Embed Size (px)
Citation preview
© 2016 Cisco and/or its affiliates. All rights reserved. This document is Cisco Public. Page 1 of 39
White Paper
Cisco Visual Networking Index: Global Mobile Data Traffic Forecast Update, 2015–2020
February 3, 2016
The Cisco® Visual Networking Index (VNI) Global Mobile Data Traffic Forecast Update
is part of the comprehensive Cisco VNI Forecast, an ongoing initiative to track and
forecast the impact of visual networking applications on global networks. This paper
presents some of Cisco’s major global mobile data traffic projections and growth
trends.
Executive Summary
The Mobile Network in 2015
Global mobile data traffic grew 74 percent in 2015. Global mobile data traffic reached 3.7 exabytes per month
at the end of 2015, up from 2.1 exabytes per month at the end of 2014.
Mobile data traffic has grown 4,000-fold over the past 10 years and almost 400-million-fold over the past
15 years. Mobile networks carried fewer than 10 gigabytes per month in 2000, and less than 1 petabyte per month
in 2005. (One exabyte is equivalent to one billion gigabytes, and one thousand petabytes.)
Fourth-generation (4G) traffic exceeded third-generation (3G) traffic for the first time in 2015. Although 4G
connections represented only 14 percent of mobile connections in 2015, they already account for 47 percent of
mobile data traffic, while 3G connections represented 34 percent of mobile connections and 43 percent of the
traffic. In 2015, a 4G connection generated six times more traffic on average than a non-4G connection.
Mobile offload exceeded cellular traffic for the first time in 2015. Fifty-one percent of total mobile data traffic
was offloaded onto the fixed network through Wi-Fi or femtocell in 2015. In total, 3.9 exabytes of mobile data traffic
were offloaded onto the fixed network each month.
© 2016 Cisco and/or its affiliates. All rights reserved. This document is Cisco Public. Page 2 of 39
More than half a billion (563 million) mobile devices and connections were added in 2015. Smartphones
accounted for most of that growth. Global mobile devices and connections in 2015 grew to 7.9 billion, up from
7.3 billion in 2014.
Globally, smart devices represented 36 percent of the total mobile devices and connections in 2015; they
accounted for 89 percent of the mobile data traffic. (For the purposes of this study, “smart devices” refers to mobile
connections that have advanced multimedia/computing capabilities with a minimum of 3G connectivity.) In 2015,
on an average, a smart device generated 14 times more traffic than a nonsmart device.
Mobile network (cellular) connection speeds grew 20 percent in 2015. Globally, the average mobile network
downstream speed in 2015 was 2,026 kilobits per second (kbps), up from 1,683 kbps in 2014.
Mobile video traffic accounted for 55 percent of total mobile data traffic in 2015. Mobile video traffic now
accounts for more than half of all mobile data traffic.
The top 1 percent of mobile data subscribers generated 7 percent of mobile data traffic, down from
18 percent in June 2014. According to a mobile data usage study conducted by Cisco, the top 20 percent of
mobile users generated 59 percent of mobile data traffic, and the top 1 percent generated 7 percent.
Average smartphone usage grew 43 percent in 2015. The average amount of traffic per smartphone in 2015
was 929 MB per month, up from 648 MB per month in 2014.
Smartphones (including phablets) represented only 43 percent of total global handsets in use in 2015, but
represented 97 percent of total global handset traffic. In 2015, the typical smartphone generated 41 times more
mobile data traffic (929 MB per month) than the typical basic-feature cell phone (which generated only 23 MB per
month of mobile data traffic).
Globally, 97 million wearable devices (a sub-segment of the machine-to-machine [M2M] category) in 2015
generated 15 petabytes of monthly traffic.
Per-user iOS mobile devices (smartphones and tablets) data usage marginally surpassed that of Android
mobile devices data usage. By the end of 2015, average iOS consumption exceeded average Android
consumption in North America and Western Europe.
In 2015, 34 percent of mobile devices were potentially IPv6-capable. This estimate is based on network
connection speed and OS capability.
In 2015, the number of mobile-connected tablets increased 1.3-fold to 133 million, and each tablet
generated 2.8 times more traffic than the average smartphone. In 2015, mobile data traffic per tablet was
2,576 MB per month, compared to 929 MB per month per smartphone.
There were 125 million PCs on the mobile network in 2015, and each PC generated 2.9 times more traffic
than the average smartphone. Mobile data traffic per PC was 2.7 GB per month in 2015.
Average nonsmartphone usage increased to 23 MB per month in 2015, compared to 16 MB per month
in 2014. Basic handsets still make up the vast majority of handsets on the network (57 percent).
© 2016 Cisco and/or its affiliates. All rights reserved. This document is Cisco Public. Page 3 of 39
The Mobile Network Through 2020
Mobile data traffic will reach the following milestones within the next 5 years:
● Monthly global mobile data traffic will be 30.6 exabytes by 2020.
● The number of mobile-connected devices per capita will reach 1.5 by 2020.
● The average global mobile connection speed will surpass 3 Mbps by 2017.
● The total number of smartphones (including phablets) will be nearly 50 percent of global devices and
connections by 2020.
● Because of increased usage on smartphones, smartphones will cross four-fifths of mobile data traffic
by 2020.
● Monthly mobile tablet traffic will surpass 2.0 exabytes per month by 2020.
● 4G connections will have the highest share (40.5 percent) of total mobile connections by 2020.
● 4G traffic will be more than half of the total mobile traffic by 2016.
● More traffic was offloaded from cellular networks (on to Wi-Fi) than remained on cellular networks in 2015.
● Three-fourths (75 percent) of the world’s mobile data traffic will be video by 2020.
Global mobile data traffic will increase nearly eightfold between 2015 and 2020. Mobile data traffic will grow
at a compound annual growth rate (CAGR) of 53 percent from 2015 to 2020, reaching 30.6 exabytes per month
by 2020.
By 2020 there will be 1.5 mobile devices per capita. There will be 11.6 billion mobile-connected devices by
2020, including M2M modules—exceeding the world’s projected population at that time (7.8 billion).
Mobile network connection speeds will increase more than threefold by 2020. The average mobile network
connection speed (2.0 Mbps in 2015) will reach nearly 6.5 megabits per second (Mbps) by 2020. By 2017, the
average mobile network connection speed will surpass 2.0 Mbps.
By 2020, 4G will be 40.5 percent of connections, but 72 percent of total traffic. By 2020, a 4G connection will
generate 3.3 times more traffic on average than a non-4G connection.
By 2020, more than three-fifths of all devices connected to the mobile network will be “smart” devices.
Globally, 67 percent of mobile devices will be smart devices by 2020, up from 36 percent in 2015. The vast majority
of mobile data traffic (98 percent) will originate from these smart devices by 2020, up from 89 percent in 2015.
By 2020, 66 percent of all global mobile devices could potentially be capable of connecting to an IPv6
mobile network. There will be 7.6 billion IPv6-capable devices by 2020.
Three-fourths of the world’s mobile data traffic will be video by 2020. Mobile video will increase 11-fold
between 2015 and 2020, accounting for 75 percent of total mobile data traffic by the end of the forecast period.
By 2020, mobile-connected tablets will generate nearly eight times more traffic than generated in 2015.
The amount of mobile data traffic generated by tablets by 2020 (2.6 exabytes per month) will be 7.6 times higher
than in 2015, a CAGR of 50 percent.
The average smartphone will generate 4.4 GB of traffic per month by 2020, nearly a fivefold increase over
the 2015 average of 929 MB per month. By 2020, aggregate smartphone traffic will be 8.8 times greater than it is
today, with a CAGR of 54 percent.
© 2016 Cisco and/or its affiliates. All rights reserved. This document is Cisco Public. Page 4 of 39
By 2015, more than half of all traffic from mobile-connected devices (almost 3.9 exabytes) will be offloaded
to the fixed network by means of Wi-Fi devices and femtocells each month. Without Wi-Fi and femtocell
offload, total mobile data traffic would grow at a CAGR of 55 percent between 2015 and 2020, instead of the
projected CAGR of 53 percent.
The Middle East and Africa will have the strongest mobile data traffic growth of any region with a
71-percent CAGR. This region will be followed by Asia Pacific at 54 percent and Central and Eastern Europe
at 52 percent.
Appendix A summarizes the details and methodology of the VNI Mobile Forecast.
2015 Year in Review
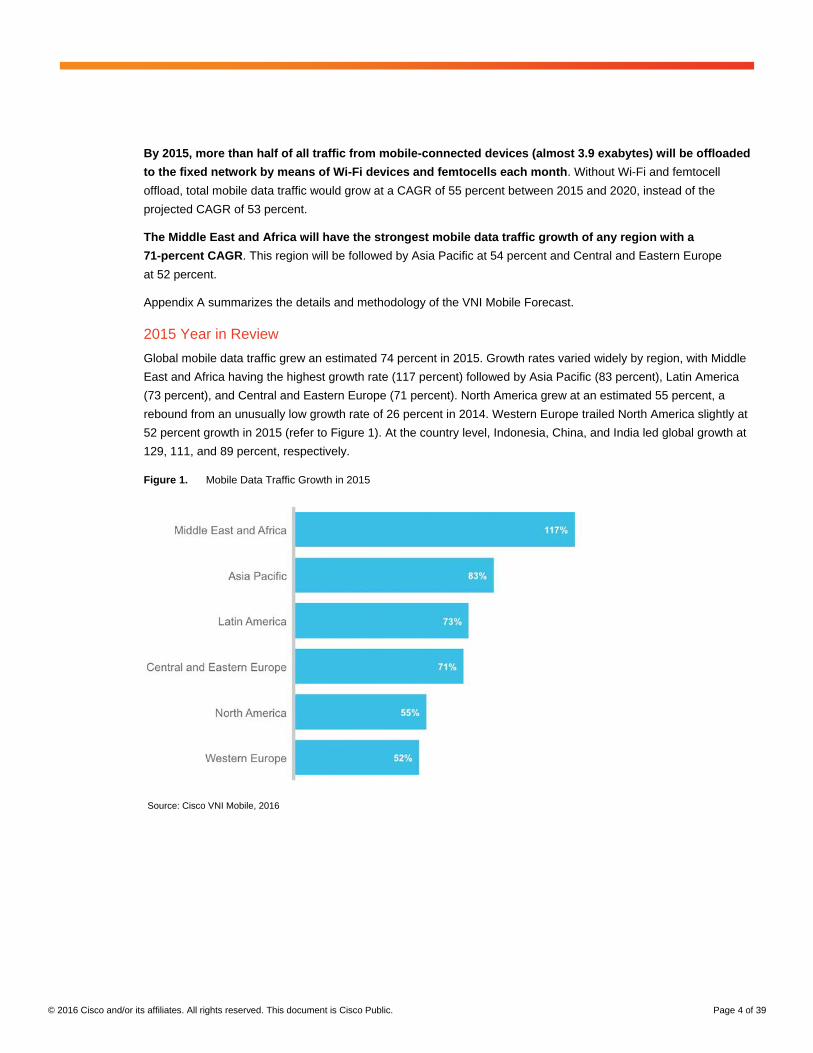
Global mobile data traffic grew an estimated 74 percent in 2015. Growth rates varied widely by region, with Middle
East and Africa having the highest growth rate (117 percent) followed by Asia Pacific (83 percent), Latin America
(73 percent), and Central and Eastern Europe (71 percent). North America grew at an estimated 55 percent, a
rebound from an unusually low growth rate of 26 percent in 2014. Western Europe trailed North America slightly at
52 percent growth in 2015 (refer to Figure 1). At the country level, Indonesia, China, and India led global growth at
129, 111, and 89 percent, respectively.
Figure 1. Mobile Data Traffic Growth in 2015
Source: Cisco VNI Mobile, 2016
© 2016 Cisco and/or its affiliates. All rights reserved. This document is Cisco Public. Page 5 of 39
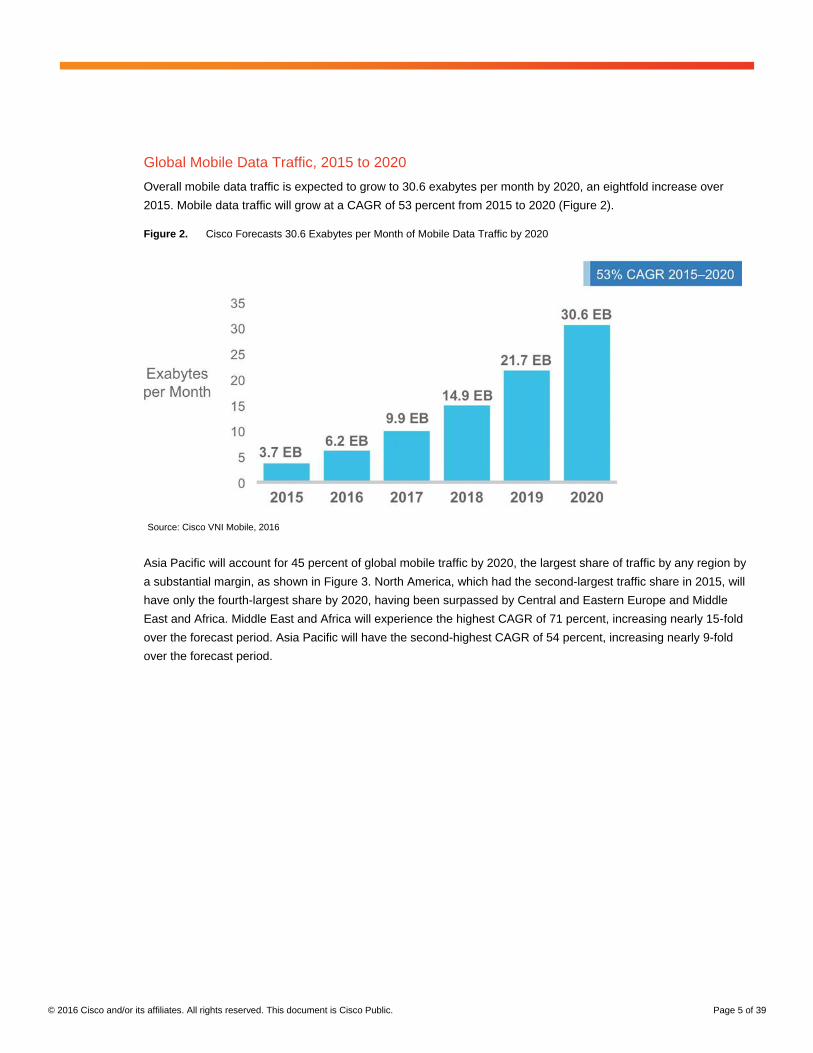
Global Mobile Data Traffic, 2015 to 2020
Overall mobile data traffic is expected to grow to 30.6 exabytes per month by 2020, an eightfold increase over
2015. Mobile data traffic will grow at a CAGR of 53 percent from 2015 to 2020 (Figure 2).
Figure 2. Cisco Forecasts 30.6 Exabytes per Month of Mobile Data Traffic by 2020
Source: Cisco VNI Mobile, 2016
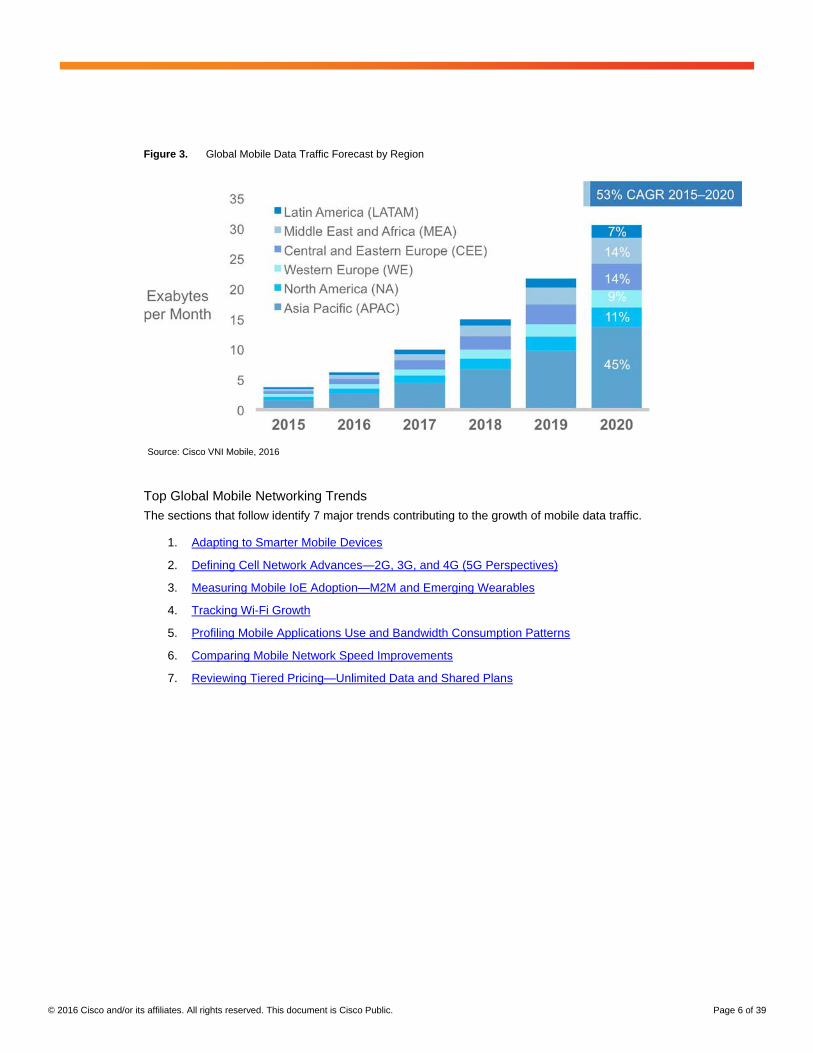
Asia Pacific will account for 45 percent of global mobile traffic by 2020, the largest share of traffic by any region by
a substantial margin, as shown in Figure 3. North America, which had the second-largest traffic share in 2015, will
have only the fourth-largest share by 2020, having been surpassed by Central and Eastern Europe and Middle
East and Africa. Middle East and Africa will experience the highest CAGR of 71 percent, increasing nearly 15-fold
over the forecast period. Asia Pacific will have the second-highest CAGR of 54 percent, increasing nearly 9-fold
over the forecast period.
© 2016 Cisco and/or its affiliates. All rights reserved. This document is Cisco Public. Page 6 of 39
Figure 3. Global Mobile Data Traffic Forecast by Region
Source: Cisco VNI Mobile, 2016
Top Global Mobile Networking Trends
The sections that follow identify 7 major trends contributing to the growth of mobile data traffic.
1. Adapting to Smarter Mobile Devices
2. Defining Cell Network Advances—2G, 3G, and 4G (5G Perspectives)
3. Measuring Mobile IoE Adoption—M2M and Emerging Wearables
4. Tracking Wi-Fi Growth
5. Profiling Mobile Applications Use and Bandwidth Consumption Patterns
6. Comparing Mobile Network Speed Improvements
7. Reviewing Tiered Pricing—Unlimited Data and Shared Plans
© 2016 Cisco and/or its affiliates. All rights reserved. This document is Cisco Public. Page 7 of 39
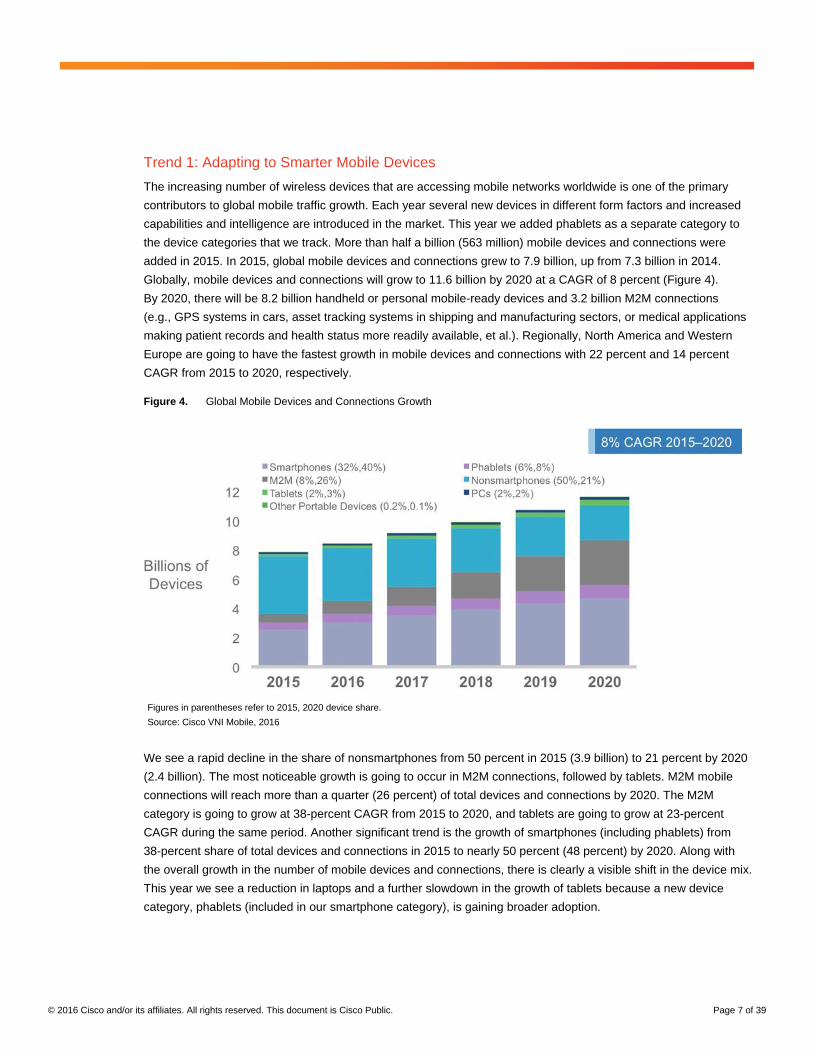
Trend 1: Adapting to Smarter Mobile Devices
The increasing number of wireless devices that are accessing mobile networks worldwide is one of the primary
contributors to global mobile traffic growth. Each year several new devices in different form factors and increased
capabilities and intelligence are introduced in the market. This year we added phablets as a separate category to
the device categories that we track. More than half a billion (563 million) mobile devices and connections were
added in 2015. In 2015, global mobile devices and connections grew to 7.9 billion, up from 7.3 billion in 2014.
Globally, mobile devices and connections will grow to 11.6 billion by 2020 at a CAGR of 8 percent (Figure 4).
By 2020, there will be 8.2 billion handheld or personal mobile-ready devices and 3.2 billion M2M connections
(e.g., GPS systems in cars, asset tracking systems in shipping and manufacturing sectors, or medical applications
making patient records and health status more readily available, et al.). Regionally, North America and Western
Europe are going to have the fastest growth in mobile devices and connections with 22 percent and 14 percent
CAGR from 2015 to 2020, respectively.
Figure 4. Global Mobile Devices and Connections Growth
Figures in parentheses refer to 2015, 2020 device share.
Source: Cisco VNI Mobile, 2016
We see a rapid decline in the share of nonsmartphones from 50 percent in 2015 (3.9 billion) to 21 percent by 2020
(2.4 billion). The most noticeable growth is going to occur in M2M connections, followed by tablets. M2M mobile
connections will reach more than a quarter (26 percent) of total devices and connections by 2020. The M2M
category is going to grow at 38-percent CAGR from 2015 to 2020, and tablets are going to grow at 23-percent
CAGR during the same period. Another significant trend is the growth of smartphones (including phablets) from
38-percent share of total devices and connections in 2015 to nearly 50 percent (48 percent) by 2020. Along with
the overall growth in the number of mobile devices and connections, there is clearly a visible shift in the device mix.
This year we see a reduction in laptops and a further slowdown in the growth of tablets because a new device
category, phablets (included in our smartphone category), is gaining broader adoption.
© 2016 Cisco and/or its affiliates. All rights reserved. This document is Cisco Public. Page 8 of 39
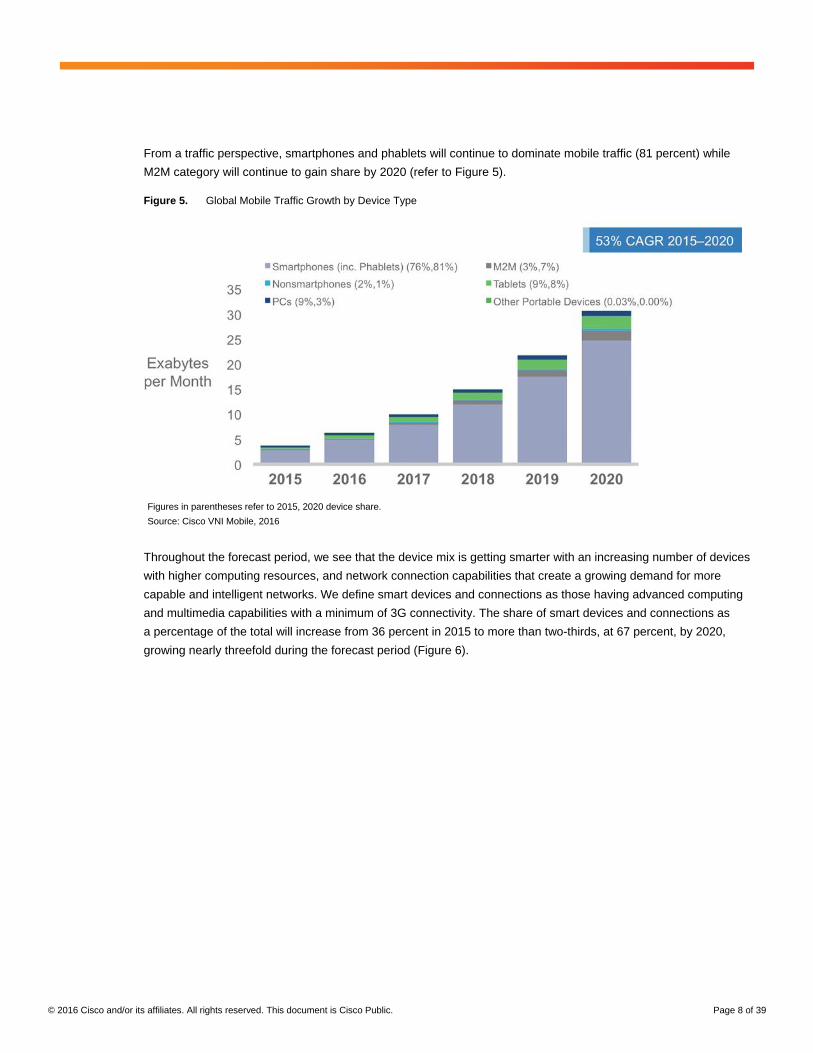
From a traffic perspective, smartphones and phablets will continue to dominate mobile traffic (81 percent) while
M2M category will continue to gain share by 2020 (refer to Figure 5).
Figure 5. Global Mobile Traffic Growth by Device Type
Figures in parentheses refer to 2015, 2020 device share.
Source: Cisco VNI Mobile, 2016
Throughout the forecast period, we see that the device mix is getting smarter with an increasing number of devices
with higher computing resources, and network connection capabilities that create a growing demand for more
capable and intelligent networks. We define smart devices and connections as those having advanced computing
and multimedia capabilities with a minimum of 3G connectivity. The share of smart devices and connections as
a percentage of the total will increase from 36 percent in 2015 to more than two-thirds, at 67 percent, by 2020,
growing nearly threefold during the forecast period (Figure 6).
© 2016 Cisco and/or its affiliates. All rights reserved. This document is Cisco Public. Page 9 of 39
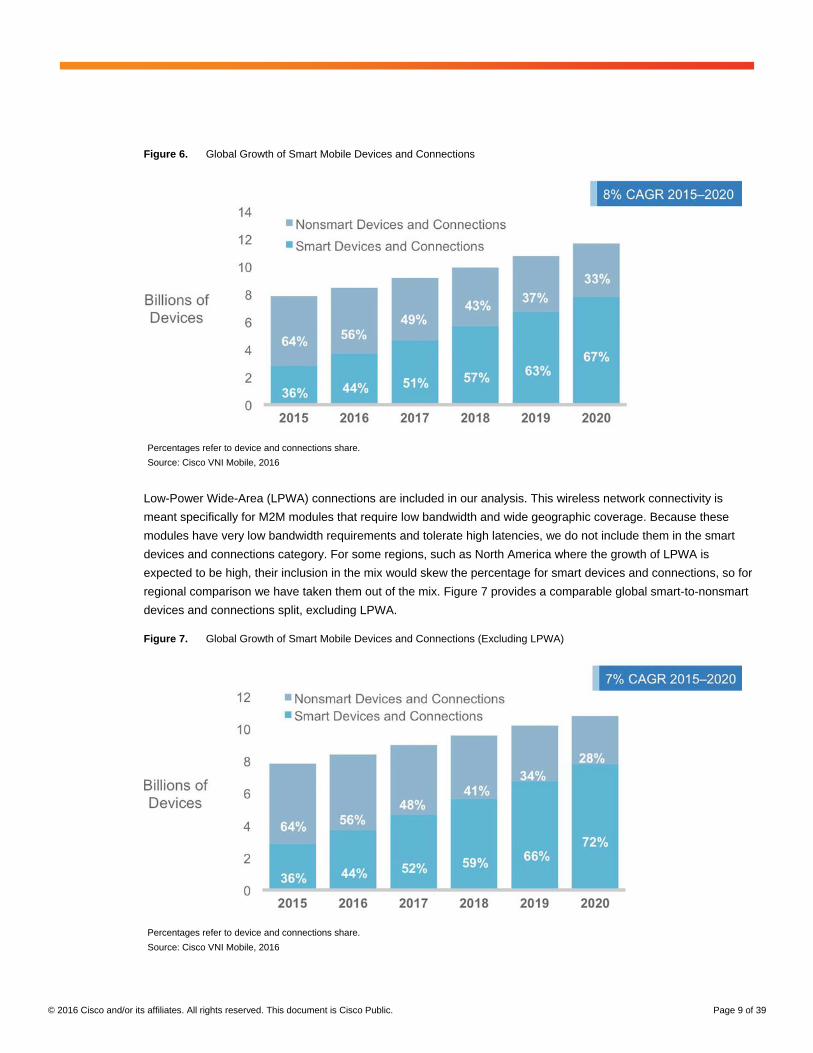
Figure 6. Global Growth of Smart Mobile Devices and Connections
Percentages refer to device and connections share.
Source: Cisco VNI Mobile, 2016
Low-Power Wide-Area (LPWA) connections are included in our analysis. This wireless network connectivity is
meant specifically for M2M modules that require low bandwidth and wide geographic coverage. Because these
modules have very low bandwidth requirements and tolerate high latencies, we do not include them in the smart
devices and connections category. For some regions, such as North America where the growth of LPWA is
expected to be high, their inclusion in the mix would skew the percentage for smart devices and connections, so for
regional comparison we have taken them out of the mix. Figure 7 provides a comparable global smart-to-nonsmart
devices and connections split, excluding LPWA.
Figure 7. Global Growth of Smart Mobile Devices and Connections (Excluding LPWA)
Percentages refer to device and connections share.
Source: Cisco VNI Mobile, 2016
© 2016 Cisco and/or its affiliates. All rights reserved. This document is Cisco Public. Page 10 of 39
When we exclude LPWA M2M connections from the mix, the global percentage share of smart devices and
connections is higher, at 72 percent by 2020.
Although this device mix conversion is a global phenomenon, some regions are ahead. By the end of 2020, North
America will have 95 percent of its installed base converted to smart devices and connections, followed by Western
Europe with 86 percent smart devices and connections (Table 1).
Table 1. Regional Share of Smart Devices and Connections (Percent of the Regional Total)
Region 2015 2020
North America 74% 95%
Western Europe 59% 86%
Central and Eastern Europe 43% 84%
Asia Pacific 35% 72%
Latin America 34% 70%
Middle East and Africa 12% 52%
Source: Cisco VNI Mobile, 2016
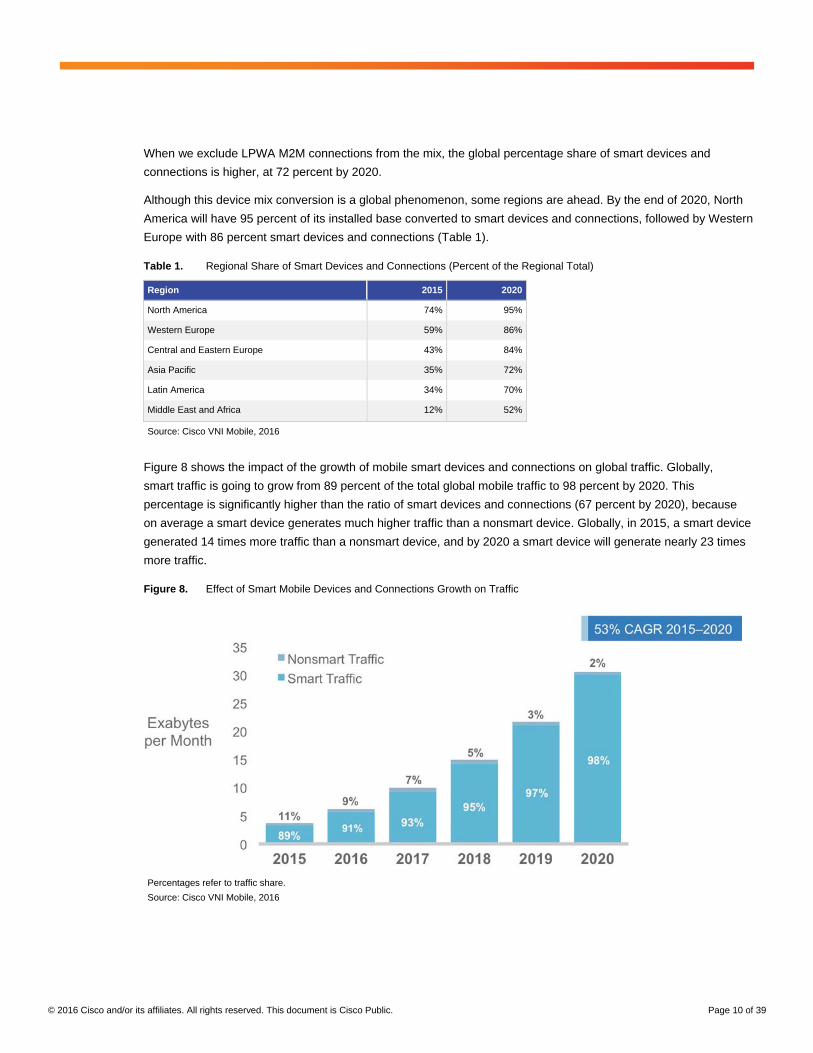
Figure 8 shows the impact of the growth of mobile smart devices and connections on global traffic. Globally,
smart traffic is going to grow from 89 percent of the total global mobile traffic to 98 percent by 2020. This
percentage is significantly higher than the ratio of smart devices and connections (67 percent by 2020), because
on average a smart device generates much higher traffic than a nonsmart device. Globally, in 2015, a smart device
generated 14 times more traffic than a nonsmart device, and by 2020 a smart device will generate nearly 23 times
more traffic.
Figure 8. Effect of Smart Mobile Devices and Connections Growth on Traffic
Percentages refer to traffic share.
Source: Cisco VNI Mobile, 2016
© 2016 Cisco and/or its affiliates. All rights reserved. This document is Cisco Public. Page 11 of 39
IPv6
With the exponential proliferation of multiple smart devices becoming a reality, the need for each device having
its own specific, unique address that it uses to communicate with other devices and the Internet and to define its
location is becoming a necessity. IPv4 addresses, the current protocol devices use to communicate on the Internet,
have exhausted the world over, and a very small number of IPv4 addresses remain just with the African Internet
Registry. In addition to solving the IPv4 address depletion problem by providing more than enough addresses, the
transition to the newer, better IPv6 protocol offers additional advantages where every device will have a globally
routable public IP address on the Internet. Hence there is not just a need, but far more a necessity, to move to IPv6
with its 340 undecillion addresses that will make smart devices and the Internet of Everything (IoE) a reality.
The transition to IPv6, which helps connect and manage the proliferation of newer-generation devices that are
contributing to mobile network usage and data traffic growth, is well underway. Continuing the Cisco VNI focus on
IPv6, the Cisco VNI 2015–2020 Mobile Data Traffic Forecast provides an update on IPv6-capable mobile devices
and connections and the potential for IPv6 mobile data traffic.
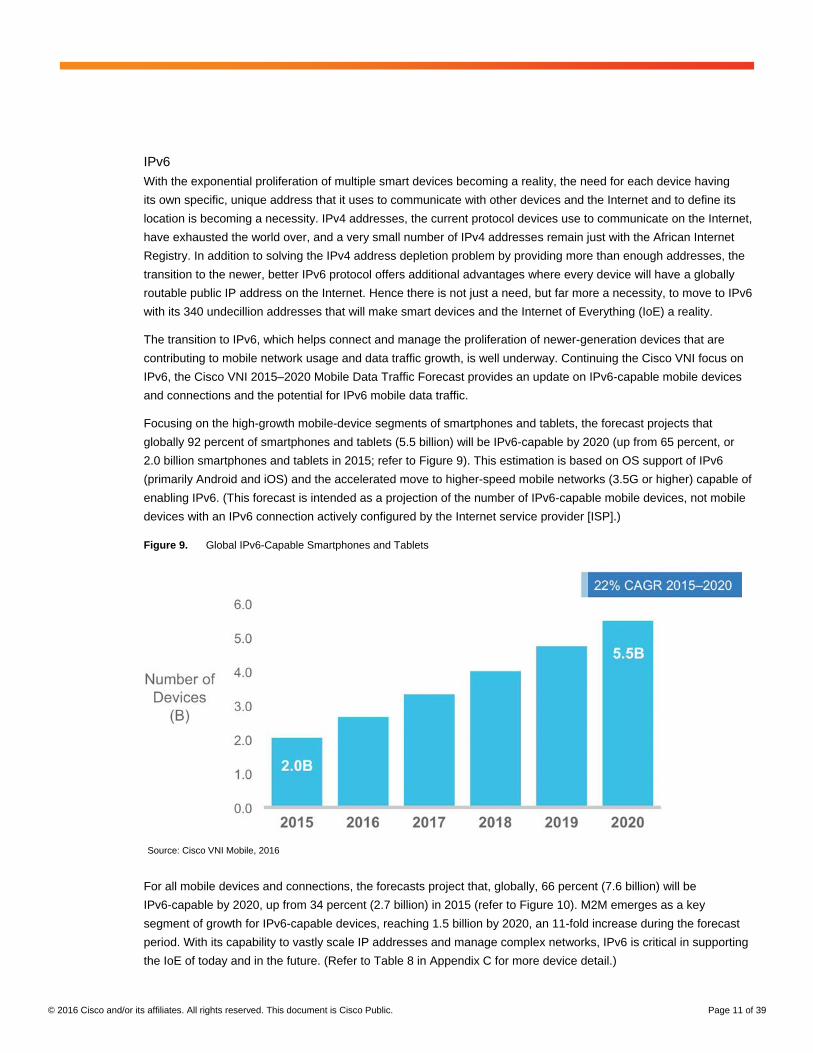
Focusing on the high-growth mobile-device segments of smartphones and tablets, the forecast projects that
globally 92 percent of smartphones and tablets (5.5 billion) will be IPv6-capable by 2020 (up from 65 percent, or
2.0 billion smartphones and tablets in 2015; refer to Figure 9). This estimation is based on OS support of IPv6
(primarily Android and iOS) and the accelerated move to higher-speed mobile networks (3.5G or higher) capable of
enabling IPv6. (This forecast is intended as a projection of the number of IPv6-capable mobile devices, not mobile
devices with an IPv6 connection actively configured by the Internet service provider [ISP].)
Figure 9. Global IPv6-Capable Smartphones and Tablets
Source: Cisco VNI Mobile, 2016
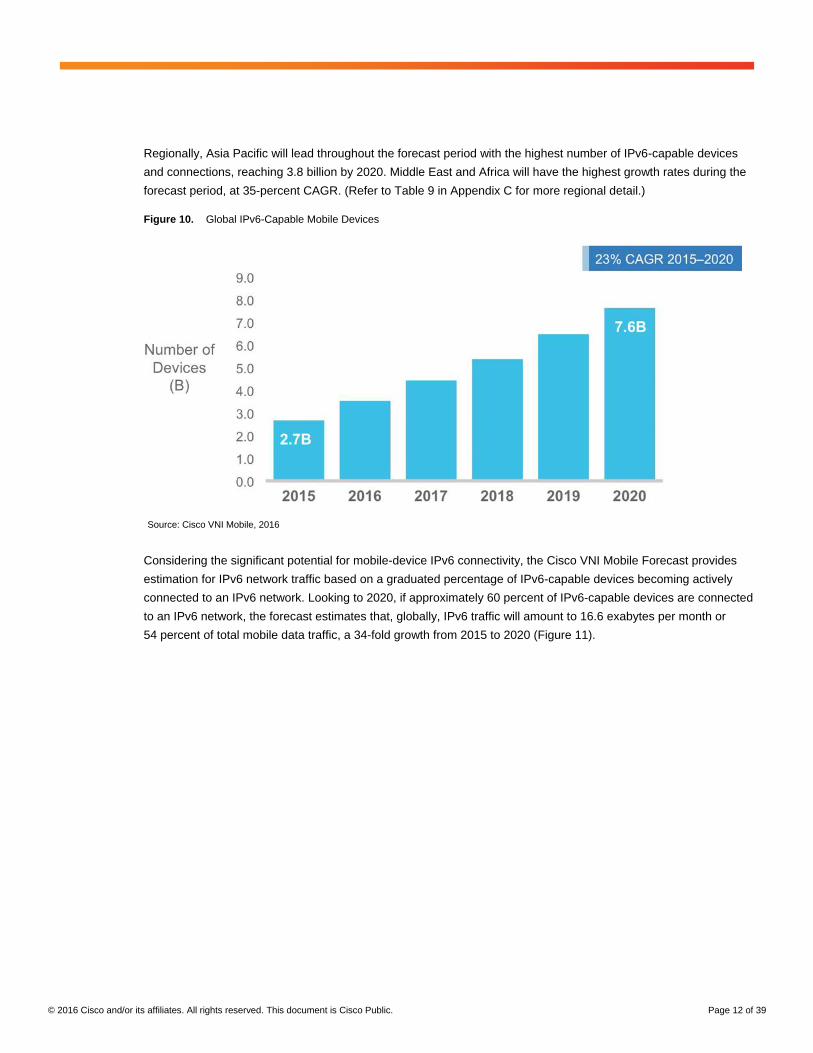
For all mobile devices and connections, the forecasts project that, globally, 66 percent (7.6 billion) will be
IPv6-capable by 2020, up from 34 percent (2.7 billion) in 2015 (refer to Figure 10). M2M emerges as a key
segment of growth for IPv6-capable devices, reaching 1.5 billion by 2020, an 11-fold increase during the forecast
period. With its capability to vastly scale IP addresses and manage complex networks, IPv6 is critical in supporting
the IoE of today and in the future. (Refer to Table 8 in Appendix C for more device detail.)
© 2016 Cisco and/or its affiliates. All rights reserved. This document is Cisco Public. Page 12 of 39
Regionally, Asia Pacific will lead throughout the forecast period with the highest number of IPv6-capable devices
and connections, reaching 3.8 billion by 2020. Middle East and Africa will have the highest growth rates during the
forecast period, at 35-percent CAGR. (Refer to Table 9 in Appendix C for more regional detail.)
Figure 10. Global IPv6-Capable Mobile Devices
Source: Cisco VNI Mobile, 2016
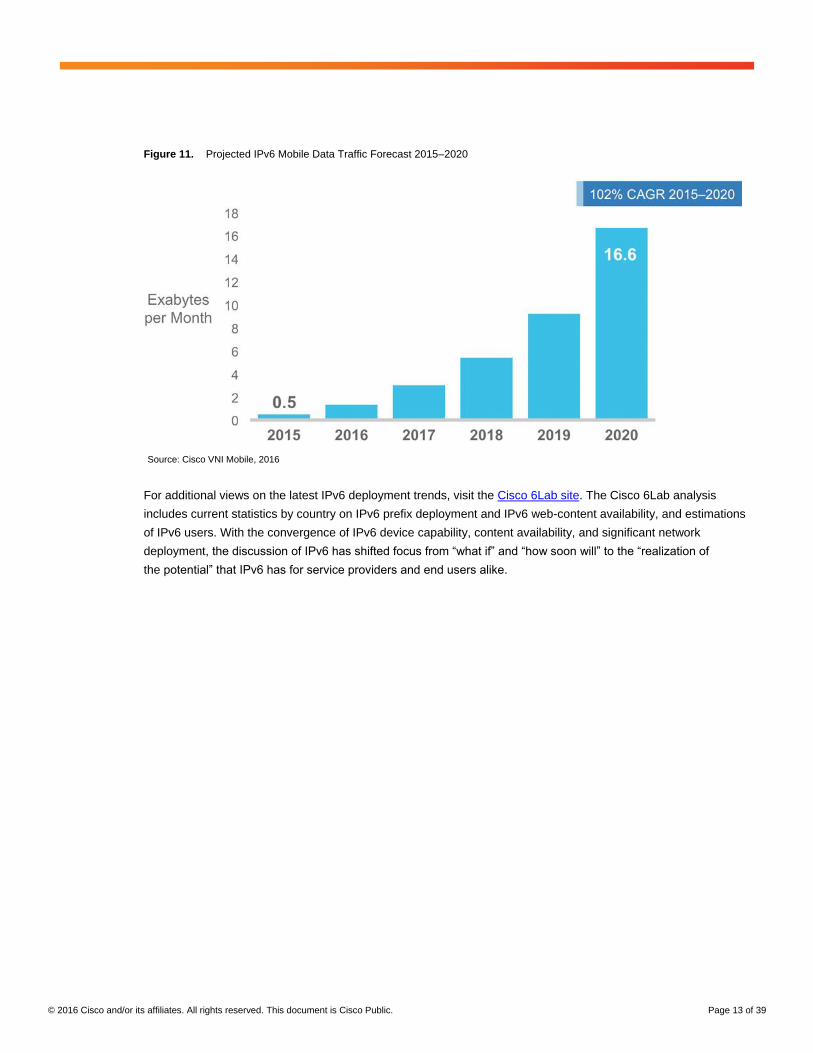
Considering the significant potential for mobile-device IPv6 connectivity, the Cisco VNI Mobile Forecast provides
estimation for IPv6 network traffic based on a graduated percentage of IPv6-capable devices becoming actively
connected to an IPv6 network. Looking to 2020, if approximately 60 percent of IPv6-capable devices are connected
to an IPv6 network, the forecast estimates that, globally, IPv6 traffic will amount to 16.6 exabytes per month or
54 percent of total mobile data traffic, a 34-fold growth from 2015 to 2020 (Figure 11).
© 2016 Cisco and/or its affiliates. All rights reserved. This document is Cisco Public. Page 13 of 39
Figure 11. Projected IPv6 Mobile Data Traffic Forecast 2015–2020
Source: Cisco VNI Mobile, 2016
For additional views on the latest IPv6 deployment trends, visit the Cisco 6Lab site. The Cisco 6Lab analysis
includes current statistics by country on IPv6 prefix deployment and IPv6 web-content availability, and estimations
of IPv6 users. With the convergence of IPv6 device capability, content availability, and significant network
deployment, the discussion of IPv6 has shifted focus from “what if” and “how soon will” to the “realization of
the potential” that IPv6 has for service providers and end users alike.
© 2016 Cisco and/or its affiliates. All rights reserved. This document is Cisco Public. Page 14 of 39
Trend 2: Defining Cell Network Advances—2G, 3G, and 4G (5G Perspectives)
Mobile devices and connections are not only getting smarter in their computing capabilities but are also evolving
from lower-generation network connectivity (2G) to higher-generation network connectivity (3G, 3.5G, and 4G or
LTE). Combining device capabilities with faster, higher bandwidth and more intelligent networks leads to wide
adoption of advanced multimedia applications that contribute to increased mobile and Wi-Fi traffic.
The explosion of mobile applications and phenomenal adoption of mobile connectivity by end users on the one
hand and the need for optimized bandwidth management and network monetization on the other hand is fueling
the growth of global 4G deployments and adoption. Service providers around the world are busy rolling out 4G
networks to help them meet the growing end-user demand for more bandwidth, higher security, and faster
connectivity on the move (Appendix B).
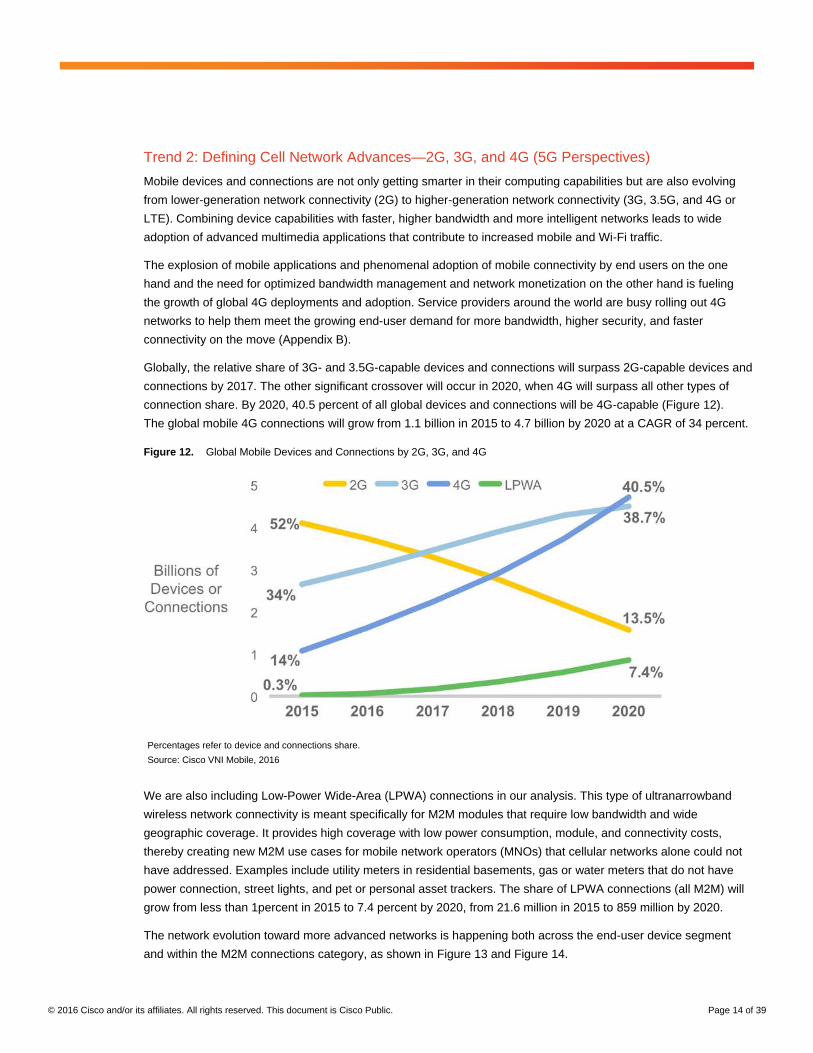
Globally, the relative share of 3G- and 3.5G-capable devices and connections will surpass 2G-capable devices and
connections by 2017. The other significant crossover will occur in 2020, when 4G will surpass all other types of
connection share. By 2020, 40.5 percent of all global devices and connections will be 4G-capable (Figure 12).
The global mobile 4G connections will grow from 1.1 billion in 2015 to 4.7 billion by 2020 at a CAGR of 34 percent.
Figure 12. Global Mobile Devices and Connections by 2G, 3G, and 4G
Percentages refer to device and connections share.
Source: Cisco VNI Mobile, 2016
We are also including Low-Power Wide-Area (LPWA) connections in our analysis. This type of ultranarrowband
wireless network connectivity is meant specifically for M2M modules that require low bandwidth and wide
geographic coverage. It provides high coverage with low power consumption, module, and connectivity costs,
thereby creating new M2M use cases for mobile network operators (MNOs) that cellular networks alone could not
have addressed. Examples include utility meters in residential basements, gas or water meters that do not have
power connection, street lights, and pet or personal asset trackers. The share of LPWA connections (all M2M) will
grow from less than 1percent in 2015 to 7.4 percent by 2020, from 21.6 million in 2015 to 859 million by 2020.
The network evolution toward more advanced networks is happening both across the end-user device segment
and within the M2M connections category, as shown in Figure 13 and Figure 14.
© 2016 Cisco and/or its affiliates. All rights reserved. This document is Cisco Public. Page 15 of 39
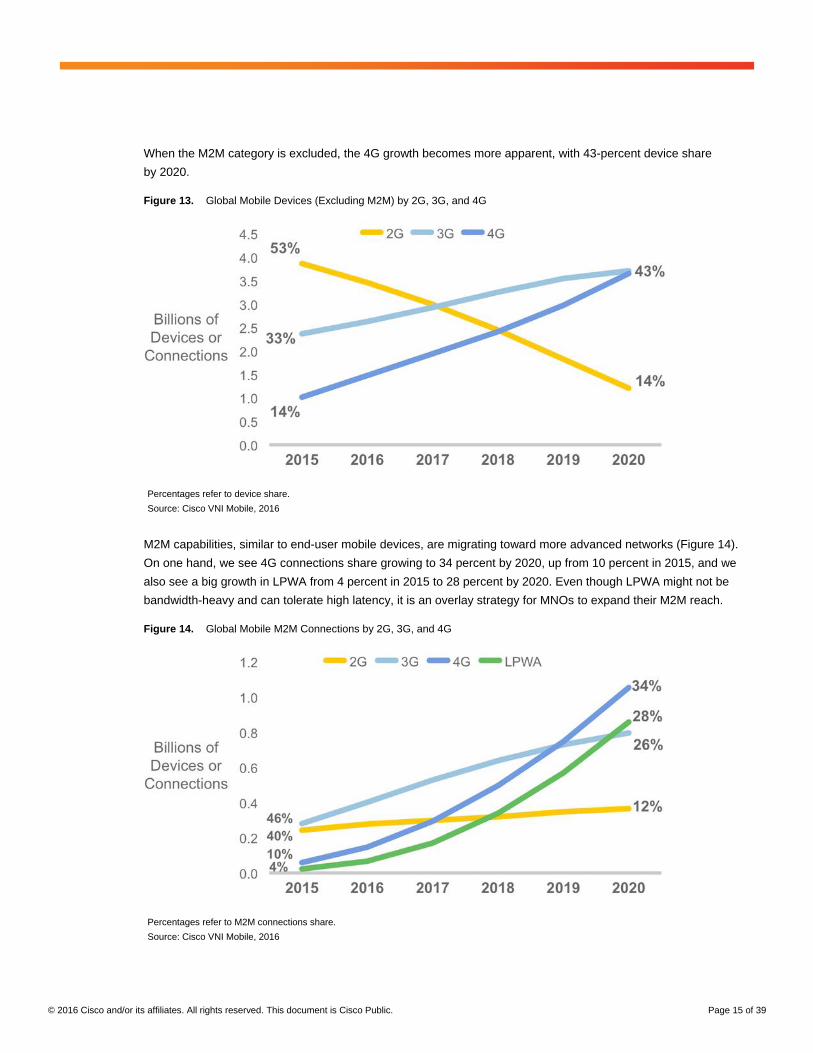
When the M2M category is excluded, the 4G growth becomes more apparent, with 43-percent device share
by 2020.
Figure 13. Global Mobile Devices (Excluding M2M) by 2G, 3G, and 4G
Percentages refer to device share.
Source: Cisco VNI Mobile, 2016
M2M capabilities, similar to end-user mobile devices, are migrating toward more advanced networks (Figure 14).
On one hand, we see 4G connections share growing to 34 percent by 2020, up from 10 percent in 2015, and we
also see a big growth in LPWA from 4 percent in 2015 to 28 percent by 2020. Even though LPWA might not be
bandwidth-heavy and can tolerate high latency, it is an overlay strategy for MNOs to expand their M2M reach.
Figure 14. Global Mobile M2M Connections by 2G, 3G, and 4G
Percentages refer to M2M connections share.
Source: Cisco VNI Mobile, 2016
© 2016 Cisco and/or its affiliates. All rights reserved. This document is Cisco Public. Page 16 of 39
The transition from 2G to 3G or 4G deployment is a global phenomenon. In fact, by 2020, 59 percent of the
mobile devices and connections in North America will have 4G capability, surpassing 3G-capable devices
and connections. Western Europe (53 percent) will have the second-highest ratio of 4G connections by 2020
(Appendix B). At the country level, Australia will have 63 percent of its total connections on 4G by 2020, with
Japan having 60 percent of all its connections on 4G by 2020. China, followed by the United States, will lead the
world in terms of its share of the total global 4G connections with 28 and 12 percent, respectively, of total global
4G connections by 2020.
Although the growth in 4G, with its higher bandwidth, lower latency, and increased security, will help regions bridge
the gap between their mobile and fixed network performance, deployment of LPWA networks will help enhance
the reach of mobile providers in the M2M segment. This situation will lead to even higher adoption of mobile
technologies by end users, making access to any content on any device from anywhere and the Internet of
Everything (IoE) more sustainable.
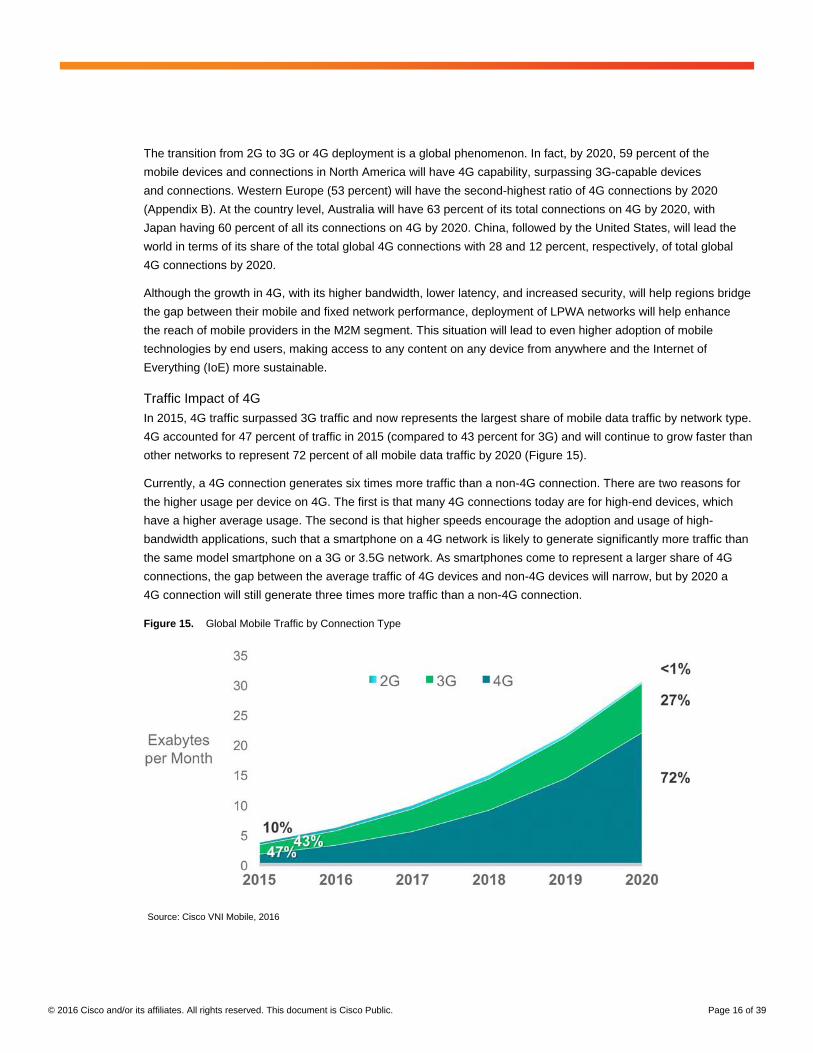
Traffic Impact of 4G
In 2015, 4G traffic surpassed 3G traffic and now represents the largest share of mobile data traffic by network type.
4G accounted for 47 percent of traffic in 2015 (compared to 43 percent for 3G) and will continue to grow faster than
other networks to represent 72 percent of all mobile data traffic by 2020 (Figure 15).
Currently, a 4G connection generates six times more traffic than a non-4G connection. There are two reasons for
the higher usage per device on 4G. The first is that many 4G connections today are for high-end devices, which
have a higher average usage. The second is that higher speeds encourage the adoption and usage of high-
bandwidth applications, such that a smartphone on a 4G network is likely to generate significantly more traffic than
the same model smartphone on a 3G or 3.5G network. As smartphones come to represent a larger share of 4G
connections, the gap between the average traffic of 4G devices and non-4G devices will narrow, but by 2020 a
4G connection will still generate three times more traffic than a non-4G connection.
Figure 15. Global Mobile Traffic by Connection Type
Source: Cisco VNI Mobile, 2016
© 2016 Cisco and/or its affiliates. All rights reserved. This document is Cisco Public. Page 17 of 39
5G Perspectives
5G is the next phase of mobile technology. 5G’s primary improvements over 4G include high bandwidth (greater
than 1 Gbps), broader coverage, and ultra-low latency. Whereas 4G has been driven by device proliferation and
dynamic information access, 5G will be driven largely by IoE applications. With 5G, resources (channels) will be
allocated based on awareness of content, user, and location. This technology is expected to solve frequency
licensing and spectrum management problems. While there are field trials are being carried out by some operators,
significant 5G deployments are not expected until 2020 and beyond. There are several gating factors such as
approval of regulatory standards, spectrum availability and auctioning and return-on-investment (ROI) strategies
to justify the investment associated with new infrastructure transitions and deployments.
© 2016 Cisco and/or its affiliates. All rights reserved. This document is Cisco Public. Page 18 of 39
Trend 3: Measuring Mobile IoE Adoption—M2M and Emerging Wearables
The phenomenal growth in smarter end-user devices and M2M connections is a clear indicator of the growth of
IoE, which is bringing together people, processes, data, and things to make networked connections more relevant
and valuable. This section focuses on the continued growth of M2M connections and the emerging trend of
wearable devices. Both M2M and wearable devices are making computing and connectivity very pervasive in
our day-to-day lives.
M2M connections—such as home and office security and automation, smart metering and utilities, maintenance,
building automation, automotive, healthcare and consumer electronics, and more—are being used across a broad
spectrum of industries, as well as in the consumer segment. As real-time information monitoring helps companies
deploy new video-based security systems, while also helping hospitals and healthcare professionals remotely
monitor the progress of their patients, bandwidth-intensive M2M connections are becoming more prevalent.
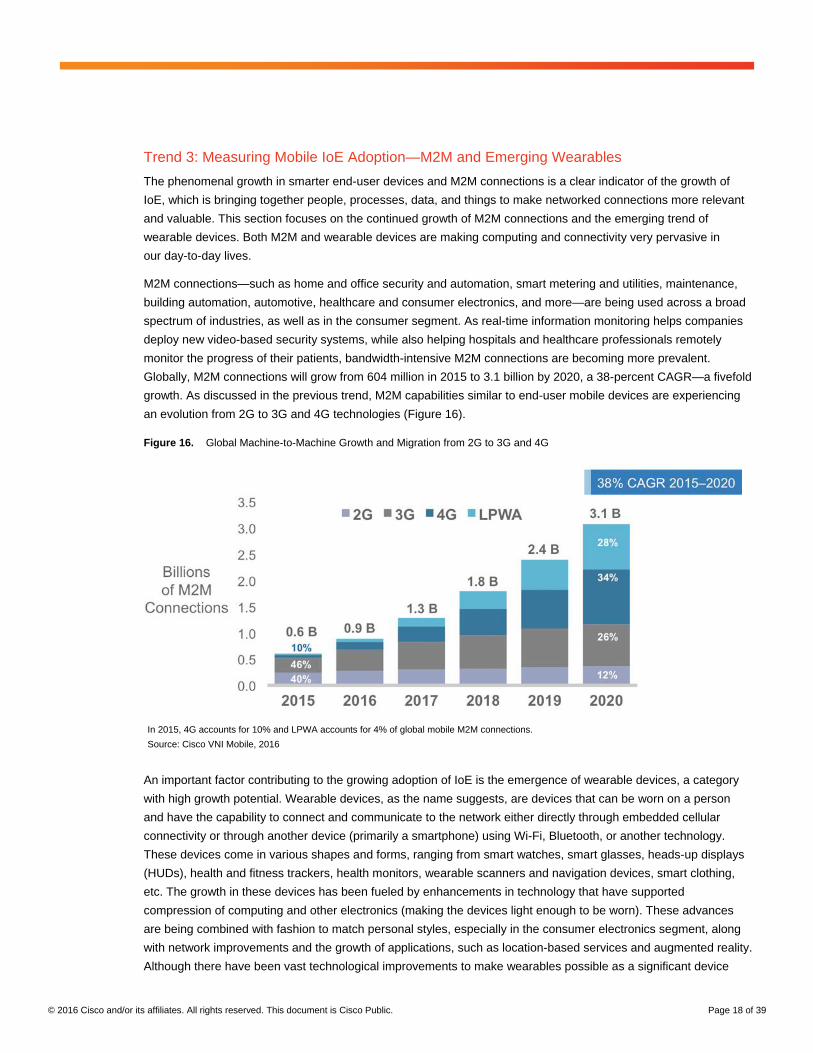
Globally, M2M connections will grow from 604 million in 2015 to 3.1 billion by 2020, a 38-percent CAGR—a fivefold
growth. As discussed in the previous trend, M2M capabilities similar to end-user mobile devices are experiencing
an evolution from 2G to 3G and 4G technologies (Figure 16).
Figure 16. Global Machine-to-Machine Growth and Migration from 2G to 3G and 4G
In 2015, 4G accounts for 10% and LPWA accounts for 4% of global mobile M2M connections.
Source: Cisco VNI Mobile, 2016
An important factor contributing to the growing adoption of IoE is the emergence of wearable devices, a category
with high growth potential. Wearable devices, as the name suggests, are devices that can be worn on a person
and have the capability to connect and communicate to the network either directly through embedded cellular
connectivity or through another device (primarily a smartphone) using Wi-Fi, Bluetooth, or another technology.
These devices come in various shapes and forms, ranging from smart watches, smart glasses, heads-up displays
(HUDs), health and fitness trackers, health monitors, wearable scanners and navigation devices, smart clothing,
etc. The growth in these devices has been fueled by enhancements in technology that have supported
compression of computing and other electronics (making the devices light enough to be worn). These advances
are being combined with fashion to match personal styles, especially in the consumer electronics segment, along
with network improvements and the growth of applications, such as location-based services and augmented reality.
Although there have been vast technological improvements to make wearables possible as a significant device
© 2016 Cisco and/or its affiliates. All rights reserved. This document is Cisco Public. Page 19 of 39
category, wide-scale availability of embedded cellular connectivity still has some barriers to overcome for some
applications—such as technology limitations, regulatory constraints, and health concerns.
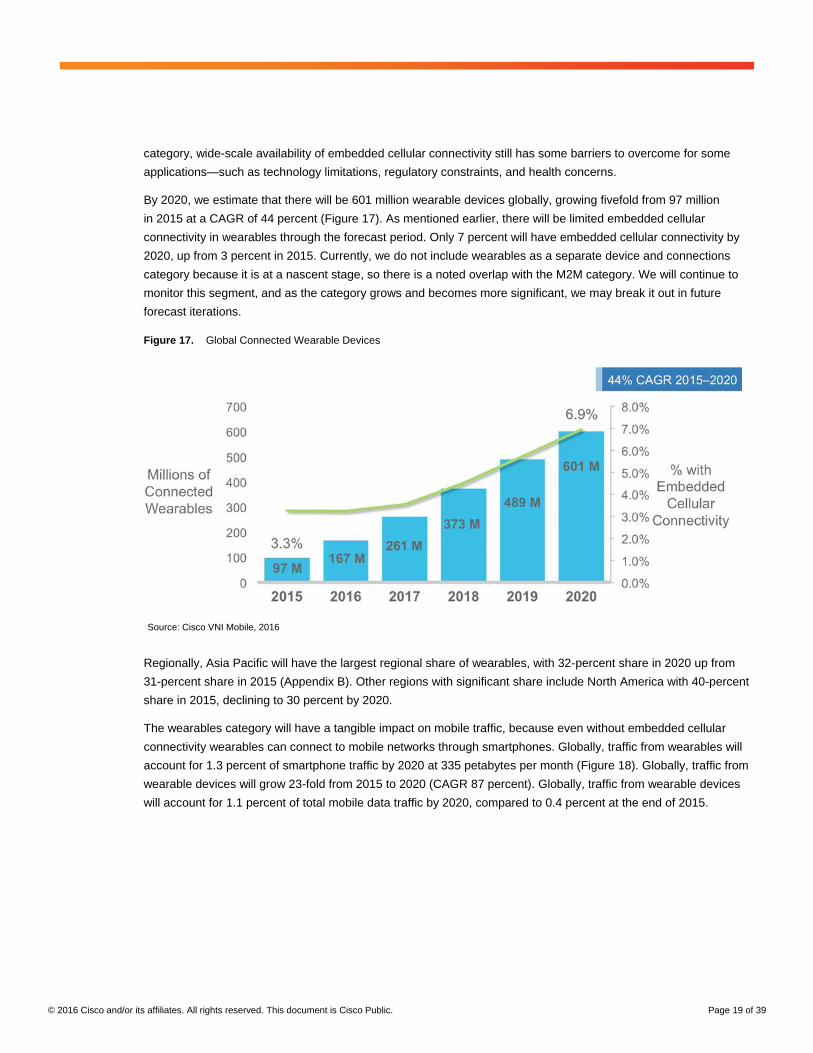
By 2020, we estimate that there will be 601 million wearable devices globally, growing fivefold from 97 million
in 2015 at a CAGR of 44 percent (Figure 17). As mentioned earlier, there will be limited embedded cellular
connectivity in wearables through the forecast period. Only 7 percent will have embedded cellular connectivity by
2020, up from 3 percent in 2015. Currently, we do not include wearables as a separate device and connections
category because it is at a nascent stage, so there is a noted overlap with the M2M category. We will continue to
monitor this segment, and as the category grows and becomes more significant, we may break it out in future
forecast iterations.
Figure 17. Global Connected Wearable Devices
Source: Cisco VNI Mobile, 2016
Regionally, Asia Pacific will have the largest regional share of wearables, with 32-percent share in 2020 up from
31-percent share in 2015 (Appendix B). Other regions with significant share include North America with 40-percent
share in 2015, declining to 30 percent by 2020.
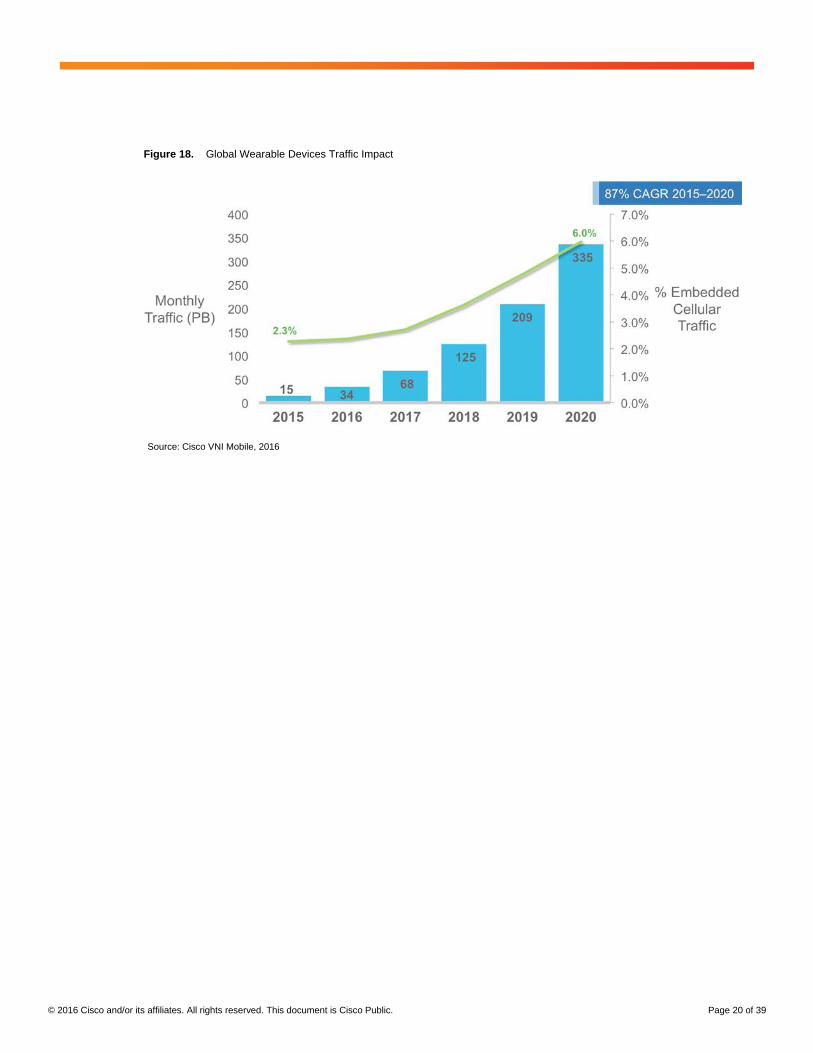
The wearables category will have a tangible impact on mobile traffic, because even without embedded cellular
connectivity wearables can connect to mobile networks through smartphones. Globally, traffic from wearables will
account for 1.3 percent of smartphone traffic by 2020 at 335 petabytes per month (Figure 18). Globally, traffic from
wearable devices will grow 23-fold from 2015 to 2020 (CAGR 87 percent). Globally, traffic from wearable devices
will account for 1.1 percent of total mobile data traffic by 2020, compared to 0.4 percent at the end of 2015.
© 2016 Cisco and/or its affiliates. All rights reserved. This document is Cisco Public. Page 20 of 39
Figure 18. Global Wearable Devices Traffic Impact
Source: Cisco VNI Mobile, 2016
© 2016 Cisco and/or its affiliates. All rights reserved. This document is Cisco Public. Page 21 of 39
Trend 4: Tracking Wi-Fi Growth
Offload
Much mobile data activity takes place within users’ homes. For users with fixed broadband and Wi-Fi access points
at home, or for users served by operator-owned femtocells and picocells, a sizable proportion of traffic generated
by mobile and portable devices is offloaded from the mobile network onto the fixed network. For the purposes
of this study, offload pertains to traffic from dual-mode devices (i.e., supports cellular and Wi-Fi connectivity,
excluding laptops) over Wi-Fi and small-cell networks. Offloading occurs at the user or device level when one
switches from a cellular connection to Wi-Fi or small-cell access. Our mobile offload projections include traffic from
both public hotspots and residential Wi-Fi networks.
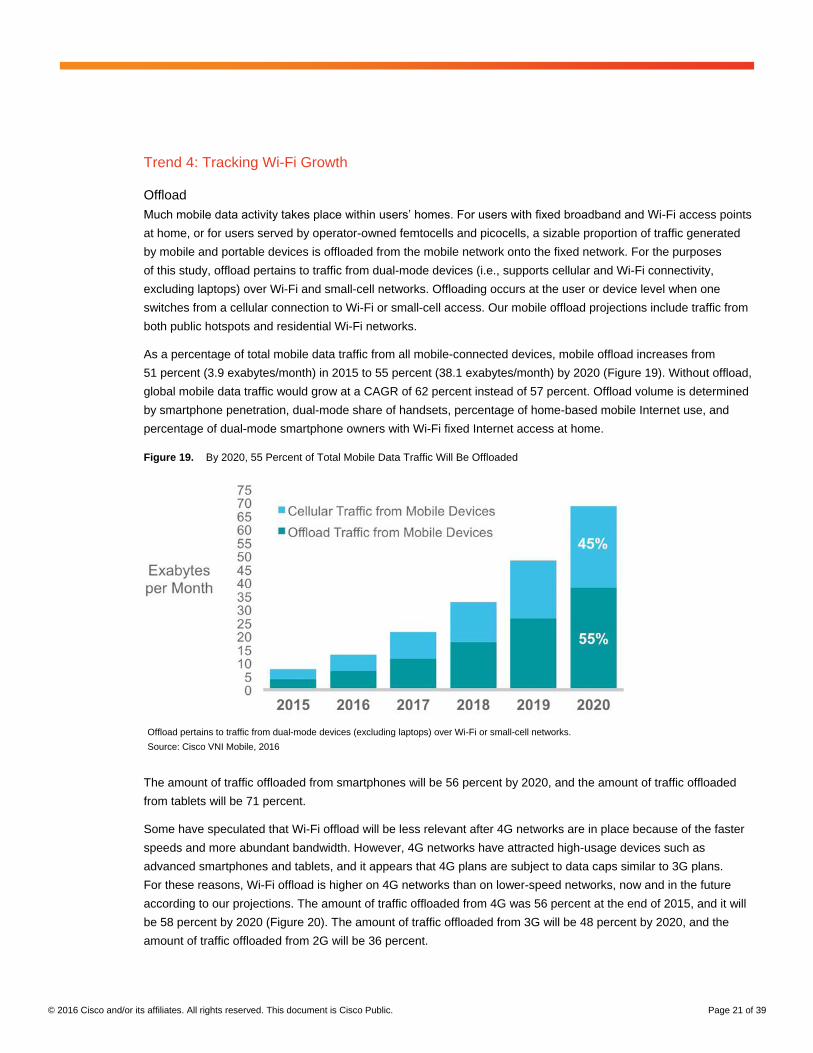
As a percentage of total mobile data traffic from all mobile-connected devices, mobile offload increases from
51 percent (3.9 exabytes/month) in 2015 to 55 percent (38.1 exabytes/month) by 2020 (Figure 19). Without offload,
global mobile data traffic would grow at a CAGR of 62 percent instead of 57 percent. Offload volume is determined
by smartphone penetration, dual-mode share of handsets, percentage of home-based mobile Internet use, and
percentage of dual-mode smartphone owners with Wi-Fi fixed Internet access at home.
Figure 19. By 2020, 55 Percent of Total Mobile Data Traffic Will Be Offloaded
Offload pertains to traffic from dual-mode devices (excluding laptops) over Wi-Fi or small-cell networks.
Source: Cisco VNI Mobile, 2016
The amount of traffic offloaded from smartphones will be 56 percent by 2020, and the amount of traffic offloaded
from tablets will be 71 percent.
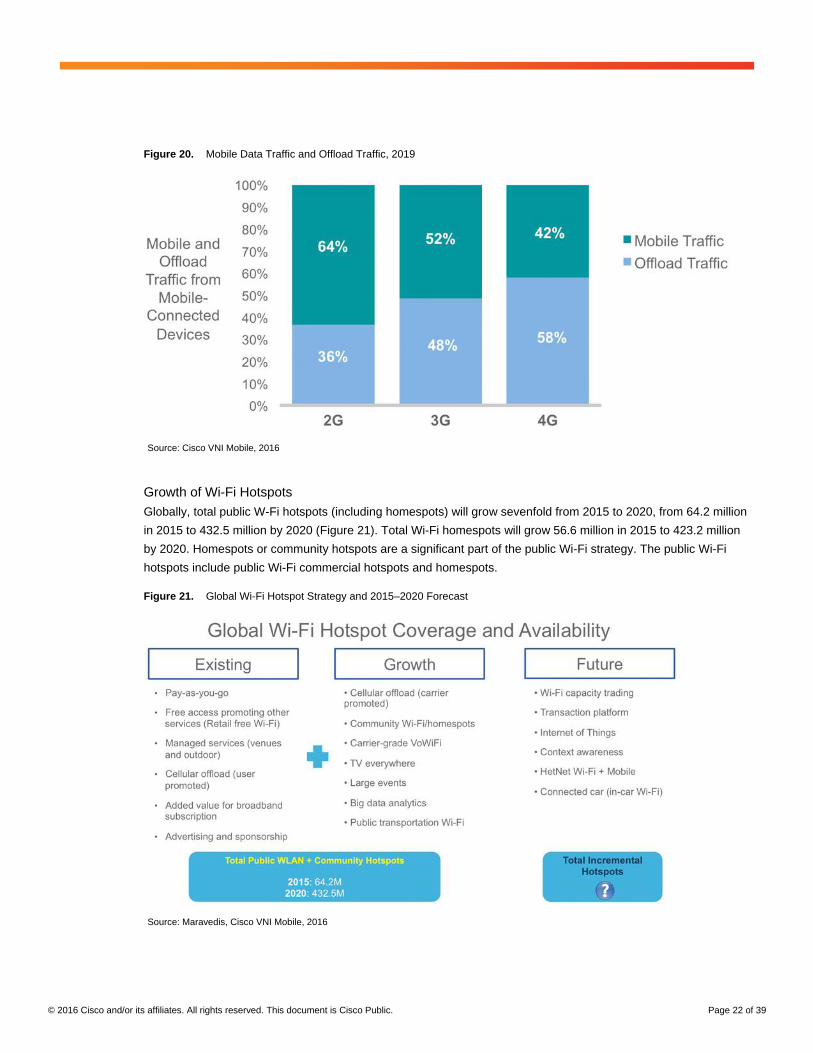
Some have speculated that Wi-Fi offload will be less relevant after 4G networks are in place because of the faster
speeds and more abundant bandwidth. However, 4G networks have attracted high-usage devices such as
advanced smartphones and tablets, and it appears that 4G plans are subject to data caps similar to 3G plans.
For these reasons, Wi-Fi offload is higher on 4G networks than on lower-speed networks, now and in the future
according to our projections. The amount of traffic offloaded from 4G was 56 percent at the end of 2015, and it will
be 58 percent by 2020 (Figure 20). The amount of traffic offloaded from 3G will be 48 percent by 2020, and the
amount of traffic offloaded from 2G will be 36 percent.
© 2016 Cisco and/or its affiliates. All rights reserved. This document is Cisco Public. Page 22 of 39
Figure 20. Mobile Data Traffic and Offload Traffic, 2019
Source: Cisco VNI Mobile, 2016
Growth of Wi-Fi Hotspots
Globally, total public W-Fi hotspots (including homespots) will grow sevenfold from 2015 to 2020, from 64.2 million
in 2015 to 432.5 million by 2020 (Figure 21). Total Wi-Fi homespots will grow 56.6 million in 2015 to 423.2 million
by 2020. Homespots or community hotspots are a significant part of the public Wi-Fi strategy. The public Wi-Fi
hotspots include public Wi-Fi commercial hotspots and homespots.
Figure 21. Global Wi-Fi Hotspot Strategy and 2015–2020 Forecast
Source: Maravedis, Cisco VNI Mobile, 2016
© 2016 Cisco and/or its affiliates. All rights reserved. This document is Cisco Public. Page 23 of 39
Commercial hotspots include fixed and MNO hotspots that are purchased or installed for a monthly fee or
commission. Commercial hotspots can be set up to offer both fee-based and free Internet Wi-Fi access. Hotspots
are installed to offer public Wi-Fi at cafés and restaurants, retail chains, hotels, airports, planes, and trains for
customers and guests. Cafés, retail shops, public venues, and offices usually provide a free Wi-Fi Service Set
Identifier (SSID) for their guests and visitors. Commercial hotspots are a smaller subset of the overall public Wi-Fi
hotspot forecast and will grow from 7.5M in 2015 to 9.3M by 2020.
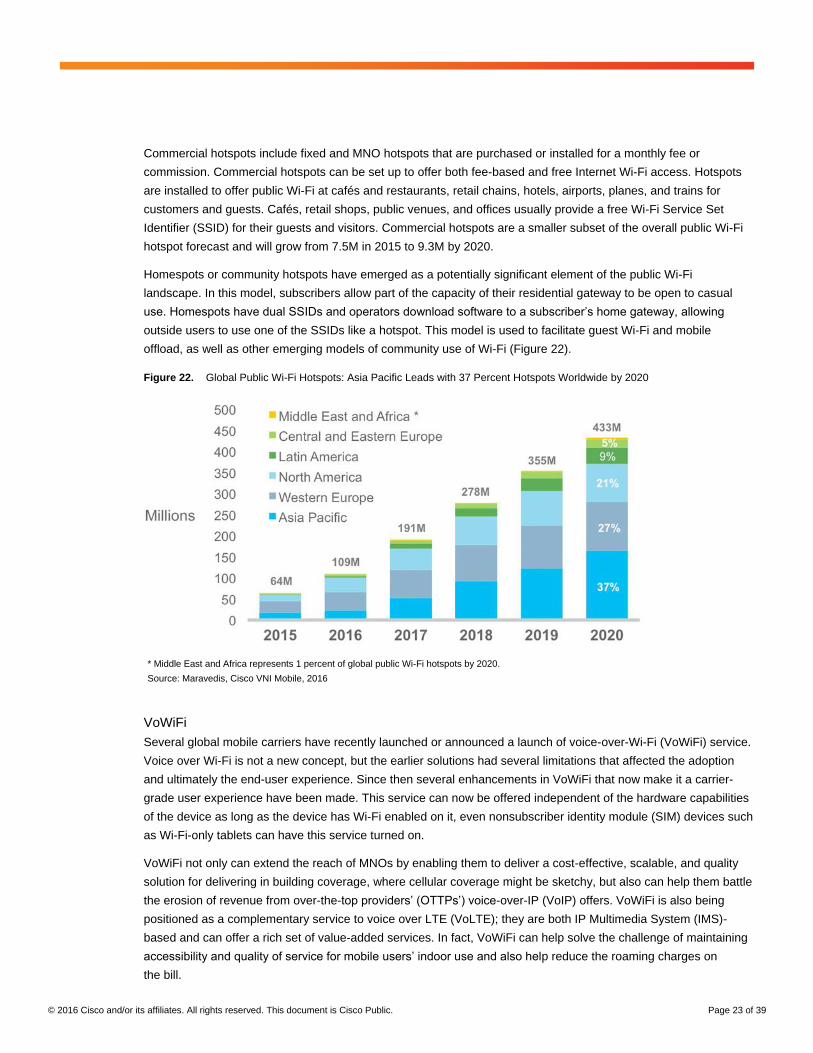
Homespots or community hotspots have emerged as a potentially significant element of the public Wi-Fi
landscape. In this model, subscribers allow part of the capacity of their residential gateway to be open to casual
use. Homespots have dual SSIDs and operators download software to a subscriber’s home gateway, allowing
outside users to use one of the SSIDs like a hotspot. This model is used to facilitate guest Wi-Fi and mobile
offload, as well as other emerging models of community use of Wi-Fi (Figure 22).
Figure 22. Global Public Wi-Fi Hotspots: Asia Pacific Leads with 37 Percent Hotspots Worldwide by 2020
* Middle East and Africa represents 1 percent of global public Wi-Fi hotspots by 2020.
Source: Maravedis, Cisco VNI Mobile, 2016
VoWiFi
Several global mobile carriers have recently launched or announced a launch of voice-over-Wi-Fi (VoWiFi) service.
Voice over Wi-Fi is not a new concept, but the earlier solutions had several limitations that affected the adoption
and ultimately the end-user experience. Since then several enhancements in VoWiFi that now make it a carrier-
grade user experience have been made. This service can now be offered independent of the hardware capabilities
of the device as long as the device has Wi-Fi enabled on it, even nonsubscriber identity module (SIM) devices such
as Wi-Fi-only tablets can have this service turned on.
VoWiFi not only can extend the reach of MNOs by enabling them to deliver a cost-effective, scalable, and quality
solution for delivering in building coverage, where cellular coverage might be sketchy, but also can help them battle
the erosion of revenue from over-the-top providers’ (OTTPs’) voice-over-IP (VoIP) offers. VoWiFi is also being
positioned as a complementary service to voice over LTE (VoLTE); they are both IP Multimedia System (IMS)-
based and can offer a rich set of value-added services. In fact, VoWiFi can help solve the challenge of maintaining
accessibility and quality of service for mobile users’ indoor use and also help reduce the roaming charges on
the bill.
© 2016 Cisco and/or its affiliates. All rights reserved. This document is Cisco Public. Page 24 of 39
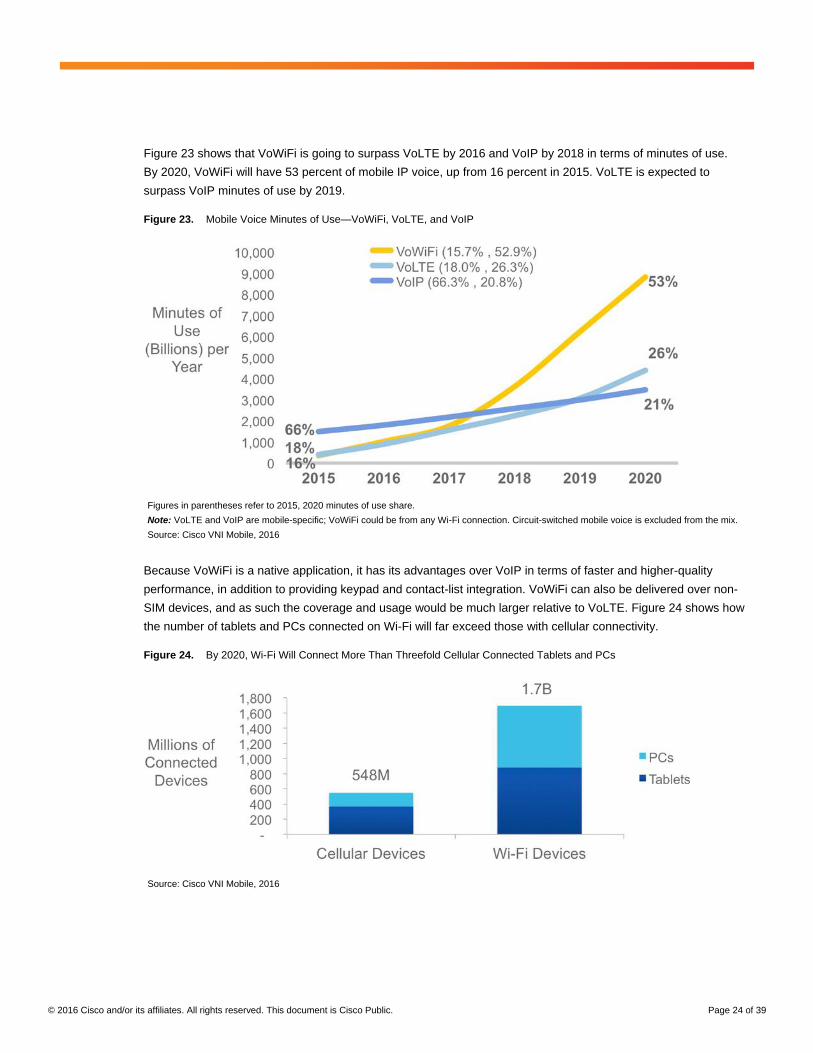
Figure 23 shows that VoWiFi is going to surpass VoLTE by 2016 and VoIP by 2018 in terms of minutes of use.
By 2020, VoWiFi will have 53 percent of mobile IP voice, up from 16 percent in 2015. VoLTE is expected to
surpass VoIP minutes of use by 2019.
Figure 23. Mobile Voice Minutes of Use—VoWiFi, VoLTE, and VoIP
Figures in parentheses refer to 2015, 2020 minutes of use share.
Note: VoLTE and VoIP are mobile-specific; VoWiFi could be from any Wi-Fi connection. Circuit-switched mobile voice is excluded from the mix.
Source: Cisco VNI Mobile, 2016
Because VoWiFi is a native application, it has its advantages over VoIP in terms of faster and higher-quality
performance, in addition to providing keypad and contact-list integration. VoWiFi can also be delivered over non-
SIM devices, and as such the coverage and usage would be much larger relative to VoLTE. Figure 24 shows how
the number of tablets and PCs connected on Wi-Fi will far exceed those with cellular connectivity.
Figure 24. By 2020, Wi-Fi Will Connect More Than Threefold Cellular Connected Tablets and PCs
Source: Cisco VNI Mobile, 2016
© 2016 Cisco and/or its affiliates. All rights reserved. This document is Cisco Public. Page 25 of 39
Wi-Fi access has had widespread acceptance by MNOs globally, and it has evolved as a complementary network
for traffic offload purposes—offloading from expensive cellular networks on to lower-cost-per-bit Wi-Fi networks.
If we draw a parallel from data to voice, we can foresee a similar evolution where VoWiFi is evolving as a
supplement to cellular voice, extending the coverage of cellular networks through Wi-Fi for voice within the
buildings and other areas that have a wider and more optimum access to Wi-Fi hotspots.
Overall Wi-Fi Traffic Growth
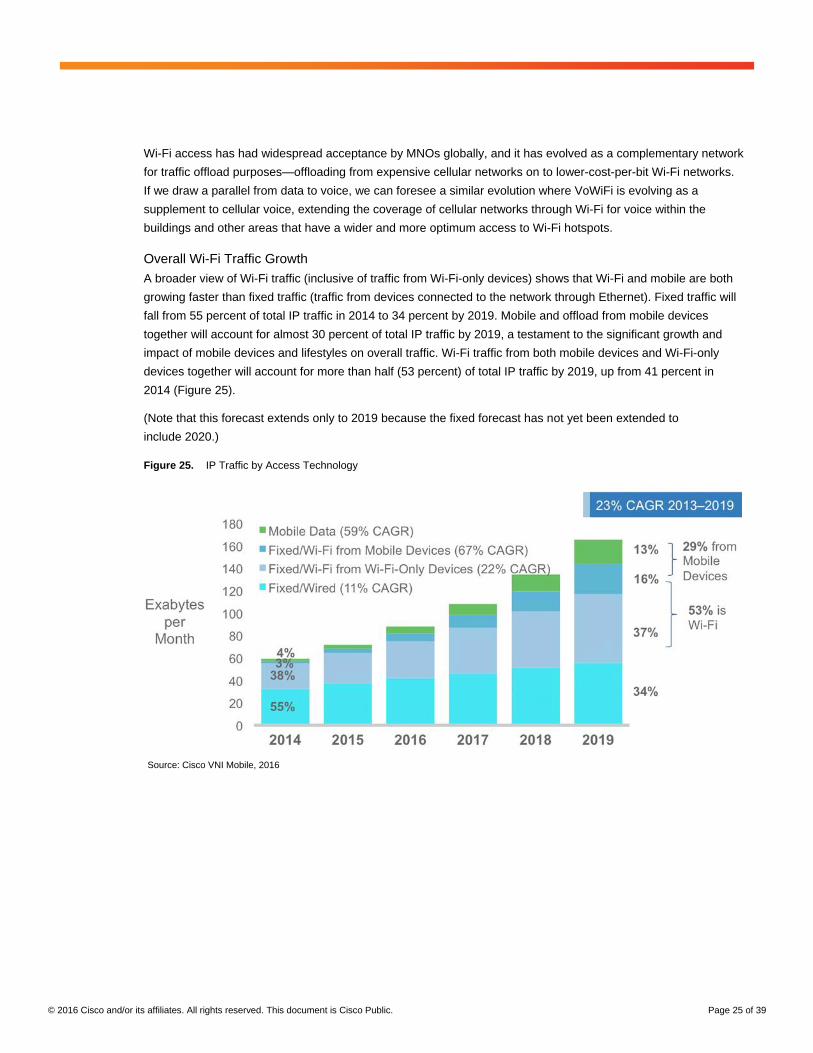
A broader view of Wi-Fi traffic (inclusive of traffic from Wi-Fi-only devices) shows that Wi-Fi and mobile are both
growing faster than fixed traffic (traffic from devices connected to the network through Ethernet). Fixed traffic will
fall from 55 percent of total IP traffic in 2014 to 34 percent by 2019. Mobile and offload from mobile devices
together will account for almost 30 percent of total IP traffic by 2019, a testament to the significant growth and
impact of mobile devices and lifestyles on overall traffic. Wi-Fi traffic from both mobile devices and Wi-Fi-only
devices together will account for more than half (53 percent) of total IP traffic by 2019, up from 41 percent in
2014 (Figure 25).
(Note that this forecast extends only to 2019 because the fixed forecast has not yet been extended to
include 2020.)
Figure 25. IP Traffic by Access Technology
Source: Cisco VNI Mobile, 2016
© 2016 Cisco and/or its affiliates. All rights reserved. This document is Cisco Public. Page 26 of 39
Trend 5: Profiling Mobile Applications Use and Bandwidth Consumption Patterns
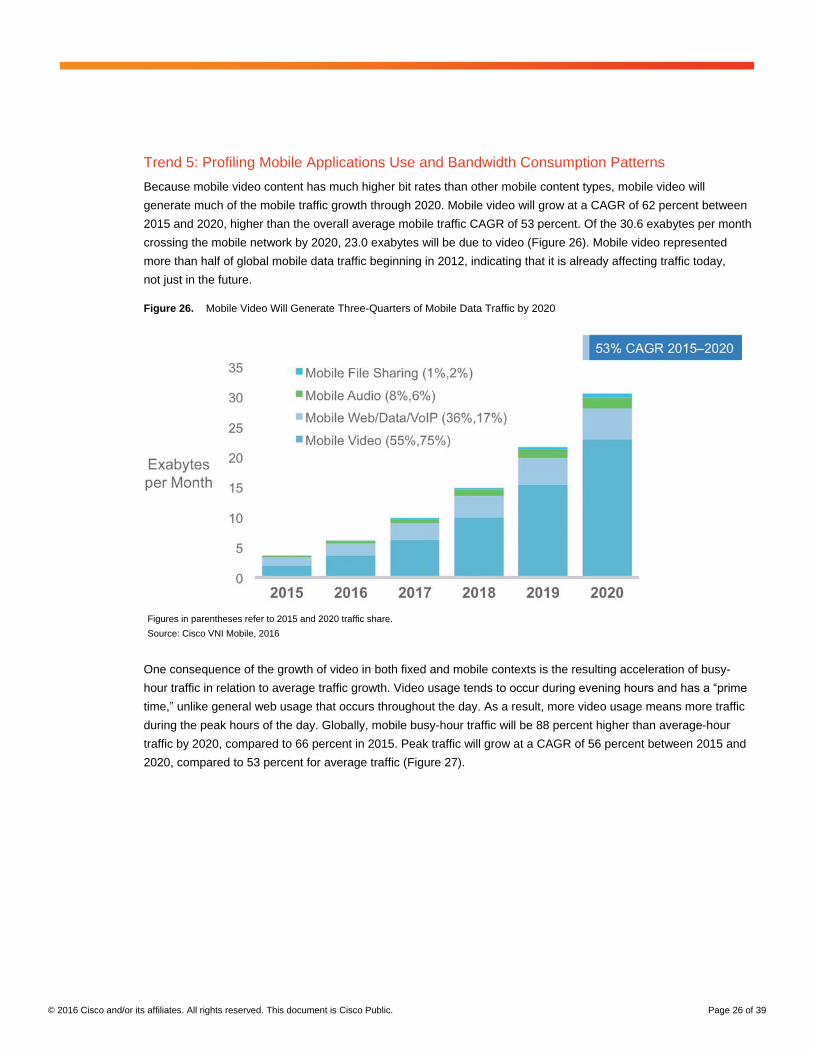
Because mobile video content has much higher bit rates than other mobile content types, mobile video will
generate much of the mobile traffic growth through 2020. Mobile video will grow at a CAGR of 62 percent between
2015 and 2020, higher than the overall average mobile traffic CAGR of 53 percent. Of the 30.6 exabytes per month
crossing the mobile network by 2020, 23.0 exabytes will be due to video (Figure 26). Mobile video represented
more than half of global mobile data traffic beginning in 2012, indicating that it is already affecting traffic today,
not just in the future.
Figure 26. Mobile Video Will Generate Three-Quarters of Mobile Data Traffic by 2020
Figures in parentheses refer to 2015 and 2020 traffic share.
Source: Cisco VNI Mobile, 2016
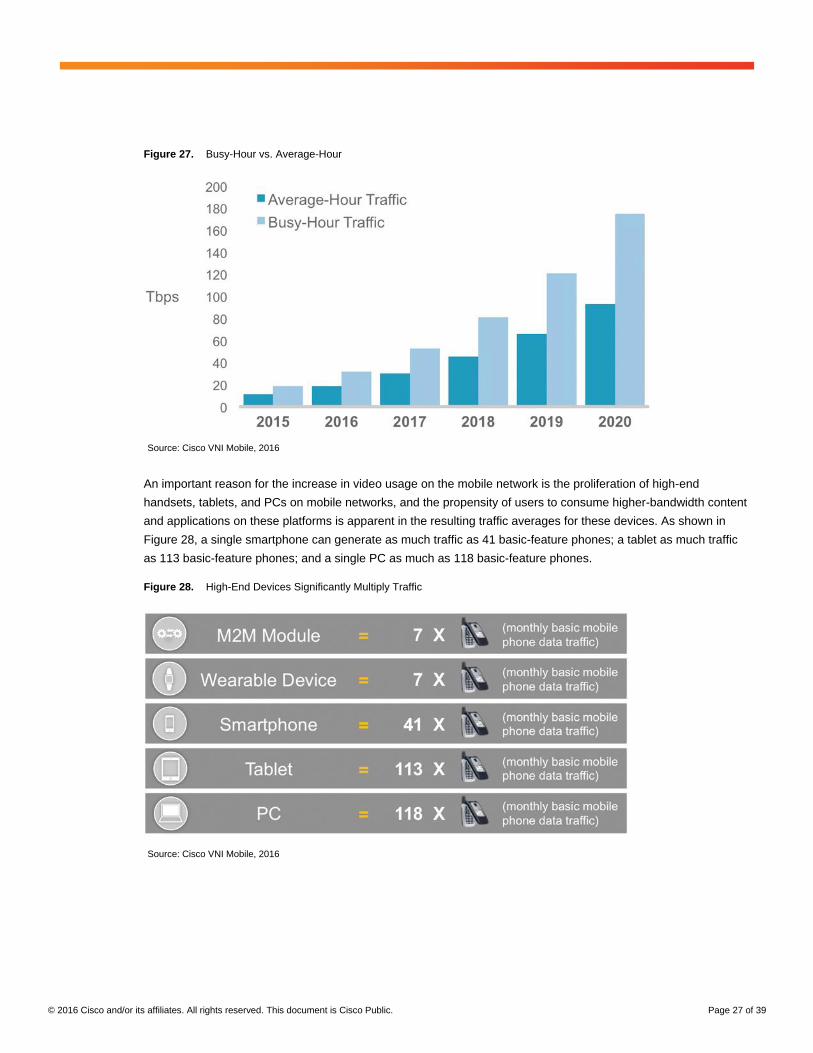
One consequence of the growth of video in both fixed and mobile contexts is the resulting acceleration of busy-
hour traffic in relation to average traffic growth. Video usage tends to occur during evening hours and has a “prime
time,” unlike general web usage that occurs throughout the day. As a result, more video usage means more traffic
during the peak hours of the day. Globally, mobile busy-hour traffic will be 88 percent higher than average-hour
traffic by 2020, compared to 66 percent in 2015. Peak traffic will grow at a CAGR of 56 percent between 2015 and
2020, compared to 53 percent for average traffic (Figure 27).
© 2016 Cisco and/or its affiliates. All rights reserved. This document is Cisco Public. Page 27 of 39
Figure 27. Busy-Hour vs. Average-Hour
Source: Cisco VNI Mobile, 2016
An important reason for the increase in video usage on the mobile network is the proliferation of high-end
handsets, tablets, and PCs on mobile networks, and the propensity of users to consume higher-bandwidth content
and applications on these platforms is apparent in the resulting traffic averages for these devices. As shown in
Figure 28, a single smartphone can generate as much traffic as 41 basic-feature phones; a tablet as much traffic
as 113 basic-feature phones; and a single PC as much as 118 basic-feature phones.
Figure 28. High-End Devices Significantly Multiply Traffic
Source: Cisco VNI Mobile, 2016
© 2016 Cisco and/or its affiliates. All rights reserved. This document is Cisco Public. Page 28 of 39
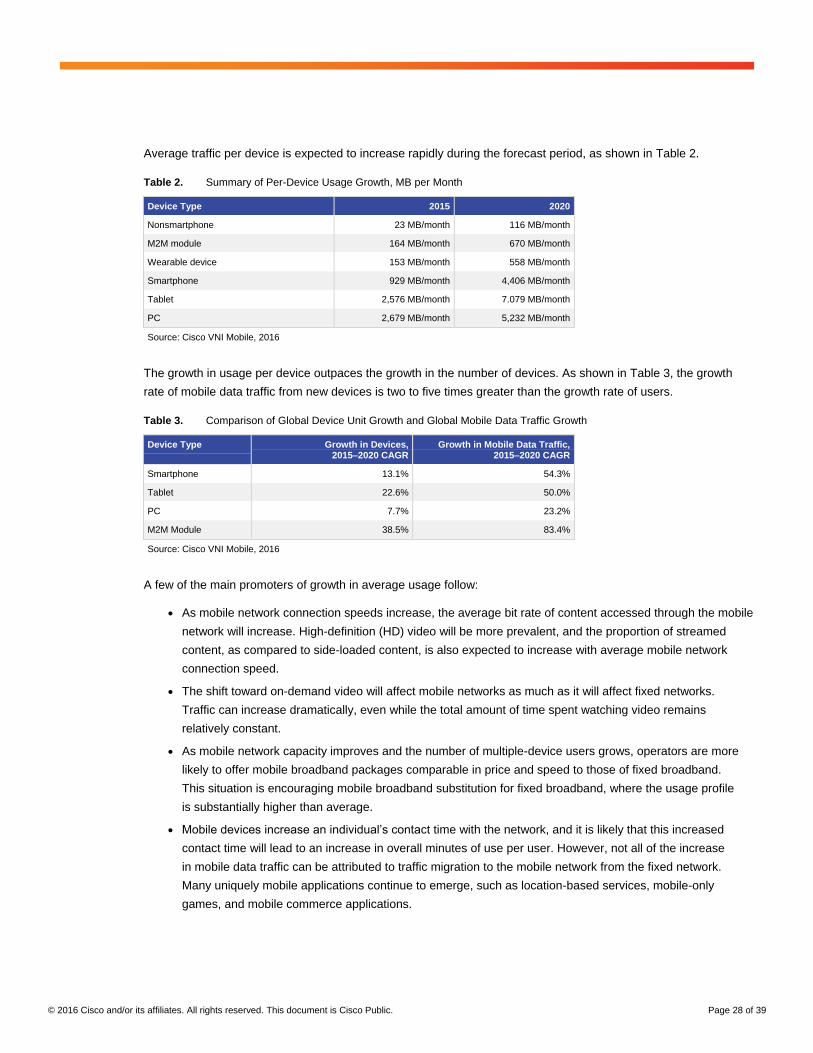
Average traffic per device is expected to increase rapidly during the forecast period, as shown in Table 2.
Table 2. Summary of Per-Device Usage Growth, MB per Month
Device Type 2015 2020
Nonsmartphone 23 MB/month 116 MB/month
M2M module 164 MB/month 670 MB/month
Wearable device 153 MB/month 558 MB/month
Smartphone 929 MB/month 4,406 MB/month
Tablet 2,576 MB/month 7.079 MB/month
PC 2,679 MB/month 5,232 MB/month
Source: Cisco VNI Mobile, 2016
The growth in usage per device outpaces the growth in the number of devices. As shown in Table 3, the growth
rate of mobile data traffic from new devices is two to five times greater than the growth rate of users.
Table 3. Comparison of Global Device Unit Growth and Global Mobile Data Traffic Growth
Device Type Growth in Devices, 2015–2020 CAGR
Growth in Mobile Data Traffic, 2015–2020 CAGR
Smartphone 13.1% 54.3%
Tablet 22.6% 50.0%
PC 7.7% 23.2%
M2M Module 38.5% 83.4%
Source: Cisco VNI Mobile, 2016
A few of the main promoters of growth in average usage follow:
● As mobile network connection speeds increase, the average bit rate of content accessed through the mobile
network will increase. High-definition (HD) video will be more prevalent, and the proportion of streamed
content, as compared to side-loaded content, is also expected to increase with average mobile network
connection speed.
● The shift toward on-demand video will affect mobile networks as much as it will affect fixed networks.
Traffic can increase dramatically, even while the total amount of time spent watching video remains
relatively constant.
● As mobile network capacity improves and the number of multiple-device users grows, operators are more
likely to offer mobile broadband packages comparable in price and speed to those of fixed broadband.
This situation is encouraging mobile broadband substitution for fixed broadband, where the usage profile
is substantially higher than average.
● Mobile devices increase an individual’s contact time with the network, and it is likely that this increased
contact time will lead to an increase in overall minutes of use per user. However, not all of the increase
in mobile data traffic can be attributed to traffic migration to the mobile network from the fixed network.
Many uniquely mobile applications continue to emerge, such as location-based services, mobile-only
games, and mobile commerce applications.
© 2016 Cisco and/or its affiliates. All rights reserved. This document is Cisco Public. Page 29 of 39
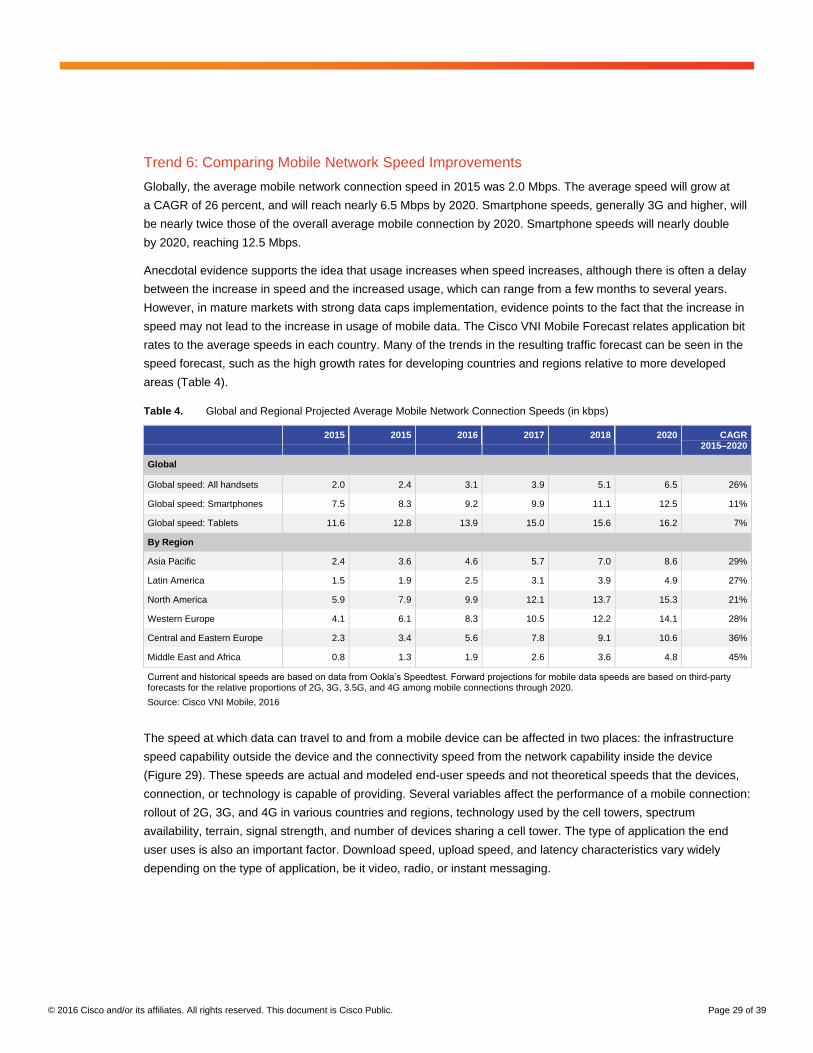
Trend 6: Comparing Mobile Network Speed Improvements
Globally, the average mobile network connection speed in 2015 was 2.0 Mbps. The average speed will grow at
a CAGR of 26 percent, and will reach nearly 6.5 Mbps by 2020. Smartphone speeds, generally 3G and higher, will
be nearly twice those of the overall average mobile connection by 2020. Smartphone speeds will nearly double
by 2020, reaching 12.5 Mbps.
Anecdotal evidence supports the idea that usage increases when speed increases, although there is often a delay
between the increase in speed and the increased usage, which can range from a few months to several years.
However, in mature markets with strong data caps implementation, evidence points to the fact that the increase in
speed may not lead to the increase in usage of mobile data. The Cisco VNI Mobile Forecast relates application bit
rates to the average speeds in each country. Many of the trends in the resulting traffic forecast can be seen in the
speed forecast, such as the high growth rates for developing countries and regions relative to more developed
areas (Table 4).
Table 4. Global and Regional Projected Average Mobile Network Connection Speeds (in kbps)
2015 2015 2016 2017 2018 2020 CAGR 2015–2020
Global
Global speed: All handsets 2.0 2.4 3.1 3.9 5.1 6.5 26%
Global speed: Smartphones 7.5 8.3 9.2 9.9 11.1 12.5 11%
Global speed: Tablets 11.6 12.8 13.9 15.0 15.6 16.2 7%
By Region
Asia Pacific 2.4 3.6 4.6 5.7 7.0 8.6 29%
Latin America 1.5 1.9 2.5 3.1 3.9 4.9 27%
North America 5.9 7.9 9.9 12.1 13.7 15.3 21%
Western Europe 4.1 6.1 8.3 10.5 12.2 14.1 28%
Central and Eastern Europe 2.3 3.4 5.6 7.8 9.1 10.6 36%
Middle East and Africa 0.8 1.3 1.9 2.6 3.6 4.8 45%
Current and historical speeds are based on data from Ookla’s Speedtest. Forward projections for mobile data speeds are based on third-party forecasts for the relative proportions of 2G, 3G, 3.5G, and 4G among mobile connections through 2020.
Source: Cisco VNI Mobile, 2016
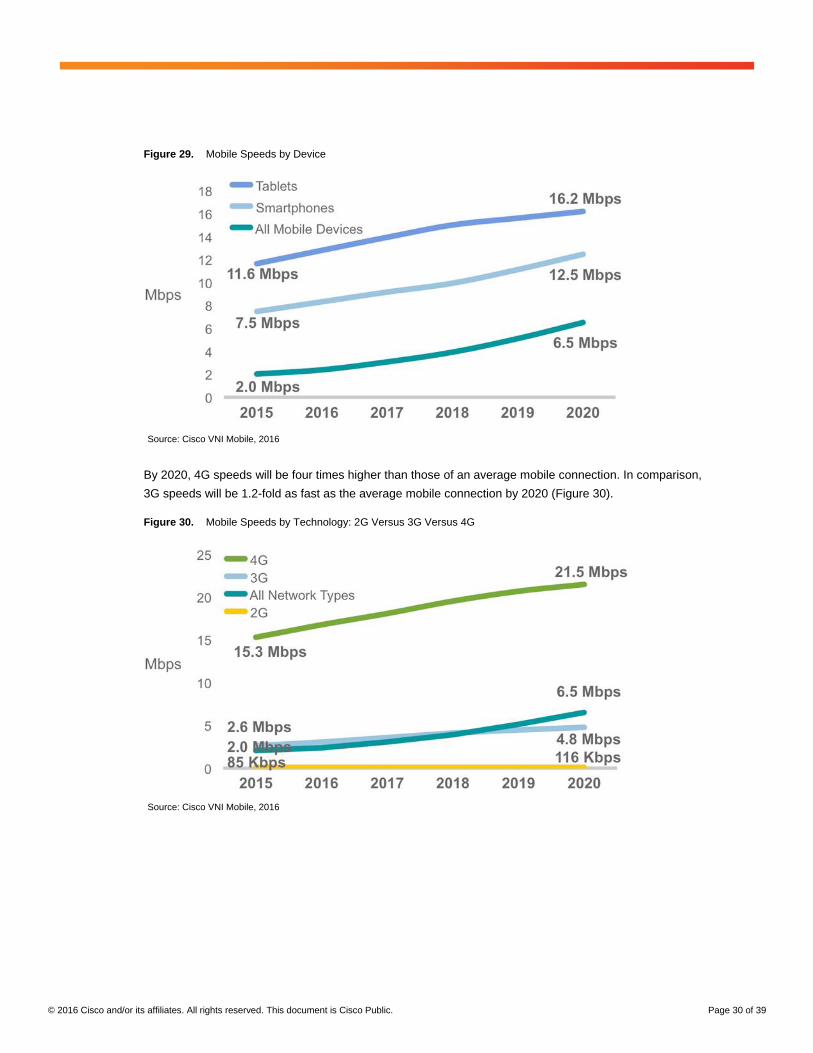
The speed at which data can travel to and from a mobile device can be affected in two places: the infrastructure
speed capability outside the device and the connectivity speed from the network capability inside the device
(Figure 29). These speeds are actual and modeled end-user speeds and not theoretical speeds that the devices,
connection, or technology is capable of providing. Several variables affect the performance of a mobile connection:
rollout of 2G, 3G, and 4G in various countries and regions, technology used by the cell towers, spectrum
availability, terrain, signal strength, and number of devices sharing a cell tower. The type of application the end
user uses is also an important factor. Download speed, upload speed, and latency characteristics vary widely
depending on the type of application, be it video, radio, or instant messaging.
© 2016 Cisco and/or its affiliates. All rights reserved. This document is Cisco Public. Page 30 of 39
Figure 29. Mobile Speeds by Device
Source: Cisco VNI Mobile, 2016
By 2020, 4G speeds will be four times higher than those of an average mobile connection. In comparison,
3G speeds will be 1.2-fold as fast as the average mobile connection by 2020 (Figure 30).
Figure 30. Mobile Speeds by Technology: 2G Versus 3G Versus 4G
Source: Cisco VNI Mobile, 2016
© 2016 Cisco and/or its affiliates. All rights reserved. This document is Cisco Public. Page 31 of 39
Trend 7: Reviewing Tiered Pricing—Unlimited Data and Shared Plans
An increasing number of service providers worldwide are moving from unlimited data plans to tiered mobile data
packages. To make an estimate of the impact of tiered pricing on traffic growth, we repeated a case study based
on the data of several tier 1 and tier 2 North American service providers. The study tracks data usage from the
timeframe of the introduction of tiered pricing 4 years ago. The findings in this study are based on Cisco’s analysis
of data provided by a third-party data-analysis firm. This firm maintains a panel of volunteer participants who have
given the company access to their mobile service bills, including GB of data usage. The data in this study reflects
usage associated with devices (from June 2014 and November 2015) and also refers to the study from the
previous update for longer-term trends. The overall study spans 4 years. Cisco’s analysis of the data consists
of categorizing the pricing plans, operating systems, devices, and users; incorporating additional third-party
information about device characteristics; and performing exploratory and statistical data analysis. Although the
results of the study represent actual data from a few tier 1 and tier 2 mobile data operators from North American
markets, global forecasts that include emerging markets and more providers may lead to lower estimates.
Unlimited plans had made a temporary resurgence from October 2013 to June 2014 with the increased number
of unlimited plan offerings by tier 2 operators. In November 2015, 73 percent of the data plans were tiered and
27 percent of the data plans were unlimited. The gigabyte consumption of both tiered and unlimited plans has
increased. On an average, usage on a device with a tiered plan grew from 1.1 GB in June 2014 to 2.7 GB in
November 2015. Unlimited plans consumption grew at a faster rate, from 2.6 GB in June 2014 to 6.4 GB in
November 2015.Tiered pricing plans are often designed to constrain the heaviest mobile data users, especially
the top 1 percent of mobile data consumers.
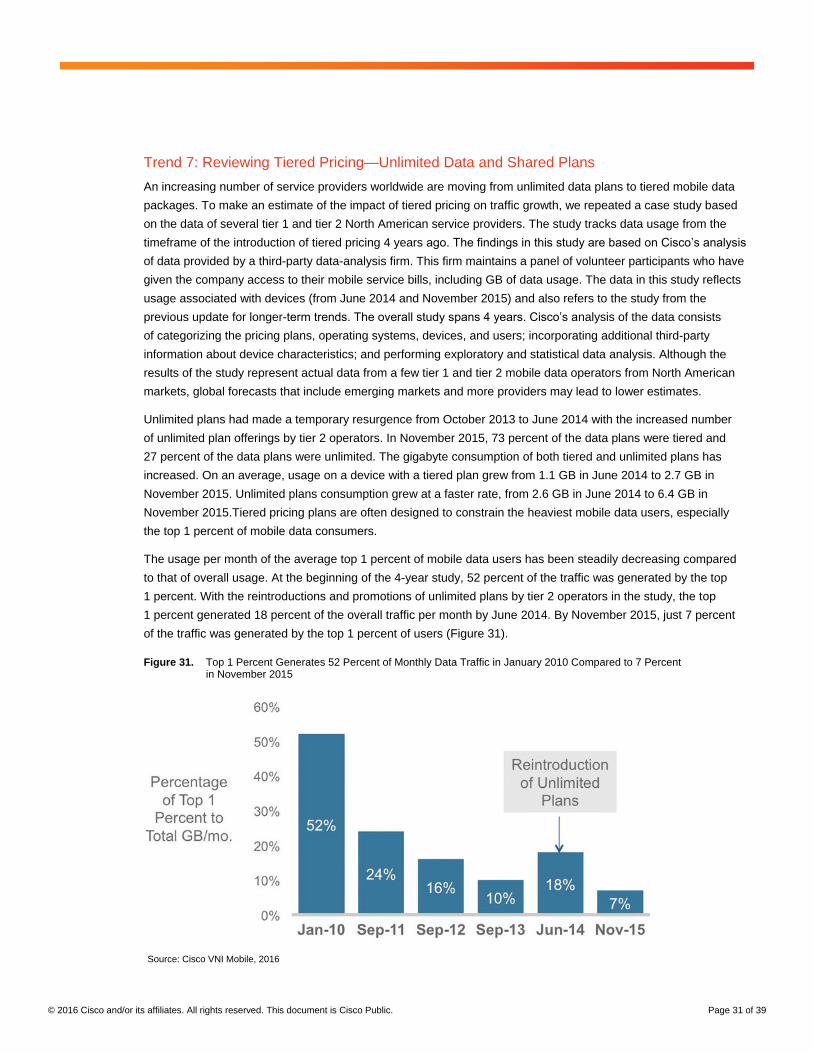
The usage per month of the average top 1 percent of mobile data users has been steadily decreasing compared
to that of overall usage. At the beginning of the 4-year study, 52 percent of the traffic was generated by the top
1 percent. With the reintroductions and promotions of unlimited plans by tier 2 operators in the study, the top
1 percent generated 18 percent of the overall traffic per month by June 2014. By November 2015, just 7 percent
of the traffic was generated by the top 1 percent of users (Figure 31).
Figure 31. Top 1 Percent Generates 52 Percent of Monthly Data Traffic in January 2010 Compared to 7 Percent in November 2015
Source: Cisco VNI Mobile, 2016
© 2016 Cisco and/or its affiliates. All rights reserved. This document is Cisco Public. Page 32 of 39
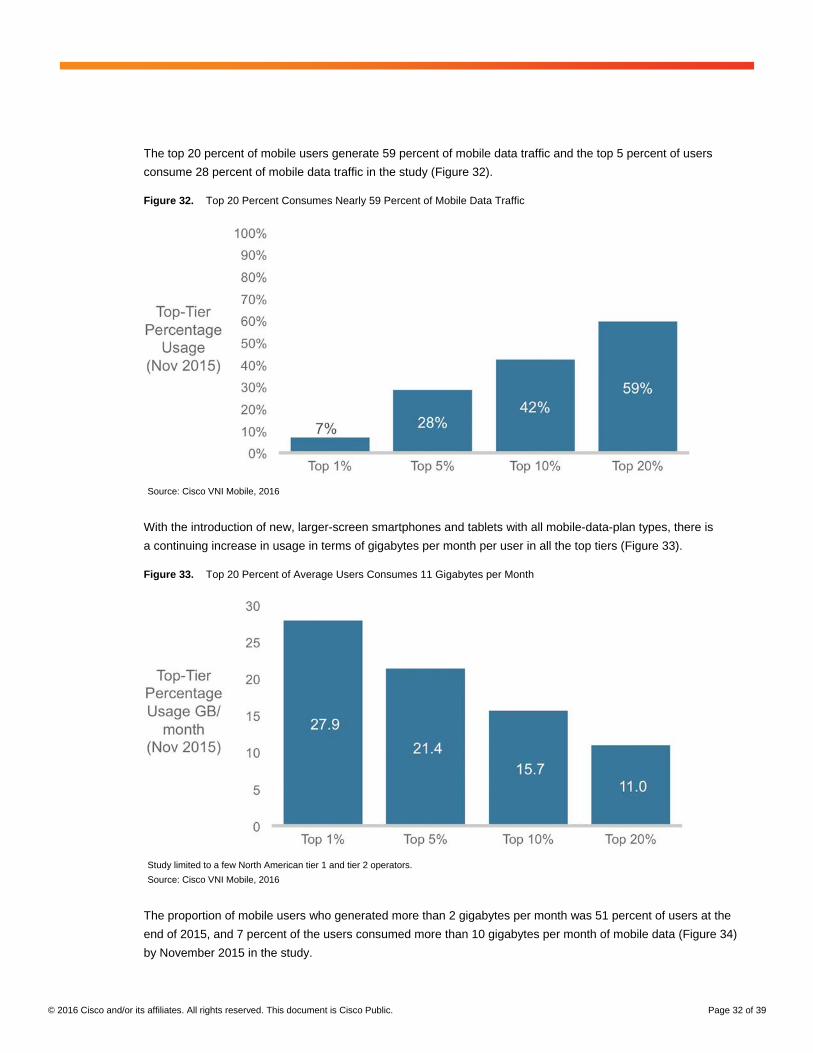
The top 20 percent of mobile users generate 59 percent of mobile data traffic and the top 5 percent of users
consume 28 percent of mobile data traffic in the study (Figure 32).
Figure 32. Top 20 Percent Consumes Nearly 59 Percent of Mobile Data Traffic
Source: Cisco VNI Mobile, 2016
With the introduction of new, larger-screen smartphones and tablets with all mobile-data-plan types, there is
a continuing increase in usage in terms of gigabytes per month per user in all the top tiers (Figure 33).
Figure 33. Top 20 Percent of Average Users Consumes 11 Gigabytes per Month
Study limited to a few North American tier 1 and tier 2 operators.
Source: Cisco VNI Mobile, 2016
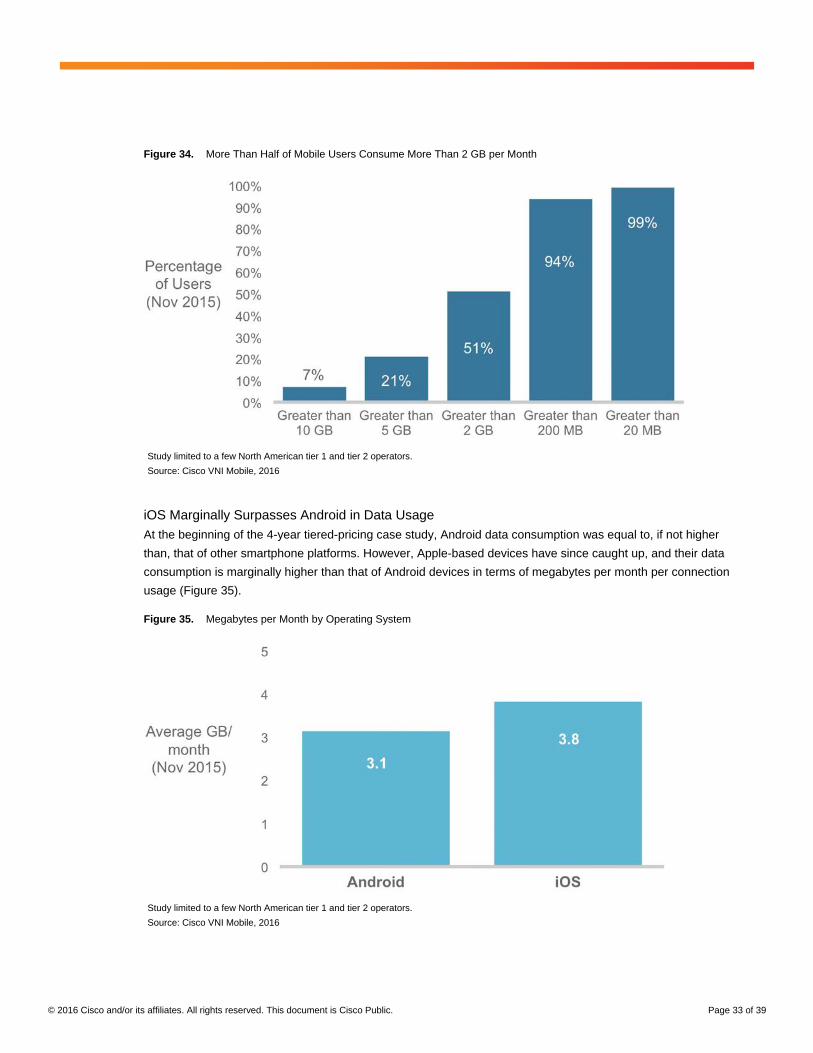
The proportion of mobile users who generated more than 2 gigabytes per month was 51 percent of users at the
end of 2015, and 7 percent of the users consumed more than 10 gigabytes per month of mobile data (Figure 34)
by November 2015 in the study.
© 2016 Cisco and/or its affiliates. All rights reserved. This document is Cisco Public. Page 33 of 39
Figure 34. More Than Half of Mobile Users Consume More Than 2 GB per Month
Study limited to a few North American tier 1 and tier 2 operators.
Source: Cisco VNI Mobile, 2016
iOS Marginally Surpasses Android in Data Usage
At the beginning of the 4-year tiered-pricing case study, Android data consumption was equal to, if not higher
than, that of other smartphone platforms. However, Apple-based devices have since caught up, and their data
consumption is marginally higher than that of Android devices in terms of megabytes per month per connection
usage (Figure 35).
Figure 35. Megabytes per Month by Operating System
Study limited to a few North American tier 1 and tier 2 operators.
Source: Cisco VNI Mobile, 2016
© 2016 Cisco and/or its affiliates. All rights reserved. This document is Cisco Public. Page 34 of 39
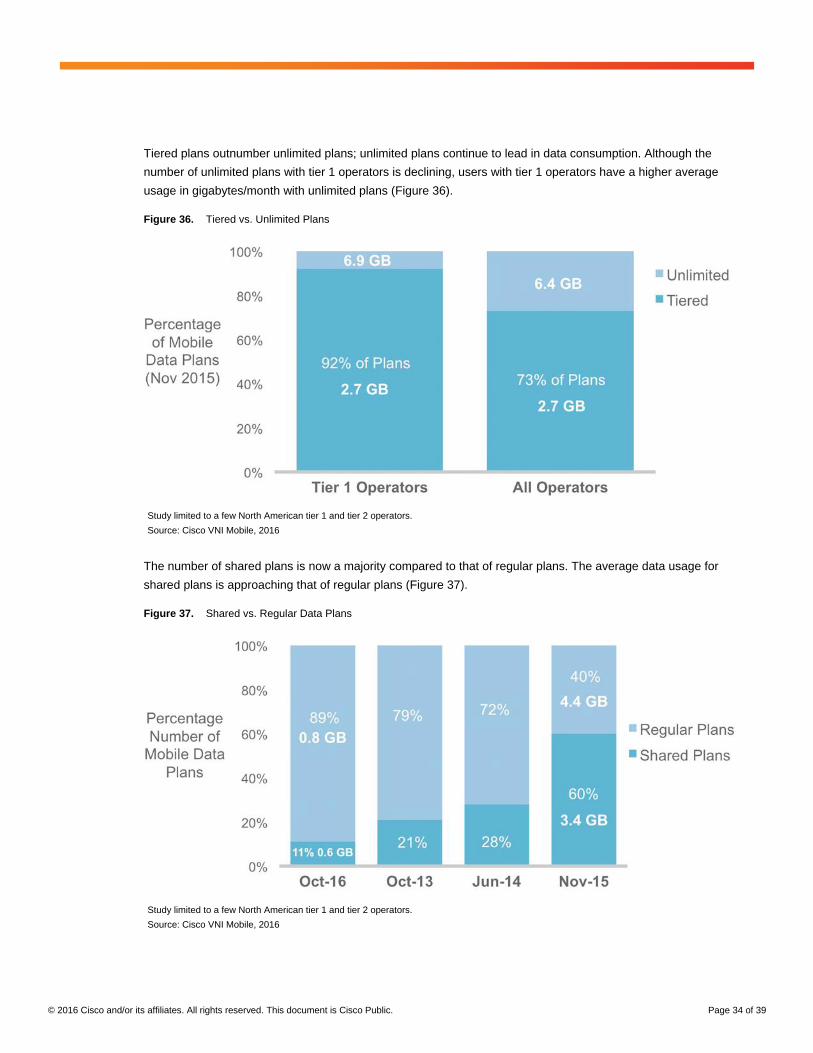
Tiered plans outnumber unlimited plans; unlimited plans continue to lead in data consumption. Although the
number of unlimited plans with tier 1 operators is declining, users with tier 1 operators have a higher average
usage in gigabytes/month with unlimited plans (Figure 36).
Figure 36. Tiered vs. Unlimited Plans
Study limited to a few North American tier 1 and tier 2 operators.
Source: Cisco VNI Mobile, 2016
The number of shared plans is now a majority compared to that of regular plans. The average data usage for
shared plans is approaching that of regular plans (Figure 37).
Figure 37. Shared vs. Regular Data Plans
Study limited to a few North American tier 1 and tier 2 operators.
Source: Cisco VNI Mobile, 2016

© 2016 Cisco and/or its affiliates. All rights reserved. This document is Cisco Public. Page 35 of 39
Conclusion
Mobile data services are well on their way to becoming necessities for many network users. Most people already
consider mobile voice service a necessity, and mobile voice, data, and video services are fast becoming an
essential part of consumers’ lives. Used extensively by consumer as well as enterprise segments, with impressive
uptakes in both developed and emerging markets, mobility has proved to be transformational. The number of
mobile subscribers is growing rapidly, and bandwidth demand for data and video is increasing. Mobile M2M
connections continue to increase. The next 5 years are projected to provide unabated mobile video adoption.
Backhaul capacity must increase so mobile broadband, data access, and video services can effectively support
consumer usage trends and keep mobile infrastructure costs in check.
Deploying next-generation mobile networks requires greater service portability and interoperability. With the
proliferation of mobile and portable devices, there is an imminent need for networks to allow all these devices
to be connected transparently, with the network providing high-performance computing and delivering enhanced
real-time video and multimedia. This openness will broaden the range of applications and services that can
be shared, creating a highly enhanced mobile broadband experience. The expansion of wireless presence will
increase the number of consumers who access and rely on mobile networks, creating a need for greater
economies of scale and lower cost per bit.
As many business models emerge with new forms of advertising; media and content partnerships; and mobile
services including M2M, live gaming, and augmented reality, a mutually beneficial situation needs to be developed
for service providers and over-the-top providers. New partnerships, ecosystems, and strategic consolidations are
expected as mobile operators, content providers, application developers, and others seek to monetize the video
traffic that traverses mobile networks. Operators must solve the challenge of effectively monetizing video traffic
while increasing infrastructure capital expenditures. They must become more agile and able to change course
quickly and provide innovative services to engage the Web 3.0 consumer. While the net neutrality regulatory
process and business models of operators evolve, there is an unmet demand from consumers for the highest
quality and speeds. As wireless technologies aim to provide experiences formerly available only through wired
networks, the next few years will be critical for operators and service providers to plan future network deployments
that will create an adaptable environment in which the multitude of mobile-enabled devices and applications of the
future can be deployed.
For More Information
Inquiries can be directed to [email protected].
© 2016 Cisco and/or its affiliates. All rights reserved. This document is Cisco Public. Page 36 of 39
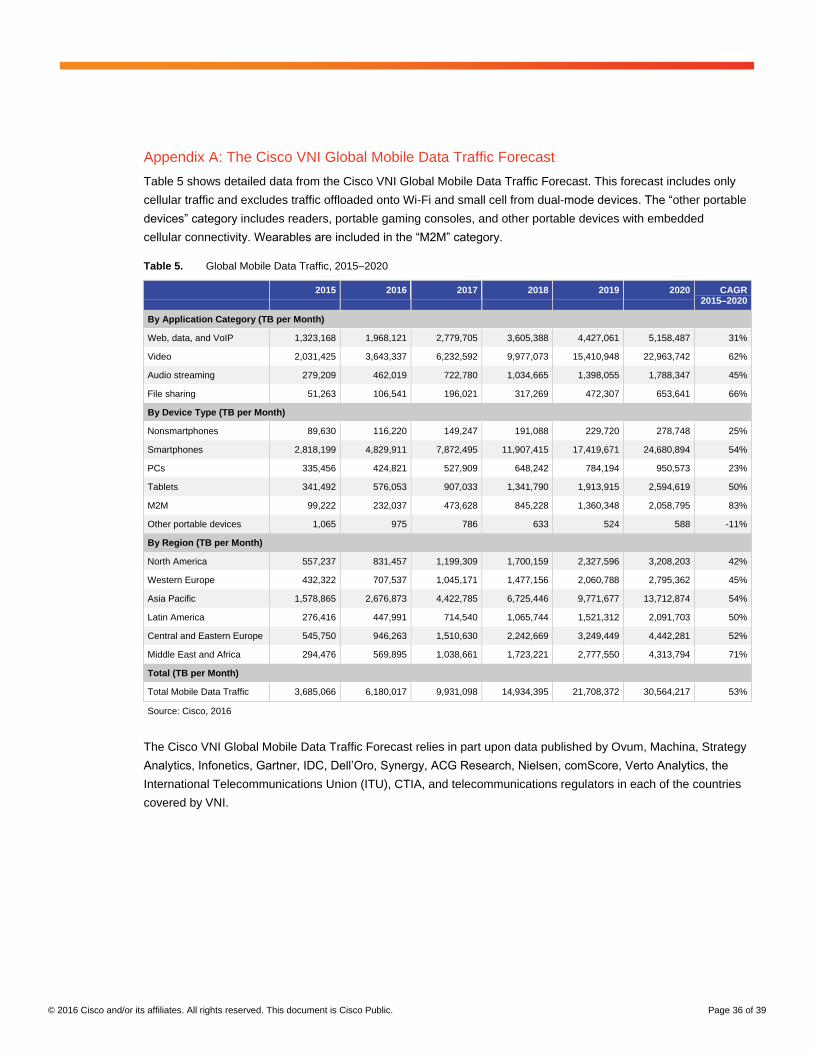
Appendix A: The Cisco VNI Global Mobile Data Traffic Forecast
Table 5 shows detailed data from the Cisco VNI Global Mobile Data Traffic Forecast. This forecast includes only
cellular traffic and excludes traffic offloaded onto Wi-Fi and small cell from dual-mode devices. The “other portable
devices” category includes readers, portable gaming consoles, and other portable devices with embedded
cellular connectivity. Wearables are included in the “M2M” category.
Table 5. Global Mobile Data Traffic, 2015–2020
2015 2016 2017 2018 2019 2020 CAGR 2015–2020
By Application Category (TB per Month)
Web, data, and VoIP 1,323,168 1,968,121 2,779,705 3,605,388 4,427,061 5,158,487 31%
Video 2,031,425 3,643,337 6,232,592 9,977,073 15,410,948 22,963,742 62%
Audio streaming 279,209 462,019 722,780 1,034,665 1,398,055 1,788,347 45%
File sharing 51,263 106,541 196,021 317,269 472,307 653,641 66%
By Device Type (TB per Month)
Nonsmartphones 89,630 116,220 149,247 191,088 229,720 278,748 25%
Smartphones 2,818,199 4,829,911 7,872,495 11,907,415 17,419,671 24,680,894 54%
PCs 335,456 424,821 527,909 648,242 784,194 950,573 23%
Tablets 341,492 576,053 907,033 1,341,790 1,913,915 2,594,619 50%
M2M 99,222 232,037 473,628 845,228 1,360,348 2,058,795 83%
Other portable devices 1,065 975 786 633 524 588 -11%
By Region (TB per Month)
North America 557,237 831,457 1,199,309 1,700,159 2,327,596 3,208,203 42%
Western Europe 432,322 707,537 1,045,171 1,477,156 2,060,788 2,795,362 45%
Asia Pacific 1,578,865 2,676,873 4,422,785 6,725,446 9,771,677 13,712,874 54%
Latin America 276,416 447,991 714,540 1,065,744 1,521,312 2,091,703 50%
Central and Eastern Europe 545,750 946,263 1,510,630 2,242,669 3,249,449 4,442,281 52%
Middle East and Africa 294,476 569,895 1,038,661 1,723,221 2,777,550 4,313,794 71%
Total (TB per Month)
Total Mobile Data Traffic 3,685,066 6,180,017 9,931,098 14,934,395 21,708,372 30,564,217 53%
Source: Cisco, 2016
The Cisco VNI Global Mobile Data Traffic Forecast relies in part upon data published by Ovum, Machina, Strategy
Analytics, Infonetics, Gartner, IDC, Dell’Oro, Synergy, ACG Research, Nielsen, comScore, Verto Analytics, the
International Telecommunications Union (ITU), CTIA, and telecommunications regulators in each of the countries
covered by VNI.
© 2016 Cisco and/or its affiliates. All rights reserved. This document is Cisco Public. Page 37 of 39
The Cisco VNI methodology begins with the number and growth of connections and devices, applies adoption
rates for applications, and then multiplies the application user base by Cisco’s estimated minutes of use
and KB per minute for that application. The methodology has evolved to link assumptions more closely with
fundamental factors, to use data sources unique to Cisco, and to provide a high degree of application, segment,
geographic, and device specificity.
● Inclusion of fundamental factors: As with the fixed IP traffic forecast, each Cisco VNI Global Mobile
Data Traffic Forecast update increases the linkages between the main assumptions and fundamental
factors such as available connection speed, pricing of connections and devices, computational processing
power, screen size and resolution, and even device battery life. This update focuses on the relationship of
mobile connection speeds and the KB-per-minute assumptions in the forecast model.
● Device-centric approach: As the number and variety of devices on the mobile network continue to
increase, it becomes essential to model traffic at the device level rather than the connection level. This
Cisco VNI Global Mobile Data Traffic Forecast update details traffic to smartphones; nonsmartphones;
laptops, tablets, and netbooks; e-readers; digital still cameras; digital video cameras; digital photo frames;
in-car entertainment systems; and handheld gaming consoles.
● Estimation of the impact of traffic offload: The Cisco VNI Global Mobile Data Traffic Forecast model
now quantifies the effect of dual-mode devices and femtocells on handset traffic. Data from the
USC Institute for Communication Technology Management’s annual mobile survey was used to
model offload effects.
© 2016 Cisco and/or its affiliates. All rights reserved. This document is Cisco Public. Page 38 of 39
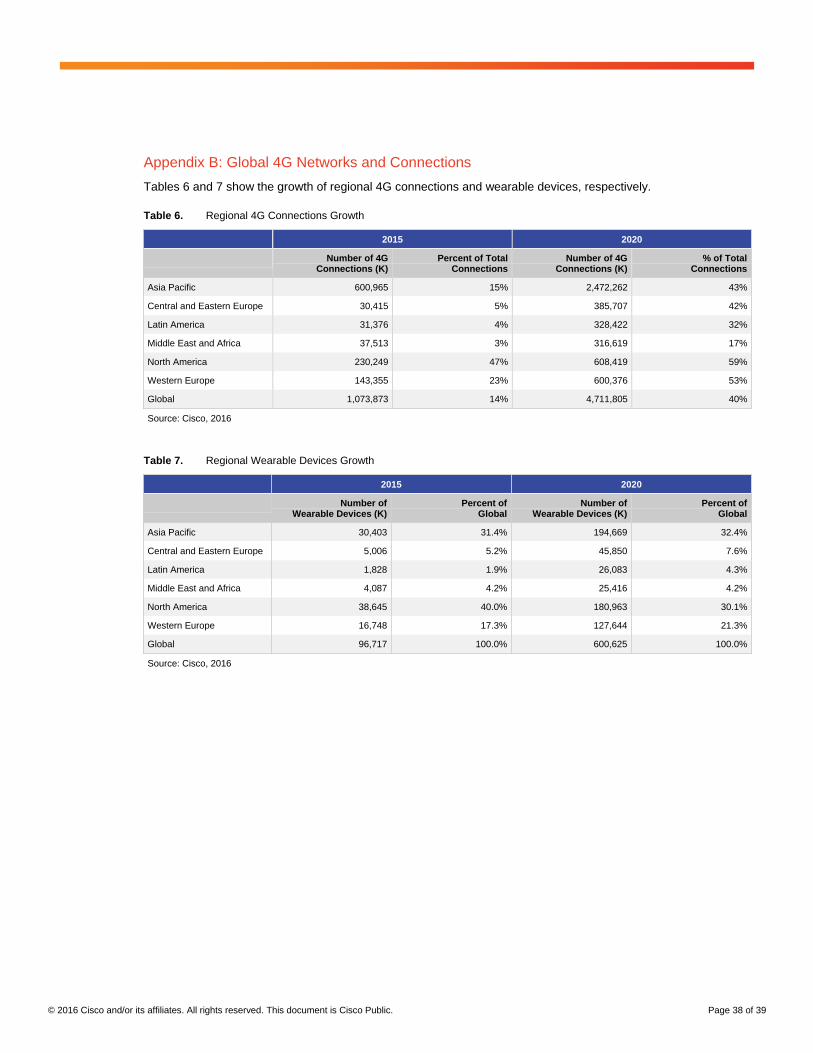
Appendix B: Global 4G Networks and Connections
Tables 6 and 7 show the growth of regional 4G connections and wearable devices, respectively.
Table 6. Regional 4G Connections Growth
2015 2020
Number of 4G Connections (K)
Percent of Total Connections
Number of 4G Connections (K)
% of Total Connections
Asia Pacific 600,965 15% 2,472,262 43%
Central and Eastern Europe 30,415 5% 385,707 42%
Latin America 31,376 4% 328,422 32%
Middle East and Africa 37,513 3% 316,619 17%
North America 230,249 47% 608,419 59%
Western Europe 143,355 23% 600,376 53%
Global 1,073,873 14% 4,711,805 40%
Source: Cisco, 2016
Table 7. Regional Wearable Devices Growth
2015 2020
Number of Wearable Devices (K)
Percent of Global
Number of Wearable Devices (K)
Percent of Global
Asia Pacific 30,403 31.4% 194,669 32.4%
Central and Eastern Europe 5,006 5.2% 45,850 7.6%
Latin America 1,828 1.9% 26,083 4.3%
Middle East and Africa 4,087 4.2% 25,416 4.2%
North America 38,645 40.0% 180,963 30.1%
Western Europe 16,748 17.3% 127,644 21.3%
Global 96,717 100.0% 600,625 100.0%
Source: Cisco, 2016
© 2016 Cisco and/or its affiliates. All rights reserved. This document is Cisco Public. Page 39 of 39
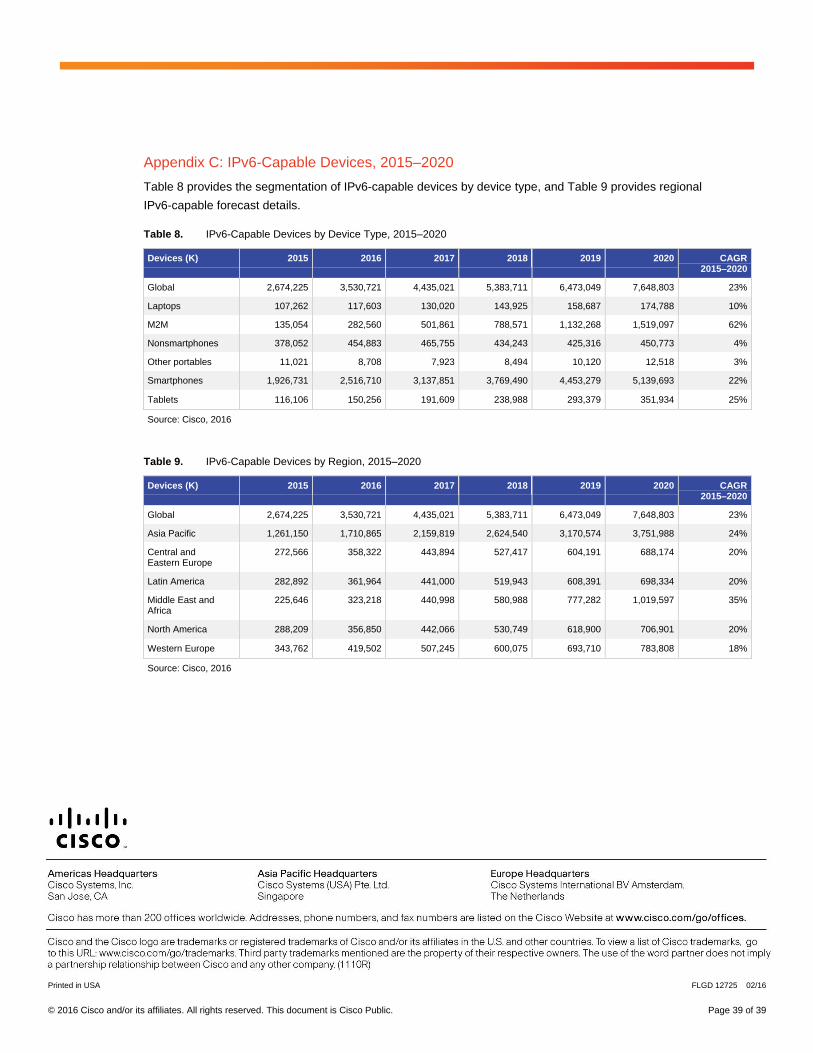
Appendix C: IPv6-Capable Devices, 2015–2020
Table 8 provides the segmentation of IPv6-capable devices by device type, and Table 9 provides regional
IPv6-capable forecast details.
Table 8. IPv6-Capable Devices by Device Type, 2015–2020
Devices (K) 2015 2016 2017 2018 2019 2020 CAGR 2015–2020
Global 2,674,225 3,530,721 4,435,021 5,383,711 6,473,049 7,648,803 23%
Laptops 107,262 117,603 130,020 143,925 158,687 174,788 10%
M2M 135,054 282,560 501,861 788,571 1,132,268 1,519,097 62%
Nonsmartphones 378,052 454,883 465,755 434,243 425,316 450,773 4%
Other portables 11,021 8,708 7,923 8,494 10,120 12,518 3%
Smartphones 1,926,731 2,516,710 3,137,851 3,769,490 4,453,279 5,139,693 22%
Tablets 116,106 150,256 191,609 238,988 293,379 351,934 25%
Source: Cisco, 2016
Table 9. IPv6-Capable Devices by Region, 2015–2020
Devices (K) 2015 2016 2017 2018 2019 2020 CAGR 2015–2020
Global 2,674,225 3,530,721 4,435,021 5,383,711 6,473,049 7,648,803 23%
Asia Pacific 1,261,150 1,710,865 2,159,819 2,624,540 3,170,574 3,751,988 24%
Central and Eastern Europe
272,566 358,322 443,894 527,417 604,191 688,174 20%
Latin America 282,892 361,964 441,000 519,943 608,391 698,334 20%
Middle East and Africa
225,646 323,218 440,998 580,988 777,282 1,019,597 35%
North America 288,209 356,850 442,066 530,749 618,900 706,901 20%
Western Europe 343,762 419,502 507,245 600,075 693,710 783,808 18%
Source: Cisco, 2016
Printed in USA FLGD 12725 02/16


![[Infographic] Cisco Visual Networking Index (VNI): Video: Mobile Traffic per End User Connection](https://img.pdfslide.us/doc/110x75/58854f4e1a28abb5368b7b51/infographic-cisco-visual-networking-index-vni-video-mobile-traffic-per.jpg)

![[Infographic] Cisco Visual Networking Index (VNI) Global Mobile Data Traffic Forecast, 2015 2020](https://img.pdfslide.us/doc/110x75/58e7ed881a28abbc0b8b5b8f/infographic-cisco-visual-networking-index-vni-global-mobile-data-traffic.jpg)


![[Infographic] Cisco Visual Networking Index (VNI): Mobile-Connected Devices per Capita](https://img.pdfslide.us/doc/110x75/5877391f1a28ab342e8b5317/infographic-cisco-visual-networking-index-vni-mobile-connected-devices-58bc16729caf4.jpg)
![[Infographic] Cisco Visual Networking Index (VNI): Mobile Users Growth](https://img.pdfslide.us/doc/110x75/58854f4e1a28abb5368b7b57/infographic-cisco-visual-networking-index-vni-mobile-users-growth-58b660760cdfd.jpg)


![[Infographic] Cisco Visual Networking Index (VNI) Forecast, 2015-2020](https://img.pdfslide.us/doc/110x75/58f049a31a28ab01228b465b/infographic-cisco-visual-networking-index-vni-forecast-2015-2020.jpg)