Embed Size (px)
Citation preview
© 2014 Cisco and/or its affiliates. All rights reserved. This document is Cisco Public. Page 1 of 40
White Paper
Cisco Visual Networking Index: Global Mobile Data Traffic Forecast Update, 2013–2018
February 5, 2014
The Cisco® Visual Networking Index (VNI) Global Mobile Data Traffic Forecast
Update is part of the comprehensive Cisco VNI Forecast, an ongoing initiative to
track and forecast the impact of visual networking applications on global networks.
This paper presents some of Cisco’s major global mobile data traffic projections
and growth trends.
Executive Summary
The Mobile Network in 2013
Global mobile data traffic grew 81 percent in 2013. Global mobile data traffic reached 1.5 exabytes per month
at the end of 2013, up from 820 petabytes per month at the end of 2012.
Last year’s mobile data traffic was nearly 18 times the size of the entire global Internet in 2000. One exabyte
of traffic traversed the global Internet in 2000, and in 2013 mobile networks carried nearly 18 exabytes of traffic.
Mobile video traffic exceeded 50 percent for the first time in 2012. Mobile video traffic was 53 percent of traffic
by the end of 2013.
Over half a billion (526 million) mobile devices and connections were added in 2013. Global mobile devices
and connections in 2013 grew to 7 billion, up from 6.5 billion in 2012. Smartphones accounted for 77 percent of
that growth, with 406 million net additions in 2013.
© 2014 Cisco and/or its affiliates. All rights reserved. This document is Cisco Public. Page 2 of 40
Globally, smart devices represented 21 percent of the total mobile devices and connections in 2013, they
accounted for 88 percent of the mobile data traffic. In 2013, on an average, a smart device generated 29 times
more traffic than a non-smart device.
Mobile network connection speeds more than doubled in 2013. Globally, the average mobile network
downstream speed in 2013 was 1,387 kilobits per second (Kbps), up from 526 Kbps in 2012.
In 2013, a fourth-generation (4G) connection generated 14.5 times more traffic on average than a
non-4G connection. Although 4G connections represent only 2.9 percent of mobile connections today, they
already account for 30 percent of mobile data traffic.
The top 1 percent of mobile data subscribers generated 10 percent of mobile data traffic, down from
52 percent at the beginning of 2010. According to a mobile data usage study conducted by Cisco, mobile data
traffic has evened out over the last year and is now lower than the 1:20 ratio that has been true of fixed networks
for several years.
Average smartphone usage grew 50 percent in 2013. The average amount of traffic per smartphone in 2013
was 529 MB per month, up from 353 MB per month in 2012.
Smartphones represented only 27 percent of total global handsets in use in 2013, but represented
95 percent of total global handset traffic. In 2013, the typical smartphone generated 48 times more mobile
data traffic (529 MB per month) than the typical basic-feature cell phone (which generated only 11 MB per month
of mobile data traffic).
Globally, there were nearly 22 million wearable devices (a sub-segment of M2M category) in 2013
generating 1.7 petabytes of monthly traffic.
Globally, 45 percent of total mobile data traffic was offloaded onto the fixed network through Wi-Fi or
femtocell in 2013. In 2013, 1.2 exabytes of mobile data traffic were offloaded onto the fixed network each month.
Without offload, mobile data traffic would have grown 98 percent rather than 81 percent in 2013.
Per-user iOS mobile devices (smartphones and tablets) data usage marginally surpassed that of Android
mobile devices data usage. By the end of 2013, average iOS consumption exceeded average Android
consumption in North America and Western Europe.
In 2013, 18 percent of mobile devices were potentially IPv6-capable. This estimate is based on network
connection speed and OS capability.
In 2013, the number of mobile-connected tablets increased 2.2-fold to 92 million, and each tablet generated
2.6 times more traffic than the average smartphone. In 2013, mobile data traffic per tablet was 1,374 MB per
month, compared to 529 MB per month per smartphone.
There were 149 million laptops on the mobile network in 2013, and each laptop generated 4.6 times
more traffic than the average smartphone. Mobile data traffic per laptop was 2.45 GB per month in 2013,
up 17 percent from 2.1 GB per month in 2012.
Average nonsmartphone usage increased 39 percent to 10.8 MB per month in 2013, compared to 7.8 MB
per month in 2012. Basic handsets still make up the vast majority of handsets on the network (73 percent).
© 2014 Cisco and/or its affiliates. All rights reserved. This document is Cisco Public. Page 3 of 40
The Mobile Network Through 2018
Mobile data traffic will reach the following milestones within the next five years.
● Monthly global mobile data traffic will surpass 15 exabytes by 2018.
● The number of mobile-connected devices will exceed the world’s population by 2014.
● The average mobile connection speed will surpass 2 Mbps by 2016.
● Due to increased usage on smartphones, smartphones will reach 66 percent of mobile data traffic by 2018.
● Monthly mobile tablet traffic will surpass 2.5 exabyte per month by 2018.
● Tablets will exceed 15 percent of global mobile data traffic by 2016.
● 4G traffic will be more than half of the total mobile traffic by 2018.
● There will be more traffic offloaded from cellular networks (on to Wi-Fi) than remain on cellular networks
by 2018.
Global mobile data traffic will increase nearly 11-fold between 2013 and 2018. Mobile data traffic will grow
at a compound annual growth rate (CAGR) of 61 percent from 2013 to 2018, reaching 15.9 exabytes per month
by 2018.
By the end of 2014, the number of mobile-connected devices will exceed the number of people on earth,
and by 2018 there will be nearly 1.4 mobile devices per capita. There will be over 10 billion mobile-connected
devices by 2018, including machine-to-machine (M2M) modules—exceeding the world’s population at that time
(7.6 billion).
Mobile network connection speeds will increase two-fold by 2018. The average mobile network connection
speed (1,387 Kbps in 2013) will exceed 2.5 megabits per second (Mbps) by 2018.
By 2018, 4G will be 15 percent of connections, but 51 percent of total traffic. By 2018, a 4G connection will
generate 6 times more traffic on average than a non-4G connection.
By 2018, over half of all devices connected to the mobile network will be “smart” devices. Globally,
54 percent of mobile devices will be smart devices by 2018, up from 21 percent in 2013. The vast majority of
mobile data traffic (96 percent) will originate from these smart devices by 2018, up from 88 percent in 2013.
By 2018, 48 percent of all global mobile devices could potentially be capable of connecting to an IPv6
mobile network. Over 4.9 billion devices will be IPv6-capable by 2018.
Over two-thirds of the world’s mobile data traffic will be video by 2018. Mobile video will increase 14-fold
between 2013 and 2018, accounting for 69 percent of total mobile data traffic by the end of the forecast period.
By 2018, mobile-connected tablets will generate nearly double the traffic generated by the entire global
mobile network in 2013. The amount of mobile data traffic generated by tablets by 2018 (2.9 exabytes per month)
will be 1.9 times higher than the total amount of global mobile data traffic in 2013 (1.5 exabytes per month).
© 2014 Cisco and/or its affiliates. All rights reserved. This document is Cisco Public. Page 4 of 40
The average smartphone will generate 2.7 GB of traffic per month by 2018, a 5-fold increase over the 2013
average of 529 MB per month. By 2018, aggregate smartphone traffic will be 11 times greater than it is today,
with a CAGR of 63 percent.
By 2018, more than half of all traffic from mobile-connected devices (almost 17 exabytes) will be offloaded
to the fixed network by means of Wi-Fi devices and femtocells each month. Without Wi-Fi and femtocell
offload, total mobile data traffic would grow at a CAGR of 65 percent between 2013 and 2018 (12-fold growth),
instead of the projected CAGR of 61 percent (11-fold growth).
The Middle East and Africa will have the strongest mobile data traffic growth of any region at 70 percent
CAGR. This region will be followed by Central & Eastern Europe at 68 percent and Asia Pacific at 67 percent.
Appendix A summarizes the details and methodology of the VNI forecast.
2013 Year in Review
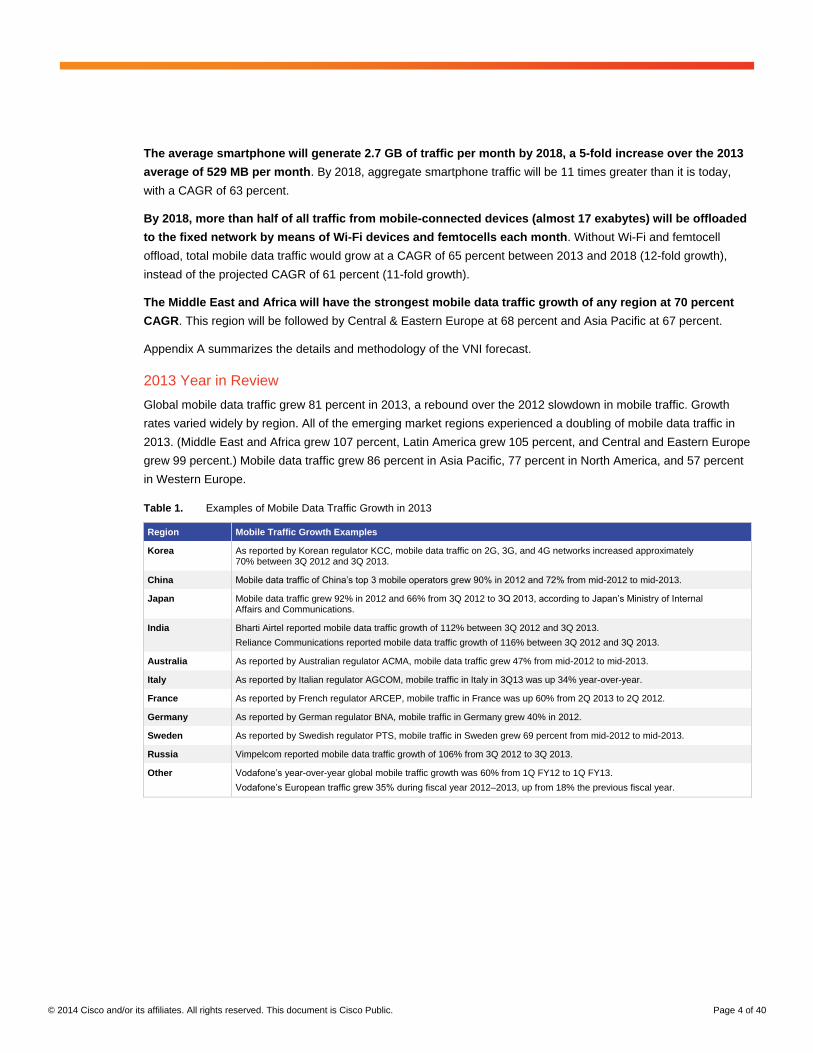
Global mobile data traffic grew 81 percent in 2013, a rebound over the 2012 slowdown in mobile traffic. Growth
rates varied widely by region. All of the emerging market regions experienced a doubling of mobile data traffic in
2013. (Middle East and Africa grew 107 percent, Latin America grew 105 percent, and Central and Eastern Europe
grew 99 percent.) Mobile data traffic grew 86 percent in Asia Pacific, 77 percent in North America, and 57 percent
in Western Europe.
Table 1. Examples of Mobile Data Traffic Growth in 2013
Region Mobile Traffic Growth Examples
Korea As reported by Korean regulator KCC, mobile data traffic on 2G, 3G, and 4G networks increased approximately 70% between 3Q 2012 and 3Q 2013.
China Mobile data traffic of China’s top 3 mobile operators grew 90% in 2012 and 72% from mid-2012 to mid-2013.
Japan Mobile data traffic grew 92% in 2012 and 66% from 3Q 2012 to 3Q 2013, according to Japan’s Ministry of Internal Affairs and Communications.
India Bharti Airtel reported mobile data traffic growth of 112% between 3Q 2012 and 3Q 2013.
Reliance Communications reported mobile data traffic growth of 116% between 3Q 2012 and 3Q 2013.
Australia As reported by Australian regulator ACMA, mobile data traffic grew 47% from mid-2012 to mid-2013.
Italy As reported by Italian regulator AGCOM, mobile traffic in Italy in 3Q13 was up 34% year-over-year.
France As reported by French regulator ARCEP, mobile traffic in France was up 60% from 2Q 2013 to 2Q 2012.
Germany As reported by German regulator BNA, mobile traffic in Germany grew 40% in 2012.
Sweden As reported by Swedish regulator PTS, mobile traffic in Sweden grew 69 percent from mid-2012 to mid-2013.
Russia Vimpelcom reported mobile data traffic growth of 106% from 3Q 2012 to 3Q 2013.
Other Vodafone’s year-over-year global mobile traffic growth was 60% from 1Q FY12 to 1Q FY13.
Vodafone’s European traffic grew 35% during fiscal year 2012–2013, up from 18% the previous fiscal year.
© 2014 Cisco and/or its affiliates. All rights reserved. This document is Cisco Public. Page 5 of 40
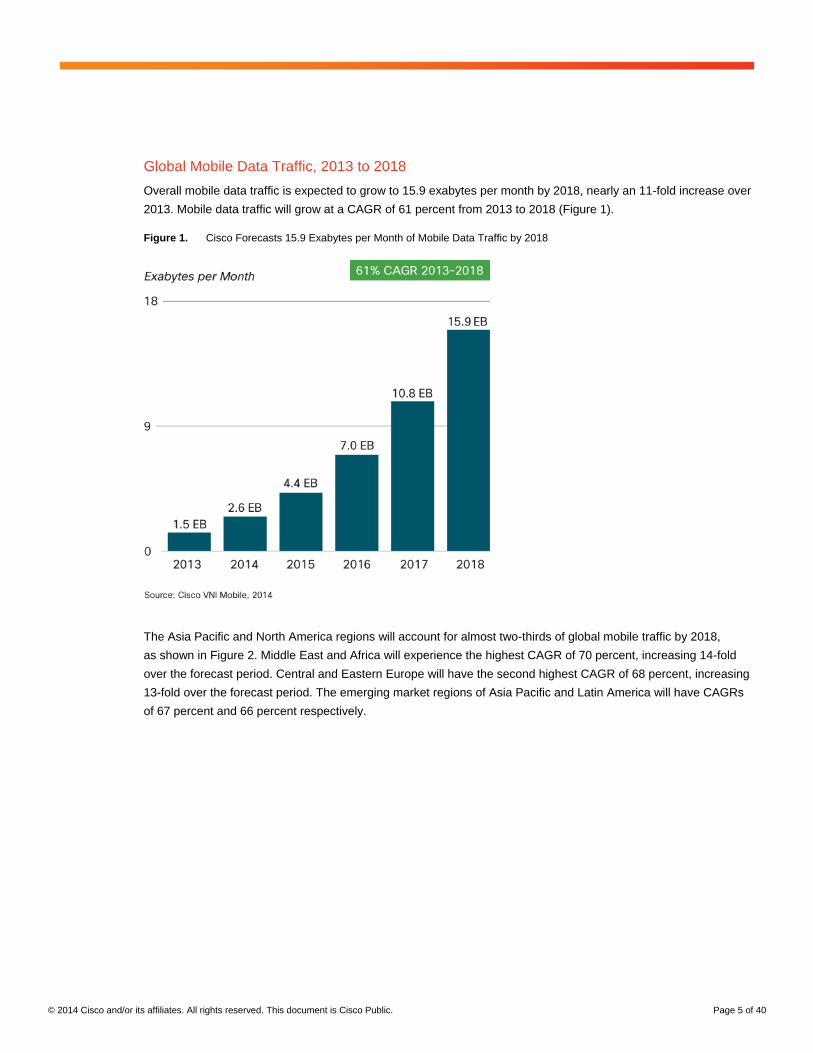
Global Mobile Data Traffic, 2013 to 2018
Overall mobile data traffic is expected to grow to 15.9 exabytes per month by 2018, nearly an 11-fold increase over
2013. Mobile data traffic will grow at a CAGR of 61 percent from 2013 to 2018 (Figure 1).
Figure 1. Cisco Forecasts 15.9 Exabytes per Month of Mobile Data Traffic by 2018
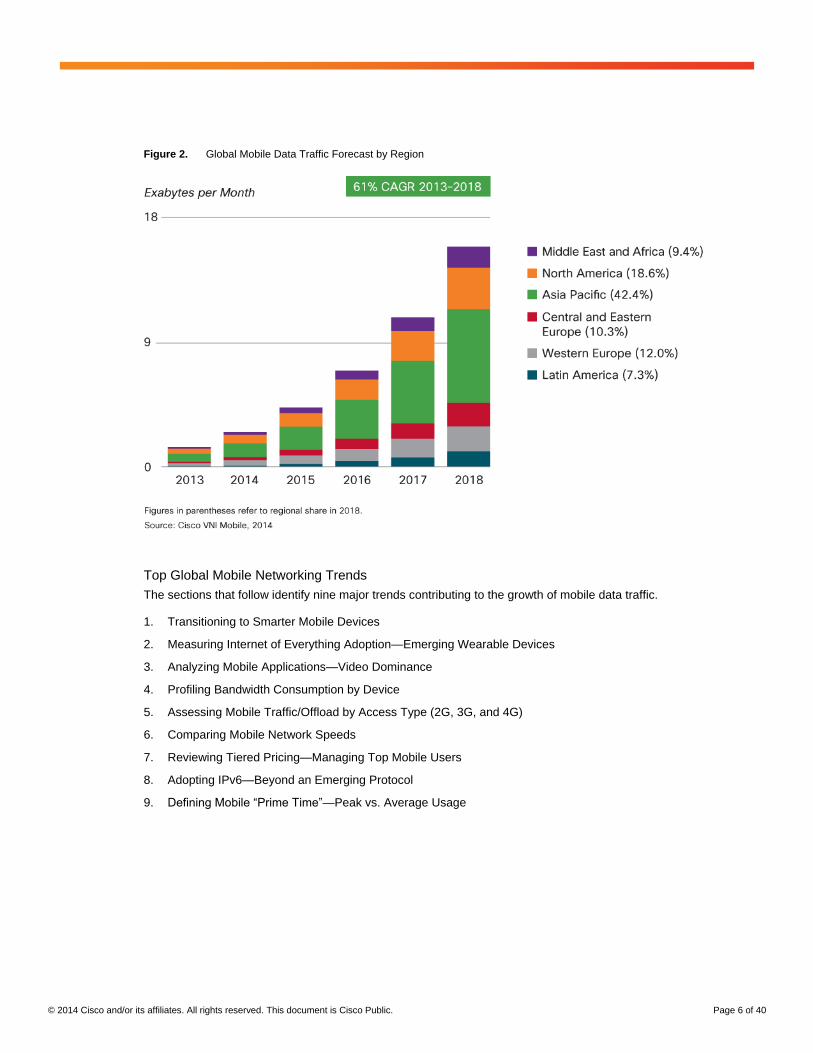
The Asia Pacific and North America regions will account for almost two-thirds of global mobile traffic by 2018,
as shown in Figure 2. Middle East and Africa will experience the highest CAGR of 70 percent, increasing 14-fold
over the forecast period. Central and Eastern Europe will have the second highest CAGR of 68 percent, increasing
13-fold over the forecast period. The emerging market regions of Asia Pacific and Latin America will have CAGRs
of 67 percent and 66 percent respectively.
© 2014 Cisco and/or its affiliates. All rights reserved. This document is Cisco Public. Page 6 of 40
Figure 2. Global Mobile Data Traffic Forecast by Region
Top Global Mobile Networking Trends
The sections that follow identify nine major trends contributing to the growth of mobile data traffic.
1. Transitioning to Smarter Mobile Devices
2. Measuring Internet of Everything Adoption—Emerging Wearable Devices
3. Analyzing Mobile Applications—Video Dominance
4. Profiling Bandwidth Consumption by Device
5. Assessing Mobile Traffic/Offload by Access Type (2G, 3G, and 4G)
6. Comparing Mobile Network Speeds
7. Reviewing Tiered Pricing—Managing Top Mobile Users
8. Adopting IPv6—Beyond an Emerging Protocol
9. Defining Mobile “Prime Time”—Peak vs. Average Usage
© 2014 Cisco and/or its affiliates. All rights reserved. This document is Cisco Public. Page 7 of 40
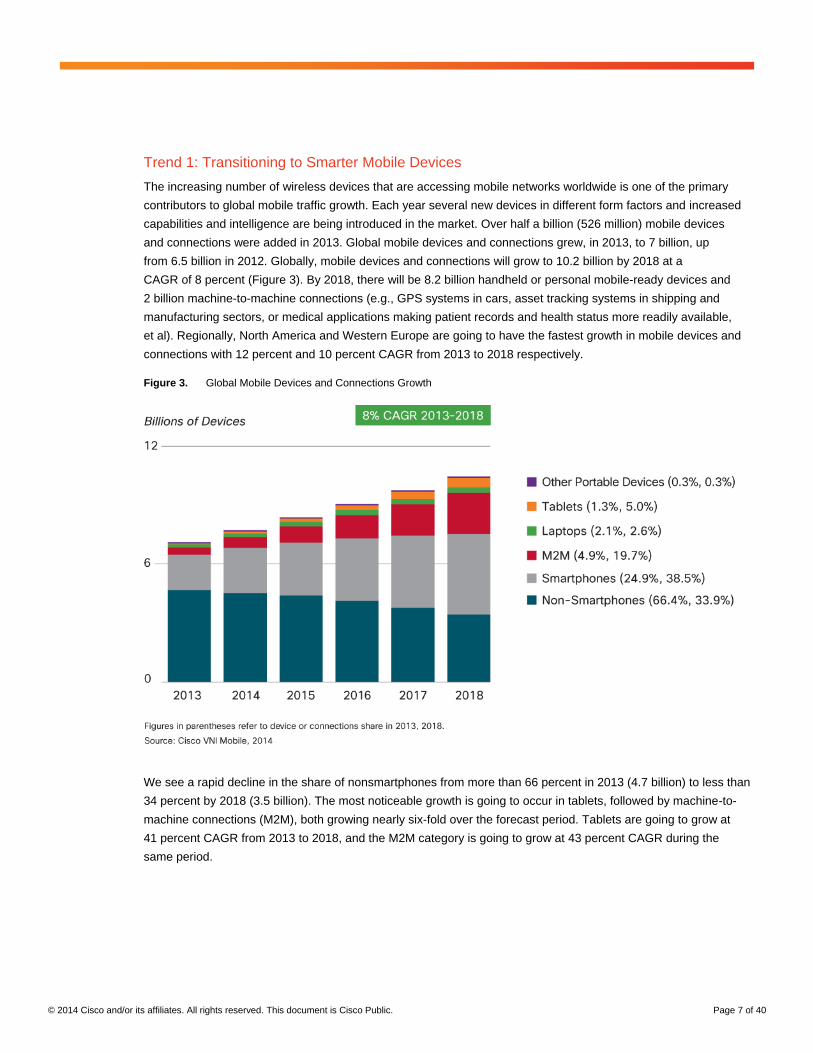
Trend 1: Transitioning to Smarter Mobile Devices
The increasing number of wireless devices that are accessing mobile networks worldwide is one of the primary
contributors to global mobile traffic growth. Each year several new devices in different form factors and increased
capabilities and intelligence are being introduced in the market. Over half a billion (526 million) mobile devices
and connections were added in 2013. Global mobile devices and connections grew, in 2013, to 7 billion, up
from 6.5 billion in 2012. Globally, mobile devices and connections will grow to 10.2 billion by 2018 at a
CAGR of 8 percent (Figure 3). By 2018, there will be 8.2 billion handheld or personal mobile-ready devices and
2 billion machine-to-machine connections (e.g., GPS systems in cars, asset tracking systems in shipping and
manufacturing sectors, or medical applications making patient records and health status more readily available,
et al). Regionally, North America and Western Europe are going to have the fastest growth in mobile devices and
connections with 12 percent and 10 percent CAGR from 2013 to 2018 respectively.
Figure 3. Global Mobile Devices and Connections Growth
We see a rapid decline in the share of nonsmartphones from more than 66 percent in 2013 (4.7 billion) to less than
34 percent by 2018 (3.5 billion). The most noticeable growth is going to occur in tablets, followed by machine-to-
machine connections (M2M), both growing nearly six-fold over the forecast period. Tablets are going to grow at
41 percent CAGR from 2013 to 2018, and the M2M category is going to grow at 43 percent CAGR during the
same period.
© 2014 Cisco and/or its affiliates. All rights reserved. This document is Cisco Public. Page 8 of 40
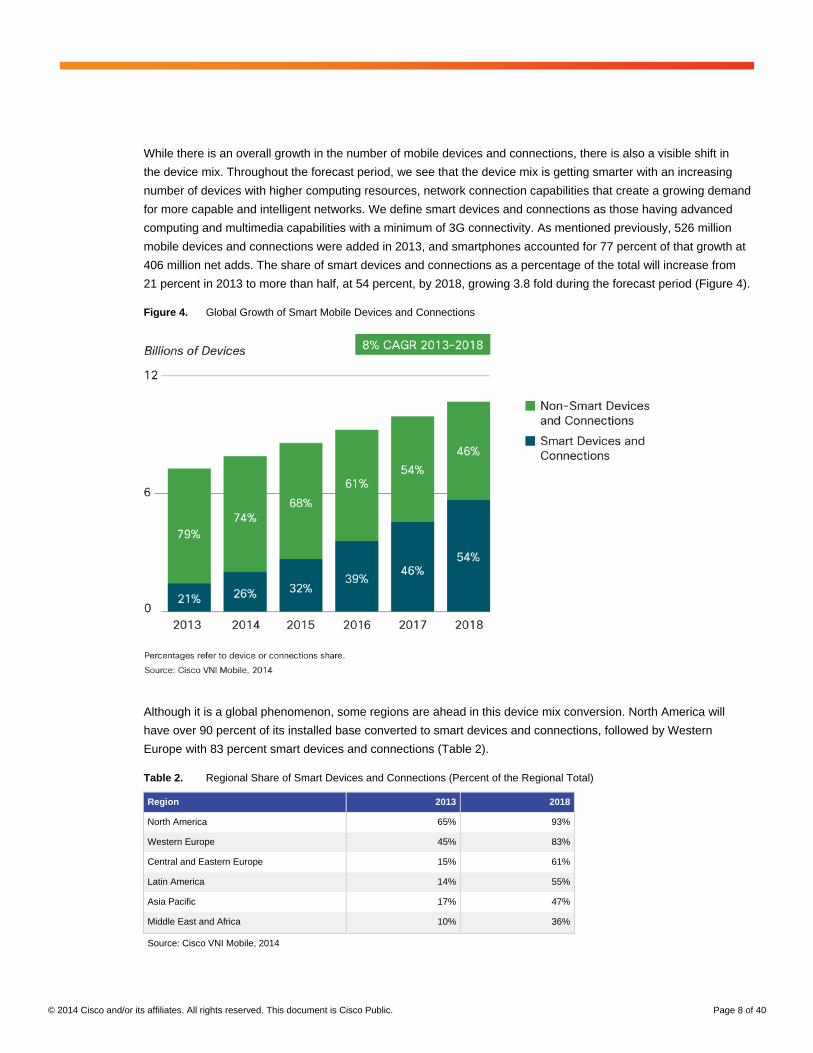
While there is an overall growth in the number of mobile devices and connections, there is also a visible shift in
the device mix. Throughout the forecast period, we see that the device mix is getting smarter with an increasing
number of devices with higher computing resources, network connection capabilities that create a growing demand
for more capable and intelligent networks. We define smart devices and connections as those having advanced
computing and multimedia capabilities with a minimum of 3G connectivity. As mentioned previously, 526 million
mobile devices and connections were added in 2013, and smartphones accounted for 77 percent of that growth at
406 million net adds. The share of smart devices and connections as a percentage of the total will increase from
21 percent in 2013 to more than half, at 54 percent, by 2018, growing 3.8 fold during the forecast period (Figure 4).
Figure 4. Global Growth of Smart Mobile Devices and Connections
Although it is a global phenomenon, some regions are ahead in this device mix conversion. North America will
have over 90 percent of its installed base converted to smart devices and connections, followed by Western
Europe with 83 percent smart devices and connections (Table 2).
Table 2. Regional Share of Smart Devices and Connections (Percent of the Regional Total)
Region 2013 2018
North America 65% 93%
Western Europe 45% 83%
Central and Eastern Europe 15% 61%
Latin America 14% 55%
Asia Pacific 17% 47%
Middle East and Africa 10% 36%
Source: Cisco VNI Mobile, 2014
© 2014 Cisco and/or its affiliates. All rights reserved. This document is Cisco Public. Page 9 of 40
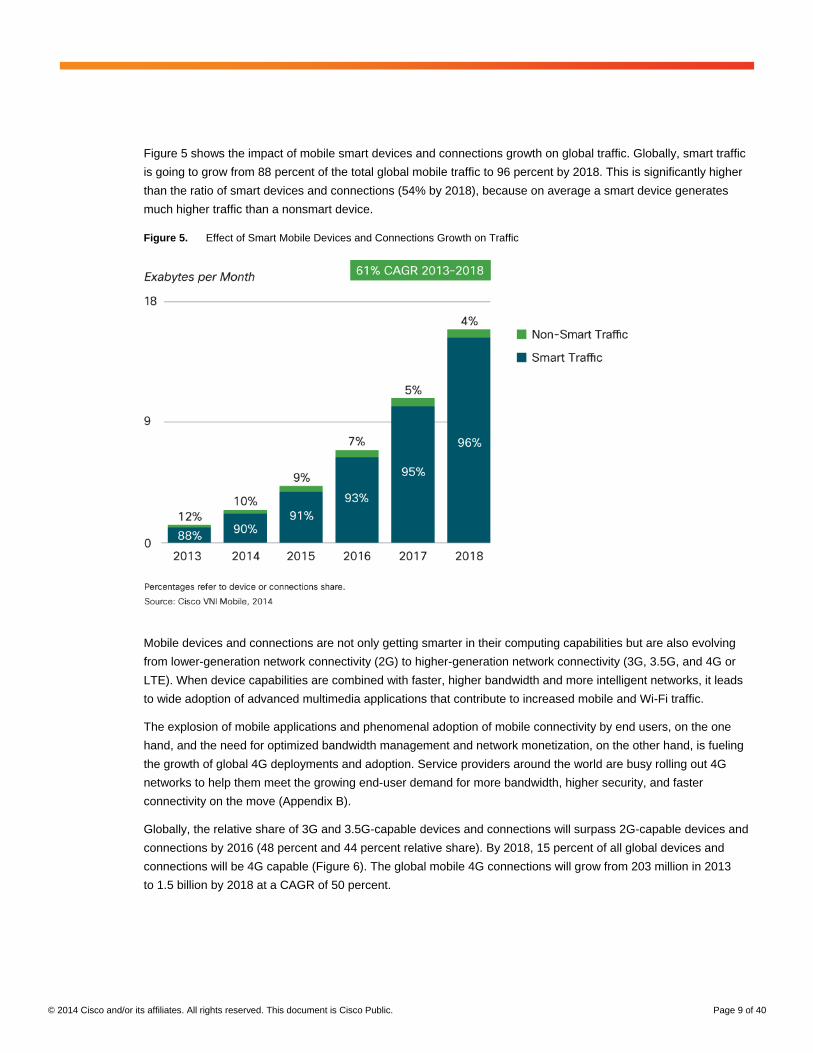
Figure 5 shows the impact of mobile smart devices and connections growth on global traffic. Globally, smart traffic
is going to grow from 88 percent of the total global mobile traffic to 96 percent by 2018. This is significantly higher
than the ratio of smart devices and connections (54% by 2018), because on average a smart device generates
much higher traffic than a nonsmart device.
Figure 5. Effect of Smart Mobile Devices and Connections Growth on Traffic
Mobile devices and connections are not only getting smarter in their computing capabilities but are also evolving
from lower-generation network connectivity (2G) to higher-generation network connectivity (3G, 3.5G, and 4G or
LTE). When device capabilities are combined with faster, higher bandwidth and more intelligent networks, it leads
to wide adoption of advanced multimedia applications that contribute to increased mobile and Wi-Fi traffic.
The explosion of mobile applications and phenomenal adoption of mobile connectivity by end users, on the one
hand, and the need for optimized bandwidth management and network monetization, on the other hand, is fueling
the growth of global 4G deployments and adoption. Service providers around the world are busy rolling out 4G
networks to help them meet the growing end-user demand for more bandwidth, higher security, and faster
connectivity on the move (Appendix B).
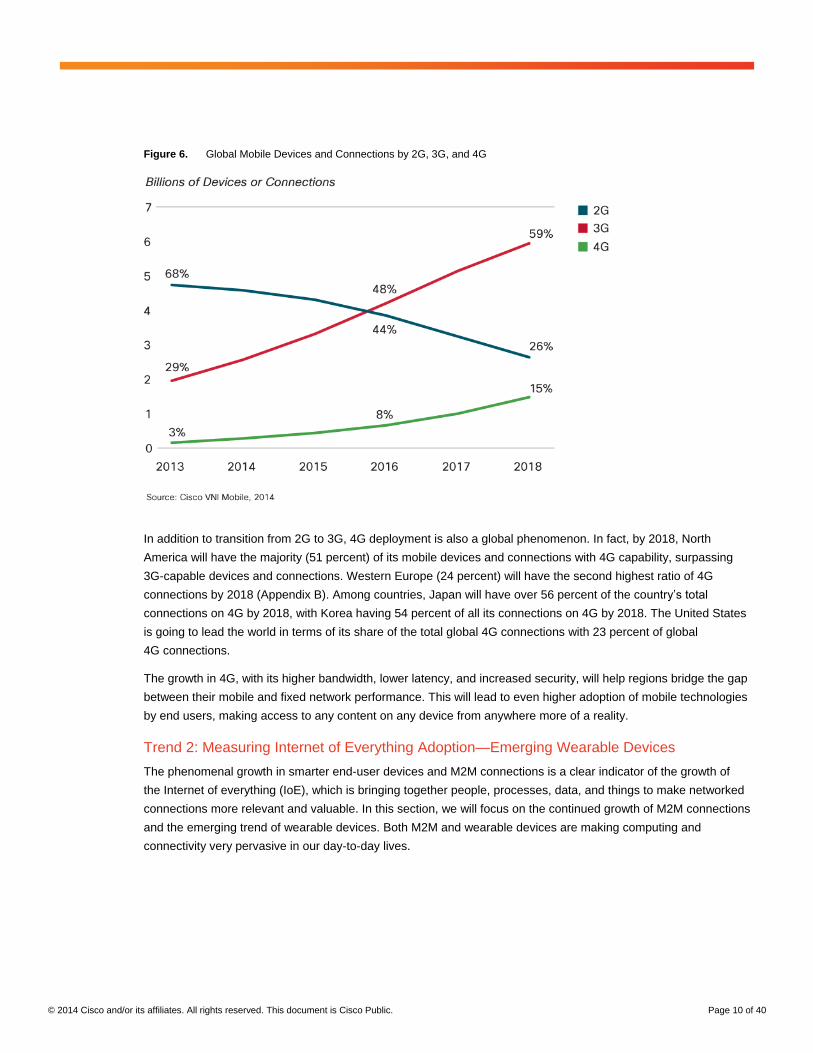
Globally, the relative share of 3G and 3.5G-capable devices and connections will surpass 2G-capable devices and
connections by 2016 (48 percent and 44 percent relative share). By 2018, 15 percent of all global devices and
connections will be 4G capable (Figure 6). The global mobile 4G connections will grow from 203 million in 2013
to 1.5 billion by 2018 at a CAGR of 50 percent.
© 2014 Cisco and/or its affiliates. All rights reserved. This document is Cisco Public. Page 10 of 40
Figure 6. Global Mobile Devices and Connections by 2G, 3G, and 4G
In addition to transition from 2G to 3G, 4G deployment is also a global phenomenon. In fact, by 2018, North
America will have the majority (51 percent) of its mobile devices and connections with 4G capability, surpassing
3G-capable devices and connections. Western Europe (24 percent) will have the second highest ratio of 4G
connections by 2018 (Appendix B). Among countries, Japan will have over 56 percent of the country’s total
connections on 4G by 2018, with Korea having 54 percent of all its connections on 4G by 2018. The United States
is going to lead the world in terms of its share of the total global 4G connections with 23 percent of global
4G connections.
The growth in 4G, with its higher bandwidth, lower latency, and increased security, will help regions bridge the gap
between their mobile and fixed network performance. This will lead to even higher adoption of mobile technologies
by end users, making access to any content on any device from anywhere more of a reality.
Trend 2: Measuring Internet of Everything Adoption—Emerging Wearable Devices
The phenomenal growth in smarter end-user devices and M2M connections is a clear indicator of the growth of
the Internet of everything (IoE), which is bringing together people, processes, data, and things to make networked
connections more relevant and valuable. In this section, we will focus on the continued growth of M2M connections
and the emerging trend of wearable devices. Both M2M and wearable devices are making computing and
connectivity very pervasive in our day-to-day lives.
© 2014 Cisco and/or its affiliates. All rights reserved. This document is Cisco Public. Page 11 of 40
M2M connections—such as home and office security and automation, smart metering and utilities, maintenance,
building automation, automotive, healthcare and consumer electronics, and more—are being used across a broad
spectrum of industries, as well as in the consumer segment. As real-time information monitoring helps companies
deploy new video-based security systems, while also helping hospitals and healthcare professionals remotely
monitor the progress of their patients, bandwidth-intensive M2M connections are becoming more prevalent.
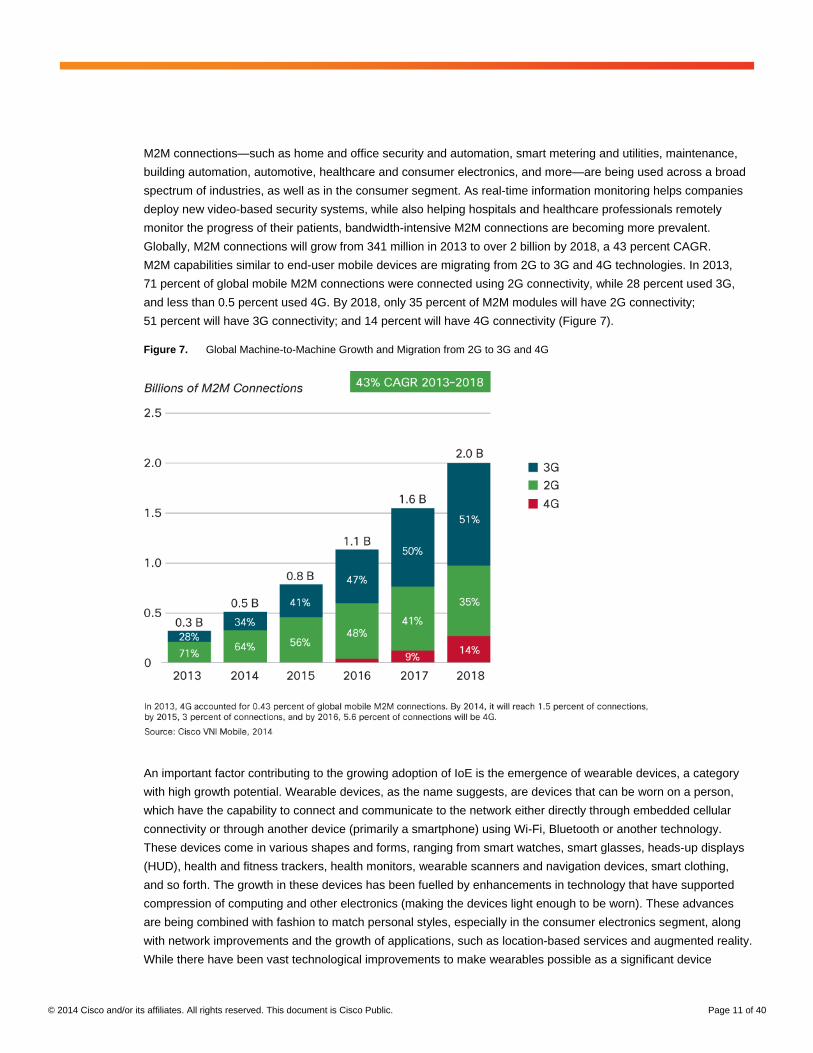
Globally, M2M connections will grow from 341 million in 2013 to over 2 billion by 2018, a 43 percent CAGR.
M2M capabilities similar to end-user mobile devices are migrating from 2G to 3G and 4G technologies. In 2013,
71 percent of global mobile M2M connections were connected using 2G connectivity, while 28 percent used 3G,
and less than 0.5 percent used 4G. By 2018, only 35 percent of M2M modules will have 2G connectivity;
51 percent will have 3G connectivity; and 14 percent will have 4G connectivity (Figure 7).
Figure 7. Global Machine-to-Machine Growth and Migration from 2G to 3G and 4G
An important factor contributing to the growing adoption of IoE is the emergence of wearable devices, a category
with high growth potential. Wearable devices, as the name suggests, are devices that can be worn on a person,
which have the capability to connect and communicate to the network either directly through embedded cellular
connectivity or through another device (primarily a smartphone) using Wi-Fi, Bluetooth or another technology.
These devices come in various shapes and forms, ranging from smart watches, smart glasses, heads-up displays
(HUD), health and fitness trackers, health monitors, wearable scanners and navigation devices, smart clothing,
and so forth. The growth in these devices has been fuelled by enhancements in technology that have supported
compression of computing and other electronics (making the devices light enough to be worn). These advances
are being combined with fashion to match personal styles, especially in the consumer electronics segment, along
with network improvements and the growth of applications, such as location-based services and augmented reality.
While there have been vast technological improvements to make wearables possible as a significant device
© 2014 Cisco and/or its affiliates. All rights reserved. This document is Cisco Public. Page 12 of 40
category, the embedded cellular connectivity still has some barriers, such as technology, regulatory, and health
concerns, to overcome before it becomes widely available and adopted.
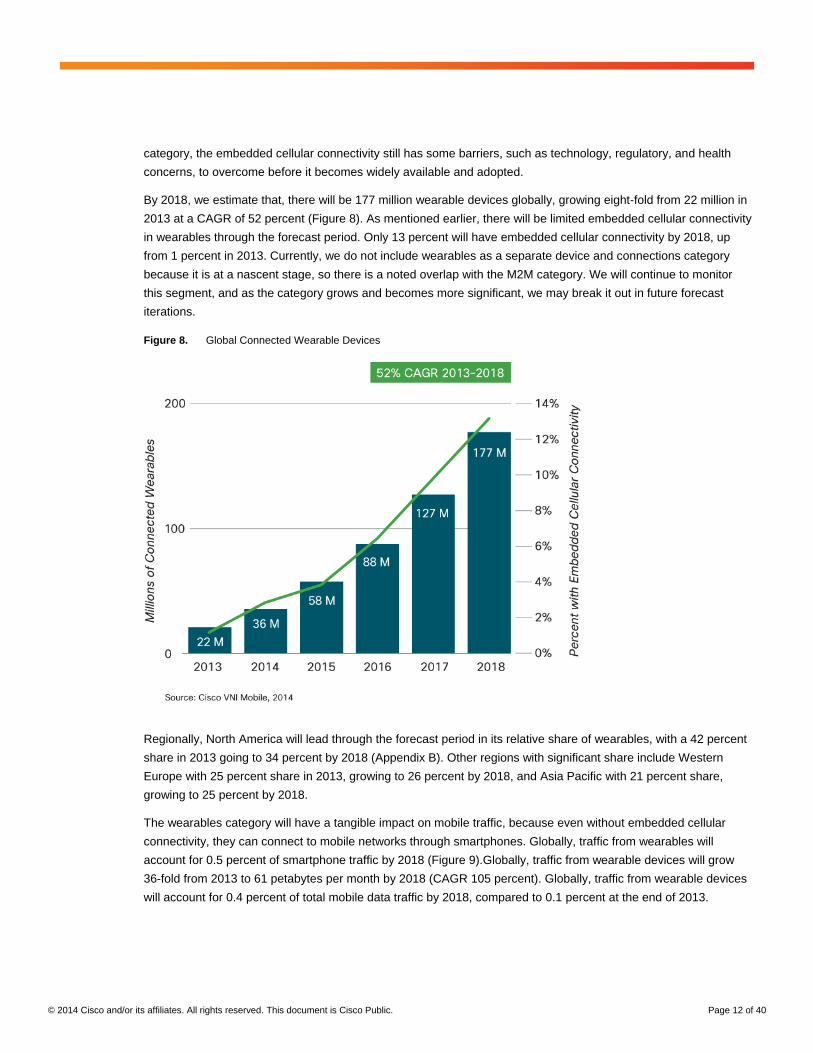
By 2018, we estimate that, there will be 177 million wearable devices globally, growing eight-fold from 22 million in
2013 at a CAGR of 52 percent (Figure 8). As mentioned earlier, there will be limited embedded cellular connectivity
in wearables through the forecast period. Only 13 percent will have embedded cellular connectivity by 2018, up
from 1 percent in 2013. Currently, we do not include wearables as a separate device and connections category
because it is at a nascent stage, so there is a noted overlap with the M2M category. We will continue to monitor
this segment, and as the category grows and becomes more significant, we may break it out in future forecast
iterations.
Figure 8. Global Connected Wearable Devices
Regionally, North America will lead through the forecast period in its relative share of wearables, with a 42 percent
share in 2013 going to 34 percent by 2018 (Appendix B). Other regions with significant share include Western
Europe with 25 percent share in 2013, growing to 26 percent by 2018, and Asia Pacific with 21 percent share,
growing to 25 percent by 2018.
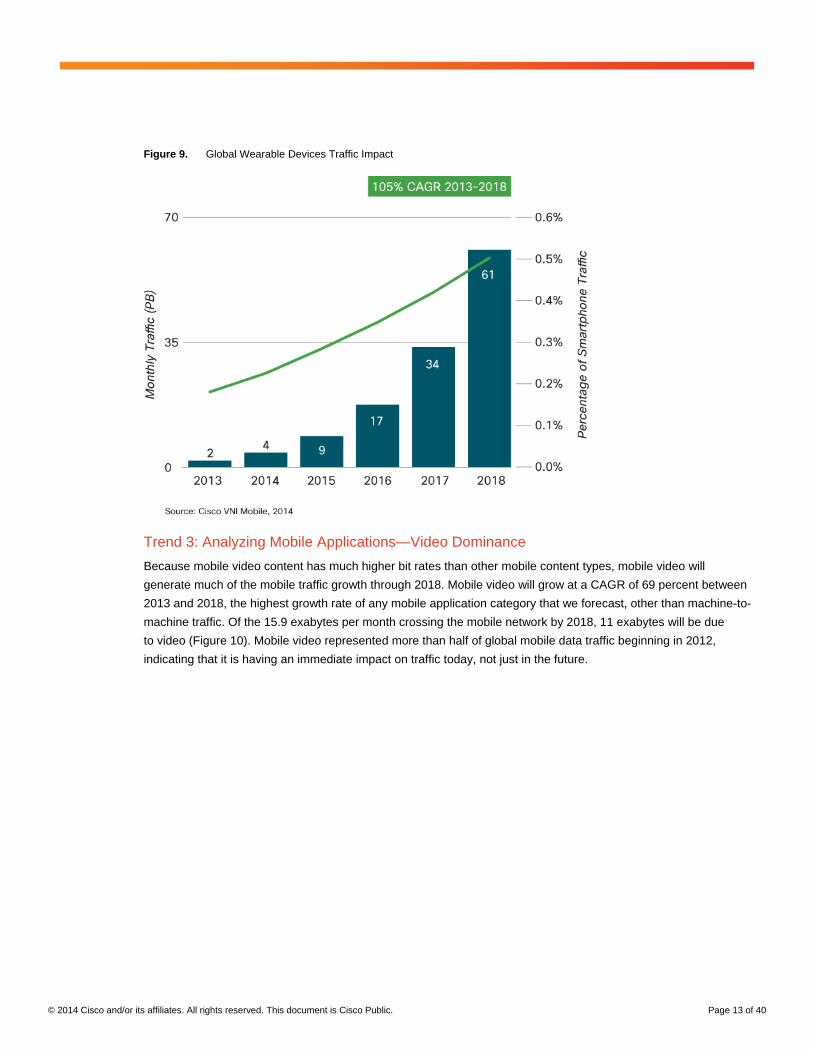
The wearables category will have a tangible impact on mobile traffic, because even without embedded cellular
connectivity, they can connect to mobile networks through smartphones. Globally, traffic from wearables will
account for 0.5 percent of smartphone traffic by 2018 (Figure 9).Globally, traffic from wearable devices will grow
36-fold from 2013 to 61 petabytes per month by 2018 (CAGR 105 percent). Globally, traffic from wearable devices
will account for 0.4 percent of total mobile data traffic by 2018, compared to 0.1 percent at the end of 2013.
© 2014 Cisco and/or its affiliates. All rights reserved. This document is Cisco Public. Page 13 of 40
Figure 9. Global Wearable Devices Traffic Impact
Trend 3: Analyzing Mobile Applications—Video Dominance
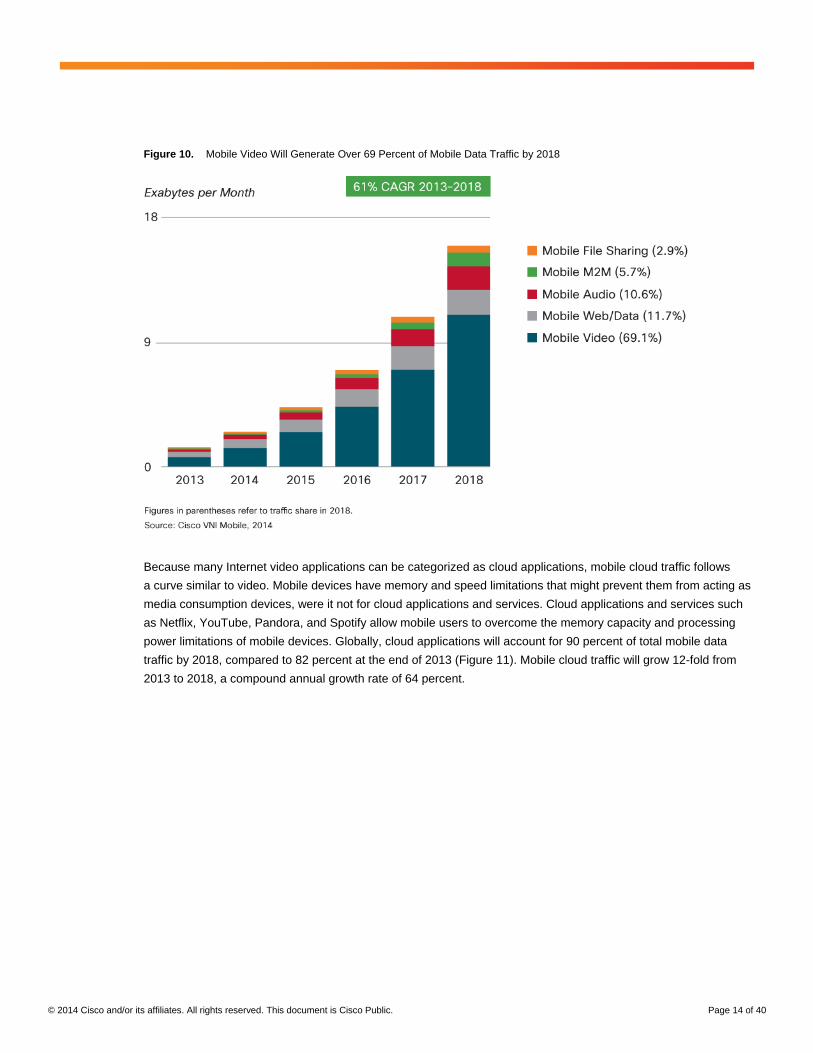
Because mobile video content has much higher bit rates than other mobile content types, mobile video will
generate much of the mobile traffic growth through 2018. Mobile video will grow at a CAGR of 69 percent between
2013 and 2018, the highest growth rate of any mobile application category that we forecast, other than machine-to-
machine traffic. Of the 15.9 exabytes per month crossing the mobile network by 2018, 11 exabytes will be due
to video (Figure 10). Mobile video represented more than half of global mobile data traffic beginning in 2012,
indicating that it is having an immediate impact on traffic today, not just in the future.
© 2014 Cisco and/or its affiliates. All rights reserved. This document is Cisco Public. Page 14 of 40
Figure 10. Mobile Video Will Generate Over 69 Percent of Mobile Data Traffic by 2018
Because many Internet video applications can be categorized as cloud applications, mobile cloud traffic follows
a curve similar to video. Mobile devices have memory and speed limitations that might prevent them from acting as
media consumption devices, were it not for cloud applications and services. Cloud applications and services such
as Netflix, YouTube, Pandora, and Spotify allow mobile users to overcome the memory capacity and processing
power limitations of mobile devices. Globally, cloud applications will account for 90 percent of total mobile data
traffic by 2018, compared to 82 percent at the end of 2013 (Figure 11). Mobile cloud traffic will grow 12-fold from
2013 to 2018, a compound annual growth rate of 64 percent.
© 2014 Cisco and/or its affiliates. All rights reserved. This document is Cisco Public. Page 15 of 40
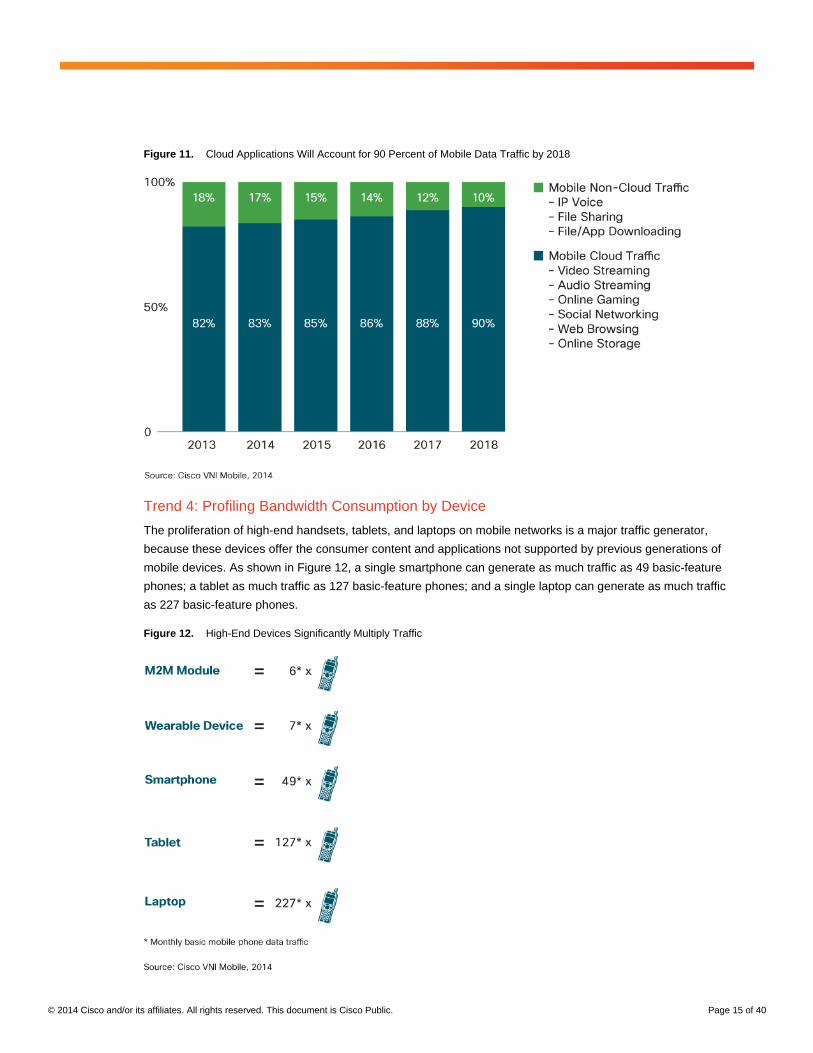
Figure 11. Cloud Applications Will Account for 90 Percent of Mobile Data Traffic by 2018
Trend 4: Profiling Bandwidth Consumption by Device
The proliferation of high-end handsets, tablets, and laptops on mobile networks is a major traffic generator,
because these devices offer the consumer content and applications not supported by previous generations of
mobile devices. As shown in Figure 12, a single smartphone can generate as much traffic as 49 basic-feature
phones; a tablet as much traffic as 127 basic-feature phones; and a single laptop can generate as much traffic
as 227 basic-feature phones.
Figure 12. High-End Devices Significantly Multiply Traffic
© 2014 Cisco and/or its affiliates. All rights reserved. This document is Cisco Public. Page 16 of 40
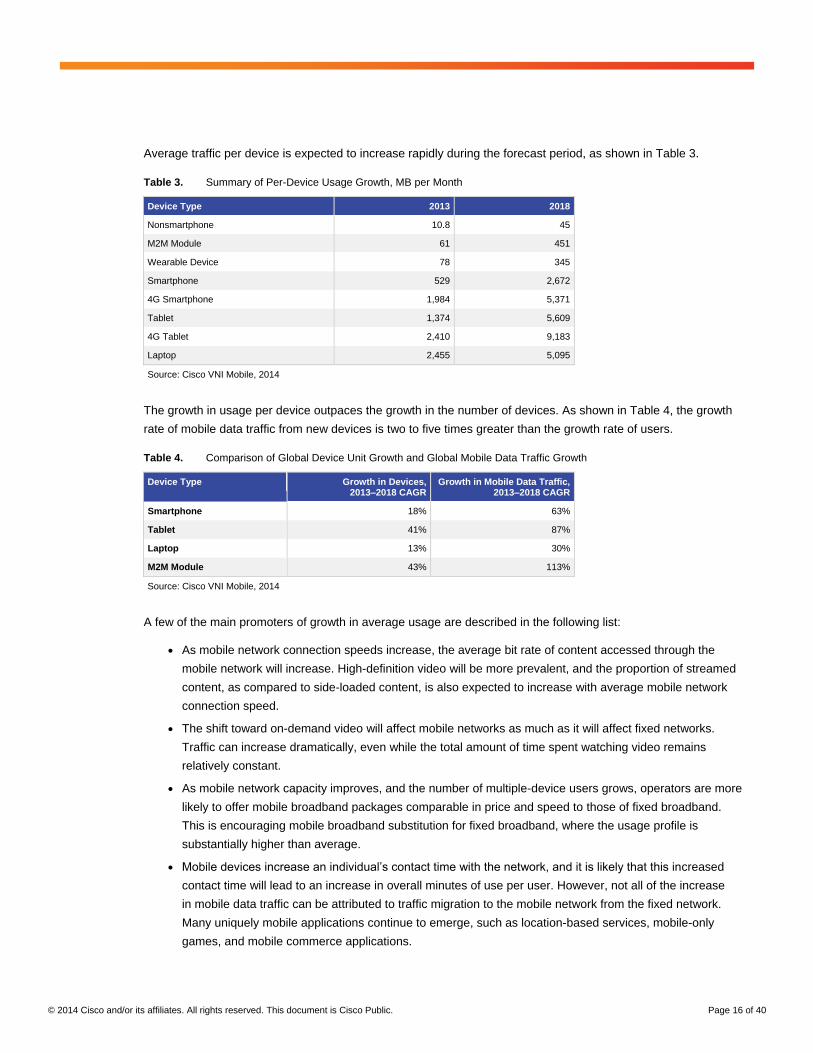
Average traffic per device is expected to increase rapidly during the forecast period, as shown in Table 3.
Table 3. Summary of Per-Device Usage Growth, MB per Month
Device Type 2013 2018
Nonsmartphone 10.8 45
M2M Module 61 451
Wearable Device 78 345
Smartphone 529 2,672
4G Smartphone 1,984 5,371
Tablet 1,374 5,609
4G Tablet 2,410 9,183
Laptop 2,455 5,095
Source: Cisco VNI Mobile, 2014
The growth in usage per device outpaces the growth in the number of devices. As shown in Table 4, the growth
rate of mobile data traffic from new devices is two to five times greater than the growth rate of users.
Table 4. Comparison of Global Device Unit Growth and Global Mobile Data Traffic Growth
Device Type Growth in Devices, 2013–2018 CAGR
Growth in Mobile Data Traffic, 2013–2018 CAGR
Smartphone 18% 63%
Tablet 41% 87%
Laptop 13% 30%
M2M Module 43% 113%
Source: Cisco VNI Mobile, 2014
A few of the main promoters of growth in average usage are described in the following list:
● As mobile network connection speeds increase, the average bit rate of content accessed through the
mobile network will increase. High-definition video will be more prevalent, and the proportion of streamed
content, as compared to side-loaded content, is also expected to increase with average mobile network
connection speed.
● The shift toward on-demand video will affect mobile networks as much as it will affect fixed networks.
Traffic can increase dramatically, even while the total amount of time spent watching video remains
relatively constant.
● As mobile network capacity improves, and the number of multiple-device users grows, operators are more
likely to offer mobile broadband packages comparable in price and speed to those of fixed broadband.
This is encouraging mobile broadband substitution for fixed broadband, where the usage profile is
substantially higher than average.
● Mobile devices increase an individual’s contact time with the network, and it is likely that this increased
contact time will lead to an increase in overall minutes of use per user. However, not all of the increase
in mobile data traffic can be attributed to traffic migration to the mobile network from the fixed network.
Many uniquely mobile applications continue to emerge, such as location-based services, mobile-only
games, and mobile commerce applications.
© 2014 Cisco and/or its affiliates. All rights reserved. This document is Cisco Public. Page 17 of 40
Trend 5: Assessing Mobile Traffic/Offload by Access Type (2G, 3G, and 4G)
Impact of 4G
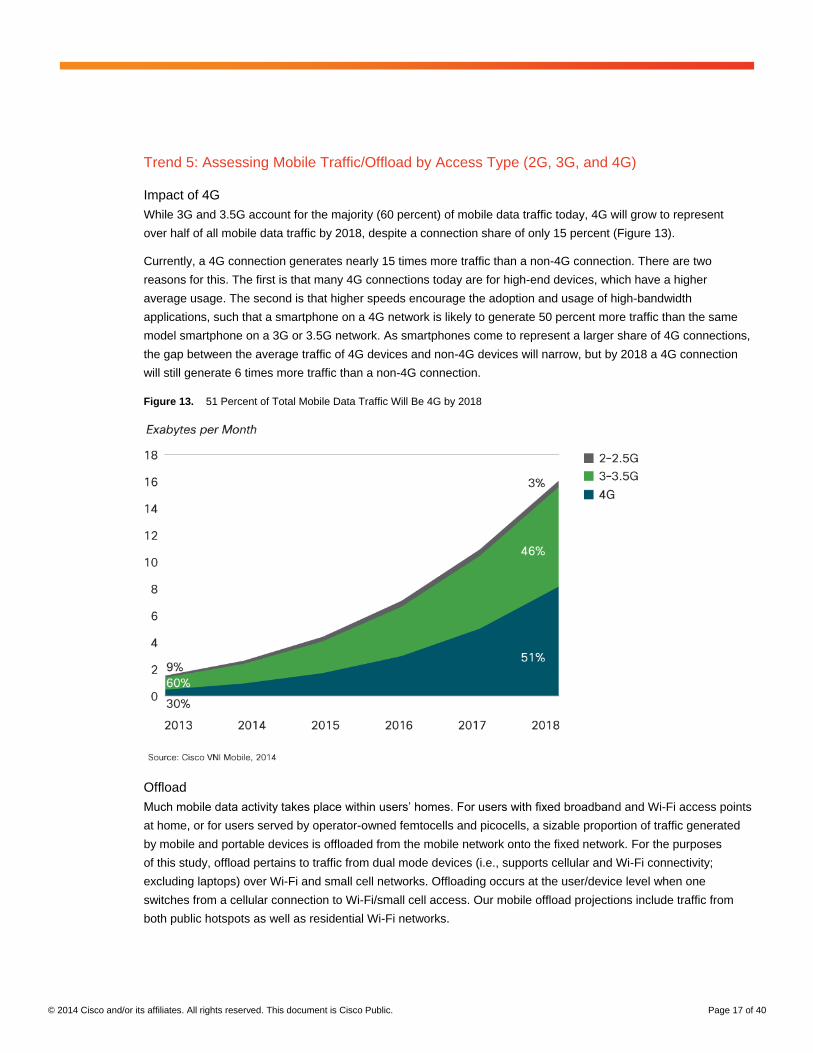
While 3G and 3.5G account for the majority (60 percent) of mobile data traffic today, 4G will grow to represent
over half of all mobile data traffic by 2018, despite a connection share of only 15 percent (Figure 13).
Currently, a 4G connection generates nearly 15 times more traffic than a non-4G connection. There are two
reasons for this. The first is that many 4G connections today are for high-end devices, which have a higher
average usage. The second is that higher speeds encourage the adoption and usage of high-bandwidth
applications, such that a smartphone on a 4G network is likely to generate 50 percent more traffic than the same
model smartphone on a 3G or 3.5G network. As smartphones come to represent a larger share of 4G connections,
the gap between the average traffic of 4G devices and non-4G devices will narrow, but by 2018 a 4G connection
will still generate 6 times more traffic than a non-4G connection.
Figure 13. 51 Percent of Total Mobile Data Traffic Will Be 4G by 2018
Offload
Much mobile data activity takes place within users’ homes. For users with fixed broadband and Wi-Fi access points
at home, or for users served by operator-owned femtocells and picocells, a sizable proportion of traffic generated
by mobile and portable devices is offloaded from the mobile network onto the fixed network. For the purposes
of this study, offload pertains to traffic from dual mode devices (i.e., supports cellular and Wi-Fi connectivity;
excluding laptops) over Wi-Fi and small cell networks. Offloading occurs at the user/device level when one
switches from a cellular connection to Wi-Fi/small cell access. Our mobile offload projections include traffic from
both public hotspots as well as residential Wi-Fi networks.
© 2014 Cisco and/or its affiliates. All rights reserved. This document is Cisco Public. Page 18 of 40
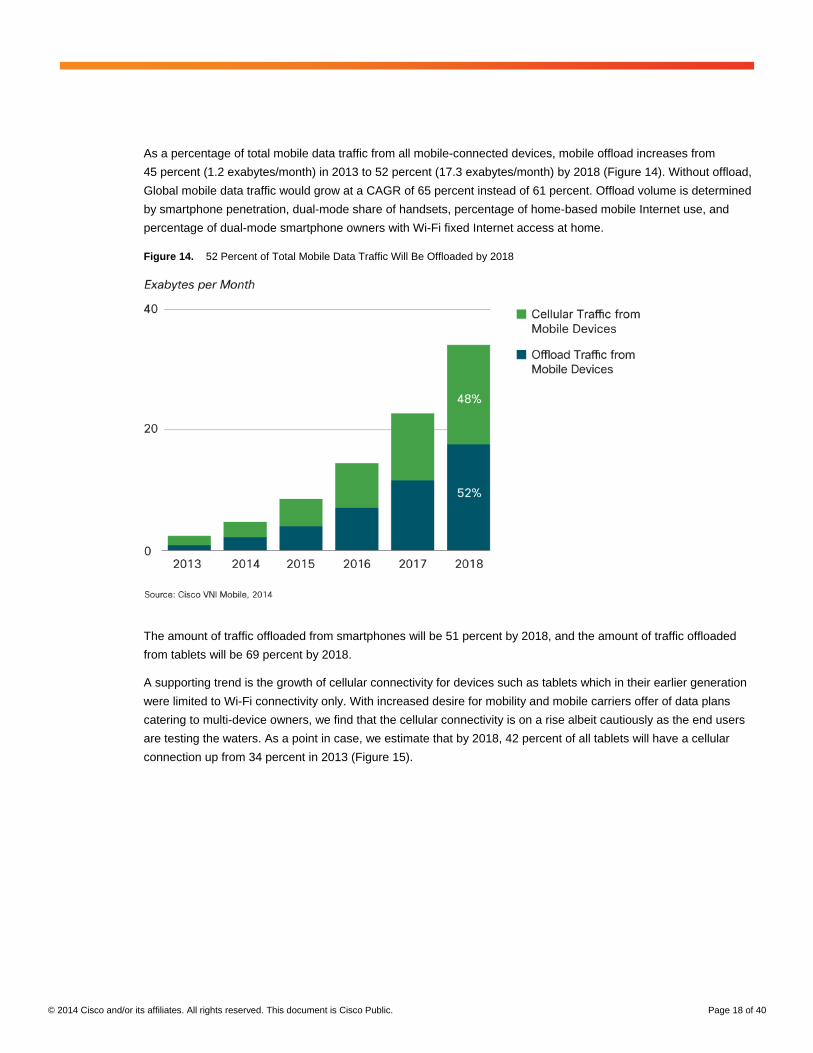
As a percentage of total mobile data traffic from all mobile-connected devices, mobile offload increases from
45 percent (1.2 exabytes/month) in 2013 to 52 percent (17.3 exabytes/month) by 2018 (Figure 14). Without offload,
Global mobile data traffic would grow at a CAGR of 65 percent instead of 61 percent. Offload volume is determined
by smartphone penetration, dual-mode share of handsets, percentage of home-based mobile Internet use, and
percentage of dual-mode smartphone owners with Wi-Fi fixed Internet access at home.
Figure 14. 52 Percent of Total Mobile Data Traffic Will Be Offloaded by 2018
The amount of traffic offloaded from smartphones will be 51 percent by 2018, and the amount of traffic offloaded
from tablets will be 69 percent by 2018.
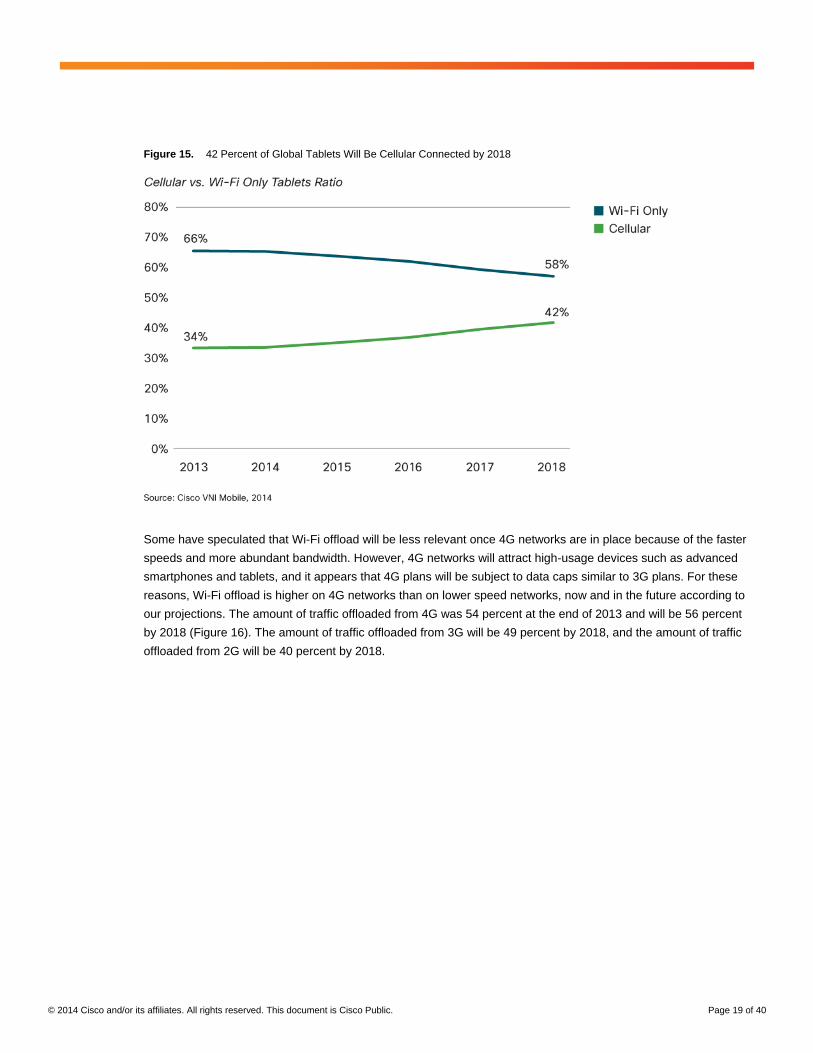
A supporting trend is the growth of cellular connectivity for devices such as tablets which in their earlier generation
were limited to Wi-Fi connectivity only. With increased desire for mobility and mobile carriers offer of data plans
catering to multi-device owners, we find that the cellular connectivity is on a rise albeit cautiously as the end users
are testing the waters. As a point in case, we estimate that by 2018, 42 percent of all tablets will have a cellular
connection up from 34 percent in 2013 (Figure 15).
© 2014 Cisco and/or its affiliates. All rights reserved. This document is Cisco Public. Page 19 of 40
Figure 15. 42 Percent of Global Tablets Will Be Cellular Connected by 2018
Some have speculated that Wi-Fi offload will be less relevant once 4G networks are in place because of the faster
speeds and more abundant bandwidth. However, 4G networks will attract high-usage devices such as advanced
smartphones and tablets, and it appears that 4G plans will be subject to data caps similar to 3G plans. For these
reasons, Wi-Fi offload is higher on 4G networks than on lower speed networks, now and in the future according to
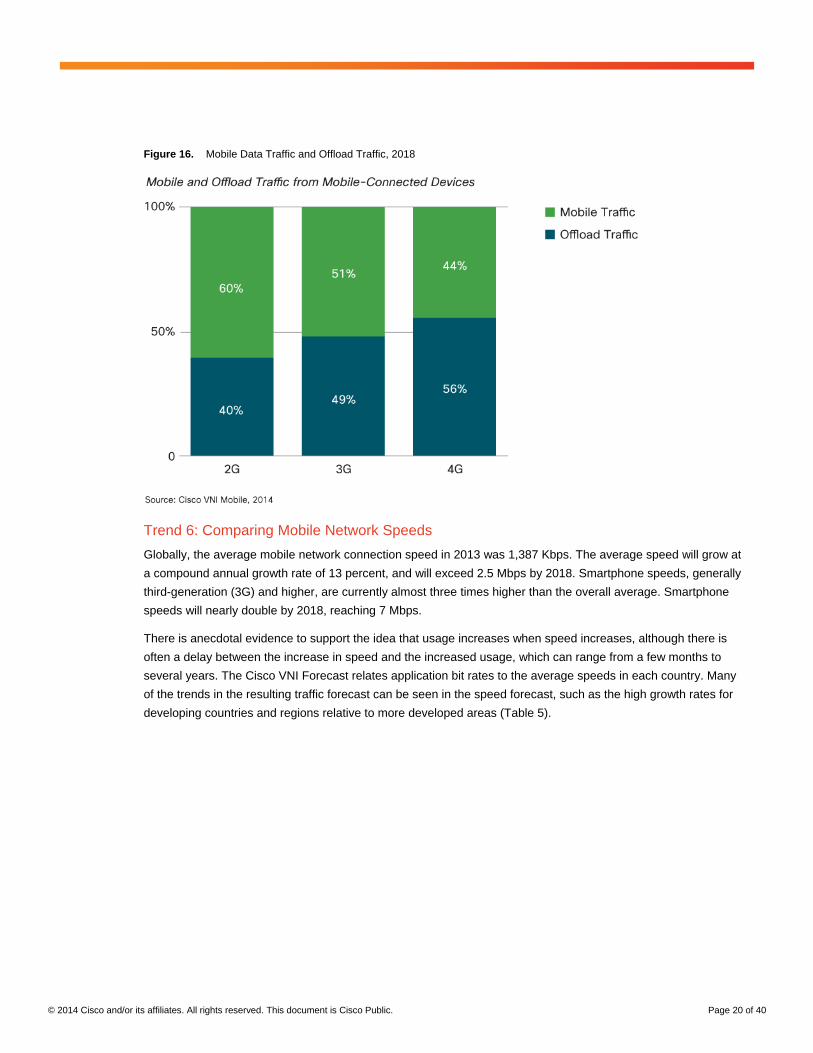
our projections. The amount of traffic offloaded from 4G was 54 percent at the end of 2013 and will be 56 percent
by 2018 (Figure 16). The amount of traffic offloaded from 3G will be 49 percent by 2018, and the amount of traffic
offloaded from 2G will be 40 percent by 2018.
© 2014 Cisco and/or its affiliates. All rights reserved. This document is Cisco Public. Page 20 of 40
Figure 16. Mobile Data Traffic and Offload Traffic, 2018
Trend 6: Comparing Mobile Network Speeds
Globally, the average mobile network connection speed in 2013 was 1,387 Kbps. The average speed will grow at
a compound annual growth rate of 13 percent, and will exceed 2.5 Mbps by 2018. Smartphone speeds, generally
third-generation (3G) and higher, are currently almost three times higher than the overall average. Smartphone
speeds will nearly double by 2018, reaching 7 Mbps.
There is anecdotal evidence to support the idea that usage increases when speed increases, although there is
often a delay between the increase in speed and the increased usage, which can range from a few months to
several years. The Cisco VNI Forecast relates application bit rates to the average speeds in each country. Many
of the trends in the resulting traffic forecast can be seen in the speed forecast, such as the high growth rates for
developing countries and regions relative to more developed areas (Table 5).
© 2014 Cisco and/or its affiliates. All rights reserved. This document is Cisco Public. Page 21 of 40
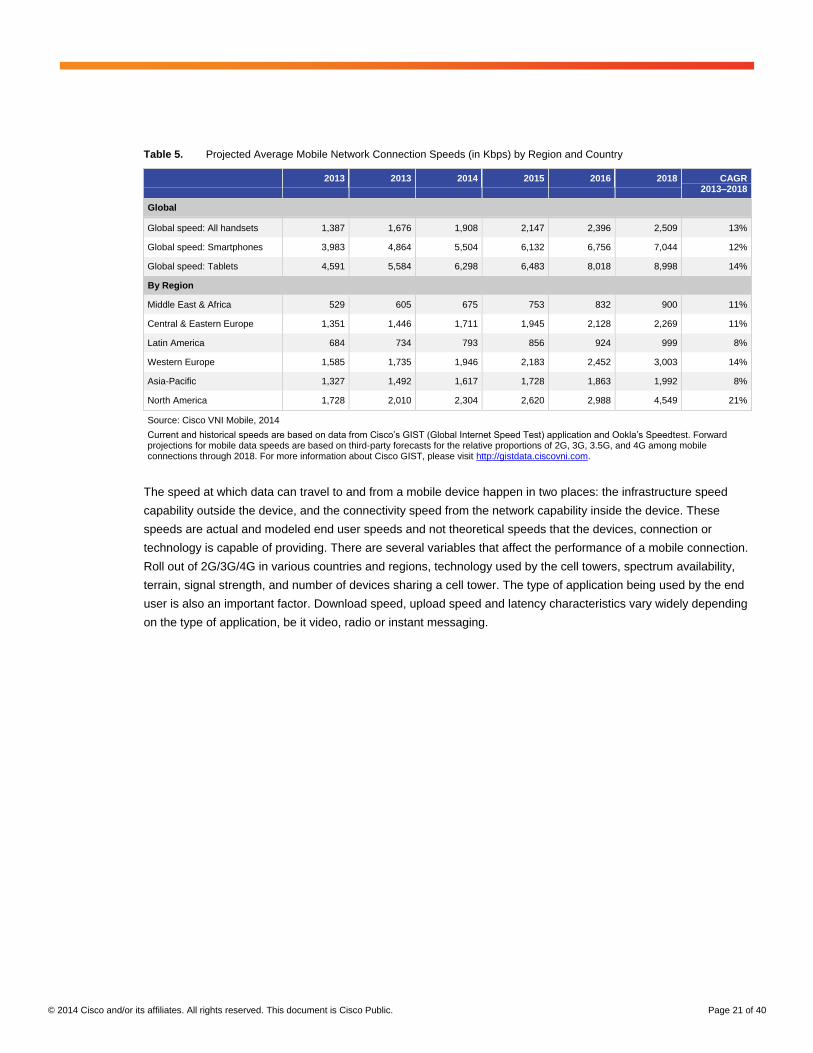
Table 5. Projected Average Mobile Network Connection Speeds (in Kbps) by Region and Country
2013 2013 2014 2015 2016 2018 CAGR 2013–2018
Global
Global speed: All handsets 1,387 1,676 1,908 2,147 2,396 2,509 13%
Global speed: Smartphones 3,983 4,864 5,504 6,132 6,756 7,044 12%
Global speed: Tablets 4,591 5,584 6,298 6,483 8,018 8,998 14%
By Region
Middle East & Africa 529 605 675 753 832 900 11%
Central & Eastern Europe 1,351 1,446 1,711 1,945 2,128 2,269 11%
Latin America 684 734 793 856 924 999 8%
Western Europe 1,585 1,735 1,946 2,183 2,452 3,003 14%
Asia-Pacific 1,327 1,492 1,617 1,728 1,863 1,992 8%
North America 1,728 2,010 2,304 2,620 2,988 4,549 21%
Source: Cisco VNI Mobile, 2014
Current and historical speeds are based on data from Cisco’s GIST (Global Internet Speed Test) application and Ookla’s Speedtest. Forward projections for mobile data speeds are based on third-party forecasts for the relative proportions of 2G, 3G, 3.5G, and 4G among mobile connections through 2018. For more information about Cisco GIST, please visit http://gistdata.ciscovni.com.
The speed at which data can travel to and from a mobile device happen in two places: the infrastructure speed
capability outside the device, and the connectivity speed from the network capability inside the device. These
speeds are actual and modeled end user speeds and not theoretical speeds that the devices, connection or
technology is capable of providing. There are several variables that affect the performance of a mobile connection.
Roll out of 2G/3G/4G in various countries and regions, technology used by the cell towers, spectrum availability,
terrain, signal strength, and number of devices sharing a cell tower. The type of application being used by the end
user is also an important factor. Download speed, upload speed and latency characteristics vary widely depending
on the type of application, be it video, radio or instant messaging.
© 2014 Cisco and/or its affiliates. All rights reserved. This document is Cisco Public. Page 22 of 40
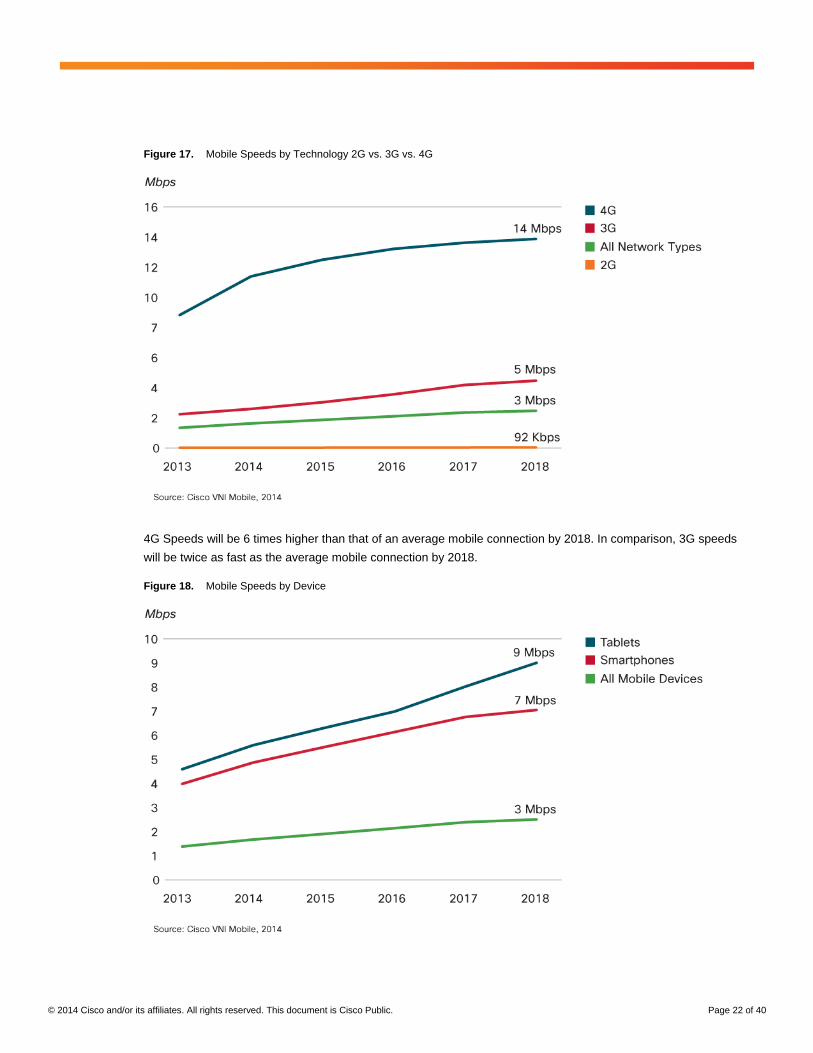
Figure 17. Mobile Speeds by Technology 2G vs. 3G vs. 4G
4G Speeds will be 6 times higher than that of an average mobile connection by 2018. In comparison, 3G speeds
will be twice as fast as the average mobile connection by 2018.
Figure 18. Mobile Speeds by Device
© 2014 Cisco and/or its affiliates. All rights reserved. This document is Cisco Public. Page 23 of 40
Trend 7: Reviewing Tiered Pricing—Managing Top Mobile Users
An increasing number of service providers worldwide are moving from unlimited data plans to tiered mobile data
packages. To make an initial estimate of the impact of tiered pricing on traffic growth, we repeated a case study
based on the data of two Tier 1 global service providers from mature mobile markets. The study tracks data usage
from the timeframe of the introduction of tiered pricing three years ago. The findings in this study are based on
Cisco’s analysis of data provided by a third-party data analysis firm. This firm maintains a panel of volunteer
participants who have given the company access to their mobile service bills, including KB of data usage. The data
in this study reflects usage associated with over 38,889 devices and spans 12 months (October 2012 through
September 2013) and also refers to the study from the previous update for longer term trends. The overall study
spans three years. Cisco’s analysis of the data consists of categorizing the pricing plans, operating systems,
devices, and users; incorporating additional third-party information on device characteristics; and performing
exploratory and statistical data analysis. While the results of the study represent actual data from Tier 1 mobile
data operators, global forecasts that include emerging markets, and Tier 2 providers may lead to lower estimates.
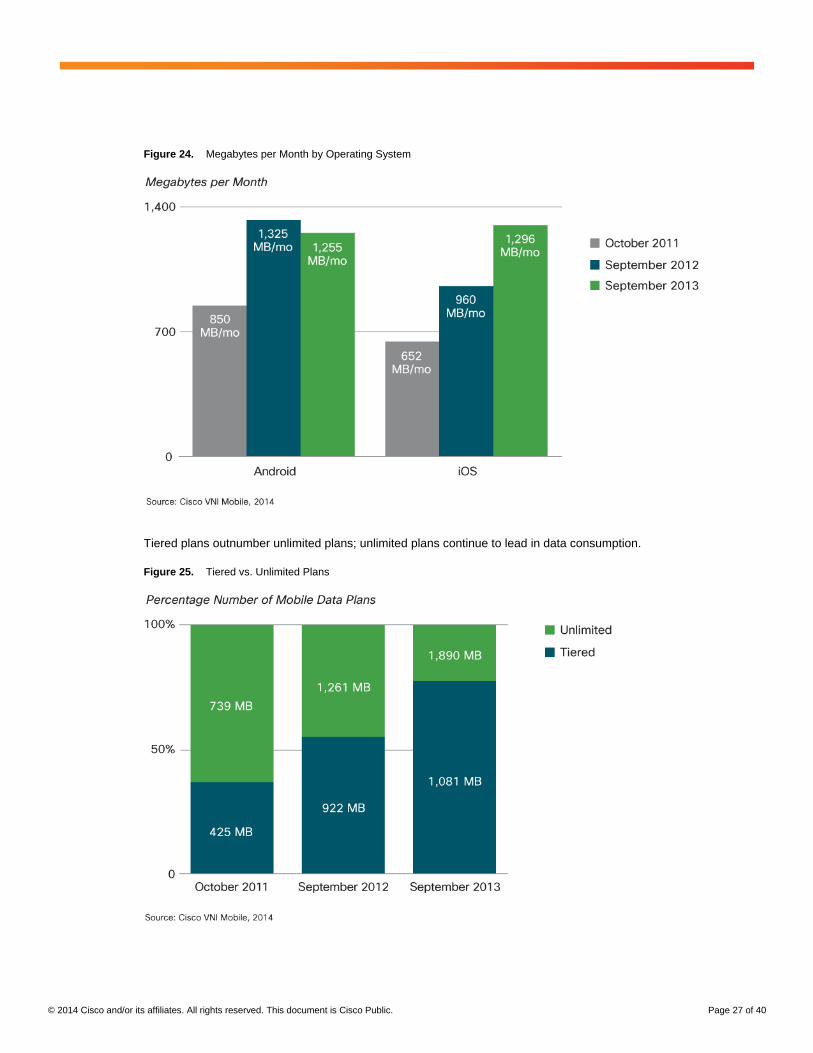
Over the period of the nearly 3-year study, the percentage of tiered plans compared to all data plans increased
from 4 percent to 55 percent, while unlimited plans dropped from 81 percent to 45 percent. This has not, however,
constrained usage patterns. From 2012 to 2013, average usage per device on a tiered plan grew from 922 MB per
month to 1,081 MB per month, while usage per device of unlimited plans grew at from a higher base of 1,261 MB
per month to 1,890 MB per month.
However, tiered plans are effective. There is a narrowing of the bandwidth consumption gap between tiered and
unlimited data plan connections, showing the general increase in consumption of mobile data traffic due to the
increased consumption of services such as Pandora, YouTube, Facebook, and Netflix. Unlimited plans have
promoted the adoption of mobile applications and increased web usage through mobile broadband.
Tiered pricing plans are often designed to constrain the heaviest mobile data users, especially the top 1 percent of
mobile data consumers. An examination of heavy mobile data users reveals that the top 1 percent of mobile users
is actually the top 3.5 percent, because the top 1 percent of users varies each month. For example, for a mobile
data subscriber base of 1000 users; the top 1 percent is 10 users. However, the same set of 10 users does not
appear in the top 1 percent category in each month; rather, a larger set of 35 subscribers rotates though the top
1 percent. This top 3.5 percent are the users who have the potential of being in the top 1 percent bracket in any
given month and substitute for each other in subsequent months. The trend is due to the nature of consumption
of mobile data applications.
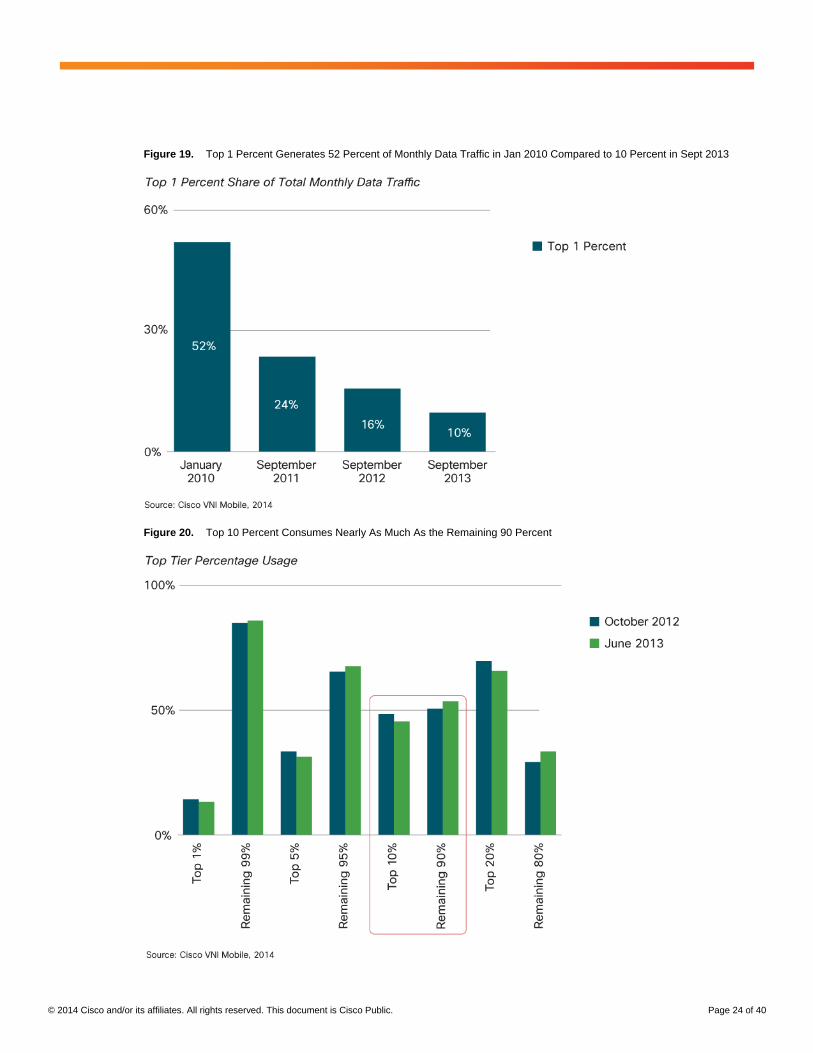
The usage per month of the average top 1 percent of mobile data users has been steadily decreasing compared
to overall usage. At the beginning of the 3-year study, 52 percent of the traffic was generated by the top 1 percent.
At the end of the three year time frame, the top 1 percent generated 10 percent of the overall traffic per month
compared to 16 percent in September 2012 (Figure 19). The top 10 percent of mobile users generate as much
traffic as the remaining 90 percent of mobile data traffic (Figure 20).
© 2014 Cisco and/or its affiliates. All rights reserved. This document is Cisco Public. Page 24 of 40
Figure 19. Top 1 Percent Generates 52 Percent of Monthly Data Traffic in Jan 2010 Compared to 10 Percent in Sept 2013
Figure 20. Top 10 Percent Consumes Nearly As Much As the Remaining 90 Percent
© 2014 Cisco and/or its affiliates. All rights reserved. This document is Cisco Public. Page 25 of 40
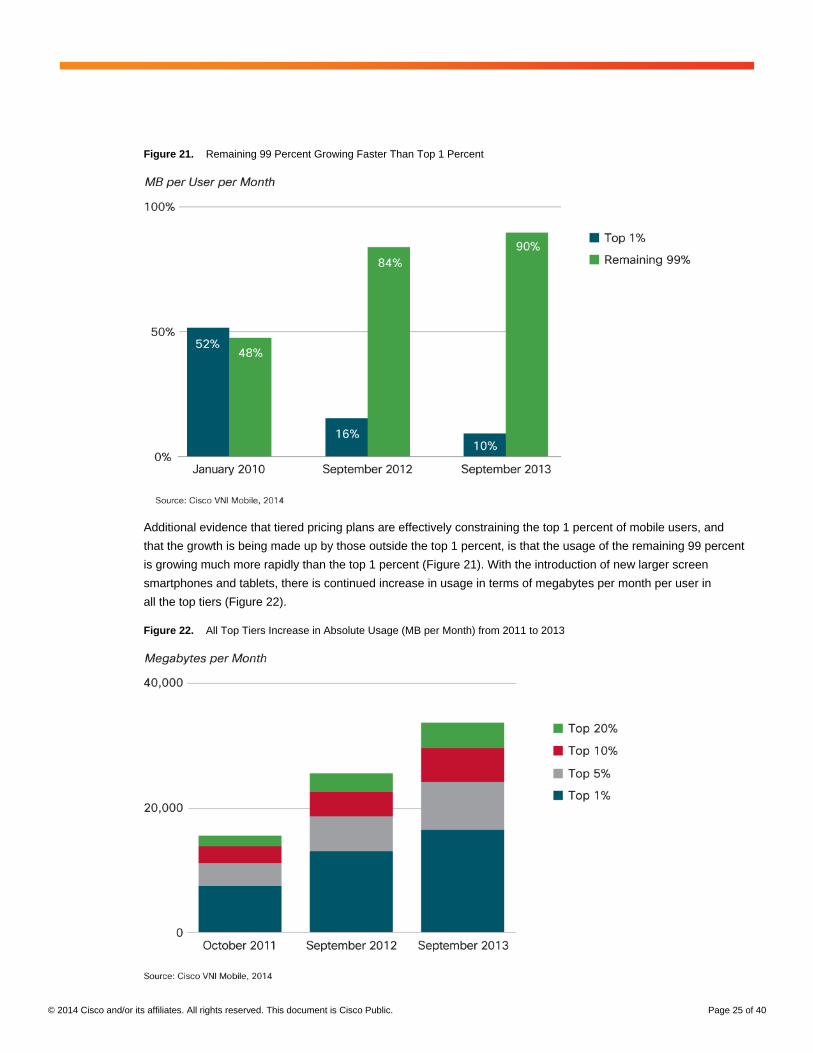
Figure 21. Remaining 99 Percent Growing Faster Than Top 1 Percent
Additional evidence that tiered pricing plans are effectively constraining the top 1 percent of mobile users, and
that the growth is being made up by those outside the top 1 percent, is that the usage of the remaining 99 percent
is growing much more rapidly than the top 1 percent (Figure 21). With the introduction of new larger screen
smartphones and tablets, there is continued increase in usage in terms of megabytes per month per user in
all the top tiers (Figure 22).
Figure 22. All Top Tiers Increase in Absolute Usage (MB per Month) from 2011 to 2013
© 2014 Cisco and/or its affiliates. All rights reserved. This document is Cisco Public. Page 26 of 40
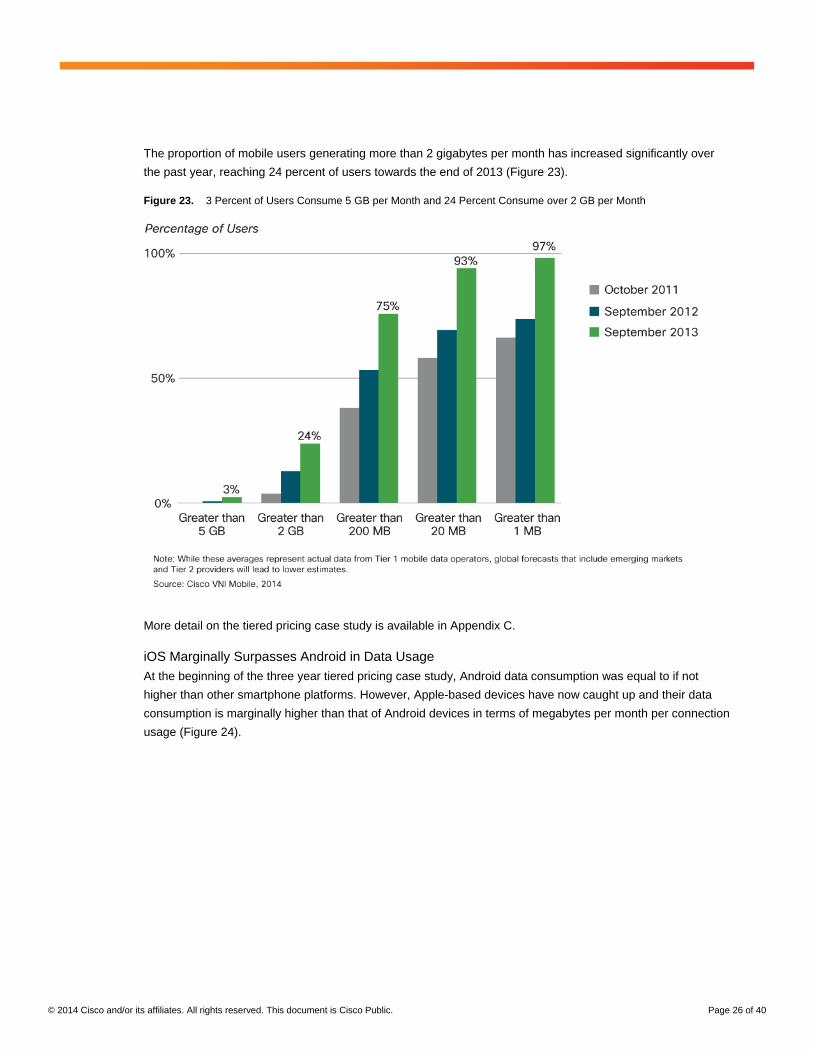
The proportion of mobile users generating more than 2 gigabytes per month has increased significantly over
the past year, reaching 24 percent of users towards the end of 2013 (Figure 23).
Figure 23. 3 Percent of Users Consume 5 GB per Month and 24 Percent Consume over 2 GB per Month
More detail on the tiered pricing case study is available in Appendix C.
iOS Marginally Surpasses Android in Data Usage
At the beginning of the three year tiered pricing case study, Android data consumption was equal to if not
higher than other smartphone platforms. However, Apple-based devices have now caught up and their data
consumption is marginally higher than that of Android devices in terms of megabytes per month per connection
usage (Figure 24).
© 2014 Cisco and/or its affiliates. All rights reserved. This document is Cisco Public. Page 27 of 40
Figure 24. Megabytes per Month by Operating System
Tiered plans outnumber unlimited plans; unlimited plans continue to lead in data consumption.
Figure 25. Tiered vs. Unlimited Plans
© 2014 Cisco and/or its affiliates. All rights reserved. This document is Cisco Public. Page 28 of 40
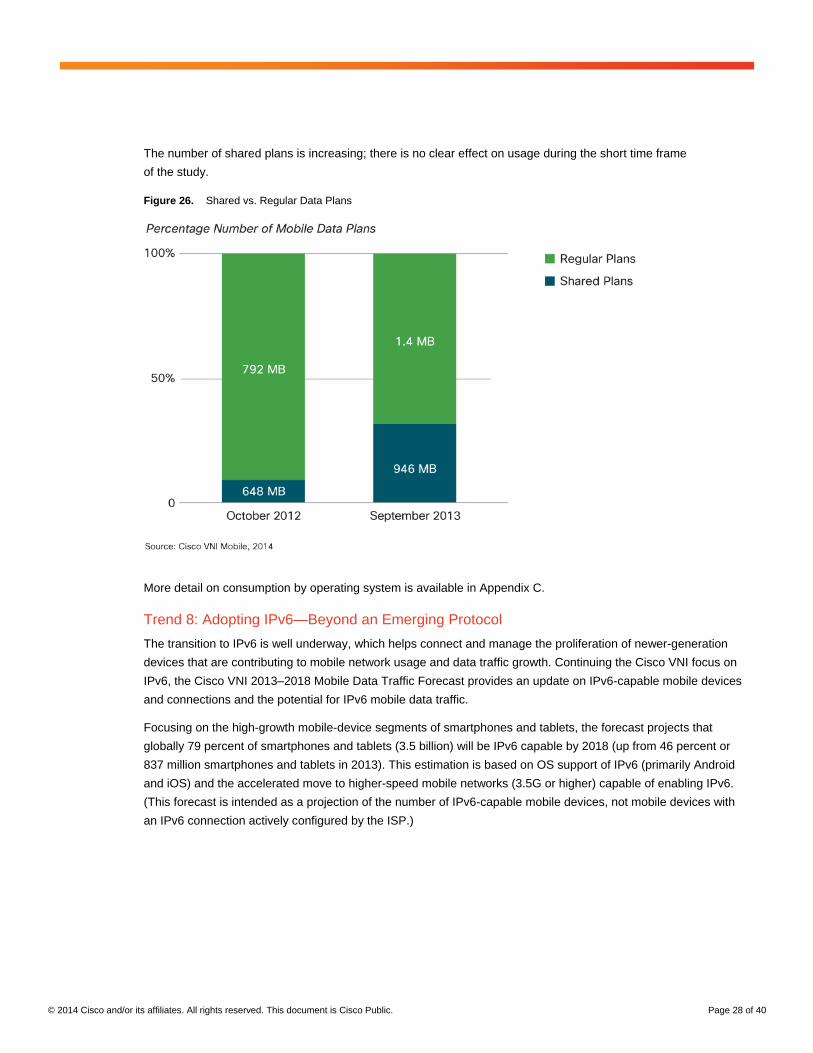
The number of shared plans is increasing; there is no clear effect on usage during the short time frame
of the study.
Figure 26. Shared vs. Regular Data Plans
More detail on consumption by operating system is available in Appendix C.
Trend 8: Adopting IPv6—Beyond an Emerging Protocol
The transition to IPv6 is well underway, which helps connect and manage the proliferation of newer-generation
devices that are contributing to mobile network usage and data traffic growth. Continuing the Cisco VNI focus on
IPv6, the Cisco VNI 2013–2018 Mobile Data Traffic Forecast provides an update on IPv6-capable mobile devices
and connections and the potential for IPv6 mobile data traffic.
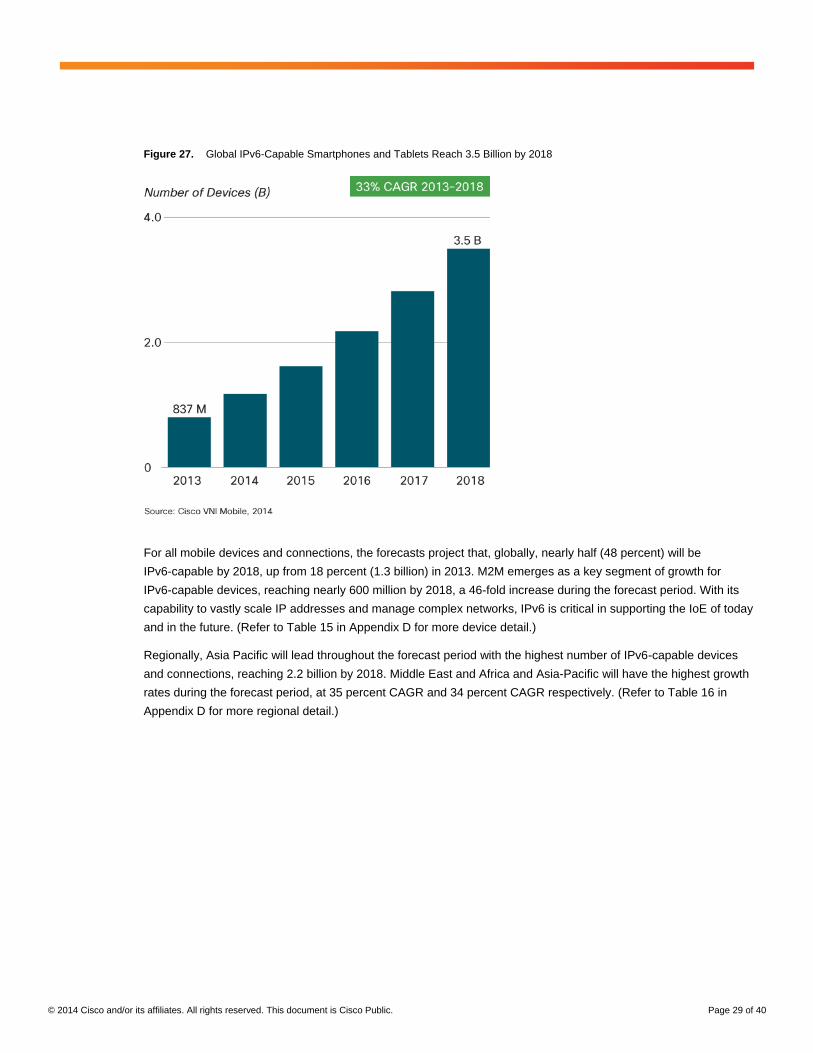
Focusing on the high-growth mobile-device segments of smartphones and tablets, the forecast projects that
globally 79 percent of smartphones and tablets (3.5 billion) will be IPv6 capable by 2018 (up from 46 percent or
837 million smartphones and tablets in 2013). This estimation is based on OS support of IPv6 (primarily Android
and iOS) and the accelerated move to higher-speed mobile networks (3.5G or higher) capable of enabling IPv6.
(This forecast is intended as a projection of the number of IPv6-capable mobile devices, not mobile devices with
an IPv6 connection actively configured by the ISP.)
© 2014 Cisco and/or its affiliates. All rights reserved. This document is Cisco Public. Page 29 of 40
Figure 27. Global IPv6-Capable Smartphones and Tablets Reach 3.5 Billion by 2018
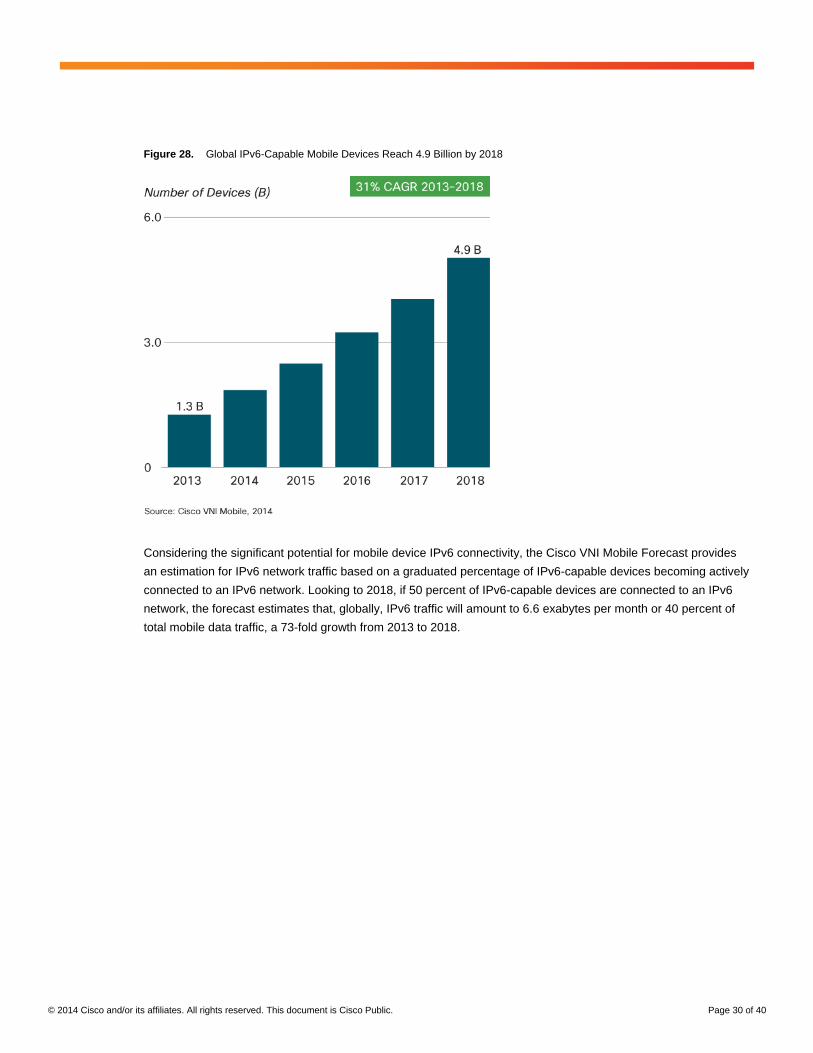
For all mobile devices and connections, the forecasts project that, globally, nearly half (48 percent) will be
IPv6-capable by 2018, up from 18 percent (1.3 billion) in 2013. M2M emerges as a key segment of growth for
IPv6-capable devices, reaching nearly 600 million by 2018, a 46-fold increase during the forecast period. With its
capability to vastly scale IP addresses and manage complex networks, IPv6 is critical in supporting the IoE of today
and in the future. (Refer to Table 15 in Appendix D for more device detail.)
Regionally, Asia Pacific will lead throughout the forecast period with the highest number of IPv6-capable devices
and connections, reaching 2.2 billion by 2018. Middle East and Africa and Asia-Pacific will have the highest growth
rates during the forecast period, at 35 percent CAGR and 34 percent CAGR respectively. (Refer to Table 16 in
Appendix D for more regional detail.)
© 2014 Cisco and/or its affiliates. All rights reserved. This document is Cisco Public. Page 30 of 40
Figure 28. Global IPv6-Capable Mobile Devices Reach 4.9 Billion by 2018
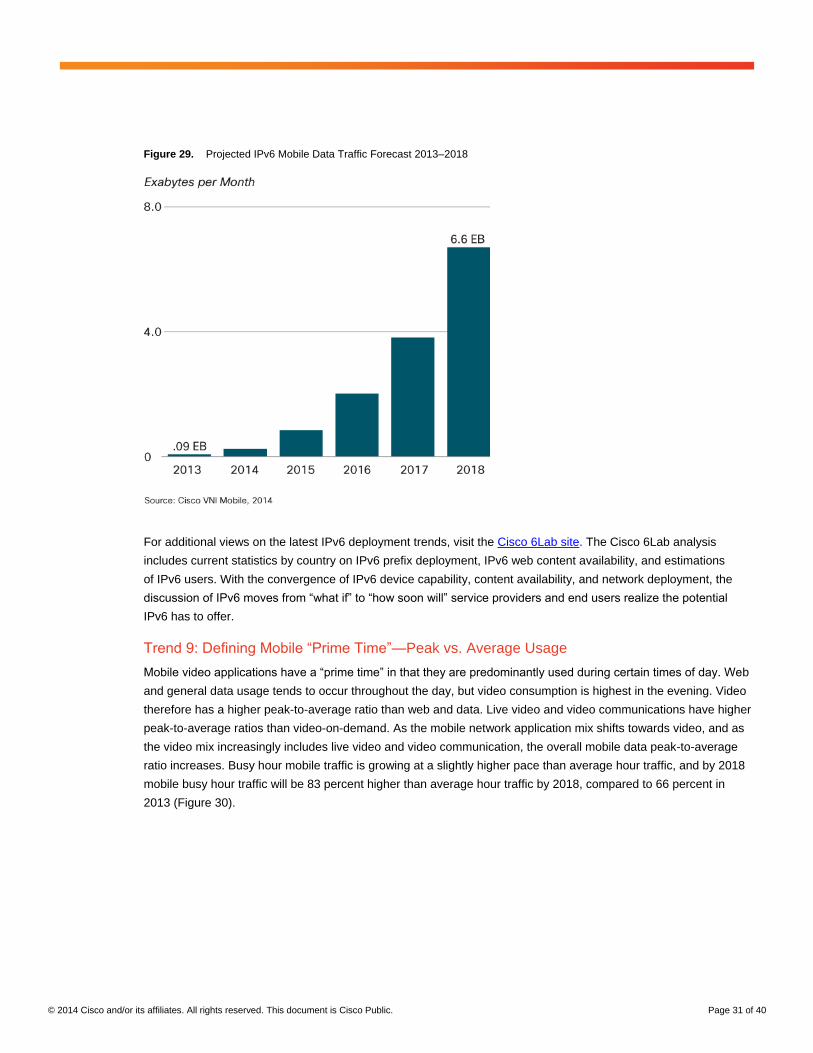
Considering the significant potential for mobile device IPv6 connectivity, the Cisco VNI Mobile Forecast provides
an estimation for IPv6 network traffic based on a graduated percentage of IPv6-capable devices becoming actively
connected to an IPv6 network. Looking to 2018, if 50 percent of IPv6-capable devices are connected to an IPv6
network, the forecast estimates that, globally, IPv6 traffic will amount to 6.6 exabytes per month or 40 percent of
total mobile data traffic, a 73-fold growth from 2013 to 2018.
© 2014 Cisco and/or its affiliates. All rights reserved. This document is Cisco Public. Page 31 of 40
Figure 29. Projected IPv6 Mobile Data Traffic Forecast 2013–2018
For additional views on the latest IPv6 deployment trends, visit the Cisco 6Lab site. The Cisco 6Lab analysis
includes current statistics by country on IPv6 prefix deployment, IPv6 web content availability, and estimations
of IPv6 users. With the convergence of IPv6 device capability, content availability, and network deployment, the
discussion of IPv6 moves from “what if” to “how soon will” service providers and end users realize the potential
IPv6 has to offer.
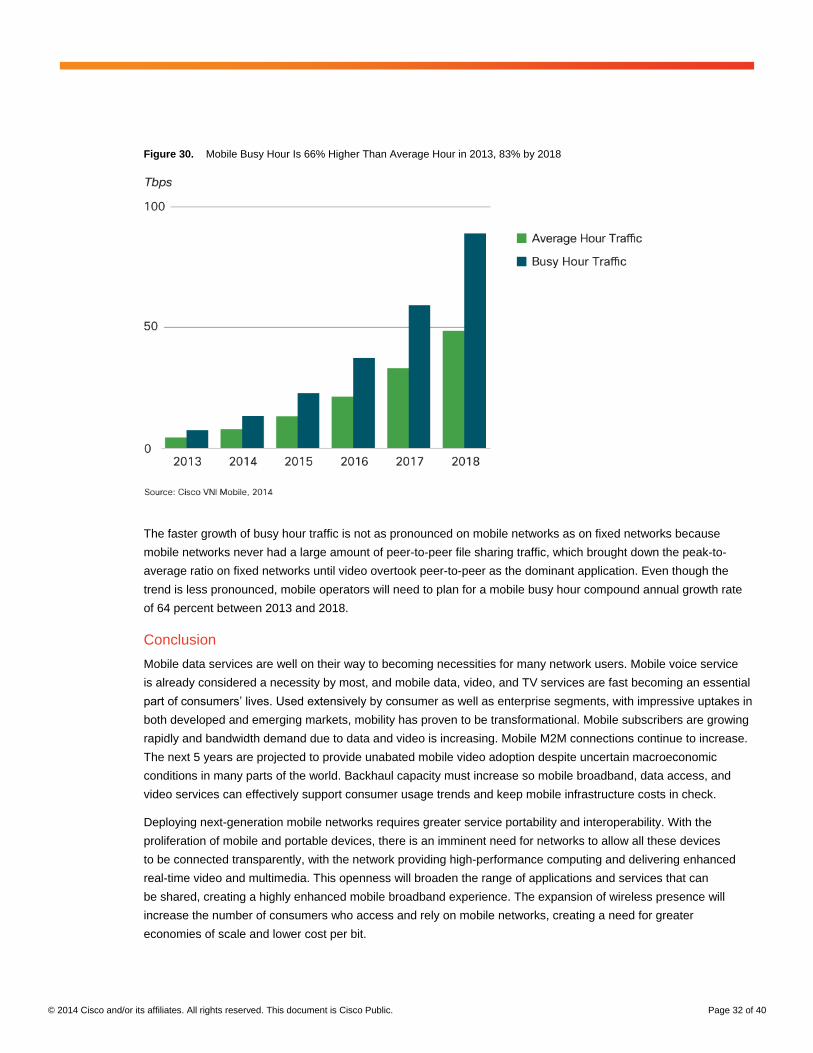
Trend 9: Defining Mobile “Prime Time”—Peak vs. Average Usage
Mobile video applications have a “prime time” in that they are predominantly used during certain times of day. Web
and general data usage tends to occur throughout the day, but video consumption is highest in the evening. Video
therefore has a higher peak-to-average ratio than web and data. Live video and video communications have higher
peak-to-average ratios than video-on-demand. As the mobile network application mix shifts towards video, and as
the video mix increasingly includes live video and video communication, the overall mobile data peak-to-average
ratio increases. Busy hour mobile traffic is growing at a slightly higher pace than average hour traffic, and by 2018
mobile busy hour traffic will be 83 percent higher than average hour traffic by 2018, compared to 66 percent in
2013 (Figure 30).
© 2014 Cisco and/or its affiliates. All rights reserved. This document is Cisco Public. Page 32 of 40
Figure 30. Mobile Busy Hour Is 66% Higher Than Average Hour in 2013, 83% by 2018
The faster growth of busy hour traffic is not as pronounced on mobile networks as on fixed networks because
mobile networks never had a large amount of peer-to-peer file sharing traffic, which brought down the peak-to-
average ratio on fixed networks until video overtook peer-to-peer as the dominant application. Even though the
trend is less pronounced, mobile operators will need to plan for a mobile busy hour compound annual growth rate
of 64 percent between 2013 and 2018.
Conclusion
Mobile data services are well on their way to becoming necessities for many network users. Mobile voice service
is already considered a necessity by most, and mobile data, video, and TV services are fast becoming an essential
part of consumers’ lives. Used extensively by consumer as well as enterprise segments, with impressive uptakes in
both developed and emerging markets, mobility has proven to be transformational. Mobile subscribers are growing
rapidly and bandwidth demand due to data and video is increasing. Mobile M2M connections continue to increase.
The next 5 years are projected to provide unabated mobile video adoption despite uncertain macroeconomic
conditions in many parts of the world. Backhaul capacity must increase so mobile broadband, data access, and
video services can effectively support consumer usage trends and keep mobile infrastructure costs in check.
Deploying next-generation mobile networks requires greater service portability and interoperability. With the
proliferation of mobile and portable devices, there is an imminent need for networks to allow all these devices
to be connected transparently, with the network providing high-performance computing and delivering enhanced
real-time video and multimedia. This openness will broaden the range of applications and services that can
be shared, creating a highly enhanced mobile broadband experience. The expansion of wireless presence will
increase the number of consumers who access and rely on mobile networks, creating a need for greater
economies of scale and lower cost per bit.

© 2014 Cisco and/or its affiliates. All rights reserved. This document is Cisco Public. Page 33 of 40
As many business models emerge with new forms of advertising, media and content partnerships, mobile
services including M2M, live gaming, and (in the future) augmented reality, a mutually beneficial situation needs
to be developed for service providers and over-the-top providers. New partnerships, ecosystems, and strategic
consolidations are expected as mobile operators, content providers, application developers, and others seek
to monetize the video traffic that traverses mobile networks. Operators must solve the challenge of effectively
monetizing video traffic while increasing infrastructure capital expenditures. They must become more agile and
able to quickly change course and provide innovative services to engage the Web 3.0 consumer. While the net
neutrality regulatory process and business models of operators evolve, there is an unmet demand from consumers
for the highest quality and speeds. As wireless technologies aim to provide experiences formerly only available
through wired networks, the next few years will be critical for operators and service providers to plan future network
deployments that will create an adaptable environment in which the multitude of mobile-enabled devices and
applications of the future can be deployed.
For More Information
Inquiries can be directed to [email protected].
© 2014 Cisco and/or its affiliates. All rights reserved. This document is Cisco Public. Page 34 of 40
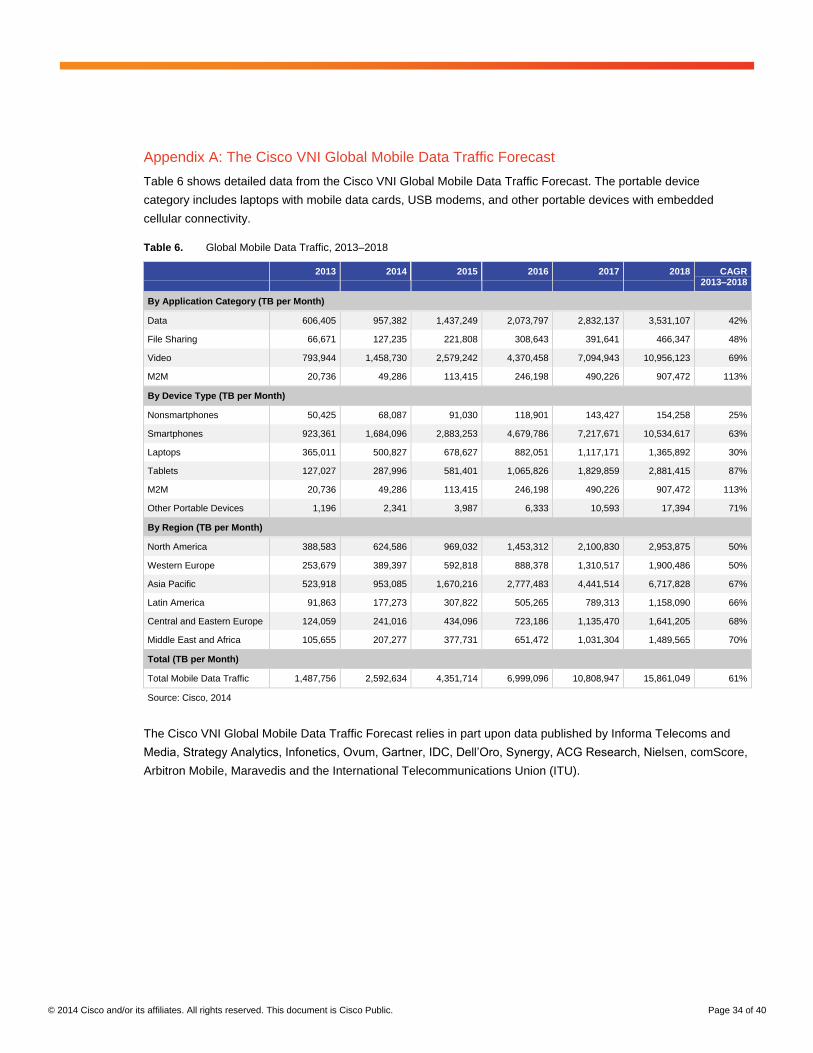
Appendix A: The Cisco VNI Global Mobile Data Traffic Forecast
Table 6 shows detailed data from the Cisco VNI Global Mobile Data Traffic Forecast. The portable device
category includes laptops with mobile data cards, USB modems, and other portable devices with embedded
cellular connectivity.
Table 6. Global Mobile Data Traffic, 2013–2018
2013 2014 2015 2016 2017 2018 CAGR 2013–2018
By Application Category (TB per Month)
Data 606,405 957,382 1,437,249 2,073,797 2,832,137 3,531,107 42%
File Sharing 66,671 127,235 221,808 308,643 391,641 466,347 48%
Video 793,944 1,458,730 2,579,242 4,370,458 7,094,943 10,956,123 69%
M2M 20,736 49,286 113,415 246,198 490,226 907,472 113%
By Device Type (TB per Month)
Nonsmartphones 50,425 68,087 91,030 118,901 143,427 154,258 25%
Smartphones 923,361 1,684,096 2,883,253 4,679,786 7,217,671 10,534,617 63%
Laptops 365,011 500,827 678,627 882,051 1,117,171 1,365,892 30%
Tablets 127,027 287,996 581,401 1,065,826 1,829,859 2,881,415 87%
M2M 20,736 49,286 113,415 246,198 490,226 907,472 113%
Other Portable Devices 1,196 2,341 3,987 6,333 10,593 17,394 71%
By Region (TB per Month)
North America 388,583 624,586 969,032 1,453,312 2,100,830 2,953,875 50%
Western Europe 253,679 389,397 592,818 888,378 1,310,517 1,900,486 50%
Asia Pacific 523,918 953,085 1,670,216 2,777,483 4,441,514 6,717,828 67%
Latin America 91,863 177,273 307,822 505,265 789,313 1,158,090 66%
Central and Eastern Europe 124,059 241,016 434,096 723,186 1,135,470 1,641,205 68%
Middle East and Africa 105,655 207,277 377,731 651,472 1,031,304 1,489,565 70%
Total (TB per Month)
Total Mobile Data Traffic 1,487,756 2,592,634 4,351,714 6,999,096 10,808,947 15,861,049 61%
Source: Cisco, 2014
The Cisco VNI Global Mobile Data Traffic Forecast relies in part upon data published by Informa Telecoms and
Media, Strategy Analytics, Infonetics, Ovum, Gartner, IDC, Dell’Oro, Synergy, ACG Research, Nielsen, comScore,
Arbitron Mobile, Maravedis and the International Telecommunications Union (ITU).

© 2014 Cisco and/or its affiliates. All rights reserved. This document is Cisco Public. Page 35 of 40
The Cisco VNI methodology begins with the number and growth of connections and devices, applies adoption
rates for applications, and then multiplies the application’s user base by Cisco’s estimated minutes of use
and KB per minute for that application. The methodology has evolved to link assumptions more closely with
fundamental factors, to use data sources unique to Cisco, and to provide a high degree of application, segment,
geographic, and device specificity.
● Inclusion of fundamental factors. As with the fixed IP traffic forecast, each Cisco VNI Global Mobile
Data Traffic Forecast update increases the linkages between the main assumptions and fundamental
factors such as available connection speed, pricing of connections and devices, computational processing
power, screen size and resolution, and even device battery life. This update focuses on the relationship of
mobile connection speeds and the KB-per-minute assumptions in the forecast model. Proprietary data from
the Cisco Global Internet Speed Test (GIST) application was used as a baseline for current-year
smartphone connection speeds for each country.
● Device-centric approach. As the number and variety of devices on the mobile network continue to
increase, it becomes essential to model traffic at the device level rather than the connection level. This
Cisco VNI Global Mobile Data Traffic Forecast update details traffic to smartphones; nonsmartphones;
laptops, tablets, and netbooks; e-readers; digital still cameras; digital video cameras; digital photo frames;
in-car entertainment systems; and handheld gaming consoles.
● Estimation of the impact of traffic offload. The Cisco VNI Global Mobile Data Traffic Forecast model
now quantifies the effect of dual-mode devices and femtocells on handset traffic. Proprietary data from
Cisco’s IBSG Connected Life Market Watch was used to model offload effects.
● Increased application-level specificity. The forecast now offers a deeper and wider range of application
specificity.
© 2014 Cisco and/or its affiliates. All rights reserved. This document is Cisco Public. Page 36 of 40
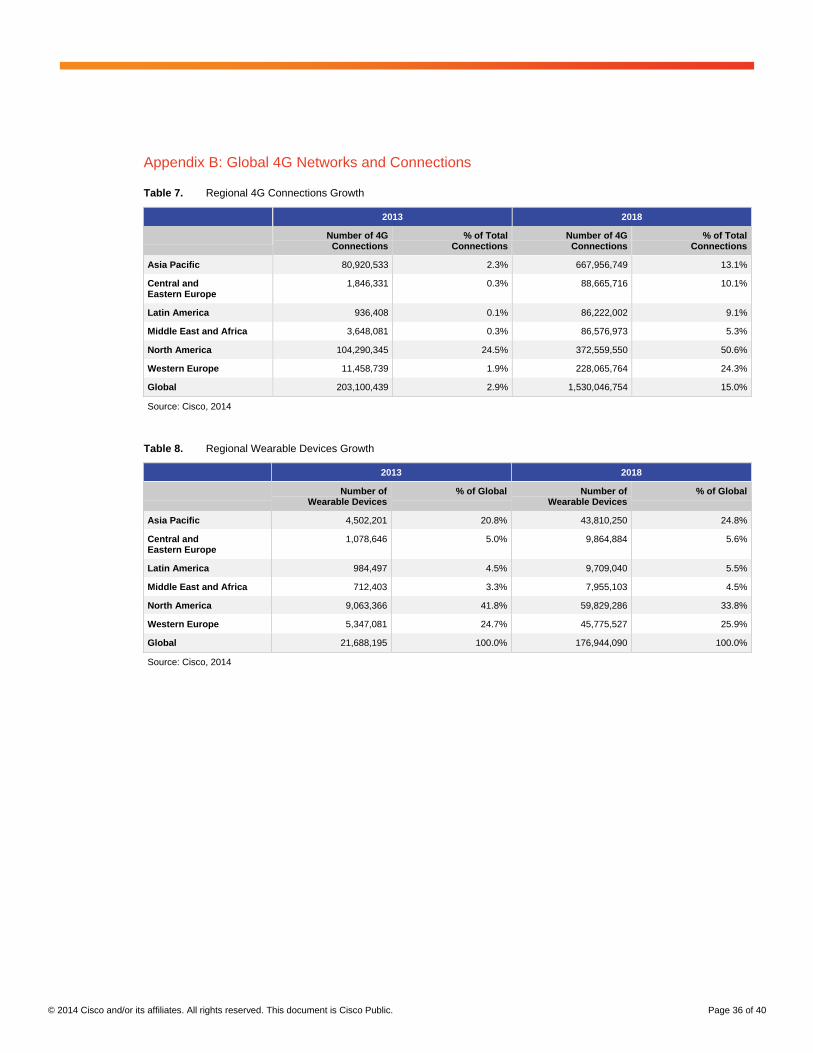
Appendix B: Global 4G Networks and Connections
Table 7. Regional 4G Connections Growth
2013 2018
Number of 4G Connections
% of Total Connections
Number of 4G Connections
% of Total Connections
Asia Pacific 80,920,533 2.3% 667,956,749 13.1%
Central and Eastern Europe
1,846,331 0.3% 88,665,716 10.1%
Latin America 936,408 0.1% 86,222,002 9.1%
Middle East and Africa 3,648,081 0.3% 86,576,973 5.3%
North America 104,290,345 24.5% 372,559,550 50.6%
Western Europe 11,458,739 1.9% 228,065,764 24.3%
Global 203,100,439 2.9% 1,530,046,754 15.0%
Source: Cisco, 2014
Table 8. Regional Wearable Devices Growth
2013 2018
Number of Wearable Devices
% of Global Number of Wearable Devices
% of Global
Asia Pacific 4,502,201 20.8% 43,810,250 24.8%
Central and Eastern Europe
1,078,646 5.0% 9,864,884 5.6%
Latin America 984,497 4.5% 9,709,040 5.5%
Middle East and Africa 712,403 3.3% 7,955,103 4.5%
North America 9,063,366 41.8% 59,829,286 33.8%
Western Europe 5,347,081 24.7% 45,775,527 25.9%
Global 21,688,195 100.0% 176,944,090 100.0%
Source: Cisco, 2014
© 2014 Cisco and/or its affiliates. All rights reserved. This document is Cisco Public. Page 37 of 40
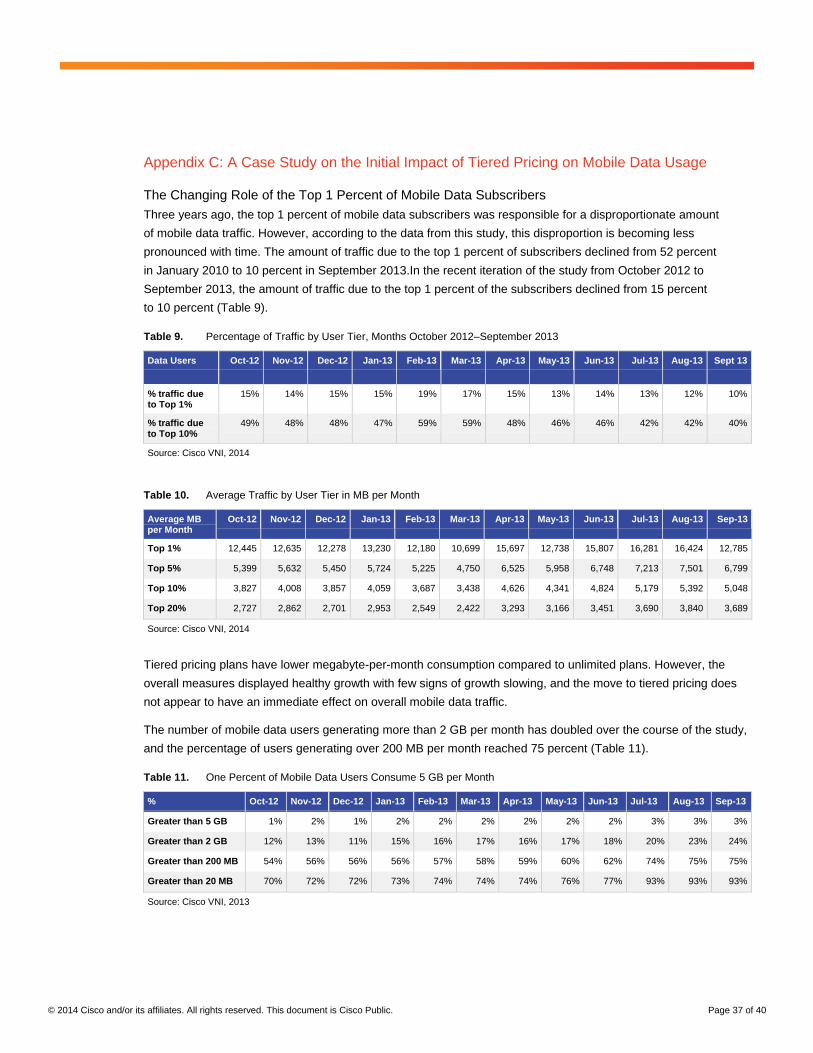
Appendix C: A Case Study on the Initial Impact of Tiered Pricing on Mobile Data Usage
The Changing Role of the Top 1 Percent of Mobile Data Subscribers
Three years ago, the top 1 percent of mobile data subscribers was responsible for a disproportionate amount
of mobile data traffic. However, according to the data from this study, this disproportion is becoming less
pronounced with time. The amount of traffic due to the top 1 percent of subscribers declined from 52 percent
in January 2010 to 10 percent in September 2013.In the recent iteration of the study from October 2012 to
September 2013, the amount of traffic due to the top 1 percent of the subscribers declined from 15 percent
to 10 percent (Table 9).
Table 9. Percentage of Traffic by User Tier, Months October 2012–September 2013
Data Users
Oct-12 Nov-12 Dec-12 Jan-13 Feb-13 Mar-13 Apr-13 May-13 Jun-13 Jul-13 Aug-13 Sept 13
% traffic due to Top 1%
15% 14% 15% 15% 19% 17% 15% 13% 14% 13% 12% 10%
% traffic due to Top 10%
49% 48% 48% 47% 59% 59% 48% 46% 46% 42% 42% 40%
Source: Cisco VNI, 2014
Table 10. Average Traffic by User Tier in MB per Month
Average MB per Month
Oct-12 Nov-12 Dec-12 Jan-13 Feb-13 Mar-13 Apr-13 May-13 Jun-13 Jul-13 Aug-13 Sep-13
Top 1% 12,445 12,635 12,278 13,230 12,180 10,699 15,697 12,738 15,807 16,281 16,424 12,785
Top 5% 5,399 5,632 5,450 5,724 5,225 4,750 6,525 5,958 6,748 7,213 7,501 6,799
Top 10% 3,827 4,008 3,857 4,059 3,687 3,438 4,626 4,341 4,824 5,179 5,392 5,048
Top 20% 2,727 2,862 2,701 2,953 2,549 2,422 3,293 3,166 3,451 3,690 3,840 3,689
Source: Cisco VNI, 2014
Tiered pricing plans have lower megabyte-per-month consumption compared to unlimited plans. However, the
overall measures displayed healthy growth with few signs of growth slowing, and the move to tiered pricing does
not appear to have an immediate effect on overall mobile data traffic.
The number of mobile data users generating more than 2 GB per month has doubled over the course of the study,
and the percentage of users generating over 200 MB per month reached 75 percent (Table 11).
Table 11. One Percent of Mobile Data Users Consume 5 GB per Month
% Oct-12 Nov-12 Dec-12 Jan-13 Feb-13 Mar-13 Apr-13 May-13 Jun-13 Jul-13 Aug-13 Sep-13
Greater than 5 GB 1% 2% 1% 2% 2% 2% 2% 2% 2% 3% 3% 3%
Greater than 2 GB 12% 13% 11% 15% 16% 17% 16% 17% 18% 20% 23% 24%
Greater than 200 MB 54% 56% 56% 56% 57% 58% 59% 60% 62% 74% 75% 75%
Greater than 20 MB 70% 72% 72% 73% 74% 74% 74% 76% 77% 93% 93% 93%
Source: Cisco VNI, 2013
© 2014 Cisco and/or its affiliates. All rights reserved. This document is Cisco Public. Page 38 of 40
The rapid increase in data usage presents a challenge to service providers who have implemented tiers defined
solely in terms of usage limits. Mobile data caps that fall too far behind usage volumes may create opportunities
for competitors in the market. Therefore, many service providers are creating more nuanced tiers, shared data
plans and data add-ons, such as a separate charge for tethering and hotspot functionality. Such offerings tend to
require less vigilance on the part of subscribers than data caps, yet still monetize scenarios that tend to have high
data usage. Shared data family plans are being introduced and their effects on overall mobile data traffic are yet to
be determined.
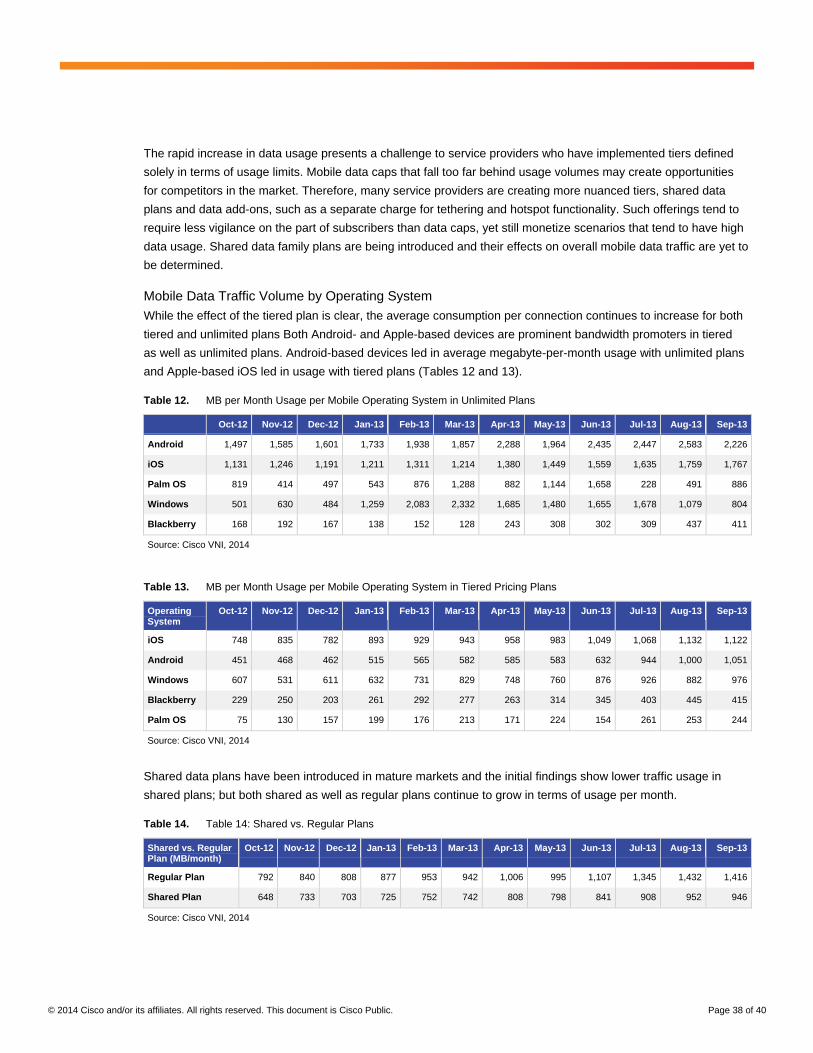
Mobile Data Traffic Volume by Operating System
While the effect of the tiered plan is clear, the average consumption per connection continues to increase for both
tiered and unlimited plans Both Android- and Apple-based devices are prominent bandwidth promoters in tiered
as well as unlimited plans. Android-based devices led in average megabyte-per-month usage with unlimited plans
and Apple-based iOS led in usage with tiered plans (Tables 12 and 13).
Table 12. MB per Month Usage per Mobile Operating System in Unlimited Plans
Oct-12 Nov-12 Dec-12 Jan-13 Feb-13 Mar-13 Apr-13 May-13 Jun-13 Jul-13 Aug-13 Sep-13
Android 1,497 1,585 1,601 1,733 1,938 1,857 2,288 1,964 2,435 2,447 2,583 2,226
iOS 1,131 1,246 1,191 1,211 1,311 1,214 1,380 1,449 1,559 1,635 1,759 1,767
Palm OS 819 414 497 543 876 1,288 882 1,144 1,658 228 491 886
Windows 501 630 484 1,259 2,083 2,332 1,685 1,480 1,655 1,678 1,079 804
Blackberry 168 192 167 138 152 128 243 308 302 309 437 411
Source: Cisco VNI, 2014
Table 13. MB per Month Usage per Mobile Operating System in Tiered Pricing Plans
Operating System
Oct-12 Nov-12 Dec-12 Jan-13 Feb-13 Mar-13 Apr-13 May-13 Jun-13 Jul-13 Aug-13 Sep-13
iOS 748 835 782 893 929 943 958 983 1,049 1,068 1,132 1,122
Android 451 468 462 515 565 582 585 583 632 944 1,000 1,051
Windows 607 531 611 632 731 829 748 760 876 926 882 976
Blackberry 229 250 203 261 292 277 263 314 345 403 445 415
Palm OS 75 130 157 199 176 213 171 224 154 261 253 244
Source: Cisco VNI, 2014
Shared data plans have been introduced in mature markets and the initial findings show lower traffic usage in
shared plans; but both shared as well as regular plans continue to grow in terms of usage per month.
Table 14. Table 14: Shared vs. Regular Plans
Shared vs. Regular Plan (MB/month)
Oct-12 Nov-12 Dec-12 Jan-13 Feb-13 Mar-13 Apr-13 May-13 Jun-13 Jul-13 Aug-13 Sep-13
Regular Plan 792 840 808 877 953 942 1,006 995 1,107 1,345 1,432 1,416
Shared Plan 648 733 703 725 752 742 808 798 841 908 952 946
Source: Cisco VNI, 2014
© 2014 Cisco and/or its affiliates. All rights reserved. This document is Cisco Public. Page 39 of 40
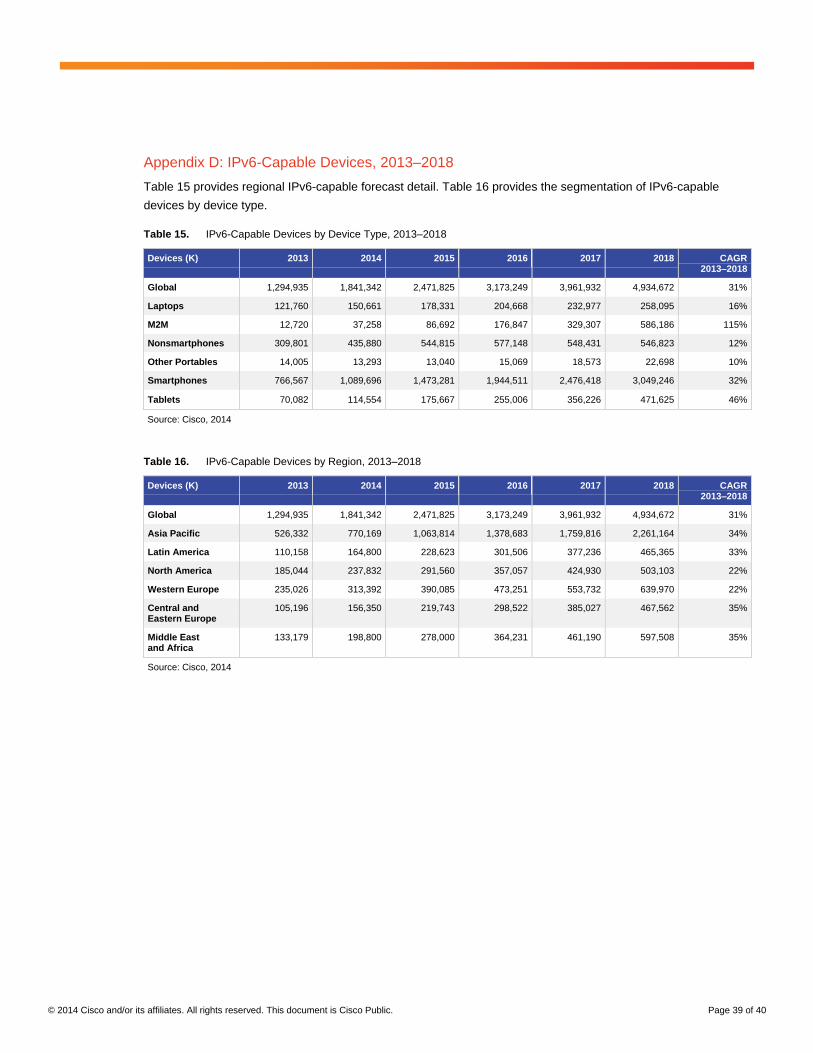
Appendix D: IPv6-Capable Devices, 2013–2018
Table 15 provides regional IPv6-capable forecast detail. Table 16 provides the segmentation of IPv6-capable
devices by device type.
Table 15. IPv6-Capable Devices by Device Type, 2013–2018
Devices (K) 2013 2014 2015 2016 2017 2018 CAGR 2013–2018
Global 1,294,935 1,841,342 2,471,825 3,173,249 3,961,932 4,934,672 31%
Laptops 121,760 150,661 178,331 204,668 232,977 258,095 16%
M2M 12,720 37,258 86,692 176,847 329,307 586,186 115%
Nonsmartphones 309,801 435,880 544,815 577,148 548,431 546,823 12%
Other Portables 14,005 13,293 13,040 15,069 18,573 22,698 10%
Smartphones 766,567 1,089,696 1,473,281 1,944,511 2,476,418 3,049,246 32%
Tablets 70,082 114,554 175,667 255,006 356,226 471,625 46%
Source: Cisco, 2014
Table 16. IPv6-Capable Devices by Region, 2013–2018
Devices (K) 2013 2014 2015 2016 2017 2018 CAGR 2013–2018
Global 1,294,935 1,841,342 2,471,825 3,173,249 3,961,932 4,934,672 31%
Asia Pacific 526,332 770,169 1,063,814 1,378,683 1,759,816 2,261,164 34%
Latin America 110,158 164,800 228,623 301,506 377,236 465,365 33%
North America 185,044 237,832 291,560 357,057 424,930 503,103 22%
Western Europe 235,026 313,392 390,085 473,251 553,732 639,970 22%
Central and Eastern Europe
105,196 156,350 219,743 298,522 385,027 467,562 35%
Middle East and Africa
133,179 198,800 278,000 364,231 461,190 597,508 35%
Source: Cisco, 2014
© 2014 Cisco and/or its affiliates. All rights reserved. This document is Cisco Public. Page 40 of 40
Printed in USA FLGD 11446 02/14


![[PPT]Quality Improvement: Problem Solving - Saint …homepages.stmartin.edu/fac_staff/dstout/MEM650/Ch03... · Web viewTitle Quality Improvement: Problem Solving Subject PDCA Cycle](https://img.pdfslide.us/doc/110x75/5aeac4fc7f8b9a36698d7378/pptquality-improvement-problem-solving-saint-viewtitle-quality-improvement.jpg)
![[PPT]Chapter 2 Linear Programming Models: Graphical …homepages.stmartin.edu/fac_staff/dstout/MBA605... · Web viewTitle Chapter 2 Linear Programming Models: Graphical and Computer](https://img.pdfslide.us/doc/110x75/5abf5d4b7f8b9a3a428e1b85/pptchapter-2-linear-programming-models-graphical-viewtitle-chapter-2-linear.jpg)