Embed Size (px)
Citation preview

White Paper
© 2018 Cisco and/or its affiliates. All rights reserved. This document is Cisco Public Information. Page 1 of 27
Cisco UCS C220 M5 Rack Server Disk I/O Characterization
June 2018

White Paper
© 2018 Cisco and/or its affiliates. All rights reserved. This document is Cisco Public Information. Page 2 of 27
Executive summary This document summarizes the I/O performance characteristics of the Cisco UCS® C220 M5 Rack Server using the Cisco® 12-Gbps modular RAID controller with a 2-GB cache module (UCSC-RAID-M5) and Cisco 12-Gbps modular serial-attached Small Computer System Interface (SCSI; SAS) host bus adapter (HBA; UCSC-SAS-M5). Performance comparisons of various SAS solid-state disks (SSDs), hard-disk drives (HDDs), Redundant Array of Independent Disk (RAID) configurations, and controller options are presented. The goal of this document is to help customers make well-informed decisions to choose the right internal disk types and configure the right controller options and RAID levels to meet their individual I/O workload needs.
Performance data was obtained using the Iometer measurement tool, with analysis based on the number of I/O operations per second (IOPS) for random I/O workloads, and megabytes per second (MBps) of throughput for sequential I/O workloads. From this analysis, specific recommendations are made for storage configuration parameters.
Many combinations of drive types and RAID levels are possible. For these characterization tests, performance evaluations were limited to small-form-factor (SFF) SSDs and HDDs with configurations of RAID 0, RAID 5, and RAID 10 virtual disks.
Introduction The widespread adoption of virtualization and data center consolidation technologies has had a profound impact on the efficiency of the data center. Virtualization brings new challenges for storage technology, requiring the multiplexing of distinct I/O workloads across a single I/O “pipe.” From a storage perspective, this approach results in a sharp increase in random IOPS. For spinning media disks, random I/O operations are the most difficult to handle, requiring costly seek operations and rotations between microsecond transfers. The hard disks not only add a security factor but also are the critical performance components in the server environment. Therefore, it is important to bundle the performance of these components through intelligent technology so that they do not cause a system bottleneck and so they will compensate for any failure of an individual component. RAID technology offers a solution by arranging several hard disks in an array so that any hard disk failure can be accommodated.
According to conventional wisdom, data center I/O workloads are either random (many concurrent accesses to relatively small blocks of data) or sequential (a modest number of large sequential data transfers). Historically, random access has been associated with a transactional workload, which is an enterprise’s most common type of workload. Currently, data centers are dominated by random and sequential workloads resulting from the scale-out architecture requirements in the data center.
I/O challenges The rise of technologies such as virtualization, cloud computing, and data consolidation poses new challenges for the data center and requires enhanced I/O requests. These enhanced requests lead to increased I/O performance requirements. They also require data centers to fully utilize available resources so that they can support the newest requirements of the data center and reduce the performance gap observed industrywide.
The following are the major factors leading to an I/O crisis:
● Increasing CPU uti l ization and increasing I/O operations: Multicore processors with virtualized server and desktop architectures increase processor utilization, increasing the I/O demand per server. In a virtualized data center, it is the I/O performance that limits the server consolidation ratio, not the CPU or memory.
● Randomization: Virtualization has the effect of multiplexing multiple logical workloads across a single physical I/O path. The greater the degree of virtualization achieved, the more random the physical I/O requests.

White Paper
© 2018 Cisco and/or its affiliates. All rights reserved. This document is Cisco Public Information. Page 3 of 27
Scope of this document For the I/O performance characterization tests, performance was evaluated using SSDs and HDDs with configurations of RAID 0, RAID 5, and RAID 10 virtual disks because most of the workloads targeted for Cisco UCS C220 M5 Rack Servers use these RAID levels. The Cisco UCS C220 M5SX server used for the I/O performance characterization tests supports up to 10 HDDs and SSDs. The performance tests described here were limited to 10-disk configurations for RAID 0, RAID 5, and RAID 10 and JBOD configuration with SFF SSDs and SFF HDDs.
Solution components The tested solution used a Cisco UCS C220 M5 Rack Server with SSDs and HDDs.
Cisco UCS C220 M5 Rack Server overview
The Cisco UCS C220 M5 Rack Server is an enterprise-class server in a 1-rack-unit (1RU) form factor. It is designed to deliver exceptional performance, expandability, and efficiency for storage and I/O-intensive infrastructure workloads. These workloads include virtualization, web, collaboration, and bare-metal applications.
The Cisco UCS C220 M5 server provides:
● Support for a 1RU 2-socket server using Intel® Xeon® Scalable processors
● Support for 2666-MHz DDR4 DIMMs and 8-, 16-, 32-, 64-, and 128-GB DIMMs
● Increased storage density with 10 front-pluggable 2.5-inch SFF drive bays, or 4 front-pluggable 3.5-inch large-form-factor (LFF) drive bays
● Non-Volatile Memory Express (NVMe) PCI Express (PCIe) SSD support (for up to 2 drives on the standard chassis SKU or up to 10 drives on the NVMe-optimized SKU)
● Cisco 12-Gbps SAS RAID modular controller and Cisco 12-Gbps SAS HBA controller
● 2 Flexible Flash (FlexFlash) Secure Digital (SD) card slots or 2 modular M.2 SATA slots
● 10-Gbps embedded Intel x550 10GBASE-T LAN-on-motherboard (LOM) port
● 1 modular LOM (mLOM) slot
● 2 PCIe Generation 3 (Gen 3) slots
● Up to 2 hot-pluggable redundant power supplies
The Cisco UCS C220 M5 server can be deployed as a standalone device or as part of a managed Cisco Unified Computing System™ (Cisco UCS) environment. Cisco UCS unifies computing, networking, management, virtualization, and storage access into a single integrated architecture that can enable end-to-end server visibility, management, and control in both bare-metal and virtualized environments.
With a Cisco UCS managed deployment, the Cisco UCS C220 M5 takes advantage of our standards-based unified computing innovations to significantly reduce customers’ total cost of ownership (TCO) and increase business agility.
Server specifications
The server specifications are as follows:
● Cisco UCS C220 M5 Rack Servers
● CPU: 2 x 2.10-GHz Intel Xeon Gold 6130 processors
● Memory: 12 x 16-GB (192-GB) DDR4
White Paper
© 2018 Cisco and/or its affiliates. All rights reserved. This document is Cisco Public Information. Page 4 of 27
● Cisco UCS Virtual Interface Card (VIC) 1387 mLOM 10-Gbps Enhanced Small Form-Factor Pluggable (SFP+)
● Cisco 12-Gbps modular RAID controller with 2-GB cache module
● Cisco 12-Gbps modular SAS HBA
Cisco UCS C220 M5 server models
The Cisco UCS C220 M5 server can be configured in four different models to match specific customer environments. The Cisco UCS C220 M5 can be used as a standalone server or as part of Cisco UCS, which unifies computing, networking, management, virtualization, and storage access into a single integrated architecture that enables end-to-end server visibility, management, and control in both bare-metal and virtualized environments.
The Cisco UCS C220 M5 server includes a dedicated internal mLOM slot for installation of a Cisco VIC or third-party network interface card (NIC), without consuming a PCI slot, in addition to two 10GBASE-T Intel x550 embedded (on the motherboard) LOM ports.
Cisco UCS C220 M5 servers are broadly categorized into SFF and LFF models as follows:
● Cisco UCS C220 M5 Rack Server (SFF model)
◦ UCSC-C220-M5SX
◦ 10 SFF front-facing SAS and SATA HDDs or SAS and SATA SSDs
◦ Optionally, up to 2 front-facing SFF NVMe PCIe SSDs (replacing the SAS and SATA drives)
◦ UCSC-C220-M5SN
◦ Up to 10 front-facing SFF NVMe PCIe SSDs only (replacing the SAS and SATA drives)
◦ Cisco UCS-C220-M5L Rack Server (LFF model)
◦ 4 LFF 3.5-inch front-facing SAS and SATA HDDs or SAS and SATA SSDs
◦ Optionally, up to 2 front-facing SFF NVMe PCIe SSDs (replacing the SAS and SATA drives)
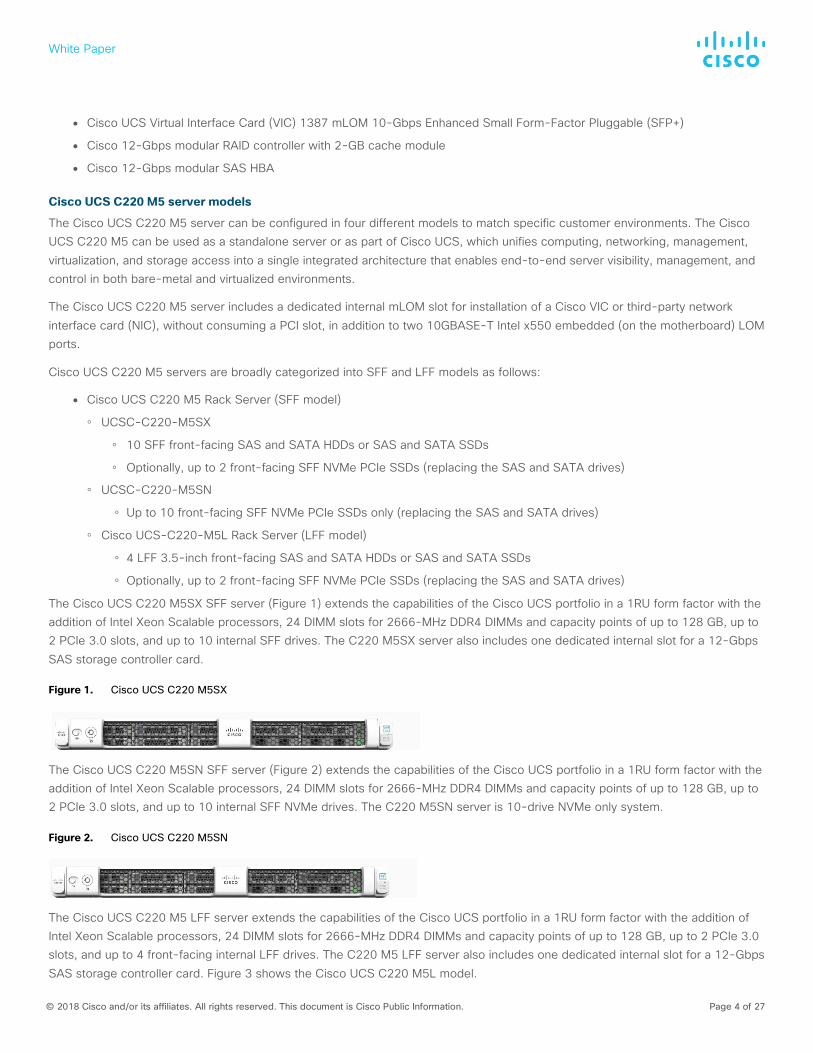
The Cisco UCS C220 M5SX SFF server (Figure 1) extends the capabilities of the Cisco UCS portfolio in a 1RU form factor with the addition of Intel Xeon Scalable processors, 24 DIMM slots for 2666-MHz DDR4 DIMMs and capacity points of up to 128 GB, up to 2 PCIe 3.0 slots, and up to 10 internal SFF drives. The C220 M5SX server also includes one dedicated internal slot for a 12-Gbps SAS storage controller card.
Figure 1. Cisco UCS C220 M5SX
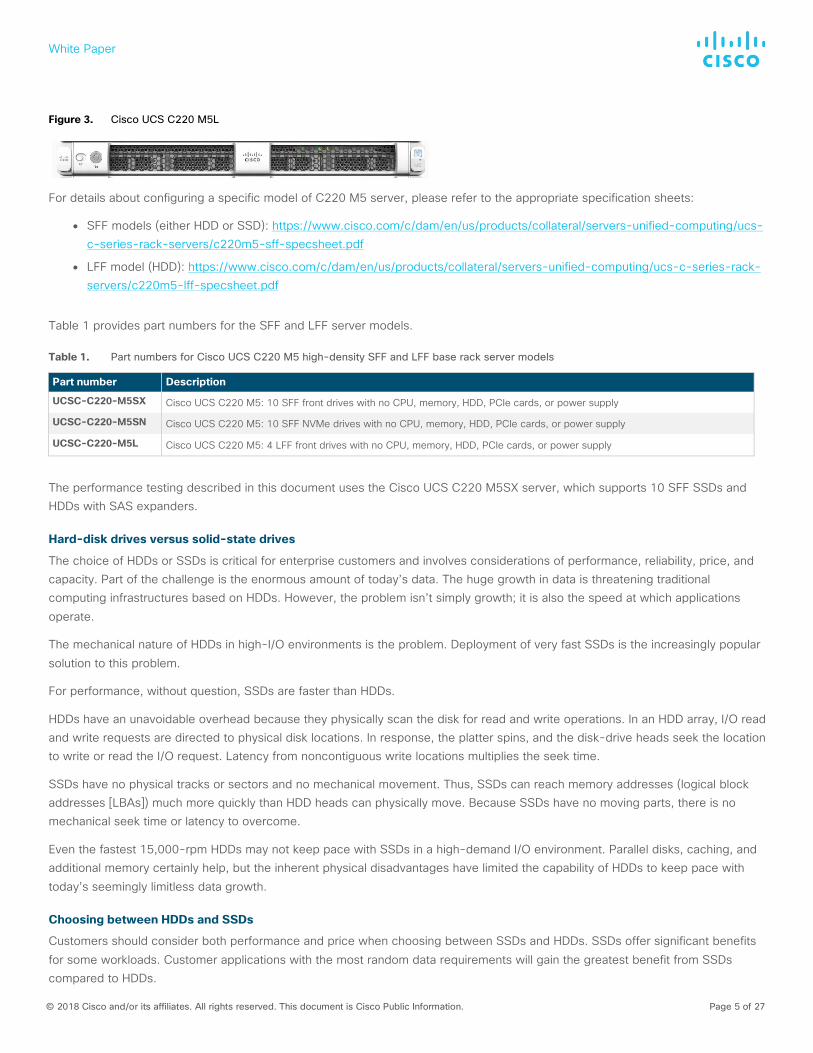
The Cisco UCS C220 M5SN SFF server (Figure 2) extends the capabilities of the Cisco UCS portfolio in a 1RU form factor with the addition of Intel Xeon Scalable processors, 24 DIMM slots for 2666-MHz DDR4 DIMMs and capacity points of up to 128 GB, up to 2 PCIe 3.0 slots, and up to 10 internal SFF NVMe drives. The C220 M5SN server is 10-drive NVMe only system.
Figure 2. Cisco UCS C220 M5SN
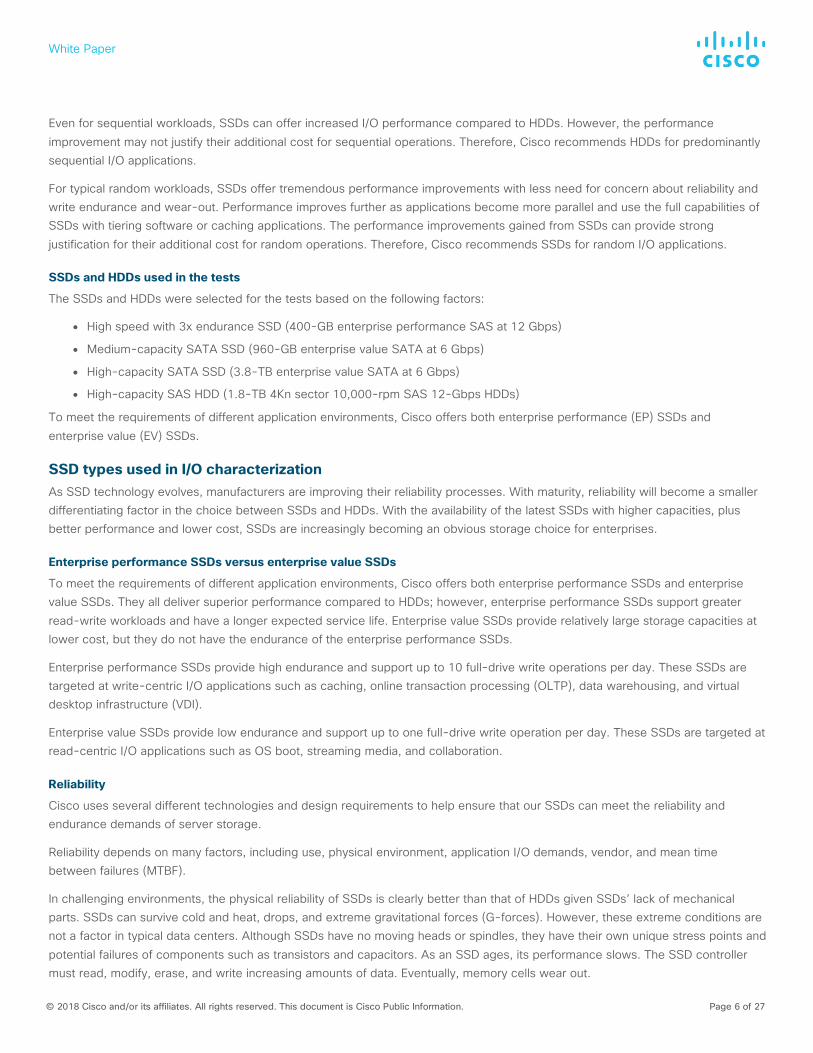
The Cisco UCS C220 M5 LFF server extends the capabilities of the Cisco UCS portfolio in a 1RU form factor with the addition of Intel Xeon Scalable processors, 24 DIMM slots for 2666-MHz DDR4 DIMMs and capacity points of up to 128 GB, up to 2 PCIe 3.0 slots, and up to 4 front-facing internal LFF drives. The C220 M5 LFF server also includes one dedicated internal slot for a 12-Gbps SAS storage controller card. Figure 3 shows the Cisco UCS C220 M5L model.
White Paper
© 2018 Cisco and/or its affiliates. All rights reserved. This document is Cisco Public Information. Page 5 of 27
Figure 3. Cisco UCS C220 M5L
For details about configuring a specific model of C220 M5 server, please refer to the appropriate specification sheets:
● SFF models (either HDD or SSD): https://www.cisco.com/c/dam/en/us/products/collateral/servers-unified-computing/ucs-c-series-rack-servers/c220m5-sff-specsheet.pdf
● LFF model (HDD): https://www.cisco.com/c/dam/en/us/products/collateral/servers-unified-computing/ucs-c-series-rack-servers/c220m5-lff-specsheet.pdf
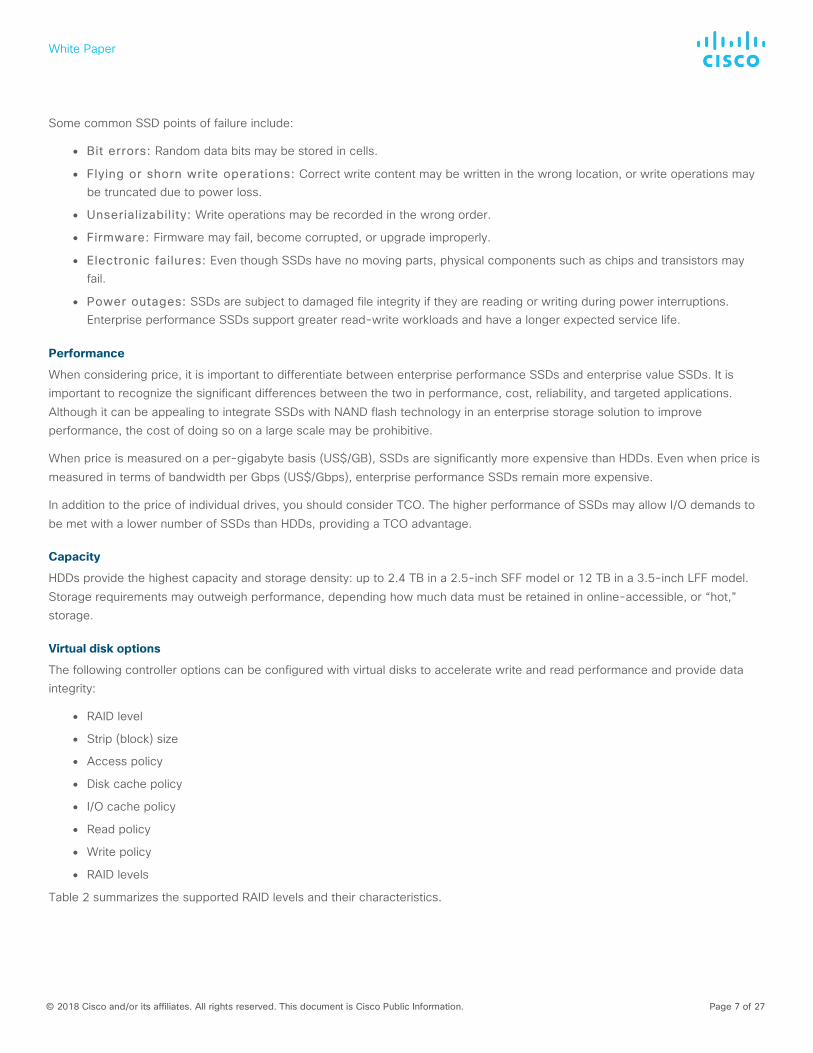
Table 1 provides part numbers for the SFF and LFF server models.
Table 1. Part numbers for Cisco UCS C220 M5 high-density SFF and LFF base rack server models
Part number Description
UCSC-C220-M5SX Cisco UCS C220 M5: 10 SFF front drives with no CPU, memory, HDD, PCIe cards, or power supply
UCSC-C220-M5SN Cisco UCS C220 M5: 10 SFF NVMe drives with no CPU, memory, HDD, PCIe cards, or power supply
UCSC-C220-M5L Cisco UCS C220 M5: 4 LFF front drives with no CPU, memory, HDD, PCIe cards, or power supply
The performance testing described in this document uses the Cisco UCS C220 M5SX server, which supports 10 SFF SSDs and HDDs with SAS expanders.
Hard-disk drives versus solid-state drives
The choice of HDDs or SSDs is critical for enterprise customers and involves considerations of performance, reliability, price, and capacity. Part of the challenge is the enormous amount of today’s data. The huge growth in data is threatening traditional computing infrastructures based on HDDs. However, the problem isn’t simply growth; it is also the speed at which applications operate.
The mechanical nature of HDDs in high-I/O environments is the problem. Deployment of very fast SSDs is the increasingly popular solution to this problem.
For performance, without question, SSDs are faster than HDDs.
HDDs have an unavoidable overhead because they physically scan the disk for read and write operations. In an HDD array, I/O read and write requests are directed to physical disk locations. In response, the platter spins, and the disk-drive heads seek the location to write or read the I/O request. Latency from noncontiguous write locations multiplies the seek time.
SSDs have no physical tracks or sectors and no mechanical movement. Thus, SSDs can reach memory addresses (logical block addresses [LBAs]) much more quickly than HDD heads can physically move. Because SSDs have no moving parts, there is no mechanical seek time or latency to overcome.
Even the fastest 15,000-rpm HDDs may not keep pace with SSDs in a high-demand I/O environment. Parallel disks, caching, and additional memory certainly help, but the inherent physical disadvantages have limited the capability of HDDs to keep pace with today’s seemingly limitless data growth.
Choosing between HDDs and SSDs
Customers should consider both performance and price when choosing between SSDs and HDDs. SSDs offer significant benefits for some workloads. Customer applications with the most random data requirements will gain the greatest benefit from SSDs compared to HDDs.
White Paper
© 2018 Cisco and/or its affiliates. All rights reserved. This document is Cisco Public Information. Page 6 of 27
Even for sequential workloads, SSDs can offer increased I/O performance compared to HDDs. However, the performance improvement may not justify their additional cost for sequential operations. Therefore, Cisco recommends HDDs for predominantly sequential I/O applications.
For typical random workloads, SSDs offer tremendous performance improvements with less need for concern about reliability and write endurance and wear-out. Performance improves further as applications become more parallel and use the full capabilities of SSDs with tiering software or caching applications. The performance improvements gained from SSDs can provide strong justification for their additional cost for random operations. Therefore, Cisco recommends SSDs for random I/O applications.
SSDs and HDDs used in the tests
The SSDs and HDDs were selected for the tests based on the following factors:
● High speed with 3x endurance SSD (400-GB enterprise performance SAS at 12 Gbps)
● Medium-capacity SATA SSD (960-GB enterprise value SATA at 6 Gbps)
● High-capacity SATA SSD (3.8-TB enterprise value SATA at 6 Gbps)
● High-capacity SAS HDD (1.8-TB 4Kn sector 10,000-rpm SAS 12-Gbps HDDs)
To meet the requirements of different application environments, Cisco offers both enterprise performance (EP) SSDs and enterprise value (EV) SSDs.
SSD types used in I/O characterization As SSD technology evolves, manufacturers are improving their reliability processes. With maturity, reliability will become a smaller differentiating factor in the choice between SSDs and HDDs. With the availability of the latest SSDs with higher capacities, plus better performance and lower cost, SSDs are increasingly becoming an obvious storage choice for enterprises.
Enterprise performance SSDs versus enterprise value SSDs
To meet the requirements of different application environments, Cisco offers both enterprise performance SSDs and enterprise value SSDs. They all deliver superior performance compared to HDDs; however, enterprise performance SSDs support greater read-write workloads and have a longer expected service life. Enterprise value SSDs provide relatively large storage capacities at lower cost, but they do not have the endurance of the enterprise performance SSDs.
Enterprise performance SSDs provide high endurance and support up to 10 full-drive write operations per day. These SSDs are targeted at write-centric I/O applications such as caching, online transaction processing (OLTP), data warehousing, and virtual desktop infrastructure (VDI).
Enterprise value SSDs provide low endurance and support up to one full-drive write operation per day. These SSDs are targeted at read-centric I/O applications such as OS boot, streaming media, and collaboration.
Reliability
Cisco uses several different technologies and design requirements to help ensure that our SSDs can meet the reliability and endurance demands of server storage.
Reliability depends on many factors, including use, physical environment, application I/O demands, vendor, and mean time between failures (MTBF).
In challenging environments, the physical reliability of SSDs is clearly better than that of HDDs given SSDs’ lack of mechanical parts. SSDs can survive cold and heat, drops, and extreme gravitational forces (G-forces). However, these extreme conditions are not a factor in typical data centers. Although SSDs have no moving heads or spindles, they have their own unique stress points and potential failures of components such as transistors and capacitors. As an SSD ages, its performance slows. The SSD controller must read, modify, erase, and write increasing amounts of data. Eventually, memory cells wear out.
White Paper
© 2018 Cisco and/or its affiliates. All rights reserved. This document is Cisco Public Information. Page 7 of 27
Some common SSD points of failure include:
● Bit errors: Random data bits may be stored in cells.
● Flying or shorn write operations: Correct write content may be written in the wrong location, or write operations may be truncated due to power loss.
● Unserial izabil i ty: Write operations may be recorded in the wrong order.
● Firmware: Firmware may fail, become corrupted, or upgrade improperly.
● Electronic fai lures: Even though SSDs have no moving parts, physical components such as chips and transistors may fail.
● Power outages: SSDs are subject to damaged file integrity if they are reading or writing during power interruptions. Enterprise performance SSDs support greater read-write workloads and have a longer expected service life.
Performance
When considering price, it is important to differentiate between enterprise performance SSDs and enterprise value SSDs. It is important to recognize the significant differences between the two in performance, cost, reliability, and targeted applications. Although it can be appealing to integrate SSDs with NAND flash technology in an enterprise storage solution to improve performance, the cost of doing so on a large scale may be prohibitive.
When price is measured on a per-gigabyte basis (US$/GB), SSDs are significantly more expensive than HDDs. Even when price is measured in terms of bandwidth per Gbps (US$/Gbps), enterprise performance SSDs remain more expensive.
In addition to the price of individual drives, you should consider TCO. The higher performance of SSDs may allow I/O demands to be met with a lower number of SSDs than HDDs, providing a TCO advantage.
Capacity
HDDs provide the highest capacity and storage density: up to 2.4 TB in a 2.5-inch SFF model or 12 TB in a 3.5-inch LFF model. Storage requirements may outweigh performance, depending how much data must be retained in online-accessible, or “hot,” storage.
Virtual disk options
The following controller options can be configured with virtual disks to accelerate write and read performance and provide data integrity:
● RAID level
● Strip (block) size
● Access policy
● Disk cache policy
● I/O cache policy
● Read policy
● Write policy
● RAID levels
Table 2 summarizes the supported RAID levels and their characteristics.
White Paper
© 2018 Cisco and/or its affiliates. All rights reserved. This document is Cisco Public Information. Page 8 of 27
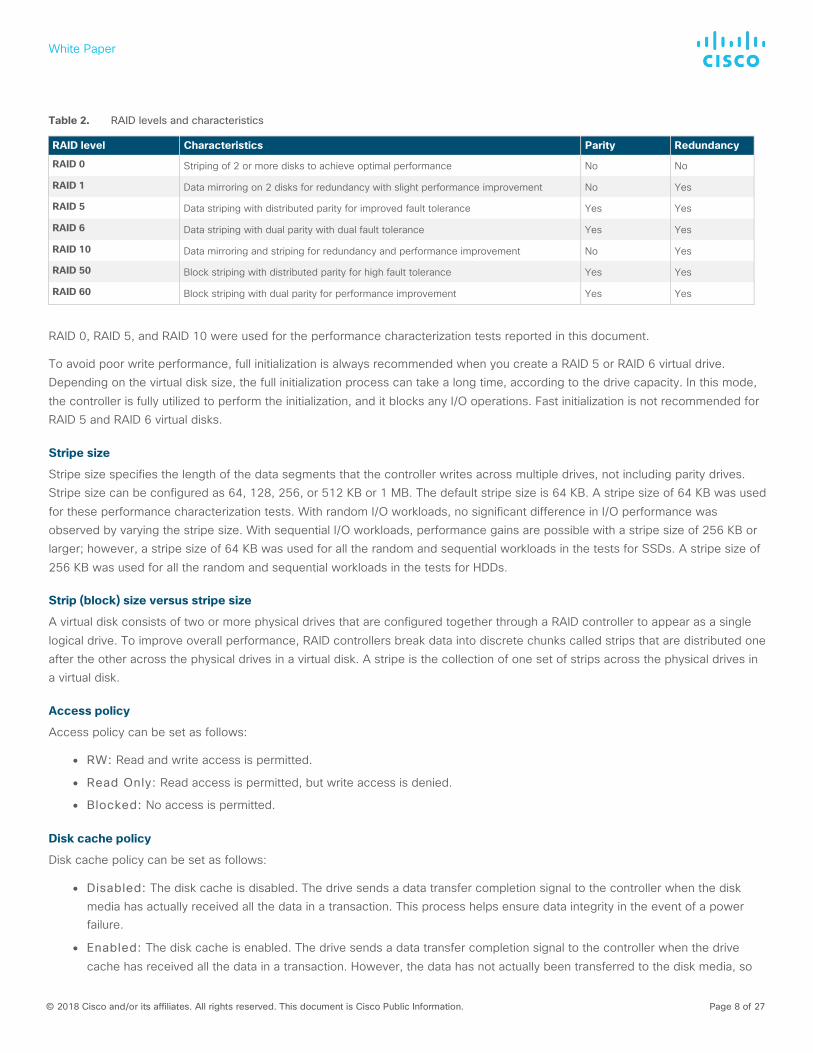
Table 2. RAID levels and characteristics
RAID level Characteristics Parity Redundancy
RAID 0 Striping of 2 or more disks to achieve optimal performance No No
RAID 1 Data mirroring on 2 disks for redundancy with slight performance improvement No Yes
RAID 5 Data striping with distributed parity for improved fault tolerance Yes Yes
RAID 6 Data striping with dual parity with dual fault tolerance Yes Yes
RAID 10 Data mirroring and striping for redundancy and performance improvement No Yes
RAID 50 Block striping with distributed parity for high fault tolerance Yes Yes
RAID 60 Block striping with dual parity for performance improvement Yes Yes
RAID 0, RAID 5, and RAID 10 were used for the performance characterization tests reported in this document.
To avoid poor write performance, full initialization is always recommended when you create a RAID 5 or RAID 6 virtual drive. Depending on the virtual disk size, the full initialization process can take a long time, according to the drive capacity. In this mode, the controller is fully utilized to perform the initialization, and it blocks any I/O operations. Fast initialization is not recommended for RAID 5 and RAID 6 virtual disks.
Stripe size
Stripe size specifies the length of the data segments that the controller writes across multiple drives, not including parity drives. Stripe size can be configured as 64, 128, 256, or 512 KB or 1 MB. The default stripe size is 64 KB. A stripe size of 64 KB was used for these performance characterization tests. With random I/O workloads, no significant difference in I/O performance was observed by varying the stripe size. With sequential I/O workloads, performance gains are possible with a stripe size of 256 KB or larger; however, a stripe size of 64 KB was used for all the random and sequential workloads in the tests for SSDs. A stripe size of 256 KB was used for all the random and sequential workloads in the tests for HDDs.
Strip (block) size versus stripe size
A virtual disk consists of two or more physical drives that are configured together through a RAID controller to appear as a single logical drive. To improve overall performance, RAID controllers break data into discrete chunks called strips that are distributed one after the other across the physical drives in a virtual disk. A stripe is the collection of one set of strips across the physical drives in a virtual disk.
Access policy
Access policy can be set as follows:
● RW: Read and write access is permitted.
● Read Only: Read access is permitted, but write access is denied.
● Blocked: No access is permitted.
Disk cache policy
Disk cache policy can be set as follows:
● Disabled: The disk cache is disabled. The drive sends a data transfer completion signal to the controller when the disk media has actually received all the data in a transaction. This process helps ensure data integrity in the event of a power failure.
● Enabled: The disk cache is enabled. The drive sends a data transfer completion signal to the controller when the drive cache has received all the data in a transaction. However, the data has not actually been transferred to the disk media, so

White Paper
© 2018 Cisco and/or its affiliates. All rights reserved. This document is Cisco Public Information. Page 9 of 27
data may be permanently lost if a power failure occurs. Although disk caching can accelerate I/O performance, it is not recommended for enterprise deployments.
I/O cache policy
I/O cache policy can be set as follows:
● Direct: All read data is transferred directly to host memory, bypassing the RAID controller cache. Any read-ahead data is cached. All write data is transferred directly from host memory, bypassing the RAID controller cache if Write Through cache mode is set. The Direct policy is recommended for all configurations.
● Cached: All read and write data passes through the controller cache memory on its way to or from host memory. Subsequent read requests for the same data can then be addressed from the controller cache. Note that “cached I/O” refers to the caching of read data, and “read ahead” refers to the caching of speculative future read data.
Read policy
Read policy can be set as follows:
● No Read Ahead (Normal Read): Only the requested data is read, and the controller does not read ahead any data.
● Always Read Ahead: The controller reads sequentially ahead of requested data and stores the additional data in cache memory, anticipating that the data will be needed soon.
Write policy
Write policy can be set as follows:
● Write Through: Data is written directly to the disks. The controller sends a data transfer completion signal to the host when the drive subsystem has received all the data in a transaction.
● Write Back: Data is first written to the controller cache memory, and then the acknowledgment is sent to the host. Data is written to the disks when the commit operation occurs at the controller cache. The controller sends a data transfer completion signal to the host when the controller cache has received all the data in a transaction.
● Write Back with Battery Backup Unit (BBU): Battery backup is used to provide data integrity protection in the event of a power failure. Battery backup is always recommended for enterprise deployments.
Workload characterization This section provides an overview of the specific access patterns used in the performance tests.
Table 3 lists the workload types tested.
Table 3. Workload types
Workload type RAID type Access pattern type Read:write (%)
OLTP 5 Random 70:30
Decision-support system (DSS), business intelligence, and video on demand (VoD) 5 Sequential 100:0
Database logging 10 Sequential 0:100
High-performance computing (HPC) 5 Random and sequential 50:50
Digital video surveillance 10 Sequential 10:90
Big data: Hadoop 0 Sequential 90:10
Apache Cassandra 0 Sequential 60:40
VDI: Boot process 5 Random 80:20
VDI: Steady state 5 Random 20:80
White Paper
© 2018 Cisco and/or its affiliates. All rights reserved. This document is Cisco Public Information. Page 10 of 27
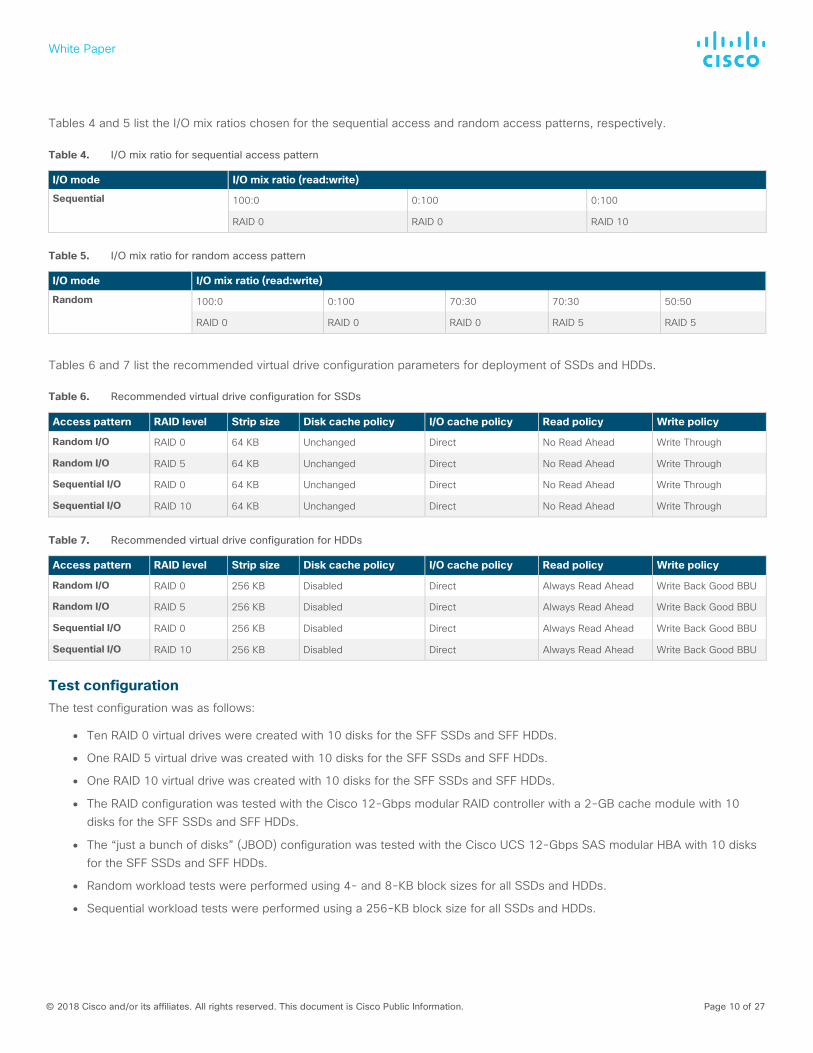
Tables 4 and 5 list the I/O mix ratios chosen for the sequential access and random access patterns, respectively.
Table 4. I/O mix ratio for sequential access pattern
I/O mode I/O mix ratio (read:write)
Sequential 100:0 0:100 0:100
RAID 0 RAID 0 RAID 10
Table 5. I/O mix ratio for random access pattern
I/O mode I/O mix ratio (read:write)
Random 100:0 0:100 70:30 70:30 50:50
RAID 0 RAID 0 RAID 0 RAID 5 RAID 5
Tables 6 and 7 list the recommended virtual drive configuration parameters for deployment of SSDs and HDDs.
Table 6. Recommended virtual drive configuration for SSDs
Access pattern RAID level Strip size Disk cache policy I/O cache policy Read policy Write policy
Random I/O RAID 0 64 KB Unchanged Direct No Read Ahead Write Through
Random I/O RAID 5 64 KB Unchanged Direct No Read Ahead Write Through
Sequential I/O RAID 0 64 KB Unchanged Direct No Read Ahead Write Through
Sequential I/O RAID 10 64 KB Unchanged Direct No Read Ahead Write Through
Table 7. Recommended virtual drive configuration for HDDs
Access pattern RAID level Strip size Disk cache policy I/O cache policy Read policy Write policy
Random I/O RAID 0 256 KB Disabled Direct Always Read Ahead Write Back Good BBU
Random I/O RAID 5 256 KB Disabled Direct Always Read Ahead Write Back Good BBU
Sequential I/O RAID 0 256 KB Disabled Direct Always Read Ahead Write Back Good BBU
Sequential I/O RAID 10 256 KB Disabled Direct Always Read Ahead Write Back Good BBU
Test configuration The test configuration was as follows:
● Ten RAID 0 virtual drives were created with 10 disks for the SFF SSDs and SFF HDDs.
● One RAID 5 virtual drive was created with 10 disks for the SFF SSDs and SFF HDDs.
● One RAID 10 virtual drive was created with 10 disks for the SFF SSDs and SFF HDDs.
● The RAID configuration was tested with the Cisco 12-Gbps modular RAID controller with a 2-GB cache module with 10 disks for the SFF SSDs and SFF HDDs.
● The “just a bunch of disks” (JBOD) configuration was tested with the Cisco UCS 12-Gbps SAS modular HBA with 10 disks for the SFF SSDs and SFF HDDs.
● Random workload tests were performed using 4- and 8-KB block sizes for all SSDs and HDDs.
● Sequential workload tests were performed using a 256-KB block size for all SSDs and HDDs.

White Paper
© 2018 Cisco and/or its affiliates. All rights reserved. This document is Cisco Public Information. Page 11 of 27
Table 8 lists the recommended Iometer settings.
Table 8. Recommended Iometer settings
Name Value
Iometer version Release 1.1.0
Run time 30 minutes per access specifications
Ramp-up time 10 seconds for random I/O; 20 seconds for sequential I/O
Record results All
Number of workers 10 workers for random I/O (equal to the number of SSDs or HDDs); 1 worker for sequential I/O
Write I/O data pattern Repeating bytes
Transfer delay 1 I/O operation
Align I/O on Request size boundaries
Reply size No reply
Note: The SSDs and HDDs were tested with various numbers of outstanding I/O operations to get the best performance within an acceptable response time.
SSD performance results Performance data was obtained using the Iometer measurement tool, with analysis based on the IOPS rate for random I/O workloads and on MBps throughput for sequential I/O workloads. From this analysis, specific recommendations can be made for storage configuration parameters.
The recommendations reflect the I/O performance of 400-GB 12-Gbps SAS enterprise performance drives with 3x endurance, 3.8-TB 6-Gbps SATA enterprise value SSDs, and 960-GB 6-Gbps SATA enterprise value SSDs used in these comparison tests. The server specifications and BIOS settings used in these performance characterization tests are detailed in the appendix, “Test environment.”
The I/O performance test results capture the maximum read IOPS rate and bandwidth achieved with the SSDs within the acceptable response time (latency) of 2 milliseconds (ms). However, the SSDs under test are capable of a much higher IOPS rate and much greater bandwidth with higher latency.
Note: All the performance metrics presented in this document have been tested with BIOS microcode updates from Intel with the fix for the Spectre Variant 2 issue.
SSD RAID 0 performance for 10-disk configuration
Figure 4 shows the performance of the SSDs under test with a RAID 0 configuration with a 100 percent random read access pattern. The graph shows the comparative performance values achieved for enterprise performance drives and enterprise value drives to help customers understand the performance trade-off when choosing an SSD type. The graph shows that the 400-GB enterprise performance drive provides better performance at the 4-KB block size. Latency is the time taken to complete a single I/O request from the application’s viewpoint.

White Paper
© 2018 Cisco and/or its affiliates. All rights reserved. This document is Cisco Public Information. Page 12 of 27
Figure 4. Random read 100%
Figure 5 shows the performance of the SSDs under test for a RAID 0 configuration with a 100 percent random write access pattern. The numbers in the graph show that for all SSDs the IOPS rate for the 4- and 8-KB block sizes is well over 100,000, and that the 400-GB 12-Gbps SAS SSD provides better performance.
Figure 5. Random write 100%
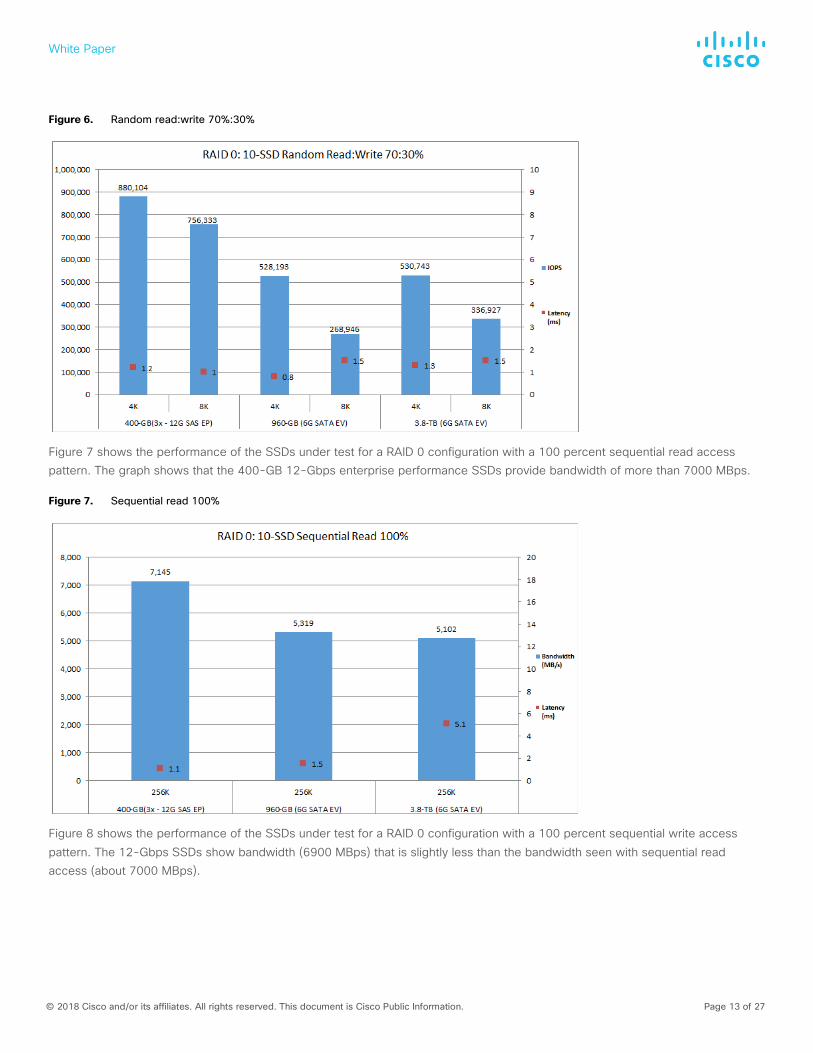
Figure 6 shows the performance of the SSDs under test for a RAID 0 configuration with a 70 percent random read and 30 percent random write access pattern. The numbers in the graph affirm that for all SSDs the IOPS rate for the 4-KB block sizes is well over 500,000.
White Paper
© 2018 Cisco and/or its affiliates. All rights reserved. This document is Cisco Public Information. Page 13 of 27
Figure 6. Random read:write 70%:30%
Figure 7 shows the performance of the SSDs under test for a RAID 0 configuration with a 100 percent sequential read access pattern. The graph shows that the 400-GB 12-Gbps enterprise performance SSDs provide bandwidth of more than 7000 MBps.
Figure 7. Sequential read 100%
Figure 8 shows the performance of the SSDs under test for a RAID 0 configuration with a 100 percent sequential write access pattern. The 12-Gbps SSDs show bandwidth (6900 MBps) that is slightly less than the bandwidth seen with sequential read access (about 7000 MBps).

White Paper
© 2018 Cisco and/or its affiliates. All rights reserved. This document is Cisco Public Information. Page 14 of 27
Figure 8. Sequential write 100%
SSD RAID 5 performance for 10-disk configuration
Figure 9 shows the performance of the SSDs under test for a RAID 5 configuration with a 70 percent random read and 30 percent random write access pattern. The numbers in the graph show that for the given SSDs the IOPS rate is well over 200,000.
Figure 9. Random read:write 70%:30%
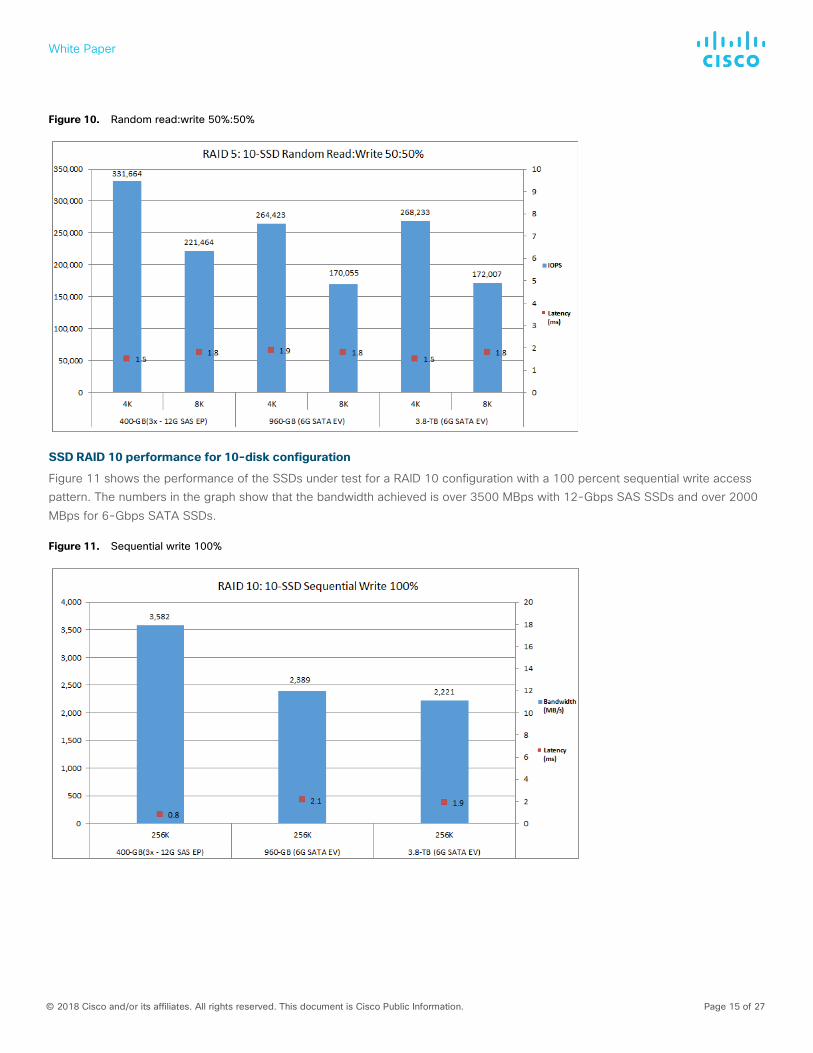
Figure 10 shows the performance of the SSDs under test for a RAID 5 configuration with a 50 percent random read and 50 percent random write access pattern. The graph shows that for the given SSDs the IOPS rate is well over 150,000.
White Paper
© 2018 Cisco and/or its affiliates. All rights reserved. This document is Cisco Public Information. Page 15 of 27
Figure 10. Random read:write 50%:50%
SSD RAID 10 performance for 10-disk configuration
Figure 11 shows the performance of the SSDs under test for a RAID 10 configuration with a 100 percent sequential write access pattern. The numbers in the graph show that the bandwidth achieved is over 3500 MBps with 12-Gbps SAS SSDs and over 2000 MBps for 6-Gbps SATA SSDs.
Figure 11. Sequential write 100%

White Paper
© 2018 Cisco and/or its affiliates. All rights reserved. This document is Cisco Public Information. Page 16 of 27
SSD JBOD performance for 10-disk configuration
The I/O performance characterization tests include JBOD pass-through controller configuration results because some software-defined storage solutions use JBOD storage. JBOD storage provides better control over individual disks. This storage type is robust and inexpensive and allows you to use all the disk space (it has no RAID requirements; all storage is pass-through). Availability is assured through replication. JBOD setups are becoming popular in scale-out environments because they can provide pooled storage effectively.
The tests used the Cisco 12-Gbps modular SAS HBA (UCSC-SAS-M5) for JBOD. The JBOD performance tests used 10 disks for the SSD and HDD configurations.
Figure 12 shows the performance of the SSDs under test for a JBOD configuration with a 100 percent random read access pattern. The graph shows the comparative performance values achieved for enterprise performance drives and enterprise value drives to help customers understand the performance trade-off when choosing an SSD type for a JBOD configuration. The graph shows that the 400-GB 12-Gbps SAS SSD at the 4-KB block size can achieve well over 900,000 IOPS.
Figure 12. Random read 100%
Figure 13 shows the performance of the SSDs under test for a JBOD configuration with a 100 percent random write access pattern. The numbers in the graph show that for 400-GB 12-Gbps SAS SSDs the IOPS rate for the 4-KB block size is well over 750,000.

White Paper
© 2018 Cisco and/or its affiliates. All rights reserved. This document is Cisco Public Information. Page 17 of 27
Figure 13. Random write 100%
Figure 14 shows the performance of the SSDs under test for a JBOD configuration with a 70 percent random read and 30 percent random write access pattern. The numbers in the graph show that for the given configuration the IOPS rate for the 4-KB block size is greater than 500,000 for all the SSDs.
Figure 14. Random read:write 70%:30%
Figure 15 shows the performance of the SSDs under test for a JBOD configuration with a 100 percent sequential read access pattern. The graph shows that the 400-GB 12-Gbps enterprise value SAS SSDs provide performance of 7000 MBps.

White Paper
© 2018 Cisco and/or its affiliates. All rights reserved. This document is Cisco Public Information. Page 18 of 27
Figure 15. Sequential read 100%
Figure 16 shows the performance of the SSDs under test for a JBOD configuration with a 100 percent sequential write access pattern. The graph shows that the 400-GB 12-Gbps enterprise value SAS SSDs provide bandwidth of about 6700 MBps.
Figure 16. Sequential write 100%
HDD performance results Figures 17 through 26 were prepared from Iometer measurement data. They illustrate the I/O performance of 1.8-TB SFF 12-Gbps SAS HDDs. The server specifications and BIOS settings used in these performance characterization tests are detailed in the appendix, “Test environment.”
The I/O performance test results capture the maximum IOPS and bandwidth achieved with the HDDs within the acceptable response time (latency) of 20 ms. These drives are capable of delivering more IOPS and bandwidth with greater queue depths and latency.
White Paper
© 2018 Cisco and/or its affiliates. All rights reserved. This document is Cisco Public Information. Page 19 of 27
SFF HDD RAID 0 performance for 10-disk configuration
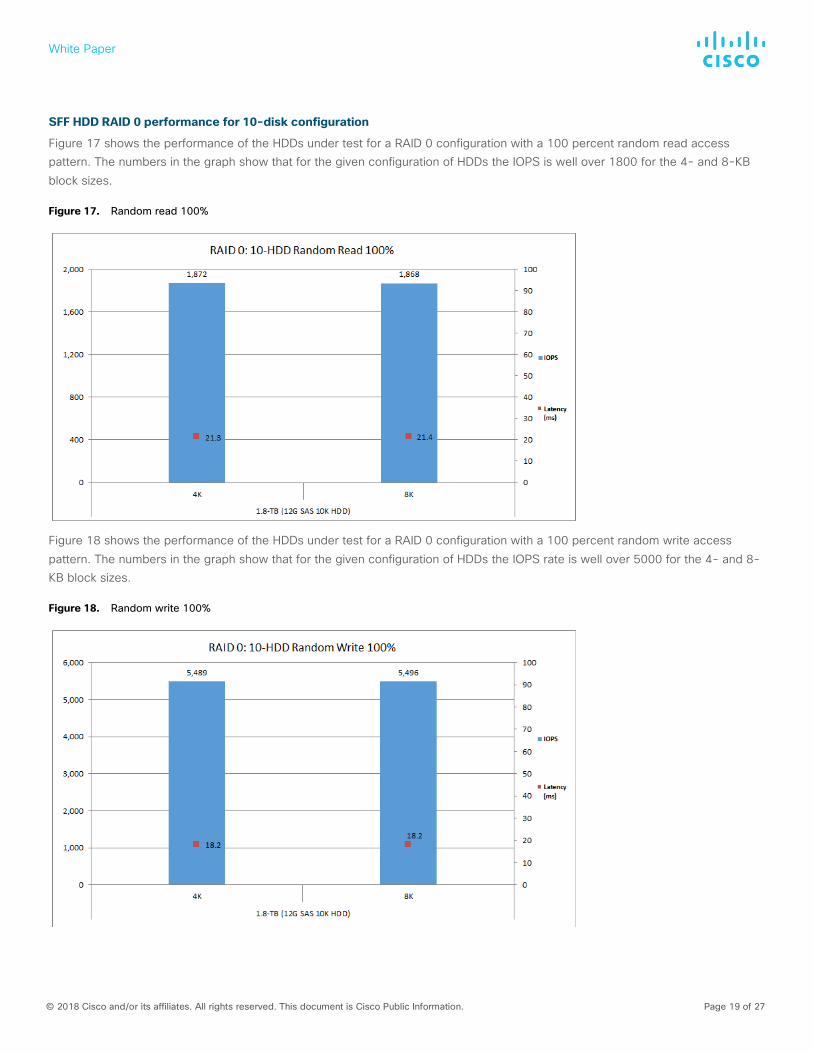
Figure 17 shows the performance of the HDDs under test for a RAID 0 configuration with a 100 percent random read access pattern. The numbers in the graph show that for the given configuration of HDDs the IOPS is well over 1800 for the 4- and 8-KB block sizes.
Figure 17. Random read 100%
Figure 18 shows the performance of the HDDs under test for a RAID 0 configuration with a 100 percent random write access pattern. The numbers in the graph show that for the given configuration of HDDs the IOPS rate is well over 5000 for the 4- and 8-KB block sizes.
Figure 18. Random write 100%

White Paper
© 2018 Cisco and/or its affiliates. All rights reserved. This document is Cisco Public Information. Page 20 of 27
Figure 19 shows the performance of the HDDs under test for a RAID 0 configuration with a 70 percent random read and 30 percent random write access pattern. The numbers in the graph show that for the given configuration of HDDs the IOPS rate for the 4- and 8-KB block sizes is well over 2000.
Figure 19. Random read:write 70:30%
Figure 20 shows the performance of the HDDs under test for a RAID 0 configuration with a 100 percent sequential read access pattern. The numbers in the graph show that for the given configuration of HDDs the bandwidth is well over 2000 MBps.
Figure 20. Sequential read and write 100%
White Paper
© 2018 Cisco and/or its affiliates. All rights reserved. This document is Cisco Public Information. Page 21 of 27
SFF HDD RAID 5 performance for 10-disk configuration
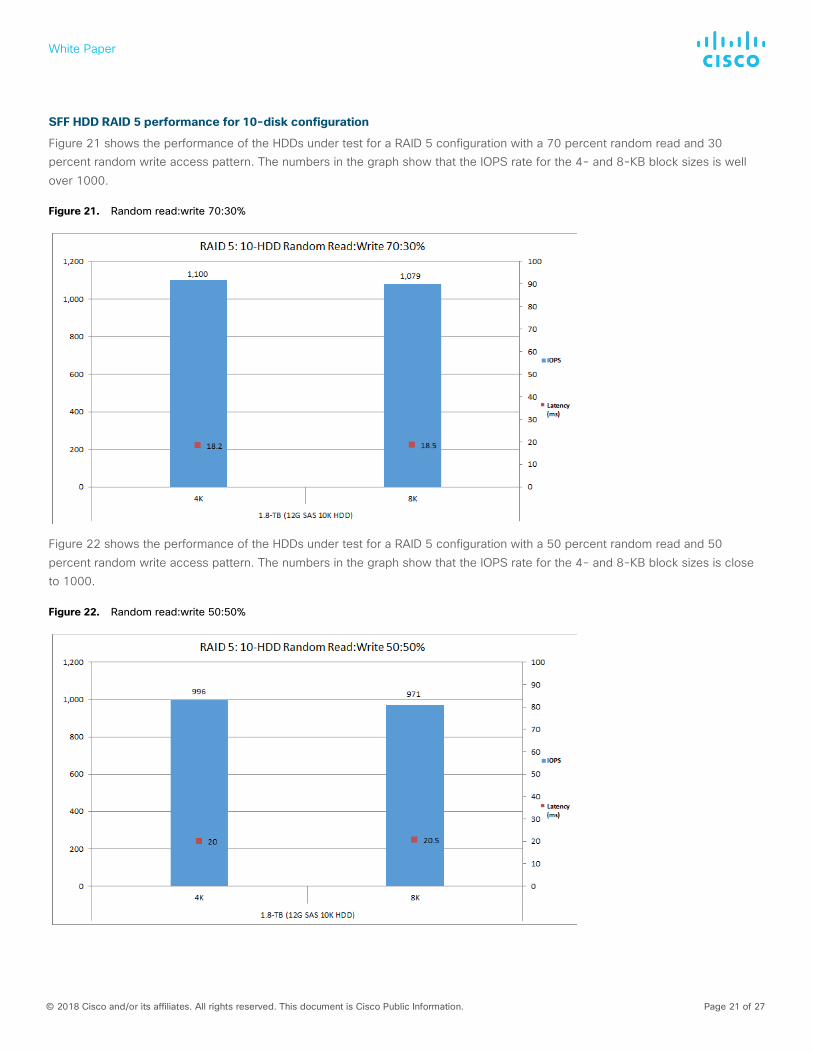
Figure 21 shows the performance of the HDDs under test for a RAID 5 configuration with a 70 percent random read and 30 percent random write access pattern. The numbers in the graph show that the IOPS rate for the 4- and 8-KB block sizes is well over 1000.
Figure 21. Random read:write 70:30%
Figure 22 shows the performance of the HDDs under test for a RAID 5 configuration with a 50 percent random read and 50 percent random write access pattern. The numbers in the graph show that the IOPS rate for the 4- and 8-KB block sizes is close to 1000.
Figure 22. Random read:write 50:50%

White Paper
© 2018 Cisco and/or its affiliates. All rights reserved. This document is Cisco Public Information. Page 22 of 27
SFF HDD RAID 10 performance for 10-disk configuration
Figure 23 shows the performance of the HDDs under test for a RAID 10 configuration with a 100 percent sequential read and write access pattern. The numbers in the graph show that the bandwidth is about 1200 MBps for 12-Gbps 10,000-rpm SAS HDDs.
Figure 23. Sequential read and write 100%
SFF HDD JBOD performance for 10-disk configuration
Figure 24 shows the performance of the HDDs under test for a JBOD configuration with a 100 percent random read access pattern. The numbers in the graph show that for the given configuration of HDDs the IOPS rate is 1800 for the 4- and 8-KB block sizes.
Figure 24. Random read 100%
White Paper
© 2018 Cisco and/or its affiliates. All rights reserved. This document is Cisco Public Information. Page 23 of 27
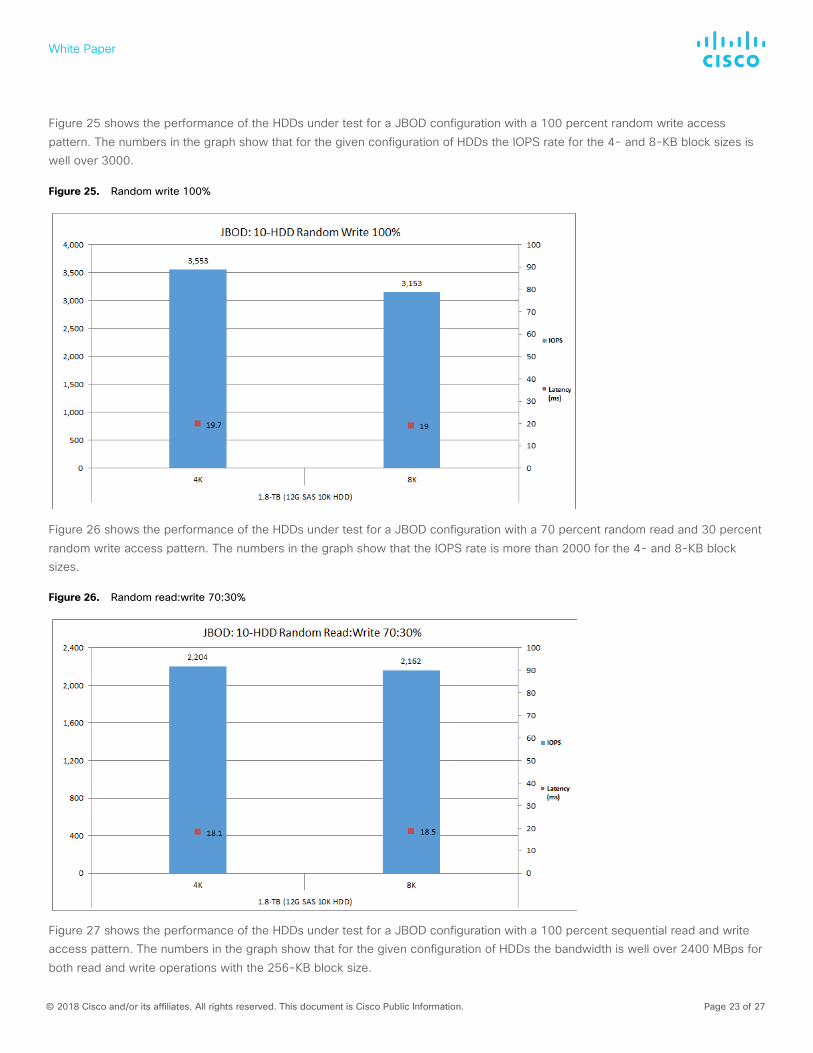
Figure 25 shows the performance of the HDDs under test for a JBOD configuration with a 100 percent random write access pattern. The numbers in the graph show that for the given configuration of HDDs the IOPS rate for the 4- and 8-KB block sizes is well over 3000.
Figure 25. Random write 100%
Figure 26 shows the performance of the HDDs under test for a JBOD configuration with a 70 percent random read and 30 percent random write access pattern. The numbers in the graph show that the IOPS rate is more than 2000 for the 4- and 8-KB block sizes.
Figure 26. Random read:write 70:30%
Figure 27 shows the performance of the HDDs under test for a JBOD configuration with a 100 percent sequential read and write access pattern. The numbers in the graph show that for the given configuration of HDDs the bandwidth is well over 2400 MBps for both read and write operations with the 256-KB block size.

White Paper
© 2018 Cisco and/or its affiliates. All rights reserved. This document is Cisco Public Information. Page 24 of 27
Figure 27. Sequential read and write 100%
For more information For additional information, see https://www.cisco.com/c/en/us/products/collateral/servers-unified-computing/ucs-c-series-rack-servers/datasheet-c78-739281.html.
Appendix: Test environment Table 9 lists the details of the server under test.
Table 9. Server properties
Name Value
Product name Cisco UCS C220 M5SX
CPU CPU: 2 x 2.10-GHz Intel Xeon Gold 6130
Number of cores 16
Number of threads 32
Total memory 192 GB
Memory DIMMs (12) 16 GB x 12 DIMM channels
Memory speed 2666 MHz
Network controller Cisco LOM X550-T2; 2 x 10-Gbps interfaces
VIC adapter Cisco UCS VIC 1387 mLOM 10-Gbps SFP+
RAID controller Cisco 12-Gbps modular RAID controller with 2-GB flash-backed write cache (FBWC; UCSC-RAID-M5)
● Cisco 12-Gbps modular SAS HBA (UCSC-SAS-M5)
SFF SSDs ● 400-GB 2.5-inch enterprise performance 12-Gbps SAS SSD (UCS-SD400G123X-EP)
● 3.8-TB 2.5-inch enterprise value 6-Gbps SATA SSD (UCS-SD38T6I1X-EV)
● 960-GB 2.5-inch enterprise value 6-Gbps SATA SSD (UCS-SD960G61X-EV)
SFF HDDs ● 1.8-TB 12-Gbps SAS 10,000-rpm (4-K native [4-Kn] sector) SFF HDD (UCS-HD18TB10K4KN)

White Paper
© 2018 Cisco and/or its affiliates. All rights reserved. This document is Cisco Public Information. Page 25 of 27
Table 10 lists the recommended server BIOS settings for a standalone Cisco UCS C220 M5 rack server.
Table 10. BIOS settings for standalone rack server
Name Value
BIOS version Release C220M5.3.1.3d
Cisco Integrated Management Controller (IMC) version Release 3.1(3a)
Cores enabled All
Intel Hyper-Threading Technology (All) Enable
Execute disable bit Enable
Intel Virtualization Technology (VT) Enable
Hardware prefetcher Enable
Adjacent-cache-line prefetcher Enable
Data cache unit (DCU) streamer Enable
DCU IP prefetcher Enable
Extended Cisco Application Policy Infrastructure Controller (APIC) Disable
Non-uniform memory access (NUMA) Enable
Sub Numa Clustering (SNC) Enable
IMC interleaving 1-way interleave
Mirror mode Disable
Patrol scrub Disable
Intel VT for Directed I/O (VT-d) Enable
Interrupt remapping Enable
Pass-through direct memory access (DMA) Disable
Address Translation Services (ATS) Enable
Posted interrupt Enable
Coherency support Disable
Intel SpeedStep Technology (P-states) Enable
Enhanced Intel SpeedStep Technology (EIST) PSD function HW_ALL
Boot performance mode Maximum performance
Energy-efficient Intel Turbo Disable
Intel Turbo mode Enable
Hardware P-states Native mode
Enhanced Performance Profile (EPP) profile Balanced performance
Autonomous core Disable
CPU C6 report Disable
Enhanced halt state (C1E) Disable
OS Advanced Configuration and Power Interface (ACPI) Cx-state ACPI C2
Package C-state C0/C1 state
Power performance tuning OS controls EPB
PECI PCB EPB OS controls EPB
Workload configuration Balanced

White Paper
© 2018 Cisco and/or its affiliates. All rights reserved. This document is Cisco Public Information. Page 26 of 27
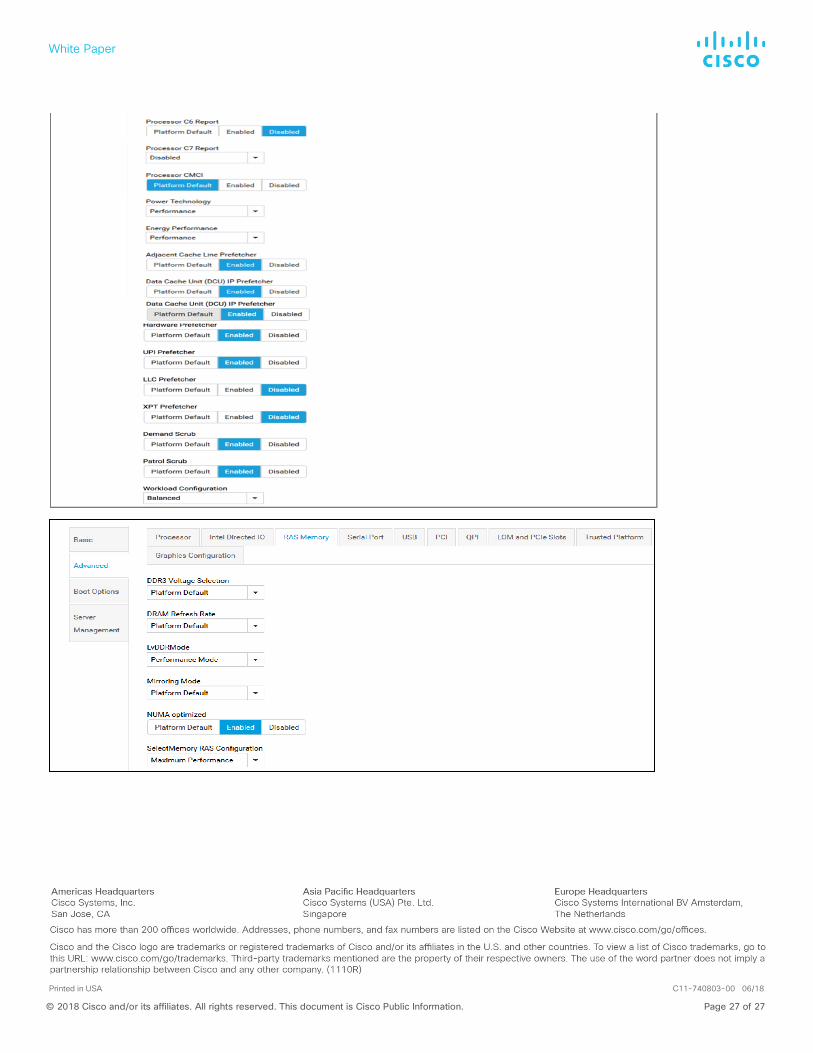
Figure 28 shows the recommended server BIOS settings for a Cisco UCS C220 M5 rack server managed by Cisco UCS.
Figure 28. BIOS settings for rack server managed by Cisco UCS
White Paper
© 2018 Cisco and/or its affiliates. All rights reserved. This document is Cisco Public Information. Page 27 of 27
Printed in USA C11-740803-00 06/18