Embed Size (px)
Citation preview
Masthead LogoFordham University
DigitalResearch@Fordham
Chemistry Faculty Publications Chemistry
1999
Circulation and energy metabolism in the brain /Donald D. Clarke and Louis SokoloffDonald Dudley Clarke PhDFordham University, [email protected]
Louis Sokoloff
Follow this and additional works at: https://fordham.bepress.com/chem_facultypubs
Part of the Biochemistry Commons
This Article is brought to you for free and open access by the Chemistry at DigitalResearch@Fordham. It has been accepted for inclusion in ChemistryFaculty Publications by an authorized administrator of DigitalResearch@Fordham. For more information, please contact [email protected].
Recommended CitationClarke, Donald Dudley PhD and Sokoloff, Louis, "Circulation and energy metabolism in the brain / Donald D. Clarke and LouisSokoloff " (1999). Chemistry Faculty Publications. 81.https://fordham.bepress.com/chem_facultypubs/81
F
C H A P T E R
Circulation and Ene,rgy Metabolism of the Brain
Donald D. Clarke and Louis Sokoloff
INTERMEDIARY METABOLISM 638 ATP production in brain is highly regulated 638 Glycogen is a dynamic but limited energy store in
brain 639 Brain glycolysis is regulated mainly by hexokinase
and phosphof ructokinase 641 The pyruvate dehydrogenase complex plays a key
role in regulating oxidation 644 Energy output and oxygen consumption are
associated with high rates of enzyme activity in t he Krebs cycle 644
The pentose shunt, also termed the hexose monophosphate pathway, is active in brain 645
Glutamate in brain is compartmented into separate pools 645
DIFFERENCES BETWEEN IN VITRO AND IN VIVO BRAIN METABOLISM 646 In contrast to cells of other tissues. individual
nerve cel ls do not function autonomously 647 The blood-brain barrier selectively limits the rates
of t ransfer of soluble substances between blood and brain 647
CEREBRAL ENERGY METABOLISM IN VIVO 647 Behavioral and central nervous system physiology
are correlated with blood and cerebrospinal f luid chemica l changes 647
Brain samples are removed for biochemical analyses 648
Radioisotope incorporation can identify and measure routes of metabolism 648
Oxygen utilization in the cortex is measured by polarographic techniques 648
Arteriovenous differences identify substances consumed or produced by brain 648
Combining cerebral blood flow and arteriovenous differences permits measurement of rates of consumption or production of substances by brain 649
REGULATION OF CEREBRAL METABOLIC RATE 6SO The brain consumes about one-fifth of total body
oxygen utilization 650 The main energy-demanding functions of the
brain are those of ion flux related to excitation and conduction 651
Continuous cerebral circulation is absolutely required to provide sufficient oxygen 651
Local rates of cerebral blood flow and metabolism can be measured by autoradiography and are coupled to local brain function 652
Basic Neurochemistry: Molecular, Cellular and Medical Aspects, 6th Ed., ed ited by G. J. Siegel et a!. Published by Lippincott-Raven Publishers, Philadelphia, 1999. Correspondence to Donald D. Clarke, Chemistry Department, Fordham University, Bronx, New York 10458.
638 Part Five Metabolism
SUBSTRATES OF CEREBRAL METABOLISM 656 Normally, the substrates are glucose and
oxygen and the products are carbon dioxide and water 656
In brain, glucose utilization is obligatory 657 The brain utilizes ketones in states of ketosis 660
AGE AND DEVELOPMENT INFLUENCE CEREBRAL ENERGY METABOLISM 661 Metabolic rate increases during early
development 661 Metabolic rate declines and plateaus after
maturation 661 Tissue pathology, but not aging, produces
secondary changes in metabolic rate 661
The biochemical pathways of energy metabolism in the brain are in most respects like those of other tissues, but special conditions peculiar to the central nervous system in vivo limit full expression of its bioclhemical potentialities. In no tissue are the discrepancies between in vivo and in vitro properties greater or the extrapolations from in vitro data to conclusions about in vivo metabolic functions more hazardous. Valid identification of normally used substrates and products of cerebral energy metabolism, as well as reliable estimations of their rates of utilization and production, can be obtained only in the intact animal; in vitro studies identify pathways of intermediary metabolism, mechanisms and potential rather than actual performance.
Although the brain is said to be unique among tissues in its high rate of oxidative metabolism, the overall cerebral metabolic rate for 0 2 (CMR02) is of the same order as the unstressed heart and renal cortex [I). Regional fluxes in the brain may greatly exceed CMR02,
however, and these are closely coupled to changes in metabolic demand.
INTERMEDIARY METABOLISM
A TP production in brain is highly regulated
Oxidative steps of carbohydrate metabolism normally contribute 36 of the 38 high-energy
CEREBRAL METABOLIC RATE IN VARIOUS PHYSIOLOGICAL STATES 662 Cerebral metabolic rate is determined locally by
functional activity in discrete regions 662 Metabolic rate and nerve conduction are related
directly 662 It is difficult to define metabolic equivalents of
consciousness, mental work and sleep 664
CEREBRAL ENERGY METABOLISM IN PATHOLOGICAL STATES 665 Psychiatric disorders may produce effects related
to anxiety 665 Coma and systemic metabolic diseases depress
brain metabolism 666 Measurement of local cerebral energy metabolism
in humans 667
phosphate bonds (-P) generated during aerobic metabolism of a single glucose molecule. About !So/o of brain glucose is converted to lactate and does not enter the Krebs cycle, also termed the citric acid cycle. However, this might be matched by a corresponding uptake of ketone bodies. The total net gain of-Pis 33 equivalents per mole of glucose utilized. The steady-state concentration of ATP is high and represents the sum of very rapid synthesis and utilization. On average, half of the terminal phosphate groups turn over in about 3 sec; this is probably much faster in certain regions [2]. The level of-Pis kept constant by regulation of ADP phosphorylation in relation to ATP hydrolysis. The active adenylyl kinase reaction, which forms equivalent amounts of ATP and AMP from ADP, prevents any great accumulation of ADP. Only a small amount of AMP is present under steady-state conditions; thus, a relatively small decrease in A TP may lead to a relatively large increase in AMP, which is a positive modulator of many reactions that lead to increased A TP synthesis. Such an amplification factor provides a sensitive control for maintenance of ATP levels [3). Between 37 and 42°C, the brain metabolic rate increases about So/o per degree.
The concentration of creatine phosphate (CRP) in brain is even higher than that of ATP, and creatine phosphokinase (CPK) is extremely active. The CRP level is exquisitely sensitive to changes in oxygenation, providing - P for ADP
Chapter 31 Brain Circulation and Metabolism 639
, phosphorylation and, thus, maintaining ATP levels. The CPK system also may function in regulating mitochondrial activity. In neurons with a very heterogeneous mitochondrial distribution, the CRP shuttle may play a critical role in energy transport [4]. The BB isoenzyme ofCPK is characteristic of, but not confined to, brain. Thus, its presence in body fluids does not necessarily indicate disruption of neural tissue.
Glycogen is a dynamic but limited energy store in brain
Although present in relatively low concentration in brain (3.3 mmoVkg brain in rat), glycogen is a unique energy reserve that requires no energy (ATP) for initiation of its metabolism. As with glucose, glycogen levels in brain appear to vary with plasma glucose concentrations. Biopsies have shown that human brain contains much more glycogen than rodent brain, but the effects of anesthesia and pathological changes in the biopsied tissue may have contributed. Glycogen granules are seen in electron micrographs of glia and neurons ofimmature animals but only in astrocytes of adults. Barbiturates decrease brain metabolism and increase the number of granules seen, particularly in astrocytes of synaptic regions; however, biochemical studies show that neurons do contain glycogen and that enzymes for its synthesis and metabolism are present in synaptosomes. Astrocyte glycogen may form a store of carbohydrate made available to neurons by still undefined mechanisms. Associated with the granules are enzymes involved in glycogen synthesis and, perhaps, degradation. The increased glycogen found in areas of brain injury may be due to glial changes or to decreased utilization during tissue preparation.
The accepted role of glycogen is that of a carbohydrate reserve utilized when glucose falls below need. However, rapid, continual breakdown and synthesis of glycogen occur at a rate of 19 IJ.moVkglmin. This is about 2% of the normal glycolytic flux in brain and is subject to elaborate control mechanisms. This suggests that, even under steady-state conditions, local carbohydrate reserves are important for brain function. However, if glycogen were the sole supply, normal glycolytic flux in brain would be maintained for less than 5 min.
The enzymes which synthesize and catabolize glycogen in other tissues are found in brain also, but their kinetic and regulatory properties do differ [5). Glycogen metabolism in brain, unlike in other tissues, is controlled locally. It is isolated from the tumult of systemic activity, evidently by the blood-brain barrier (BBB). Although glucocorticoid hormones that penetrate the BBB increase glycogen turnover, circulating protein hormones and biogenic amines have no effect. Beyond the BBB, cells are sensitive to local amine concentrations; drugs that cross the BBB and modify local amine concentrations or membrane receptors thus cause metabolic changes (see Chap. 32).
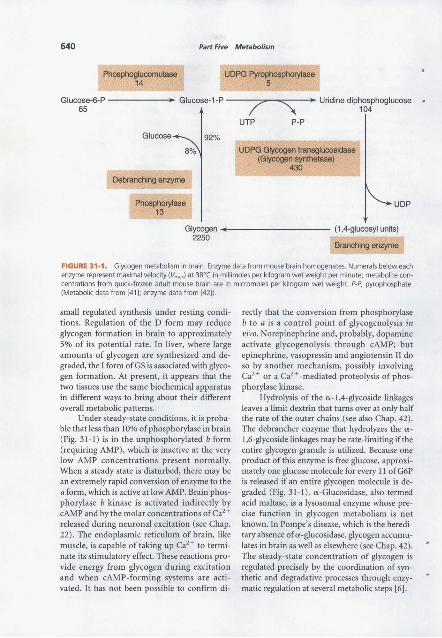
Separate systems for the synthesis and degradation of glycogen provide a greater degree of control than if glycogen were degraded by simply reversing its synthesis (Fig. 31-1). The amount of glucose-6-phosphate ( G6P), the initial synthetic substrate, usually varies inversely with the rate of brain glycolysis because of greater facilitation of the phosphofructokinase step relative to transport and phosphorylation of glucose. Thus, a decline in G6P during energy need slows glycogen formation.
The glucosyl group of uridine diphosphoglucose (UDP-glucose) is transferred to the terminal glucose of the nonreducing end of an amylose chain in an a -1 ,4-glycosidic linkage (Fig. 31-1). This reaction, catalyzed by glycogen synthetase (GS), is rate-controlling for glycogen synthesis [5). In brain, as in other tissues, GS occurs in both a phosphorylated (D) form, which depends on G6P as a positive modulator, and a dephosphorylated, independent (I) form sensitive to, but not dependent on, the modulator. Although in brain the I form of GS requires no stimulator, it has a relatively low affinity for UDP-glucose. At times of increased energy demand, not only is there a change from the D to the I form but also an I form with even lower affinity for substrate develops. Inhibition of glycogen synthesis is enhanced, and this increases the availability of G6P for energy needs. Goldberg and O'Toole [5) hypothesize that the I form in brain is associated with inhibition of glycogen synthesis under, conditions of energy demand, whereas the D form causes a relatively
640 Part Five Metabolism
Phosphoglucomutase 14
Glucose-6-P ------~ 65
---"?"-""'--+> Uridine diphosphoglucose
UTP P-P
UDPG Glycogen transglucosidase (Glycogen synthetase)
430
104
UDP
Glycogen -+---------- (1 ,4-glucosyl units) 2250
Branching enzyme
FIGURE 31-1. Glycogen metabolism in brain. Enzyme data from mouse brain homogenates. Numerals below each enzyme represent maximal velocity WmaJ at 38°C in millimoles per kilogram wet weight per minute; metabolite concentrations from quick-frozen adult mouse brain are in micromoles per kilogram wet weight. P-P, pyrophosphate. (Metabolic data from [41 ); enzyme data from [42]) .
small regulated synthesis under resting conditions. Regulation of the D form may reduce glycogen formation in brain to approximately 5% of its potential rate. In liver, where large amounts of glycogen are synthesized and degraded, the I form of GS is associated with glycogen formation. At present, it appears that the two tissues use the same biochemical apparatus in different ways to bring about their different overall metabolic patterns.
Under steady-state conditions, it is probable that Jess than 10% of phosphorylase in brain (Fig. 31-1) is in the unphosphorylated b form (requiring AMP), which is inactive at the very low AMP concentrations present normally. When a steady state is disturbed, there may be an extremely rapid conversion of enzyme to the a form, which is active at low AMP. Brain phosphorylase b kinase is activated indirectly by cAMP and by the molar concentrations of Ca2 +
released during neuronal excitation (see Chap. 22) . The endoplasmic reticulum of brain, like muscle, is capable of taking up Ca2 + to terminate its stimulatory effect. These reactions provide energy from glycogen during excitation and when cAMP-forming systems are acti vated. It has not been possible to confirm di-
reedy that the conversion from phosphorylase b to a is a control point of glycogenolysis in vivo. Norepinephrine and, probably, dopamine activate glycogenolysis through cAMP; but epinephrine, vasopressin and angiotensin II do so by another mechanism, possibly involving Ca2+ or a Ca2 + -mediated proteolysis of phosphorylase kinase.
Hydrolysis of the u-1,4-glycoside linkages leaves a limit dextrin that turns over at only half the rate of the outer chains (see also Chap. 42). The debrancher enzyme that hydrolyzes the u-1,6-glycoside linkages may be rate-limiting if the entire glycogen granule is utilized. Because one product of this enzyme is free glucose, approximately one glucose molecule for every 11 of G6P is released if an entire glycogen molecule is degraded (Fig. 31-1). a-Glucosidase, also termed acid maltase, is a lysosomal enzyme whose precise function in glycogen metabolism is not known. In Pompe's disease, which is the hereditary absence of ex -glucosidase, glycogen accumulates in brain as well as elsewhere (see Chap. 42). The steady-state concentration of glycogen is regulated precisely by the coordination of synthetic and degradative processes through enzymatic regulation at several metabolic steps [6].
Chapter 31 Brain Circulation and Metabolism 641
Brain glycolysis is regulated mainly by hexokinase and phosphofructokinase
Aerobic and anaerobic glycolysis have been defined historically as the amount of lactate produced under conditions of "adequate" oxygen and no oxygen, respectively. More recently, glycolysis refers to the Embden-Meyerhoff glycolytic sequence from glucose, or glycogen glucosyl, to pyruvate. Glycolytic flux is defined indirectly: it is the rate at which glucose must be utilized to produce the observed rate of ADP phosphorylation.
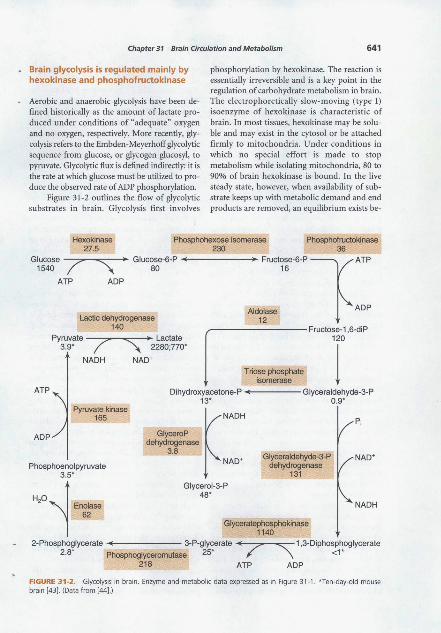
Figure 31-2 outlines the flow of glycolytic substrates in brain. Glycolysis first involves
phosphorylation by hexokinase. The reaction is essentially irreversible and is a key point in the regulation of carbohydrate metabolism in brain. The electrophoretically slow-moving (type I) isoenzyme of hexokinase is characteristic of brain. In most tissues, hexokinase may be soluble and may exist in the cytosol or be attached firmly to mitochondria. Under conditions in which no special effort is made to stop metabolism while isolating mitochondria, 80 to 90% of brain hexokinase is bound. In the live steady state, however, when availability of substrate keeps up with metabolic demand and end products are removed, an equilibrium exists be-
Hexokinase 27.5
Phosphohexose isomerase 230
Phosphofructokinase 36
Glucose 7 1540 I
ATP ADP
• Gluc~~e-6-P +------.- Fruct~~e-6-P 1ATP
Aldolase ADP Lactic dehydrogenase 12
140 _.----------Fructose-1 ,6-diP Py3ru_9v~te 7 • Lactate 1
120
I "" 2280;770' NADH NAD+
Triose phosphate isomerase
ATP Dihydroxyacetone-P +-----Glyceraldehyde-3-P
ADP
Pyruvate kinase 165
Phosphoenolpyruvate 3.5'
H20~ Enolase 62
GlyceroP dehydrogenase
3.8
1~ OE
~NADH
NAD+ Glyceraldehyde-3-P dehydrogenase
131
Glyceroi-3-P 48'
Glyceratephosphokinase 1140
P;
NAD+
NADH
2-Phosphoglycerate 3-P-glycerate < 7 2.8' Phosphoglyceromu1ase 25'
"\ 1 ,3-Diphosphoglycerate <1'
218 ATP ADP
FIGURE 31-2. Glycolysis in brain. Enzyme and metabolic data expressed as in Figure 31-1 . *Ten-day-old mouse brain [43]. (Data from [44].)
642 Part Five Metabolism
tween the soluble and the bound enzyme. Binding changes the kinetic properties of hexokinase and its inhibition by G6P so that the bound enzyme on mitochondria is more active. The extent of binding is inversely related to the ATP: ADP ratio, so conditions in which energy utilization exceeds supply shift the solubilization equilibrium to the bound form and produce a greater potential capacity for initiating glycolysis to meet the energy demand. This mechanism allows ATP to function both as the substrate of the enzyme and, at another site, as a regulator to decrease ATP production through its influence on enzyme binding. It also confers preference on glucose in the competition for the MgATP2~ generated by mitochondrial oxidative phosphorylation. Thus, a process that will sustain ATP production continues at the expense of other uses of energy. Because energy reserves are exhausted rapidly postmortem, it is not surprising that brain hexokinase is bound almost entirely.
The significance of reversible binding of other enzymes to mitochondria is not clear. The measured glycolytic flux, when compared with the maximal velocity of hexokinase, indicates that in the steady state the hexokinase reaction is inhibited 97%. Brain hexokinase is inhibited by its product G6P, to a lesser extent by ADP and allosterically by 3-phosphoglycerate and several nucleoside phosphates, including cAMP and free ATP4~ . The ratio of ATP to Mg>+ also may have a regulatory action. In addition to acting on enzyme kinetics, G6P solubilizes hexokinase, thus reducing the efficiency of the enzyme when the reaction product accumulates. The sum total of these mechanisms is a fine tuning of the activity of the initial enzyme in glycolysis in response to changes in the cellular environment. Glucokinase, also termed low-affinity hexokinase, a major component of liver hexokinase, has not been found in brain.
G6P represents a branch point in metabolism because it is a common substrate for enzymes involved in glycolytic, pentose phosphate shunt and glycogen-forming pathways. There is also slight but detectable G6Pase activity in brain, the significance of which is not clear. The liver requires this enzyme to convert glycogen to glucose. The differences between the hexokinases and the modes of glycogen metabolism
of liver and brain can be related to the function of liver as a carbohydrate storehouse for the body, whereas brain metabolism is adapted for rapid carbohydrate utilization for energy needs. In glycolysis, G6P is the substrate of phosphohexose isomerase. This is a reversible reaction, with a small free energy change and a 5:1 equilibrium ratio in brain that favors G6P.
Fructose-6-phosphate is the substrate of phosphofructokinase, a key regulatory enzyme controlling glycolysis [3]. The other substrate is MgATP2~ . Like other regulatory reactions, it is essentially irreversible. It is modulated by a large number of metabolites and cofactors, whose concentrations under different metabolic conditions have a great effect on glycolytic flux. Prominent among these are availability of - P and citrate concentrations. Brain phosphofructokinase is inhibited by ATP, Mg2+ and citrate and stimulated by NH!, K+, PO~~. 5'-AMP, 3',5',-cAMP, ADP and fructose-1,6-bisphosphate.
When oxygen is admitted to cells metabolizing anaerobically, utilization of 0 2 increases, whereas utilization of glucose and production of lactate drop; this is known as the Pasteur effect. Modulation of the phosphofructokinase reaction can account direcdy for the Pasteur effect. In the steady state, A TP and citrate concentrations in brain apparently are sufficient to keep phosphofructokinase relatively inhibited as long as the concentration of positive modulators, or disinhibitors, is low. When the steady state is disturbed, activation of this enzyme produces an increase in glycolytic flux, which takes place almost as fast as events changing the internal "milieu.
Fructose-1,6-bisphosphate is split by brain aldolase to glyceraldehyde-3-phosphate and dihydroxyacetone phosphate. Dihydroxyacetone phosphate is the common substrate for both glycerophosphate dehydrogenase, an enzyme active in reduced nicotinamide adenine dinucleotide (NADH) oxidation and lipid pathways (see Chap. 3), and triose phosphate isomerase, which maintains an equilibrium between dihydroxyacetone phosphate and glyceraldehyde-3-phosphate; the equilibrium strongly favors accumulation of dihydroxyacetone phosphate.
After the reaction with glyceraldehyde-3-phosphate dehydrogenase, glycolysis in brain proceeds through the usual steps. Brain enolase,
Chapter 31 Brain Circulation and Metabolism 643
also termed D-2-phosphoglycerate hydrolyase, which catalyzes dehydration of 2-phosphoglycerate to phosphoenolpyruvate, is present as two related dimers, one of which (-y) is associated specifically with neurons and the other (a) with glia. The neuronal subunit is identical to the neuron-specific protein 14-3-2. Immunocytochemical determination of the enolases makes them useful in determining neuron:glia ratios in tissue samples, but neuron-specific enolase is not confined to neural tissue. Brain phosphoenolpyruvate kinase controls an essentially irreversible reaction that requires not only Mg2 + , as do several other glycolytic enzymes, but also K+ or Na+. This step also maybe regulatory.
Brain tissue, even when at rest and well oxygenated, produces a small amount of lactate, which is removed in the venous blood, accounting for 13% of the pyruvate produced by glycolysis. The measured lactate concentration in brain depends on success in rapidly arresting brain metabolism prior to tissue processing. Five lactate dehydrogenase isoenzymes are present in adult brain; the one that electrophoretically moves most rapidly toward the anode, termed band 1, predominates. This isoenzyme is generally higher in tissues that are more dependent on aerobic processes for energy; the slower moving isoenzymes are relatively higher in tissues such as white skeletal muscle, which is better adapted to function at suboptimal oxygen levels. The distribution of lactate dehydrogenase isoenzymes in various brain regions, layers of the retina, brain neoplasms and brain tissue cultures and during development indicates that their synthesis might be controlled by tissue oxygen concentrations. Lactate dehydrogenase functions in the cytoplasm to oxidize NADH, which accumulates as a result of the activity of glyceraldehyde-3-phosphate dehydrogenase in glycolysis. This permits glycolytic ATP production to continue under anaerobic conditions. Lactate dehydrogenase also functions under aerobic conditions because NADH cannot easily penetrate mitochondrial membranes. Oxidation of NADH in the cytoplasm depends on this reaction and on the activity of shuttle mechanisms that transfer reducing equivalents to mitochondria.
Glycerol phosphate dehydrogenase is another enzyme indirectly associated with glycoly-
sis that participates in cytoplasmic oxidation of NADH. This enzyme reduces dihydroxyacetone phosphate to glycerol-3-phosphate, oxidizing NADH in the process. Under hypoxic conditions, a.-glycerophosphate and lactate increase initially at comparable rates, although the amount of lactate produced greatly exceeds that of a-glycerophosphate. The relative concentrations of the oxidized and reduced substrates of these reactions indicate much higher local concentrations ofNADH in brain than are found by gross measurements. In fact, the relative proportions of oxidized and reduced substrates of the reactions that are linked to the pyridine nucleotides may be a better indicator oflocal redox states (NAD + /NADH) in brain than the direct measurement of pyridine nucleotides themselves [3,7].
An aspect of glucose metabolism that has led to much confusion is the observation that labeled glucose appears in carbon dioxide much more slowly than might be suggested from an examination of the glycolytic pathway plus the citric acid cycle [8]. Glucose flux is 0.5 to 1.0 jJ.mol/min/g wet weight of brain in a variety of species. The concentration of glycolytic plus Krebs cycle intermediates is 2 IJ.mol/g. Hence, the intermediates might turn over every 2 to 4 min and 14C02 production might reach a steady state in 5 to 10 min. This is not seen experimentally. Also, large amounts of radioactivity are trapped in amino acids related to the Krebs cycle (70 to 80%) from 10 to 30 min after a glucose injection. This is due to high transaminase activity in comparison with flux through the Krebs cycle, and amino acids made by transamination of cycle intermediates behave as if they are part of the cycle. When pools of these amino acids ( - 20 IJ.mol/g) are added to the Krebs cycle components plus glycolytic intermediates, the calculated time for 14C02 evolution is increased by a factor of 10, in agreement with experimental results.
In contrast, in liver, amino acids related to the Krebs cycle are present at much lower steady-state values, and approximately 20% of the radioactivity from administered glucose is trapped in these amino acids shortly after injection. Thus, ignoring the radioactivity trapped in amino acids has a relatively small effect on esti-
644 Part Five Metabolism
mates of glycolytic fluxes in liver but makes an enormous difference in brain. Immature brain resembles liver more nearly in this respect. The relationship of the Krebs cycle to glycolysis undergoes a sharp change during development, coincident with the metabolic compartmentation of amino acid metabolism characteristic of adult brain.
The pyruvate dehydrogenase complex plays a key role in regulating oxidation
Pyruvate dehydrogenase has an activity of 14 nmol/min/mg protein in rat brain and controls the rate of pyruvate entry into the Krebs cycle as acetyl coenzyme A (acetyl-CoA). Pyruvate dehydrogenase, or decarboxylase, is part of a mitochondrial multienzyme complex that also includes the enzymes lipoate acetyltransferase and lipoamide dehydrogenase; the coenzymes thiamine pyrophosphate, lipoic acid, CoA and flavine; and nicotinamide adenine dinucleotides. It is inactivated by being phosphorylated at the decarboxylase moiety by a tightly bound Mg2+ /ATP2- -dependent protein kinase and activated by being dephosphorylated by a loosely bound Mg2+ - and Ca2+ -dependent phosphatase. About half the brain enzyme is usually active. Pyruvate protects the complex against inactivation by inhibiting the kinase. ADP is a competitive inhibitor of Mg2+ for the inactivating kinase. Under conditions of greater metabolic demand, increases in pyruvate and ADP and decreases in acetyl-CoA and ATP make the complex more active. Pyruvate dehydrogenase is inhibited by NADH, decreasing formation of acetyl-CoA during hypoxia and allowing more pyruvate to be reduced by lactate dehydrogenase, thus forming the NAD+ necessary to sustain glycolysis. Pyruvate dehydrogenase defects do occur in several mitochondrial enzymedeficiency states (see below and Morgan-Hughes [9], also Chap. 42).
Although acetylcholine synthesis normally is controlled by the rate of choline uptake and choline acetyltransferase activity (see Chap. II), the supply of acetyl-CoA can be limiting under adverse conditions. Choline uptake is, however, independent of acetyl-CoA concentration. The mitochondrial membrane is not permeable to the
acetyl-CoA produced within it, but there is efflux of its condensation product, citrate. AcetylCoA can then be formed from citrate in the cytosol by ATP citrate lyase. The acetyl moiety of acetylcholine is formed in a compartment, presumably the synaptosome, with rapid glucose turnover. The cytosol of cholinergic endings is rich in citrate lyase, and it is possible that citrate shuttles the acetyl-CoA from the mitochondrial compartment to the cytosol. During hypoxia or hypoglycemia, acetylcholine synthesis can be inhibited by failure of the acetyl-CoA supply.
Energy output and oxygen consumption are associated with high rates of enzyme activity in the Krebs cycle
The actual flux through the Krebs cycle depends on glycolysis and acetyl-CoA production, which can "push" the cycle, the possible control at several enzymatic steps of the cycle and the local ADP concentration, which is a prime activator of the mitochondrial respiration to which the Krebs cycle is linked. The steady-state concentration of citrate in brain is about one-fifth that of glucose. This is relatively high compared with glycolytic intermediates or isocitrate.
As in other tissues, there are two isocitrate dehydrogenases in brain. One is active primarily in the cytoplasm and requires nicotinamide adenine dinucleotide phosphate (NADP+) as cofactor; the other, bound to mitochondria and requiring NAD+, is the enzyme that participates in the citric acid cycle. The NAD+ -linked enzyme catalyzes an essentially irreversible reaction, has allosteric properties, is inhibited by A TP and NADH and may be stimulated by ADP. The function of cytoplasmic NADP+ isocitrate dehydrogenase is uncertain, but it has been postulated that it supplies the NADPH necessary for many reductive synthetic reactions. The relatively high activity of this enzyme in immature brain and white matter is consistent with such a role. a-Ketoglutarate (a-KG) dehydrogenase, which oxidatively decarboxylates a-KG, requires the same cofactors as does the pyruvate decarboxylation step.
Succinate dehydrogenase, the enzyme that catalyzes the oxidation of succinate to fumarate, is bound tightly to the mitochondrial mem-
Chapter 31 Brain Circulation and Metabolism 645
brane. In brain, succinate dehydrogenase also may have a regulatory role when the steady state is disturbed. Isocitrate and succinate concentrations in brain are affected little by changes in the flux of the citric acid cycle as long as an adequate glucose supply is available. The highly unfavorable free energy change of the malate dehydrogenase reaction is overcome by the rapid removal of oxaloacetate, which is maintained at low concentrations under steady-state conditions by the condensation reaction with acetyl-CoA [ 6].
Malic dehydrogenase is one of several enzymes in the citric acid cycle present in both the cytoplasm and mitochondria. The function of the cytoplasmic components of these enzyme activities is not known, but they may assist in the transfer of hydrogen equivalents from the cytoplasm into mitochondria.
The Krebs cycle functions as an oxidative process for energy production and as a source of various amino acids, for example, glutamate, glutamine, "(-aminobutyrate (GABA), aspartate and asparagine. To export net amounts of a-KG or oxaloacetate from the Krebs cycle, the supply of dicarboxylic acids must be replenished. The major route for this seems to be the fixation of C02
to pyruvate or other substrates at the three-carbon level. Thus, the C02 fixation rate sets an upper limit at which biosynthetic reactions can occur. In studies of acute ammonia toxicity in cats, this has been estimated as 0.15 IJ.mol/g wet weight brain/min, or approximately 10% of the flux through the citric acid cycle (see below). Liver seems to have ten times the capacity of brain for C02 fixation, as is appropriate for an organ geared to making large quantities of protein for export [10]. In brain, pyruvate carboxylase, which catalyzes C02 fixation, appears to be largely an astrocytic enzyme. Pyruvate dehydrogenase seems to be the rate-limiting step for the entry of pyruvate into the Krebs cycle from glycolysis.
The pentose shunt, also termed the hexose monophosphate pathway, is active in brain
Under basal conditions 5 to 8% of brain glucose is likely to be metabolized via the pentose shunt in the adult monkey and 2.3% in the rat [8]. Both shunt enzymes and metabolic flux have
been found in isolated nerve endings. The penlose pathway has relatively high activity in developing brain, reaching a peak during myelination. Its main contribution is probably to produce the NADPH needed for reductive reactions necessary for lipid synthesis (see Chap. 3). Shunt enzymes and metabolic flux are found in synaptosomes. Although the capacity of the pathway, as determined using nonphysiological electron acceptors, remains constant throughout the rat life span, activity with physiological acceptors could not be detected in middle-aged (18 months) and older animals. It seems that the shunt serves as a reserve pathway for use under such stresses as the need for increased lipid synthesis or repair or reduction of oxidative toxins. The shunt pathway also provides pentose for nucleotide synthesis; however, only a small fraction of the activity of this pathway would be required. As with glycogen synthesis, turnover in the penlose phosphate pathway decreases under conditions of increased energy need, for example, during and after high rates of stimulation. Pentose phosphate flux apparently is regulated by the concentrations of G6P, NADP+, glyceraldehyde-3-phosphate and fructose-6-phosphate. Since transketolase, an enzyme in this pathway, requires thiamine pyrophosphate as a cofactor, poor myelin maintenance in thiamine deficiency may reflect failure of this pathway to provide sufficient NADPH for lipid synthesis [6].
Glutamate in brain is compartmented into separate pools
The pools that subserve different metabolic pathways for glutamate equilibrate with each other only slowly. This compartmentation is a vital factor in the separate regulation of special functions of glutamate (see Chap. 15) and GABA (see Chap. 16), such as neurotransmission, and of general functions, such as protein biosynthesis. Glutamate metabolism in brain shows at least two distinct pools; in addition, the Krebs cycle intermediates associated with these pools are distinctly compartmented. Mathematical models to fit data from radiotracer experiments that require separate Krebs cycles to satisfy the hypotheses of compartmentation have been developed. A key assumption of current models is that GABA
646 Part Five Metabolism
is metabolized at a site different from its synthesis. The best fit of kinetic data is obtained when glutamate from a small pool actively converted to glutamine flows back to a larger pool (8 f).mol/g), which is converted to GABA. Of possible relevance to this is the finding that glutamate decarboxylase (GAD) is localized at or near nerve terminals, whereas GABA transaminase, the major degradative enzyme, is mitochondrial.
Evidence points to an inferred small pool of glutamate (2 fJ.mol/g) as probably glial. Glutamate released from nerve endings appears to be taken up by glia or neurons, converted to glutamine and recycled to glutamate and GABA (see Chaps. 5 and 15). Various estimates of the proportion of glucose carbon that flows through the GABA shunt have been made, but the most definitive experiments show this to be about 10% of the total glycolytic flux. While this may seem small, that portion of the Krebs cycle flux used for energy production, including ATP synthesis and maintenance of ionic gradients, does not require C02 fixation, while the portion used for biosynthesis of amino acids does. Recycling the carbon skeleton of some of the glutamate released in neurotransmission through glutamine and GABA to succinate diminishes the need for dicarboxylic acids to replenish intermediates of the Krebs cycle when export of ct-KG to make amino acids takes place.
It is difficult to get good estimates of the extent of C02 fixation in brain; the maximum capability measured during ammonia stress, when glutamine increases rapidly, suggests that C02
fixation occurs at 0.15 f.Lmol/g/min in cat and 0.33 J.l.mol!glmin in rat; this is about the same rate as for the GABA shunt.
For comparison, only about 2o/o of the glucose flux in whole brain goes toward lipid synthesis and approximately 0.3% is used for protein synthesis. Thus, turnover of neurotransmitter amino acids is a major biosynthetic activity in brain.
Metabolic compartmentation of glutamate usually is observed when labeled ketogenic substrates are administered to animals. It is interesting that acetoacetate and 13-hydroxybutyrate do not show this effect, apparently because ketone bodies are a normal substrate for brain and are taken up in all kinds of cells. Acetate and similar
substrates, which are not taken up into brain efficiently, appear to be more readily taken up or activated, or both, in glia. This is believed to lead to the observed abnormal glutamine/glutamate ratio. Similarly, metabolic inhibitors, like fluoroacetate, appear to act selectively in glia and to produce their neurotoxic action without marked inhibition of the overall Krebs cycle flux in brain. This difference in behavior has led to suggestions that acetate and fluoroacetate may be useful markers for the study of glial metabolism by autoradiography [II] .
A nonuniform distribution of metabolites in living systems is a widespread occurrence. Steadystate concentrations of GABA vary from 2 to 10 mM in discrete brain regions, and it has been estimated that GABA may be as high as 50 mM in nerve terminals. Observations in brain indicate the existence of pools of metabolites with half-lives of many hours for mixing, which is most unusual. The discovery of subcellular, morphological compartmentation, that is, different populations of mitochondria in cerebral cortex that have distinctive enzyme complements, may provide a somewhat better perspective by which to visualize such a separation of metabolic function [ 12].
In addition to the phasic release of both excitatory and inhibitory transmitters, there may be a continuous tonic release of GABA, dependent only on the activity of the enzyme responsible for its synthesis and independent of the depolarization of the presynaptic membrane. Such inhibitory neurons could act tonically by constantly maintaining an elevated threshold in the excitatory neurons so that the latter would start firing when a decrease occurred in the continuous release of GABA acting on them. This is consistent with a known correlation between the inhibition of GAD and the appearance of convulsions after certain drug treatments. GABA is depleted by some convulsant drugs and elevated by others.
DIFFERENCES BETWEEN IN VITRO AND IN VIVO BRAIN METABOLISM
In addition to the usual differences between in vitro and in vivo studies that pertain to all tissues, there are two unique conditions that pertain only to the central nervous system.
Chapter 31 Brain Circulation and Metabolism 647
In contrast to cells of other tissues, individual nerve cells do not function autonomously
They are generally so incorporated into a complex neural network that their functional activity is integrated with that of various other parts of the central nervous system and with somatic tissues. In addition, neurons and adjacent glia are linked in their metabolism. Any procedure that interrupts the structural and functional integrity of the network inevitably would alter quantitatively and, perhaps, qualitatively its normal metabolic behavior.
The blood-brain barrier selectively limits the rates of transfer of soluble substances between blood and brain
This barrier discriminates among various potential substrates for cerebral metabolism (see Chap. 32). The substrate function is confined to those compounds in the blood that are not only suitable substrates for cerebral enzymes but also can penetrate from blood to brain at rates adequate to support the considerable energy demands of brain. Substances that can be readily oxidized by brain slices, minces or homogenates in vitro and that are utilized effectively in vivo when formed endogenously within the brain often are incapable of supporting cerebral energy metabolism and function when present in the blood because of restricted passage through the BBB. The in vitro techniques establish only the existence and potential capacity of the enzyme systems required for the use of a given substrate; they do not define the extent to which such a pathway actually is used in vivo. This can be done only in intact animals, and it is this aspect of cerebral metabolism with which this part of the chapter is concerned.
CEREBRAL ENERGY METABOLISM IN VIVO
Numerous methods have been used to study the metabolism of the brain in vivo; these vary in complexity and in the degree to which they
yield quantitative results. Some require such minimal operative procedures on the laboratory animal that no anesthesia is required, and there is no interference with the tissue except for the effects of the particular experimental condition being studied. Some of these techniques are applicable to normal, conscious human subjects, and consecutive and comparative studies can be made repeatedly in the same subject. Other methods are more traumatic and either require the animal to be killed or involve such extensive surgical intervention and tissue damage that the experiments approach an in vitro experiment carried out in situ. All, however, are capable of providing specific and useful information.
Behavioral and central nervous system physiology are correlated with blood and cerebrospinal fluid chemical changes
The simplest way to study the metabolism of the central nervous system in vivo is to correlate spontaneous or experimentally produced alterations in the chemical composition of the blood, spinal fluid or both with changes in cerebral physiological functions or gross central nervous system-mediated behavior. The level of consciousness, the reflex behavior or the electroencephalogram (EEG) generally is used to monitor the effects of chemical changes on functional and metabolic activities of brain. Such methods first demonstrated the need for glucose as a substrate for cerebral energy metabolism; hypoglycemia produced by insulin or other means altered various parameters of cerebral function that could not be restored to normal by administering substances other than glucose.
The chief virtue of these methods is their simplicity, but they are gross and nonspecific and do not distinguish between direct effects of the agent on cerebral metabolism and those secondary to changes produced initially in somatic tissues. Also, negative results are often inconclusive, for there always remain questions of insufficient dosage, inadequate cerebral circulation and delivery to the tissues or impermeability of the BBB.
648 Part Five Metabolism
Brain samples are removed for biochemical analyses
The availability of analytical chemical techniques makes it possible to measure specific metabolites and enzyme activities in brain tissue at selected times during or after exposure of the animal to an experimental condition. This approach has been very useful in studies of the intermediary metabolism of brain. It has permitted estimation of the rates of flux through the various steps of established metabolic pathways and the identification of control points in the pathways where regulation may be exerted. Such studies have helped to define more precisely changes in energy metabolism associated with altered cerebral functions, for example, those produced by anesthesia, convulsions or hypoglycemia. While such methods require killing animals and analyzing tissues, in effect, they are in vivo methods since they attempt to describe the state of the tissue while it is still in the animal at the moment of killing. They have encountered their most serious problems with regard to this point. Postmortem changes in brain are extremely rapid and not always retarded completely even by the most rapid freezing techniques available. These methods have proved to be very valuable, nevertheless, particularly in the area of energy metabolism.
Radioisotope incorporation can identify and measure routes of metabolism
The technique of administering radioactive precursors followed by the chemical separation and assay of products in the tissue has added greatly to the armamentarium for studying cerebral metabolism in vivo. Labeled precursors are administered by any of a variety of routes; at selected later times the brain is removed, the precursor and the various products of interest are isolated and the radioactivity and quantity of the compounds in question are assayed. Such techniques facilitate identification of metabolic routes and rates of flux through various steps of a pathway. In some cases, comparison of specific activities of the products and precursors has led to the surprising finding of higher specific activities in products than in precursors. This is conclusive evidence of the presence of compartmen-
tation. These methods have been used effectively in studies of amine and neurotransmitter synthesis and metabolism, lipid metabolism, protein synthesis, amino acid metabolism and the distribution of glucose carbon through the various biochemical pathways present in brain.
Radioisotope incorporation methods are particularly valuable for studies of intermediary metabolism, which generally are not feasible by most other in vivo techniques. They are without equal for the qualitative identification of the pathways and routes of metabolism. They suffer, however, from a disadvantage: only one set of measurements per animal is possible because the animal must be killed. Quantitative interpretations often are confounded by the problems of compartmentation. Also, all too frequently, they are misused; unfortunately, quantitative conclusions are drawn incorrectly based on radioactivity data without appropriate consideration of the specific activities of precursor pools.
Oxygen utilization in the cortex is measured by polarographic techniques
The 0 2 electrode has been used for measuring the amount of 0 2 consumed locally in the cerebral cortex in vivo [13). The electrode is applied to the surface of the exposed cortex, and the local partial pressure for 0 2 (P02 ) is measured continuously before and during occlusion of the blood flow to the local area. During occlusion, P02 falls linearly as 0 2 is consumed by tissue metabolism, and the rate of fall is a measure of the rate of 0 2 consumption locally in the cortex. Repeated measurements can be made successively in the animal, and the technique has been used to demonstrate the increased 0 2 consumption of the cerebral cortex and the relation between changes in the EEG and the metabolic rate during convulsions [13). The technique is limited to measurements in the cortex and, of course, to 0 2 utilization.
Arteriovenous differences identify substances consumed or produced by brain
The primary functions of the circulation are to replenish the nutrients consumed by the tissues and to remove the products of their metabolism.
Chapter 31 Brain Circulation and Metabolism 649
These functions are reflected in the composition of the blood traversing the tissue. Substances taken up by a tissue from the blood are higher in concentration in the arterial inflow than in the venous outflow, and the converse is true for substances released by the tissue. The convention is to subtract the venous concentration from the arterial concentration so that a positive arteriovenous difference represents net uptake and a negative difference, net release. In nonsteady states, as after a perturbation, there may be transient arteriovenous differences that reflect changes in tissue concentrations and re-equilibration of the tissue with the blood. In steady states, in which it is presumed that the tissue concentration remains constant, positive and negative arteriovenous differences mean net consumption or production of the substance by the tissue, respectively. Zero arteriovenous differences indicate neither consumption nor production.
This method is useful for all substances in blood that can be assayed with enough accuracy, precision and sensitivity to enable the detection of arteriovenous differences. The method is useful only for tissues from which mixed representative venous blood can be sampled. Arterial blood has essentially the same composition throughout and can be sampled from any artery. In contrast, venous blood is specific for each tissue, and to establish valid arteriovenous differences the venous blood must represent the total outflow or the flow-weighted average of all of the venous outflows from the tissue under study, uncontaminated by blood from any other tissue. It is not possible to fulfill this condition for many tissues.
The method is fully applicable to the brain, particularly in humans, in whom the anatomy of venous drainage is favorable for such studies. Representative cerebral venous blood, with no more than approximately 3o/o contamination with extracerebral blood, is readily obtained from the superior bulb of the internal jugular vein in humans. The venipuncture can be made percutaneously under local anesthesia; therefore, measurements can be made during conscious states undistorted by the effects of general anesthesia. Using this method with monkeys is similar, although the vein must be exposed surgically before
puncture. Other common laboratory animals are less suitable because extensive communication between cerebral and extracerebral venous beds is present and uncontaminated representative venous blood is difficult to obtain from the cerebrum without major surgical intervention. In these cases, one can sample blood from the confluence of the sinuses, also termed the torcular herophili, even though it does not contain fully representative blood from the brainstem and some of the lower portions of the brain.
The chief advantages of these methods are their simplicity and applicability to unanesthetized humans. They permit the qualitative identification of the ultimate substrates and products of cerebral metabolism. They have no applicability, however, to those intermediates that are formed and consumed entirely within brain without being exchanged with blood or to those substances that are exchanged between brain and blood with no net flux in either direction. Furthermore, they provide no quantification of the rates of utilization or production because arteriovenous differences depend not only on the rates of consumption or production by the tissue but also on blood flow (see below). Blood flow affects all of the arteriovenous differences proportionately, however, and comparison of the arteriovenous differences of various substances obtained from the same samples of blood reflects their relative rates of utilization or production.
Combining cerebral blood flow and arteriovenous differences permits measurement of rates of consumption or production of substances by brain
In a steady state, the tissue concentration of any substance utilized or produced by brain is presumed to remain constant. When a substance is exchanged between brain and blood, the difference in its steady state of delivery to brain in the arterial blood and removal in the venous blood must be equal to the net rate of its utilization or production by brain. This relation can be expressed as follows:
CMR = CBF(A - V)
650 Part Five Metabolism
where (A - V) is the difference in concentration in arterial and cerebral venous blood, CBF is the rate of cerebral blood flow in volume of blood per unit time and cerebral metabolic rate (CMR) is the steady-state rate of utilization or production of the substance by brain.
If both the rate of cerebral blood flow and the arteriovenous difference are known, then the net rate of utilization or production of the substance by brain can be calculated. This has been the basis of most quantitative studies of cerebral metabolism in vivo.
The most reliable method for determining cerebral blood flow is the inert gas method of Kety and Schmidt [14]. Originally, it was designed for use in studies of conscious, unanesthetized humans, and it has been employed most widely for this purpose; but it also has been adapted for use in animals. The method is based on the Fick principle, which is an equivalent of the law of conservation of matter; and it utilizes low concentrations of a freely diffusible, chemically inert gas as a tracer substance. The original gas was nitrous oxide, but subsequent modifications have substituted other gases, such as 85Kr, 79Kr or hydrogen, which can be measured more conveniently in blood. During a period of inhalation of 15% N20 in air, for example, timed arterial and cerebral venous blood samples are withdrawn and analyzed for their N20 contents. The cerebral blood flow in milliliters per 100 g of brain tissue per minute can be calculated from the following equation:
CBF= 100!\ V(1)tn[A(t)- V(t)] dt
of inhalation is required to approach equilibrium. At the end of this interval, the N20 concentration in brain tissue is about equal to the cerebral venous blood concentration. Because the method requires sampling of both arterial and cerebral venous blood, it lends itself readily to the simultaneous measurement of arteriovenous differences of substances involved in cerebral metabolism. This method and its modifications have provided most of our knowledge of the rates of substrate utilization or product formation by brain in vivo.
REGULATION OF CEREBRAL METABOLIC RATE
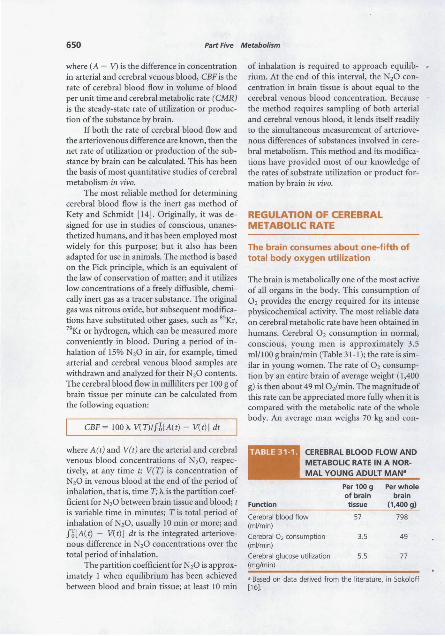
The brain consumes about one-fifth of total body oxygen utilization
The brain is metabolically one of the most active of all organs in the body. This consumption of 0 2 provides the energy required for its intense physicochemical activity. The most reliable data on cerebral metabolic rate have been obtained in humans. Cerebral 0 2 consumption in normal, conscious, young men is approximately 3.5 ml/100 g brain/min (Table 31-1); the rate is similar in young women. The rate of 0 2 consumption by an entire brain of average weight (1,400 g) is then about 49 ml 0 2/min. The magnitude of this rate can be appreciated more fully when it is compared with the metabolic rate of the whole body. An average man weighs 70 kg and con-
where A(t) and V(t) are the arterial and cerebral CEREBRAL BLOOD FLOW AND venous blood concentrations of N,O, respec- METABOLIC RATE IN A NOR-lively, at any time t; V(T) is concentration of MAL YOUNG ADULT MAN• N20 in venous blood at the end of the period of inhalation, that is, time T; X. is the partition coefficient for N20 between brain tissue and blood; t is variable time in minutes; T is total period of inhalation ofN20, usually 10 min or more; and fl[A(t) - V(t)] dt is the integrated arteriovenous difference in N20 concentrations over the total period of inhalation.
The partition coefficient for N20 is approx
Function
Cerebral blood flow (mVmin)
Cerebral 0 2 consumption (mVmin)
Cerebral glucose utilization (mg/min)
Per 100 g Per whole of brain brain tissue (1,400g)
57 798
3.5 49
5.5 77
imately 1 when equilibrium has been achieved a Based on data derived from the literature, in Sokoloff between blood and brain tissue; at least 10 min [16).
Chapter 31 Brain Circulation and Metabolism 651
sumes about 250 ml 0 2/min in the basal state. Therefore, the brain, which represents only about 2% of total body weight, accounts for 20% of the resting total body 0 2 consumption. In children, the brain takes up an even larger fraction, as much as 50% in the middle of the first decade of life [15].
0 2 is utilized in the brain almost entirely for the oxidation of carbohydrate [16]. The energy equivalent of the total cerebral metabolic rate is, therefore, approximately 20 W, or 0.25 kcal/min. If it is assumed that this energy is utilized mainly for the synthesis of high-energy phosphate bonds, that the efficiency of the energy conservation is approximately 20% and that the free energy of hydrolysis of the terminal phosphate of ATP is approximately 7 kcal!mol, then this energy expenditure can be estimated to support the steady turnover of close to 7 mmol, or approximately 4 X 10²¹ molecules, of ATP per minute in the entire human brain. The brain normally has no respite from this enormous energy demand. Cerebral 0 2 consumption continues unabated day and night. Even during sleep there is only a relatively small decrease in cerebral metabolic rate; indeed, it may even be increased in rapid eye movement (REM) sleep (see below).
The main energy-demanding functions of the brain are those of ion flux related to excitation and conduction
The brain does not do mechanical work, like that of cardiac and skeletal muscle, or osmotic work, as the kidney does in concentrating urine. It does not have the complex energy-consuming metabolic functions of the liver nor, despite the synthesis of some hormones and neurotransmitters, is it noted for its biosynthetic activities. Considerable emphasis has been placed on the extent of macromolecular synthesis in the central nervous system, an interest stimulated by the recognition that there are some proteins with short half-lives in brain. However, these represent relatively small numbers of molecules, and in fact, the average protein turnover and the rate of protein synthesis in mature brain are slower than in most other tissues, except perhaps muscle. Clearly, the functions of nervous tissues are
mainly excitation and conduction, and these are reflected in the unceasing electrical activity of the brain. The electrical energy ultimately is derived from chemical processes, and it is likely that most of the energy consumption of the brain is used for active transport of ions to sustain and restore the membrane potentials discharged during the processes of excitation and conduction (see Chaps. 5 and 6).
Not all of the 0 2 consumption of the brain is used for energy metabolism. The brain contains a variety of oxidases and hydroxylases that function in the synthesis and metabolism of a number of neurotransmitters. For example, tyrosine hydroxylase is a mixed-function oxidase that hydroxylates tyrosine to 3,4-dihydroxyphenylalanine (DOPA), and dopamine 13-hydroxylase hydroxylates dopamine to form norepinephrine. Similarly, tryptophan hydroxylase hydroxylates tryptophan to form 5-hydroxytryptophan in the pathway of serotonin synthesis. The enzymes are oxygenases, which utilize molecular 0 2 and incorporate it into the hydroxyl group of the hydroxylated products. 0 2
also is consumed in the metabolism of these monoamine neurotransmitters, which are deaminated oxidatively to their respective aldehydes by monoamine oxidases. All of these enzymes are present in brain, and the reactions catalyzed by them use 0 2 • However, the total turnover rates of these neurotransmitters and the sum total of the maximal velocities of all oxidases involved in their synthesis and degradation can account for only a very small, possibly immeasurable, fraction of the total 0 2 consumption of brain.
Continuous cerebral circulation is absolutely required to provide sufficient oxygen
Not only does the brain utilize 0 2 at a very rapid rate, but it is absolutely dependent on uninterrupted oxidative metabolism for maintenance of its functional and structural integrity. There is a large Pasteur effect in brain tissue, but even at its maximal rate anaerobic glycolysis is unable to provide sufficient energy. Since the 0 2 stored in brain is extremely small compared with its rate of utilization, the brain requires continuous re-
652 Part Five Metabolism
plenishment of its 0 2 by the circulation. If cerebral blood flow is interrupted completely, consciousness is lost within less than 10 sec, or the amount of time required to consume the 0 2
contained within the brain and its blood content. Loss of consciousness as a result of anoxemia, caused by anoxia or asphyxia, takes only a little longer because of the additional 0 2 present in the lungs and the still-circulating blood. The average critical level of 0 2 tension in brain tissues, below which consciousness and the normal EEG pattern are invariably lost, lies between 15 and 20 mm Hg. This seems to be so whether the tissue anoxia is achieved by lowering the cerebral blood flow or the arterial oxygen content. Cessation of cerebral blood flow is followed within a few minutes by irreversible pathological changes within the brain, readily demonstrated by microscopic anatomical techniques. In medical crises, such as cardiac arrest, damage to the brain occurs earliest and is most decisive in determining the degree of recovery.
Cerebral blood flow must be able to maintain the avaricious appetite of the brain for 0 2•
The average rate of blood flow in the human brain as a whole is approximately 57 ml/100 g tissue/min (see Table 31-1). For a whole brain this amounts to almost 800 ml/min, or approximately 15% of the total basal cardiac output. This must be maintained within relatively narrow limits, for the brain cannot tolerate any major drop in its perfusion. A fall in cerebral blood flow to half its normal rate is sufficient to cause loss of consciousness in normal, healthy, young men. There are, fortunately, numerous reflexes and other physiological mechanisms to sustain adequate le_;els of arterial blood pressure at the head level, such as the baroreceptor reflexes, and to maintain cerebral blood flow, even when arterial pressure falls in times of stress for example, autoregulation. There are also mechanisms to adjust cerebral blood flow to changes in cerebral metabolic demand.
Regulation of cerebral blood flow is achieved mainly by control of the tone or the degree of constriction, or dilation, of the cerebral vessels. This in turn is controlled mainly by local chemical factors, such as PaC02, Pa02, pH and others still unrecognized. High PaC02, low Pa02
and low pH, which are products of metabolic activity, tend to dilate the blood vessels and increase cerebral blood flow; changes in the opposite direction constrict the vessels and decrease blood flow [ 17]. Cerebral blood flow is regulated through such mechanisms to maintain homeostasis of these chemical factors in the local tissue. The rates of production of these chemical factors depend on the rates of energy metabolism; therefore, cerebral blood flow is adjusted to the cerebral metabolic rate [ 17].
Local rates of cerebral blood flow and metabolism can be measured by autoradiography and are coupled to local brain function
The rates of blood flow and metabolism presented in Table 31-1 and discussed above represent the average values in the brain as a whole. The brain is not homogeneous, however; it is composed of a variety of tissues and discrete structures that often function independently or even inversely with respect to one another. There is little reason to expect that their perfusion and metabolic rates would be similar. Indeed, experiments clearly indicate that they are not. Local cerebral blood flow in laboratory animals has been determined from the local tissue concentrations, measured by a quantitative autoradiographic technique, and from the total history of the arterial concentration of a freely diffusible, chemically inert, radioactive tracer introduced into the circulation [18]. The results reveal that blood-flow rates vary widely throughout the brain, with average values in gray matter approximately four to five times those in white matter [18].
A method has been devised to measure glucose consumption in discrete functional and structural components of the brain in intact, conscious laboratory animals [19]. This method also employs quantitative autoradiography to measure local tissue concentrations but utilizes 2-deoxy-o-[ 14C]glucose as the tracer. The local tissue accumulation of [ 14C]deoxyglucose as [14C]deoxy-G6P in a given interval of time is related to the amount of glucose that has been phosphorylated by
Chapter 31 Brain Circulation and Metabolism 653
A
Plasma Brain Tlsaue
Precursor Pool Metabolic Products
[14C]Giycoli£ids [14C]Deoxyglycog~ C]Giycoproteins
[14C]UDPDG
1l [14C]Deoxyglucose -1-Phosphate
kj 1l [14C]Oeoxyglucose
k; [14C]Deoxyglucose - [14C]Deoxyglucose 6-Phosphate
(Cj.) t: k2 (C~) : (C;,.) &I '
' c 2! Total Tissue 14f Concentration= c; = C~ + C~ Ill
' k, 8 k3 :
Glucose::;::::: iii ~Glucose~ ' '
Glucose 6-Phosphate ' (Cp) ko (C.) •, --- .. ~.-- ' (CM)
' t ' ' -' ' t ' ' ' -' t ' ' ' C02 + H20 :
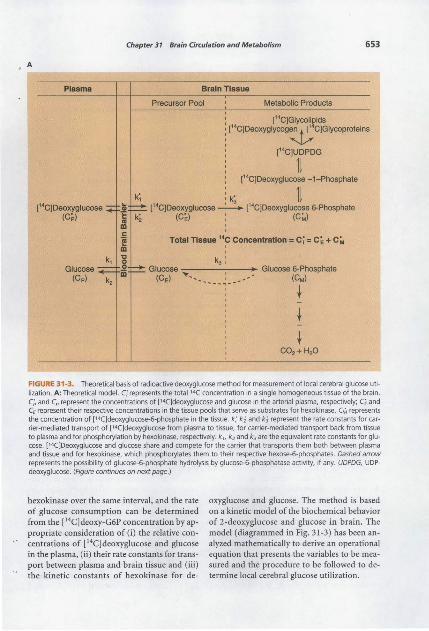
FIGURE 31-3. Theoretical basis of radioactive deoxyglucose method for measurement of local cerebral glucose utilization. A: Theoretical model. Ci represents the totai'4C concentration in a single homogeneous tissue of the brain. C~ and Cp represent the concentrations of ['4C}deoxyglucose and glucose in the arterial plasma, respectively; C£ and CE represent their respective concentrations in the tissue pools that serve as substrates for hexokinase. CM represents the concentration of (14()deoxyglucose-6-phosphate in the tissue. k; k2 and k3 represent the rate constants for carrier-mediated transport of [14C)deoxyglucose from plasma to tissue, for carrier-mediated transport back from tissue to plasma and for phosphorylation by hexokinase, respectively. k 1, k2 and k3 are the equivalent rate constants for glucose. [14C]Deoxyglucose and glucose share and compete for the carrier that transports them both between plasma and tissue and for hexokinase, which phosphorylates them to their respective hexose-6-phosphates. Dashed arrow represents the possibility of glucose-6-phosphate hydrolysis by glucos.e-6-phosphatase activity, if any. UDPDG, UDPdeoxyglucose. (Figure continues on next page.}
hexokinase over the same interval, and the rate of glucose consumption can be determined from the [ 14C] deoxy-G6P concentration by appropriate consideration of (i) the relative concentrations of [ 14C]deoxyglucose and glucose in the plasma, (ii) their rate constants for transport between plasma and brain tissue and (iii) the kinetic constants of hexokinase for de-
oxyglucose and glucose. The method is based on a kinetic model of the biochemical behavior of 2-deoxyglucose and glucose in brain. The model (diagrammed in Fig. 31-3) has been analyzed mathematically to derive an operational equation that presents the variables to be measured and the procedure to be followed to determine local cerebral glucose utilization.
654 Part Five Metabolism
B General equation for measurement of reaction rates with tracers:
Labeled Product Formed in Interval of Time, 0 to T Rate of reaction=
[ Isotope effect J correction factor [ Integrated specific activity J
of precursor
Operational equation of [ 1.C]deoxyglucose method:
labeled Product formed in Interval of Time, 0 to T
Total ••c in tissue at timeT ~
••c in precursor remaining in tissue at time T
c:<n - k: e-(k;H;JT loT c; e(k;H;Jtdt
R,=------------------------~----------
[1\: y;: K:J [lT(s_)dt -e-(k; +k;)TiT(s_) e(k; +k;Jt dt] <1> V. K. 0 C, 0 C,
,____,___, Isotope effect Integrated plasma Correction for lag in tissue
equilibration with plasma correction specific activity factor
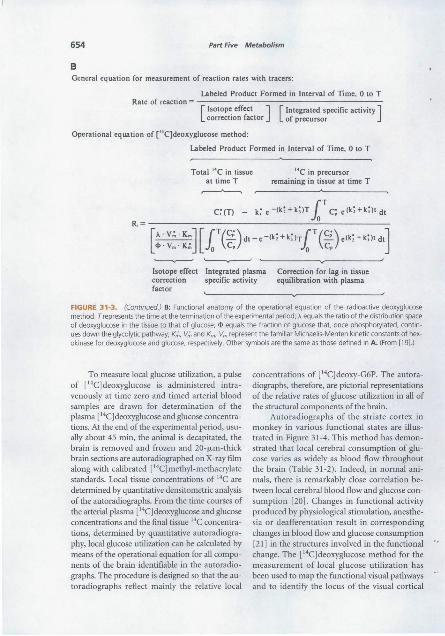
FIGURE 31·3. (Continued.) B: Functional anatomy of the operational equation of the radioactive deoxyglucose method. Trepresents the time at the termination of the experimental period;>.. equals the ratio of the distribution space of deoxyglucose in the tissue to that of glucose; ¢ equals the fraction of glucose that, once phosphorylated, continues down the glycolytic pathway; K~, V~ and Km, Vm represent the familiar Michaelis-Menten kinetic constants of hexokinase for deoxyglucose and glucose, respectively. Other symbols are the same as those defined in A. (From [19].)
To measure local glucose utilization, a pulse of ("C]deoxyglucose is administered intravenously at time zero and timed arterial blood samples are drawn for determination of the plasma [ 14CJdeoxyglucose and glucose concentrations. At the end of the experimental period, usually about 45 min, the animal is decapitated, the brain is removed and frozen and 20-f.1m-thick brain sections are auto radiographed on X-ray film along with calibrated (14C]methyl-methacrylate standards. Local tissue concentrations of 14C are determined by quantitative densitometric analysis of the autoradiographs. From the time courses of the arterial plasma ( 14C]deoxyglucose and glucose concentrations and the final tissue 14C concentrations, determined by quantitative autoradiography, local glucose utilization can be calculated by means of the operational equation for all components of the brain identifiable in the autoradiographs. The procedure is designed so that the autoradiographs reflect mainly the relative local
concentrations of (14C]deoxy-G6P. The autoradiographs, therefore, are pictorial representations of the relative rates of glucose utilization in all of the structural components of the brain.
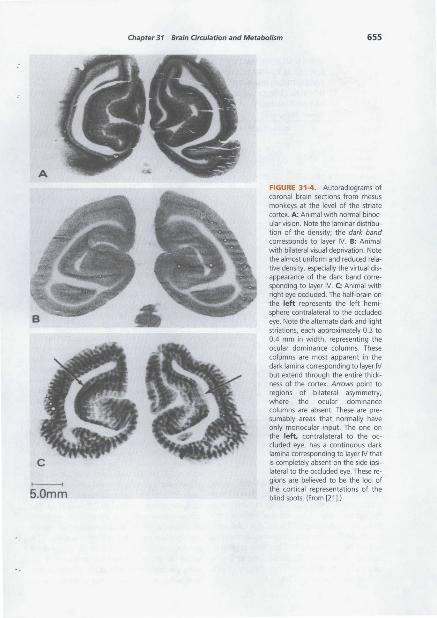
Autoradiographs of the striate cortex in monkey in various functional states are illustrated in Figure 31-4. This method has demonstrated that local cerebral consumption of glucose varies as widely as blood flow throughout the brain (Table 31-2). Indeed, in normal animals, there is remarkably close correlation between local cerebral blood flow and glucose consumption (20]. Changes in functional activity produced by physiological stimulation, anesthesia or deafferentation result in corresponding changes in blood flow and glucose consumption (21] in the structures involved in the functional change. The (14C]deoxyglucose method for the measurement of local glucose utilization has been used to map the functional visual pathways and to identify the locus of the visual cortical
A
>----< 5.0mm
Chapter 31 Brain Circulation and Metabolism 655
FIGURE 31-4. Autoradiograms of coronal bra in sections from rhesus monkeys at the level of the striate cortex. A: Animal with normal binocular vision. Note the laminar distribution of the density; the dark band corresponds to layer IV. B: Animal with bilateral visual deprivation. Note the almost uniform and reduced relative density, especially the virtual disappearance of the dark band corresponding to layer IV. C: Animal with right eye occluded. The half-brain on the left represents the left hemisphere contralateral to the occluded eye. Note the alternate dark and light striations, each approximately 0.3 to 0.4 mm in width, representing the ocular dominance columns. These columns are most apparent in the dark lamina corresponding to layer IV but extend through the entire thickness of the cortex. Arrows point to regions of bilateral asymmetry, where the ocular dominance columns are absent. These are presumably areas that normally have only monocu lar input. The one on the left, contralateral to the occluded eye, has a continuous dark lamina corresponding to layer IV that is completely absent on the side ipsilateral to the occluded eye. These regions are believed to be the loci of the cortical representations of the blind spots. (From [21).)
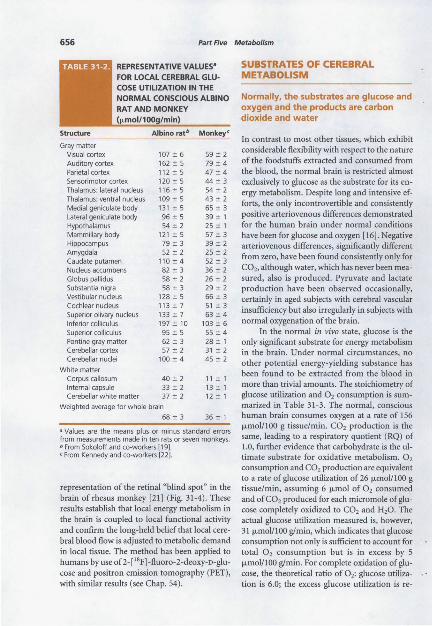
656 Part Five Metabolism
REPRESENTATIVE VALUES• FOR LOCAL CEREBRAL GLUCOSE UTILIZATION IN THE
SUBSTRATES OF CEREBRAL METABOLISM
NORMAL CONSCIOUS ALBINO Normally, the substrates are glucose and
Monkeyo:
Gray matter Visual cortex 107 :!:: 6 59 :!: 2 Auditory cortex 162 :!: 5 79 :!: 4 Parietal cortex 112:!: 5 47 :!: 4 Sensorimotor cortex 120 ± 5 44 ± 3 Thalamus: lateral nucleus 116 "' 5 54 "' 2 Thalamus: ventral nucleus 109 "' 5 43 "' 2 Medial geniculate body 131 "' 5 65 "' 3 Lateral geniculate body 96 "' 5 39 ± 1 Hypothalamus 54 ± 2 25 ± 1 Mammillary body 121 "'5 57::!: 3 Hippocampus 79 ± 3 39 ± 2 Amygdala 52 "' 2 25 "' 2 Caudate putamen 110 ± 4 52 "' 3 Nucleus accumbens 82 "' 3 36 ± 2 Globus pallidus 58 "' 2 26 ± 2 Substantia nigra 58 :!:: 3 29 :!:: 2 Vestibular nucleus 128 "' 5 66"' 3 Cochlear nucleus 113 ± 7 51 ± 3 Superior olivary nucleus 133 ::!:: 7 63 :!:: 4 Inferior colliculus 197 :!:: 10 103 ::!:: 6 Superior colliculus 95 :!:: 5 55 :!:: 4 Pontine gray matter 62 ::!::: 3 28 ::!:: 1 Cerebellar cortex 57::!:: 2 31 "' 2 Cerebellar nuclei 100 ± 4 45 ± 2
White matter Corpus callosum 40 ± 2 11 ± 1 Internal capsule 33 ± 2 13 ± 1 Cerebellar white matter 37 ± 2 12 ± 1
Weighted average for whole brain
68 ± 3 36 ± 1
a Values are the means plus or minus standard errors from measurements made in ten rats or seven monkeys. b From Sokoloff and co4 workers [19] . c From Kennedy and co4 workers [22].
representation of the retinal "blind spot" in the brain of rhesus monkey [21] (Fig. 31-4). These results establish that local energy metabolism in the brain is coupled to local functional activity and confirm the long-held belief that local cerebral blood flow is adjusted to metabolic demand in local tissue. The method has been applied to humans by use of2-[ 18F]-fluoro-2-deoxy-o-glucose and positron emission tomography (PET), with similar results (see Chap. 54).
oxygen and the products are carbon dioxide and water
In contrast to most other tissues, which exhibit considerable flexibility with respect to the nature of the foodstuffs extracted and consumed from the blood, the normal brain is restricted almost exclusively to glucose as the substrate for its energy metabolism. Despite long and intensive efforts, the only incontrovertible and consistently positive arteriovenous differences demonstrated for the human brain under normal conditions have been for glucose and oxygen [16]. Negative arteriovenous differences, significantly different from zero, have been found consistently only for C02, although water, which has never been measured, also is produced. Pyruvate and lactate production have been observed occasionally, certainly in aged subjects with cerebral vascular insufficiency but also irregularly in subjects with normal oxygenation of the brain.
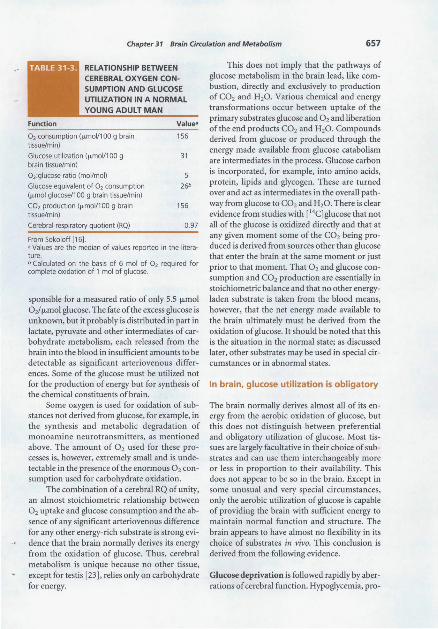
In the normal in vivo state, glucose is the only significant substrate for energy metabolism in the brain. Under normal circumstances, no other potential energy-yielding substance has been found to be extracted from the blood in more than trivial amounts. The stoichiometry of glucose utilization and 0 2 consumption is summarized in Table 31-3. The normal, conscious human brain consumes oxygen at a rate of 156 fLmol/100 g tissue/min. C02 production is the same, leading to a respiratory quotient (RQ) of 1.0, further evidence that carbohydrate is the ultimate substrate for oxidative metabolism. 0 2
consumption and C02 production are equivalent to a rate of glucose utilization of 26 fLmol/100 g tissue/min, assuming 6 J.Lmol of 0 2 consumed and of C02 produced for each micromole of glucose completely oxidized to C02 and H20. The actual glucose utilization measured is, however, 31 fLmol/100 glmin, which indicates that glucose consumption not only is sufficient to account for total 0 2 consumption but is in excess by 5 fLmol/100 glmin. For complete oxidation of glucose, the theoretical ratio of 0 2: glucose utilization is 6.0; the excess glucose utilization is re-
Chapter 31 Brain Circulation and Metabolism 657
RELATIONSHIP BETWEEN CEREBRAL OXYGEN CONSUMPTION AND GLUCOSE
UTILIZATION IN A NORMAL YOUNG ADULT MAN
0 2 consumption (j.LmoV1 00 g brain tissue/min)
Glucose utilization {j.LmoV1 00 g brain tissue/min)
0 2 :glucose ratio (moVmol)
Glucose equivalent of 0 2 consumption {1-Lmol glucose/1 00 g brain tissue/min)
C02 production (j.LmoV1 00 g brain tissue/min)
Cerebral respiratory quotient (RQ)
From Sokoloff [16[.
Valuea
156
31
26'
156
0.97
a Values are the median of values reported in the literature. b Calculated on the basis of 6 mol of 0 2 required for complete oxidation of 1 mol of glucose.
sponsible for a measured ratio of only 5.5 f.Lmol 0 2/f.Lmol glucose. The fate of the excess glucose is unknown, but it probably is distributed in part in lactate, pyruvate and other intermediates of carbohydrate metabolism, each released from the brain into the blood in insufficient amounts to be detectable as significant arteriovenous differences. Some of the glucose must be utilized not for the production of energy but for synthesis of the chemical constituents of brain.
Some oxygen is used for oxidation of substances not derived from glucose, for example, in the synthesis and metabolic degradation of monoamine neurotransmitters, as mentioned above. The amount of 0 2 used for these processes is, however, extremely small and is undetectable in the presence of the enormous 0 2 consumption used for carbohydrate oxidation.
The combination of a cerebral RQ of unity, an almost stoichiometric relationship between 0 2 uptake and glucose consumption and the absence of any significant arteriovenous difference for any other energy-rich substrate is strong evidence that the brain normally derives its energy from the oxidation of glucose. Thus, cerebral metabolism is unique because no other tissue, except for testis [23], relies only on carbohydrate for energy.
This does not imply that the pathways of glucose metabolism in the brain lead, like combustion, directly and exclusively to production of C02 and H20. Various chemical and energy transformations occur between uptake of the primary substrates glucose and 0 2 and liberation of the end products C02 and H20. Compounds derived from glucose or produced through the energy made available from glucose catabolism are intermediates in the process. Glucose carbon is incorporated, for example, into amino acids, protein, lipids and glycogen. These are turned over and act as intermediates in the overall pathway from glucose to C02 and H20. There is clear evidence from studies with [ 14C]glucose that not all of the glucose is oxidized directly and that at any given moment some of the C02 being produced is derived from sources other than glucose that enter the brain at the same moment or just prior to that moment. That 0 2 and glucose consumption and C02 production are essentially in stoichiometric balance and that no other energyladen substrate is taken from the blood means, however, that the net energy made available to the brain ultimately must be derived from the oxidation of glucose. It should be noted that this is the situation in the normal state; as discussed later, other substrates may be used in special circumstances or in abnormal states.
In brain, glucose utilization is obligatory
The brain normally derives almost all of its energy from the aerobic oxidation of glucose, but this does not distinguish between preferential and obligatory utilization of glucose. Most tissues are largely facultative in their choice of substrates and can use them interchangeably more or less in proportion to their availability. This does not appear to be so in the brain. Except in some unusual and very special circumstances, only the aerobic utilization of glucose is capable of providing the brain with sufficient energy to maintain normal function and structure. The brain appears to have almost no flexibility in its choice of substrates in vivo. This conclusion is derived from the following evidence.
Glucose deprivation is followed rapidly by aberrations of cerebral function. Hypoglycemia, pro-
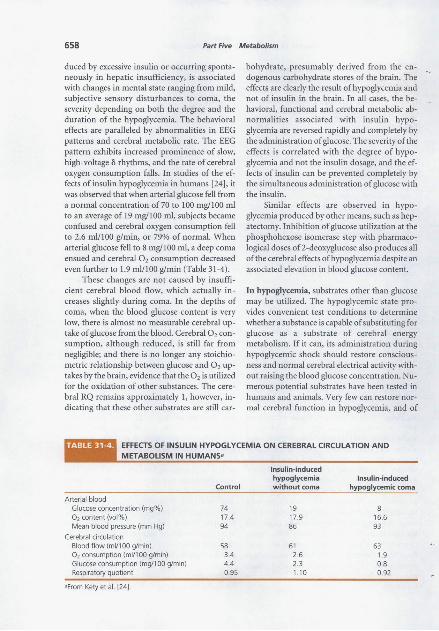
658 Part Five Metabolism
duced by excessive insulin or occurring spontaneously in hepatic insufficiency, is associated with changes in mental state ranging from mild, subjective sensory disturbances to coma, the severity depending on both the degree and the duration of the hypoglycemia. The behavioral effects are paralleled by abnormalities in EEG patterns and cerebral metabolic rate. The EEG pattern exhibits increased prominence of slow, high-voltage & rhythms, and the rate of cerebral oxygen consumption falls. In studies of the effects of insulin hypoglycemia in humans [24], it was observed that when arterial glucose fell from a normal concentration of70 to 100 mg/100 ml to an average of 19 mg/100 ml, subjects became confused and cerebral oxygen consumption fell to 2.6 ml/100 glmin, or 79% of normal. When arterial glucose fell to 8 mg/100 ml, a deep coma ensued and cerebral 0 2 consumption decreased even further to 1.9 ml/100 glmin (Table 31-4).
These changes are not caused by insufficient cerebral blood flow, which actually increases slightly during coma. In the depths of coma, when the blood glucose content is very low, there is almost no measurable cerebral uptake of glucose from the blood. Cerebral 0 2 consumption, although reduced, is still far from negligible; and there is no longer any stoichiometric relationship between glucose and 0 2 uptakes by the brain, evidence that the 0 2 is utilized for the oxidation of other substances. The cerebral RQ remains approximately l, however, indicating that these other substrates are still car-
bohydrate, presumably derived from the endogenous carbohydrate stores of the brain. The effects are clearly the result of hypoglycemia and not of insulin in the brain. In all cases, the behavioral, functional and cerebral metabolic abnormalities associated with insulin hypoglycemia are reversed rapidly and completely by the administration of glucose. The severity of the effects is correlated with the degree of hypoglycemia and not the insulin dosage, and the effects of insulin can be prevented completely by the simultaneous administration of glucose with the insulin.
Similar effects are observed in hypoglycemia produced by other means, such as hepatectomy. Inhibition of glucose utilization at the phosphohexose isomerase step with pharmacological doses of2-deoxyglucose also produces all of the cerebral effects of hypoglycemia despite an associated elevation in blood glucose content.
In hypoglycemia, substrates other than glucose may be utilized. The hypoglycemic state provides convenient test conditions to determine whether a substance is capable of substituting for glucose as a substrate of cerebral energy metabolism. If it can, its administration during hypoglycemic shock should restore consciousness and normal cerebral electrical activity without raising the blood glucose concentration. Numerous potential substrates have been tested in humans and animals. Very few can restore normal cerebral function in hypoglycemia, and of
EFFECTS OF INSULIN HYPOGLYCEMIA ON CEREBRAL CIRCULATION AND METABOLISM IN HUMANS•
Arterial blood Glucose concentration (mg%) 0 2 content (vol%) Mean blood pressure (mm Hg)
Cerebral circulation Blood flow (mV1 00 g/min) 0 2 consumption (mV1 00 g/min) Glucose consumption (mg/1 00 g/min) Respiratory quotient
" from Kety et al. [24}.
Control
74 17.4 94
58 3.4 4.4 0.95
Insulin-induced hypoglycemia without coma
19 17.9 86
61 2.6 2.3 1.10
Insulin-induced hypoglycemic coma
16.6 93
63 1.9 0.8 0.92
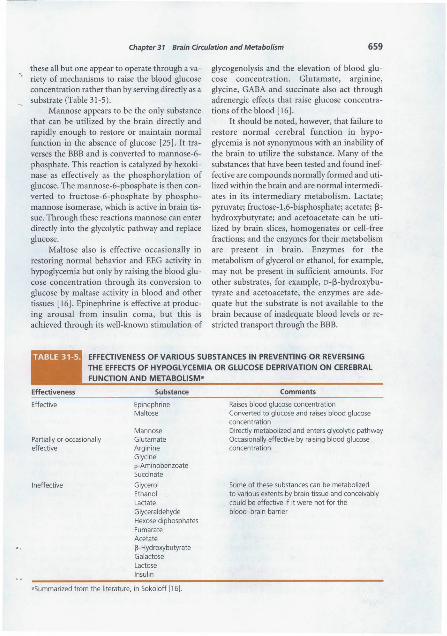
Chapter 31 Brain Circulation and Metabolism 659
these all but one appear to operate through a variety of mechanisms to raise the blood glucose concentration rather than by serving directly as a substrate (Table 31-5).
Mannose appears to be the only substance that can be utilized by the brain directly and rapidly enough to restore or maintain normal function in the absence of glucose [25]. It traverses the BBB and is converted to mannose-6-phosphate. This reaction is catalyzed by hexokinase as effectively as the phosphorylation of glucose. The mannose-6-phosphate is then converted to fructose-6-phosphate by phosphomannose isomerase, which is active in brain tissue. Through these reactions mannose can enter directly into the glycolytic pathway and replace glucose.
Maltose also is effective occasionally in restoring normal behavior and EEG activity in hypoglycemia but only by raising the blood glucose concentration through its conversion to glucose by maltase activity in blood and other tissues [16]. Epinephrine is effective at producing arousal from insulin coma, but this is achieved through its well-known stimulation of
glycogenolysis and the elevation of blood glucose concentration. Glutamate, arginine, glycine, GABA and succinate also act through adrenergic effects that raise glucose concentrations of the blood [16].
It should be noted, however, that failure to restore normal cerebral function in hypoglycemia is not synonymous with an inability of the brain to utilize the substance. Many of the substances that have been tested and found ineffective are compounds normally formed and utilized within the brain and are normal intermediates in its intermediary metabolism. Lactate; pyruvate; fructose-1,6-bisphosphate; acetate; 13-hydrox:ybutyrate; and acetoacetate can be utilized by brain slices, homogenates or cell-free fractions; and the enzymes for their metabolism are present in brain. Enzymes for the metabolism of glycerol or ethanol, for example, may not be present in sufficient amounts. For other substrates, for example, n-13-hydroxybutyrate and acetoacetate, the enzymes are adequate but the substrate is not available to the brain because of inadequate blood levels or restricted transport through the BBB.
EFFECTIVENESS OF VARIOUS SUBSTANCES IN PREVENTING OR REVERSING
THE EFFECTS OF HYPOGLYCEMIA OR GLUCOSE DEPRIVATION ON CEREBRAL
FUNCTION AND METABOLISM•
Partially or occasionally effective
Ineffective
Substance
Epinephrine Maltose
Man nose Glutamate Arginine Glycine p-Aminobenzoate Succinate
Glycerol Ethanol lactate Glyceraldehyde Hexose diphosphates Fumarate Acetate [3-Hydroxybutyrate Galactose Lactose Insulin
aSummarized from the literature, in Sokoloff [ 16]
Comments
Raises blood glucose concentration Converted to glucose and raises blood glucose concentration Directly metabolized and enters glycolytic pathway Occasionally effective by raising blood glucose concentration
Some of these substances can be metabolized to various extents by brain tissue and conceivably could be effective if it were not for the blood-brain barrier
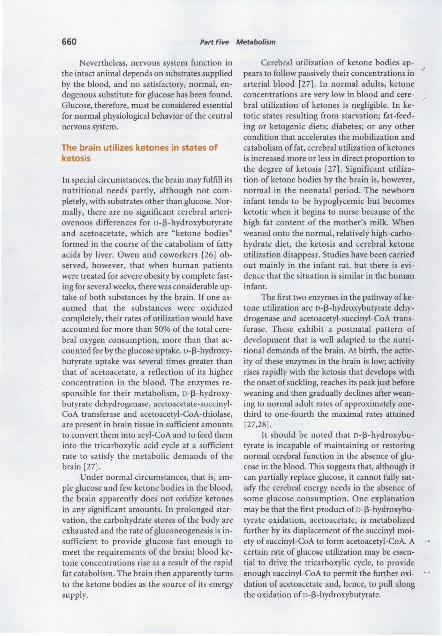
660 Part Five Metabolism
Nevertheless, nervous system function in the intact animal depends on substrates supplied by the blood, and no satisfactory, normal, endogenous substitute for glucose has been found. Glucose, therefore, must be considered essential for normal physiological behavior of the central nervous system.
The brain utilizes ketones in states of ketosis
In special circumstances, the brain may fulfill its nutritional needs partly, although not completely, with substrates other than glucose. Normally, there are no significant cerebral arteriovenous differences for o-13-hydroxybutyrate and acetoacetate, which are "ketone bodies" formed in the course of the catabolism of fatty acids by liver. Owen and coworkers [26] observed, however, that when human patients were treated for severe obesity by complete fasting for several weeks, there was considerable uptake of both substances by the brain. If one assumed that the substances were oxidized completely, their rates of utilization would have accounted for more than 50% of the total cerebral oxygen consumption, more than that accounted for by the glucose uptake. o-13-hydroxybutyrate uptake was several times greater than that of acetoacetate, a reflection of its higher concentration in the blood. The enzymes responsible for their metabolism, o-13-hydroxybutyrate dehydrogenase, acetoacetate-succinylCoA transferase and acetoacetyl-CoA-thiolase, are present in brain tissue in sufficient amounts to convert them into acyl-CoA and to feed them into the tricarboxylic acid cycle at a sufficient rate to satisfy the metabolic demands of the brain [27].
Under normal circumstances, that is, ample glucose and few ketone bodies in the blood, the brain apparently does not oxidize ketones in any significant amounts. In prolonged starvation, the carbohydrate stores of the body are exhausted and the rate of gluconeogenesis is insufficient to provide glucose fast enough to meet the requirements of the brain; blood ketone concentrations rise as a result of the rapid fat catabolism. The brain then apparently turns to the ketone bodies as the source of its energy supply.
Cerebral utilization of ketone bodies appears to follow passively their concentrations in arterial blood [27]. In normal adults, ketone concentrations are very low in blood and cerebral utilization of ketones is negligible. In ketotic states resulting from starvation; fat-feeding or ketogenic diets; diabetes; or any other condition that accelerates the mobilization and catabolism of fat, cerebral utilization of ketones is increased more or less in direct proportion to the degree of ketosis [27]. Significant utilization of ketone bodies by the brain is, however, normal in the neonatal period. The newborn infant tends to be hypoglycemic but becomes ketotic when it begins to nurse because of the high fat content of the mother's milk. When weaned onto the normal, relatively high-carbohydrate diet, the ketosis and cerebral ketone utilization disappear. Studies have been carried out mainly in the infant rat, but there is evidence that the situation is similar in the human infant.
The first two enzymes in the pathway of ketone utilization are o-13-hydroxybutyrate dehydrogenase and acetoacetyl-succinyl-CoA transferase. These exhibit a postnatal pattern of development that is well adapted to the nutritional demands of the brain. At birth, the activity of these enzymes in the brain is low; activity rises rapidly with the ketosis that develops with the onset of suckling, reaches its peak just before weaning and then gradually declines after weaning to normal adult rates of approximately onethird to one-fourth the maximal rates attained [27,28].
It should be noted that o-13-hydroxybutyrate is incapable of maintaining or restoring normal cerebral function in the absence of glucose in the blood. This suggests that, although it can partially replace glucose, it cannot fully satisfy the cerebral energy needs in the absence of some glucose consumption. One explanation may be that the first product ofo-13-hydroxybutyrate oxidation, acetoacetate, is metabolized further by its displacement of the succinyl moiety of succinyl-CoA to form acetoacetyl-GoA. A certain rate of glucose utilization may be essential to drive the tricarboxylic cycle, to provide enough succinyl-CoA to permit the further oxidation of acetoacetate and, hence, to pull along the oxidation ofo-13-hydroxybutyrate.
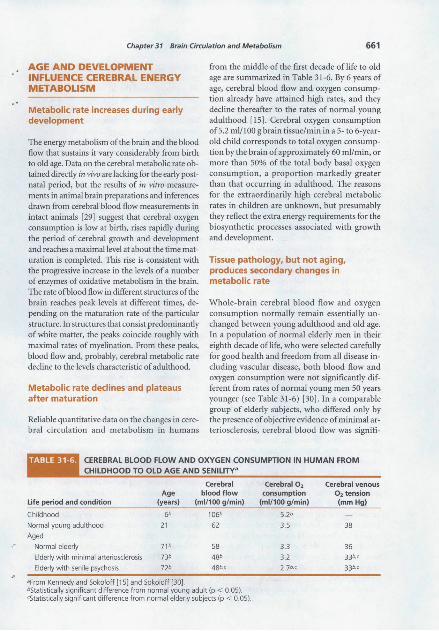
Chapter 31 Brain Circulation and Metabolism 661
AGE AND DEVELOPMENT INFLUENCE CEREBRAL ENERGY METABOLISM
Metabolic rate increases during early development
The energy metabolism of the brain and the blood flow that sustains it vary considerably from birth to old age. Data on the cerebral metabolic rate obtained directly in vivo are lacking for the early postnatal period, but the results of in vitro measurements in animal brain preparations and inferences drawn from cerebral blood flow measurements in intact animals [29] suggest that cerebral oxygen consumption is low at birth, rises rapidly during the period of cerebral growth and development and reaches a maximal level at about the time maturation is completed. This rise is consistent with the progressive increase in the levels of a number of enzymes of oxidative metabolism in the brain. The rate ofblood flow in different structures of the brain reaches peak levels at different times, depending on the maturation rate of the particular structure. In structures that consist predominantly of white matter, the peaks coincide roughly with maximal rates of myelination. From these peaks, blood flow and, probably, cerebral metabolic rate decline to the levels characteristic of adulthood.
Metabolic rate declines and plateaus after maturation
Reliable quantitative data on the changes in cerebral circulation and metabolism in humans
from the middle of the first decade of life to old age are summarized in Table 31-6. By 6 years of age, cerebral blood flow and oxygen consumption already have attained high rates, and they decline thereafter to the rates of normal young adulthood [15]. Cerebral oxygen consumption of5.2 ml/100 g brain tissue/min in a 5- to 6-yearold child corresponds to total oxygen consumption by the brain of approximately 60 ml!min, or more than 50% of the total body basal oxygen consumption, a proportion markedly greater than that occurring in adulthood. The reasons for the extraordinarily high cerebral metabolic rates in children are unknown, but presumably they reflect the extra energy requirements for the biosynthetic processes associated with growth and development.
Tissue pathology, but not aging, produces secondary changes in metabolic rate
Whole-brain cerebral blood flow and oxygen consumption normally remain essentially unchanged between young adulthood and old age. In a population of normal elderly men in their eighth decade of life, who were selected carefully for good health and freedom from all disease including vascular disease, both blood flow and oxygen consumption were not significantly different from rates of normal young men SO years younger (see Table 31-6) [30]. In a comparable group of elderly subjects, who differed only by the presence of objective evidence of minimal arteriosclerosis, cerebral blood flow was signifi-
AGE AND SENILITY•
Cerebral Age blood flow
life period and condition (years) (ml/100 g/min)
Childhood fib 1Q6b
Normal young adulthood 21 62
Aged
Normal elderly 71 ' 58
Elderly with minimal arteriosclerosis 73b 48b
Elderly with senile psychosis 72' 48b,c
•From Kennedy and Sokoloff [151 and Sokoloff [301. bStatistically significant difference from normal young adult (p < 0.05). cStatistically significant difference from normal elderly subjects (p < 0.05).
Cerebral 0 2
consumption (ml/100 g/min)
5.2b
3.5
3.3
3.2 2.7b.c
Cerebral venous 0 2 tension (mmHg)
38
36 33b,c
33b.c
662 Part Five Metabolism
cantly lower. It had reached a point at which the oxygen tension of the cerebral venous blood declined, an indication of relative cerebral hypoxia. However, normal cerebral oxygen consumption was maintained through extraction of larger than normal proportions of the arterial blood oxygen. In senile, psychotic patients with arteriosclerosis, cerebral blood flow was no lower but cerebral oxygen consumption had declined. These data suggest that aging per se need not lower cerebral oxygen consumption and blood flow but that, when blood flow is reduced, it is probably secondary to vascular disease, which produces cerebral vascular insufficiency and chronic relative hypoxia in the brain, or to another tissue pathology that decreases function, such as dementia (see Chap. 46). Because arteriosclerosis and Alzheimer's disease are so prevalent in the aged population, most individuals probably follow the latter pattern. However, agerelated changes in local regulation are possible and are the subject of research (see Chap. 30).
CEREBRAL METABOLIC RATE IN VARIOUS PHYSIOLOGICAL STATES
Cerebral metabolic rate is determined locally by functional activity in discrete regions
In organs such as heart or skeletal muscle that perform mechanical work, increased functional activity clearly is associated with increased metabolic rate. In nervous tissues outside the central nervous system, electrical activity is an almost quantitative indicator of the degree of functional activity; and in structures such as sympathetic ganglia and postganglionic axons, increased electrical activity produced by electrical stimulation definitely is associated with increased utilization of oxygen. Within the central nervous system, local energy metabolism also is correlated closely with the level of local functional activity. Studies using the [14C]deoxyglucose method have demonstrated pronounced changes in glucose utilization associated withaltered functional activity in discrete regions of the central nervous system specifically related to that
function [21]. For example, diminished visual or auditory input depresses glucose utilization in all components of the central visual or auditory pathways, respectively (Fig. 31-4). Focal seizures increase glucose utilization in discrete components of the motor pathways, such as the motor cortex and the basal ganglia (Fig. 31-5).
Convulsive activity, induced or spontaneous, often has been employed as a method of increasing electrical activity of the brain (see Chap. 37). Davies and Remand [13] used the oxygen electrode technique in the cerebral cortex of cat and found increases in oxygen consumption during electrically induced or druginduced convulsions. Because the increased oxygen consumption either coincided with or followed the onset of convulsions, it was concluded that the elevation in metabolic rate was the consequence of the increased functional activity produced by the convulsive state (see Chaps. 37 and 54).
Metabolic rate and nerve conduction are related directly
The [ 14C] deoxyglucose method has defined the nature and mechanisms of the relationship between energy metabolism and functional activity in nervous tissues. Studies in the superior cervical ganglion of the rat have shown almost a direct relationship between glucose utilization in the ganglion and spike frequency in the afferent fibers from the cervical sympathetic trunk [31]. A spike results from the passage of a finite current ofNa + into the cell and ofK+ out of the cell, ion currents that degrade the ionic gradients responsible for the resting membrane potential. Such degradation can be expected to stimulate Na,K-ATPase activity to restore the ionic gradients to normal, and such ATPase activity in tum would stimulate energy metabolism. Indeed, Mata et al. [32] have found that, in the posterior pituitary in vitro, stimulation of glucose utilization due to either electrical stimulation or opening of Na + channels in the excitable membrane by veratridine is blocked by ouabain, a specific inhibitor ofNa,K-ATPase activity (see Chap. 5). Most, if not all, of the stimulated energy metabolism associated with increased functional activity is confined to the axonal terminals
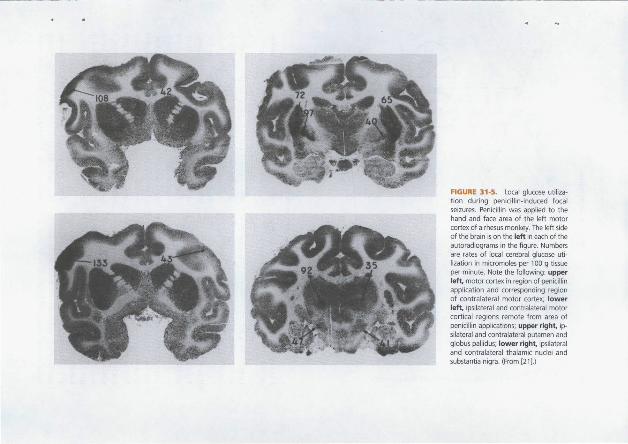
FIGURE 31-5. Local glucose utiliza~
tion during penicillin~induced focal seizures. Penicillin was applied to the hand and face area of the left motor cortex of a rhesus monkey. The left side of the brain is on the left in each of the autoradiograms in the figure. Numbers are rates of local cerebral glucose utilization in micromoles per 100 g tissue per minute. Note the following: upper left motor cortex in region of penicillin application and corresponding region of contralateral motor cortex; lower left ipsilateral and contralateral motor cortical regions remote from area of penicillin applications; upper right, ipsilateral and contralateral putamen and globus pallidus; lower right, ipsilateral and contralateral thalamic nuclei and substant ia nigra. (From [21 }.)
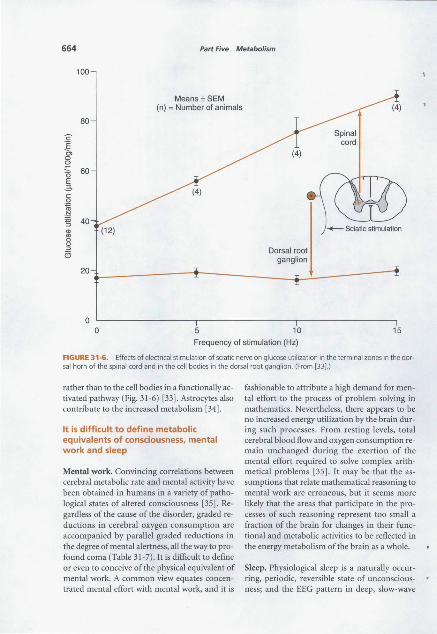
664 Part Five Metabolism
100
Means ±SEM (n) =Number of animals
80
c E
"' 0 0
"' 60 0 E 6 c: 0
~ ~ :s 40 Q) (12) "' 0
" :J Dorsal root a ganglion
20
0 0 5 10 15
Frequency of stimulation (Hz)
FIGURE 31·6. Effects of electrical stimulation of sciatic nerve on glucose utilization in the terminal zones in the dorsal horn of the spinal cord and in the cell bodies in the dorsal root ganglion . (From [331.)
rather than to the cell bodies in a functionally activated pathway (Fig. 31-6) [33]. Astrocytes also contribute to the increased metabolism [34].
It is difficult to define metabolic equivalents of consciousness, mental work and sleep
Mental work. Convincing correlations between cerebral metabolic rate and mental activity have been obtained in humans in a variety of pathological states of altered consciousness [35]. Regardless of the cause of the disorder, graded reductions in cerebral oxygen consumption are accompanied by parallel graded reductions in the degree of mental alertness, all the way to profound coma (Table 31-7). It is difficult to define or even to conceive of the physical equivalent of mental work. A common view equates concentrated mental effort with mental work, and it is
fashionable to attribute a high demand for mental effort to the process of problem solving in mathematics. Nevertheless, there appears to be no increased energy utilization by the brain during such processes. From resting levels, total cerebral blood flow and oxygen consumption remain unchanged during the exertion of the mental effort required to solve complex arithmetical problems [35]. It may be that the assumptions that relate mathematical reasoning to mental work are erroneous, but it seems more likely that the areas that participate in the processes of such reasoning represent too small a fraction of the brain for changes in their ftmctional and metabolic activities to be reflected in the energy metabolism of the brain as a whole.
Sleep. Physiological sleep is a naturally occurring, periodic, reversible state of unconsciousness; and the EEG pattern in deep, slow-wave
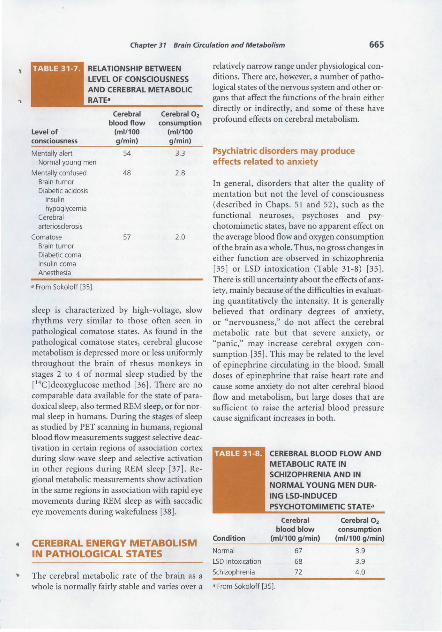
Chapter 31 Brain Circulation and Metabolism 665
RELATIONSHIP BETWEEN LEVEL OF CONSCIOUSNESS
Level of consciousness
Mentally alert Normal young men
Mentally confused Brain tumor Diabetic acidosis
Insulin hypoglycemia
Cerebral arteriosclerosis
Comatose Brain tumor Diabetic coma Insulin coma Anesthesia
• From Sokoloff [35].
Cerebral blood flow
(ml/100 g/min)
54
48
57
Cerebral 0 2
consumption (ml/100 g/min)
3.3
2.8
2.0
sleep is characterized by high-voltage, slow rhythms very similar to those often seen in pathological comatose states. As found in the pathological comatose states, cerebral glucose metabolism is depressed more or less uniformly throughout the brain of rhesus monkeys in stages 2 to 4 of normal sleep studied by the [ 14C]deoxyglucose method [36]. There are no comparable data available for the state of paradoxical sleep, also termed REM sleep, or for normal sleep in humans. During the stages of sleep as studied by PET scanning in humans, regional blood flow measurements suggest selective deactivation in certain regions of association cortex during slow-wave sleep and selective activation in other regions during REM sleep [37]. Regional metabolic measurements show activation in the same regions in association with rapid eye movements during REM sleep as with saccadic eye movements during wakefulness [38].
CEREBRAL ENERGY METABOLISM IN PATHOLOGICAL STATES
The cerebral metabolic rate of the brain as a
relatively narrow range under physiological conditions. There are, however, a number of pathological states of the nervous system and other organs that affect the functions of the brain either directly or indirectly, and some of these have profound effects on cerebral metabolism.
Psychiatric disorders may produce effects related to anxiety
In general, disorders that alter the quality of mentation but not the level of consciousness (described in Chaps. 51 and 52), such as the functional neuroses, psychoses and psychotomimetic states, have no apparent effect on the average blood flow and oxygen consumption of the brain as a whole. Thus, no gross changes in either function are observed in schizophrenia [35] or LSD intoxication (Table 31-8) [35]. There is still uncertainty about the effects of anxiety, mainly because of the difficulties in evaluating quantitatively the intensity. It is generally believed that ordinary degrees of anxiety, or "nervousness," do not affect the cerebral metabolic rate but that severe anxiety, or "panic," may increase cerebral oxygen consumption [35]. This may be related to the level of epinephrine circulating in the blood. Small doses of epinephrine that raise heart rate and cause some anxiety do not alter cerebral blood flow and metabolism, but large doses that are sufficient to raise the arterial blood pressure cause significant increases in both.
CEREBRAL BLOOD FLOW AND METABOLIC RATE IN SCHIZOPHRENIA AND IN NORMAL YOUNG MEN DUR
ING LSD-INDUCED PSYCHOTOMIMETIC STATE•
Cerebral blood blow
Condition (ml/100 g/min)
Normal 67
LSD intoxication 68
Schizophrenia 72
Cerebral 0 2
consumption (ml/100 g/min)
3.9
3 .9
4.0
whole is normally fairly stable and varies over a • From Sokoloff [35].
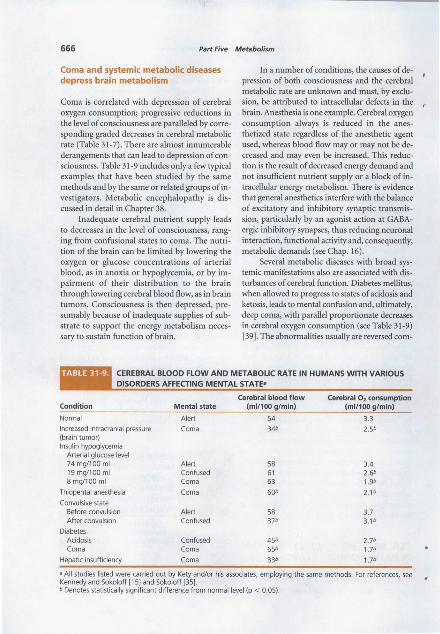
666 Part Five Metabolism
Coma and systemic metabolic diseases depress brain metabolism
Coma is correlated with depression of cerebral oxygen consumption; progressive reductions in the level of consciousness are paralleled by corresponding graded decreases in cerebral metabolic rate (Table 31-7). There are almost innumerable derangements that can lead to depression of consciousness. Table 31-9 includes only a few typical examples that have been studied by the same methods and by the same or related groups of investigators. Metabolic encephalopathy is discussed in detail in Chapter 38.
Inadequate cerebral nutrient supply leads to decreases in the level of consciousness, ranging from confusional states to coma. The nutrition of the brain can be limited by lowering the oxygen or glucose concentrations of arterial blood, as in anoxia or hypoglycemia, or by impairment of their distribution to the brain through lowering cerebral blood flow, as in brain tumors. Consciousness is then depressed, presumably because of inadequate supplies of substrate to support the energy metabolism necessary to sustain function of brain.
In a number of conditions, the causes of depression of both consciousness and the cerebral metabolic rate are unknown and must, by exclusion, be attributed to intracellular defects in the brain. Anesthesia is one example. Cerebral oxygen consumption always is reduced in the anesthetized state regardless of the anesthetic agent used, whereas blood flow may or may not be decreased and may even be increased. This reduction is the result of decreased energy demand and not insufficient nutrient supply or a block of intracellular energy metabolism. There is evidence that general anesthetics interfere with the balance of excitatory and inhibitory synaptic transmission, particularly by an agonist action at GABAergic inhibitory synapses, thus reducing neuronal interaction, functional activity and, consequently, metabolic demands (see Chap. 16).
Several metabolic diseases with broad systemic manifestations also are associated with disturbances of cerebral function. Diabetes mellitus, when allowed to progress to states of acidosis and ketosis, leads to mental .confusion and, ultimately, deep coma, with parallel proportionate decreases in cerebral oxygen consumption (see Table 31-9) [39]. The abnormalities usually are reversed com-
CEREBRAL BLOOD FLOW AND METABOLIC RATE IN HUMANS WITH VARIOUS DISORDERS AFFECTING MENTAL STATE•
Cerebral blood flow Cerebral 0 2 consumption Condition Mental state (ml/100 g/min) (ml/100 g/min)
Normal Alert 54 3.3
Increased intracranial pressure Coma 34b 2.5b (brain tumor) Insulin hypoglycemia
Arterial glucose level 74 mg/100 ml Alert 58 3.4 19 mg/100 ml Confused 61 2.6'> 8 mg/100 ml Coma 63 1.9b
Thiopental anesthesia Coma 60b 2.1b
Convulsive state Before convulsion Alert 58 3.7 After convulsion Confused 37b 3.1b
Diabetes Acidosis Confused 45b 2.7b Coma Coma 65b 1.7b
Hepatic insufficiency Coma 33b 1.7b
a All studies listed were carried out by Kety and/or his associates, employing the same methods. For references, see Kennedy and Sokoloff [15] and Sokoloff [35]. b Denotes statistically significant difference from normal level (p < 0.05).
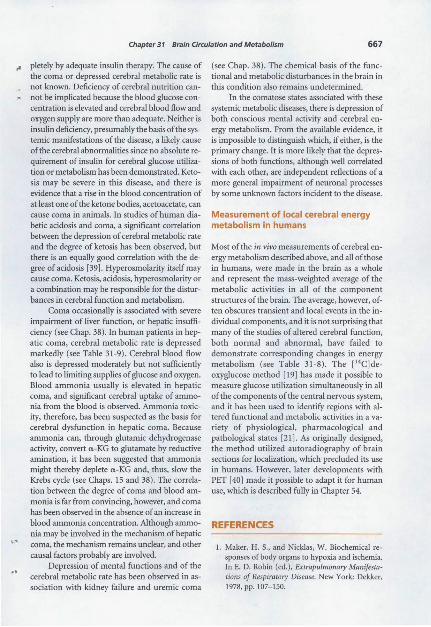
Chapter 31 Brain Circulation and Metabolism 667
,. pletely by adequate insulin therapy. The cause of the coma or depressed cerebral metabolic rate is not known. Deficiency of cerebral nutrition cannot be implicated because the blood glucose concentration is elevated and cerebral blood flow and oxygen supply are more than adequate. Neither is insulin deficiency, presumably the basis of the systemic manifestations of the disease, a likely cause of the cerebral abnormalities since no absolute requirement of insulin for cerebral glucose utilization or metabolism has been demonstrated. Ketosis may be severe in this disease, and there is evidence that a rise in the blood concentration of at least one of the ketone bodies, acetoacetate, can cause coma in animals. In studies of human diabetic acidosis and coma, a significant correlation between the depression of cerebral metabolic rate and the degree of ketosis has been observed, but there is an equally good correlation with the degree of acidosis [39]. Hyperosmolarity itself may cause coma. Ketosis, acidosis, hyperosmolarity or a combination may be responsible for the disturbances in cerebral function and metabolism.
Coma occasionally is associated with severe impairment of liver function, or hepatic insufficiency (see Chap. 38). In human patients in hepatic coma, cerebral metabolic rate is depressed markedly (see Table 31-9). Cerebral blood flow also is depressed moderately but not sufficiently to lead to limiting supplies of glucose and oxygen. Blood ammonia usually is elevated in hepatic coma, and significant cerebral uptake of ammonia from the blood is observed. Ammonia toxicity, therefore, has been suspected as the basis for cerebral dysfunction in hepatic coma. Because ammonia can, through glutamic dehydrogenase activity, convert o:-KG to glutamate by reductive amination, it has been suggested that ammonia might thereby deplete o:-KG and, thus, slow the Krebs cycle (see Chaps. 15 and 38). The correlation between the degree of coma and blood ammonia is far from convincing, however, and coma has been observed in the absence of an increase in blood ammonia concentration. Although ammonia may be involved in the mechanism of hepatic coma, the mechanism remains unclear, and other causal factors probably are involved.
Depression of mental functions and of the cerebral metabolic rate has been observed in association with kidney failure and uremic coma
(see Chap. 38). The chemical basis of the functional and metabolic disturbances in the brain in this condition also remains undetermined.
In the comatose states associated with these systemic metabolic diseases, there is depression of both conscious mental activity and cerebral energy metabolism. From the available evidence, it is impossible to distinguish which, if either, is the primary change. It is more likely that the depressions of both functions, although well correlated with each other, are independent reflections of a more general impairment of neuronal processes by some unknown factors incident to the disease.
Measurement of local cerebral energy metabolism in humans
Most of the in vivo measurements of cerebral energy metabolism described above, and all of those in humans, were made in the brain as a whole and represent the mass-weighted average of the metabolic activities in all of the component structures of the brain. The average, however, often obscures transient and local events in the individual components, and it is not surprising that many of the studies of altered cerebral function, both normal and abnormal, have failed to demonstrate corresponding changes in energy metabolism (see Table 31-8). The [14C]deoxyglucose method [19] has made it possible to measure glucose utilization simultaneously in all of the components of the central nervous system, and it has been used to identify regions withaltered functional and metabolic activities in a variety of physiological, pharmacological and pathological states [21]. As originally designed, the method utilized autoradiography of brain sections for localization, which precluded its use in humans. However, later developments with PET [ 40] made it possible to adapt it for human use, which is described fully in Chapter 54.
REFERENCES
1. Maker, H. S., and Nicklas, W. Biochemical responses of body organs to hypoxia and ischemia. In E. D. Robin (ed.), Extrapulmonary Manifestations of Respiratory Disease. New York: Dekker, 1978, pp. 107-150.
668 Part Five Metabolism
2. Gatfield, P. D., Lowry, 0. H., Schulz, D. W., and
Passoneau, J. V. Regional energy reserves in mouse brain and changes with ischaemia and anaesthesia./. Neurochem. 13:185-195, 1966.
3. Lowry, 0. H., and Passoneau, J. V. The relationships between substrates and enzymes of glycolysis in brain.]. Bioi. Chern. 239:31-32, 1964.
4. Meyer, R. A., and Sweeney, H. L. A simple analysis of the "phosphocreatine shuttle." Am./. Physiol. 246:365- 377, 1984.
5. Goldberg, N.D., and O'Toole, A. G. The proper
ties of glycogen synthetase and regulation of glycogen biosynthesis in rat brain. /. Biol. Chern. 244:3053-3061, 1969.
6. Matthews, C. K., and van Holde, K. E., Biochemistry, 2nd. ed. Redwood City, California: Benjamin, Cummings, 1996, pp. 474-477.
7. Stewart, M.A., and Moonsammy, G. I. Substrate changes in peripheral nerve recovering from anoxia. /. Neurochem. 13:1433-1439, 1966.
8. Gaitonde, M. K., Evison, E., and Evans, G. M. The rate of utilization of glucose via hexosemonophosphate shunt in brain. f . Neurochem. 41:1253-1260, 1983.
9. Morgan-Hughes, J. A. Mitochondrial disease. TrendsNeurosci. 9:15-19,1986.
10. Waelsch, H., Berl, S., Rossi, C. A., Clarke, D. D.,
and Purpura, D. P. Quantitative aspects of C02
fixation in mammalian brain in vivo. f. Neurochem.l l:717-728, 1964.
11. Clarke, D. D. Fluoroacetate and fluorocitrate: Mechanism of action. Neurochem. Res. 16:1055-1058, 199!.
12. Leong, S. F., Lai, ). C. K., Lim, L., and Clark,). B. The activities of some energy metabolizing enzymes in non synaptic (free) and synaptic mitochondria derived from selected brain regions. f. Neurochem. 42:1308-1312, 1984.
13. Davies, P. W., and Remand, A. Oxygen consumption of the cerebral cortex of the cat during metrazole convulsions. Res. Publ. Assoc. Nerv. Ment. Dis. 26:205-217, 1946.
14. Kety, S. S., and Schmidt, C. F. The nitrous oxide method for the quantitative determination of cerebral blood flow in man: Theory, procedure, and normal values. f. Clin. Invest. 27:476-483, 1948.
15. Kennedy, C., and Sokoloff, L. An adaptation of the nitrous oxide method to the study of the
cerebral circulation in children; normal values for cerebral blood flow and cerebral metabolic rate in childhood.]. Clin. Invest. 36:1130- 1137, 1957.
16. Sokoloff, L. The metabolism of the central ner- a. vous system in vivo. In J. Field, H. W. Magoun, and V. E. Hall (eds.), Handbook of PhysiologyNeurophysiology. Washington, D.C.: American ... Physiological Society, 1960, Vol. 3, pp. 1843-1864.
17. Sokoloff, L., and Kety, S. S. Regulation of cerebral circulation. Physiol. Rev. 40(Suppl. 4):38-44, 1960.
18. Freygang, W. H., and Sokoloff, L. Quantitative
measurements of regional circulation in the central nervous system by the use of radioactive inert gas. Adv. Bioi. Med. Phys. 6:263-279, 1958.
19. Sokoloff, L., Reivich, M., Kennedy, C., et al. The [ 14C)deoxyglucose method for the measurement of local cerebral glucose utilization: Theory, procedure, and normal values in the conscious and anesthetized albino rat.]. Neurochem. 28:897-916, 1977.
20. Sokoloff, L. Local cerebral energy metabolism: Its relationships to local functional activity and blood flow. In M. ). Purves and L. Elliott (eds.), Cerebral Vascular Smooth Muscle and Its Control (Ciba Foundation Symposium 56). Amsterdam: Elsevier/Excerpta Medica/North Holland, 1978, pp. 171-197.
21. Sokoloff, L. Relation between physiological function and energy metabolism in the central nervous system.]. Neurochem. 29:13-26, 1977.
22. Kennedy, C., Sakurada, 0., Shinohara, M., Jehle, }., and Sokoloff, L. Local cerebral glucose utilization in the normal conscious Macaque monkey. Ann. Neurol. 4:293- 301, 1978.
23. Himwich, H. E., and Nahum, L. H. The respiratory quotient of testicle. Am. ]. Physiol. 88:68()...{;85, 1929.
24. Kety, S. S., Woodford, R. B., Harmel, M. H., Freyhan, F. A., Appel, K. E., and Schmidt, C. F. Cerebral flow and metabolism in schizophrenia. The effects of barbiturate seminarcosis, insulin coma, and electroshock. Am.]. Psychiatry 104:765-770, 1948.
25. Sloviter, H. A., and Kamimoto, T. The isolated, perfused rat brain preparation metabolizes mannose but not maltose. /. Neurochem. 17:1109-1111, 1970.
26. Owen, 0 . E., Morgan, A. P., Kemp, H. G., Sullivan, J. M., Herrera, M. G., and Cahill, G. F., Jr.
Brain metabolism during fasting. ]. Clin. Invest. 46:1589-1595, 1967.
27. Krebs, H. A., William son, D. H., Bates, M. W., Page, M. A., and Hawkins, R. A. The role of ketone bodies in caloric homeostatis. Adv. Enzyme Regul. 9:387-409, 197!.
Chapter 31 Brain Circulation and Metabolism 669
28. Klee, C. B., and Sokoloff, L. Changes in o(- )-~hydroxybutyric dehydrogenase activity during brain maturation in the rat. }. Biol. Chern. 242:388{}-3883, 1967.
29. Kennedy, C., Grave, G. D., Jehle, /. W., and Sokoloff, L. Changes in blood flow in the component structures of the dog brain during postnatal maturation.}. Neurochem. 19:2423-2433, 1972.
30. Sokoloff, L. Cerebral circulatory and metabolic changes associated with aging. Res. Pub!. Assoc. Nerv. Ment. Dis. 41:237-254, 1966.
31. Yarowsky, P., Kadekaro, M., and Sokoloff, L. Frequency-dependent activation of glucose utilization in the superior cervical ganglion by electrical stimulation of cervical sympathetic trunk. Proc. Nat/. Acad. Sci. USA 80:4179-4183, 1983.
32. Mata, M., Fink, D. }., Gainer, H., et al. Activitydependent energy metabolism in rat posterior pituitary primarily reflects sodium pump activity. f. Neurochem. 34:213-215, 1980.
33. Kadekaro, M., Crane, A. M., and Sokoloff, L. Differential effects of electrical stimulation of sciatic nerve on metabolic activity in spinal cord and dorsal root ganglion in the rat. Proc. Natl. Acad. Sci. USA 82:601{}-6013, 1985.
34. Takahashi, S., Driscoll, B. F., Law,M./., and Sokoloff, L. Role of sodium and potassium ions in regulation of glucose metabolism in cultured astroglia. Proc. Nat/. Acad. Sci. USA 92:4616-4620, 1995.
35. Sokoloff, L. Cerebral circulation and behavior in man: Strategy and findings. In A. J. Mandell and M. P. Mandell (eds.), Psychochemical Research in Man. New York: Academic, 1969, pp. 237-252.
36. Kennedy, C., Gillin, /. C., Mendelson, W., et a!. Local cerebral glucose utilization in non-rapid
eye movement sleep. Nature 297:325-327, 1982. 37. Braun, A. R., Balkin, T. ]., Wesenten, N. ]., et al.
Regional cerebral blood flow through the sleep-wake cycle. An H2 [ 150] PET study. Brain 120:1173-1197,1997.
38. Hong, C. C., Gillin,/. C., Dow, B. M., Wu, J., and Buchsbaum, M. S. Localized and lateralized cerebral glucose metabolism associated with eye movements during REM sleep and wakefulness: A positron emission tomography (PET) study. Sleep 18:57{}-580, 1995.
39. Kety, S. S., Polis, B. D., Nadler, C. S., and Schmidt, C. F. Blood flow and oxygen consumption of the human brain in diabetic . acidosis and coma. f. Clin.lnvest. 27:50{}-510, 1948.
40. Reivich, M., Kuhl, D., Wolf, A., etal. The [l 8F)fluorodeoxyglucose method for the measurement of local cerebral glucose utilization in man. Circ. Res. 44:127-137, 1979.
41. Passoneau, ]. V., Lowry, 0. H., Schulz, D. W. and Brown, J, G. Glucose-1,6-diphosphate formation by phosphoglucomutase in mammalian tissues.}. Bioi. Chern. 244:902-909, 1969.
42. Breckenridge, B. M. and Crawford E. T. The quantitative histochemistry of the brain. }. Neurochem. 7:234-240, 1961.
43. Matchinsky, F. M. Energy metabolism of the microscopic structures of the cochlea, the retina, and the cerebellum in biochemistry of simple neuronal models. E. Costa and E. Giacobini (eds.). Adv. Biochem. Psychopharm. 2:217-243, 1970.
44. Mcilwain, H. Biochemistry and the Central Nervous System, 3rd ed. Boston: Little, Brown, 1966, pp. 1-26.