Embed Size (px)
DESCRIPTION
Circulation
Citation preview

990
The physical examination of a patient often includes an assessment of whether a patient looks younger or older
than his or her actual age.1,2 This practice assumes that the perceived age of a patient correlates with age-related disease and mortality, and thus that patients appearing older than their chronological age are more likely to be in poor health, com-pared with patients appearing their actual age. Previous stud-ies have found that male pattern baldness,3 grey hair,3,4 and facial wrinkles4,5 as well as presence of arcus corneae3 are all associated with looking old for one’s age.
Clinical Perspective on p 998
Male pattern baldness, grey hair, and facial wrinkles are all common signs of aging. Presence of ≥1 of these visible age-related signs have been associated with increased risk of ischemic cardiovascular disease in most6–11 but not all studies.12,13 In contrast, male pattern baldness, grey hair, and facial wrinkles did not associate with death.14–16 Earlobe crease, xanthelasmata,
and arcus corneae are appearance factors, which like the com-mon age-related signs occur more frequently with increasing age. Earlobe crease is a diagonal fold or wrinkle in the skin of the earlobe, whereas xanthelasmata and arcus corneae are cholesterol deposits on the eyelids and in the cornea, respec-tively.17–19 Most studies confirm an association between earlobe crease and risk of cardiovascular disease20–24 or death,25 although some studies argue that this association is mainly attributable to an association between earlobe crease and increasing age.26 We have recently shown that xanthelasmata and arcus corneae are associated with an increased risk of ischemic heart disease (IHD) and death independent of age and sex—and for xanthe-lasmata also independent of plasma lipid levels.27
Cardiovascular disease is 1 of the most common age-related diseases, and also 1 of the most common causes of death in the general population. Assuming that presence of visible age-related signs are a marker of the actual biological age of an individual, we tested the hypothesis that age-related
Background—Cardiovascular disease is 1 of the most common age-related diseases, and also 1 of the most common causes of death in the general population. We tested the hypothesis that visible age-related signs associate with risk of ischemic heart disease (IHD), myocardial infarction (MI), and death in the general population, independent of chronological age.
Methods and Results—10,885 individuals aged 20 to 93 years free of IHD were followed from 1976 through 1978 until June 2011 with 100% complete follow-up. During these 35 years of follow-up, 3401 participants developed IHD and 1708 developed MI. Presence of frontoparietal baldness, crown top baldness, earlobe crease, and xanthelasmata was associated with increased risk of IHD or MI after multifactorial adjustment for chronological age and well-known cardiovascular risk factors. The risk of IHD and MI increased stepwise with increasing number of age-related signs with multifactorially adjusted hazard ratios up to 1.40 (95% confidence interval, 1.20–1.62) for IHD and 1.57 (1.28–1.93) for MI, in individuals with 3 to 4 versus no age-related signs at baseline (P for trend <0.001). In all age groups in both women and men, absolute 10-year risk of IHD and MI increased with increasing number of visible age-related signs.
Conclusions—Male pattern baldness, earlobe crease, and xanthelasmata—alone or in combination—associate with increased risk of ischemic heart disease and myocardial infarction independent of chronological age and other well-known cardiovascular risk factors. This is the first prospective study to show that looking old for your age is a marker of poor cardiovascular health. (Circulation. 2014;129:990-998.)
Key Words: aging ◼ epidemiology ◼ myocardial ischemia
© 2013 American Heart Association, Inc.
Circulation is available at http://circ.ahajournals.org DOI: 10.1161/CIRCULATIONAHA.113.001696
Continuing medical education (CME) credit is available for this article. Go to http://cme.ahajournals.org to take the quiz. Received February 13, 2013; accepted October 24, 2013.
From the Department of Clinical Biochemistry, Rigshospitalet, Copenhagen, Denmark (M.C., R.F.-S.,A.T.-H.); The Copenhagen City Heart Study, Frederiksberg Hospital, Copenhagen, Denmark (P.S., G.B.J., B.G.N., A.T.-H.); the Department of Cardiology, Hvidovre Hospital, Hvidovre, Denmark (G.B.J.); Department of Clinical Biochemistry, Herlev Hospital, Copenhagen, Denmark (B.G.N.); and Copenhagen University Hospitals and Faculty of Health Sciences, University of Copenhagen, Copenhagen, Denmark (M.C., R.F.-S., P.S., G.B.J., B.G.N., A.T.-H.).
The online-only Data Supplement is available with this article at http://circ.ahajournals.org/lookup/suppl/doi:10.1161/CIRCULATIONAHA. 113.001696/-/DC1.
Correspondence to Anne Tybjærg-Hansen MD, DMSc, Department of Clinical Biochemistry KB 3011, Section for Molecular Genetics KB 4111, Rigshospitalet, Copenhagen University Hospital, Blegdamsvej 9, DK-2100 Copenhagen Ø, Denmark. E-mail [email protected]
Visible Age-Related Signs and Risk of Ischemic Heart Disease in the General Population
A Prospective Cohort Study
Mette Christoffersen, MSc; Ruth Frikke-Schmidt, MD, DMSc; Peter Schnohr, MD, DMSc; Gorm B. Jensen, MD, DMSc; Børge G. Nordestgaard, MD, DMSc; Anne Tybjærg-Hansen, MD, DMSc
by guest on May 4, 2015http://circ.ahajournals.org/Downloaded from by guest on May 4, 2015http://circ.ahajournals.org/Downloaded from by guest on May 4, 2015http://circ.ahajournals.org/Downloaded from by guest on May 4, 2015http://circ.ahajournals.org/Downloaded from by guest on May 4, 2015http://circ.ahajournals.org/Downloaded from by guest on May 4, 2015http://circ.ahajournals.org/Downloaded from by guest on May 4, 2015http://circ.ahajournals.org/Downloaded from by guest on May 4, 2015http://circ.ahajournals.org/Downloaded from by guest on May 4, 2015http://circ.ahajournals.org/Downloaded from by guest on May 4, 2015http://circ.ahajournals.org/Downloaded from by guest on May 4, 2015http://circ.ahajournals.org/Downloaded from by guest on May 4, 2015http://circ.ahajournals.org/Downloaded from by guest on May 4, 2015http://circ.ahajournals.org/Downloaded from by guest on May 4, 2015http://circ.ahajournals.org/Downloaded from by guest on May 4, 2015http://circ.ahajournals.org/Downloaded from by guest on May 4, 2015http://circ.ahajournals.org/Downloaded from by guest on May 4, 2015http://circ.ahajournals.org/Downloaded from by guest on May 4, 2015http://circ.ahajournals.org/Downloaded from by guest on May 4, 2015http://circ.ahajournals.org/Downloaded from by guest on May 4, 2015http://circ.ahajournals.org/Downloaded from by guest on May 4, 2015http://circ.ahajournals.org/Downloaded from by guest on May 4, 2015http://circ.ahajournals.org/Downloaded from by guest on May 4, 2015http://circ.ahajournals.org/Downloaded from by guest on May 4, 2015http://circ.ahajournals.org/Downloaded from by guest on May 4, 2015http://circ.ahajournals.org/Downloaded from by guest on May 4, 2015http://circ.ahajournals.org/Downloaded from by guest on May 4, 2015http://circ.ahajournals.org/Downloaded from by guest on May 4, 2015http://circ.ahajournals.org/Downloaded from by guest on May 4, 2015http://circ.ahajournals.org/Downloaded from by guest on May 4, 2015http://circ.ahajournals.org/Downloaded from by guest on May 4, 2015http://circ.ahajournals.org/Downloaded from by guest on May 4, 2015http://circ.ahajournals.org/Downloaded from by guest on May 4, 2015http://circ.ahajournals.org/Downloaded from by guest on May 4, 2015http://circ.ahajournals.org/Downloaded from by guest on May 4, 2015http://circ.ahajournals.org/Downloaded from by guest on May 4, 2015http://circ.ahajournals.org/Downloaded from by guest on May 4, 2015http://circ.ahajournals.org/Downloaded from by guest on May 4, 2015http://circ.ahajournals.org/Downloaded from by guest on May 4, 2015http://circ.ahajournals.org/Downloaded from by guest on May 4, 2015http://circ.ahajournals.org/Downloaded from by guest on May 4, 2015http://circ.ahajournals.org/Downloaded from by guest on May 4, 2015http://circ.ahajournals.org/Downloaded from

Christoffersen et al Age-Related Signs and Ischemic Heart Disease 991
signs—individually and combined—associate with risk of IHD, myocardial infarction (MI), and death in the general population, independent of chronological age. We studied 10 885 participants from the Copenhagen City Heart Study cohort and followed them from 1976 to 1978 until June 2011.
MethodsParticipantsThe Copenhagen City Heart Study is a prospective cardiovascular study of the Danish general population initiated in 1976 to 1978 with follow-up examinations in 1981 to 1983, 1991 to 1994, and 2001 to 2003. We invited 19 329 white women and men of Danish descent strati-fied into 5-year age groups from 20 years to 80 years or older, and drawn randomly from the National Danish Central Person Registry. Data were obtained from a self-administered questionnaire, a physical examina-tion, and from blood samples. All questionnaires were checked during the examination by the staff in collaboration with the participant.28
Of those participants invited, 14 223 (74%) attended and 10 885 individuals (56%) in whom complete information on all relevant variables including age-related signs were available at baseline, were included in this study. Participants were followed up using their unique Central Person Register number from baseline at the 1976 to 1978 examination through June 2011. Follow-up for all end points, including IHD, MI, and death, was 100% complete (ie, none were lost to follow-up). The study was approved by institutional review boards and by Danish ethical committees (the Copenhagen and Frederiksberg committee and the Copenhagen County committee; KF-100.2039/91, KF-01-144/01, H-KF-01-144/01), and conducted according to the Declaration of Helsinki. Participants gave written informed consent.
Age-Related signsTrained nurses or medical laboratory technicians, who were unaware of the participants’ risk and disease profile, determined the presence and extent of male pattern baldness, grey hair, facial wrinkles, earlobe crease, xanthelasmata, and arcus corneae by careful visual inspection during the physical examination, according to prespecified criteria (Figure 1 for representative examples). For a detailed description of the criteria used to diagnose the age-related signs, see the Methods section in the online-only Data Supplement.
Ischemic Heart Disease, Myocardial Infarction, and DeathDiagnosis of MI and IHD (World Health Organization: International Classification of Diseases, Eighth Revision codes 410 and 410–414;
International Classification of Diseases Tenth Revision codes I21–I22 and I20–I25) were collected and verified by reviewing all hospital admissions and diagnoses entered in the National Danish Patient Registry, all causes of death entered in the National Danish Causes of Death Registry, and medical records from hospitals and general practitioners. IHD was fatal or nonfatal MI or characteristic symptoms of angina pectoris, including revascularization procedures29; death from other causes led to censoring. A diagnosis of MI followed the changing definitions over time. After 2000 the diagnosis was based on either 1 of the following: (1) Typical rise and fall of biochemical markers of myocardial necrosis (troponin or CK-MB) with at least 1 of the following: ischemic symptoms, develop-ment of pathological Q waves on the ECG, ECG changes indicative of ischemia, or coronary artery intervention; or (2) Pathological findings of an acute, healed, or healing MI,30 with later changes as indicated.31
Information on date of death was obtained from the National Danish Central Person Registry, which is 100% complete.
CovariatesEnzymatic methods (Boehringer Mannheim, Mannheim, Germany) were used on fresh plasma samples to measure plasma levels of total cholesterol and triglycerides. Body mass index was measured weight in kilograms divided by height in meters squared. Hypertension was use of antihypertensive medication, a systolic blood pressure of >140 mm Hg, or a diastolic blood pressure of >90 mm Hg. Diabetes mellitus was self-reported disease, use of insulin or oral hypoglycemic agents, or nonfasting plasma glucose levels of more than 11 mmol/L (>198 mg/dL). Smoking in packyears was the accumulated smoking expo-sure calculated from the questionnaires and categorized as 0 packyears (nonsmokers and smokers having smoked less than 1 pack of ciga-rettes per day for 1 month), <10 packyears (smokers having smoked corresponding to 1 pack of cigarettes per day for a period between 1 month and 10 years), 10 to 20 packyears (smokers having smoked cor-responding to 1 pack of cigarettes per day for a period between 10 and 20 years), and ≥20 packyears (smokers having smoked correspond-ing to 1 pack of cigarettes per day for ≥20 years). Regular alcohol consumers drank alcohol at least twice weekly, whereas light drink-ers consumed alcohol less often. Physical inactivity was leisure time activity <4 hours weekly. Women reported menopausal status and use of hormonal replacement therapy. Family history of ischemic vascular disease was ≥1 parent with a previous MI or ischemic stroke. Education and income were included as markers of socioeconomic status of the participants. Education was <8 years of education versus ≥8 years of education. Income was a 1976 to 1978 income <10 000 Danish kroner per month versus ≥10 000 Danish kroner per month (≈1730 US dollars).
Figure 1. Photographs of visible age-related signs. A, Frontoparietal baldness. B, Crown top baldness. C, Earlobe crease. D, Arcus corneae. E, Xanthelasmata. Photographs: Børge G. Nordestgaard and Mette Christoffersen.
by guest on May 4, 2015http://circ.ahajournals.org/Downloaded from

992 Circulation March 4, 2014
Statistical AnalysesSTATA software, version 12.0 (Stata Corp, College Station, TX) was used for all analyses. Two-sided probability values less than 0.05 were consid-ered significant. The Mann–Whitney U test or Pearson χ2 test were used in 2-group comparisons. Cumulative incidences of IHD and MI were plotted with the use of Kaplan–Meier curves, and differences between individu-als with increasing number of visible age-related signs were examined by log-rank tests. Cox proportional hazards regression models were used to estimate hazard ratios with 95% confidence intervals for IHD, MI, and death as a function of age-related signs, individually and combined. Participants with multiple episodes of IHD were censored after the first event. We used time (in years) from study entry as the time scale to calcu-late crude hazard ratios and hazard ratios adjusted for age at study entry. We further used age as the time scale and left truncation (or delayed entry) to calculate adjusted hazard ratios. Using age as the time scale is the gold standard for prospective studies on risk of disease and mortality, since this is the scale over which the most dramatic change in risk occurs.32 This further implies that age is automatically adjusted for in the best possible way, since at every time point each individual is compared with individu-als of the exact same age. Because participants were not followed from
birth, the choice of age as time scale requires data to be analyzed using delayed entry.32 This takes into account that a period of ignorance exists before an individual enters into the study, a period in which the individual may have been subjected to the effects on risk associated with visible age-related signs. Additional adjustments were for sex, or multifactorially for sex, total cholesterol, triglycerides, body mass index, hypertension, diabe-tes mellitus, smoking in packyears, alcohol consumption, physical inac-tivity, postmenopausal status and use of hormonal replacement therapy, family history of ischemic vascular disease, education and income. The assumption of linearity on the log risk scale was examined for continuous covariates (age at study entry, total cholesterol, triglycerides, and body mass index) by including each covariate squared, one at a time, in the fully adjusted regression models. We used piecewise linear splines with four knots placed at percentiles of the data, when adjusting for these fac-tors in the Cox regression model. Proportionality of hazards over time was assessed by plotting −ln[−ln(survival)] versus ln(analysis time), and tested using Schoenfeld residuals. No major violations of the proportional hazards assumption were observed. Competing risk of any death was accounted for by censoring at the date of death.
Interaction between presence or absence of visible age-related signs and sex on risk of IHD, MI, and death were evaluated by the inclusion of
Table. Baseline Characteristics of Individuals From the Copenhagen City Heart Study Stratified by Incident Ischemic Heart Disease, Myocardial Infarction, and Total Death During Follow-Up
Ischemic heart disease Myocardial infarction Total death
No event IHD No event MI No event Death
No. of individuals, n (%) 7484 (69) 3401 (31) 9177 (84) 1708 (16) 3163 (29) 7722 (71)
Age, y 52 (42–59) 56 (49–64)* 53 (43–60) 56 (49–63)* 41 (36–48) 57 (50–64)*
Sex (F/M) 3704/3780 1353/2048* 4483/4694 574/1134* 1780/1383 3277/4445*
Total cholesterol, mmol/L 5.9 (5.1–6.7) 6.2 (5.5–7.0)* 5.9 (5.2–6.7) 6.3 (5.6–7.2)* 5.6 (4.9–6.3) 6.1 (5.4–7.0)*
Triglycerides, mmol/L 1.4 (1.0–2.0) 1.6 (1.2–2.4)* 1.4 (1.0–2.1) 1.8 (1.2–2.5)* 1.2 (0.9–1.8) 1.6 (1.1–2.3)*
Body mass index, kg/m2 24 (22–27) 26 (23–28)* 25 (22–27) 26 (23–28)* 24 (22–26) 25 (23–28)*
Hypertension, n (%) 3291 (44) 2044 (60)* 4275 (47) 1060 (62)* 853 (27) 4482 (58)*
Diabetes mellitus, n (%) 162 (2) 156 (5)* 227 (2) 91 (5)* 15 (0.5) 303 (4)*
Smoking, packyears 10 (0–25) 15 (0–30)* 10 (0–26) 17 (0–30)* 3 (0–15) 16 (0–30)*
Regular alcohol consumer, n (%) 4110 (55) 1807 (53) 5006 (55) 911 (53) 1635 (52) 4282 (55)*
Physically inactive, n (%) 5414 (72) 2528 (74)† 6672 (73) 1270 (74) 2131 (67) 5811 (75)*
Postmenopausal, n (%) 2256 (61) 1076 (80)* 2865 (64) 467 (81)* 572 (32) 2760 (84)*
Hormonal replacement therapy, n (%) 489 (22) 207 (19) 613 (21) 83 (18) 179 (31) 517 (19)*
Lipid-lowering therapy, n (%) 0 0 0 0 0 0
Family history of IVD, n (%) 2228 (30) 1231 (36)* 2802 (31) 657 (38)* 901 (28) 2558 (33)*
Education < 8 yr, n (%) 3382 (45) 1769 (52)* 4232 (46) 919 (54)* 1047 (33) 4104 (53)*
Income < 10 000 DKK/mo, n (%) 5905 (79) 2789 (82)* 7296 (80) 1398 (82)† 2368 (75) 6326 (82)*
Frontoparietal baldness (F/M), n (%) 295(8)/3220(85) 140(10)†/1871(91)* 366(8)/4039(86) 69(12)†/1052(93)* 118(7)/1055(76) 317(10)*/4036(91)*
Crown top baldness (F/M), n (%) 29(1)/1659(44) 26(2)†/1099(54)* 45(1)/2150(46) 10(2)/608(54)* 3(0.2)/393(28) 52(2)*/2365(47)*
Greying of hair, n (%) 2545 (34) 1547 (46)* 3307 (36) 785 (46)* 487 (15) 3605 (47)*
Facial wrinkles, n (%) 4006 (54) 2197 (65)* 5100 (56) 1103 (65)* 1068 (34) 5135 (67)*
Earlobe crease, n (%) 1465 (20) 970 (29)* 1934 (21) 501 (29)* 331 (10) 2104 (27)*
Xanthelasmata, n (%) 298 (4) 190 (6)* 382 (4) 106 (6)* 83 (3) 405 (5)*
Arcus corneae, n (%) 1710 (23) 1079 (32)* 2262 (25) 527 (31)* 244 (8) 2545 (33)*
Data are median (interquartile range) or percent. Hypertension was use of antihypertensive medication, a systolic blood pressure of 140 mm Hg or greater, or a diastolic blood pressure of 90 mm Hg or greater. Diabetes mellitus was self-reported disease, use of insulin or oral hypoglycemic agents, or nonfasting plasma glucose levels of more than 11 mmol/L (>198 mg/dL). Packyears was the accumulated smoking exposure calculated from the questionnaires. Regular alcohol consumer was consumption of alcohol at least twice weekly. Physically inactive was leisure time activity <4 h weekly. Women reported menopausal status and use of hormonal replacement therapy. Family history of ischemic vascular disease (IVD) was ≥1 parent with a previous myocardial infarction or ischemic stroke. Education was less than 8 yr of education. Income in 1976 through 1978 was <10 000 Danish kroner (DKK) per month (≈1730 US dollars). Frontoparietal baldness, crown top baldness, earlobe crease, xanthelasmata, and arcus corneae were all presence of the trait. Facial wrinkles were prominent facial wrinkles. Greying of hair was moderate to complete greying of hair. Individuals who dyed their hair or used a wig were excluded from the study. To convert triglycerides to mg/dL, divide by 0.0113; to convert cholesterol to mg/dL, divide by 0.0259.
*P<0.001, †P<0.05 by Mann–Whitney U test or Pearson χ2 test.
by guest on May 4, 2015http://circ.ahajournals.org/Downloaded from

Christoffersen et al Age-Related Signs and Ischemic Heart Disease 993
2-factor interaction terms in the Cox regression model, using a likelihood ratio test between models excluding and including the interaction term.
Absolute 10-year risks of IHD and MI in women and men as a func-tion of age (<40 years, 40–49 years, 50–59 years, 60–69 years, 70–79 years) and number of visible age-related signs were estimated by cal-culation of subhazard ratios using the method of Fine and Gray,33 thus accounting for the competing risk of death. Data were presented as estimated incidence rates (number of events per 10 years) in percent.
For a description of the various sensitivity analyses performed, see the Methods in the online-only Data Supplement.
ResultsBaseline characteristics of individuals from the general popula-tion by incident IHD, MI, and death are shown in the Table. During a follow-up of up to 35 years (mean follow-up 23 years), 3401 participants developed IHD, 1708 developed MI, and 7722 died. Baseline characteristics of individuals excluded from the study are shown in Table I in the online-only Data Supplement.
Individual Age-Related Signs and Risk of Ischemic Heart Disease and DeathThe associations between presence of age-related signs and risk of IHD, MI, and death are presented in Figure 2 (unad-justed, or adjusted for age at study entry) and Figure 3 (adjusted for age and sex, or multifactorially, see below). There was no
interaction between visible age-related signs and sex on risk of either end point (Figure I in the online-only Data Supplement). However, results for frontoparietal and crown top baldness are stratified by sex to account for the fact that male pattern bald-ness is more common in men compared with women.
All visible age-related signs associated with increased risk of IHD, MI, and total death before adjustment for potential con-founders (Figure 2). After adjustment for age at study entry, or age and sex combined, presence of frontoparietal baldness, crown top baldness, greying of hair, earlobe crease, xanthelasmata, and arcus corneae remained associated with increased risk of IHD or MI, and xanthelasmata and arcus corneae in addition with total death (Figure 2, right columns and Figure 3, left columns for the individual end points). After multifactorial adjustment for well-known cardiovascular risk factors and markers of socioeconomic status (age, sex, total cholesterol, triglycerides, body mass index, hypertension, diabetes mellitus, smoking in packyears, alcohol consumption, physical activity, postmenopausal status, hormonal replacement therapy, education, income, and family history of ischemic vascular disease), only frontoparietal baldness, crown top baldness, earlobe crease, and xanthelasmata remained inde-pendently associated with IHD or MI. Frontoparietal baldness associated with multifactorially adjusted hazard ratios of 1.14
Figure 2. Crude estimates and estimates adjusted for age at study entry for risk of ischemic heart disease, myocardial infarction, and total death in the Copenhagen City Heart Study in individuals with vs without moderate to complete greying of hair, prominent facial wrinkles, earlobe crease, xanthelasmata, arcus corneae, frontoparietal baldness, or crown top baldness. Hazard ratios and 95% confidence intervals (CI) for ischemic heart disease, myocardial infarction, and total death are from the Copenhagen City Heart Study 1976 to 1978 examination (n=10 885; follow-up up to 35 years; mean follow-up 23 years). Data are analyzed from study entry using time (in years) as the time scale. The left columns for each end point are crude estimates without any corrections; right columns for each end point are adjusted for age at study entry using piecewise linear splines. *The number indicates the upper 95% CI limit, when this exceeds the width of the graph/scale of the hazard ratio.
by guest on May 4, 2015http://circ.ahajournals.org/Downloaded from

994 Circulation March 4, 2014
(confidence interval [CI],0.98–1.33) for IHD and 1.40 (CI, 1.12–1.76) for MI in men, with similar though less significant results in women. Corresponding values for crown top baldness were 1.09 (CI, 1.00–1.19) and 1.13 (CI, 1.01–1.28) in men—again with similar findings in women. Hazard ratios for IHD and MI in individuals with earlobe crease were respectively, 1.09 (CI, 1.01–1.18) and 1.09 (CI, 0.98–1.22). In individuals with xanthelasmata, multifactorially adjusted hazard ratios were 1.30 (CI, 1.12–1.50) for IHD and 1.37 (CI, 1.12–1.67) for MI (Figure 3). After mul-tifactorial adjustment, only xanthelasmata remained associated with increased risk of total death with a hazard ratio of 1.13 (CI, 1.02–1.24; Figure 3). Results on the association between visible age-related signs and risk of death from myocardial infarction were essentially similar to results for risk of myocardial infarc-tion (compare Figure II in the online-only Data Supplement with Figure 3, middle right column).
Multiple Age-Related Signs and Risk of Ischemic Heart Disease and DeathTo account for the likelihood of having >1 visible age-related sign at the same time, we further scrutinized frontoparietal
baldness, crown top baldness, earlobe crease, and xanthelas-mata, all of which individually associated with an increased risk of IHD or MI after multifactorial adjustment. For each individ-ual we counted the number of these age-related signs, resulting in a range from 0 to a maximum of 4 age-related signs.
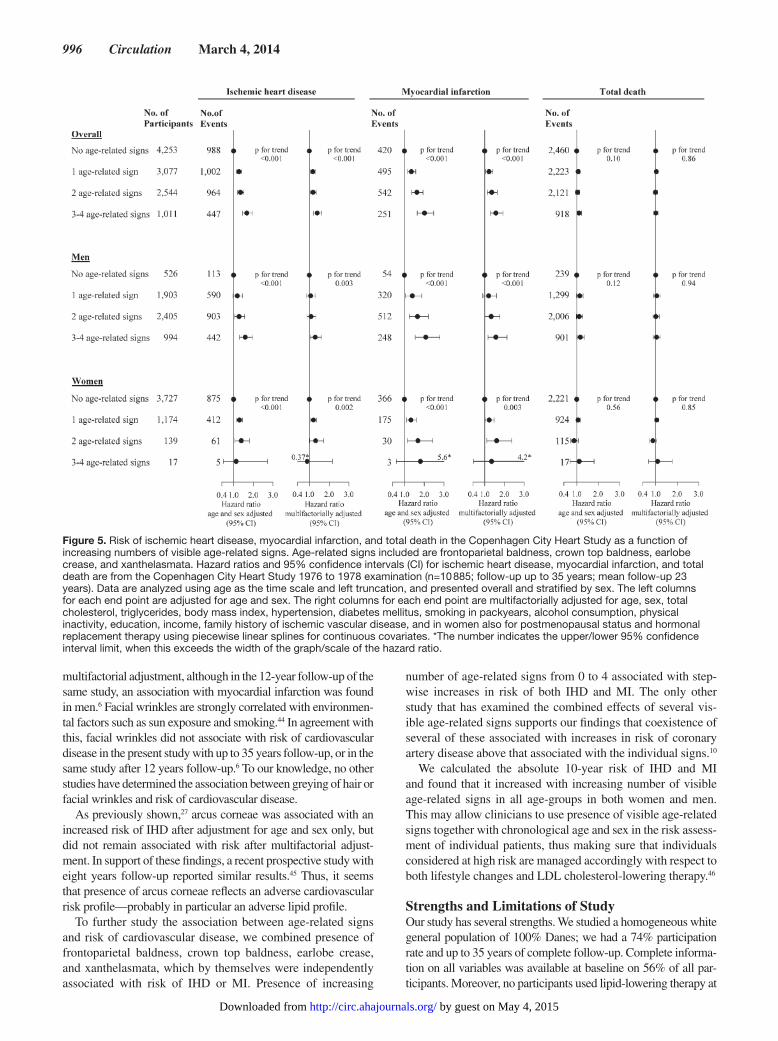
The cumulative incidences of IHD and MI increased stepwise with increasing number of age-related signs, and were similar for the crude analysis and for the analysis adjusted for age at study entry (log-rank trend, P<0.0001; Figure III in the online-only Data Supplement and Figure 4). Multifactorially adjusted hazard ratios were 1.40 (CI, 1.20–1.62) for IHD and 1.57 (CI, 1.28–1.93) for MI in individuals with 3 to 4 age-related signs compared with indi-viduals with no age-related signs at baseline (P for trend <0.001; Figure 5). To account for the fact that male pattern baldness is much more common in men compared with women, we also performed analyses stratified by sex; results were similar for women and men (Figure III in the online-only Data Supplement and Figures 4 and 5). After multifactorial adjustment, increasing number of age-related signs did not associate with total death (Figure 5).
The significant associations between increasing number of age-related signs and risk of IHD and MI were examined
Figure 3. Adjusted risk estimates for ischemic heart disease, myocardial infarction, and total death in the Copenhagen City Heart Study in individuals with vs without moderate to complete greying of hair, prominent facial wrinkles, earlobe crease, xanthelasmata, arcus corneae, frontoparietal baldness, or crown top baldness. Hazard ratios and 95% confidence intervals (CI) for ischemic heart disease, myocardial infarction, and total death are from the Copenhagen City Heart Study 1976 to 1978 examination (n=10 885; follow-up up to 35 years; mean follow-up 23 years). Data are analyzed using age as the time scale and left truncation. The left columns for each end point are adjusted for age and sex. The right columns for each end point are multifactorially adjusted for age, sex, total cholesterol, triglycerides, body mass index, hypertension, diabetes, smoking in packyears, alcohol consumption, physical inactivity, education, income, family history of ischemic vascular disease, and in women also for postmenopausal status and hormonal replacement therapy using piecewise linear splines for continuous covariates. *The number indicates the upper/lower 95% confidence interval limit, when this exceeds the width of the graph/scale of the hazard ratio.
by guest on May 4, 2015http://circ.ahajournals.org/Downloaded from

Christoffersen et al Age-Related Signs and Ischemic Heart Disease 995
further by calculating absolute 10-year risks. In all age groups in both women and men, absolute 10-year risks of IHD and MI increased with increasing number of age-related signs (Figure 6). The highest absolute 10-year risk of IHD of 21% was in men 70 to 79 years of age presenting with 3 to 4 age-related signs. In men 70 to 79 years of age without age-related signs the corresponding 10-year risk of IHD was 13%. Equivalent values in women were 18% and 12%. The highest absolute 10-year risk of MI of 10% was in men aged 60 to 69 years presenting with 3 to 4 age-related signs. In men 60 to 69 years of age without age-related signs the corresponding 10-year risk of MI was 6%. Equivalent values in women were 7% and 4%.
Sensitivity AnalysesTo account for the strong association between age-related signs and chronological age we performed further adjustment for age at study entry (Figures IV and V in the online-only Data Supplement). The results on risk of IHD, MI, and total death were similar to those shown in Figures 3 and 5.
Analyses treating age-related signs, individually and com-bined, as time-varying covariates, were similar to the model using only the baseline assessment of age-related signs (Tables II–IX in the online-only Data Supplement).
DiscussionThis is the first prospective study to find that looking old for your age is a marker of poor cardiovascular health. The princi-pal findings are that the visible age-related signs: male pattern baldness, earlobe crease, and xanthelasmata, individually and combined, associate with increased risk of IHD and MI in the general population, independent of chronological age and other well-known cardiovascular risk factors. In contrast, greying of hair and arcus corneae associate with increased risk of IHD and MI after adjustment for age and sex, but not after multifactorial adjustment; and facial wrinkles did not associate with risk.
Comparison With Other StudiesThe present prospective study is substantially larger than most previous studies on the association between age-related signs and risk of cardiovascular disease. With one exception,10 all previous studies have investigated the association between a single age-related sign and risk of cardiovascular disease, although individuals may develop several age-related signs at the same time. Therefore, we investigated both the associa-tion between individual age-related signs and combinations of several age-related signs and risk of IHD.
Most previous case–control studies on the individual age-related signs, male pattern baldness, earlobe crease or xan-thelasmata, and risk of cardiovascular disease have confirmed an association, although no consensus exists on the importance of these age-related signs in clinical practice. There is a strong genetic predisposition to male pattern baldness, and several studies have suggested involvement of the androgen pathway.34 The hair follicles are a target for androgens, and the expression of androgen receptors was significantly higher in dermal papilla cells from balding scalp compared with nonbalding scalp fol-licles.35 This and other observations36,37 led to the hypothesis that free testosterone acts on both the hair follicle and the vessel wall, leading to both male pattern baldness and proliferation of smooth muscle cells—a key event in the formation of the ath-erosclerotic plaque. In addition, recent genomewide association studies have revealed loci on chromosome 7 and 20 associ-ated with male pattern baldness, suggesting a possible role for androgen-independent pathways as a common cause of male pattern baldness and cardiovascular disease.38–40 Possible expla-nations for the increased risk of IHD associated with presence of earlobe crease and xanthelasmata may be altered characteristics of the connective tissue in these individuals reflected both in the dermis and in the arterial intima. This might lead to an increased propensity to retain cholesterol in the connective tissue, which in turn could explain the association to cardiovascular disease.18,41
Physiological hair greying is caused by defective renewal of melanocyte stem cells, which has been suggested to be caused by accumulation of DNA damage associated with aging.42 Because DNA damage may also be a causal factor in atherosclerosis,43 greying of hair may be a marker of susceptibility to atheroscle-rosis and possibly other age-related diseases. In the present study, greying of hair did not associate with risk of IHD or MI after
Figure 4. Cumulative incidences of ischemic heart disease (IHD) and myocardial infarction (MI) as a function of age in the Copenhagen City Heart Study in individuals with no (green line), 1 (yellow line), 2 (blue line) or 3 to 4 (red line) visible age-related signs. Age-related signs included are frontoparietal baldness, crown top baldness, earlobe crease, and xanthelasmata. Cumulative incidences were by the Kaplan–Meier method with age as the x axis.
by guest on May 4, 2015http://circ.ahajournals.org/Downloaded from
996 Circulation March 4, 2014
multifactorial adjustment, although in the 12-year follow-up of the same study, an association with myocardial infarction was found in men.6 Facial wrinkles are strongly correlated with environmen-tal factors such as sun exposure and smoking.44 In agreement with this, facial wrinkles did not associate with risk of cardiovascular disease in the present study with up to 35 years follow-up, or in the same study after 12 years follow-up.6 To our knowledge, no other studies have determined the association between greying of hair or facial wrinkles and risk of cardiovascular disease.
As previously shown,27 arcus corneae was associated with an increased risk of IHD after adjustment for age and sex only, but did not remain associated with risk after multifactorial adjust-ment. In support of these findings, a recent prospective study with eight years follow-up reported similar results.45 Thus, it seems that presence of arcus corneae reflects an adverse cardiovascular risk profile—probably in particular an adverse lipid profile.
To further study the association between age-related signs and risk of cardiovascular disease, we combined presence of frontoparietal baldness, crown top baldness, earlobe crease, and xanthelasmata, which by themselves were independently associated with risk of IHD or MI. Presence of increasing
number of age-related signs from 0 to 4 associated with step-wise increases in risk of both IHD and MI. The only other study that has examined the combined effects of several vis-ible age-related signs supports our findings that coexistence of several of these associated with increases in risk of coronary artery disease above that associated with the individual signs.10
We calculated the absolute 10-year risk of IHD and MI and found that it increased with increasing number of visible age-related signs in all age-groups in both women and men. This may allow clinicians to use presence of visible age-related signs together with chronological age and sex in the risk assess-ment of individual patients, thus making sure that individuals considered at high risk are managed accordingly with respect to both lifestyle changes and LDL cholesterol-lowering therapy.46
Strengths and Limitations of StudyOur study has several strengths. We studied a homogeneous white general population of 100% Danes; we had a 74% participation rate and up to 35 years of complete follow-up. Complete informa-tion on all variables was available at baseline on 56% of all par-ticipants. Moreover, no participants used lipid-lowering therapy at
Figure 5. Risk of ischemic heart disease, myocardial infarction, and total death in the Copenhagen City Heart Study as a function of increasing numbers of visible age-related signs. Age-related signs included are frontoparietal baldness, crown top baldness, earlobe crease, and xanthelasmata. Hazard ratios and 95% confidence intervals (CI) for ischemic heart disease, myocardial infarction, and total death are from the Copenhagen City Heart Study 1976 to 1978 examination (n=10 885; follow-up up to 35 years; mean follow-up 23 years). Data are analyzed using age as the time scale and left truncation, and presented overall and stratified by sex. The left columns for each end point are adjusted for age and sex. The right columns for each end point are multifactorially adjusted for age, sex, total cholesterol, triglycerides, body mass index, hypertension, diabetes mellitus, smoking in packyears, alcohol consumption, physical inactivity, education, income, family history of ischemic vascular disease, and in women also for postmenopausal status and hormonal replacement therapy using piecewise linear splines for continuous covariates. *The number indicates the upper/lower 95% confidence interval limit, when this exceeds the width of the graph/scale of the hazard ratio.
by guest on May 4, 2015http://circ.ahajournals.org/Downloaded from

Christoffersen et al Age-Related Signs and Ischemic Heart Disease 997
baseline in 1976 through 1978, and thus none of the lipid profiles of the participants were biased from treatment effects. This makes this study unique in its ability to evaluate the association between age-related signs and risk of cardiovascular disease.
A limitation to the generalizability of our study is that we only examined whites. The prevalence of different age-related signs, as well as the association with risk of IHD may differ among dif-ferent ethnicities. Therefore, our findings may not necessarily translate to populations of other ethnicities. Another limitation is that the diagnosis of all age-related signs, though performed by trained nurses and technicians according to prespecified criteria, was based on visual inspection, and that we did not have data to confirm the inter- and intraobserver consistency of the assessment of age-related features over the period of assessment. However, the prevalence of the age-related signs in our study corresponds well with previous reports in the literature.12,18,19,22 Finally, although we have adjusted for a large number of covariates, an ever-present influence of unmeasured confounders may still influ-ence our results. In particular, low-density lipoprotein cholesterol, high-density lipoprotein cholesterol, lipoprotein(a), and apolipo-proteins were not measured at baseline in 1976 through 78, and thus were not adjusted for. However, we adjusted for total cho-lesterol (ie, cholesterol in low-density lipoproteins, high-density lipoproteins, remnants, and lipoprotein(a)) and for nonfasting triglycerides. The use of cardioprotective medication over time was not registered and accordingly not adjusted for. However, this would probably have led to bias toward the null. In addition, some covariates were partly self-reported, specifically hypertension and
diabetes mellitus, but could be verified for the majority by relevant ICD diagnosis, or by treatment with relevant drugs.
ConclusionWe show that male pattern baldness, earlobe crease, and xanthelasmata—alone or in combination—associate with increased risk of IHD and MI in the general population, inde-pendent of chronological age and other well-known cardio-vascular risk factors. In contrast, greying of hair and arcus corneae was not associated with increased risk of IHD and MI after adjustment for these risk factors.
AcknowledgmentsWe thank the staff and participants from the Copenhagen City Heart Study for their important contributions to our study.
Sources of FundingThis study was funded by the Faculty of Health Sciences, University of Copenhagen; the Lundbeck Foundation; the Research Fund at Rigshospitalet; the Danish Medical Research Council; and the Danish Heart Foundation. The sponsors had no role in the design of the study; in the collection, analysis, and interpretation of the data; in the writing of the report; and in the decision to submit the article for publication. The views expressed in this article are those of the authors and not those of any funding body or other whose support is acknowledged.
DisclosuresNone.
References 1. Sherertz EF, Hess SP. Stated age. N Engl J Med. 1993;329:281–282. 2. Chang HJ. Lower extremity purpura. JAMA. 2011;305:1911–1912. 3. Bulpitt CJ, Markowe HL, Shipley MJ. Why do some people look older
than they should? Postgrad Med J. 2001;77:578–581. 4. Gunn DA, Rexbye H, Griffiths CE, Murray PG, Fereday A, Catt SD,
Tomlin CC, Strongitharm BH, Perrett DI, Catt M, Mayes AE, Messenger AG, Green MR, van der Ouderaa F, Vaupel JW, Christensen K. Why some women look young for their age. PLoS One. 2009;4:e8021.
5. Fink B, Matts PJ. The effects of skin colour distribution and topogra-phy cues on the perception of female facial age and health. J Eur Acad Dermatol Venereol. 2008;22:493–498.
6. Schnohr P, Lange P, Nyboe J, Appleyard M, Jensen G. Gray hair, baldness, and wrinkles in relation to myocardial infarction: the Copenhagen City Heart Study. Am Heart J. 1995;130:1003–1010.
7. Lesko SM, Rosenberg L, Shapiro S. A case-control study of baldness in relation to myocardial infarction in men. JAMA. 1993;269:998–1003.
8. Ford ES, Freedman DS, Byers T. Baldness and ischemic heart disease in a national sample of men. Am J Epidemiol. 1996;143:651–657.
9. Lotufo PA, Chae CU, Ajani UA, Hennekens CH, Manson JE. Male pattern baldness and coronary heart disease: the Physicians’ Health Study. Arch Intern Med. 2000;160:165–171.
10. Mirić D, Fabijanić D, Giunio L, Eterović D, Culić V, Bozić I, Hozo I. Dermatological indicators of coronary risk: a case-control study. Int J Cardiol. 1998;67:251–255.
11. Mansouri P, Mortazavi M, Eslami M, Mazinani M. Androgenetic alopecia and coronary artery disease in women. Dermatol Online J. 2005;11:2.
12. Shahar E, Heiss G, Rosamond WD, Szklo M. Baldness and myocardial infarction in men: the atherosclerosis risk in communities study. Am J Epidemiol. 2008;167:676–683.
13. Gunn DA, de Craen AJ, Dick JL, Tomlin CC, van Heemst D, Catt SD, Griffiths T, Ogden S, Maier AB, Murray PG, Griffiths CE, Slagboom PE, Westendorp RG. Facial appearance reflects human familial longevity and cardiovascular disease risk in healthy individuals. J Gerontol A Biol Sci Med Sci. 2013;68:145–152.
14. Glasser M. Is early onset of gray hair a risk factor? Med Hypotheses. 1991;36:404–411.
15. Schnohr P, Nyboe J, Lange P, Jensen G. Longevity and gray hair, baldness, facial wrinkles, and arcus senilis in 13,000 men and women: the Copenhagen City Heart Study. J Gerontol A Biol Sci Med Sci. 1998;53:M347–M350.
Figure 6. Absolute 10-year risk of ischemic heart disease (IHD) and myocardial infarction (MI) in the Copenhagen City Heart Study in individuals with no (green), 1 (yellow), 2 (blue) or 3 to 4 (red) visible age-related signs stratified by sex and 10-year age groups. Age-related signs included are frontoparietal baldness, crown top baldness, earlobe crease, and xanthelasmata. Competing risk of death was accounted for using the method of Fine and Gray.33
by guest on May 4, 2015http://circ.ahajournals.org/Downloaded from

998 Circulation March 4, 2014
16. Menotti A, Mariotti S, Seccareccia F, Torsello S, Dima F. Determinants of all causes of death in samples of Italian middle-aged men followed up for 25 years. J Epidemiol Community Health. 1987;41:243–250.
17. Frank ST. Aural sign of coronary-artery disease. N Engl J Med. 1973;289:327–328.
18. Bergman R. The pathogenesis and clinical significance of xanthelasma palpebrarum. J Am Acad Dermatol. 1994;30(2 Pt 1):236–242.
19. Fernández A, Sorokin A, Thompson PD. Corneal arcus as coronary artery disease risk factor. Atherosclerosis. 2007;193:235–240.
20. Elliott WJ. Ear lobe crease and coronary artery disease. 1,000 patients and review of the literature. Am J Med. 1983;75:1024–1032.
21. Nyboe J, Jensen G, Appleyard M, Schnohr P. Risk factors for acute myocar-dial infarction in Copenhagen. I: Hereditary, educational and socioeconomic factors. Copenhagen City Heart Study. Eur Heart J. 1989;10:910–916.
22. Tranchesi Júnior B, Barbosa V, de Albuquerque CP, Caramelli B, Gebara O, Santos Filho RD, Nakano O, Bellotti G, Pileggi F. Diagonal earlobe crease as a marker of the presence and extent of coronary atherosclerosis. Am J Cardiol. 1992;70:1417–1420.
23. Evrengül H, Dursunoğlu D, Kaftan A, Zoghi M, Tanriverdi H, Zungur M, Kiliç M. Bilateral diagonal earlobe crease and coronary artery disease: a significant association. Dermatology. 2004;209:271–275.
24. Celik S, Erdoğan T, Gedikli O, Kiriş A, Erem C. Diagonal ear-lobe crease is associated with carotid intima-media thickness in subjects free of clini-cal cardiovascular disease. Atherosclerosis. 2007;192:428–431.
25. Elliott WJ, Karrison T. Increased all-cause and cardiac morbidity and mor-tality associated with the diagonal earlobe crease: a prospective cohort study. Am J Med. 1991;91:247–254.
26. Brady PM, Zive MA, Goldberg RJ, Gore JM, Dalen JE. A new wrinkle to the earlobe crease. Arch Intern Med. 1987;147:65–66.
27. Christoffersen M, Frikke-Schmidt R, Schnohr P, Jensen GB, Nordestgaard BG, Tybjærg-Hansen A. Xanthelasmata, arcus corneae, and ischaemic vascular disease and death in general population: prospective cohort study. BMJ. 2011;343:d5497.
28. Schnohr P, Jensen JS, Scharling H, Nordestgaard BG. Coronary heart dis-ease risk factors ranked by importance for the individual and community. A 21 year follow-up of 12 000 men and women from The Copenhagen City Heart Study. Eur Heart J. 2002;23:620–626.
29. Fox K, Garcia MA, Ardissino D, Buszman P, Camici PG, Crea F, Daly C, De Backer G, Hjemdahl P, Lopez-Sendon J, Marco J, Morais J, Pepper J, Sechtem U, Simoons M, Thygesen K, Priori SG, Blanc JJ, Budaj A, Camm J, Dean V, Deckers J, Dickstein K, Lekakis J, McGregor K, Metra M, Morais J, Osterspey A, Tamargo J, Zamorano JL; Task Force on the Management of Stable Angina Pectoris of the European Society of Cardiology; ESC Committee for Practice Guidelines (CPG). Guidelines on the management of stable angina pectoris: exec-utive summary: The Task Force on the Management of Stable Angina Pectoris of the European Society of Cardiology. Eur Heart J. 2006;27:1341–1381.
30. Myocardial infarction redefined--a consensus document of The Joint European Society of Cardiology/American College of Cardiology Committee for the redefinition of myocardial infarction. Eur Heart J. 2000;21:1502–1513.
31. Thygesen K, Alpert JS, White HD; Joint ESC/ACCF/AHA/WHF Task Force for the Redefinition of Myocardial Infarction. Universal definition of myocardial infarction. Eur Heart J. 2007;28:2525–2538.
32. Kirkwood BR, Sterne JAC. Medical statistics. 2nd ed.. Malden, MA, USA: Blackwell Science; 2003: 290–293.
33. Fine JP, Gray RJ. A proportional hazards model for the subdistribution of a competing risk. J Am Stat Assoc. 1999;94:496–509.
34. Alsantali A, Shapiro J. Androgens and hair loss. Curr Opin Endocrinol Diabetes Obes. 2009;16:246–253.
35. Hibberts NA, Howell AE, Randall VA. Balding hair follicle dermal papilla cells contain higher levels of androgen receptors than those from non-balding scalp. J Endocrinol. 1998;156:59–65.
36. Stárka L, Cermáková I, Dusková M, Hill M, Dolezal M, Polácek V. Hormonal profile of men with premature balding. Exp Clin Endocrinol Diabetes. 2004;112:24–28.
37. Arias-Santiago S, Gutiérrez-Salmerón MT, Castellote-Caballero L, Buendía-Eisman A, Naranjo-Sintes R. Androgenetic alopecia and cardio-vascular risk factors in men and women: a comparative study. J Am Acad Dermatol. 2010;63:420–429.
38. Hillmer AM, Brockschmidt FF, Hanneken S, Eigelshoven S, Steffens M, Flaquer A, Herms S, Becker T, Kortüm AK, Nyholt DR, Zhao ZZ, Montgomery GW, Martin NG, Mühleisen TW, Alblas MA, Moebus S, Jöckel KH, Bröcker-Preuss M, Erbel R, Reinartz R, Betz RC, Cichon S, Propping P, Baur MP, Wienker TF, Kruse R, Nöthen MM. Susceptibility variants for male-pattern baldness on chromosome 20p11. Nat Genet. 2008;40:1279–1281.
39. Richards JB, Yuan X, Geller F, Waterworth D, Bataille V, Glass D, Song K, Waeber G, Vollenweider P, Aben KK, Kiemeney LA, Walters B, Soranzo N, Thorsteinsdottir U, Kong A, Rafnar T, Deloukas P, Sulem P, Stefansson H, Stefansson K, Spector TD, Mooser V. Male-pattern baldness suscepti-bility locus at 20p11. Nat Genet. 2008;40:1282–1284.
40. Brockschmidt FF, Heilmann S, Ellis JA, Eigelshoven S, Hanneken S, Herold C, Moebus S, Alblas MA, Lippke B, Kluck N, Priebe L, Degenhardt FA, Jamra RA, Meesters C, Jöckel KH, Erbel R, Harrap S, Schumacher J, Fröhlich H, Kruse R, Hillmer AM, Becker T, Nöthen MM. Susceptibility variants on chromosome 7p21.1 suggest HDAC9 as a new candidate gene for male-pattern baldness. Br J Dermatol. 2011;165:1293–1302.
41. Friedlander AH, Scully C. Diagonal ear lobe crease and atherosclerosis: a review of the medical literature and oral and maxillofacial implications. J Oral Maxillofac Surg. 2010;68:3043–3050.
42. Nishimura EK. Melanocyte stem cells: a melanocyte reservoir in hair follicles for hair and skin pigmentation. Pigment Cell Melanoma Res. 2011;24:401–410.
43. Gray K, Bennett M. Role of DNA damage in atherosclerosis–bystander or participant? Biochem Pharmacol. 2011;82:693–700.
44. Yin L, Morita A, Tsuji T. Skin aging induced by ultraviolet exposure and tobacco smoking: evidence from epidemiological and molecular studies. Photodermatol Photoimmunol Photomed. 2001;17:178–183.
45. Fernandez AB, Keyes MJ, Pencina M, D’Agostino R, O’Donnell CJ, Thompson PD. Relation of corneal arcus to cardiovascular disease (from the Framingham Heart Study data set). Am J Cardiol. 2009;103:64–66.
46. Third Report of the National Cholesterol Education Program (NCEP) Expert Panel on Detection, Evaluation, and Treatment of High Blood Cholesterol in Adults (Adult Treatment Panel III) final report. Circulation. 2002;106:3143–3421.
CLINICAL PERSPECTIVEResults from the present study suggest that male pattern baldness, greying of hair, earlobe crease, xanthelasmata, and arcus cor-neae associate with risk of cardiovascular disease independent of age and sex. Thus, these age-related signs are not just a reflec-tion of the chronological age of an individual, but may instead reflect the physiological state of the body, and thus be a marker of poor cardiovascular health. This is important, because it justifies the common practice for the clinician on physical examination to include a statement of whether a patient looks younger or older than his or her actual age, as an indication of the patient’s general health status. The present study further revealed that male pattern baldness, earlobe crease, and xanthelasmata are mark-ers of ischemic heart disease independent of lipid levels and other well-known cardiovascular risk factors in addition to age and sex. Presence of these age-related signs alone—or especially in combination—should warrant further examination to make sure that these individuals are managed accordingly with regard to lifestyle changes and lipid-lowering therapy. The independent association between male pattern baldness, earlobe crease, and xanthelasmata and risk of ischemic heart disease indicates that these effects are mediated through other pathways than the classical risk factors. Further studies on the mechanisms underly-ing the increased risk of ischemic heart disease in individuals with these age-related signs may provide new insight into the pathogenesis of atherosclerosis, and thus may eventually reveal possible new risk factors for ischemic cardiovascular disease.
Go to http://cme.ahajournals.org to take the CME quiz for this article.
by guest on May 4, 2015http://circ.ahajournals.org/Downloaded from

SUPPLEMENTAL MATERIAL

1
METHODS
Age-related signs
Presence of age-related signs was registered at the baseline 1976-1978 examination and at the
first follow-up examination in 1981-1983.
The extent of male pattern baldness was described in two regions of the scalp –
the frontoparietal region and the crown top region - according to Hamilton,1 with minor
modifications (for photographs of baldness in the frontoparietal and crown top region see
Figure 1). In the frontoparietal region, baldness was registered as (1) no bald triangle; (2) bald
triangle but >3 cm in front of the ear; or (3) bald triangle <3 cm in front of the ear. For the
present study, we combined individuals into two groups: (1) no bald triangle; or (2) bald
triangle. In the crown top region, baldness was registered as (1) thick hair; (2) partly thin hair;
(3) bald spot; or (4) bald top and front. For the present study, we combined individuals into
two groups: (1) thick hair; or (2) thin hair or bald spot (corresponding to groups 2-4).
The extent of grey hair was described as (0) dyed hair; (1) no grey hairs; (2) few
grey hairs; (3) moderate grey hairs, (4) completely grey/white hair, or (5) wig. For the present
study, we combined individuals into two groups: (1) no or few grey hairs; or (2) moderate to
complete greying of hair. Individuals who dyed their hair or used a wig were excluded from
the study.
The extent of facial wrinkles was determined in the crow’s-foot area lateral to
the canthus of the right eye according to Daniell,2 with minor modifications. Participants were
classified as having (1) no wrinkles; (2) one to three shallow wrinkles less than 1.5 cm in
length; (3) one to six shallow wrinkles less than 3 cm in length; (4) several prominent
wrinkles not more than 4 cm in length plus shallow wrinkles; or (5) several prominent

2
wrinkles more than 4 cm in length plus shallow wrinkles. For the present study, we combined
individuals into two groups: (1) no or shallow wrinkles (corresponding to groups 1-3 above);
or (2) prominent wrinkles (groups 4-5).
Earlobe crease was determined on the right ear, and was (1) no earlobe crease;
(2) earlobe crease extending over less than half of the earlobe; or (3) earlobe crease extending
over more than half of the earlobe (for a photograph of earlobe crease see Figure 1). For the
present study, we combined individuals into two groups: (1) no earlobe crease; or (2) earlobe
crease present (corresponding to groups 2 and 3 above).
Arcus corneae was determined on the right eye, and was (1) no arcus; (2) half
arcus; or (3) complete arcus (for a photograph of arcus corneae see Figure 1). For the present
study, we combined individuals into two groups: (1) no arcus corneae; or (2) arcus corneae
present (corresponding to groups 2 and 3 above).
Xanthelasmata was determined on both eyes, and was: (1) no xanthelasmata; or
(2) xanthelasmata present (for a photograph of xanthelasmata see Figure 1).
Sensitivity analyses
To account for the robust association between age-related signs and age, we included an
additional adjustment for age by including age at study entry as a covariate in a separate
adjusted Cox regression analysis with age as the time scale.
We further included the assessment of age-related signs at the 1981-1983
follow-up examination, thus treating age-related signs as time-varying covariates. We
analyzed four different models: Model 1 and 2 included 10,885 individuals from the 1976-
1978 examination of the Copenhagen City Heart Study of whom 8,579 (79%) further attended
the 1981-1983 follow-up examination. For all participants, complete information on all
relevant variables including age-related signs was available at baseline. In model 2 we

3
assumed that individuals do not acquire fewer age-related signs over time. Accordingly
individuals with fewer age-related signs at the 1981-1983 examination compared to the 1976-
1978 examination were reclassified using the registration from the 1976-1978 examination
throughout the study period. Model 3 and 4 included 12,122 individuals from the Copenhagen
City Heart Study of whom 8,601 (71%) attended both the baseline 1976-1978 examination
and the 1981-1983 follow-up examination, 2,320 (19%) individuals who attended only the
1976-1978 baseline examination, and 1,201 (10%) individuals who attended only the 1981-
1983 follow-up examination. Participants entered the study at the time for the first
examination they attended. For all participants, complete information on all relevant variables
including age-related signs was available at study entry. In model 4 we assumed that
individuals do not acquire fewer age-related signs over time, accordingly individuals with
fewer age-related signs at the 1981-1983 examination compared to the 1976-1978
examination were reclassified, thus using the registration from the 1976-1978 examination
throughout the study period.

4
REFERENCES
(1) Hamilton JB. Patterned loss of hair in man; types and incidence. Ann N Y Acad Sci.
1951;53:708-728.
(2) Daniell HW. Smoker's wrinkles. A study in the epidemiology of "crow's feet". Ann
Intern Med. 1971; 5:873-880.

5
FIGURE LEGENDS
Supplementary Figure 1. Risk of ischemic heart disease, myocardial infarction, and total
death in the Copenhagen City Heart Study in individuals with versus without age-
related signs stratified by sex.
Hazard ratios and 95% confidence intervals for ischemic heart disease, myocardial infarction,
and total death are from the Copenhagen City Heart Study 1976-1978 examination (n=10,885;
follow-up up to 35 years; mean follow-up 23 years). Multifactorial adjustment was for age,
sex, total cholesterol, triglycerides, body mass index, hypertension, diabetes, smoking in
packyears, alcohol consumption, physical inactivity, education, income, family history of
ischemic vascular disease, and in women also for postmenopausal status and hormonal
replacement therapy using splines for continuous covariates.
*P-value for interaction between presence or absence of age-related signs and sex on risk of
ischemic heart disease, myocardial infarction, and total death. Within strata of sex, individuals
without age-related signs (reference group) have a hazard ratio of one, and are not shown.
Supplementary Figure 2. Adjusted risk estimates for death from myocardial infarction
in the Copenhagen City Heart Study in individuals with versus without moderate to
complete greying of hair, prominent facial wrinkles, earlobe crease, xanthelasmata,
arcus corneae, frontoparietal baldness, or crown top baldness.
Hazard ratios and 95% confidence intervals for ischemic heart disease, myocardial infarction,
and total death are from the Copenhagen City Heart Study 1976-1978 examination (n=10,885;
follow-up up to 35 years; mean follow-up 23 years). Multifactorial adjustment was for age,
sex, total cholesterol, triglycerides, body mass index, hypertension, diabetes, smoking in

6
packyears, alcohol consumption, physical inactivity, education, income, family history of
ischemic vascular disease, and in women also for postmenopausal status and hormonal
replacement therapy using splines for continuous covariates. *The number indicates the upper
95% confidence interval limit, when this exceeds the width of the graph/scale of the hazard
ratio.
Supplementary Figure 3. Cumulative incidence of ischemic heart disease and
myocardial infarction as a function of time since study entry in the Copenhagen City
Heart Study in individuals with no (green line), one (yellow line), two (blue line) or three
to four (red line) visible age-related signs.
Age-related signs included are frontoparietal baldness, crown top baldness, earlobe crease,
and xanthelasmata. Cumulative incidences were by the Kaplan-Meier method with time since
study entry as the x-axis. IHD, ischemic heart disease; MI, myocardial infarction.
Supplementary Figure 4. Adjusted risk estimates for ischemic heart disease, myocardial
infarction, and total death in the Copenhagen City Heart Study in individuals with
versus without moderate to complete greying of hair, prominent facial wrinkles, earlobe
crease, xanthelasmata, arcus corneae, frontoparietal baldness, or crown top baldness
with additional adjustment for age at study entry.
Hazard ratios and 95% confidence intervals for ischemic heart disease, myocardial infarction,
and total death are from the Copenhagen City Heart Study 1976-1978 examination (n=10,885;
follow-up up to 35 years; mean follow-up 23 years). We adjusted for age using age as the
time scale and left truncation and by including age at study entry as a covariate in the Cox
regression. Left columns for each endpoint are adjusted for age, sex, and age at study entry.
Right columns for each endpoint are multifactorially adjusted for age, sex, age at study entry,

7
total cholesterol, triglycerides, body mass index, hypertension, diabetes, smoking in
packyears, alcohol consumption, physical inactivity, education, income, family history of
ischemic vascular disease, and in women also for postmenopausal status and hormonal
replacement therapy using splines for continuous covariates. *The number indicates the upper
95% confidence interval limit, when this exceeds the width of the graph/scale of the hazard
ratio.
Supplementary Figure 5. Risk estimates for ischemic heart disease, myocardial
infarction, and total death in the Copenhagen City Heart Study as a function of
increasing number of age-related signs with additional adjustment for age at study
entry.
Age-related signs included are frontoparietal baldness, crown top baldness, earlobe crease,
and xanthelasmata. Hazard ratios and 95% confidence intervals for ischemic heart disease,
myocardial infarction, and total death are from the Copenhagen City Heart Study 1976-1978
examination (n=10,885; follow-up up to 35 years; mean follow-up 23 years). Data are
presented overall and stratified by sex. We adjusted for age using age as the time scale and
left truncation and by including age at study entry as a covariate in the Cox regression. Left
columns for each endpoint are adjusted for age, sex, and age at study entry. Right columns for
each endpoint are multifactorially adjusted for age, sex, age at study entry, total cholesterol,
triglycerides, body mass index, hypertension, diabetes, smoking in packyears, alcohol
consumption, physical inactivity, education, income, family history of ischemic vascular
disease, and in women also for postmenopausal status and hormonal replacement therapy
using splines for continuous covariates. *The number indicates the upper 95% confidence
interval limit, when this exceeds the width of the graph/scale of the hazard ratio.

8
TABLES
Supplementary Table 1. Baseline characteristics of individuals from the Copenhagen City Heart Study who were excluded from the
analysis due to incomplete information on relevant variables stratified by incident ischemic heart disease, myocardial infarction, and
total death during follow-up.
Ischemic heart disease Myocardial infarction Total death
No event IHD No event MI No event Death
No. of individuals – No. (%) 2,147 (73) 805 (27) 2,556 (87) 396 (13) 838 (28) 2,114 (72)
Age - years 53 (44-59) 57 (51-63)* 53 (45-60) 57 (51-63)* 44 (38-51) 57 (51-63)*
Sex (F/M) 1,885/262 633/172* 2,225/331 293/103* 758/80 1,760/354*
Total cholesterol - mmol/L 6.1 (5.3-6.9) 6.5 (5.7-7.2)* 6.1 (5.4-6.9) 6.7 (5.7-7.5)* 5.7 (5.0-6.4) 6.4 (5.6-7.2)*
Triglycerides - mmol/L 1.3 (1.0-1.7) 1.5 (1.1-2.1)* 1.3 (1.0-1.8) 1.6 (1.2-2.2)* 1.1 (0.9-1.5) 1.4 (1.1-2.0)*
Body mass index - kg/m2 24 (22-27) 25 (23-28)* 24 (22-27) 25 (23-28)* 23 (21-26) 24 (22-28)*
Hypertension – No. (%) 926 (43) 473 (59)* 1,162 (45) 237 (60)* 228 (27) 1,171 (55)*
Diabetes mellitus – No. (%) 45 (2) 36 (5)* 64 (3) 17 (4)† 5 (0.6) 76 (4)*
Smoking – packyears 7 (0-19) 10 (0-23)* 7 (0-19) 11 (0-24)* 2 (0-12) 10 (0-23)*
Regular alcohol consumer – No. (%) 860 (41) 317 (40) 1,023 (41) 154 (40) 327 (40) 850 (41)
Physically inactive – No. (%) 1,674 (77) 650 (81)† 1,996 (78) 308 (78) 637 (76) 1,667 (79)
Postmenopausal – No. (%) 1,222 (65) 529 (84)* 1,494 (67) 257 (88)* 286 (38) 1,465 (83)*
Hormonal replacement therapy – No. (%) 325 (27) 112 (21)† 385 (26) 52 (20) 103 (36) 334 (23)*
Lipid-lowering therapy – No. (%) 0 0 0 0 0 0
Family history of IVD – No. (%) 722 (34) 286 (36) 873 (34) 135 (34) 272 (32) 736 (35)
Education < 8 years – No. (%) 1,045 (49) 449 (56)† 1,267 (50) 227 (58)† 330 (40) 1,164 (56)*

9
Income < 10,000 DKK/month – No. (%) 1,454 (80) 552 (84)† 1,732 (80) 274 (85) 505 (72) 1,501 (85)*
Frontoparietal baldness (F/M) – No. (%) 134(7)/218(86) 69(11)†/143(90) 172(8)/281(88) 31(11)/80(87) 43(6)/58(74) 160(9)†/303(91)*
Crown top baldness (F/M) – No. (%) 13(1)/107(47) 10(2)†/86(55) 18(1)/145(49) 5(2)/48(51) 2(0.3)/25(34) 21(1)†/168(54)†
Greying of hair – No. (%) 307 (40) 173 (49)† 389 (42) 91 (47) 46 (19) 434 (50)*
Facial wrinkles – No. (%) 1,042 (50) 493 (63)* 1,282 (52) 253 (66)* 270 (33) 1,265 (62)*
Earlobe crease – No. (%) 292 (15) 154 (22)* 366 (16) 80 (23)† 69 (9) 377 (20)*
Xanthelasmata – No. (%) 71 (3) 47 (6)† 89 (4) 29 (8)* 21 (3) 97 (5)†
Arcus corneae – No. (%) 394 (19) 218 (28)* 501 (21) 111 (29)* 55 (7) 557 (28)*
Data are median (interquartile range) or percent. Hypertension was use of anti-hypertensive medication, a systolic blood pressure of
140 mm Hg or greater, and/or a diastolic blood pressure of 90 mm Hg or greater. Diabetes mellitus was self-reported disease, use of
insulin or oral hypoglycaemic agents, and/or non-fasting plasma glucose levels of more than 11 mmol/L (>198 mg/dL). Packyears was
the accumulated smoking exposure calculated from the questionnaires. Regular alcohol consumer was consumption of alcohol at least
twice weekly. Physically inactive was leisure time activity less than 4 hours weekly. Women reported menopausal status and use of
hormonal replacement therapy. Family history of ischemic vascular disease (IVD) was at least one parent with a previous myocardial
infarction or ischemic stroke. Education was less than 8 years of education. Income in 1976-1978 was less than 10,000 Danish kroner
(DKK) per month (app. 1,340 EUROs). Frontoparietal baldness, crown top baldness, earlobe crease, xanthelasmata, and arcus corneae
were all presence of the trait. Facial wrinkles were prominent facial wrinkles. Greying of hair was moderate to complete greying of
hair. Individuals who dyed their hair or used a wig were excluded from the study. To convert triglycerides to mg/dL, divide by 0.0113;
to convert cholesterol to mg/dL, divide by 0.0259. *P<0.001, †P<0.05 by Mann-Whitney U test or Pearson χ2 test.

10
Supplementary Table 2. Risk estimates for ischemic heart disease, myocardial infarction, and total death by presence or absence of
greying of hair in the Copenhagen City Heart Study in models treating greying of hair as a time-varying covariate.
Hazard ratio (95% confidence interval)
Age and sex adjusted
Hazard ratio (95% confidence interval)
Multifactorially adjusted
Model 1
(n=10,885)
Model 2
(n=10,885)
Model 3
(n=12,122)
Model 4
(n=12,122)
Model 1
(n=10,885)
Model 2
(n=10,885)
Model 3
(n=12,122)
Model 4
(n=12,122)
IHD No or few grey hair 1 1 1 1 1 1 1 1
Moderate or complete
1.03 (0.96-1.11) 1.02 (0.95-1.10) 1.03 (0.96-1.10) 1.01 (0.94-1.09) 1.00 (0.93-1.08) 0.99 (0.92-1.07) 0.98 (0.91-1.05) 0.97 (0.90-1.04)
MI No or few grey hair 1 1 1 1 1 1 1 1
Moderate or complete
1.17 (1.06-1.30) 1.16 (1.05-1.29) 1.18 (1.07-1.30) 1.16 (1.05-1.29) 1.09 (0.98-1.21) 1.08 (0.98-1.20) 1.09 (0.99-1.21) 1.09 (0.98-1.20)
Death
No or few grey hair 1 1 1 1 1 1 1 1
Moderate or complete
0.94 (0.90-0.99) 0.95 (0.90-1.00) 0.94 (0.90-0.99) 0.94 (0.90-0.99) 0.92 (0.88-0.97) 0.93 (0.88-0.98) 0.92 (0.87-0.96) 0.92 (0.88-0.97)
Hazard ratios and 95% confidence intervals for ischemic heart disease, myocardial infarction, and total death are from the Copenhagen
City Heart Study 1976-1978 examination and 1981-1983 examination with greying of hair treated as a time-varying covariate.

11
Model 1: 10,885 individuals from the 1976-1978 examination of the Copenhagen City Heart Study of whom 8,579 (79%) further
attended the 1981-1983 follow-up examination. During follow-up 3,401 participants developed IHD, 1,708 developed MI, and 7,722
died.
Model 2: 10,885 individuals from the 1976-1978 examination of the Copenhagen City Heart Study of whom 8,579 (79%) further
attended the 1981-1983 follow-up examination. During follow-up 3,401 participants developed IHD, 1,708 developed MI, and 7,722
died. Individuals with less greying of hair at the 1981-1983 examination compared to the 1976-1978 examination were reclassified,
thus using the status for greying of hair from the 1976-1978 examination throughout the study period.
Model 3: 12,122 individuals from the Copenhagen City Heart Study of whom 8,601 (71%) attended both the baseline 1976-1978
examination and the 1981-1983 follow-up examination, 2,320 (19%) individuals who attended only the 1976-1978 baseline
examination, and 1,201 (10%) individuals who attended only the 1981-1983 follow-up examination. During follow-up 3,687
participants developed IHD, 1,856 developed MI, and 8,449 died.
Model 4: 12,122 individuals from the Copenhagen City Heart Study of whom 8,601 (71%) attended both the baseline 1976-1978
examination and the 1981-1983 follow-up examination, 2,320 (19%) individuals who attended only the 1976-1978 baseline
examination, and 1,201 (10%) individuals who attended only the 1981-1983 follow-up examination. During follow-up 3,687
participants developed IHD, 1,856 developed MI, and 8,449 died. Individuals with less greying of hair at the 1981-1983 examination

12
compared to the 1976-1978 examination were reclassified, thus using the status for greying of hair from the 1976-1978 examination
throughout the study period.

13
Supplementary Table 3. Risk estimates for ischemic heart disease, myocardial infarction, and total death by presence or absence of
facial wrinkles in the Copenhagen City Heart Study in models treating facial wrinkles as a time-varying covariate.
Hazard ratio (95% confidence interval)
Age and sex adjusted
Hazard ratio (95% confidence interval)
Multifactorially adjusted
Model 1
(n=10,885)
Model 2
(n=10,885)
Model 3
(n=12,122)
Model 4
(n=12,122)
Model 1
(n=10,885)
Model 2
(n=10,885)
Model 3
(n=12,122)
Model 4
(n=12,122)
IHD None or shallow 1 1 1 1 1 1 1 1
Prominent 1.07 (0.99-1.15) 1.01 (0.93-1.10) 1.07 (1.00-1.15) 1.02 (0.94-1.10) 1.04 (0.97-1.12) 0.96 (0.88-1.05) 1.03 (0.96-1.10) 0.96 (0.89-1.04)
MI None or shallow 1 1 1 1 1 1 1 1
Prominent 1.15 (1.04-1.28) 1.10 (0.97-1.24) 1.16 (1.05-1.28) 1.11 (0.99-1.24) 1.05 (0.95-1.17) 0.97 (0.86-1.09) 1.05 (0.95-1.16) 0.98 (0.87-1.10)
Death
None or shallow 1 1 1 1 1 1 1 1
Prominent 1.03 (0.98-1.08) 0.98 (0.92-1.03) 1.03 (0.99-1.08) 0.97 (0.92-1.03) 0.99 (0.94-1.04) 0.93 (0.88-0.99) 1.00 (0.95-1.05) 0.94 (0.89-1.00)
Hazard ratios and 95% confidence intervals for ischemic heart disease, myocardial infarction, and total death are from the Copenhagen
City Heart Study 1976-1978 examination and 1981-1983 examination with facial wrinkles treated as a time-varying covariate.

14
Model 1: 10,885 individuals from the 1976-1978 examination of the Copenhagen City Heart Study of whom 8,579 (79%) further
attended the 1981-1983 follow-up examination. During follow-up 3,401 participants developed IHD, 1,708 developed MI, and 7,722
died.
Model 2: 10,885 individuals from the 1976-1978 examination of the Copenhagen City Heart Study of whom 8,579 (79%) further
attended the 1981-1983 follow-up examination. During follow-up 3,401 participants developed IHD, 1,708 developed MI, and 7,722
died. Individuals with fewer facial wrinkles at the 1981-1983 examination compared to the 1976-1978 examination were reclassified,
thus using the status for facial wrinkles from the 1976-1978 examination throughout the study period.
Model 3: 12,122 individuals from the Copenhagen City Heart Study of whom 8,601 (71%) attended both the baseline 1976-1978
examination and the 1981-1983 follow-up examination, 2,320 (19%) individuals who attended only the 1976-1978 baseline
examination, and 1,201 (10%) individuals who attended only the 1981-1983 follow-up examination. During follow-up 3,687
participants developed IHD, 1,856 developed MI, and 8,449 died.
Model 4: 12,122 individuals from the Copenhagen City Heart Study of whom 8,601 (71%) attended both the baseline 1976-1978
examination and the 1981-1983 follow-up examination, 2,320 (19%) individuals who attended only the 1976-1978 baseline
examination, and 1,201 (10%) individuals who attended only the 1981-1983 follow-up examination. During follow-up 3,687
participants developed IHD, 1,856 developed MI, and 8,449 died. Individuals with fewer facial wrinkles at the 1981-1983 examination

15
compared to the 1976-1978 examination were reclassified, thus using the status for facial wrinkles from the 1976-1978 examination
throughout the study period.
16
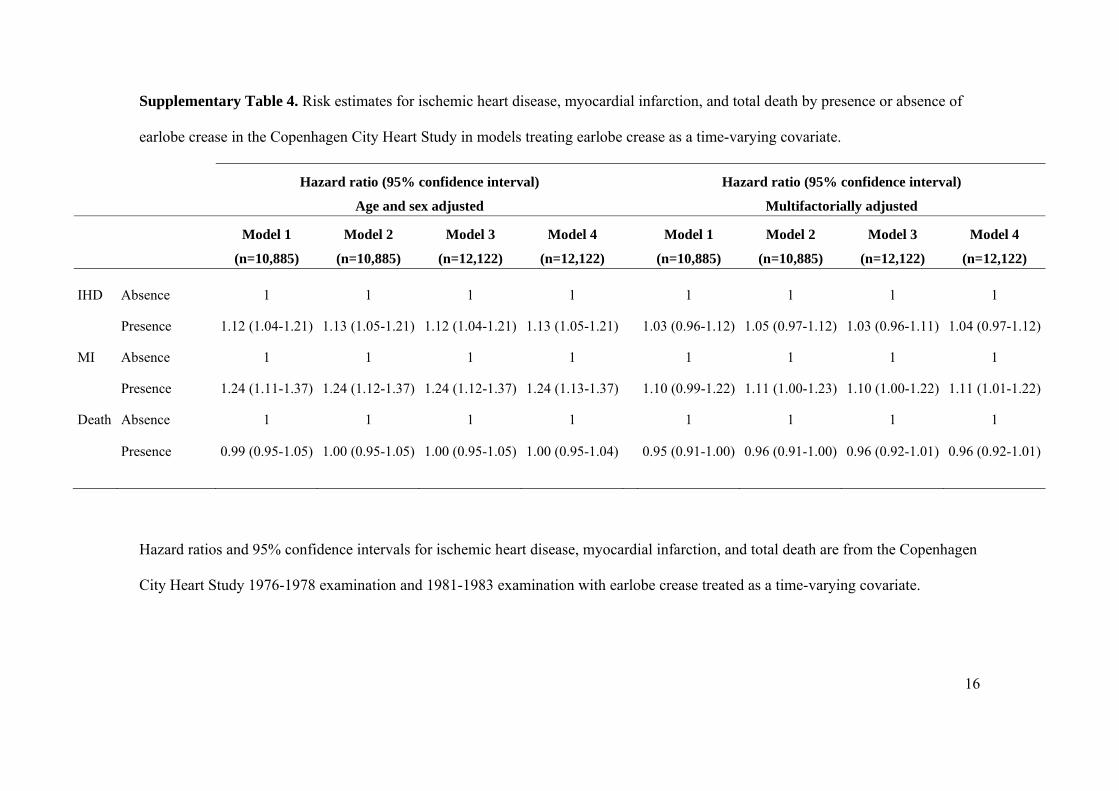
Supplementary Table 4. Risk estimates for ischemic heart disease, myocardial infarction, and total death by presence or absence of
earlobe crease in the Copenhagen City Heart Study in models treating earlobe crease as a time-varying covariate.
Hazard ratio (95% confidence interval)
Age and sex adjusted
Hazard ratio (95% confidence interval)
Multifactorially adjusted
Model 1
(n=10,885)
Model 2
(n=10,885)
Model 3
(n=12,122)
Model 4
(n=12,122)
Model 1
(n=10,885)
Model 2
(n=10,885)
Model 3
(n=12,122)
Model 4
(n=12,122)
IHD Absence 1 1 1 1 1 1 1 1
Presence 1.12 (1.04-1.21) 1.13 (1.05-1.21) 1.12 (1.04-1.21) 1.13 (1.05-1.21) 1.03 (0.96-1.12) 1.05 (0.97-1.12) 1.03 (0.96-1.11) 1.04 (0.97-1.12)
MI Absence 1 1 1 1 1 1 1 1
Presence 1.24 (1.11-1.37) 1.24 (1.12-1.37) 1.24 (1.12-1.37) 1.24 (1.13-1.37) 1.10 (0.99-1.22) 1.11 (1.00-1.23) 1.10 (1.00-1.22) 1.11 (1.01-1.22)
Death
Absence 1 1 1 1 1 1 1 1
Presence 0.99 (0.95-1.05) 1.00 (0.95-1.05) 1.00 (0.95-1.05) 1.00 (0.95-1.04) 0.95 (0.91-1.00) 0.96 (0.91-1.00) 0.96 (0.92-1.01) 0.96 (0.92-1.01)
Hazard ratios and 95% confidence intervals for ischemic heart disease, myocardial infarction, and total death are from the Copenhagen
City Heart Study 1976-1978 examination and 1981-1983 examination with earlobe crease treated as a time-varying covariate.

17
Model 1: 10,885 individuals from the 1976-1978 examination of the Copenhagen City Heart Study of whom 8,579 (79%) further
attended the 1981-1983 follow-up examination. During follow-up 3,401 participants developed IHD, 1,708 developed MI, and 7,722
died.
Model 2: 10,885 individuals from the 1976-1978 examination of the Copenhagen City Heart Study of whom 8,579 (79%) further
attended the 1981-1983 follow-up examination. During follow-up 3,401 participants developed IHD, 1,708 developed MI, and 7,722
died. Individuals with absence of an earlobe crease at the 1981-1983 examination in contrast to presence of an earlobe crease at the
1976-1978 examination were reclassified, thus using the status for earlobe crease from the 1976-1978 examination throughout the
study period.
Model 3: 12,122 individuals from the Copenhagen City Heart Study of whom 8,601 (71%) attended both the baseline 1976-1978
examination and the 1981-1983 follow-up examination, 2,320 (19%) individuals who attended only the 1976-1978 baseline
examination, and 1,201 (10%) individuals who attended only the 1981-1983 follow-up examination. During follow-up 3,687
participants developed IHD, 1,856 developed MI, and 8,449 died.
Model 4: 12,122 individuals from the Copenhagen City Heart Study of whom 8,601 (71%) attended both the baseline 1976-1978
examination and the 1981-1983 follow-up examination, 2,320 (19%) individuals who attended only the 1976-1978 baseline
examination, and 1,201 (10%) individuals who attended only the 1981-1983 follow-up examination. During follow-up 3,687
participants developed IHD, 1,856 developed MI, and 8,449 died. Individuals with absence of an earlobe crease at the 1981-1983

18
examination in contrast to presence of an earlobe crease at the 1976-1978 examination were reclassified, thus using the status for
earlobe crease from the 1976-1978 examination throughout the study period.

19
Supplementary Table 5. Risk estimates for ischemic heart disease, myocardial infarction, and total death by presence or absence of
xanthelasmata in the Copenhagen City Heart Study in models treating xanthelasmata as a time-varying covariate.
Hazard ratio (95% confidence interval)
Age and sex adjusted
Hazard ratio (95% confidence interval)
Multifactorially adjusted
Model 1
(n=10,885)
Model 2
(n=10,885)
Model 3
(n=12,122)
Model 4
(n=12,122)
Model 1
(n=10,885)
Model 2
(n=10,885)
Model 3
(n=12,122)
Model 4
(n=12,122)
IHD Presence 1 1 1 1 1 1 1 1
Absence 1.39 (1.22-1.59) 1.32 (1.18-1.49) 1.37 (1.21-1.56) 1.31 (1.17-1.47) 1.27 (1.11-1.45) 1.22 (1.08-1.37) 1.22 (1.07-1.39) 1.19 (1.06-1.33)
MI Presence 1 1 1 1 1 1 1 1
Absence 1.63 (1.37-1.94) 1.57 (1.34-1.83) 1.57 (1.32-1.86) 1.52 (1.31-1.77) 1.41 (1.19-1.69) 1.39 (1.18-1.62) 1.36 (1.14-1.61) 1.34 (1.15-1.56)
Death
Presence 1 1 1 1 1 1 1 1
Absence 1.21 (1.10-1.32) 1.17 (1.08-1.26) 1.20 (1.10-1.31) 1.16 (1.07-1.25) 1.11 (1.01-1.22) 1.08 (1.00-1.17) 1.11 (1.02-1.21) 1.08 (1.00-1.17)
Hazard ratios and 95% confidence intervals for ischemic heart disease, myocardial infarction, and total death are from the Copenhagen
City Heart Study 1976-1978 examination and 1981-1983 examination with xanthelasmata treated as a time-varying covariate.

20
Model 1: 10,885 individuals from the 1976-1978 examination of the Copenhagen City Heart Study of whom 8,579 (79%) further
attended the 1981-1983 follow-up examination. During follow-up 3,401 participants developed IHD, 1,708 developed MI, and 7,722
died.
Model 2: 10,885 individuals from the 1976-1978 examination of the Copenhagen City Heart Study of whom 8,579 (79%) further
attended the 1981-1983 follow-up examination. During follow-up 3,401 participants developed IHD, 1,708 developed MI, and 7,722
died. Individuals with absence of xanthelasmata at the 1981-1983 examination in contrast to presence of xanthelasmata at the 1976-
1978 examination were reclassified, thus using the status for xanthelasmata from the 1976-1978 examination throughout the study
period.
Model 3: 12,122 individuals from the Copenhagen City Heart Study of whom 8,601 (71%) attended both the baseline 1976-1978
examination and the 1981-1983 follow-up examination, 2,320 (19%) individuals who attended only the 1976-1978 baseline
examination, and 1,201 (10%) individuals who attended only the 1981-1983 follow-up examination. During follow-up 3,687
participants developed IHD, 1,856 developed MI, and 8,449 died.
Model 4: 12,122 individuals from the Copenhagen City Heart Study of whom 8,601 (71%) attended both the baseline 1976-1978
examination and the 1981-1983 follow-up examination, 2,320 (19%) individuals who attended only the 1976-1978 baseline
examination, and 1,201 (10%) individuals who attended only the 1981-1983 follow-up examination. During follow-up 3,687
participants developed IHD, 1,856 developed MI, and 8,449 died. Individuals with absence of xanthelasmata at the 1981-1983

21
examination in contrast to presence of xanthelasmata at the 1976-1978 examination were reclassified, thus using the status for
xanthelasmata from the 1976-1978 examination throughout the study period.

22
Supplementary Table 6. Risk estimates for ischemic heart disease, myocardial infarction, and total death by presence or absence of
arcus corneae in the Copenhagen City Heart Study in models treating arcus corneae as a time-varying covariate.
Hazard ratio (95% confidence interval)
Age and sex adjusted
Hazard ratio (95% confidence interval)
Multifactorially adjusted
Model 1
(n=10,885)
Model 2
(n=10,885)
Model 3
(n=12,122)
Model 4
(n=12,122)
Model 1
(n=10,885)
Model 2
(n=10,885)
Model 3
(n=12,122)
Model 4
(n=12,122)
IHD Absence 1 1 1 1 1 1 1 1
Presence 1.13 (1.05-1.22) 1.12 (1.05-1.21) 1.12 (1.04-1.20) 1.11 (1.04-1.19) 1.03 (0.96-1.12) 1.02 (0.95-1.10) 1.02 (0.95-1.10) 1.01 (0.94-1.08)
MI Absence 1 1 1 1 1 1 1 1
Presence 1.09 (0.99-1.21) 1.10 (0.99-1.22) 1.10 (0.99-1.21) 1.09 (0.99-1.21) 0.93 (0.84-1.04) 0.93 (0.84-1.03) 0.94 (0.85-1.04) 0.94 (0.85-1.04)
Death
Absence 1 1 1 1 1 1 1 1
Presence 1.10 (1.05-1.15) 1.09 (1.04-1.15) 1.09 (1.05-1.15) 1.08 (1.04-1.13) 1.02 (0.98-1.08) 1.01 (0.96-1.06) 1.02 (0.97-1.07) 1.01 (0.96-1.05)
Hazard ratios and 95% confidence intervals for ischemic heart disease, myocardial infarction, and total death are from the Copenhagen
City Heart Study 1976-1978 examination and 1981-1983 examination with arcus corneae treated as a time-varying covariate.
Model 1: 10,885 individuals from the 1976-1978 examination of the Copenhagen City Heart Study of whom 8,579 (79%) further
attended the 1981-1983 follow-up examination. During follow-up 3,401 participants developed IHD, 1,708 developed MI, and 7,722
died.

23
Model 2: 10,885 individuals from the 1976-1978 examination of the Copenhagen City Heart Study of whom 8,579 (79%) further
attended the 1981-1983 follow-up examination. During follow-up 3,401 participants developed IHD, 1,708 developed MI, and 7,722
died. Individuals with absence of arcus corneae at the 1981-1983 examination in contrast to presence of arcus corneae at the 1976-
1978 examination were reclassified, thus using the status for arcus corneae from the 1976-1978 examination throughout the study
period.
Model 3: 12,122 individuals from the Copenhagen City Heart Study of whom 8,601 (71%) attended both the baseline 1976-1978
examination and the 1981-1983 follow-up examination, 2,320 (19%) individuals who attended only the 1976-1978 baseline
examination, and 1,201 (10%) individuals who attended only the 1981-1983 follow-up examination. During follow-up 3,687
participants developed IHD, 1,856 developed MI, and 8,449 died.
Model 4: 12,122 individuals from the Copenhagen City Heart Study of whom 8,601 (71%) attended both the baseline 1976-1978
examination and the 1981-1983 follow-up examination, 2,320 (19%) individuals who attended only the 1976-1978 baseline
examination, and 1,201 (10%) individuals who attended only the 1981-1983 follow-up examination. During follow-up 3,687
participants developed IHD, 1,856 developed MI, and 8,449 died. Individuals with absence of arcus corneae at the 1981-1983
examination in contrast to presence of arcus corneae at the 1976-1978 examination were reclassified, thus using the status for arcus
corneae from the 1976-1978 examination throughout the study period.

24
Supplementary Table 7. Risk estimates for ischemic heart disease, myocardial infarction, and total death by presence or absence of
frontoparietal baldness in the Copenhagen City Heart Study in models treating frontoparietal baldness as a time-varying covariate.
Hazard ratio (95% confidence interval)
Age and sex adjusted
Hazard ratio (95% confidence interval)
Multifactorially adjusted
Model 1
(n=10,885)
Model 2
(n=10,885)
Model 3
(n=12,122)
Model 4
(n=12,122)
Model 1
(n=10,885)
Model 2
(n=10,885)
Model 3
(n=12,122)
Model 4
(n=12,122)
Men
IHD Absence 1 1 1 1 1 1 1 1
Presence 1.17 (1.00-1.37) 1.26 (1.01-1.58) 1.13 (0.97-1.31) 1.17 (0.96-1.42) 1.12 (0.95-1.31) 1.21 (0.96-1.51) 1.07 (0.93-1.24) 1.11 (0.91-1.35)
MI Absence 1 1 1 1 1 1 1 1
Presence 1.31 (1.06-1.63) 1.63 (1.18-1.27) 1.26 (0.81-1.55) 1.44 (1.09-1.91) 1.20 (0.97-1.49) 1.49 (1.07-2.07) 1.16 (0.94-1.42) 1.31 (0.99-1.74)
Death
Absence 1 1 1 1 1 1 1 1
Presence 0.98 (0.88-1.08) 0.99 (0.85-1.15) 0.97 (0.88-1.07) 0.95 (0.83-1.08) 0.96 (0.86-1.06) 0.98 (0.84-1.13) 0.97 (0.88-1.07) 0.95 (0.83-1.08)
Women
IHD Absence 1 1 1 1 1 1 1 1
Presence 1.12 (0.97-1.29) 1.12 (0.99-1.28) 1.11 (0.97-1.28) 1.11 (0.98-1.26) 1.12 (0.97-1.29) 1.11 (0.97-1.26) 1.11 (0.96-1.27) 1.10 (0.97-1.25)
MI Absence 1 1 1 1 1 1 1 1
Presence 1.01 (0.80-1.26) 1.11 (0.91-1.35) 1.01 (0.81-1.26) 1.10 (0.91-1.33) 1.04 (0.82-1.30) 1.13 (0.92-1.38) 1.02 (0.82-1.27) 1.10 (0.90-1.33)
Death Absence 1 1 1 1 1 1 1 1
Presence 1.00 (0.91-1.09) 0.97 (0.89-1.05) 0.99 (0.91-1.09) 0.96 (0.89-1.04) 1.01 (0.91-1.11) 0.97 (0.89-1.06) 0.99 (0.90-1.08) 0.95 (0.88-1.04)
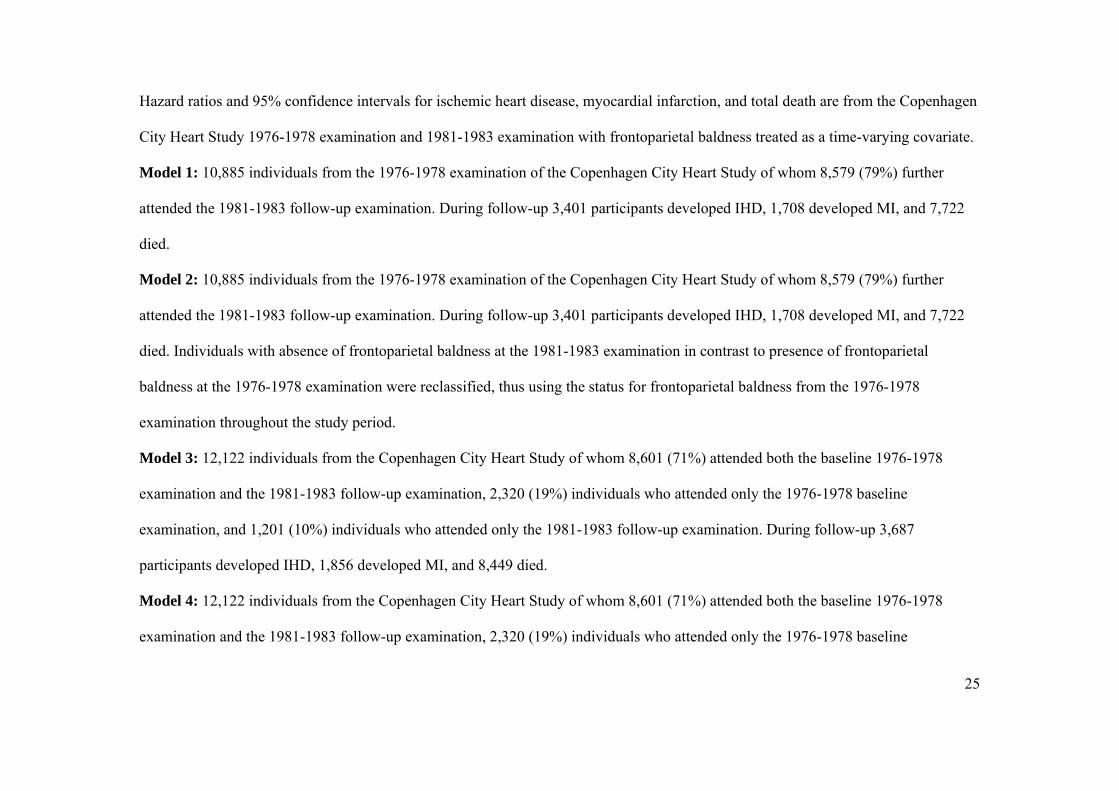
25
Hazard ratios and 95% confidence intervals for ischemic heart disease, myocardial infarction, and total death are from the Copenhagen
City Heart Study 1976-1978 examination and 1981-1983 examination with frontoparietal baldness treated as a time-varying covariate.
Model 1: 10,885 individuals from the 1976-1978 examination of the Copenhagen City Heart Study of whom 8,579 (79%) further
attended the 1981-1983 follow-up examination. During follow-up 3,401 participants developed IHD, 1,708 developed MI, and 7,722
died.
Model 2: 10,885 individuals from the 1976-1978 examination of the Copenhagen City Heart Study of whom 8,579 (79%) further
attended the 1981-1983 follow-up examination. During follow-up 3,401 participants developed IHD, 1,708 developed MI, and 7,722
died. Individuals with absence of frontoparietal baldness at the 1981-1983 examination in contrast to presence of frontoparietal
baldness at the 1976-1978 examination were reclassified, thus using the status for frontoparietal baldness from the 1976-1978
examination throughout the study period.
Model 3: 12,122 individuals from the Copenhagen City Heart Study of whom 8,601 (71%) attended both the baseline 1976-1978
examination and the 1981-1983 follow-up examination, 2,320 (19%) individuals who attended only the 1976-1978 baseline
examination, and 1,201 (10%) individuals who attended only the 1981-1983 follow-up examination. During follow-up 3,687
participants developed IHD, 1,856 developed MI, and 8,449 died.
Model 4: 12,122 individuals from the Copenhagen City Heart Study of whom 8,601 (71%) attended both the baseline 1976-1978
examination and the 1981-1983 follow-up examination, 2,320 (19%) individuals who attended only the 1976-1978 baseline

26
examination, and 1,201 (10%) individuals who attended only the 1981-1983 follow-up examination. During follow-up 3,687
participants developed IHD, 1,856 developed MI, and 8,449 died. Individuals with absence of frontoparietal baldness at the 1981-1983
examination in contrast to presence of frontoparietal baldness at the 1976-1978 examination were reclassified, thus using the status for
frontoparietal baldness from the 1976-1978 examination throughout the study period.

27
Supplementary Table 8. Risk estimates for ischemic heart disease, myocardial infarction, and total death by presence or absence of
crown top baldness in the Copenhagen City Heart Study in models treating crown top baldness as a time-varying covariate.
Hazard ratio (95% confidence interval)
Age and sex adjusted
Hazard ratio (95% confidence interval)
Multifactorially adjusted
Model 1
(n=10,885)
Model 2
(n=10,885)
Model 3
(n=12,122)
Model 4
(n=12,122)
Model 1
(n=10,885)
Model 2
(n=10,885)
Model 3
(n=12,122)
Model 4
(n=12,122)
Men
IHD Absence 1 1 1 1 1 1 1 1
Presence 1.15 (1.05-1.26) 1.18 (1.07-1.29) 1.15 (1.06-1.25) 1.17 (1.07-1.28) 1.10 (1.01-1.21) 1.12 (1.03-1.23) 1.10 (1.01-1.20) 1.12 (1.03-1.23)
MI Absence 1 1 1 1 1 1 1 1
Presence 1.20 (1.07-1.36) 1.26 (1.11-1.43) 1.21 (1.08-1.36) 1.26 (1.12-1.42) 1.14 (1.01-1.29) 1.19 (1.05-1.35) 1.14 (1.02-1.29) 1.19 (1.06-1.34)
Death
Absence 1 1 1 1 1 1 1 1
Presence 0.99 (0.93-1.05) 0.99 (0.93-1.05) 1.00 (0.94-1.06) 0.99 (0.93-1.05) 0.99 (0.93-1.06) 0.99 (0.93-1.05) 1.00 (0.94-1.06) 0.99 (0.93-1.05)
Women
IHD Absence 1 1 1 1 1 1 1 1
Presence 1.25 (0.93-1.69) 1.26 (0.96-1.66) 1.27 (0.95-1.70) 1.27 (0.97-1.66) 1.08 (0.79-1.47) 1.08 (0.82-1.44) 1.14 (0.85-1.53) 1.14 (0.87-1.49)
MI Absence 1 1 1 1 1 1 1 1
Presence 1.03 (0.61-1.72) 1.15 (0.74-1.81) 1.09 (0.67-1.77) 1.19 (0.78-1.83) 0.91 (0.54-1.53) 1.02 (0.65-1.61) 0.96 (0.59-1.57) 1.05 (0.68-1.62)
Death Absence 1 1 1 1 1 1 1 1
Presence 1.00 (0.82-1.22) 0.98 (0.82-1.18) 1.01 (0.83-1.22) 0.98 (0.82-1.18) 0.98 (0.80-1.20) 0.95 (0.79-1.14) 0.96 (0.79-1.16) 0.93 (0.78-1.11)

28
Hazard ratios and 95% confidence intervals for ischemic heart disease, myocardial infarction, and total death are from the Copenhagen
City Heart Study 1976-1978 examination and 1981-1983 examination with crown top baldness treated as a time-varying covariate.
Model 1: 10,885 individuals from the 1976-1978 examination of the Copenhagen City Heart Study of whom 8,579 (79%) further
attended the 1981-1983 follow-up examination. During follow-up 3,401 participants developed IHD, 1,708 developed MI, and 7,722
died.
Model 2: 10,885 individuals from the 1976-1978 examination of the Copenhagen City Heart Study of whom 8,579 (79%) further
attended the 1981-1983 follow-up examination. During follow-up 3,401 participants developed IHD, 1,708 developed MI, and 7,722
died. Individuals with absence of crown top baldness at the 1981-1983 examination in contrast to presence of crown top baldness at the
1976-1978 examination were reclassified, thus using the status for crown top baldness from the 1976-1978 examination throughout the
study period.
Model 3: 12,122 individuals from the Copenhagen City Heart Study of whom 8,601 (71%) attended both the baseline 1976-1978
examination and the 1981-1983 follow-up examination, 2,320 (19%) individuals who attended only the 1976-1978 baseline
examination, and 1,201 (10%) individuals who attended only the 1981-1983 follow-up examination. During follow-up 3,687
participants developed IHD, 1,856 developed MI, and 8,449 died.
Model 4: 12,122 individuals from the Copenhagen City Heart Study of whom 8,601 (71%) attended both the baseline 1976-1978
examination and the 1981-1983 follow-up examination, 2,320 (19%) individuals who attended only the 1976-1978 baseline

29
examination, and 1,201 (10%) individuals who attended only the 1981-1983 follow-up examination. During follow-up 3,687
participants developed IHD, 1,856 developed MI, and 8,449 died. Individuals with absence of crown top baldness at the 1981-1983
examination in contrast to presence of crown top baldness at the 1976-1978 examination were reclassified, thus using the status for
crown top baldness from the 1976-1978 examination throughout the study period.

30
Supplementary Table 9. Risk estimates for ischemic heart disease, myocardial infarction, and total death as a function of increasing
numbers of visible age-related signs in the Copenhagen City Heart Study in models treating number of age-related signs as a time-
varying covariate.
Hazard ratio (95% confidence interval)
Age and sex adjusted
Hazard ratio (95% confidence interval)
Multifactorially adjusted
Model 1
(n=10,885)
Model 2
(n=10,885)
Model 3
(n=12,122)
Model 4
(n=12,122)
Model 1
(n=10,885)
Model 2
(n=10,885)
Model 3
(n=12,122)
Model 4
(n=12,122)
Overall
IHD No age-related signs 1 1 1 1 1 1 1 1
1 age-related sign 1.12 (1.01-1.24) 1.17 (1.05-1.30) 1.14 (1.04-1.26) 1.19 (1.08-1.32) 1.06 (0.95-1.17) 1.10 (0.99-1.22) 1.05 (0.96-1.16) 1.10 (1.00-1.22)
2 age-related signs 1.36 (1.12-1.42) 1.32 (1.17-1.50) 1.25 (1.12-1.40) 1.31 (1.16-1.48) 1.14 (1.01-1.29) 1.19 (1.05-1.35) 1.11 (0.99-1.25) 1.17 (1.03-1.32)
3-4 age-related signs 1.53 (1.33-1.76) 1.61 (1.40-1.86) 1.49 (1.30-1.71) 1.56 (1.36-1.79) 1.29 (1.12-1.49) 1.35 (1.17-1.56) 1.26 (1.10-1.44) 1.31 (1.14-1.51)
MI No age-related signs 1 1 1 1 1 1 1 1
1 age-related sign 1.13 (0.97-1.31) 1.22 (1.04-1.43) 1.15 (1.00-1.33) 1.25 (1.08-1.45) 1.03 (0.89-1.21) 1.15 (0.98-1.35) 1.00 (0.87-1.16) 1.09 (0.94-1.27)
2 age-related signs 1.42 (1.20-1.69) 1.58 (1.32-1.90) 1.44 (1.22-1.69) 1.60 (1.34-1.90) 1.23 (1.03-1.47) 1.40 (1.16-1.69) 1.21 (1.03-1.43) 1.34 (1.12-1.60)
3-4 age-related signs 1.78 (1.46-2.16) 2.06 (1.68-2.53) 1.72 (1.42-2.08) 1.98 (1.63-2.41) 1.40 (1.15-1.71) 1.65 (1.34-2.03) 1.35 (1.12-1.64) 1.55 (1.27-1.89)
Death No age-related signs 1 1 1 1 1 1 1 1
1 age-related sign 1.02 (0.95-1.09) 1.03 (0.97-1.11) 1.02 (0.96-1.08) 1.02 (0.96-1.09) 0.99 (0.93-1.06) 1.00 (0.94-1.08) 0.99 (0.93-1.05) 0.99 (0.93-1.06)
2 age-related signs 1.01 (0.94-1.09) 0.99 (0.92-1.08) 1.02 (0.94-1.10) 0.99 (0.92-1.07) 0.97 (0.89-1.05) 0.95 (0.87-1.03) 0.97 (0.90-1.05) 0.94 (0.87-1.02)
3-4 age-related signs 1.04 (0.95-1.15) 1.02 (0.93-1.12) 1.04 (0.95-1.14) 1.01 (0.92-1.10) 0.98 (0.89-1.07) 0.94 (0.86-1.04) 0.98 (0.89-1.07) 0.94 (0.85-1.03)

31
Hazard ratio (95% confidence interval)
Age and sex adjusted
Hazard ratio (95% confidence interval)
Multifactorially adjusted
Model 1
(n=10,885)
Model 2
(n=10,885)
Model 3
(n=12,122)
Model 4
(n=12,122)
Model 1
(n=10,885)
Model 2
(n=10,885)
Model 3
(n=12,122)
Model 4
(n=12,122)
Men
IHD No age-related signs 1 1 1 1 1 1 1 1
1 age-related sign 1.13 (0.91-1.41) 1.25 (0.92-1.71) 1.02 (0.84-1.25) 1.02 (0.79-1.32) 1.06 (0.85-1.32) 1.18 (0.87-1.61) 0.96 (0.78-1.17) 0.95 (0.74-1.23)
2 age-related signs 1.29 (1.04-1.59) 1.44 (1.06-1.95) 1.18 (0.97-1.42) 1.19 (0.92-1.52) 1.14 (0.92-1.41) 1.28 (0.94-1.73) 1.04 (0.86-1.26) 1.05 (0.81-1.34)
3-4 age-related signs 1.58 (1.26-1.97) 1.76 (1.29-2.40) 1.44 (1.18-1.77) 1.45 (1.12-1.88) 1.33 (1.06-1.66) 1.48 (1.08-2.02) 1.21 (0.99-1.49) 1.22 (0.94-1.57)
MI No age-related signs 1 1 1 1 1 1 1 1
1 age-related sign 1.19 (0.88-1.61) 1.35 (0.87-2.09) 1.06 (0.81-1.39) 1.06 (0.74-1.61) 1.06 (0.79-1.43) 1.20 (0.77-1.86) 0.94 (0.71-1.23) 0.93 (0.65-1.33)
2 age-related signs 1.47 (1.10-1.96) 1.73 (1.12-2.66) 1.36 (1.04-1.76) 1.42 (1.00-2.01) 1.23 (0.92-1.64) 1.42 (0.92-2.19) 1.13 (0.87-1.47) 1.16 (0.82-1.64)
3-4 age-related signs 1.88 (1.39-2.55) 2.28 (1.47-3.53) 1.69 (1.29-2.23) 1.82 (1.28-2.60) 1.47 (1.08-1.99) 1.75 (1.13-2.71) 1.36 (0.99-1.73) 1.39 (0.98-1.98)
Death No age-related signs 1 1 1 1 1 1 1 1
1 age-related sign 1.03 (0.89-1.18) 1.07 (0.87-1.31) 0.99 (0.87-1.13) 0.98 (0.82-1.17) 0.99 (0.86-1.15) 1.03 (0.84-1.27) 0.98 (0.85-1.12) 0.96 (0.81-1.15)
2 age-related signs 1.02 (0.89-1.18) 1.05 (0.86-1.28) 1.00 (0.88-1.13) 0.97 (0.81-1.15) 0.96 (0.84-1.11) 0.98 (0.80-1.20) 0.96 (0.85-1.10) 0.93 (0.78-1.10)
3-4 age-related signs 1.06 (0.91-1.22) 1.07 (0.87-1.31) 1.03 (0.89-1.18) 0.98 (0.83-1.17) 0.99 (0.86-1.15) 0.98 (0.80-1.21) 0.98 (0.85-1.12) 0.92 (0.77-1.10)

32
Hazard ratio (95% confidence interval)
Age and sex adjusted
Hazard ratio (95% confidence interval)
Multifactorially adjusted
Model 1
(n=10,885)
Model 2
(n=10,885)
Model 3
(n=12,122)
Model 4
(n=12,122)
Model 1
(n=10,885)
Model 2
(n=10,885)
Model 3
(n=12,122)
Model 4
(n=12,122)
Women
IHD No age-related signs 1 1 1 1 1 1 1 1
1 age-related sign 1.13 (1.00-1.27) 1.17 (1.04-1.31) 1.14 (1.01-1.27) 1.17 (1.05-1.31) 1.05 (0.93-1.19) 1.09 (0.97-1.22) 1.06 (0.94-1.18) 1.09 (0.98-1.22)
2 age-related signs 1.27 (1.03-1.57) 1.28 (1.06-1.55) 1.27 (1.03-1.56) 1.27 (1.05-1.53) 1.18 (0.96-1.46) 1.20 (0.99-1.45) 1.19 (0.97-1.46) 1.19 (0.99-1.44)
3-4 age-related signs 0.88 (0.44-1.77) 1.13 (0.62-2.06) 0.87 (0.43-1.75) 1.12 (0.61-2.03) 0.77 (0.38-1.55) 0.94 (0.51-1.72) 0.79 (0.39-1.59) 0.96 (0.52-1.74)
MI No age-related signs 1 1 1 1 1 1 1 1
1 age-related sign 1.10 (0.91-1.32) 1.20 (1.01-1.44) 1.12 (0.94-1.33) 1.20 (1.01-1.42) 0.97 (0.80-1.16) 1.08 (0.90-1.29) 0.98 (0.82-1.17) 1.07 (0.90-1.27)
2 age-related signs 1.60 (1.19-2.15) 1.62 (1.23-2.13) 1.54 (1.15-2.06) 1.55 (1.19-2.03) 1.53 (1.14-2.07) 1.54 (1.17-2.03) 1.46 (1.09-1.96) 1.46 (1.11-1.91)
3-4 age-related signs 0.55 (0.14-2.23) 1.34 (0.55-3.24) 0.54 (0.13-2.18) 1.29 (0.53-3.13) 0.50 (0.13-2.04) 1.13 (0.46-2.75) 0.48 (0.12-1.95) 1.06 (0.44-2.59)
Death No age-related signs 1 1 1 1 1 1 1 1
1 age-related sign 1.02 (0.95-1.10) 1.04 (0.96-1.12) 1.01 (0.94-1.09) 1.02 (0.95-1.10) 1.00 (0.93-1.08) 1.02 (0.95-1.10) 0.98 (0.91-1.06) 0.99 (0.92-1.07)
2 age-related signs 1.00 (0.87-1.15) 0.95 (0.83-1.07) 1.02 (0.89-1.17) 0.96 (0.85-1.09) 0.96 (0.84-1.11) 0.91 (0.80-1.04) 0.98 (0.85-1.12) 0.92 (0.81-1.05)
3-4 age-related signs 0.94 (0.63-1.39) 1.02 (0.72-1.44) 0.92 (0.62-1.37) 1.01 (0.71-1.42) 0.86 (0.58-1.29) 1.04 (0.66-1.33) 0.84 (0.56-1.25) 0.88 (0.62-1.25)
Hazard ratios and 95% confidence intervals for ischemic heart disease, myocardial infarction, and total death are from the Copenhagen
City Heart Study 1976-1978 examination and 1981-1983 examination with number of age-related signs treated as a time-varying
covariate.

33
Model 1: 10,885 individuals from the 1976-1978 examination of the Copenhagen City Heart Study of whom 8,579 (79%) further
attended the 1981-1983 follow-up examination. During follow-up 3,401 participants developed IHD, 1,708 developed MI, and 7,722
died.
Model 2: 10,885 individuals from the 1976-1978 examination of the Copenhagen City Heart Study of whom 8,579 (79%) further
attended the 1981-1983 follow-up examination. During follow-up 3,401 participants developed IHD, 1,708 developed MI, and 7,722
died. Individuals with fewer age-related signs at the 1981-1983 examination compared to the 1976-1978 examination were
reclassified, thus using the number of age-related signs from the 1976-1978 examination throughout the study period.
Model 3: 12,122 individuals from the Copenhagen City Heart Study of whom 8,601 (71%) attended both the baseline 1976-1978
examination and the 1981-1983 follow-up examination, 2,320 (19%) individuals who attended only the 1976-1978 baseline
examination, and 1,201 (10%) individuals who attended only the 1981-1983 follow-up examination. During follow-up 3,687
participants developed IHD, 1,856 developed MI, and 8,449 died.
Model 4: 12,122 individuals from the Copenhagen City Heart Study of whom 8,601 (71%) attended both the baseline 1976-1978
examination and the 1981-1983 follow-up examination, 2,320 (19%) individuals who attended only the 1976-1978 baseline
examination, and 1,201 (10%) individuals who attended only the 1981-1983 follow-up examination. During follow-up 3,687
participants developed IHD, 1,856 developed MI, and 8,449 died. Individuals with fewer age-related signs at the 1981-1983

34
examination compared to the 1976-1978 examination were reclassified, thus using the number of age-related signs from the 1976-1978
examination throughout the study period.

35
FIGURES
Supplementary Figure 1

36
Supplementary Figure 2

37
Supplementary Figure 3

38
Supplementary Figure 4

39
Supplementary Figure 5

Nordestgaard and Anne Tybjærg-HansenMette Christoffersen, Ruth Frikke-Schmidt, Peter Schnohr, Gorm B. Jensen, Børge G.
A Prospective Cohort StudyVisible Age-Related Signs and Risk of Ischemic Heart Disease in the General Population:
Print ISSN: 0009-7322. Online ISSN: 1524-4539 Copyright © 2013 American Heart Association, Inc. All rights reserved.
is published by the American Heart Association, 7272 Greenville Avenue, Dallas, TX 75231Circulation doi: 10.1161/CIRCULATIONAHA.113.001696
2014;129:990-998; originally published online December 13, 2013;Circulation.
http://circ.ahajournals.org/content/129/9/990World Wide Web at:
The online version of this article, along with updated information and services, is located on the
http://circ.ahajournals.org/content/suppl/2013/12/13/CIRCULATIONAHA.113.001696.DC1.htmlData Supplement (unedited) at:
http://circ.ahajournals.org//subscriptions/
is online at: Circulation Information about subscribing to Subscriptions:
http://www.lww.com/reprints Information about reprints can be found online at: Reprints:
document. Permissions and Rights Question and Answer this process is available in the
click Request Permissions in the middle column of the Web page under Services. Further information aboutOffice. Once the online version of the published article for which permission is being requested is located,
can be obtained via RightsLink, a service of the Copyright Clearance Center, not the EditorialCirculationin Requests for permissions to reproduce figures, tables, or portions of articles originally publishedPermissions:
by guest on May 4, 2015http://circ.ahajournals.org/Downloaded from