Embed Size (px)
Citation preview
CIPM key comparison CCM.FF‐K6.2011
Comparison of the Primary (National) Standards of Low‐Pressure Gas Flow
Final Report
Pilot Miroslava Benková – CMI, Czech Republic
Stefan Makovnik – SMU, Slovakia Co‐pilot
Bodo Mickan – PTB, Germany Participants
Roberto Arias – CENAM, Mexico Khaled Chahine – NMI, Australia Tatsuya Funaki – NMIJ AIST, Japan
Chunhui Li – NIM, China Hae Man Choi – KRISS, Korea Denys Seredyuk – GP, Ukraine
Chun‐Min Su – CMS, Chinese Taipei Christophe Windenberg – LNE‐LADG, France
John Wright – NIST, USA
February, 2014
CIPM key comparison CCM.FF‐K6.2011 Comparison of the Primary (National) Standards of low‐pressure Gas Flow
Final Report Page 2 of 36
Contents
1 Introduction ..................................................................................................................................... 3
2 Participants ...................................................................................................................................... 3
3 The transfer standard ...................................................................................................................... 4
3.1 Basic technical specification .................................................................................................... 4
4 The measurement procedure .......................................................................................................... 4
4.1 Method of measurement ........................................................................................................ 4
4.2 Equipment ............................................................................................................................... 5
4.3 Measurement procedure and ambient conditions ................................................................. 6
5 Measurements results ..................................................................................................................... 6
5.1 Stability of the transfer standard ............................................................................................ 6
5.2 Laboratory results ................................................................................................................... 8
5.3 Laboratory uncertainty ............................................................................................................ 9
5.4 Laboratory measurement conditions .................................................................................... 11
5.5 Temperature, pressure, and flow stability ............................................................................ 11
5.6 Uncertainty of the corrections and stability of the transfer standard .................................. 12
6 Evaluation ...................................................................................................................................... 12
6.1 Determination of the Key Comparison Reference Value (KCRV) and its uncertainty ........... 13
6.2 The determination of the differences “Lab to KCRV” and “Lab to Lab” ............................... 14
6.3 Differences to the KCRV ........................................................................................................ 15
6.4 Lab to Lab Differences ........................................................................................................... 15
6.5 The KCRV and its uncertainty ................................................................................................ 15
7 Summary ....................................................................................................................................... 17
8 Conclusions .................................................................................................................................... 18
9 References ..................................................................................................................................... 19
Appendix A – NMI reports ..................................................................................................................... 20
Appendix B – graphical representation of relative error and expanded uncertainty ........................... 26
CIPM key comparison CCM.FF‐K6.2011 Comparison of the Primary (National) Standards of low‐pressure Gas Flow
Final Report Page 3 of 36
1 Introduction
A comparison was organised for the purpose of determination of the degree of equivalence of the primary (national) standards for low‐pressure gas flow measurement over the range (2 to 100) m3/h. A rotary gas meter G65 donated by LNE‐LADG France was used as a transfer standard.
A comparison was initialised as a CCM Key Comparison for low‐pressure gas flow. The results of this comparison can be used for review of CMC tables.
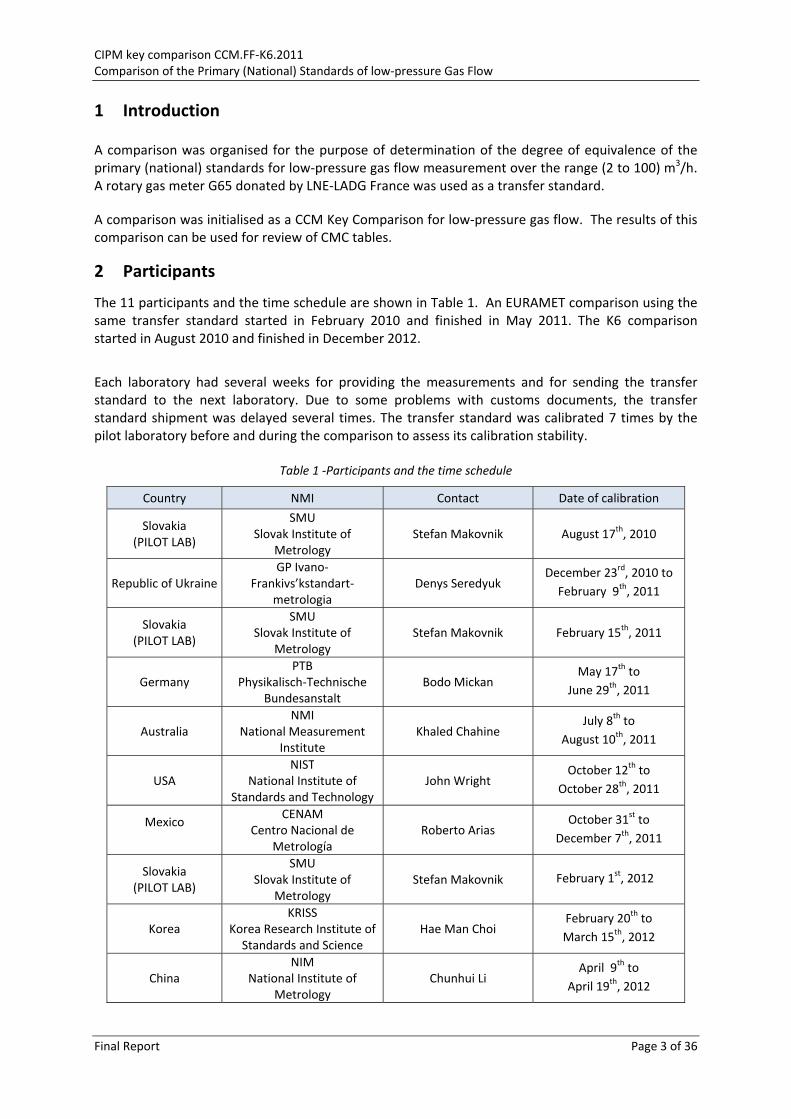
2 Participants
The 11 participants and the time schedule are shown in Table 1. An EURAMET comparison using the same transfer standard started in February 2010 and finished in May 2011. The K6 comparison started in August 2010 and finished in December 2012.
Each laboratory had several weeks for providing the measurements and for sending the transfer standard to the next laboratory. Due to some problems with customs documents, the transfer standard shipment was delayed several times. The transfer standard was calibrated 7 times by the pilot laboratory before and during the comparison to assess its calibration stability.
Table 1 ‐Participants and the time schedule
Country NMI Contact Date of calibration
Slovakia (PILOT LAB)
SMU Slovak Institute of
Metrology Stefan Makovnik August 17th, 2010
Republic of Ukraine
GP Ivano‐Frankivs’kstandart‐
metrologia Denys Seredyuk
December 23rd, 2010 to
February 9th, 2011
Slovakia (PILOT LAB)
SMU Slovak Institute of
Metrology Stefan Makovnik February 15th, 2011
Germany PTB
Physikalisch‐Technische Bundesanstalt
Bodo Mickan May 17th to
June 29th, 2011
Australia
NMI National Measurement
Institute Khaled Chahine
July 8th to
August 10th, 2011
USA
NIST National Institute of
Standards and Technology John Wright
October 12th to
October 28th, 2011
Mexico
CENAM Centro Nacional de
Metrología Roberto Arias
October 31st to
December 7th, 2011
Slovakia (PILOT LAB)
SMU Slovak Institute of
Metrology Stefan Makovnik February 1st, 2012
Korea
KRISS Korea Research Institute of Standards and Science
Hae Man Choi February 20th to
March 15th, 2012
China
NIM National Institute of
Metrology Chunhui Li
April 9th to
April 19th, 2012
CIPM key comparison CCM.FF‐K6.2011 Comparison of the Primary (National) Standards of low‐pressure Gas Flow
Final Report Page 4 of 36
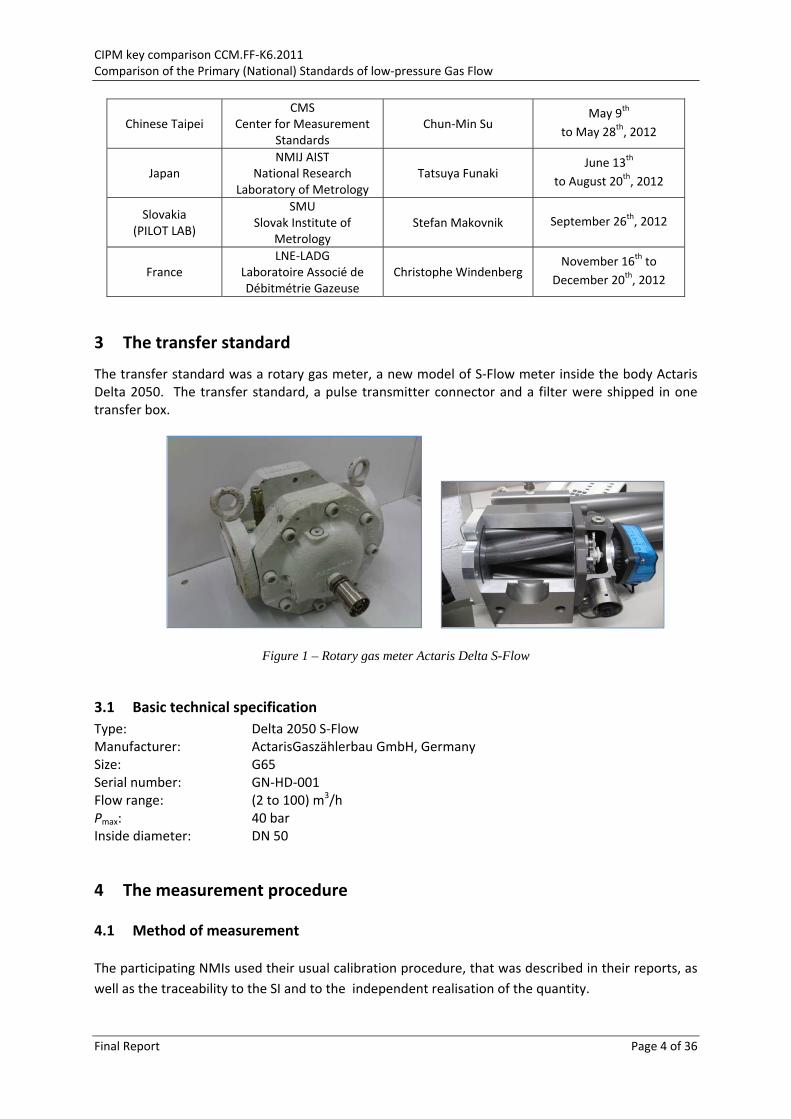
Chinese Taipei
CMS Center for Measurement
Standards Chun‐Min Su
May 9th
to May 28th, 2012
Japan
NMIJ AISTNational Research
Laboratory of Metrology Tatsuya Funaki
June 13th
to August 20th, 2012
Slovakia (PILOT LAB)
SMU Slovak Institute of
Metrology Stefan Makovnik September 26th, 2012
France LNE‐LADG
Laboratoire Associé de Débitmétrie Gazeuse
Christophe Windenberg November 16th to
December 20th, 2012
3 The transfer standard
The transfer standard was a rotary gas meter, a new model of S‐Flow meter inside the body Actaris Delta 2050. The transfer standard, a pulse transmitter connector and a filter were shipped in one transfer box.
Figure 1 – Rotary gas meter Actaris Delta S-Flow
3.1 Basic technical specification
Type: Delta 2050 S‐Flow Manufacturer: ActarisGaszählerbau GmbH, Germany Size: G65 Serial number: GN‐HD‐001 Flow range: (2 to 100) m3/h Pmax: 40 bar Inside diameter: DN 50
4 The measurement procedure
4.1 Method of measurement
The participating NMIs used their usual calibration procedure, that was described in their reports, as
well as the traceability to the SI and to the independent realisation of the quantity.
CIPM key comparison CCM.FF‐K6.2011 Comparison of the Primary (National) Standards of low‐pressure Gas Flow
Final Report Page 5 of 36
The Relative error of the meter e in (%) was the quantity used to compare the participants’ results. It
is defined as the difference between the volume indicated by the transfer standard and the volume
measured by the reference (national) standard:
100s
st
V
VVe
, (1)
where e is the relative error of the transfer standard (%), Vt is the volume indicated by the transfer standard (m3),
Vs is the volume measured by the reference standard (m3).
4.2 Equipment
Each laboratory described the equipment used in the calibration and sent the information about
whether or not their traceability is independent of other laboratories or not.
A summary of the used equipment, range of flow tested, and traceability can be found in Table 2.
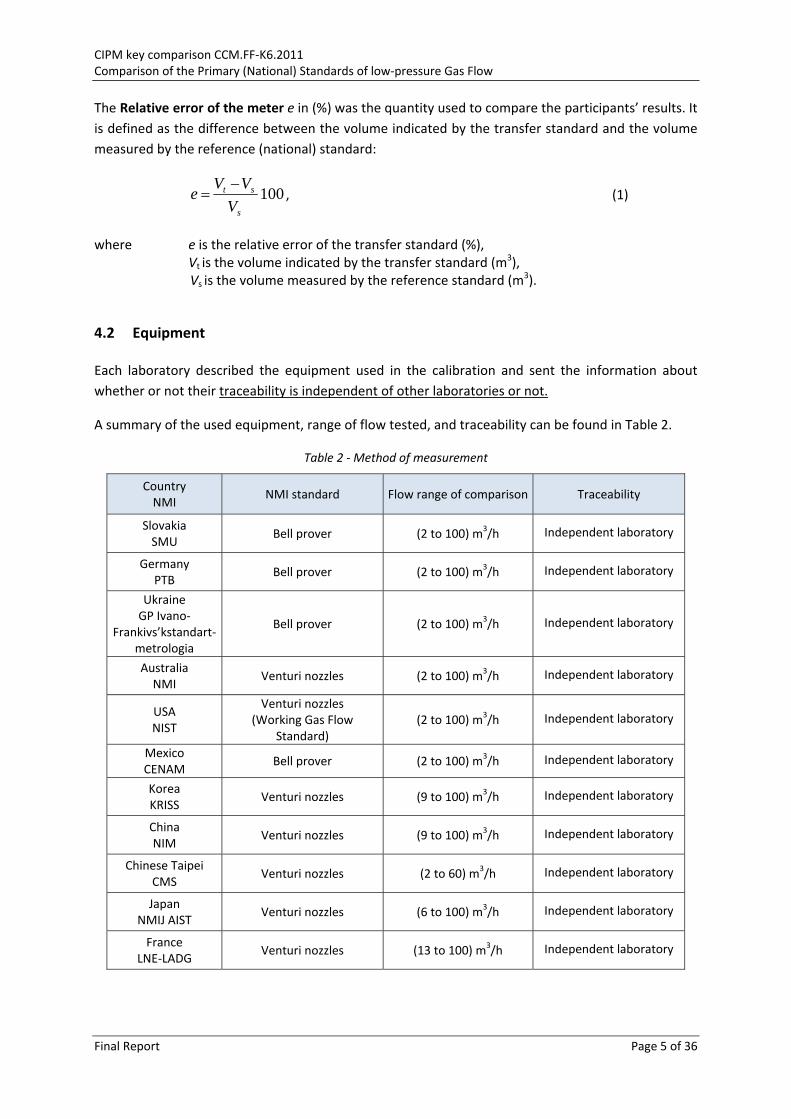
Table 2 ‐ Method of measurement
Country NMI
NMI standard Flow range of comparison Traceability
Slovakia SMU
Bell prover (2 to 100) m3/h Independent laboratory
Germany PTB
Bell prover (2 to 100) m3/h Independent laboratory
Ukraine GP Ivano‐
Frankivs’kstandart‐metrologia
Bell prover (2 to 100) m3/h Independent laboratory
Australia NMI
Venturi nozzles (2 to 100) m3/h Independent laboratory
USA NIST
Venturi nozzles(Working Gas Flow
Standard) (2 to 100) m3/h Independent laboratory
Mexico CENAM
Bell prover (2 to 100) m3/h Independent laboratory
Korea KRISS
Venturi nozzles (9 to 100) m3/h Independent laboratory
China NIM
Venturi nozzles (9 to 100) m3/h Independent laboratory
Chinese Taipei CMS
Venturi nozzles (2 to 60) m3/h Independent laboratory
Japan NMIJ AIST
Venturi nozzles (6 to 100) m3/h Independent laboratory
France LNE‐LADG
Venturi nozzles (13 to 100) m3/h Independent laboratory
CIPM key comparison CCM.FF‐K6.2011 Comparison of the Primary (National) Standards of low‐pressure Gas Flow
Final Report Page 6 of 36
4.3 Measurement procedure and ambient conditions
The measured range was (2 to 100) m3/h. If the laboratory was not able to cover the whole flow
range they could make measurements in one part of the flow range.
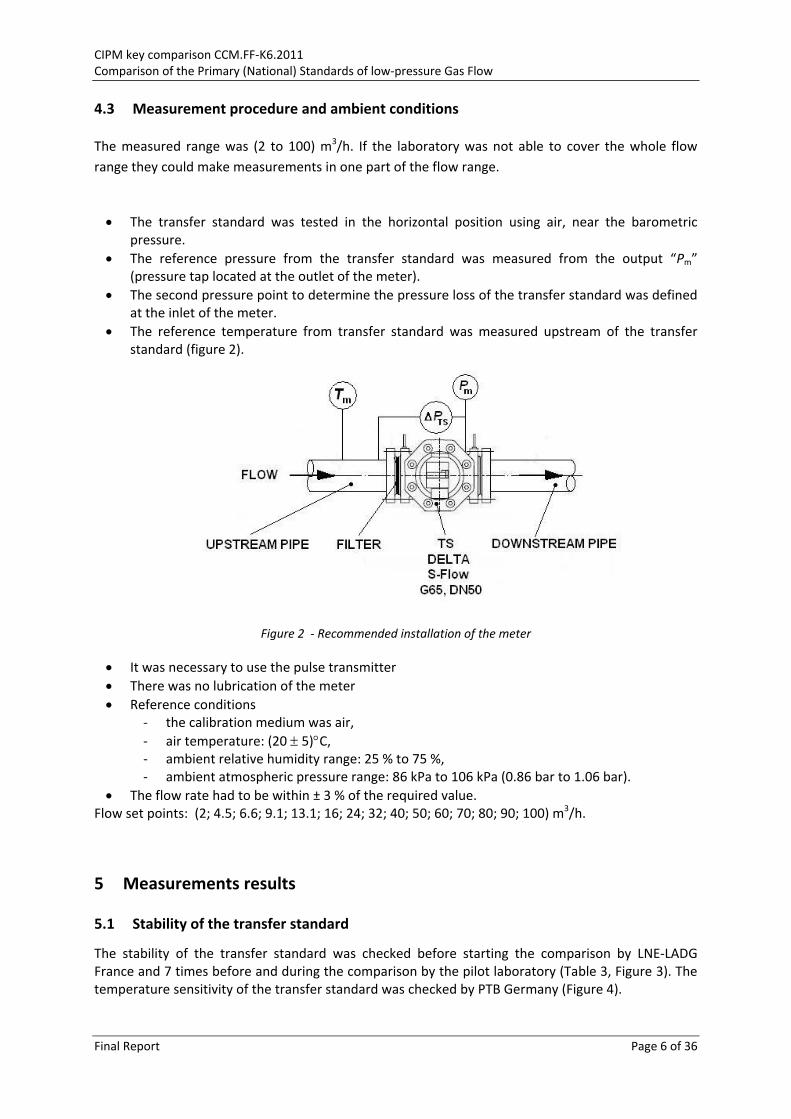
The transfer standard was tested in the horizontal position using air, near the barometric pressure.
The reference pressure from the transfer standard was measured from the output “Pm” (pressure tap located at the outlet of the meter).
The second pressure point to determine the pressure loss of the transfer standard was defined at the inlet of the meter.
The reference temperature from transfer standard was measured upstream of the transfer standard (figure 2).
Figure 2 ‐ Recommended installation of the meter
It was necessary to use the pulse transmitter
There was no lubrication of the meter
Reference conditions ‐ the calibration medium was air,
‐ air temperature: (20 5)C, ‐ ambient relative humidity range: 25 % to 75 %, ‐ ambient atmospheric pressure range: 86 kPa to 106 kPa (0.86 bar to 1.06 bar).
The flow rate had to be within ± 3 % of the required value. Flow set points: (2; 4.5; 6.6; 9.1; 13.1; 16; 24; 32; 40; 50; 60; 70; 80; 90; 100) m3/h.
5 Measurements results
5.1 Stability of the transfer standard
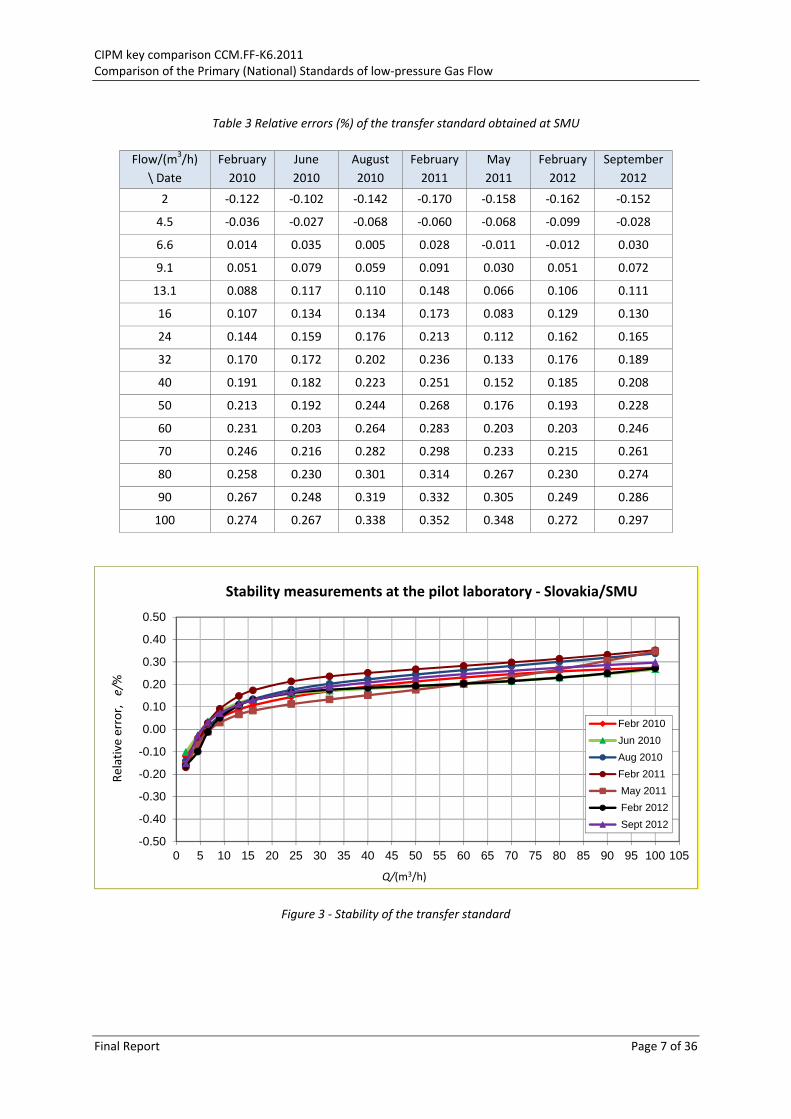
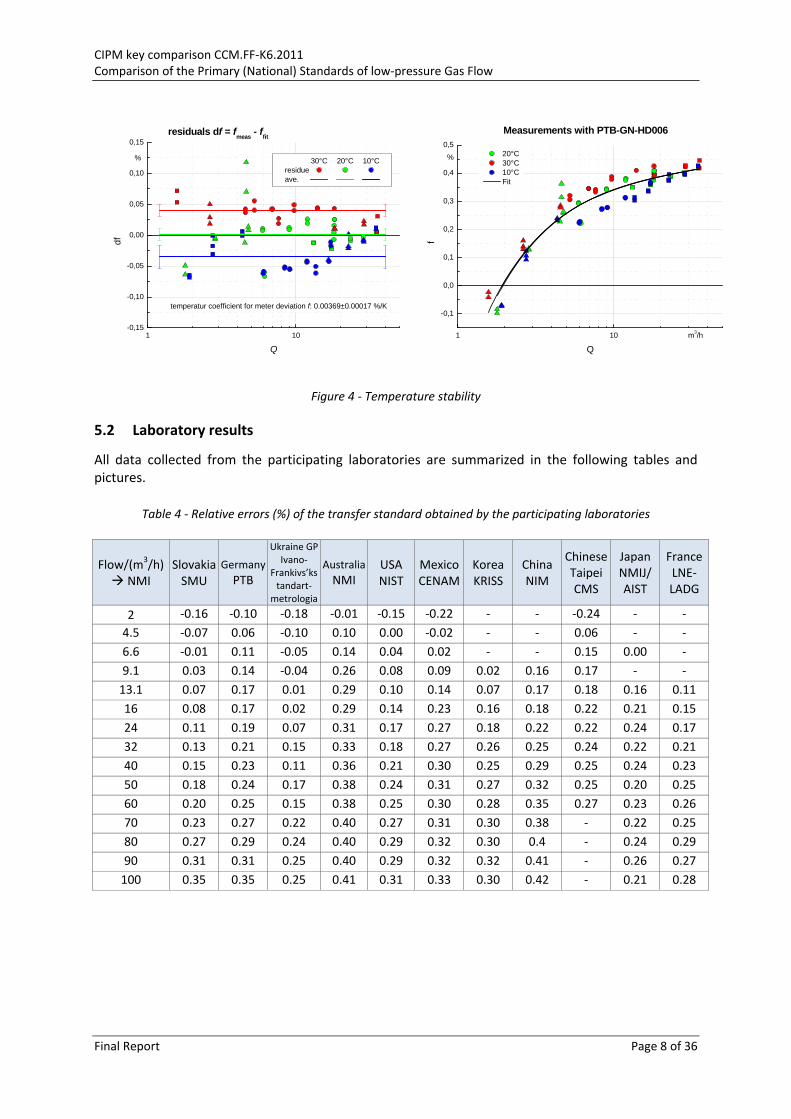
The stability of the transfer standard was checked before starting the comparison by LNE‐LADG France and 7 times before and during the comparison by the pilot laboratory (Table 3, Figure 3). The temperature sensitivity of the transfer standard was checked by PTB Germany (Figure 4).
CIPM key comparison CCM.FF‐K6.2011 Comparison of the Primary (National) Standards of low‐pressure Gas Flow
Final Report Page 7 of 36
Table 3 Relative errors (%) of the transfer standard obtained at SMU
Flow/(m3/h)
\ Date
February
2010
June
2010
August
2010
February
2011
May
2011
February
2012
September
2012
2 ‐0.122 ‐0.102 ‐0.142 ‐0.170 ‐0.158 ‐0.162 ‐0.152
4.5 ‐0.036 ‐0.027 ‐0.068 ‐0.060 ‐0.068 ‐0.099 ‐0.028
6.6 0.014 0.035 0.005 0.028 ‐0.011 ‐0.012 0.030
9.1 0.051 0.079 0.059 0.091 0.030 0.051 0.072
13.1 0.088 0.117 0.110 0.148 0.066 0.106 0.111
16 0.107 0.134 0.134 0.173 0.083 0.129 0.130
24 0.144 0.159 0.176 0.213 0.112 0.162 0.165
32 0.170 0.172 0.202 0.236 0.133 0.176 0.189
40 0.191 0.182 0.223 0.251 0.152 0.185 0.208
50 0.213 0.192 0.244 0.268 0.176 0.193 0.228
60 0.231 0.203 0.264 0.283 0.203 0.203 0.246
70 0.246 0.216 0.282 0.298 0.233 0.215 0.261
80 0.258 0.230 0.301 0.314 0.267 0.230 0.274
90 0.267 0.248 0.319 0.332 0.305 0.249 0.286
100 0.274 0.267 0.338 0.352 0.348 0.272 0.297
Figure 3 ‐ Stability of the transfer standard
-0.50
-0.40
-0.30
-0.20
-0.10
0.00
0.10
0.20
0.30
0.40
0.50
0 5 10 15 20 25 30 35 40 45 50 55 60 65 70 75 80 85 90 95 100 105
Relative error,
e/%
Q/(m3/h)
Stability measurements at the pilot laboratory ‐ Slovakia/SMU
Febr 2010
Jun 2010
Aug 2010
Febr 2011
May 2011
Febr 2012
Sept 2012
CIPM key comparison CCM.FF‐K6.2011 Comparison of the Primary (National) Standards of low‐pressure Gas Flow
Final Report Page 8 of 36
Figure 4 ‐ Temperature stability
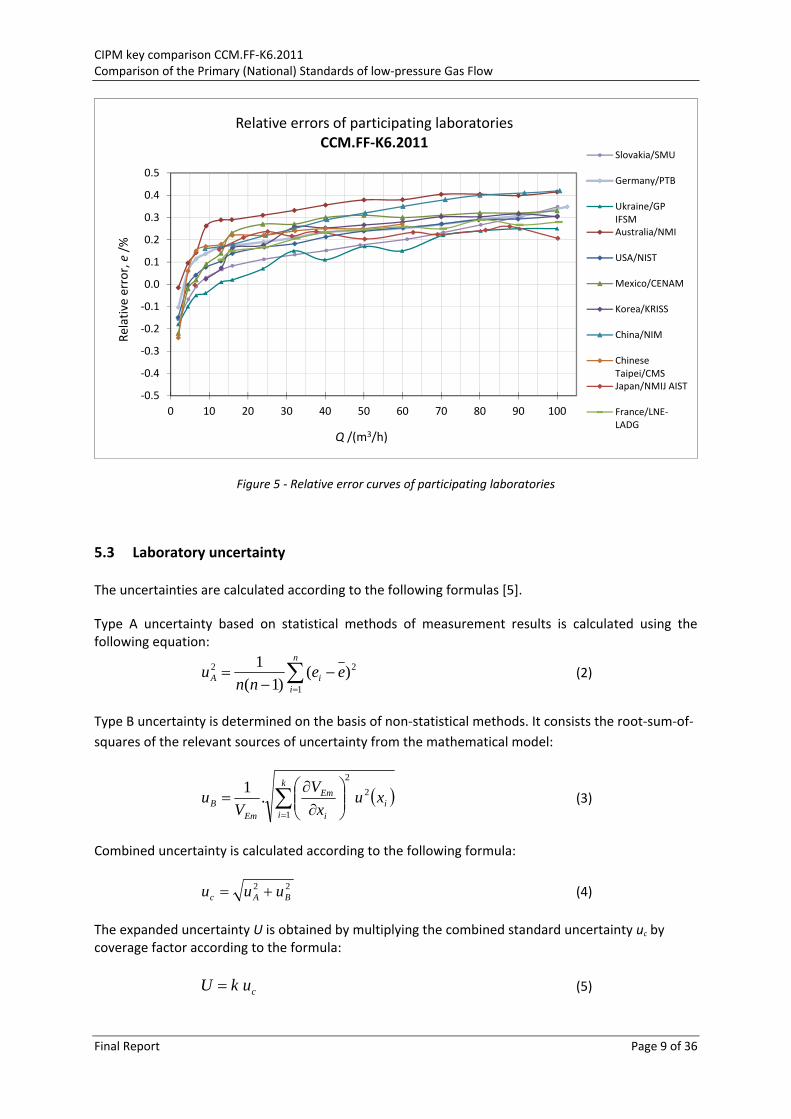
5.2 Laboratory results
All data collected from the participating laboratories are summarized in the following tables and pictures.
Table 4 ‐ Relative errors (%) of the transfer standard obtained by the participating laboratories
Flow/(m3/h) NMI
SlovakiaSMU
Germany
PTB
Ukraine GP Ivano‐
Frankivs’kstandart‐
metrologia
Australia
NMI USA NIST
MexicoCENAM
Korea KRISS
China NIM
Chinese Taipei CMS
Japan NMIJ/ AIST
FranceLNE‐LADG
2 ‐0.16 ‐0.10 ‐0.18 ‐0.01 ‐0.15 ‐0.22 ‐ ‐ ‐0.24 ‐ ‐
4.5 ‐0.07 0.06 ‐0.10 0.10 0.00 ‐0.02 ‐ ‐ 0.06 ‐ ‐
6.6 ‐0.01 0.11 ‐0.05 0.14 0.04 0.02 ‐ ‐ 0.15 0.00 ‐
9.1 0.03 0.14 ‐0.04 0.26 0.08 0.09 0.02 0.16 0.17 ‐ ‐
13.1 0.07 0.17 0.01 0.29 0.10 0.14 0.07 0.17 0.18 0.16 0.11
16 0.08 0.17 0.02 0.29 0.14 0.23 0.16 0.18 0.22 0.21 0.15
24 0.11 0.19 0.07 0.31 0.17 0.27 0.18 0.22 0.22 0.24 0.17
32 0.13 0.21 0.15 0.33 0.18 0.27 0.26 0.25 0.24 0.22 0.21
40 0.15 0.23 0.11 0.36 0.21 0.30 0.25 0.29 0.25 0.24 0.23
50 0.18 0.24 0.17 0.38 0.24 0.31 0.27 0.32 0.25 0.20 0.25
60 0.20 0.25 0.15 0.38 0.25 0.30 0.28 0.35 0.27 0.23 0.26
70 0.23 0.27 0.22 0.40 0.27 0.31 0.30 0.38 ‐ 0.22 0.25
80 0.27 0.29 0.24 0.40 0.29 0.32 0.30 0.4 ‐ 0.24 0.29
90 0.31 0.31 0.25 0.40 0.29 0.32 0.32 0.41 ‐ 0.26 0.27
100 0.35 0.35 0.25 0.41 0.31 0.33 0.30 0.42 ‐ 0.21 0.28
1 10-0,15
-0,10
-0,05
0,00
0,05
0,10
0,15
30°C 20°C 10°Cresidueave.
df
Q
residuals df = fmeas
- ffit
temperatur coefficient for meter deviation f: 0.00369±0.00017 %/K
%
1 10
-0,1
0,0
0,1
0,2
0,3
0,4
0,5 20°C 30°C 10°C Fit
f
Q
m3/h
%
Measurements with PTB-GN-HD006
CIPM key comparison CCM.FF‐K6.2011 Comparison of the Primary (National) Standards of low‐pressure Gas Flow
Final Report Page 9 of 36
Figure 5 ‐ Relative error curves of participating laboratories
5.3 Laboratory uncertainty
The uncertainties are calculated according to the following formulas [5].
Type A uncertainty based on statistical methods of measurement results is calculated using the following equation:
n
iiA ee
nnu
1
22 )()1(
1 (2)
Type B uncertainty is determined on the basis of non‐statistical methods. It consists the root‐sum‐of‐
squares of the relevant sources of uncertainty from the mathematical model:
i
k
i i
Em
EmB xu
x
V
Vu 2
2
1
.1
(3)
Combined uncertainty is calculated according to the following formula:
22BAc uuu (4)
The expanded uncertainty U is obtained by multiplying the combined standard uncertainty uc by coverage factor according to the formula:
cukU (5)
‐0.5
‐0.4
‐0.3
‐0.2
‐0.1
0.0
0.1
0.2
0.3
0.4
0.5
0 10 20 30 40 50 60 70 80 90 100
Relative error, e/%
Q /(m3/h)
Relative errors of participating laboratoriesCCM.FF‐K6.2011
Slovakia/SMU
Germany/PTB
Ukraine/GPIFSMAustralia/NMI
USA/NIST
Mexico/CENAM
Korea/KRISS
China/NIM
ChineseTaipei/CMSJapan/NMIJ AIST
France/LNE‐LADG
CIPM key comparison CCM.FF‐K6.2011 Comparison of the Primary (National) Standards of low‐pressure Gas Flow
Final Report Page 10 of 36
Where the coverage factor k = 2 is usually used in the flow community.
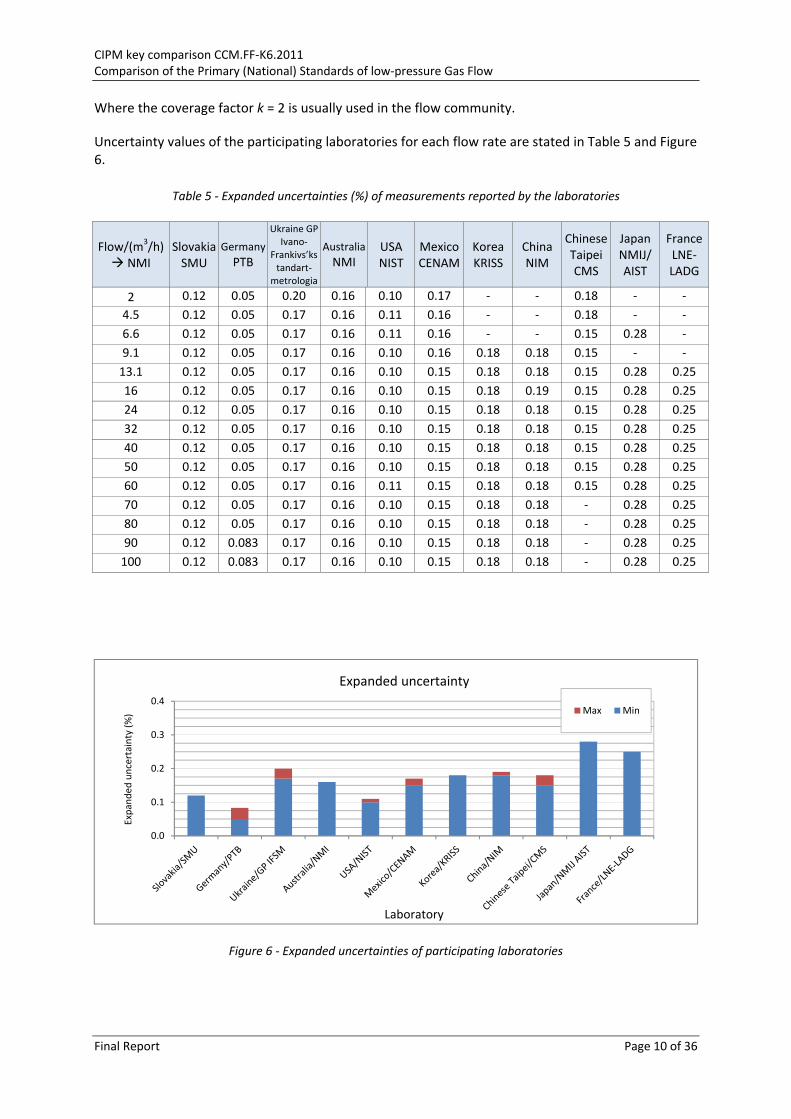
Uncertainty values of the participating laboratories for each flow rate are stated in Table 5 and Figure 6.
Table 5 ‐ Expanded uncertainties (%) of measurements reported by the laboratories
Flow/(m3/h) NMI
SlovakiaSMU
Germany
PTB
Ukraine GP Ivano‐
Frankivs’kstandart‐
metrologia
Australia
NMI USA NIST
MexicoCENAM
Korea KRISS
China NIM
ChineseTaipei CMS
Japan NMIJ/ AIST
FranceLNE‐LADG
2 0.12 0.05 0.20 0.16 0.10 0.17 ‐ ‐ 0.18 ‐ ‐
4.5 0.12 0.05 0.17 0.16 0.11 0.16 ‐ ‐ 0.18 ‐ ‐
6.6 0.12 0.05 0.17 0.16 0.11 0.16 ‐ ‐ 0.15 0.28 ‐
9.1 0.12 0.05 0.17 0.16 0.10 0.16 0.18 0.18 0.15 ‐ ‐
13.1 0.12 0.05 0.17 0.16 0.10 0.15 0.18 0.18 0.15 0.28 0.25
16 0.12 0.05 0.17 0.16 0.10 0.15 0.18 0.19 0.15 0.28 0.25
24 0.12 0.05 0.17 0.16 0.10 0.15 0.18 0.18 0.15 0.28 0.25
32 0.12 0.05 0.17 0.16 0.10 0.15 0.18 0.18 0.15 0.28 0.25
40 0.12 0.05 0.17 0.16 0.10 0.15 0.18 0.18 0.15 0.28 0.25
50 0.12 0.05 0.17 0.16 0.10 0.15 0.18 0.18 0.15 0.28 0.25
60 0.12 0.05 0.17 0.16 0.11 0.15 0.18 0.18 0.15 0.28 0.25
70 0.12 0.05 0.17 0.16 0.10 0.15 0.18 0.18 ‐ 0.28 0.25
80 0.12 0.05 0.17 0.16 0.10 0.15 0.18 0.18 ‐ 0.28 0.25
90 0.12 0.083 0.17 0.16 0.10 0.15 0.18 0.18 ‐ 0.28 0.25
100 0.12 0.083 0.17 0.16 0.10 0.15 0.18 0.18 ‐ 0.28 0.25
Figure 6 ‐ Expanded uncertainties of participating laboratories
0.0
0.1
0.2
0.3
0.4
Expanded
uncertainty (%)
Laboratory
Expanded uncertainty
Max Min
CIPM key comparison CCM.FF‐K6.2011 Comparison of the Primary (National) Standards of low‐pressure Gas Flow
Final Report Page 11 of 36
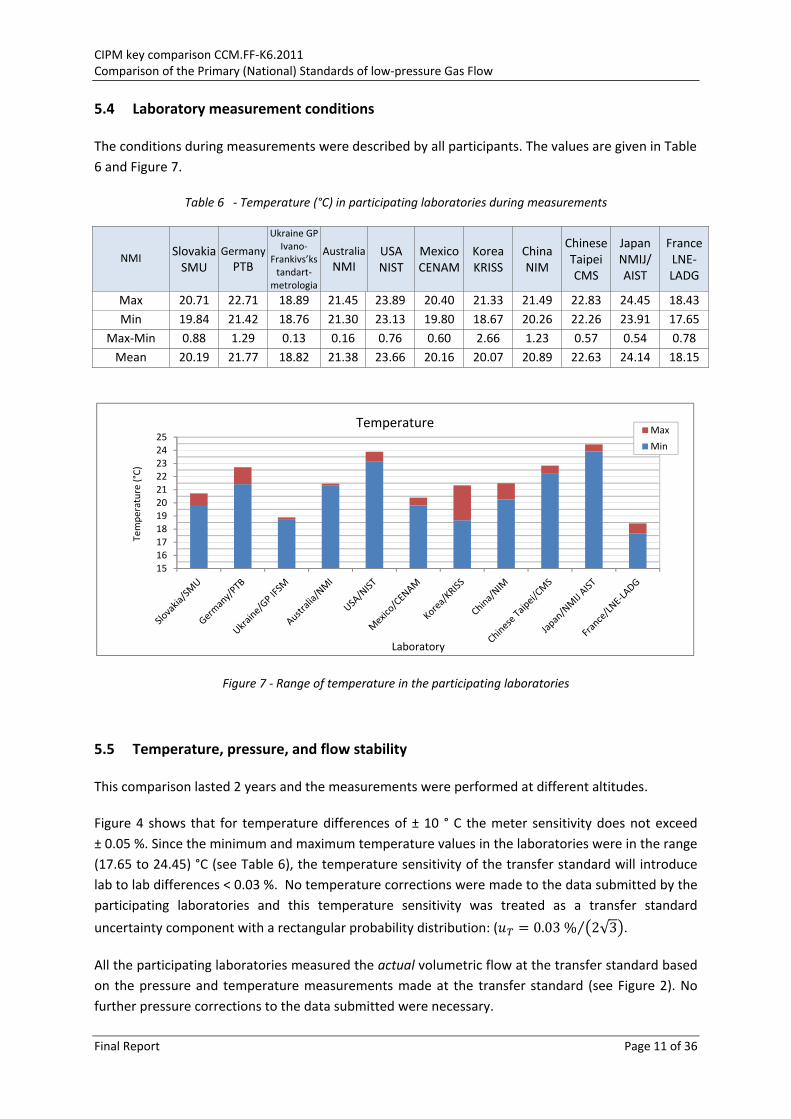
5.4 Laboratory measurement conditions
The conditions during measurements were described by all participants. The values are given in Table
6 and Figure 7.
Table 6 ‐ Temperature (°C) in participating laboratories during measurements
NMI SlovakiaSMU
Germany
PTB
Ukraine GP Ivano‐
Frankivs’kstandart‐
metrologia
Australia
NMI USA NIST
MexicoCENAM
Korea KRISS
China NIM
Chinese Taipei CMS
Japan NMIJ/ AIST
FranceLNE‐LADG
Max 20.71 22.71 18.89 21.45 23.89 20.40 21.33 21.49 22.83 24.45 18.43
Min 19.84 21.42 18.76 21.30 23.13 19.80 18.67 20.26 22.26 23.91 17.65
Max‐Min 0.88 1.29 0.13 0.16 0.76 0.60 2.66 1.23 0.57 0.54 0.78
Mean 20.19 21.77 18.82 21.38 23.66 20.16 20.07 20.89 22.63 24.14 18.15
Figure 7 ‐ Range of temperature in the participating laboratories
5.5 Temperature, pressure, and flow stability
This comparison lasted 2 years and the measurements were performed at different altitudes.
Figure 4 shows that for temperature differences of ± 10 ° C the meter sensitivity does not exceed
± 0.05 %. Since the minimum and maximum temperature values in the laboratories were in the range
(17.65 to 24.45) °C (see Table 6), the temperature sensitivity of the transfer standard will introduce
lab to lab differences < 0.03 %. No temperature corrections were made to the data submitted by the
participating laboratories and this temperature sensitivity was treated as a transfer standard
uncertainty component with a rectangular probability distribution: ( 0.03% 2√3⁄ .
All the participating laboratories measured the actual volumetric flow at the transfer standard based
on the pressure and temperature measurements made at the transfer standard (see Figure 2). No
further pressure corrections to the data submitted were necessary.
1516171819202122232425
Temperature (°C)
Laboratory
Temperature Max
Min
CIPM key comparison CCM.FF‐K6.2011 Comparison of the Primary (National) Standards of low‐pressure Gas Flow
Final Report Page 12 of 36
The tolerance of the flow during the measurement was specified to be 3 % in the comparison
protocol. Some laboratories did not report whether or not this tolerance was met during their
testing. For the laboratories that did report their flow stability it can be verified that the tolerance of
3 % was maintained at all flows except for one laboratory which exceeded this value at the following
flows ‐ (13.1; 16.0; 24.0; 40.0 and 60.0) m3/h . No correction was made for flows not meeting the
3 % criteria.
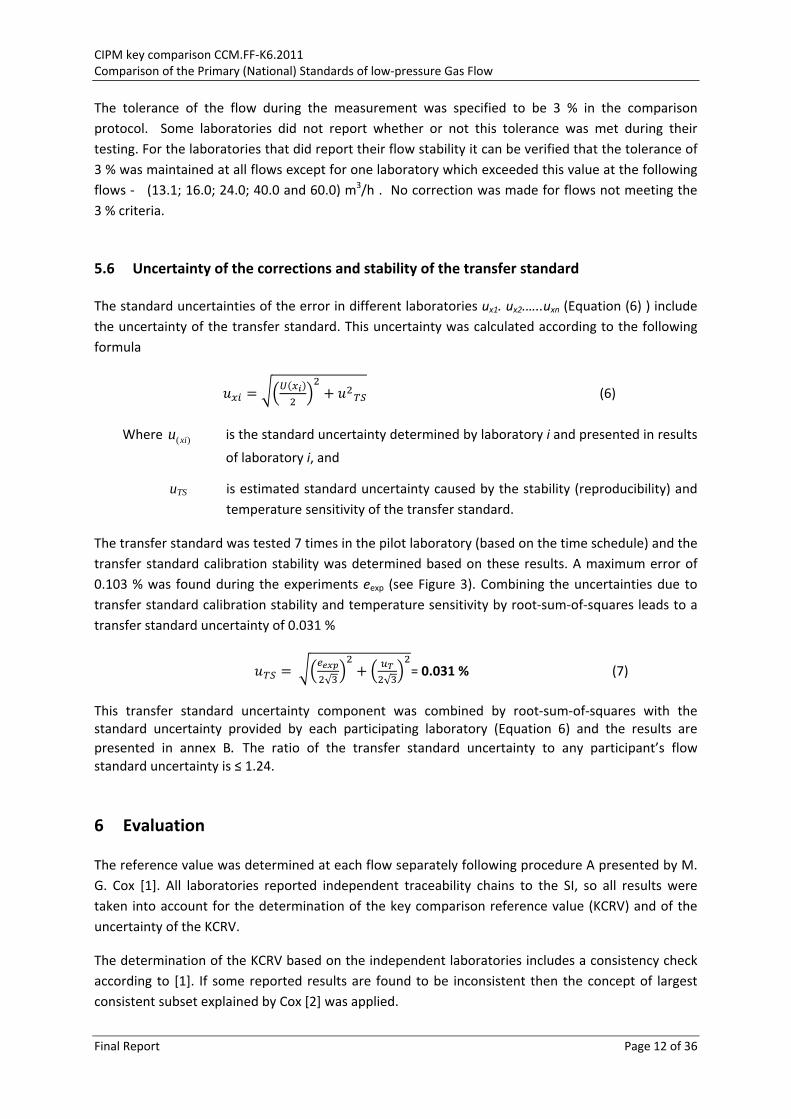
5.6 Uncertainty of the corrections and stability of the transfer standard
The standard uncertainties of the error in different laboratories ux1. ux2.…..uxn (Equation (6) ) include
the uncertainty of the transfer standard. This uncertainty was calculated according to the following
formula
(6)
Where )(xiu is the standard uncertainty determined by laboratory i and presented in results
of laboratory i, and
uTS is estimated standard uncertainty caused by the stability (reproducibility) and
temperature sensitivity of the transfer standard.
The transfer standard was tested 7 times in the pilot laboratory (based on the time schedule) and the
transfer standard calibration stability was determined based on these results. A maximum error of
0.103 % was found during the experiments eexp (see Figure 3). Combining the uncertainties due to
transfer standard calibration stability and temperature sensitivity by root‐sum‐of‐squares leads to a
transfer standard uncertainty of 0.031 %
√ √
= 0.031 % (7)
This transfer standard uncertainty component was combined by root‐sum‐of‐squares with the standard uncertainty provided by each participating laboratory (Equation 6) and the results are
presented in annex B. The ratio of the transfer standard uncertainty to any participant’s flow standard uncertainty is ≤ 1.24.
6 Evaluation
The reference value was determined at each flow separately following procedure A presented by M.
G. Cox [1]. All laboratories reported independent traceability chains to the SI, so all results were
taken into account for the determination of the key comparison reference value (KCRV) and of the
uncertainty of the KCRV.
The determination of the KCRV based on the independent laboratories includes a consistency check
according to [1]. If some reported results are found to be inconsistent then the concept of largest
consistent subset explained by Cox [2] was applied.
CIPM key comparison CCM.FF‐K6.2011 Comparison of the Primary (National) Standards of low‐pressure Gas Flow
Final Report Page 13 of 36
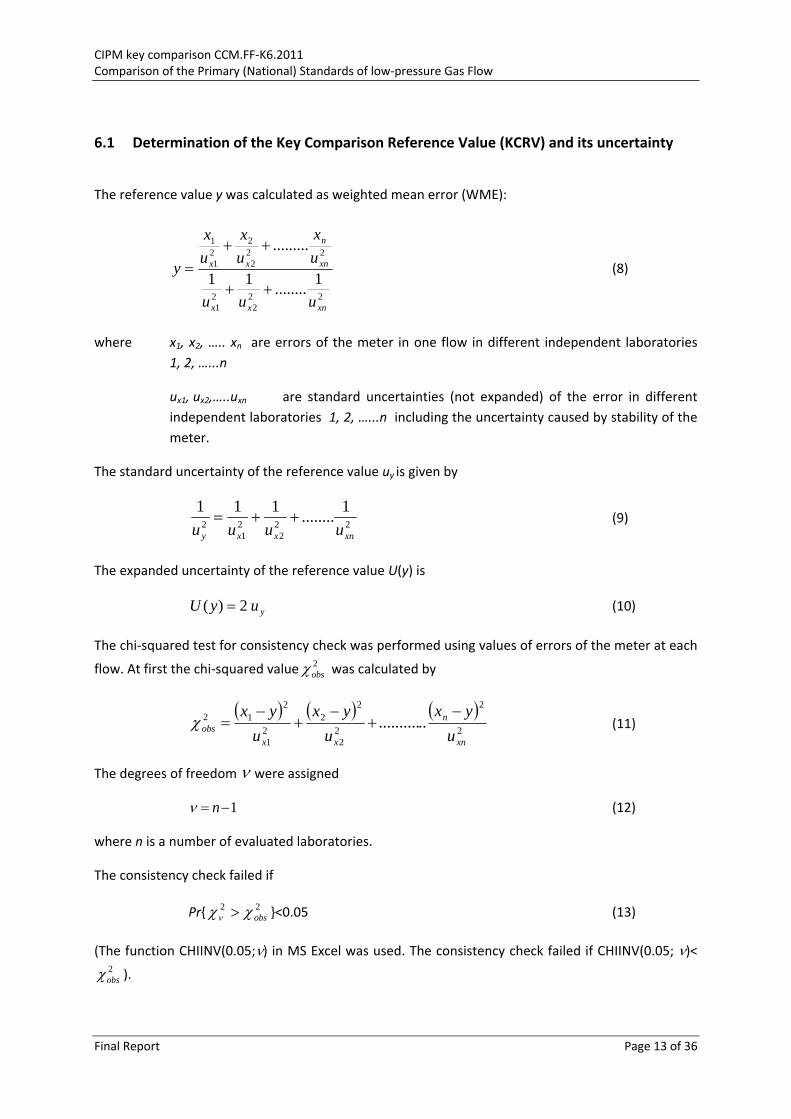
6.1 Determination of the Key Comparison Reference Value (KCRV) and its uncertainty
The reference value y was calculated as weighted mean error (WME):
222
21
222
221
1
1........
11
.........
xnxx
xn
n
xx
uuu
u
x
u
x
u
x
y
(8)
where x1, x2, ….. xn are errors of the meter in one flow in different independent laboratories
1, 2, …...n
ux1, ux2,…..uxn are standard uncertainties (not expanded) of the error in different
independent laboratories 1, 2, …...n including the uncertainty caused by stability of the
meter.
The standard uncertainty of the reference value uy is given by
222
21
2
1........
111
xnxxy uuuu (9)
The expanded uncertainty of the reference value U(y) is
yuyU 2)( (10)
The chi‐squared test for consistency check was performed using values of errors of the meter at each
flow. At first the chi‐squared value 2obs was calculated by
2
2
22
22
21
212 ............
xn
n
xx
obsu
yx
u
yx
u
yx
(11)
The degrees of freedom were assigned
1 n (12)
where n is a number of evaluated laboratories.
The consistency check failed if
Pr{ 22obs }<0.05 (13)
(The function CHIINV(0.05;) in MS Excel was used. The consistency check failed if CHIINV(0.05; )<2obs ).
CIPM key comparison CCM.FF‐K6.2011 Comparison of the Primary (National) Standards of low‐pressure Gas Flow
Final Report Page 14 of 36
If the consistency check passed, then y was accepted as the key comparison reference value xref and
U(y) was accepted as the expanded uncertainty of the key comparison reference value U(xref).
If the consistency check failed, then the laboratory with the highest value of
2
2
xi
i
u
yx was excluded
for the next round of evaluation and the new reference value y (WME). The new standard
uncertainty of the reference value uy and the chi‐squared value2obs were calculated again without
the values of the excluded laboratory. The consistency check was performed again too.
All laboratories passed the consistency check.
6.2 The determination of the differences “Lab to KCRV” and “Lab to Lab”
When the KCRV was determined, the differences between the participating laboratories and the
KCRV were calculated according to
refii xxd (14)
and jiij xxd (15)
Based on these differences, the normalized Degree of Equivalence (DoE) was calculated according to:
)( i
ii dU
dEn (16)
and )( ij
ijij dU
dEn (17)
The DoE is a measure for the equivalence of the results of any laboratory with the KCRV or with any
other laboratory, respectively:
‐ the results of a laboratory were equivalent (passed) if Eni or Enij ≤ 1.
‐ the laboratory was determined as not equivalent (failed) if Eni or Enij >1.
The calculation of the DoE needs information about the uncertainty of the differences di and dij
(Equations (14) and (15)). To make statements about this, it is necessary to consider first the general
problem of the difference of two values x1 and x2. If we look to the pure propagation of (standard)
uncertainty we find:
cov.2cov
cov 22
21
2
21
1
21
22
21
2
21
1
212
21
uu
x
xxx
xx
u
u
x
xx
x
xxu xx (18)
CIPM key comparison CCM.FF‐K6.2011 Comparison of the Primary (National) Standards of low‐pressure Gas Flow
Final Report Page 15 of 36
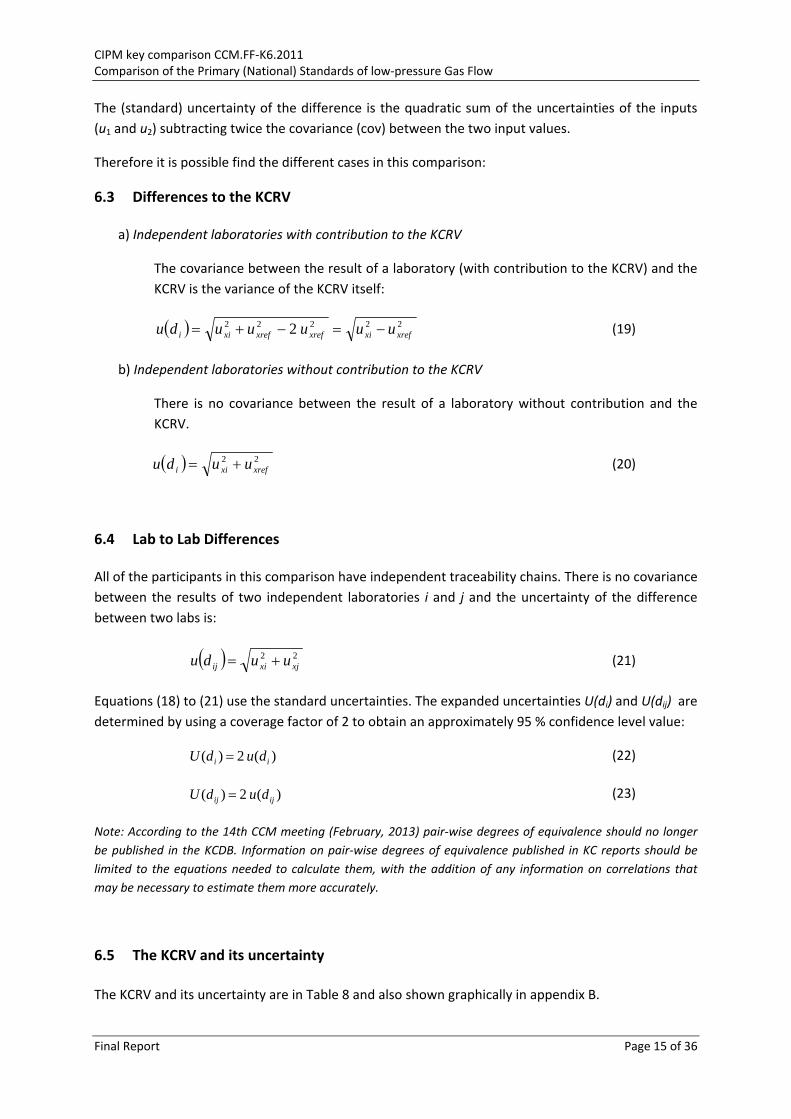
The (standard) uncertainty of the difference is the quadratic sum of the uncertainties of the inputs
(u1 and u2) subtracting twice the covariance (cov) between the two input values.
Therefore it is possible find the different cases in this comparison:
6.3 Differences to the KCRV
a) Independent laboratories with contribution to the KCRV
The covariance between the result of a laboratory (with contribution to the KCRV) and the
KCRV is the variance of the KCRV itself:
22222 2 xrefxixrefxrefxii uuuuudu (19)
b) Independent laboratories without contribution to the KCRV
There is no covariance between the result of a laboratory without contribution and the
KCRV.
22xrefxii uudu (20)
6.4 Lab to Lab Differences
All of the participants in this comparison have independent traceability chains. There is no covariance
between the results of two independent laboratories i and j and the uncertainty of the difference
between two labs is:
22xjxiij uudu (21)
Equations (18) to (21) use the standard uncertainties. The expanded uncertainties U(di) and U(dij) are
determined by using a coverage factor of 2 to obtain an approximately 95 % confidence level value:
)(2)( ii dudU (22)
)(2)( ijij dudU (23)
Note: According to the 14th CCM meeting (February, 2013) pair‐wise degrees of equivalence should no longer
be published in the KCDB. Information on pair‐wise degrees of equivalence published in KC reports should be
limited to the equations needed to calculate them, with the addition of any information on correlations that
may be necessary to estimate them more accurately.
6.5 The KCRV and its uncertainty
The KCRV and its uncertainty are in Table 8 and also shown graphically in appendix B.
CIPM key comparison CCM.FF‐K6.2011 Comparison of the Primary (National) Standards of low‐pressure Gas Flow
Final Report Page 16 of 36
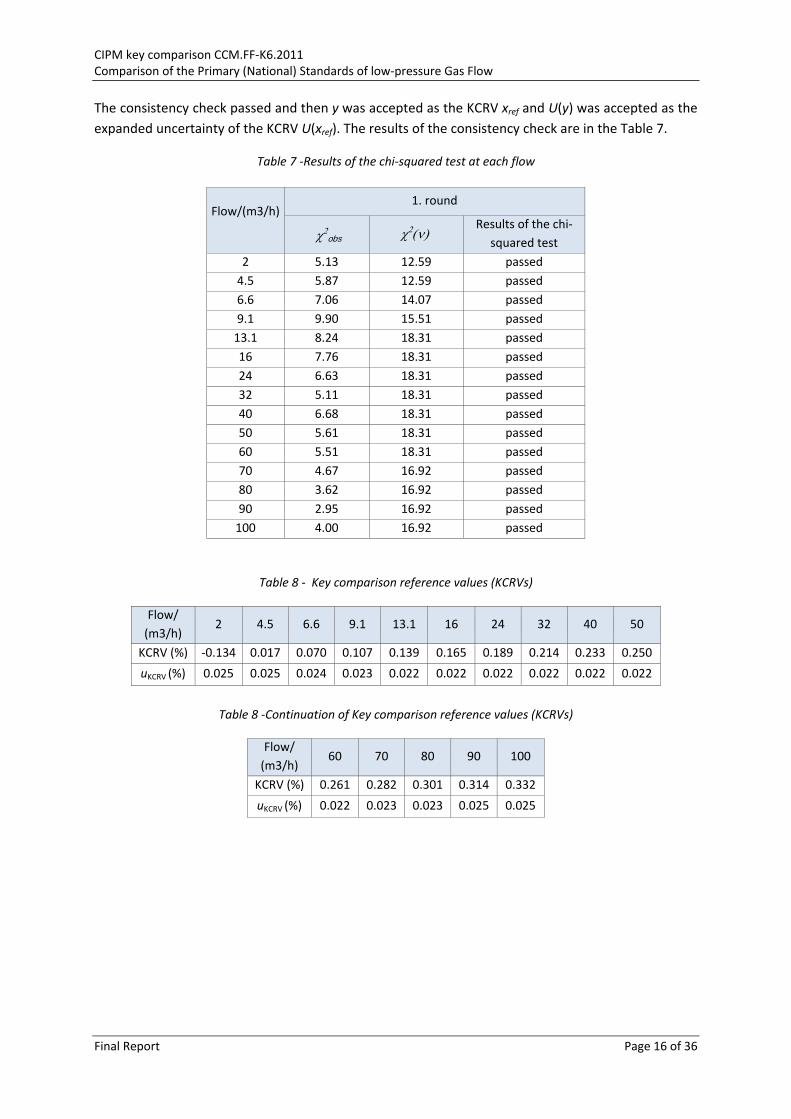
The consistency check passed and then y was accepted as the KCRV xref and U(y) was accepted as the
expanded uncertainty of the KCRV U(xref). The results of the consistency check are in the Table 7.
Table 7 ‐Results of the chi‐squared test at each flow
Flow/(m3/h)
1. round
obs Results of the chi‐
squared test
2 5.13 12.59 passed
4.5 5.87 12.59 passed
6.6 7.06 14.07 passed
9.1 9.90 15.51 passed
13.1 8.24 18.31 passed
16 7.76 18.31 passed
24 6.63 18.31 passed
32 5.11 18.31 passed
40 6.68 18.31 passed
50 5.61 18.31 passed
60 5.51 18.31 passed
70 4.67 16.92 passed
80 3.62 16.92 passed
90 2.95 16.92 passed
100 4.00 16.92 passed
Table 8 ‐ Key comparison reference values (KCRVs)
Flow/
(m3/h) 2 4.5 6.6 9.1 13.1 16 24 32 40 50
KCRV (%) ‐0.134 0.017 0.070 0.107 0.139 0.165 0.189 0.214 0.233 0.250
uKCRV (%) 0.025 0.025 0.024 0.023 0.022 0.022 0.022 0.022 0.022 0.022
Table 8 ‐Continuation of Key comparison reference values (KCRVs)
Flow/
(m3/h) 60 70 80 90 100
KCRV (%) 0.261 0.282 0.301 0.314 0.332
uKCRV (%) 0.022 0.023 0.023 0.025 0.025
CIPM key comparison CCM.FF‐K6.2011 Comparison of the Primary (National) Standards of low‐pressure Gas Flow
Final Report Page 17 of 36
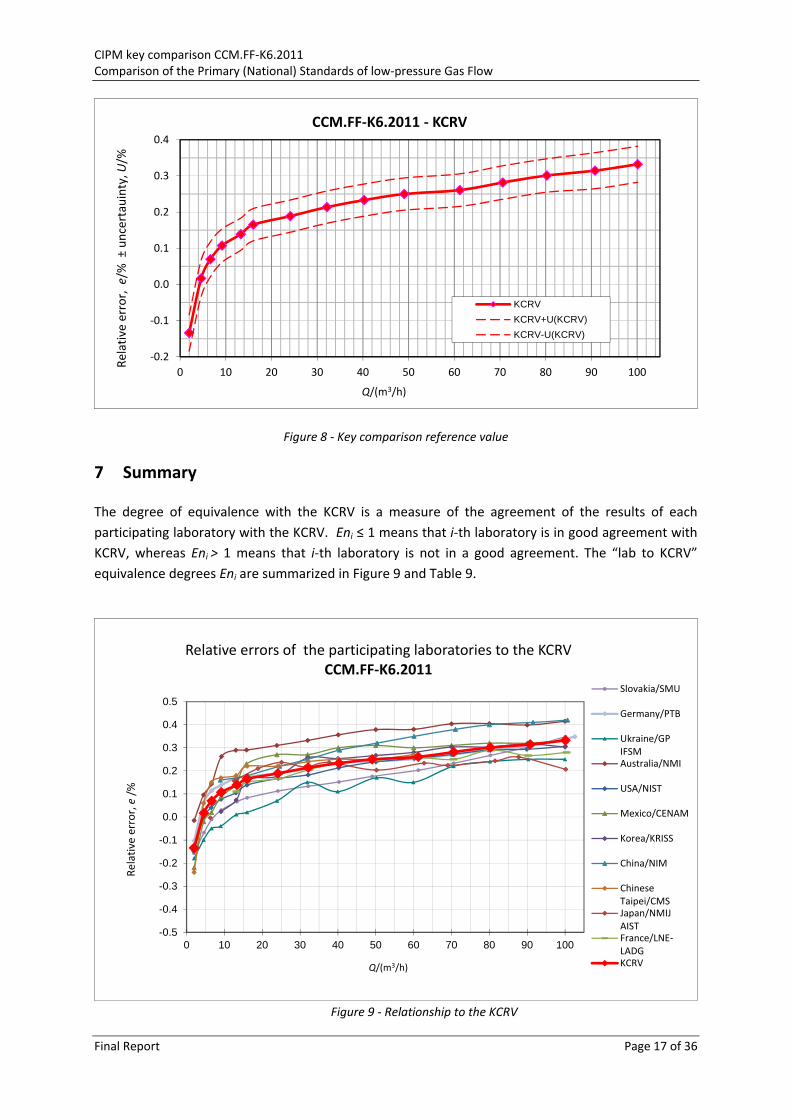
Figure 8 ‐ Key comparison reference value
7 Summary
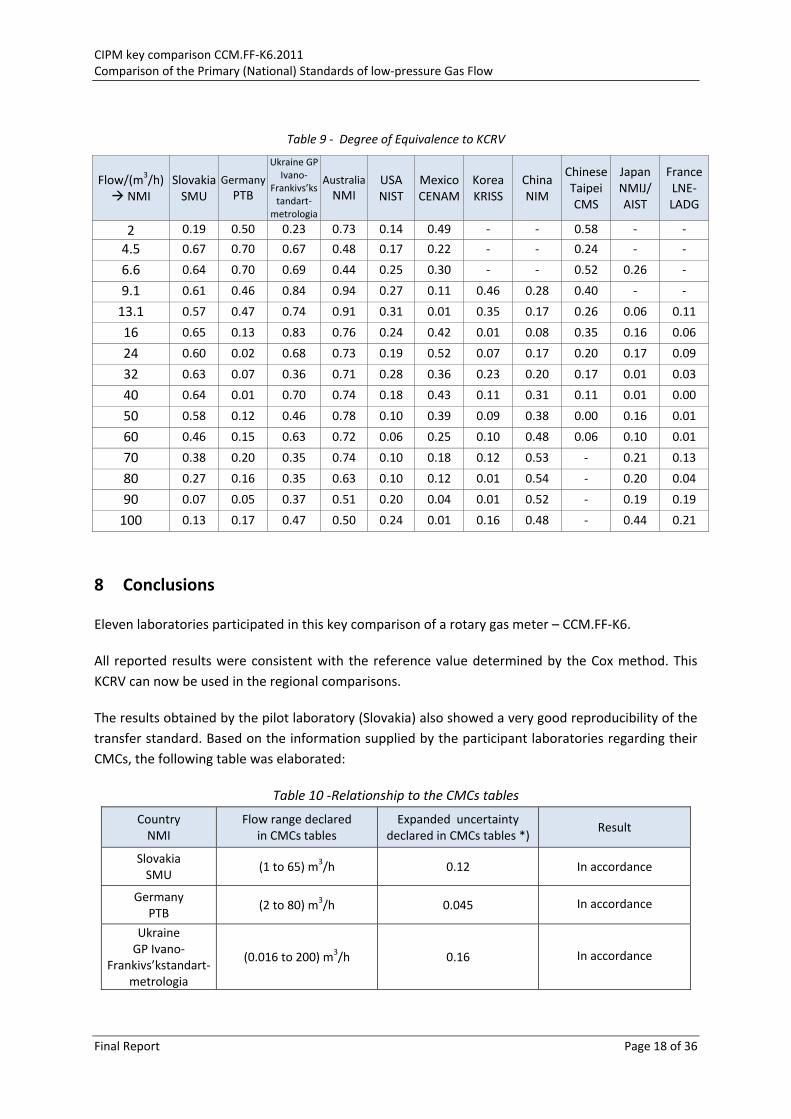
The degree of equivalence with the KCRV is a measure of the agreement of the results of each
participating laboratory with the KCRV. Eni ≤ 1 means that i‐th laboratory is in good agreement with
KCRV, whereas Eni > 1 means that i‐th laboratory is not in a good agreement. The “lab to KCRV”
equivalence degrees Eni are summarized in Figure 9 and Table 9.
Figure 9 ‐ Relationship to the KCRV
‐0.2
‐0.1
0.0
0.1
0.2
0.3
0.4
0 10 20 30 40 50 60 70 80 90 100
Relative error,
e/%
±uncertauinty,U
/%
Q/(m3/h)
CCM.FF‐K6.2011 ‐ KCRV
KCRV
KCRV+U(KCRV)
KCRV-U(KCRV)
-0.5
-0.4
-0.3
-0.2
-0.1
0.0
0.1
0.2
0.3
0.4
0.5
0 10 20 30 40 50 60 70 80 90 100
Relative error, e/%
Q/(m3/h)
Relative errors of the participating laboratories to the KCRVCCM.FF‐K6.2011
Slovakia/SMU
Germany/PTB
Ukraine/GPIFSMAustralia/NMI
USA/NIST
Mexico/CENAM
Korea/KRISS
China/NIM
ChineseTaipei/CMSJapan/NMIJAISTFrance/LNE‐LADGKCRV
CIPM key comparison CCM.FF‐K6.2011 Comparison of the Primary (National) Standards of low‐pressure Gas Flow
Final Report Page 18 of 36
Table 9 ‐ Degree of Equivalence to KCRV
Flow/(m3/h) NMI
SlovakiaSMU
Germany
PTB
Ukraine GP Ivano‐
Frankivs’kstandart‐
metrologia
Australia
NMI USA NIST
MexicoCENAM
Korea KRISS
China NIM
ChineseTaipei CMS
Japan NMIJ/ AIST
FranceLNE‐LADG
2 0.19 0.50 0.23 0.73 0.14 0.49 ‐ ‐ 0.58 ‐ ‐
4.5 0.67 0.70 0.67 0.48 0.17 0.22 ‐ ‐ 0.24 ‐ ‐
6.6 0.64 0.70 0.69 0.44 0.25 0.30 ‐ ‐ 0.52 0.26 ‐
9.1 0.61 0.46 0.84 0.94 0.27 0.11 0.46 0.28 0.40 ‐ ‐
13.1 0.57 0.47 0.74 0.91 0.31 0.01 0.35 0.17 0.26 0.06 0.11
16 0.65 0.13 0.83 0.76 0.24 0.42 0.01 0.08 0.35 0.16 0.06
24 0.60 0.02 0.68 0.73 0.19 0.52 0.07 0.17 0.20 0.17 0.09
32 0.63 0.07 0.36 0.71 0.28 0.36 0.23 0.20 0.17 0.01 0.03
40 0.64 0.01 0.70 0.74 0.18 0.43 0.11 0.31 0.11 0.01 0.00
50 0.58 0.12 0.46 0.78 0.10 0.39 0.09 0.38 0.00 0.16 0.01
60 0.46 0.15 0.63 0.72 0.06 0.25 0.10 0.48 0.06 0.10 0.01
70 0.38 0.20 0.35 0.74 0.10 0.18 0.12 0.53 ‐ 0.21 0.13
80 0.27 0.16 0.35 0.63 0.10 0.12 0.01 0.54 ‐ 0.20 0.04
90 0.07 0.05 0.37 0.51 0.20 0.04 0.01 0.52 ‐ 0.19 0.19
100 0.13 0.17 0.47 0.50 0.24 0.01 0.16 0.48 ‐ 0.44 0.21
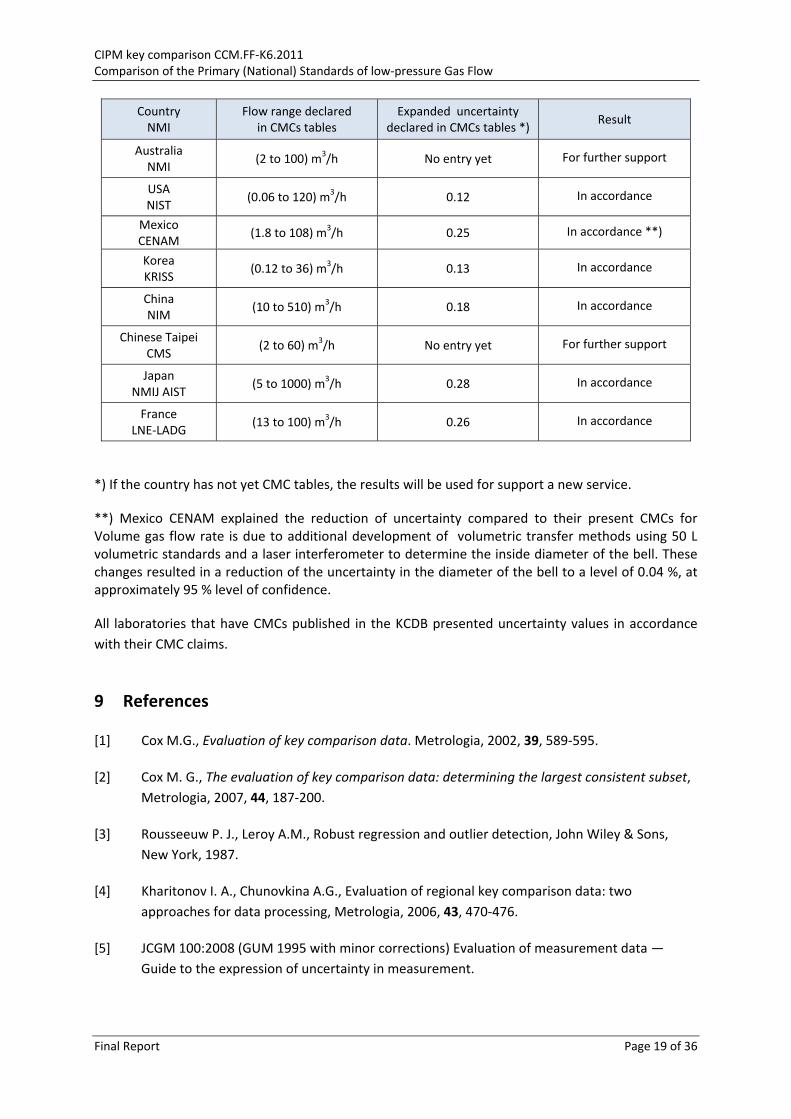
8 Conclusions
Eleven laboratories participated in this key comparison of a rotary gas meter – CCM.FF‐K6.
All reported results were consistent with the reference value determined by the Cox method. This
KCRV can now be used in the regional comparisons.
The results obtained by the pilot laboratory (Slovakia) also showed a very good reproducibility of the
transfer standard. Based on the information supplied by the participant laboratories regarding their
CMCs, the following table was elaborated:
Table 10 ‐Relationship to the CMCs tables
Country NMI
Flow range declared in CMCs tables
Expanded uncertainty declared in CMCs tables *)
Result
Slovakia SMU
(1 to 65) m3/h 0.12 In accordance
Germany PTB
(2 to 80) m3/h 0.045 In accordance
Ukraine GP Ivano‐
Frankivs’kstandart‐metrologia
(0.016 to 200) m3/h 0.16 In accordance
CIPM key comparison CCM.FF‐K6.2011 Comparison of the Primary (National) Standards of low‐pressure Gas Flow
Final Report Page 19 of 36
Country NMI
Flow range declared in CMCs tables
Expanded uncertainty declared in CMCs tables *)
Result
Australia NMI
(2 to 100) m3/h No entry yet For further support
USA NIST
(0.06 to 120) m3/h 0.12 In accordance
Mexico CENAM
(1.8 to 108) m3/h 0.25 In accordance **)
Korea KRISS
(0.12 to 36) m3/h 0.13 In accordance
China NIM
(10 to 510) m3/h 0.18 In accordance
Chinese Taipei CMS
(2 to 60) m3/h No entry yet For further support
Japan NMIJ AIST
(5 to 1000) m3/h 0.28 In accordance
France LNE‐LADG
(13 to 100) m3/h 0.26 In accordance
*) If the country has not yet CMC tables, the results will be used for support a new service.
**) Mexico CENAM explained the reduction of uncertainty compared to their present CMCs for Volume gas flow rate is due to additional development of volumetric transfer methods using 50 L volumetric standards and a laser interferometer to determine the inside diameter of the bell. These changes resulted in a reduction of the uncertainty in the diameter of the bell to a level of 0.04 %, at approximately 95 % level of confidence.
All laboratories that have CMCs published in the KCDB presented uncertainty values in accordance
with their CMC claims.
9 References
[1] Cox M.G., Evaluation of key comparison data. Metrologia, 2002, 39, 589‐595.
[2] Cox M. G., The evaluation of key comparison data: determining the largest consistent subset,
Metrologia, 2007, 44, 187‐200.
[3] Rousseeuw P. J., Leroy A.M., Robust regression and outlier detection, John Wiley & Sons,
New York, 1987.
[4] Kharitonov I. A., Chunovkina A.G., Evaluation of regional key comparison data: two
approaches for data processing, Metrologia, 2006, 43, 470‐476.
[5] JCGM 100:2008 (GUM 1995 with minor corrections) Evaluation of measurement data —
Guide to the expression of uncertainty in measurement.
CIPM key comparison CCM.FF‐K6.2011 Comparison of the Primary (National) Standards of low‐pressure Gas Flow
Final Report Page 20 of 36
Appendix A – NMI reports Characteristic information\ picture of the primary
standard used by measurements Working procedure
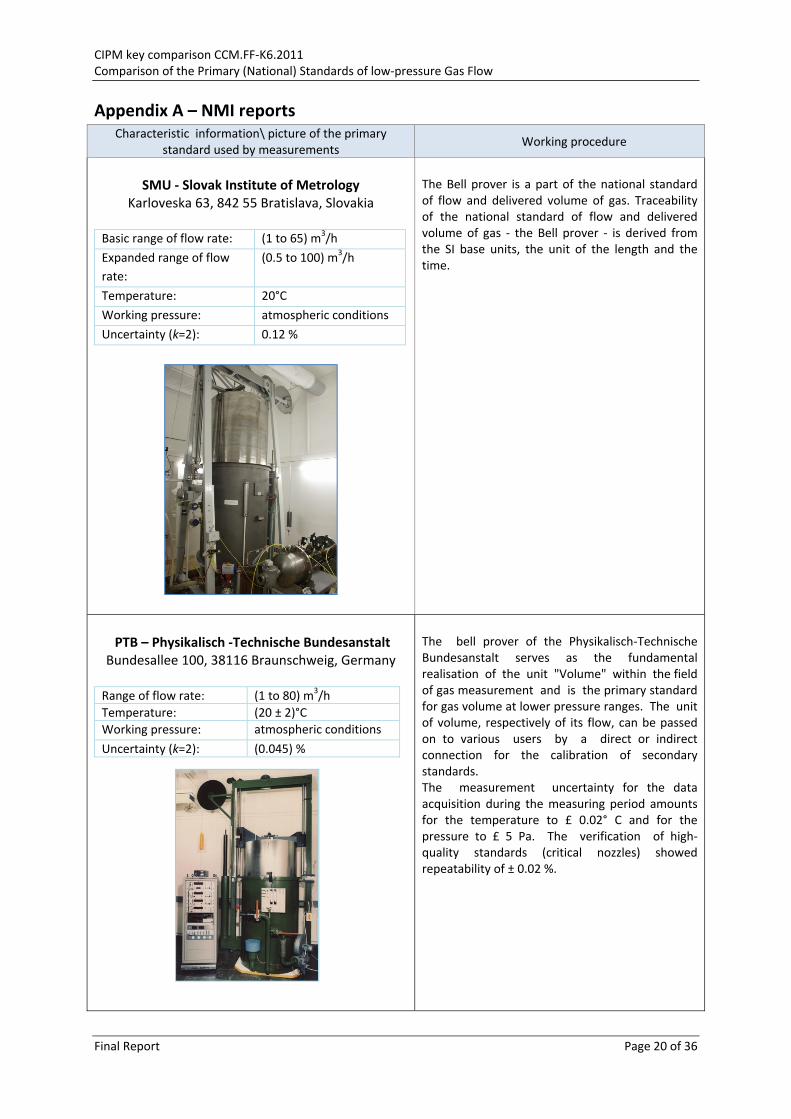
SMU ‐ Slovak Institute of Metrology
Karloveska 63, 842 55 Bratislava, Slovakia Basic range of flow rate: (1 to 65) m3/h
Expanded range of flow
rate:
(0.5 to 100) m3/h
Temperature: 20°C
Working pressure: atmospheric conditions
Uncertainty (k=2): 0.12 %
The Bell prover is a part of the national standard of flow and delivered volume of gas. Traceability of the national standard of flow and delivered volume of gas ‐ the Bell prover ‐ is derived from the SI base units, the unit of the length and the time.
PTB – Physikalisch ‐Technische Bundesanstalt Bundesallee 100, 38116 Braunschweig, Germany
Range of flow rate: (1 to 80) m3/h
Temperature: (20 ± 2)°C
Working pressure: atmospheric conditions
Uncertainty (k=2): (0.045) %
The bell prover of the Physikalisch‐Technische Bundesanstalt serves as the fundamental realisation of the unit "Volume" within the field of gas measurement and is the primary standard for gas volume at lower pressure ranges. The unit of volume, respectively of its flow, can be passed on to various users by a direct or indirect connection for the calibration of secondary standards. The measurement uncertainty for the data acquisition during the measuring period amounts for the temperature to £ 0.02° C and for the pressure to £ 5 Pa. The verification of high‐quality standards (critical nozzles) showed repeatability of ± 0.02 %.
CIPM key comparison CCM.FF‐K6.2011 Comparison of the Primary (National) Standards of low‐pressure Gas Flow
Final Report Page 21 of 36
Characteristic information\ picture of the primary standard used by measurements
Working procedure
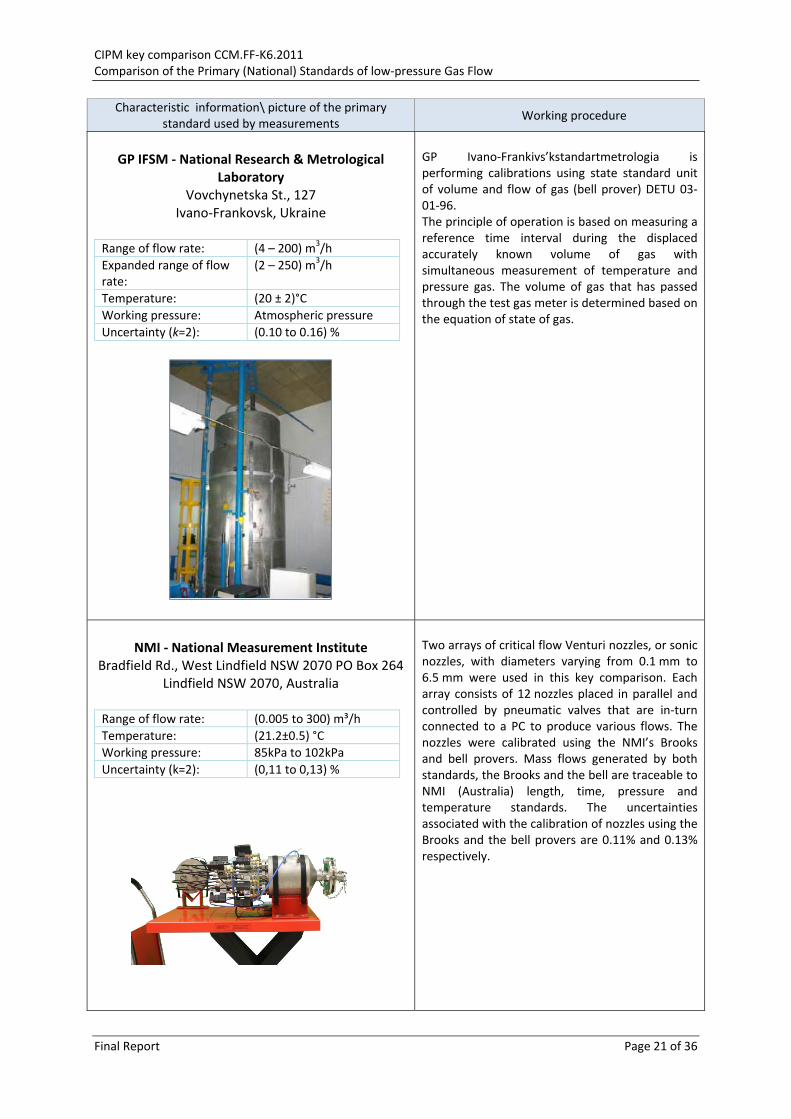
GP IFSM ‐ National Research & Metrological
Laboratory Vovchynetska St., 127
Ivano‐Frankovsk, Ukraine Range of flow rate: (4 – 200) m3/h
Expanded range of flow rate:
(2 – 250) m3/h
Temperature: (20 ± 2)°C
Working pressure: Atmospheric pressure
Uncertainty (k=2): (0.10 to 0.16) %
GP Ivano‐Frankivs’kstandartmetrologia is performing calibrations using state standard unit of volume and flow of gas (bell prover) DETU 03‐01‐96. The principle of operation is based on measuring a reference time interval during the displaced accurately known volume of gas with simultaneous measurement of temperature and pressure gas. The volume of gas that has passed through the test gas meter is determined based on the equation of state of gas.
NMI ‐ National Measurement Institute
Bradfield Rd., West Lindfield NSW 2070 PO Box 264 Lindfield NSW 2070, Australia
Range of flow rate: (0.005 to 300) m³/h
Temperature: (21.2±0.5) °C
Working pressure: 85kPa to 102kPa
Uncertainty (k=2): (0,11 to 0,13) %
Two arrays of critical flow Venturi nozzles, or sonic nozzles, with diameters varying from 0.1 mm to 6.5 mm were used in this key comparison. Each array consists of 12 nozzles placed in parallel and controlled by pneumatic valves that are in‐turn connected to a PC to produce various flows. The nozzles were calibrated using the NMI’s Brooks and bell provers. Mass flows generated by both standards, the Brooks and the bell are traceable to NMI (Australia) length, time, pressure and temperature standards. The uncertainties associated with the calibration of nozzles using the Brooks and the bell provers are 0.11% and 0.13% respectively.
CIPM key comparison CCM.FF‐K6.2011 Comparison of the Primary (National) Standards of low‐pressure Gas Flow
Final Report Page 22 of 36
Characteristic information\ picture of the primary standard used by measurements
Working procedure
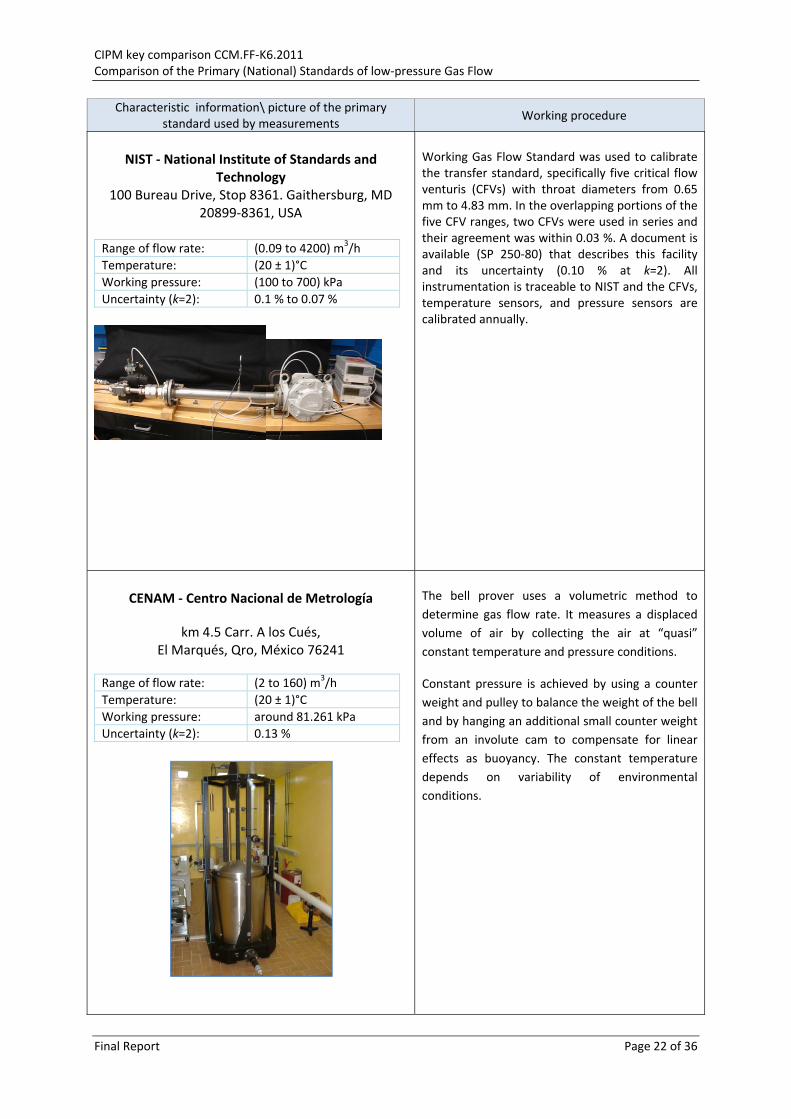
NIST ‐ National Institute of Standards and
Technology 100 Bureau Drive, Stop 8361. Gaithersburg, MD
20899‐8361, USA
Range of flow rate: (0.09 to 4200) m3/h
Temperature: (20 ± 1)°C
Working pressure: (100 to 700) kPa
Uncertainty (k=2): 0.1 % to 0.07 %
Working Gas Flow Standard was used to calibrate the transfer standard, specifically five critical flow venturis (CFVs) with throat diameters from 0.65 mm to 4.83 mm. In the overlapping portions of the five CFV ranges, two CFVs were used in series and their agreement was within 0.03 %. A document is available (SP 250‐80) that describes this facility and its uncertainty (0.10 % at k=2). All instrumentation is traceable to NIST and the CFVs, temperature sensors, and pressure sensors are calibrated annually.
CENAM ‐ Centro Nacional de Metrología
km 4.5 Carr. A los Cués, El Marqués, Qro, México 76241
Range of flow rate: (2 to 160) m3/h
Temperature: (20 ± 1)°C
Working pressure: around 81.261 kPa
Uncertainty (k=2): 0.13 %
The bell prover uses a volumetric method to
determine gas flow rate. It measures a displaced
volume of air by collecting the air at “quasi”
constant temperature and pressure conditions.
Constant pressure is achieved by using a counter
weight and pulley to balance the weight of the bell
and by hanging an additional small counter weight
from an involute cam to compensate for linear
effects as buoyancy. The constant temperature
depends on variability of environmental
conditions.
CIPM key comparison CCM.FF‐K6.2011 Comparison of the Primary (National) Standards of low‐pressure Gas Flow
Final Report Page 23 of 36
Characteristic information\ picture of the primary standard used by measurements
Working procedure
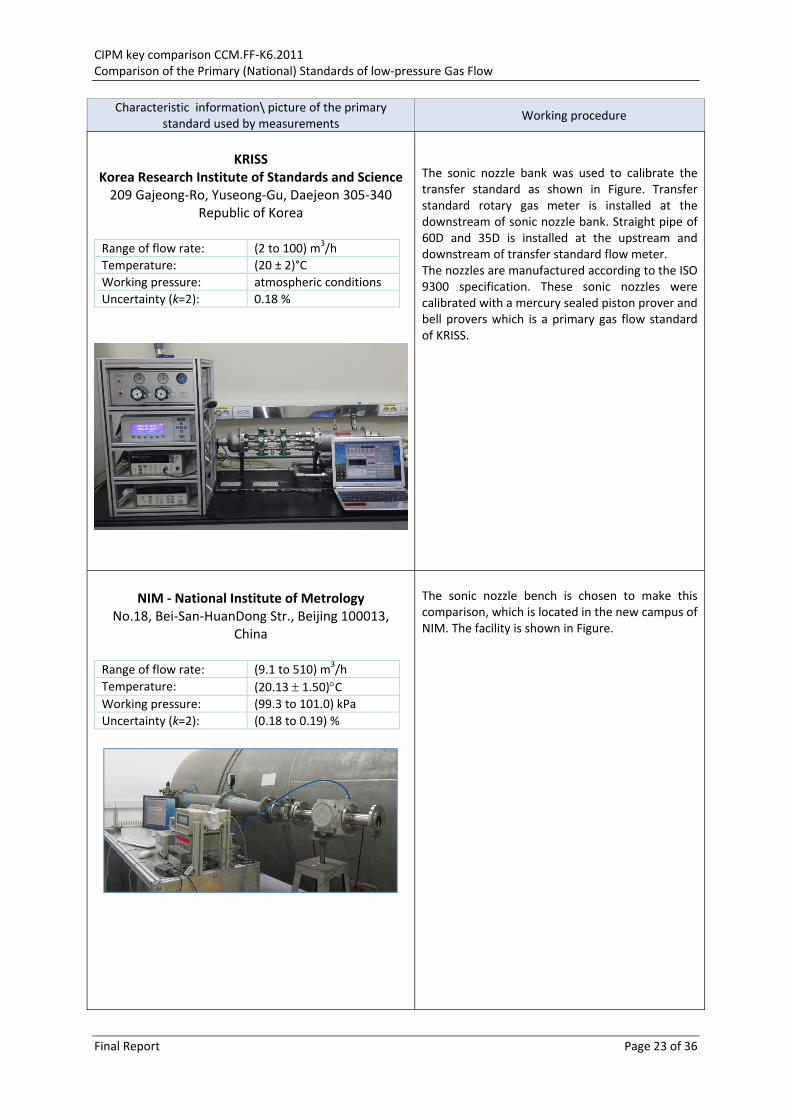
KRISS
Korea Research Institute of Standards and Science 209 Gajeong‐Ro, Yuseong‐Gu, Daejeon 305‐340
Republic of Korea Range of flow rate: (2 to 100) m3/h
Temperature: (20 ± 2)°C
Working pressure: atmospheric conditions
Uncertainty (k=2): 0.18 %
The sonic nozzle bank was used to calibrate the transfer standard as shown in Figure. Transfer standard rotary gas meter is installed at the downstream of sonic nozzle bank. Straight pipe of 60D and 35D is installed at the upstream and downstream of transfer standard flow meter. The nozzles are manufactured according to the ISO 9300 specification. These sonic nozzles were calibrated with a mercury sealed piston prover and bell provers which is a primary gas flow standard of KRISS.
NIM ‐ National Institute of Metrology
No.18, Bei‐San‐HuanDong Str., Beijing 100013, China
Range of flow rate: (9.1 to 510) m3/h
Temperature: (20.13 1.50)C Working pressure: (99.3 to 101.0) kPa
Uncertainty (k=2): (0.18 to 0.19) %
The sonic nozzle bench is chosen to make this comparison, which is located in the new campus of NIM. The facility is shown in Figure.
CIPM key comparison CCM.FF‐K6.2011 Comparison of the Primary (National) Standards of low‐pressure Gas Flow
Final Report Page 24 of 36
Characteristic information\ picture of the primary standard used by measurements
Working procedure
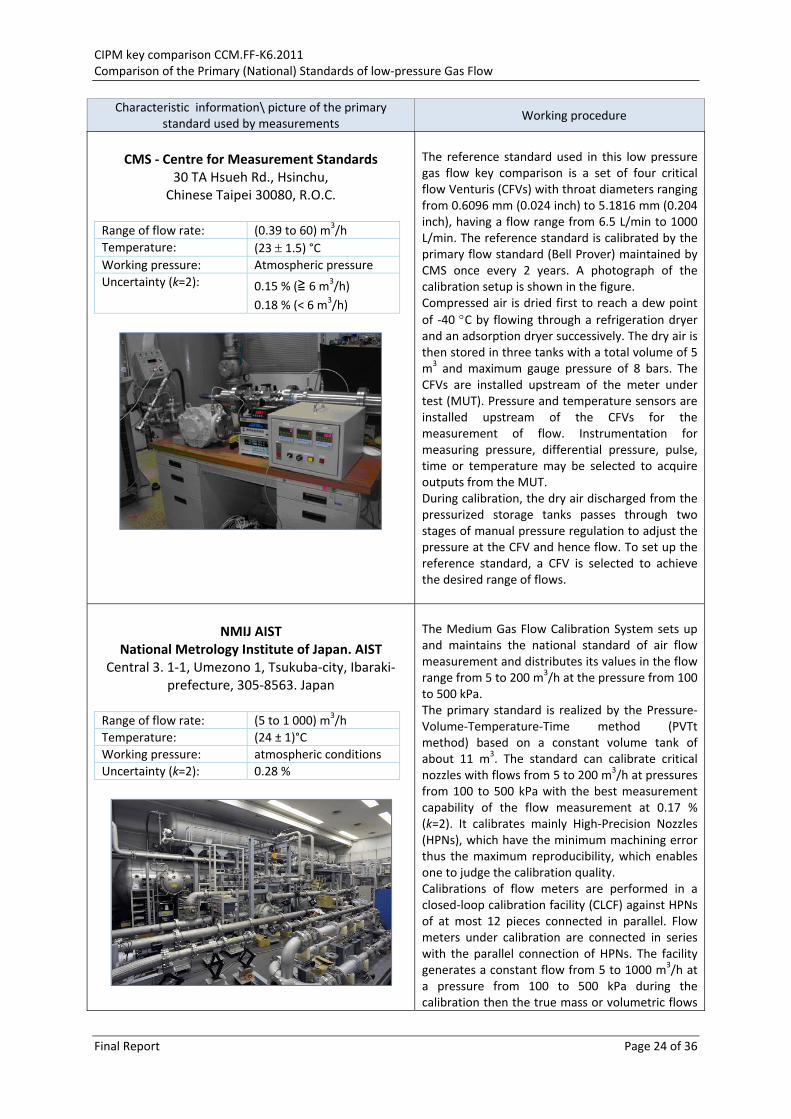
CMS ‐ Centre for Measurement Standards
30 TA Hsueh Rd., Hsinchu, Chinese Taipei 30080, R.O.C.
Range of flow rate: (0.39 to 60) m3/h
Temperature: (23 1.5) °C Working pressure: Atmospheric pressure
Uncertainty (k=2): 0.15 % (≧ 6 m3/h)
0.18 % (< 6 m3/h)
The reference standard used in this low pressure gas flow key comparison is a set of four critical flow Venturis (CFVs) with throat diameters ranging from 0.6096 mm (0.024 inch) to 5.1816 mm (0.204 inch), having a flow range from 6.5 L/min to 1000 L/min. The reference standard is calibrated by the primary flow standard (Bell Prover) maintained by CMS once every 2 years. A photograph of the calibration setup is shown in the figure. Compressed air is dried first to reach a dew point
of ‐40 C by flowing through a refrigeration dryer and an adsorption dryer successively. The dry air is then stored in three tanks with a total volume of 5 m3 and maximum gauge pressure of 8 bars. The CFVs are installed upstream of the meter under test (MUT). Pressure and temperature sensors are installed upstream of the CFVs for the measurement of flow. Instrumentation for measuring pressure, differential pressure, pulse, time or temperature may be selected to acquire outputs from the MUT. During calibration, the dry air discharged from the pressurized storage tanks passes through two stages of manual pressure regulation to adjust the pressure at the CFV and hence flow. To set up the reference standard, a CFV is selected to achieve the desired range of flows.
NMIJ AIST
National Metrology Institute of Japan. AIST Central 3. 1‐1, Umezono 1, Tsukuba‐city, Ibaraki‐
prefecture, 305‐8563. Japan Range of flow rate: (5 to 1 000) m3/h
Temperature: (24 ± 1)°C
Working pressure: atmospheric conditions
Uncertainty (k=2): 0.28 %
The Medium Gas Flow Calibration System sets up and maintains the national standard of air flow measurement and distributes its values in the flow range from 5 to 200 m3/h at the pressure from 100 to 500 kPa. The primary standard is realized by the Pressure‐Volume‐Temperature‐Time method (PVTt method) based on a constant volume tank of about 11 m3. The standard can calibrate critical nozzles with flows from 5 to 200 m3/h at pressures from 100 to 500 kPa with the best measurement capability of the flow measurement at 0.17 % (k=2). It calibrates mainly High‐Precision Nozzles (HPNs), which have the minimum machining error thus the maximum reproducibility, which enables one to judge the calibration quality. Calibrations of flow meters are performed in a closed‐loop calibration facility (CLCF) against HPNs of at most 12 pieces connected in parallel. Flow meters under calibration are connected in series with the parallel connection of HPNs. The facility generates a constant flow from 5 to 1000 m3/h at a pressure from 100 to 500 kPa during the calibration then the true mass or volumetric flows
CIPM key comparison CCM.FF‐K6.2011 Comparison of the Primary (National) Standards of low‐pressure Gas Flow
Final Report Page 25 of 36
Characteristic information\ picture of the primary standard used by measurements
Working procedure
of flow meters are calculated from the mass flow conservation through the facility. The facility has three blower compressors, each of which can generate 100 kPa pressure increase at any pressure, thus the facility can have a pressure increase up to 300 kPa, which can put the HPNs in the critical condition. The best measurement capability of a flow meter calibration is estimated at 0.28 % (k=2).
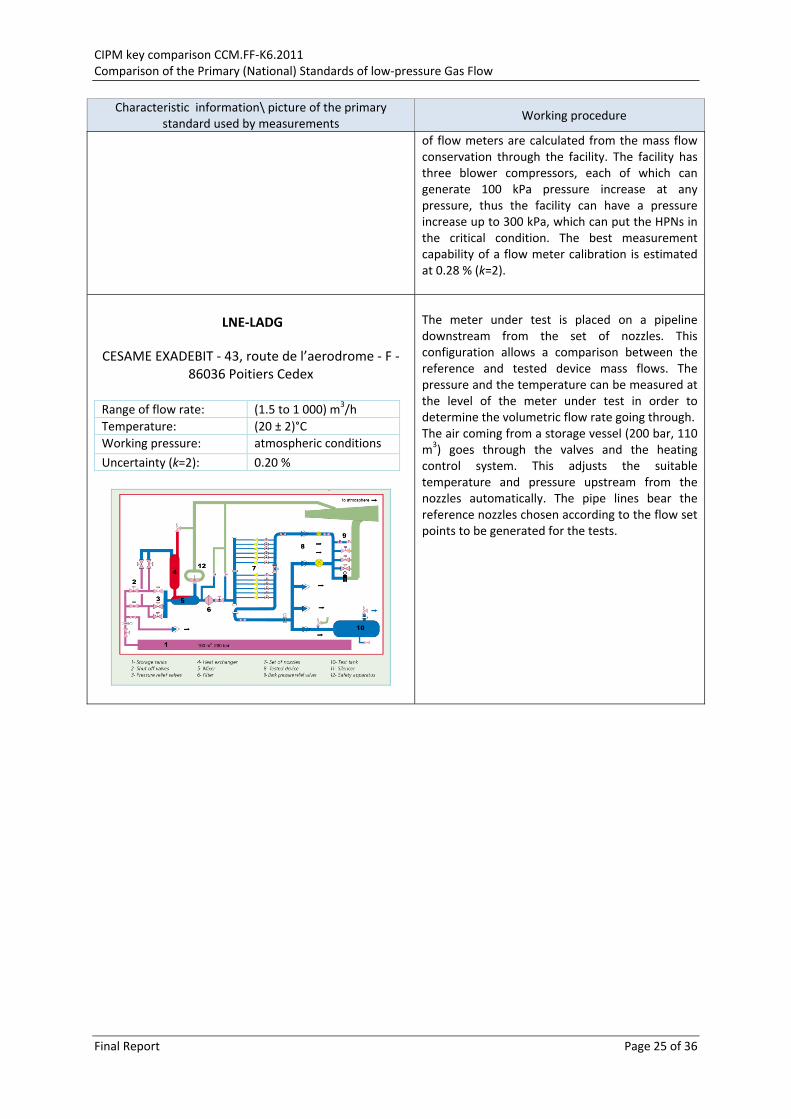
LNE‐LADG
CESAME EXADEBIT ‐ 43, route de l’aerodrome ‐ F ‐ 86036 Poitiers Cedex
Range of flow rate: (1.5 to 1 000) m3/h
Temperature: (20 ± 2)°C
Working pressure: atmospheric conditions
Uncertainty (k=2): 0.20 %
The meter under test is placed on a pipeline downstream from the set of nozzles. This configuration allows a comparison between the reference and tested device mass flows. The pressure and the temperature can be measured at the level of the meter under test in order to determine the volumetric flow rate going through. The air coming from a storage vessel (200 bar, 110 m3) goes through the valves and the heating control system. This adjusts the suitable temperature and pressure upstream from the nozzles automatically. The pipe lines bear the reference nozzles chosen according to the flow set points to be generated for the tests.
CIPM key comparison CCM.FF‐K6.2011 Comparison of the Primary (National) Standards of low‐pressure Gas Flow
Final Report Page 26 of 36
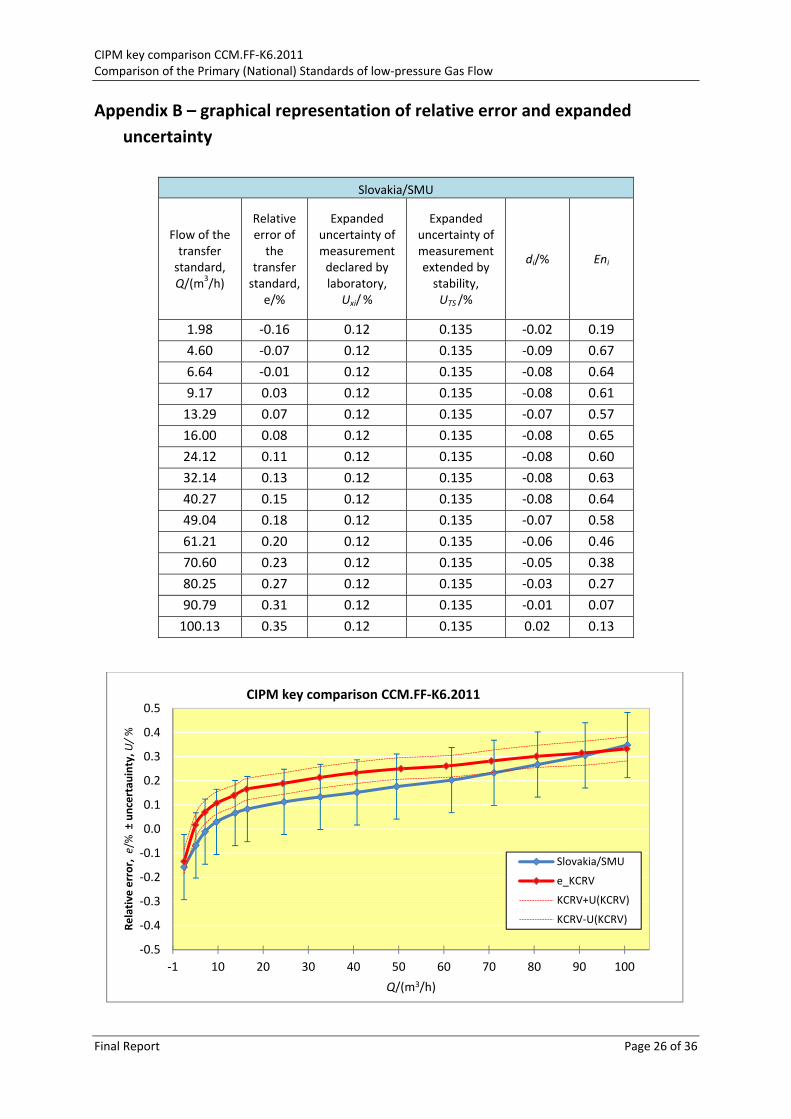
Appendix B – graphical representation of relative error and expanded
uncertainty
Slovakia/SMU
Flow of the transfer standard, Q/(m3/h)
Relative error of the
transfer standard,
e/%
Expanded uncertainty of measurement declared by laboratory,
Uxi/ %
Expanded uncertainty of measurement extended by stability, UTS /%
di/% Eni
1.98 ‐0.16 0.12 0.135 ‐0.02 0.19
4.60 ‐0.07 0.12 0.135 ‐0.09 0.67
6.64 ‐0.01 0.12 0.135 ‐0.08 0.64
9.17 0.03 0.12 0.135 ‐0.08 0.61
13.29 0.07 0.12 0.135 ‐0.07 0.57
16.00 0.08 0.12 0.135 ‐0.08 0.65
24.12 0.11 0.12 0.135 ‐0.08 0.60
32.14 0.13 0.12 0.135 ‐0.08 0.63
40.27 0.15 0.12 0.135 ‐0.08 0.64
49.04 0.18 0.12 0.135 ‐0.07 0.58
61.21 0.20 0.12 0.135 ‐0.06 0.46
70.60 0.23 0.12 0.135 ‐0.05 0.38
80.25 0.27 0.12 0.135 ‐0.03 0.27
90.79 0.31 0.12 0.135 ‐0.01 0.07
100.13 0.35 0.12 0.135 0.02 0.13
‐0.5
‐0.4
‐0.3
‐0.2
‐0.1
0.0
0.1
0.2
0.3
0.4
0.5
‐1 10 20 30 40 50 60 70 80 90 100
Relative
error,
e/%
±uncertau
inty,U
/%
Q/(m3/h)
Slovakia/SMU
e_KCRV
KCRV+U(KCRV)
KCRV‐U(KCRV)
CIPM key comparison CCM.FF‐K6.2011
CIPM key comparison CCM.FF‐K6.2011 Comparison of the Primary (National) Standards of low‐pressure Gas Flow
Final Report Page 27 of 36
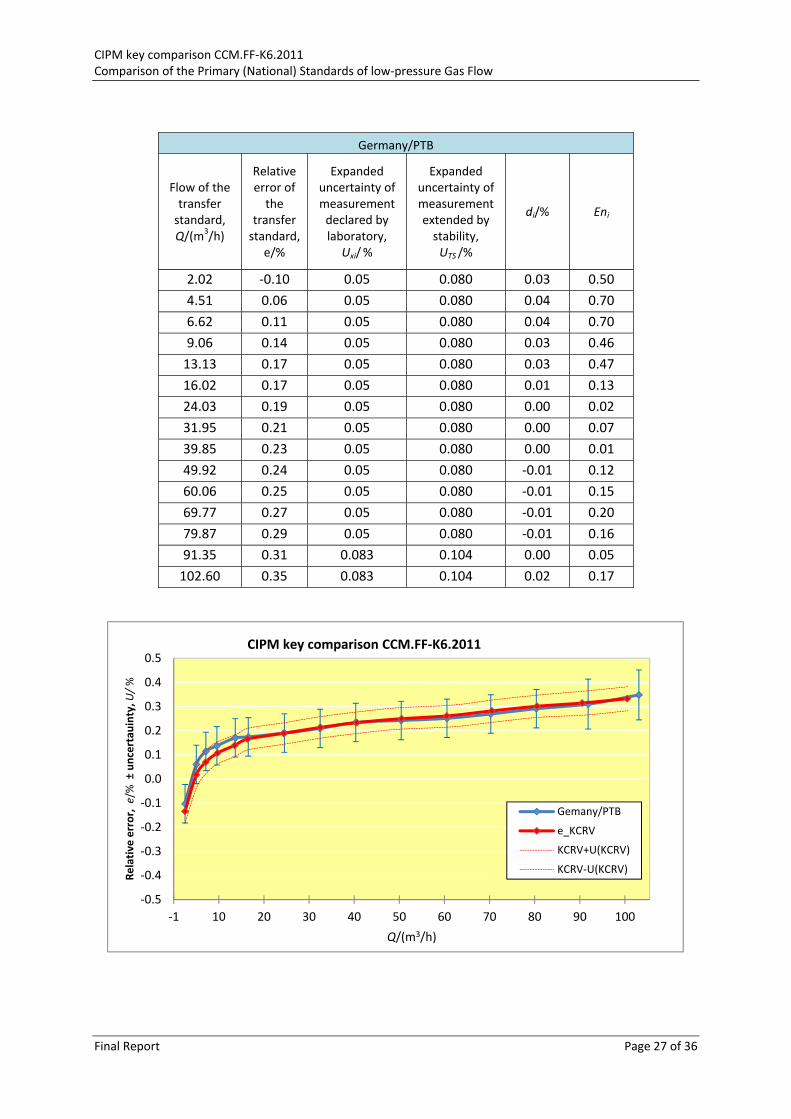
Germany/PTB
Flow of the transfer standard, Q/(m3/h)
Relative error of the
transfer standard,
e/%
Expanded uncertainty of measurement declared by laboratory,
Uxi/ %
Expanded uncertainty of measurement extended by stability, UTS /%
di/% Eni
2.02 ‐0.10 0.05 0.080 0.03 0.50
4.51 0.06 0.05 0.080 0.04 0.70
6.62 0.11 0.05 0.080 0.04 0.70
9.06 0.14 0.05 0.080 0.03 0.46
13.13 0.17 0.05 0.080 0.03 0.47
16.02 0.17 0.05 0.080 0.01 0.13
24.03 0.19 0.05 0.080 0.00 0.02
31.95 0.21 0.05 0.080 0.00 0.07
39.85 0.23 0.05 0.080 0.00 0.01
49.92 0.24 0.05 0.080 ‐0.01 0.12
60.06 0.25 0.05 0.080 ‐0.01 0.15
69.77 0.27 0.05 0.080 ‐0.01 0.20
79.87 0.29 0.05 0.080 ‐0.01 0.16
91.35 0.31 0.083 0.104 0.00 0.05
102.60 0.35 0.083 0.104 0.02 0.17
‐0.5
‐0.4
‐0.3
‐0.2
‐0.1
0.0
0.1
0.2
0.3
0.4
0.5
‐1 10 20 30 40 50 60 70 80 90 100
Relative
error,
e/%
±uncertau
inty,U
/%
Q/(m3/h)
Gemany/PTB
e_KCRV
KCRV+U(KCRV)
KCRV‐U(KCRV)
CIPM key comparison CCM.FF‐K6.2011
CIPM key comparison CCM.FF‐K6.2011 Comparison of the Primary (National) Standards of low‐pressure Gas Flow
Final Report Page 28 of 36
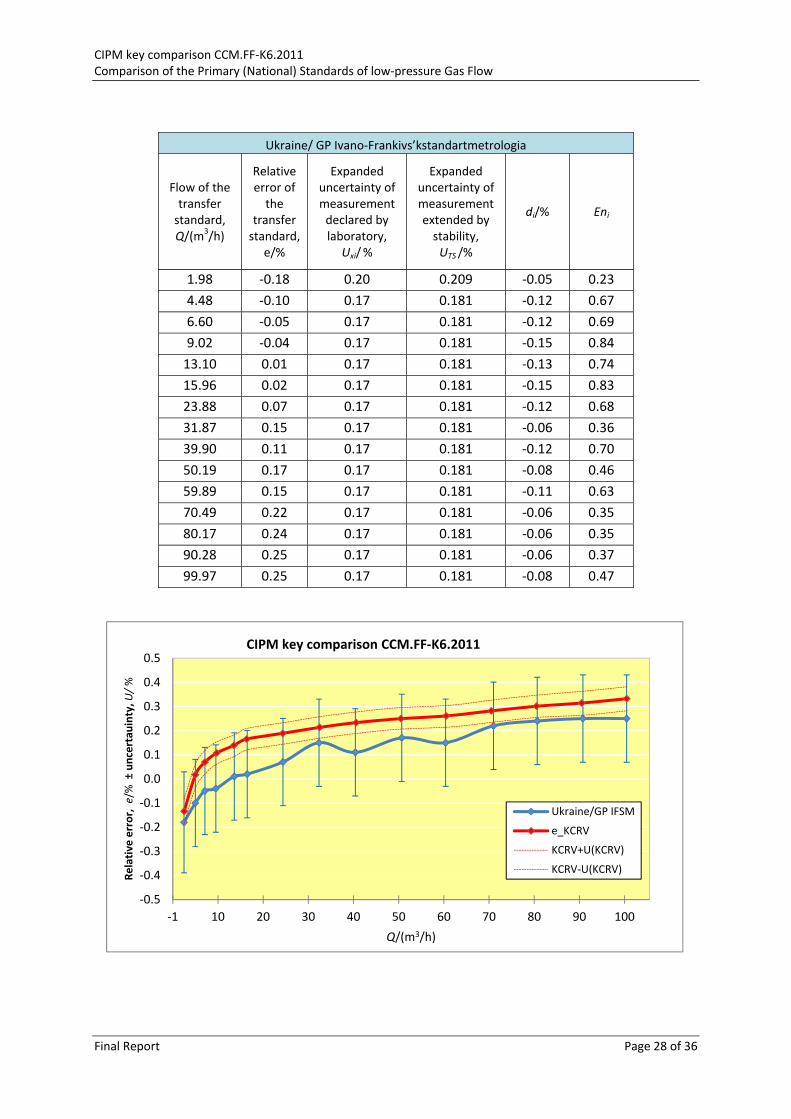
Ukraine/ GP Ivano‐Frankivs’kstandartmetrologia
Flow of the transfer standard, Q/(m3/h)
Relative error of the
transfer standard,
e/%
Expanded uncertainty of measurement declared by laboratory,
Uxi/ %
Expanded uncertainty of measurement extended by stability, UTS /%
di/% Eni
1.98 ‐0.18 0.20 0.209 ‐0.05 0.23
4.48 ‐0.10 0.17 0.181 ‐0.12 0.67
6.60 ‐0.05 0.17 0.181 ‐0.12 0.69
9.02 ‐0.04 0.17 0.181 ‐0.15 0.84
13.10 0.01 0.17 0.181 ‐0.13 0.74
15.96 0.02 0.17 0.181 ‐0.15 0.83
23.88 0.07 0.17 0.181 ‐0.12 0.68
31.87 0.15 0.17 0.181 ‐0.06 0.36
39.90 0.11 0.17 0.181 ‐0.12 0.70
50.19 0.17 0.17 0.181 ‐0.08 0.46
59.89 0.15 0.17 0.181 ‐0.11 0.63
70.49 0.22 0.17 0.181 ‐0.06 0.35
80.17 0.24 0.17 0.181 ‐0.06 0.35
90.28 0.25 0.17 0.181 ‐0.06 0.37
99.97 0.25 0.17 0.181 ‐0.08 0.47
‐0.5
‐0.4
‐0.3
‐0.2
‐0.1
0.0
0.1
0.2
0.3
0.4
0.5
‐1 10 20 30 40 50 60 70 80 90 100
Relative
error,
e/%
±uncertau
inty,U
/%
Q/(m3/h)
Ukraine/GP IFSM
e_KCRV
KCRV+U(KCRV)
KCRV‐U(KCRV)
CIPM key comparison CCM.FF‐K6.2011
CIPM key comparison CCM.FF‐K6.2011 Comparison of the Primary (National) Standards of low‐pressure Gas Flow
Final Report Page 29 of 36
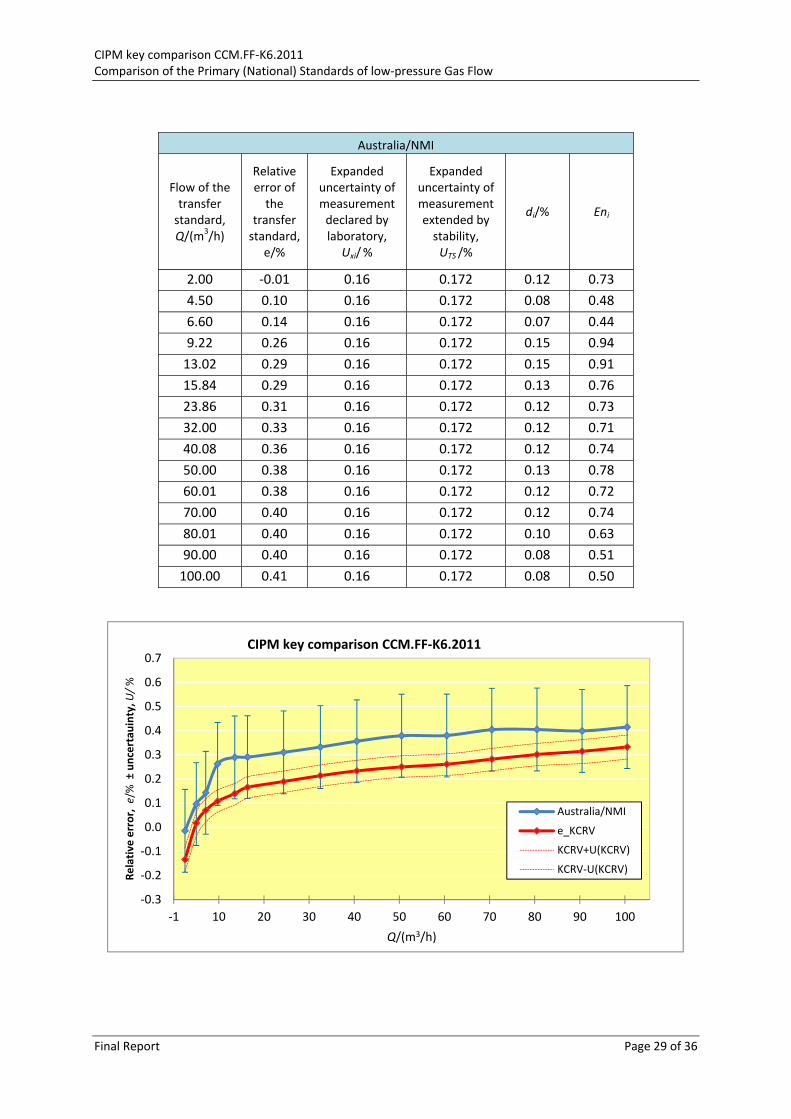
Australia/NMI
Flow of the transfer standard, Q/(m3/h)
Relative error of the
transfer standard,
e/%
Expanded uncertainty of measurement declared by laboratory,
Uxi/ %
Expanded uncertainty of measurement extended by stability, UTS /%
di/% Eni
2.00 ‐0.01 0.16 0.172 0.12 0.73
4.50 0.10 0.16 0.172 0.08 0.48
6.60 0.14 0.16 0.172 0.07 0.44
9.22 0.26 0.16 0.172 0.15 0.94
13.02 0.29 0.16 0.172 0.15 0.91
15.84 0.29 0.16 0.172 0.13 0.76
23.86 0.31 0.16 0.172 0.12 0.73
32.00 0.33 0.16 0.172 0.12 0.71
40.08 0.36 0.16 0.172 0.12 0.74
50.00 0.38 0.16 0.172 0.13 0.78
60.01 0.38 0.16 0.172 0.12 0.72
70.00 0.40 0.16 0.172 0.12 0.74
80.01 0.40 0.16 0.172 0.10 0.63
90.00 0.40 0.16 0.172 0.08 0.51
100.00 0.41 0.16 0.172 0.08 0.50
‐0.3
‐0.2
‐0.1
0.0
0.1
0.2
0.3
0.4
0.5
0.6
0.7
‐1 10 20 30 40 50 60 70 80 90 100
Relative
error,
e/%
±uncertau
inty,U
/%
Q/(m3/h)
Australia/NMI
e_KCRV
KCRV+U(KCRV)
KCRV‐U(KCRV)
CIPM key comparison CCM.FF‐K6.2011
CIPM key comparison CCM.FF‐K6.2011 Comparison of the Primary (National) Standards of low‐pressure Gas Flow
Final Report Page 30 of 36
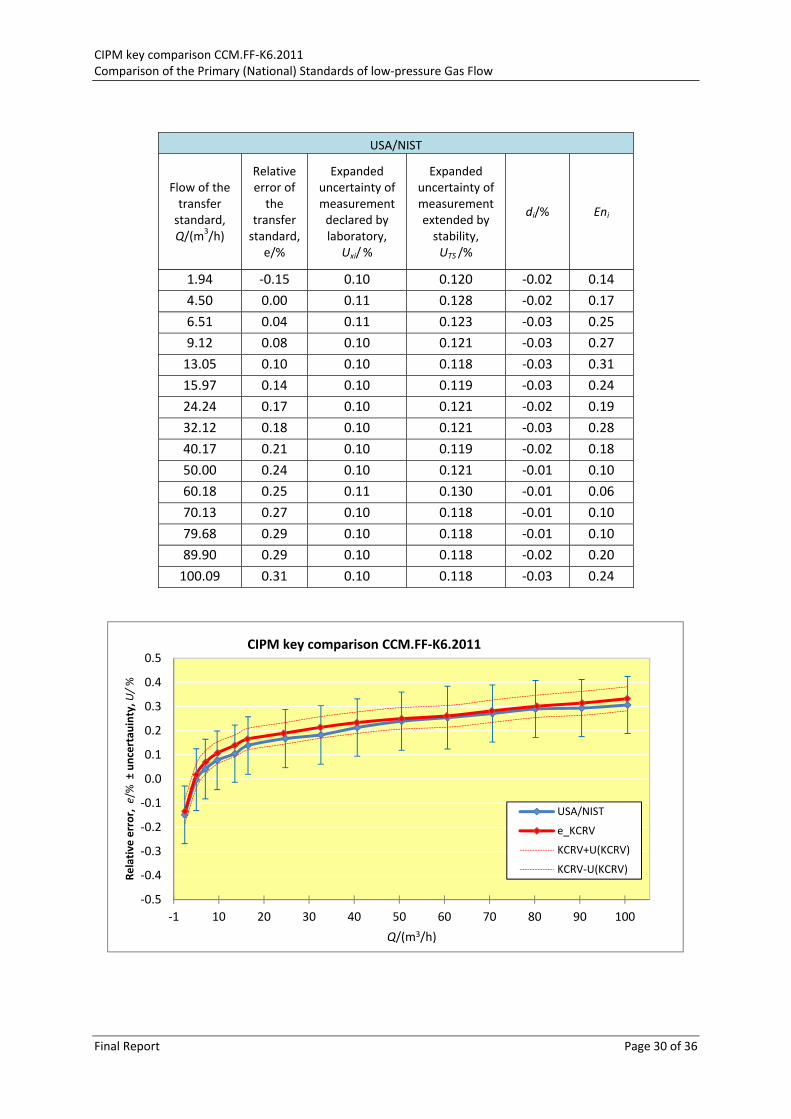
USA/NIST
Flow of the transfer standard, Q/(m3/h)
Relative error of the
transfer standard,
e/%
Expanded uncertainty of measurement declared by laboratory,
Uxi/ %
Expanded uncertainty of measurement extended by stability, UTS /%
di/% Eni
1.94 ‐0.15 0.10 0.120 ‐0.02 0.14
4.50 0.00 0.11 0.128 ‐0.02 0.17
6.51 0.04 0.11 0.123 ‐0.03 0.25
9.12 0.08 0.10 0.121 ‐0.03 0.27
13.05 0.10 0.10 0.118 ‐0.03 0.31
15.97 0.14 0.10 0.119 ‐0.03 0.24
24.24 0.17 0.10 0.121 ‐0.02 0.19
32.12 0.18 0.10 0.121 ‐0.03 0.28
40.17 0.21 0.10 0.119 ‐0.02 0.18
50.00 0.24 0.10 0.121 ‐0.01 0.10
60.18 0.25 0.11 0.130 ‐0.01 0.06
70.13 0.27 0.10 0.118 ‐0.01 0.10
79.68 0.29 0.10 0.118 ‐0.01 0.10
89.90 0.29 0.10 0.118 ‐0.02 0.20
100.09 0.31 0.10 0.118 ‐0.03 0.24
‐0.5
‐0.4
‐0.3
‐0.2
‐0.1
0.0
0.1
0.2
0.3
0.4
0.5
‐1 10 20 30 40 50 60 70 80 90 100
Relative
error,
e/%
±uncertau
inty,U
/%
Q/(m3/h)
USA/NIST
e_KCRV
KCRV+U(KCRV)
KCRV‐U(KCRV)
CIPM key comparison CCM.FF‐K6.2011
CIPM key comparison CCM.FF‐K6.2011 Comparison of the Primary (National) Standards of low‐pressure Gas Flow
Final Report Page 31 of 36
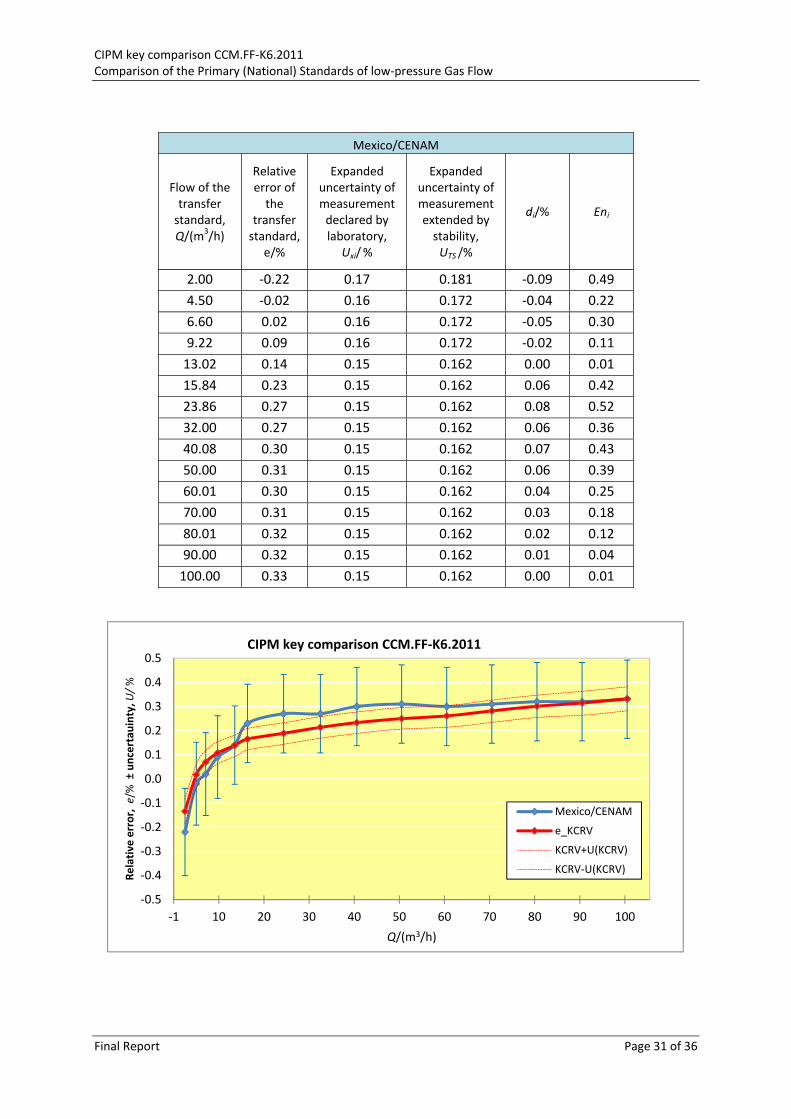
Mexico/CENAM
Flow of the transfer standard, Q/(m3/h)
Relative error of the
transfer standard,
e/%
Expanded uncertainty of measurement declared by laboratory,
Uxi/ %
Expanded uncertainty of measurement extended by stability, UTS /%
di/% Eni
2.00 ‐0.22 0.17 0.181 ‐0.09 0.49
4.50 ‐0.02 0.16 0.172 ‐0.04 0.22
6.60 0.02 0.16 0.172 ‐0.05 0.30
9.22 0.09 0.16 0.172 ‐0.02 0.11
13.02 0.14 0.15 0.162 0.00 0.01
15.84 0.23 0.15 0.162 0.06 0.42
23.86 0.27 0.15 0.162 0.08 0.52
32.00 0.27 0.15 0.162 0.06 0.36
40.08 0.30 0.15 0.162 0.07 0.43
50.00 0.31 0.15 0.162 0.06 0.39
60.01 0.30 0.15 0.162 0.04 0.25
70.00 0.31 0.15 0.162 0.03 0.18
80.01 0.32 0.15 0.162 0.02 0.12
90.00 0.32 0.15 0.162 0.01 0.04
100.00 0.33 0.15 0.162 0.00 0.01
‐0.5
‐0.4
‐0.3
‐0.2
‐0.1
0.0
0.1
0.2
0.3
0.4
0.5
‐1 10 20 30 40 50 60 70 80 90 100
Relative
error,
e/%
±uncertau
inty,U
/%
Q/(m3/h)
Mexico/CENAM
e_KCRV
KCRV+U(KCRV)
KCRV‐U(KCRV)
CIPM key comparison CCM.FF‐K6.2011
CIPM key comparison CCM.FF‐K6.2011 Comparison of the Primary (National) Standards of low‐pressure Gas Flow
Final Report Page 32 of 36
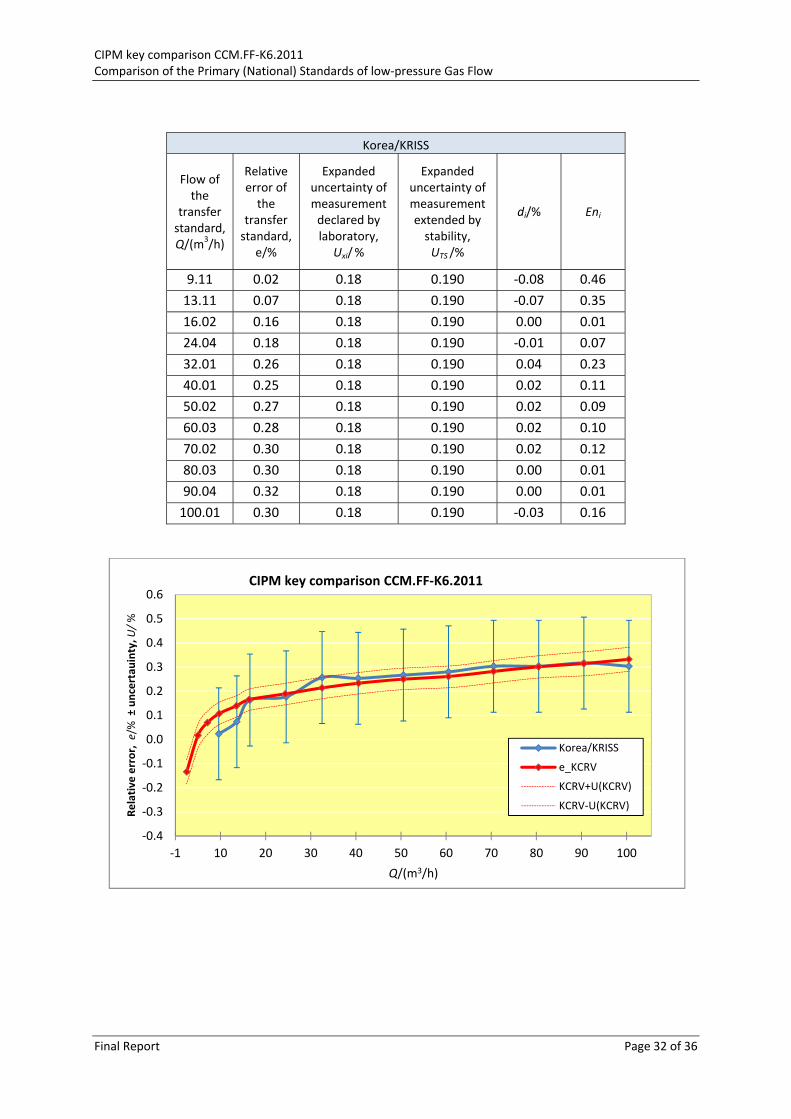
Korea/KRISS
Flow of the
transfer standard, Q/(m3/h)
Relative error of the
transfer standard,
e/%
Expanded uncertainty of measurement declared by laboratory,
Uxi/ %
Expanded uncertainty of measurement extended by stability, UTS /%
di/% Eni
9.11 0.02 0.18 0.190 ‐0.08 0.46
13.11 0.07 0.18 0.190 ‐0.07 0.35
16.02 0.16 0.18 0.190 0.00 0.01
24.04 0.18 0.18 0.190 ‐0.01 0.07
32.01 0.26 0.18 0.190 0.04 0.23
40.01 0.25 0.18 0.190 0.02 0.11
50.02 0.27 0.18 0.190 0.02 0.09
60.03 0.28 0.18 0.190 0.02 0.10
70.02 0.30 0.18 0.190 0.02 0.12
80.03 0.30 0.18 0.190 0.00 0.01
90.04 0.32 0.18 0.190 0.00 0.01
100.01 0.30 0.18 0.190 ‐0.03 0.16
‐0.4
‐0.3
‐0.2
‐0.1
0.0
0.1
0.2
0.3
0.4
0.5
0.6
‐1 10 20 30 40 50 60 70 80 90 100
Relative
error,
e/%
±uncertau
inty,U
/%
Q/(m3/h)
Korea/KRISS
e_KCRV
KCRV+U(KCRV)
KCRV‐U(KCRV)
CIPM key comparison CCM.FF‐K6.2011
CIPM key comparison CCM.FF‐K6.2011 Comparison of the Primary (National) Standards of low‐pressure Gas Flow
Final Report Page 33 of 36
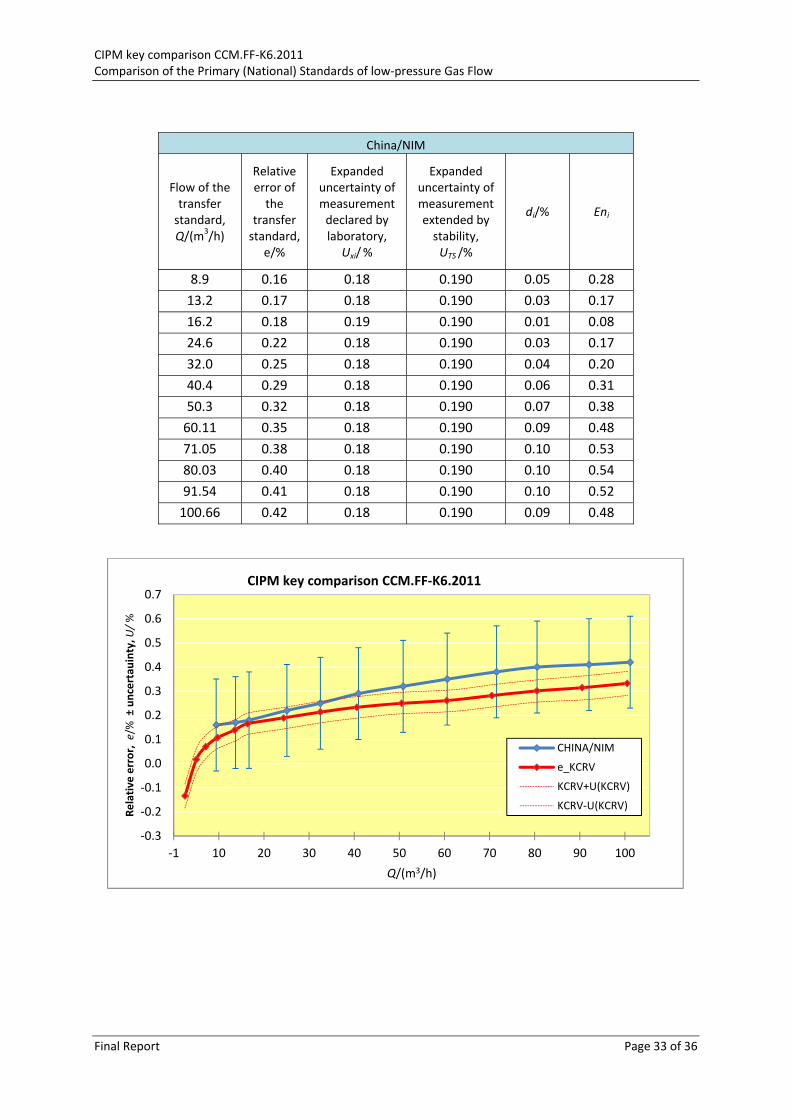
China/NIM
Flow of the transfer standard, Q/(m3/h)
Relative error of the
transfer standard,
e/%
Expanded uncertainty of measurement declared by laboratory,
Uxi/ %
Expanded uncertainty of measurement extended by stability, UTS /%
di/% Eni
8.9 0.16 0.18 0.190 0.05 0.28
13.2 0.17 0.18 0.190 0.03 0.17
16.2 0.18 0.19 0.190 0.01 0.08
24.6 0.22 0.18 0.190 0.03 0.17
32.0 0.25 0.18 0.190 0.04 0.20
40.4 0.29 0.18 0.190 0.06 0.31
50.3 0.32 0.18 0.190 0.07 0.38
60.11 0.35 0.18 0.190 0.09 0.48
71.05 0.38 0.18 0.190 0.10 0.53
80.03 0.40 0.18 0.190 0.10 0.54
91.54 0.41 0.18 0.190 0.10 0.52
100.66 0.42 0.18 0.190 0.09 0.48
‐0.3
‐0.2
‐0.1
0.0
0.1
0.2
0.3
0.4
0.5
0.6
0.7
‐1 10 20 30 40 50 60 70 80 90 100
Relative
error,
e/%
±uncertau
inty,U
/%
Q/(m3/h)
CHINA/NIM
e_KCRV
KCRV+U(KCRV)
KCRV‐U(KCRV)
CIPM key comparison CCM.FF‐K6.2011
CIPM key comparison CCM.FF‐K6.2011 Comparison of the Primary (National) Standards of low‐pressure Gas Flow
Final Report Page 34 of 36
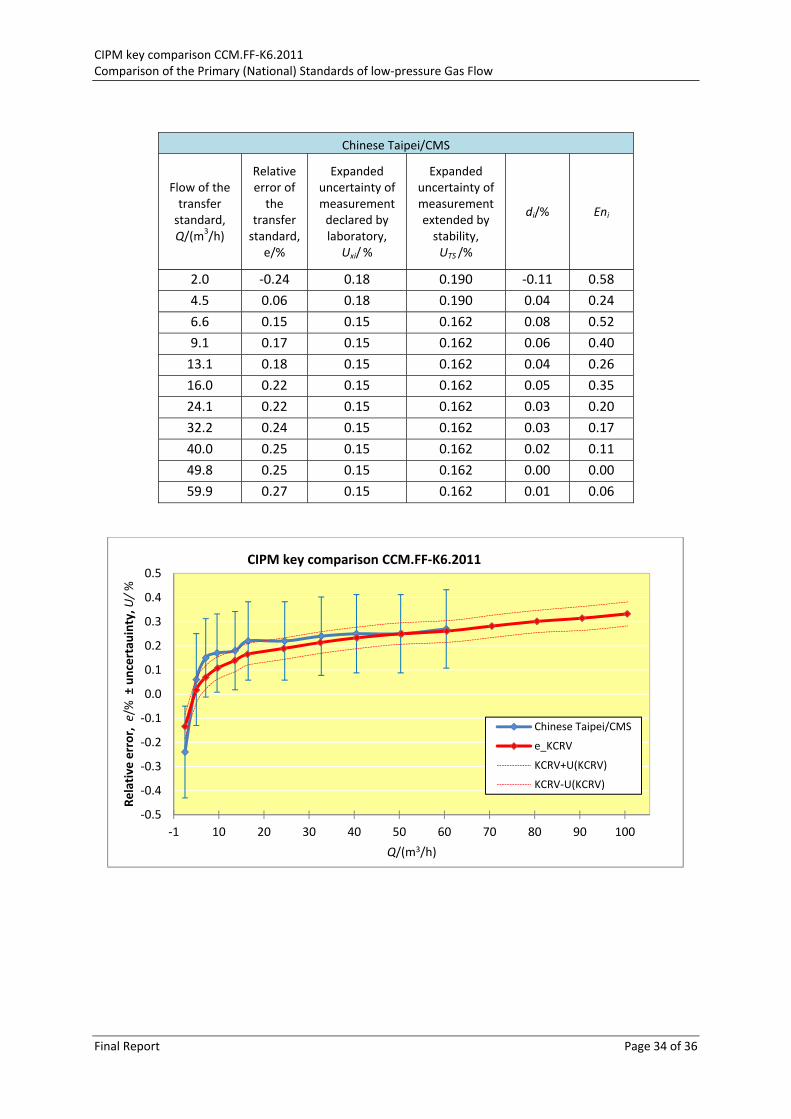
Chinese Taipei/CMS
Flow of the transfer standard, Q/(m3/h)
Relative error of the
transfer standard,
e/%
Expanded uncertainty of measurement declared by laboratory,
Uxi/ %
Expanded uncertainty of measurement extended by stability, UTS /%
di/% Eni
2.0 ‐0.24 0.18 0.190 ‐0.11 0.58
4.5 0.06 0.18 0.190 0.04 0.24
6.6 0.15 0.15 0.162 0.08 0.52
9.1 0.17 0.15 0.162 0.06 0.40
13.1 0.18 0.15 0.162 0.04 0.26
16.0 0.22 0.15 0.162 0.05 0.35
24.1 0.22 0.15 0.162 0.03 0.20
32.2 0.24 0.15 0.162 0.03 0.17
40.0 0.25 0.15 0.162 0.02 0.11
49.8 0.25 0.15 0.162 0.00 0.00
59.9 0.27 0.15 0.162 0.01 0.06
‐0.5
‐0.4
‐0.3
‐0.2
‐0.1
0.0
0.1
0.2
0.3
0.4
0.5
‐1 10 20 30 40 50 60 70 80 90 100
Relative error,
e/%
±uncertau
inty,U
/%
Q/(m3/h)
Chinese Taipei/CMS
e_KCRV
KCRV+U(KCRV)
KCRV‐U(KCRV)
CIPM key comparison CCM.FF‐K6.2011
CIPM key comparison CCM.FF‐K6.2011 Comparison of the Primary (National) Standards of low‐pressure Gas Flow
Final Report Page 35 of 36
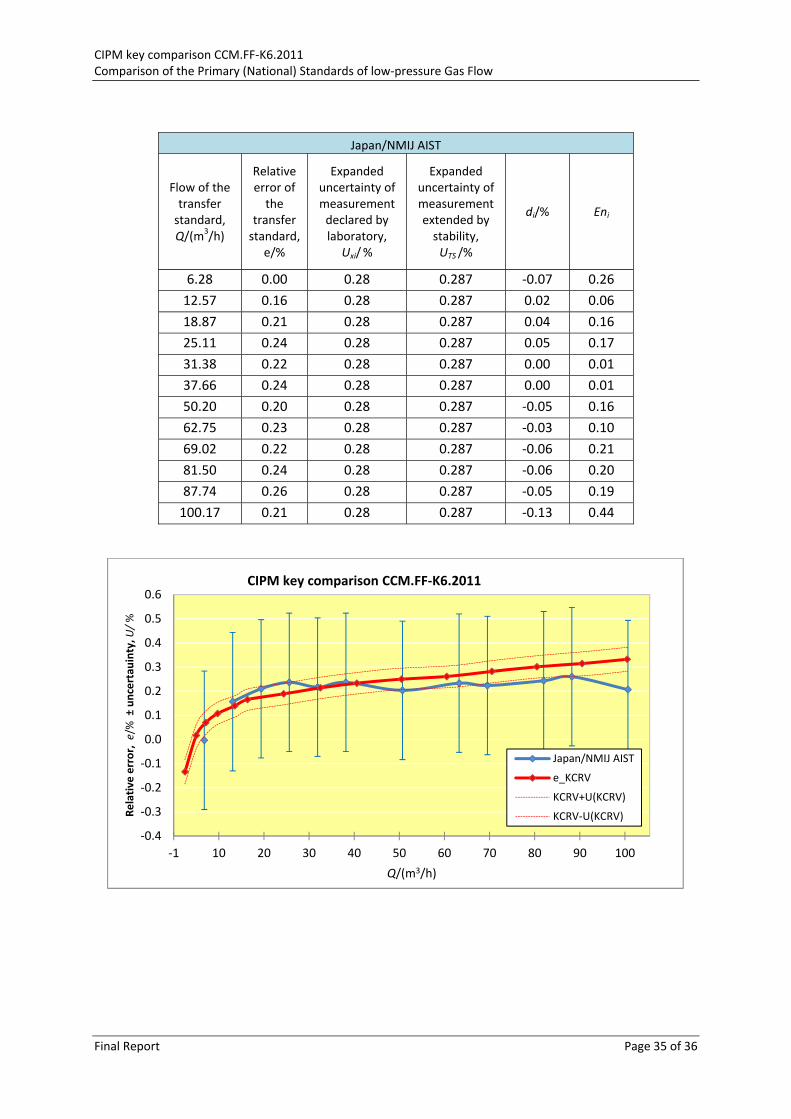
Japan/NMIJ AIST
Flow of the transfer standard, Q/(m3/h)
Relative error of the
transfer standard,
e/%
Expanded uncertainty of measurement declared by laboratory,
Uxi/ %
Expanded uncertainty of measurement extended by stability, UTS /%
di/% Eni
6.28 0.00 0.28 0.287 ‐0.07 0.26
12.57 0.16 0.28 0.287 0.02 0.06
18.87 0.21 0.28 0.287 0.04 0.16
25.11 0.24 0.28 0.287 0.05 0.17
31.38 0.22 0.28 0.287 0.00 0.01
37.66 0.24 0.28 0.287 0.00 0.01
50.20 0.20 0.28 0.287 ‐0.05 0.16
62.75 0.23 0.28 0.287 ‐0.03 0.10
69.02 0.22 0.28 0.287 ‐0.06 0.21
81.50 0.24 0.28 0.287 ‐0.06 0.20
87.74 0.26 0.28 0.287 ‐0.05 0.19
100.17 0.21 0.28 0.287 ‐0.13 0.44
‐0.4
‐0.3
‐0.2
‐0.1
0.0
0.1
0.2
0.3
0.4
0.5
0.6
‐1 10 20 30 40 50 60 70 80 90 100
Relative
error,
e/%
±uncertau
inty,U
/%
Q/(m3/h)
Japan/NMIJ AIST
e_KCRV
KCRV+U(KCRV)
KCRV‐U(KCRV)
CIPM key comparison CCM.FF‐K6.2011
CIPM key comparison CCM.FF‐K6.2011 Comparison of the Primary (National) Standards of low‐pressure Gas Flow
Final Report Page 36 of 36
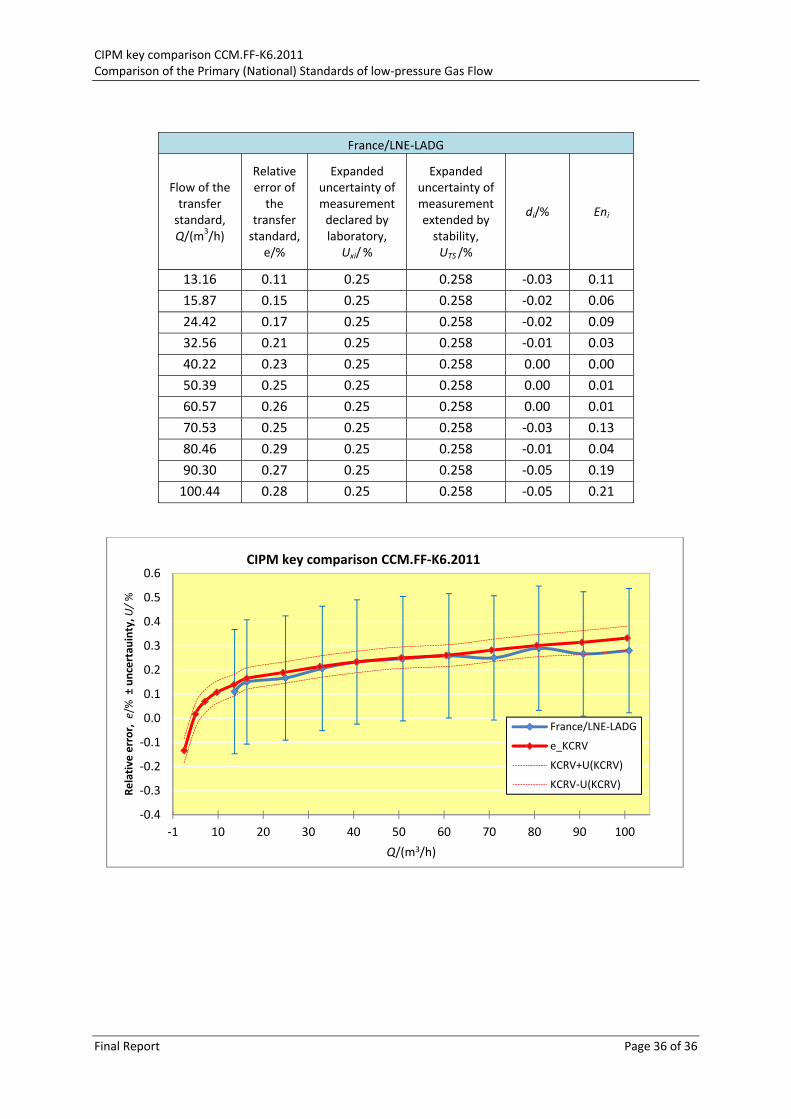
France/LNE‐LADG
Flow of the transfer standard, Q/(m3/h)
Relative error of the
transfer standard,
e/%
Expanded uncertainty of measurement declared by laboratory,
Uxi/ %
Expanded uncertainty of measurement extended by stability, UTS /%
di/% Eni
13.16 0.11 0.25 0.258 ‐0.03 0.11
15.87 0.15 0.25 0.258 ‐0.02 0.06
24.42 0.17 0.25 0.258 ‐0.02 0.09
32.56 0.21 0.25 0.258 ‐0.01 0.03
40.22 0.23 0.25 0.258 0.00 0.00
50.39 0.25 0.25 0.258 0.00 0.01
60.57 0.26 0.25 0.258 0.00 0.01
70.53 0.25 0.25 0.258 ‐0.03 0.13
80.46 0.29 0.25 0.258 ‐0.01 0.04
90.30 0.27 0.25 0.258 ‐0.05 0.19
100.44 0.28 0.25 0.258 ‐0.05 0.21
‐0.4
‐0.3
‐0.2
‐0.1
0.0
0.1
0.2
0.3
0.4
0.5
0.6
‐1 10 20 30 40 50 60 70 80 90 100
Relative
error,
e/%
±uncertau
inty,U
/%
Q/(m3/h)
France/LNE‐LADG
e_KCRV
KCRV+U(KCRV)
KCRV‐U(KCRV)
CIPM key comparison CCM.FF‐K6.2011


![Metrologia 52 (2015) Tech. Suppl. 06007 - BIPM - BIPMII)/BIPM.RI... · Metrologia 52 (2015) Tech. Suppl. 06007 2/33 (CIPM MRA) [2]. The comparison described in this report is known](https://img.pdfslide.us/doc/110x75/5c17775509d3f29c288b9854/metrologia-52-2015-tech-suppl-06007-bipm-iibipmri-metrologia-52.jpg)