Embed Size (px)
Citation preview
Author: Jennifer Allen, MPH, DC Dept. of Behavioral Health
12/1/2017
CRISIS INTERVENTION
OFFICER (CIO) ANNUAL TREND
REPORT (FY2014- FY2017)
Data captured from the PD251C submitted to DBH by MPD and other law enforcement agencies in the District of Columbia.

12/1/2017
1
CRISIS INTERVENTION OFFICER (CIO) ANNUAL TREND
REPORT (FY2014- FY2017) The information contained in this report summarizes data collected for the Crisis Intervention Officer (CIO) Program using the PD251C (MPD-CIO Tracking Form). The PD251C is to be completed by Crisis Intervention Officers following their response to mental health-related calls or by the responding officer if a CIO is not available. Because officers do not complete the PD251C every time they respond to these types of calls (but may instead complete the mandatory, official PD251), the data shown here represents some CIO calls, but not all. The following report shows trends in data from PD251Cs for fiscal years 2014-2017 (N=2,984) unless otherwise noted.
Executive Summary
The Crisis Intervention Officer (CIO) program in the District of Columbia first began in 2009 as a collaborative effort between the Washington Metropolitan Police Department (MPD) and the Department of Behavioral Health (DBH). Nationally, the program is called Crisis Intervention Teams (CIT), but the District elected to certify individual officers as CIOs rather than teams of officers with the intent of decreasing response time and providing the specialized training to more officers. In addition to MPD, officers from multiple law enforcement agencies within the District have attended the 40-hour training including, but not limited to: U.S. Secret Service, U.S. Capitol Police, DC Protective Services Police Department, Amtrak, Consortium of University Police, DC Housing Police, U.S. Park Police, and Metro Transit (WMATA).
This report provides a summary of findings from data collected via PD251Cs completed and submitted to DBH’s Applied Research and Evaluation Unit (ARE). The data show trends in characteristics of persons and incidents where CIOs responded, the behaviors that resulted in a CIO being dispatched, and the outcome of the calls.
The two primary goals of the CIO program are to (1) increase safety for the public and law enforcement and (2) divert individuals experiencing a mental health crisis who have not committed a crime to appropriate behavioral health services instead of the criminal justice system. Some additional key outcomes unique to the types of incidents that occur with individuals with mental illness include:
Decreases in preventable arrests Decreased response times Increases in referrals to mental health services by law enforcement

12/1/2017
2
Key Data Findings
October 1, 2013 through September 30, 2017 (FY14-FY17):
A total of 2,984 PD251Cs were submitted to DBH; There were 1,005 CIOs (821 from MPD; 184 other agencies) active in the field; Fourth District submitted more PD251Cs than other Districts; Suicide Threats/Attempts and Depressed behavior were the most common behaviors
reported on scene; Weapons were present in 7-10% of incidents (knives/sharp objects were most
common); Injuries to the CIO or responding officer (non-CIO) were reported in 1-2% of incidents; Physical force (versus spray, baton, Taser or firearm) was the only type of force used by
the CIO or responding officer in 2-3% of incidents (data available for FY17 only); The level of resistance by the subject was cooperative or passive in 87-89% of incidents
(data available for FY17 only); Incidents resulted in transports for psychiatric evaluation in 81-84% of calls; Incidents resulted in arrest in 4-6% of calls; A greater percentage (50%) of calls in 2D are due to suicide threats or attempts; Persons aged 19-29 were the subject of the majority of calls (28%); There is very little difference in the percentage of incidents involving men and women; Incidents occur at an elementary/middle/high school in 1-6% and at a college/university
in 6-10% of calls (data available for FY17 only); Veterans are the subject of 3-7% of incidents (data available for FY17 only);

12/1/2017
3
Certified CIOs in the Field
Each year there are at least five CIO training events where a maximum of 35 law enforcement personnel participate per class. Since the program’s start in October 2009, 1,156 law enforcement personnel (963 from MPD districts and bureaus; 193 from other agencies) have been trained and certified as Crisis intervention Officers. Other agencies who have completed certification include Office of Unified Command (911 dispatch), U.S. Capitol Police, U.S. Secret Service, U.S. Park Police, U.S. Supreme Court Police, Amtrak Police, Metro Transit Police, D.C. Housing Authority Police, D.C. Library Police, Government Printing Office Police, DGS Protective Services Police and the University Consortium of Police (American University, Georgetown University, and George Washington University). Officers have been lost to attrition over the years due to retirement, resignation and/or separation from the various departments and agencies resulting in 1,005 CIOs (821 from MPD and 184 from other agencies) active in the field currently.
Figure 1. PD251C’s Received
The total number of PD251Cs submitted to DBH by MPD and by other law enforcement agencies since the program’s start in October 2009 (N=5,259) is shown in Figure 1. Because of the relative size of MPD’s jurisdiction, the number of trained MPD CIOs, and the program is MPD-led they submit the majority of forms. Submission of a PD251C is not required of other law enforcement agencies.
482 436
688
1682
586 564674
147
0
200
400
600
800
1000
1200
1400
1600
1800
1D 2D 3D 4D 5D 6D 7D OtherAgency
PD251Cs Submitted by MPD District or Other Agency (#)Oct 2009 ‐ Sep 2017 (N=5,259)

12/1/2017
4
Figures 1b-1h. Trends in PD251Cs Received by MPD District
The total number of PD251Cs submitted by each MPD District over time is shown below. Although an increase in the number of submitted forms was anticipated as more CIOs were certified, results shown below are mixed. In general, increases in PD251C submissions were seen between FY11 and FY17 in Districts 2, 3, 4, and 5; declines occurred in Districts 1 and 6. Submissions by District 7 have fluctuated over time. Compared to the others, District 4 has consistently submitted more PD251Cs each year.
106 94 69 36 44 7657
0
100
200
300
400
FY11 FY12 FY13 FY14 FY15 FY16 FY17
1D (n=482)
36 52 47107 61 71
620
100
200
300
400
FY11 FY12 FY13 FY14 FY15 FY16 FY17
2D (n=436)
51
13788 90 123
71128
0
100
200
300
400
FY11 FY12 FY13 FY14 FY15 FY16 FY17
3D (n=688)
158
387
240189
225 214269
0
100
200
300
400
FY11 FY12 FY13 FY14 FY15 FY16 FY17
4D (n=1,682)
56 52 71 92117
86112
0
100
200
300
400
FY11 FY12 FY13 FY14 FY15 FY16 FY17
5D (n=586)
123 11461 90 81 59
360
100
200
300
400
FY11 FY12 FY13 FY14 FY15 FY16 FY17
6D (n=564)
75
197
56 63120
760
100
200
300
400
FY11 FY12 FY13 FY14 FY15 FY16
7D (n=674)

12/1/2017
5
Figure 1i. Trends in CIOs who Submit PD251C’s
Figure 1i displays the number of certified CIOs who submitted PD251C forms each year based on the following groupings: no forms, 1-10 forms, 11-20 forms, 21-30 forms and 31 forms or more. There are a small number of CIOs in each District who submit the majority of PD251Cs while most CIOs submit no forms at all.
Figure 2. Trends in Origin of Call
The origin of call is how a CIO was dispatched to the scene of a mental health related incident and is presented in Figure 2. The majority of calls are dispatched by OUC (911 call takers). But in 8-18% of calls CIOs were ‘on-scene’ which means they were either flagged down by someone as an incident was occurring, they came upon an incident while on patrol or they were requested by another non-CIO after they arrived on scene and determined that a CIO was needed.
482543
684
778
136 170 171 210
14 15 11 132 3 0 40 2 2 00
200
400
600
800
FY14 FY15 FY16 FY17
PD251Cs Submitted by MPD CIOs (#)
0 1‐10 11‐20 21‐30 31+
82% 84% 81% 92%
18% 16% 18% 8%
0%
25%
50%
75%
100%
FY14 (n=670) FY15 (n=791) FY16 (n=693) FY17 (n=830)
Origin of Call (%)
Dispatched On‐Scene

12/1/2017
6
Figure 3. Behaviors Observed on Scene
Figure 3 displays the percentage of the types of behaviors observed on scene during mental health related incidents. The majority of incidents involved Suicide Threat/Attempts which is in keeping with the program’s intent to dispatch CIOs for incidents involving persons experiencing a mental health crisis. Depressed, Hostile/Aggressive, and Disoriented/Confused behaviors are also reported often. More than one type of behavior can be selected. Behaviors marked with an asterisk (*) were added to the revised PD251C which was implemented in FY17.
Figure 3a. Trends in Behaviors Observed on Scene
Figure 3a displays the trends in the four most commonly reported behaviors on scene. Suicide Threats and Attempts decreased between FY14 and FY15 and then trended upwards through FY17. Depressed behaviors trended down during this reporting period, while reports of Disoriented/Confused behavior trended up. Interestingly, Hostile and Aggressive behaviors trended up between FY14 and FY16 and then made a sharp decline in FY17. Reasons for this are unknown.
1%
7%
8%
9%
10%
20%
21%
25%
25%
26%
36%
38%
39%
0% 25% 50%
*HoardingInappropriately Dressed
Nuisance*Medical Neglect*Welfare Check
Hearing/Seeing ThingsHyperactive
Frightened/anxiousThreats/Violence to Others
Disoriented/ConfusedHostile/Aggressive
DepressedSuicide Threat/Attempt
Behaviors Observed On Scene (%) FY14‐FY17 (N=2,984)
39%
34%
39%
45%
41%38% 38%
34%
38% 39% 41%
27%24% 25%
27%29%
20%
30%
40%
50%
FY14 (N=670) FY15 (n=791) FY16 (n=693) FY17 (N=830)
Trends of the Most Commonly Selected Behaviors Observed On‐Scene (%) *More than one behavior type can be selected
Suicide threat/attempt Depressed Hostile/Aggressive Disoriented/Confused

12/1/2017
7
Figure 4. Trends in Incidents Involving Weapons
The majority of mental health related incidents are reported as having no weapons involved, and this finding has been fairly consistent between FY14 and FY17 showing that subjects’ brandished weapons in 7-10% of incidents.
Figure 5. Type of Weapons
Because there are so few, the number (not percentage) of the types of weapons a subject brandished during an incident is displayed in Figure 5. While the majority of incidents do not involve weapons of any kind, the most common types of weapons reported are knives and other sharp objects. If a call was dispatched that involved the presence of a firearm then a CIO would likely not be the responding officer, a PD251C would not be completed and that data would not be presented here. More than one type of weapon can be selected.
8% 10% 7% 9%
92% 90% 91% 91%
0%
25%
50%
75%
100%
FY14 (N=670) FY15 (n=791) FY16 (n=693) FY17 (n=830)
Incidents Involving Weapons (%)
Yes No
122
35 3319
2 2 10
50
100
150
200
Knife Other Sharpobject
Blunt object Other Hand Stick Firearm
Type of Weapons Reported (#) ‐ FY14‐FY17 (N=2,984)

12/1/2017
8
Figure 6. Trends in Persons Injured
While the majority of incidents involving persons with mental illness are resolved without injuries to anyone, the percentage of persons who were injured on scene is presented in Figure 6. The person most likely to be injured is the incident subject followed by other persons or citizens (who know or who were involved with the incident subject) who were on scene. There was a notable decrease in proportion of persons injured in FY17. More than one type of person injured can be selected.
Figure 7. Trends in Additional Manpower Involved
Indicating when additional manpower is needed by a CIO was added to the revised PD251C beginning in FY17. Therefore since it is a new indicator, Figure 7 shows the percentage of types of additional manpower needed during a mental health related incident by quarter for FY17 only. While no additional manpower is required for most mental health related incidents, ERT is requested in 1-4%; Police Details in 1-3% and; Barricades in 1% or fewer incidents. By Q4, 99% of incidents needed no additional manpower. More than one type can be selected.
68% 63% 63%
89%
17%19% 20%
8%12% 13% 13%3%1% 2% 2% 0%
1% 2% 1% 1%
0%
25%
50%
75%
100%
FY14 (n=670) FY15 (n=791) FY16 (n=693) FY17 (n=830)
Persons Injured On Scene (%)
No Injuries Subject Injured Injure Others CIO Officer Other Officer
93%
4% 3% 1%
96%
1% 2% 0.4%
96%
3% 1% 1%
99%
1% 0% 0%0%
25%
50%
75%
100%
No Addtl. Manpower ERT Police Detail Barricade
Additional Manpower Involved (%) ‐ FY17 (N=830)Q1 (n=237) Q2 (n=228) Q3 (n=176) Q4 (n=189)
12/1/2017
9
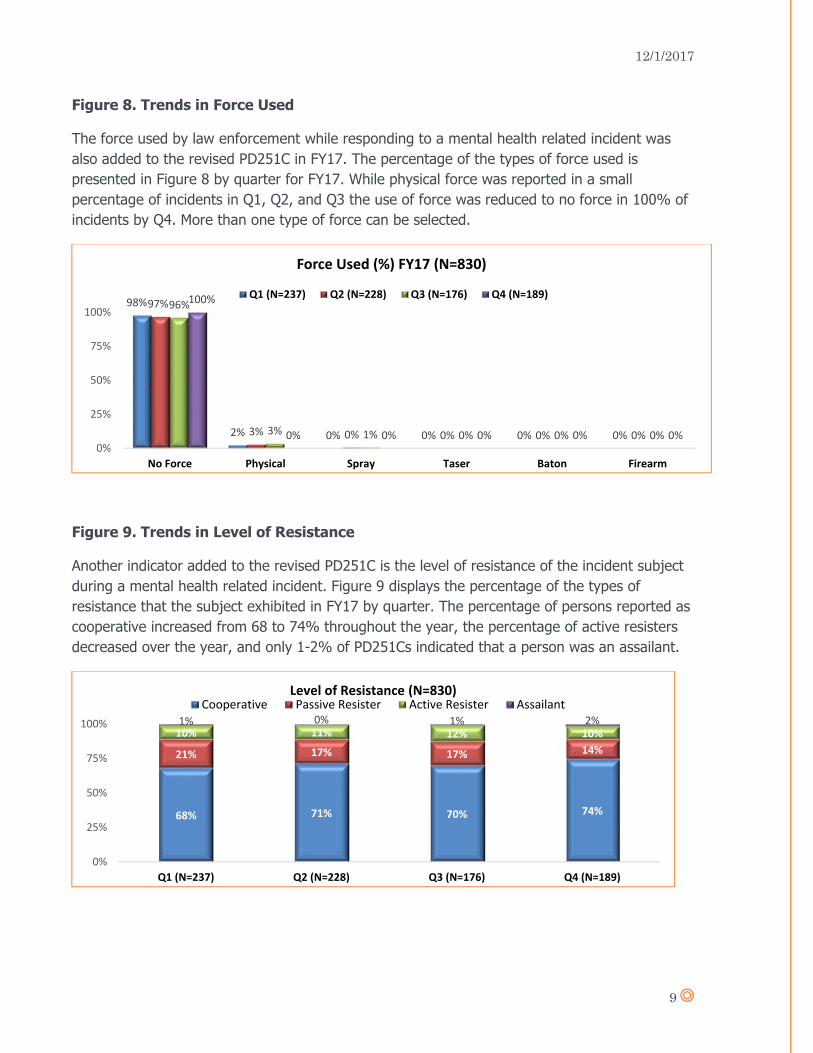
Figure 8. Trends in Force Used
The force used by law enforcement while responding to a mental health related incident was also added to the revised PD251C in FY17. The percentage of the types of force used is presented in Figure 8 by quarter for FY17. While physical force was reported in a small percentage of incidents in Q1, Q2, and Q3 the use of force was reduced to no force in 100% of incidents by Q4. More than one type of force can be selected.
Figure 9. Trends in Level of Resistance
Another indicator added to the revised PD251C is the level of resistance of the incident subject during a mental health related incident. Figure 9 displays the percentage of the types of resistance that the subject exhibited in FY17 by quarter. The percentage of persons reported as cooperative increased from 68 to 74% throughout the year, the percentage of active resisters decreased over the year, and only 1-2% of PD251Cs indicated that a person was an assailant.
98%
2% 0% 0% 0% 0%
97%
3% 0% 0% 0% 0%
96%
3% 1% 0% 0% 0%
100%
0% 0% 0% 0% 0%0%
25%
50%
75%
100%
No Force Physical Spray Taser Baton Firearm
Force Used (%) FY17 (N=830)
Q1 (N=237) Q2 (N=228) Q3 (N=176) Q4 (N=189)
68% 71% 70% 74%
21% 17% 17% 14%
10% 11% 12% 10%1% 0% 1% 2%
0%
25%
50%
75%
100%
Q1 (N=237) Q2 (N=228) Q3 (N=176) Q4 (N=189)
Level of Resistance (N=830)Cooperative Passive Resister Active Resister Assailant

12/1/2017
10
Figure 10. Disposition (Outcome) of Incidents
The percentage of the types of action taken by a CIO to resolve a mental health related incident are presented in Figure 10. The majority of incidents result in the subject being transported for psychiatric evaluation and very few resulting in arrests which is in line with the intention of the program. CIOs are also able to successfully resolve 15% of incidents with de-escalation and/or other skills that do not require formal action (e.g., arrest or transport) to be taken. More than one disposition can be selected.
Figure 10a. Trends in Disposition
Trends in disposition type are shown in Figure 10a and reveal that the percentage of transports for psychiatric evaluation and arrests have remained relatively stable. The percentage of incidents that resulted in no action (did not require formal actions of arrest or transport) increased from 10- to 18% between FY14 and FY17. It is possible that de-escalation and other skills CIOs utilize while on scene allow them to resolve more incidents without having to take formal action.
82%
15%5%
0%
25%
50%
75%
100%
Transported for Eval No Action/Resolved On‐Scene Arrest
Disposition/Outcome of Incidents (%) ‐ FY14‐FY17 (N=2,984)
6% 4%6% 4%
10%16% 16% 18%
81% 80% 83% 84%
0%
25%
50%
75%
100%
FY14 (N=670) FY15 (n=791) FY16 (n=693) FY17 (n=830)
Tredns in Outcome/Disposition (%)*More than one disposition type can be selected
Arrest No Action Transported for Eval

12/1/2017
11
Figure 11. Type of Transport
For incidents that resulted in a transport for psychiatric evaluation the percentage of the type of transport is described in Figure 11. The majority of incidents that require transports for psychiatric evaluation are involuntary (FD12) in nature. Mental health related calls result in transports for psychiatric evaluation about 80% of the time.
Figure 11a. Trends in Type of Transport
Trends in the percentage of transport types (Voluntary or Involuntary/FD12) are presented in Figure 11a. Overall, the percentage of incidents that involved transports increased between FY14 and FY17 (N/A went from 19- to 16%) but the type of transport showed no consistent trends and only changed slightly. Compared to FY14, voluntary transports decreased in FY15 and FY16 and then increased in FY17, while involuntary transports increased in FY15 and FY16 and decreased again in FY17.
55%18%
18%
Incidents Involving Psychiatric Admissions (%) ‐ FY14‐FY17 (N=2,984)
FD‐12/Involuntary Adm Voluntary Adm N/A
53% 54% 58% 54%
28% 26% 25% 30%
19% 20% 17% 16%
0%
25%
50%
75%
100%
FY14 (N=670) FY15 (n=791) FY16 (n=693) FY17 (n=830)
Trends in Type of Transport (%)
FD12/Involun Eval Voluntary Eval N/A

12/1/2017
12
Figure 12. Suicide Threats/Attempts by District
Preventing subjects in crisis from harming themselves or others is an important aspect of CIO intervention. Figure 12 presents the percentage of suicide threats or attempts by district and results reveal that half of the mental health related calls in 2D are attributed to this. It is speculated that the large number of colleges and universities and bars/clubs located in 2D may be a contributing factor but further analysis is needed in this area.
Figure 12a. Trends in Calls for Suicide Threats/Attempts by District
Figure 12a shows the trends in suicide threats or attempts by district. In general, more calls of this type occurred in 2D; 4D had the lowest percentage. Districts saw a decline in suicide threats or attempts in FY15 and then trended up through FY17 with the exception of 6D which showed a steady decrease and 7D which had a steady upward trend between FY14 and FY17.
37%
50%
39%33%
42% 39%
49%
0%
10%
20%
30%
40%
50%
60%
1D 2D 3D 4D 5D 6D 7D
Suicide Threats & Attempts by District (%) ‐ FY14‐FY17 (N=2,984)
0%
10%
20%
30%
40%
50%
60%
70%
FY14 (n=670) FY15 (n=791) FY16 (n=693) FY17 (n=830)
Suicide Threat/Attempt by District
1D 2D 3D 4D 5D 6D 7D

12/1/2017
13
Figure 13. Arrests and Transports by District
Other than safety, the main goal of the CIO initiative is diversion from the criminal justice system when appropriate. Since arrests and transports for psychiatric evaluation represent the two ends of the diversion spectrum, those results are presented here in Figure 13 by district. Results show that the percentage of arrests overall were low but were slightly higher in 1D and 3D compared to other districts. Conversely, the rate of arrests were lower in 2D and 4D. Transports for evaluation were highest in 2D which aligns with data shown previously that suicide threats or attempts were highest in 2D.
Figure 13a. Trends in Arrests by District
Trends in the percentage of arrests by district are presented in Figure 13a. While 3D began FY14 and FY15 with more arrests compared to other districts, that trend declined in FY16 and FY17. Conversely, districts 1, 5 and 6 showed a sharp increase in arrests in FY16 and trended back down in FY17. Other districts have been fairly consistent in the percentage of arrests made.
8%3%
8%3%
6% 7% 6%
83%
89%
78%80%
77%
83% 86%
0%
25%
50%
75%
100%
1D 2D 3D 4D 5D 6D 7D
Arrests & Transports for Psych Evaluation (%) by District, FY14‐FY17 (N=2,984)Arrests Transports for Psych Eval
0%
5%
10%
15%
20%
FY14 (n=670) FY15 (n=791) FY16 (n=693) FY17 (n=830)
Trends in Arrests by District (%)
1D 2D 3D 4D 5D 6D 7D

12/1/2017
14
Figure 13b. Trends in Transports for Psychiatric Evaluation by District
Trends in the percentage of transports for psychiatric evaluation are shown in Figure 13b. The rate of transport is higher in 2D overall but after a trend upwards in FY15, there was a decline in FY16 and FY17. Transports remained consistent in 6D and 7D but trended upward in FY17. There was inconsistent variation in the other districts during the reporting period.
Figure 14. Trends in Prior Contact with Subject
The percentage of calls where the CIO indicated having prior contact with the same incident subject in the past is displayed in Figure 14. The number of incidents that involved a subject familiar to the responding officer has remained consistent (14- to 15%) between FY14 and FY17.
60%
70%
80%
90%
100%
FY14 (n=670) FY15 (n=791) FY16 (n=693) FY17 (n=830)
Trends in Transports for Psych Evaluation by District (%)
1D 2D 3D 4D 5D 6D 7D
14% 14% 15% 14%
86% 86% 85% 86%
0%
25%
50%
75%
100%
FY14 (N=670) FY15 (n=791) FY16 (n=693) FY17 (n=830)
Prior Contact with Incident Subject?
Yes No

12/1/2017
15
Figure 15. School-Related Incidents
This is a new indicator added to the revised PD251C and data is shown by quarter for FY17 only. The percentage of times a mental health related incident occurred at a school is shown in Figure 15. Throughout the year 12-13% of incidents were school related but the number decreased to 8% in Q4.
Figure 16. Veteran Status of Incident Subjects
The percentage of incidents involving veterans is also a new indicator added to the revised PD251C and data is shown by quarter for FY17 only. Figure 16 shows a small number of subjects were identified as veterans and the number decreased throughout the year.
88% 87% 87% 92%
6% 9% 10% 7%6% 4% 3% 1%
0%
25%
50%
75%
100%
Q1 (N=237) Q2 (N=228) Q3 (N=176) Q4 (N=189)
School‐Related Incidents (%) FY17 (N=830)
Non‐School Related College‐Univ Elem‐Middle‐High
82% 75% 73% 74%
11% 21% 24% 22%
7% 4% 3% 4%
0%
25%
50%
75%
100%
Q1 (N=237) Q2 (N=228) Q3 (N=176) Q4 (N=189)
Veteran Status (%) FY17 (N=830)No Don't Know Yes

12/1/2017
16
Figure 17. Race/Ethnicity of Incident Subjects
The percentage of race/ethnicities represented by incident subjects is also a new indicator added to the revised PD251C and data is shown by quarter for FY17 only. Figure 17 shows that the majority of subjects are Black/African-American and the number increased over the year.
Figure 18. Trends in the Gender of Incident Subjects
The gender of incident subjects is presented in Figure 17. The difference in the percentage of males and females is minimal to none between FY14 and FY16. In FY17 males were the subject of 9% more calls than women. New categories were added in FY17 and a very small number of subjects identified themselves as either transgendered males or females.
68%
18%
0%5% 4% 2%
66%
18%
6% 5% 3% 2%
69%
19%
0%6% 4% 2%
73%
17%
0%6%
2% 3%
0%
25%
50%
75%
100%
Black/Af‐Am White/Cauc American Indian Hispanic Other Asian
Race/Ethnicity (%) FY17 (N=830)Q1 (N=237) Q2 (N=228) Q3 (N=176) Q4 (N=189)
51% 50% 49% 54%
49% 50% 51% 45%
0.12% 0.36%
0%
25%
50%
75%
100%
FY14 (n=670) FY15 (n=791) FY16 (n=693) FY17 (n=830)
Gender of Incident Subjects (%)
Male Female TG Male TG Female

12/1/2017
17
Figure 19. Age of Incident Subjects
The percentage of the ages (in categories) of incident subjects is displayed in Figure 18. Compared to the other age groups, 19-29 year olds are consistently the subjects of the majority of mental health related calls.
2%
10%
28%
19%
15%
16%
9%3%
Age of Incident Subjects (%) FY14‐FY17(N=2,984)
0‐10 (2%)
11‐18 (10%)
19‐29 (28%)
30‐39 (19%)
40‐49 (15%)
50‐59 (16%)
60‐69 (9%)
70+ (3%)
Mean Age = 38