Embed Size (px)
Citation preview

Cineworld Group H1 2018 Results9 August 2018
0

Key Highlights
Completion of milestone
transaction
Acquisition of Regal
Entertainment for $5.8bn
financed through $2.3bn rights
issue and $4.1bn debt facility
Integration progressing well
On track to deliver synergy plans
for 2018 and 2019
Strategic Progress Financial Review
Group Pro Forma2 revenue of
$2,456m up 10.8%3
Group Pro Forma Adj. EBITDA1 of
$554m up +14.1%3 and margin up
0.7% to 22.5%
Strong performance in the US
with box office revenue up 14.3%
Solid performance in the UK and
CEE & I in the context of a
challenging first half
Continued investment in
technology with ScreenX, 4DX
and IMAX agreements
Roll-out across our estate: 6
new sites across the US, UK and
CEE & I
Refurbishment programme
progressing well
Operating Development
1. Adjusted EBITDA is defined as Operating profit plus share of profits from joint ventures using the equity accounting method net of tax adjusted for depreciation and amortisation, onerous lease charges and releases, impairments and reversals of impairments, transaction and reorganisation costs, gains/losses on disposals of assets and subsidiaries, share based payment charges, and share of profits received from associates in excess of distributions or any undistributed such profits
2. Pro-forma (“PF”) results reflect the Group and US performance had Regal been consolidated for the entirety of the period from 1 January 2018. For the purposes of percentage movements, the same comparative period has been applied.3. Constant currency (“cc”) movements have been calculated by applying the 2018 average exchange rates to the 2017 performance 1

Cineworld Today
121
14
35
3
1826
6
UK & Ireland Poland
Czech
RepublicSlovakia
HungaryRomania
Bulgaria
Israel
11
558
screenssitesx x
7,306
1,094 385
13329
65
237157
136
43 121 130
Leading and global Cinema Group operating in 10 countries with 792 sites1 and 9,542 screens1
United States
1. As of 30 June 2018 2

Financial Review

Group Pro Forma Performance summary
H1 2018 PF Revenue / Growth1
$2,456m / +10.8%
H1 2018 PF Adj. EBITDA / Margin / Growth1
$554m / 22.5% / +14.1%
76%
15%9%
United StatesUK & IrelandCEE & I
62%28%
10%
Box office
Retail
Other Income
H1 2018PF Admissions / Growth1
159m / +4.9%
Revenue by geography Revenue by product & services
4
1. Constant currency (“cc”) movements have been calculated by applying the 2018 average exchange rates to the 2017 performance

H1 18 Pro Forma Performance By Geography
United States UK & Ireland CEE & I
110m
$1,873m
$441m
23.5%
14.3%
23m
$229m
$55m
24.0%
-1.3% cc
26m
$354m
$58m
16.3%
2.5% cc
159m
$2,456m
$554m
22.5%
Group
-11.1% cc3.2% cc
4.9%
10.8%
14.1%
0.7%
9.2%
20.0%
1.1%
-2.7% -5.7%
-2.4%0.1%
Admissions:
Revenue:
Adj. EBITDA:
EBITDA margin:
5

Pro Forma Performance - United States
➢ US pro forma revenue of $1,873m up 14.3% driven by
➢ Admissions growth +9.2%
➢ Box office revenue growth +14.3%
➢ Retail revenue growth +13.6%
➢ Other Income growth +16.4%
➢ US pro forma EBITDA of $441m up 20.0%
United States
UK & Ireland
CEE & I
H1 2018 PF Revenue / Growth
$1,873m / 14.3%
H1 2018 PF EBITDA / Margin
$441m / 23.5% / +1.1%
76%
558 7,306
screenssitesx x
H1 2018 Pro Forma Revenues
6

United States - KPI
100.8110.1
H1 17 H1 18
PF Admissions (m)
+9.2%
10.0 10.4
H1 17 H1 18
+4.6%
4.7 4.9
H1 17 H1 18
+4.0%
PF ATP ($) PF SPP ($)
7

screenssitesx x
H1 18 Performance – UK & Ireland
➢ UK & Ireland revenue of $354m up 2.5% in cc driven by
➢ Admissions decline of -2.7%
➢ Box office revenue growth +1.3% in cc
➢ Retail revenue growth +1.0% in cc
➢ Other Income growth +15.0% in cc
➢ EBITDA of $58m up 3.2%
United States
UK & Ireland
CEE & I
H1 2018 Revenue / Growth
$354m / 2.5% cc
H1 2018 EBITDA / Margin
$58m / 16.3% / +0.1%
15%
121 1,094
H1 2018 Revenues
8

UK & Ireland - KPI
26.3 25.6
H1 17 H1 18
(2.7%)
8.7 9.1
H1 17 H1 18
+4.1%
3.2 3.3
H1 17 H1 18
+3.8%
Admissions (m) ATP1 ($) SPP1 ($)
1. Constant currency (“cc”) movements have been calculated by applying the 2018 average exchange rates to the 2017 performance
9
screenssitesx x
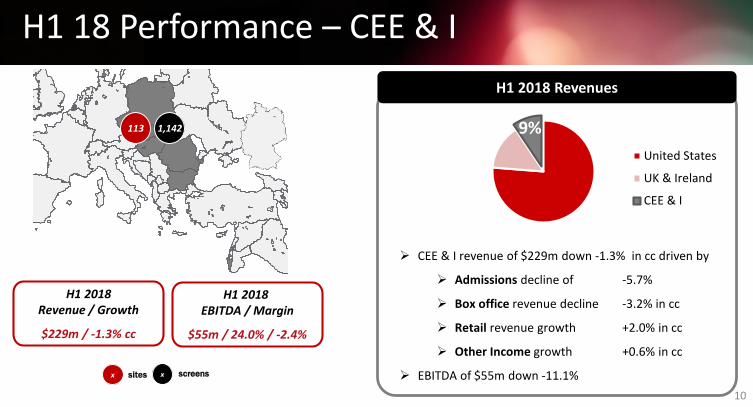
H1 18 Performance – CEE & I
➢ CEE & I revenue of $229m down -1.3% in cc driven by
➢ Admissions decline of -5.7%
➢ Box office revenue decline -3.2% in cc
➢ Retail revenue growth +2.0% in cc
➢ Other Income growth +0.6% in cc
➢ EBITDA of $55m down -11.1%
United States
UK & Ireland
CEE & I
H1 2018 Revenue / Growth
$229m / -1.3% cc
H1 2018 EBITDA / Margin
$55m / 24.0% / -2.4%
9%113 1,142
H1 2018 Revenues
10

CEE & I – KPI
24.5 23.1
H1 17 H1 18
(5.7%)
5.7 5.8
H1 17 H1 18
+2.5%
2.4 2.6
H1 17 H1 18
+8.2%
Admissions (m) ATP1 ($) SPP1 ($)
1. Constant currency (“cc”) movements have been calculated by applying the 2018 average exchange rates to the 2017 performance
11

Statutory Group Profit and Loss
$m H1 2018 H1 2017 FY 2017
Revenue 1,862.9 528.7 1,147.0
Adjusted EBITDA 413.6 107.5 257.7
Depreciation and amortisation (144.4) (41.5) (87.8)
Exceptional cost & other adjustments
(55.8) (1.1) (4.8)
Operating profit1 213.4 64.9 165.1
Net finance costs (53.2) (4.4) (10.0)
Profit before tax 160.2 60.5 155.1
Tax charge (31.8) (9.9) (25.6)
Profit after tax 128.4 50.6 129.5
Adjustments 24.0 3.4 9.5
Adjusted profit after tax 152.4 54.0 139.0
The $55.8m net exceptional items includes the following:
− $49.8m of transaction costs
− ($2.2m) credit from the release of onerous lease provisions
− $0.4m impairment costs
− $1.6m share-based charges
− $1.4m loss on disposal of assets
− $4.8m non-cash profits from jointly controlled entities
Net finance costs of $53.2m includes:
− $61.2m in respect of interest on bank loans
− ($37.3m) of foreign exchange gain
− $13.6m unwind of discount on deferred revenue
− $6.3m amortisation of prepaid finance costs
− $9.4m of other charges
Includes $6.2m of share of profit from jointly controlled entities adjusted for undistributed profits of $4.8m
121. Operating profit plus share of loss of joint ventures using equity accounting method net of tax

Growth in the adjusted diluted EPS of 50.0%$m H1 2018 H1 2017 FY 2017
Profit after tax 128.4 50.6 129.5
Adjustments:
Amortisation 11.0 3.0 6.6
Transaction and reorganisation costs 49.8 0.9 10.0
Impairments 0.4 0.8 (6.7)
Share based payment charges 1.6 1.4 2.4
Onerous lease charges and releases (2.2) 0.8 1.7
Recycle of fair value from hedging reserve 3.5 - -
Profit on disposal 1.4 (2.8) (2.6)
FX gain on loan (35.5) - -
Tax affect of adjusted items (6.0) (0.7) (1.9)
Adjustments total 24.0 3.4 9.5
Adjusted profit after tax 152.4 54.0 139.0
Diluted earnings per share denominator 1,161.5 613.5 615.6
Diluted EPS 11.1c 8.2c 21.0c
Adjusted diluted EPS 13.2c 8.8c 22.6c
The exceptional items includes the following:
− $49.8m of transaction costs
− $0.4m impairment costs
− $1.6m share-based charges
− ($2.2m) credit from the release of onerous lease provisions
− $3.5m recycle of fair value on hedging reserve
− $1.4m profit on disposal of assets
− ($35.5m) foreign exchange gain recognized on the retranslation on the Euro term loan
Effective tax rate of 19.9% applied to the adjustments
13

Net Debt Analysis
$5,786m
$2,340m
$414m
$73m
$371m
$376m
$3,852m
Net Debt1 Jan 18
Acquisition of Regal Proceeds from RightsIssue
Adj. EBITDA Capex Others Adjusted Net Debt30 Jun 18
Adjusted Net Debt1/ LTM Adjusted EBITDA: 3.8x
1. Includes $202m payable to Regal dissenting shareholders2. Includes working capital movements, interest, tax, deal related fees, foreign exchange and others
1 2
14
1

Interim Dividend
9 Aug
Cineworld declares $4.85c dividend per share
Dividend declared
Ex-DividendDate
13 Sep 14 Sep
Record DateDeadline for
currency election
Currency election GBP (default) or USD
21 Sep
GBP/USD Exchange rate
determined
5 Oct
Payment
15

Financial Outlook
Business on track to deliver synergy plans for 2018 and 2019
Total capital expenditure for 2018 expected to be approximately $220m-$240m on a statutory basis
Normalised tax rate expected to trend towards 19%-20%
Focus on cash generation with deleveraging profile on track
Group to maintain historical dividend payout
16

Business Update

Integration Update
New management team in place from Day 1
New operating structure in the US with new
regional heads
Global head office remains in London, UK and
Regal office to remain in Knoxville, Tennessee
Senior management team fully engaged in the
integration of Regal
People Strategy
Best practice sharing across all areas of the business:
procurement and benchmarking initiatives
Alignment of IT and reporting systems
Key actions to date:
Corporate expense optimisation
Roll-out of allocated seating
Online penetration
Marketing & Advertising (NCM)
Plans for first cinemas refurbishments progressing
well
18

Integration Benefits
Expected Combination Benefits (excluding tax) Total run-rate synergies of $100m to be achieved
in 2019
$60m costs reduction
$40m business initiatives
Phasing: 40%-50% expected to be realised in
2018 and 100% in 2019
Significant efficiencies achieved to date including
rationalising of public company costs and
optimisation of functions
Further integration benefit opportunities being
reviewed by management
$100m
2018 2019
$40m-$50m
19

Continued Roll-out Across Europe…
Weston-Super-Mare, UK Ramnicu Valcea, RomaniaDover, UK
20

…and the United States
Lynbrook, NY Celebration Pointe, Florida Delta Shores, California
21

Next generation cinemas – refurbishments
Full refurbishment and 4DX of our flagship cinema in Leicester Square
Refurbishment of our Enfield cinema in the UK
Four new 4DX installed in Dublin, Middlesbrough, Castleford and Leicester Square
Continued delivery of refurbishments with the following completed in H1 2018
Leicester Square Leicester Square Dublin 22

First Look: Refurbishments in the United States
Irvine, California

First Look: Refurbishments in the United States
Union Square, New York

Technology Investments
Digital Laser Projectors
New 4DX (80 screens) and IMAX (55 screens) agreements
ScreenX (100 screens): 270 degree panoramic film-viewing experience
Investment into a wide range of new and exciting technologies including
25

Speke: Our First ScreenX

What is coming?
12 sites, 111 screens planned to open in H2 2018
8 sites & 81 screens in the US
4 sites & 30 screens in the UK
Further refurbishments planned in the UK (4 sites) and CEE & I (1 site in Hungary)
Plans for first cinemas refurbishments in the US progressing well
Further integration benefits opportunities from the combination with Regal being reviewed by management
Continued focus on customer experience to be “The Best Place to Watch a Movie”
27

Release Schedule: H2 2018
28
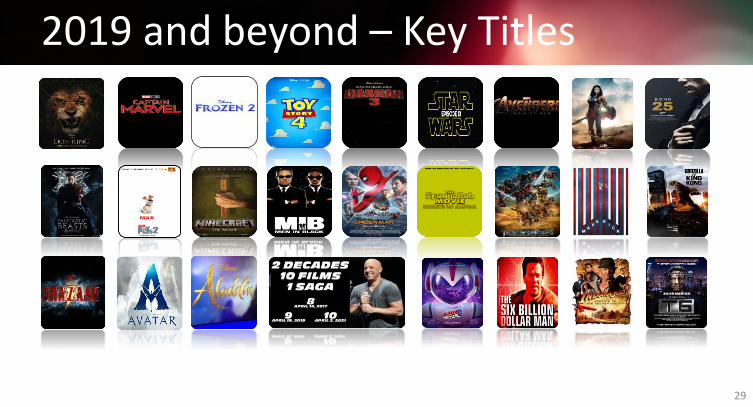
2019 and beyond – Key Titles
29