Embed Size (px)
Citation preview
CINET1 GDS-calculatorGraph Dynamical Systems
Visualization
Group CINETgdsSichao Wu, Yao Zhang
Virginia TechDec. 2012
CS5604 Final Project Presentation
1 CINET is supported by the NSF under Grant No. 1032677
Recap: What is GDS?
GDS: Graph Dynamic Systems. Five elements:
Graph. Vertices, which represent states. Edges, which indicate interacting vertices. Vertex functions, which quantify vertex
state changes. Update scheme: synchronous, sequential,
block, etc.
Motivation
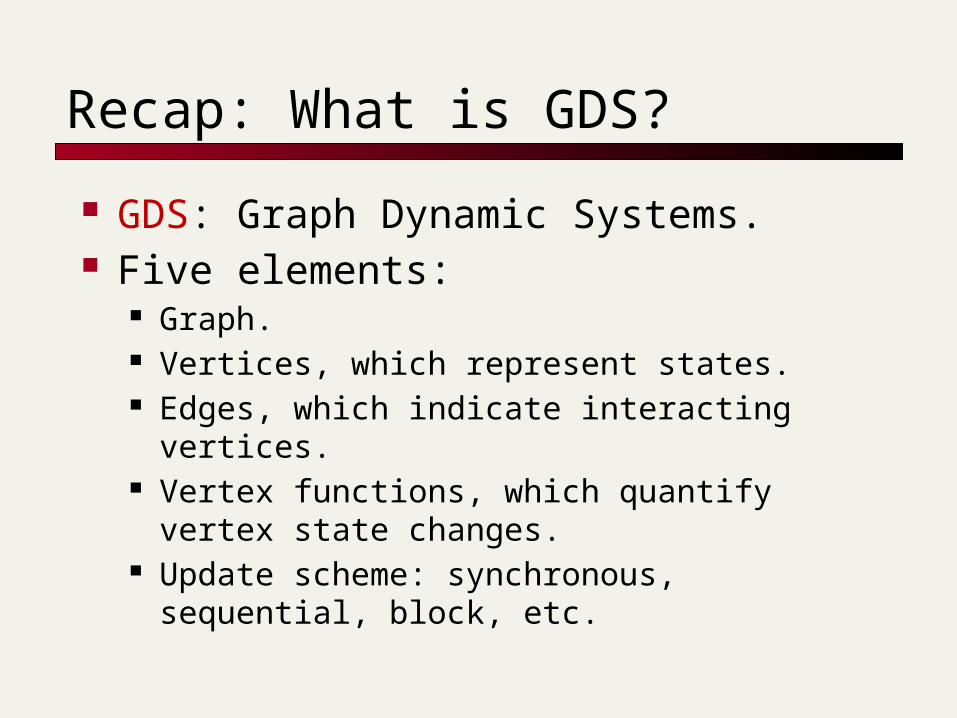
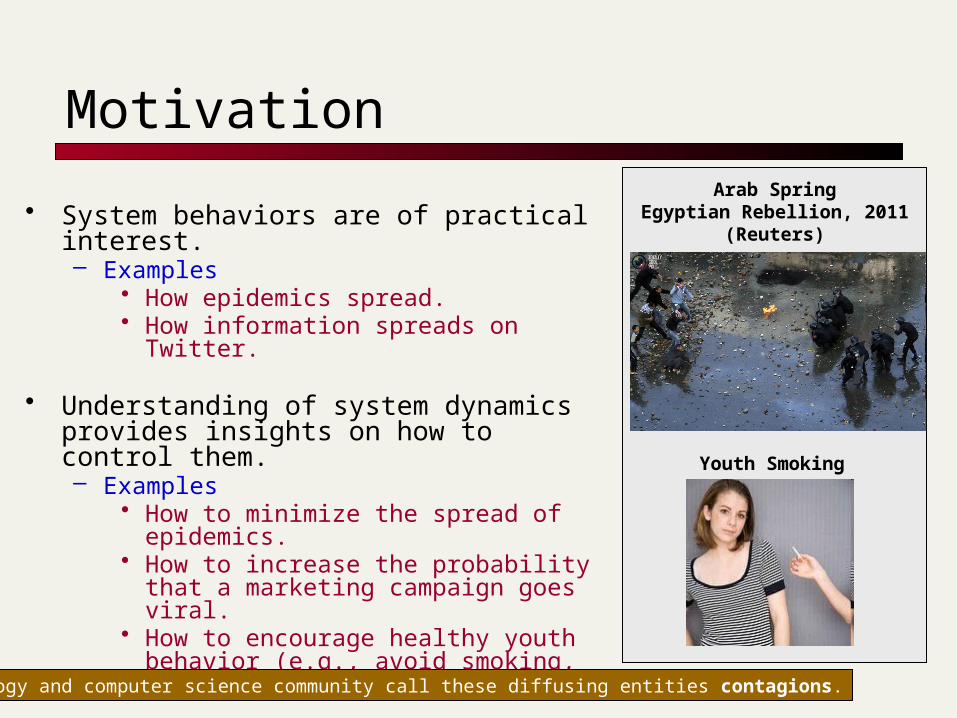
• System behaviors are of practical interest.– Examples
• How epidemics spread.• How information spreads on Twitter.
• Understanding of system dynamics provides insights on how to control them.– Examples
• How to minimize the spread of epidemics.
• How to increase the probability that a marketing campaign goes viral.
• How to encourage healthy youth behavior (e.g., avoid smoking, excessive drinking).
Arab SpringEgyptian Rebellion, 2011
(Reuters)
Youth Smoking
Sociology and computer science community call these diffusing entities contagions.
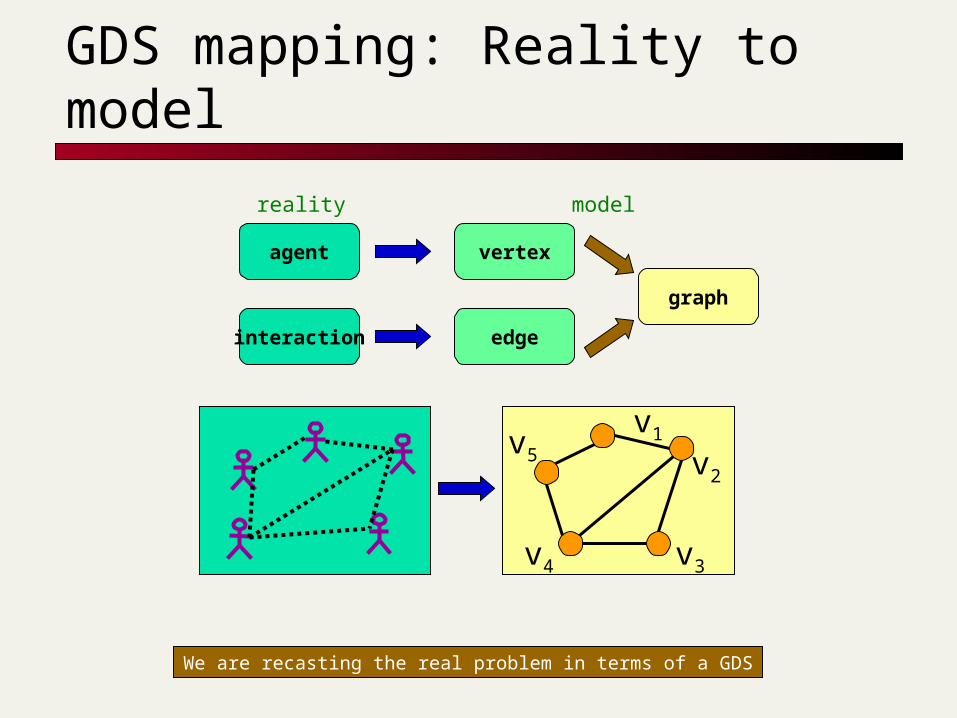
GDS mapping: Reality to model
agent
interaction
vertex
edge
reality model
graph
v1
v2
v3v4
v5
We are recasting the real problem in terms of a GDS
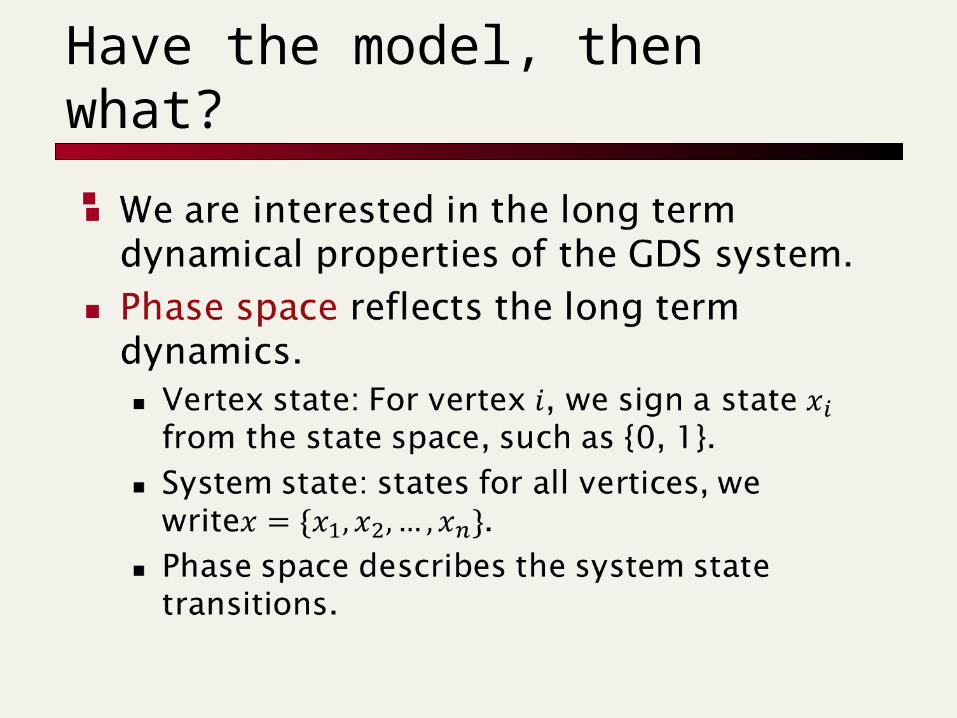
Have the model, then what?
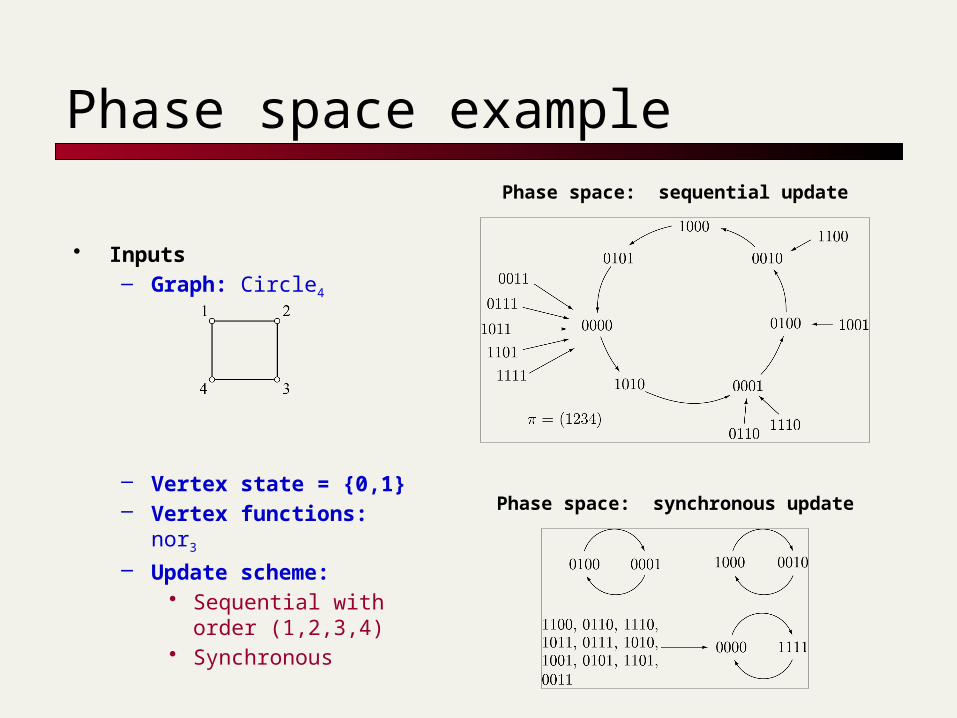
Phase space examplePhase space: sequential update
Phase space: synchronous update
• Inputs– Graph: Circle4
– Vertex state = {0,1}– Vertex functions: nor3 – Update scheme:
• Sequential with order (1,2,3,4)
• Synchronous
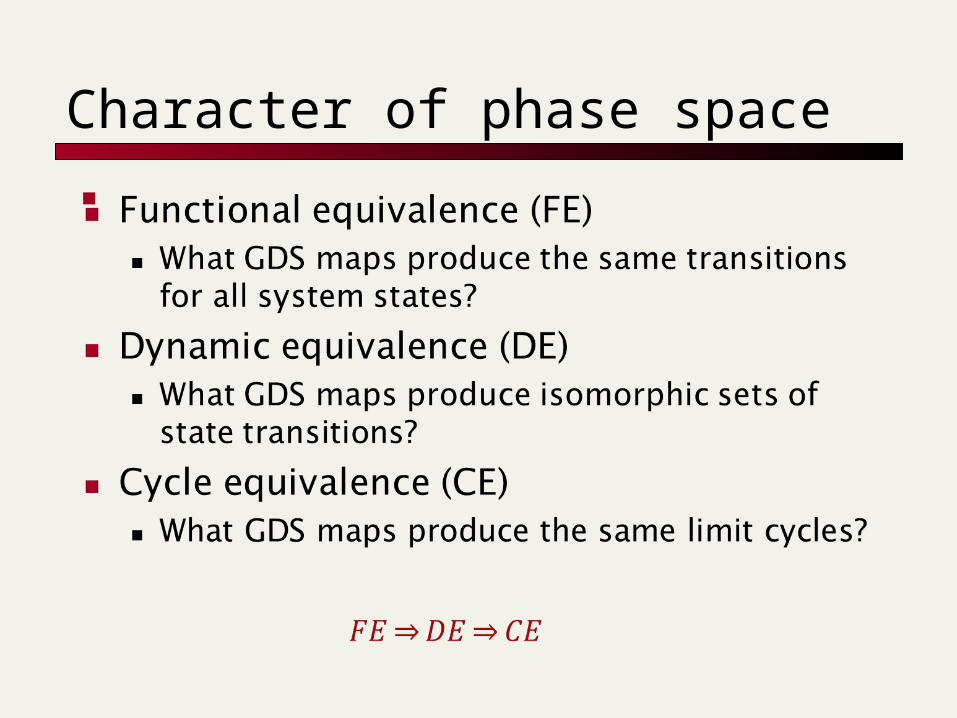
Character of phase space
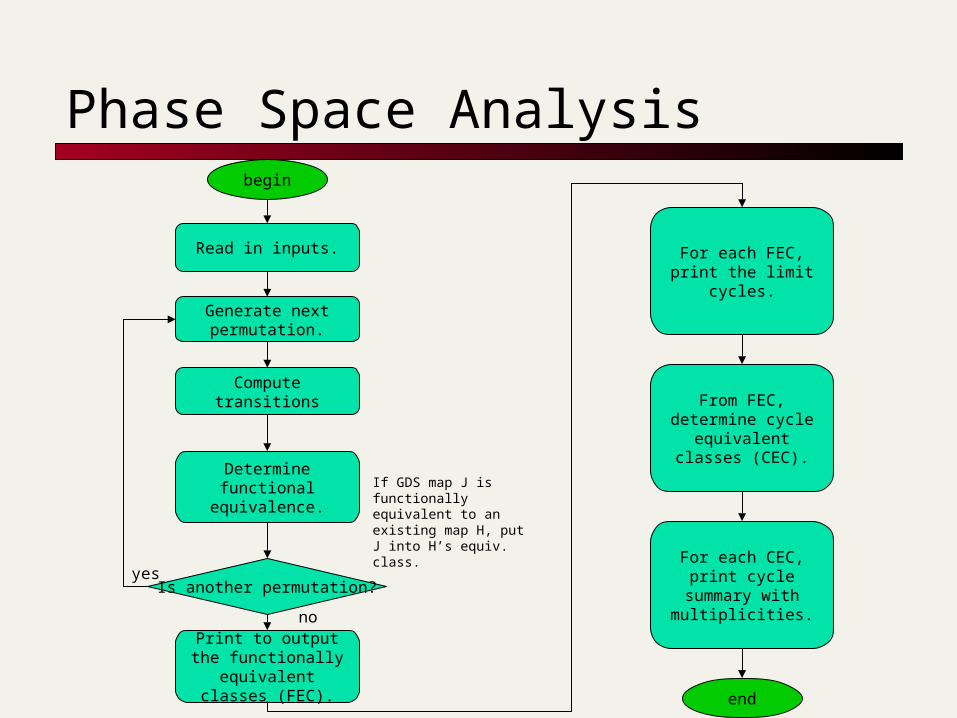
Phase Space Analysis
Read in inputs.
Generate next permutation.
Compute transitions
Determine functional equivalence.
If GDS map J is functionally equivalent to an existing map H, put J into H’s equiv. class.
Print to output the functionally equivalent
classes (FEC).
From FEC, determine cycle
equivalent classes (CEC).
Is another permutation?
no
yes For each CEC, print cycle summary with
multiplicities.
begin
For each FEC, print the limit cycles.
end
Task - Overview
GDS calculator visualization system has three main tasks: Visualizing bar charts. Visualizing phase space transition
graphs. Exporting to graphs and charts to
files.
Task – Visualizing bar chars
Bar Charts we have implemented: the number of cycles for each cycle
equivalent set. the number of permutations for each
permutation equivalent set. the number of cycles for each permutation. the maximum cycle length for each
permutation. the number of permutations for a specific
cycle length.
Task – Visualizing graphs
Graph we have implemented: functional state transitions. cycle state transitions.
Exporting to graphs and charts to files Export bar charts: png, pdf. Export graphs: png, gexf.
Design – MVC Architecture
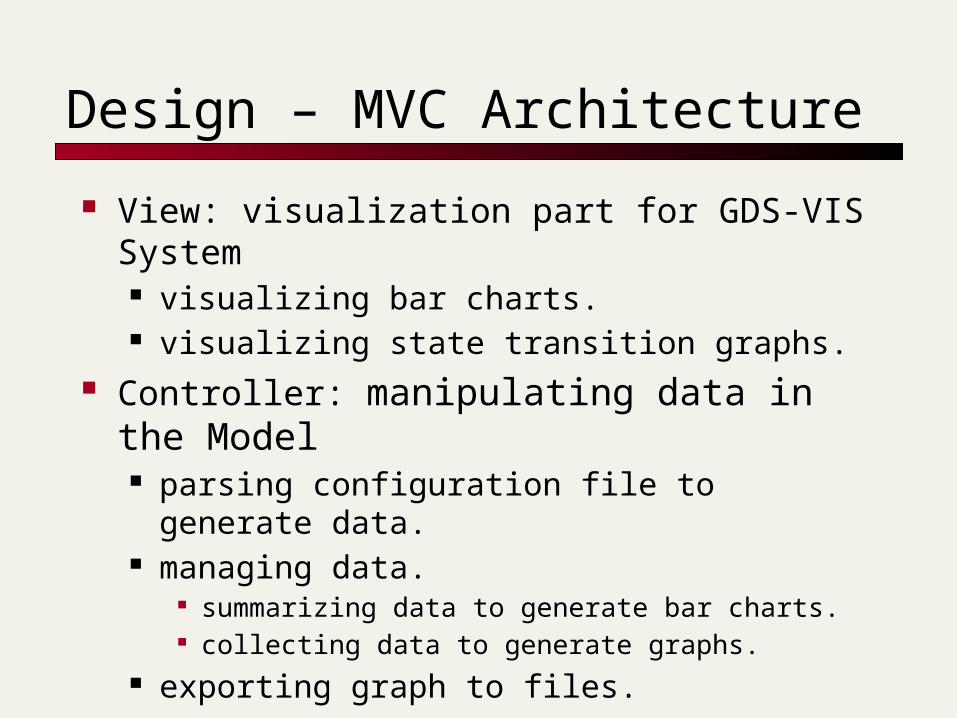
View: visualization part for GDS-VIS System visualizing bar charts. visualizing state transition graphs.
Controller: manipulating data in the Model parsing configuration file to generate data. managing data.
summarizing data to generate bar charts. collecting data to generate graphs.
exporting graph to files.
Design - Model
Model: data used in GDS-VIS system Permutation Node state Functional transition Cycle transition Functional equivalence Cycle equivalence
Implementation - Environment
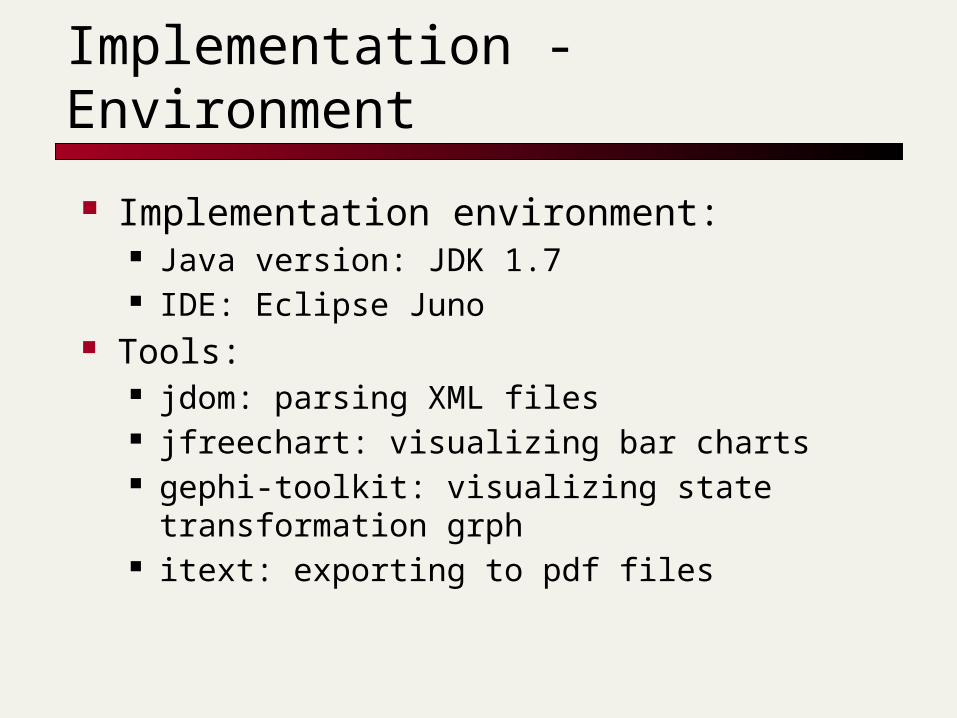
Implementation environment: Java version: JDK 1.7 IDE: Eclipse Juno
Tools: jdom: parsing XML files jfreechart: visualizing bar charts gephi-toolkit: visualizing state
transformation grph itext: exporting to pdf files
Implementation – Class diagram
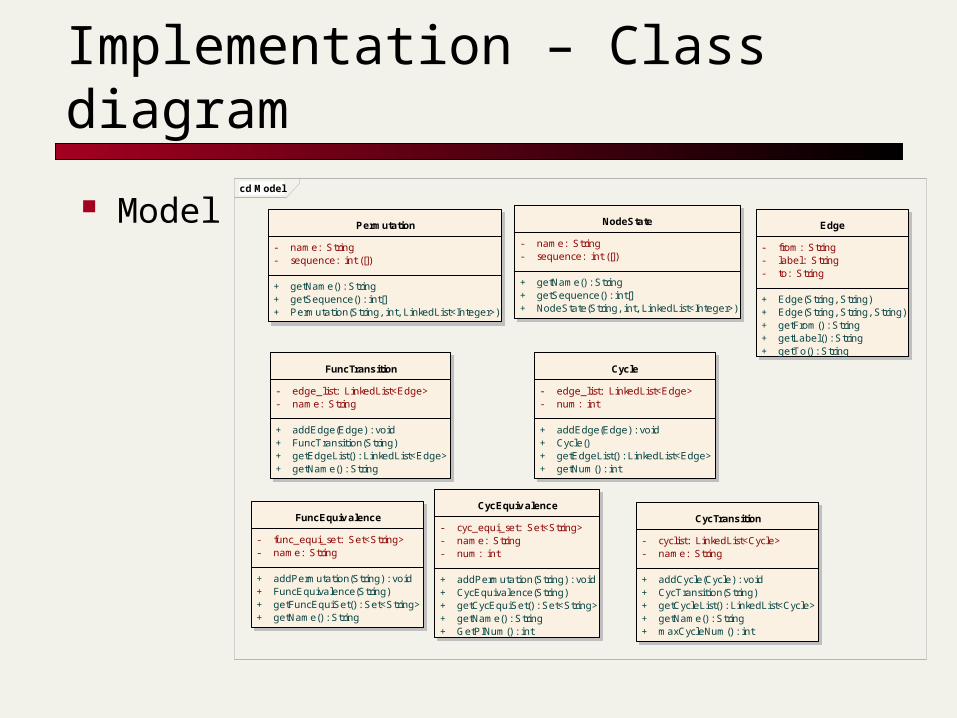
Model cd Model
CycEquiv alence
- cyc_equi_set: Set<String>- name: String- num: int
+ addPermutation(String) : void+ CycEquivalence(String)+ getCycEquiSet() : Set<String>+ getName() : String+ GetPINum() : int
Cycle
- edge_list: LinkedList<Edge>- num: int
+ addEdge(Edge) : void+ Cycle()+ getEdgeList() : LinkedList<Edge>+ getNum() : int
CycTransition
- cyclist: LinkedList<Cycle>- name: String
+ addCycle(Cycle) : void+ CycTransition(String)+ getCycleList() : LinkedList<Cycle>+ getName() : String+ maxCycleNum() : int
Edge
- from: String- label: String- to: String
+ Edge(String, String)+ Edge(String, String, String)+ getFrom() : String+ getLabel() : String+ getTo() : String
FuncEquiv alence
- func_equi_set: Set<String>- name: String
+ addPermutation(String) : void+ FuncEquivalence(String)+ getFuncEquiSet() : Set<String>+ getName() : String
FuncTransition
- edge_list: LinkedList<Edge>- name: String
+ addEdge(Edge) : void+ FuncTransition(String)+ getEdgeList() : LinkedList<Edge>+ getName() : String
NodeState
- name: String- sequence: int ([])
+ getName() : String+ getSequence() : int[]+ NodeState(String, int, LinkedList<Integer>)
Permutation
- name: String- sequence: int ([])
+ getName() : String+ getSequence() : int[]+ Permutation(String, int, LinkedList<Integer>)
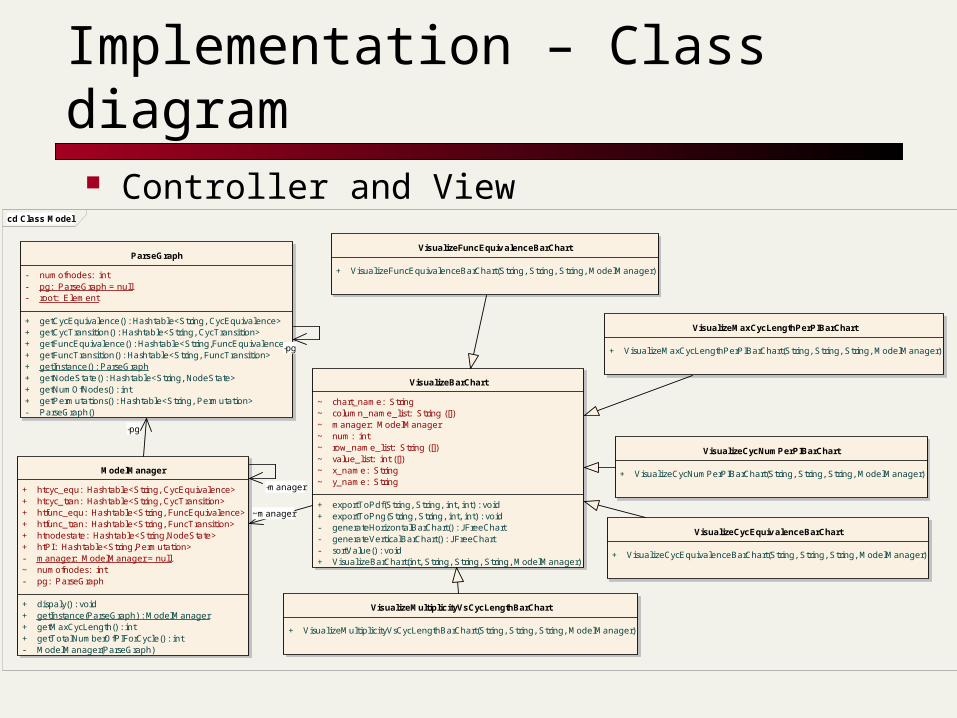
Implementation – Class diagram Controller and View
cd Class Model
ModelManager
+ htcyc_equ: Hashtable<String, CycEquivalence>+ htcyc_tran: Hashtable<String, CycTransition>+ htfunc_equ: Hashtable<String, FuncEquivalence>+ htfunc_tran: Hashtable<String, FuncTransition>+ htnodestate: Hashtable<String,NodeState>+ htPI: Hashtable<String,Permutation>- manager: ModelManager = null~ numofnodes: int- pg: ParseGraph
+ dispaly() : void+ getInstance(ParseGraph) : ModelManager+ getMaxCycLength() : int+ getTotalNumberOfPIForCycle() : int- ModelManager(ParseGraph)
ParseGraph
- numofnodes: int- pg: ParseGraph = null- root: Element
+ getCycEquivalence() : Hashtable<String, CycEquivalence>+ getCycTransition() : Hashtable<String, CycTransition>+ getFuncEquivalence() : Hashtable<String,FuncEquivalence>+ getFuncTransition() : Hashtable<String, FuncTransition>+ getInstance() : ParseGraph+ getNodeState() : Hashtable<String, NodeState>+ getNumOfNodes() : int+ getPermutations() : Hashtable<String, Permutation>- ParseGraph()
VisualizeBarChart
~ chart_name: String~ column_name_list: String ([])~ manager: ModelManager~ num: int~ row_name_list: String ([])~ value_list: int ([])~ x_name: String~ y_name: String
+ exportToPdf(String, String, int, int) : void+ exportToPng(String, String, int, int) : void- generateHorizontalBarChart() : JFreeChart- generateVerticalBarChart() : JFreeChart- sortValue() : void+ VisualizeBarChart(int, String, String, String, ModelManager)
VisualizeCycEquiv alenceBarChart
+ VisualizeCycEquivalenceBarChart(String, String, String, ModelManager)
VisualizeCycNumPerPIBarChart
+ VisualizeCycNumPerPIBarChart(String, String, String, ModelManager)
VisualizeFuncEquiv alenceBarChart
+ VisualizeFuncEquivalenceBarChart(String, String, String, ModelManager)
VisualizeMaxCycLengthPerPIBarChart
+ VisualizeMaxCycLengthPerPIBarChart(String, String, String, ModelManager)
VisualizeMultiplicityVsCycLengthBarChart
+ VisualizeMultiplicityVsCycLengthBarChart(String, String, String, ModelManager)
~manager
-pg
-pg
-manager
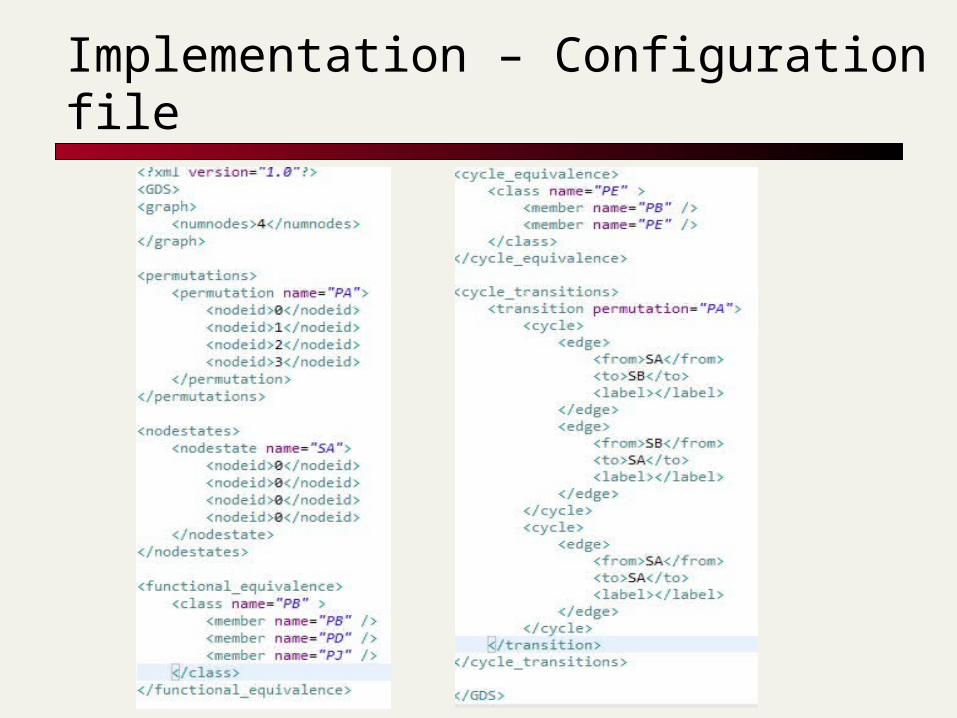
Implementation – Configuration file
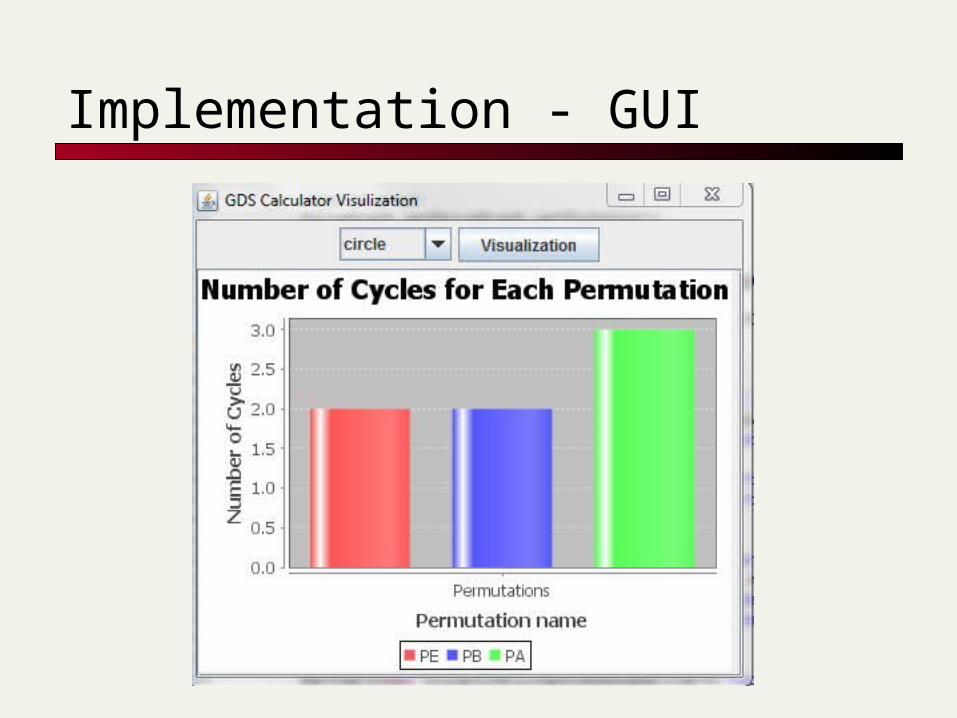
Implementation - GUI
Future work
Improving GUI implementation. Visualizing more statistical charts. Integrating with the CINET project.

Thanks