Embed Size (px)
Citation preview

1
WelcomeGreater Cincinnati/Northern Kentucky Apartment Association
2012 Apartment Market Overview2012 Apartment Market Overview
CBRE | Page 1

1
2012 Apartment Market
Distress Report / Capital Markets
Economic Fundamentals
Development Pipeline
Investment Market
Rents and Occupancies
Forecast for 2012
CBRE | Page 2
January 2011 January 2012
2012 Apartment MarketWhat a Difference a Year Makes
Average Temperature 26.1 Degrees 35.3 Degrees
January Snowfall 12.8 Inches 1.6 Inches
CBRE | Page 3
2
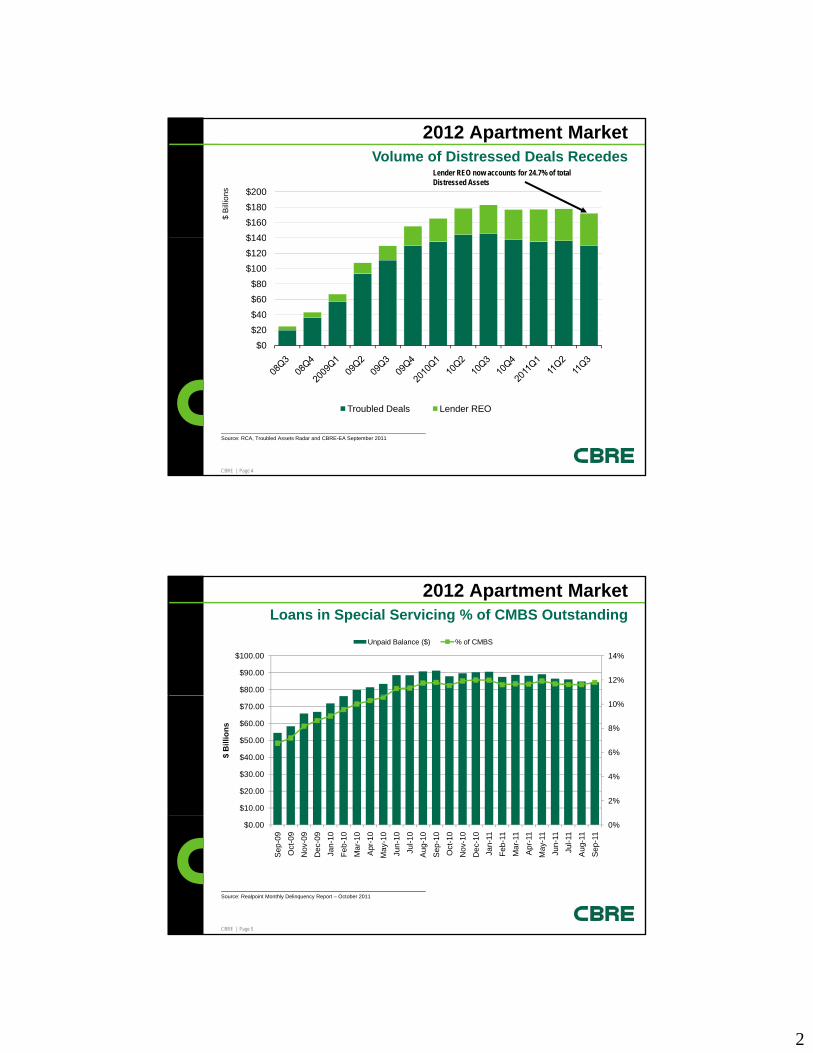
2012 Apartment MarketVolume of Distressed Deals Recedes
$140
$160
$180
$200
$ B
illio
ns
Lender REO now accounts for 24.7% of total Distressed Assets
$0
$20
$40
$60
$80
$100
$120
$140
CBRE | Page 4
Source: RCA, Troubled Assets Radar and CBRE-EA September 2011
Troubled Deals Lender REO
2012 Apartment MarketLoans in Special Servicing % of CMBS Outstanding
12%
14%
$80.00
$90.00
$100.00
Unpaid Balance ($) % of CMBS
2%
4%
6%
8%
10%
$10.00
$20.00
$30.00
$40.00
$50.00
$60.00
$70.00
$ B
illi
on
s
CBRE | Page 5
Source: Realpoint Monthly Delinquency Report – October 2011
0%$0.00
Se
p-0
9
Oct
-09
No
v-0
9
De
c-0
9
Jan
-10
Fe
b-1
0
Ma
r-1
0
Ap
r-1
0
Ma
y-1
0
Jun
-10
Jul-1
0
Au
g-1
0
Se
p-1
0
Oct
-10
No
v-1
0
De
c-1
0
Jan
-11
Fe
b-1
1
Ma
r-11
Ap
r-11
Ma
y-11
Jun
-11
Jul-1
1
Au
g-11
Se
p-1
1

3
Substantial Loan Maturities will OccurIn the next 5 years, total amount is estimated to be $1.7 Trillion
2012 Apartment Market
CBRE | Page 6
Source: CBRE Investors, Foresight Analytics 3Q 2010 Update
2012 Apartment MarketFreddie Mac 2010 & 2011 Earnings
MULTI-FAMILY IS STRONG
CBRE | Page 7
Source: Fannie Mae / Freddic Mac
3Q2011
4
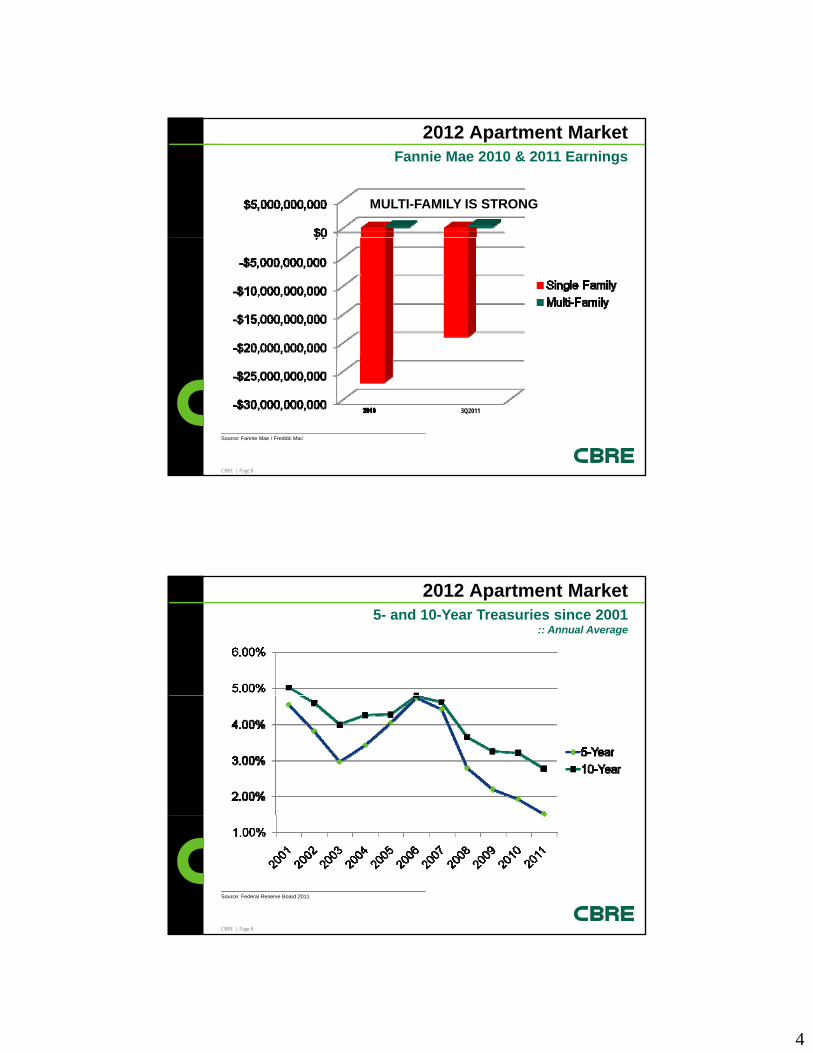
2012 Apartment MarketFannie Mae 2010 & 2011 Earnings
MULTI-FAMILY IS STRONG
CBRE | Page 8
Source: Fannie Mae / Freddic Mac
3Q2011
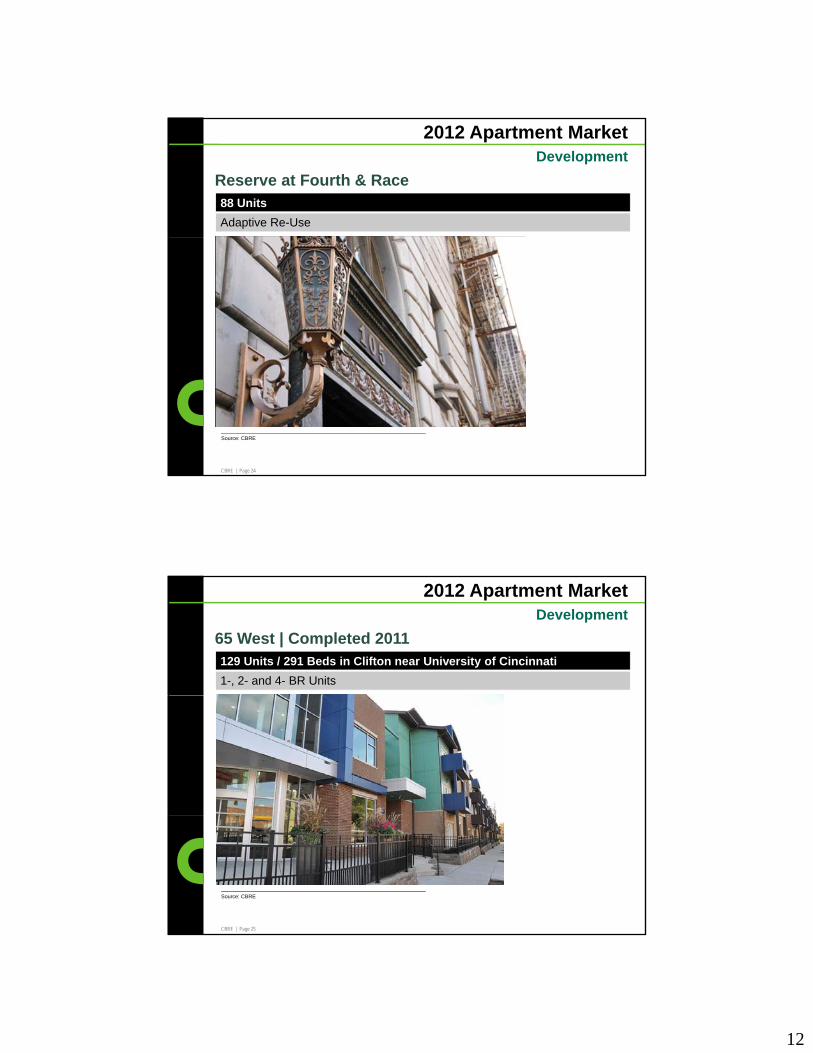
2012 Apartment Market5- and 10-Year Treasuries since 2001
:: Annual Average
CBRE | Page 9
Source: Federal Reserve Board 2011

5
2012 Apartment MarketKey Rates
:: Historical and Current
2/2006 2/2007 2/2008 2/2009 2/2010 2/2011 2/2012*
Prime Rate 7.50% 8.25% 6.00% 3.25% 3.25% 3.25% 3.25%
5-Year Treasuries 4.59% 4.68% 2.74% 1.87% 2.25% 2.33% 0.875%
10-Year Treasuries 4.60% 4.69% 3.68% 2.89% 3.63% 3.60% 2.00%
LIBOR (3-mo) 4.77% 5.36% 3.09% 1.24% 0.25% 0.31% 0.49%
CBRE | Page 10
*Source: Bloomberg.com as of 2/21/2012 @ 7:57 AM
2012 Apartment MarketHomeownership Rate is Likely to Continue Declining in 2012
38
40
42
69
70
71
Homeownership Rate, % Renter Households, Millions
22
24
26
28
30
32
34
36
61
62
63
64
65
66
67
68
CBRE | Page 11
Source: Bureau of the Census (Housing Vacancy Survey), CBRE Econometric Advisors, Q3 2011
2060
1965
1966
1967
1968
1969
1970
1971
1972
1973
1974
1975
1976
1977
1978
1979
1980
1981
1982
1983
1984
1985
1986
1987
1988
1989
1990
1991
1992
1993
1994
1995
1996
1997
1998
1999
2000
2001
2002
2003
2004
2005
2006
2007
2008
2009
2010
2011
2012
F
Homeownership Rate, % Renter Households, Millions

6
2012 Apartment MarketFannie Mae | Freddie Mac REO Inventory
CBRE | Page 12
Source: Fannie Mae / Freddic Mac
2012 Apartment MarketCincinnati MSA Housing Market
Number of Single Family Sales
30,000
35,000
10,000
15,000
20,000
25,000
CBRE | Page 13
Source: Cincinnati Board of Realtors & Northern Kentucky Association of Realtors
0
5,000
1998 1999 2000 2001 2002 2003 2004 2005 2006 2007 2008 2009 2010 2011

7
6.9% 7.2% 7.6%
9.9% 10.5%
8.0%
10.0%
12.0%
2012 Apartment MarketNational House Price Appreciation
:: House Price Appreciation Over Previous Four Quarters | USA(Seasonally Adjusted, Purchase-Only Index)
4.8%
‐0.2%
‐4.7%‐3.0%
‐3.7%
‐8.0%
‐6.0%
‐4.0%
‐2.0%
0.0%
2.0%
4.0%
6.0%
CBRE | Page 14
‐8.3%
‐12.0%
‐10.0%
Source: Federal Housing Finance Agency, Nov. 29, 2011 News Release
20
01
Q3
20
02
Q3
20
03
Q3
20
04
Q3
20
05
Q3
20
06
Q3
20
07
Q3
20
08
Q3
20
09
Q3
20
10
Q3
20
11
Q3
2012 Apartment MarketJobs – Statewide Unemployment Rate
:: Current / Low / High (Seasonally Adjusted)
Current* Low Year High Year
Nationwide 8.7%
Indiana 9.0% 2.6% 1999 12.7% 1983
Ohio 8.5% 3.8% 2001 13.8% 1983
Kentucky 9.4% 4.1% 2000 12.0% 1983
CBRE | Page 15
Source: Bureau of Labor Statistics
* As of November 2011p

8
2012 Apartment MarketGreater Cincinnati MSA Unemployment Rate
(Not Seasonally Adjusted)
CBRE | Page 16
Source: Bureau of Labor Statistics
2012 Apartment Market
10,000
20,000
Greater Cincinnati Net Job Growth
-40,000
-30,000
-20,000
-10,000
0
CBRE | Page 17
-50,000
,
De
c-02
De
c-03
De
c-04
De
c-05
De
c-06
De
c-07
De
c-08
De
c-09
De
c-10
De
c-11
201
2 Pro
j.
201
3 Pro
j.
201
4 Pro
j.
201
5 Pro
j.
201
6 Pro
j.Source: CBRE Econometric Advisors

9
2012 Apartment Market
6 9%
6.6%
Cleveland OH
Columbus, OH
Jobs | Local MSA Unemployment Rates(Not Seasonally Adjusted as of November 2011p)
8.0%
7.8%
7.2%
7.0%
6.9%
Springfield, OH
Cincinnati, OH
Akron, OH
Lexington, KY
Cleveland, OH
CBRE | Page 18
9.5%
8.3%
8.2%
Detroit, MI
Dayton, OH
Indianapolis, IN
Source: Bureau of Labor Statistics
2012 Apartment MarketCincinnati MSA Population Growth
9.1%
3.0%
8.9%
CBRE | Page 19
Source: CBRE

10
2012 Apartment MarketGreater Cincinnati Building Permits Issued
2011 Single Family Permits Issued: 2,4902011 Multi-Family Permits Issued: 743
CBRE | Page 20
Source: US Census
2012 Apartment MarketGreater Cincinnati Multi-Family Permits*
*Multi-Family Defined as 5+ Units
CBRE | Page 21
Source: US Census

11
2012 Apartment MarketGreater Cincinnati Multi-Family Units Built and Projected
CBRE | Page 22
Source: CBRE
2012 Apartment Market
Current @ The Banks | Completed 2011300 Units in Downtown Cincinnati
Studio, 1- and 2- BR Units | Average $1.80/SF Rents
Development
CBRE | Page 23
Source: CBRE
12
2012 Apartment MarketDevelopment
Reserve at Fourth & Race88 Units
Adaptive Re-Use
CBRE | Page 24
Source: CBRE
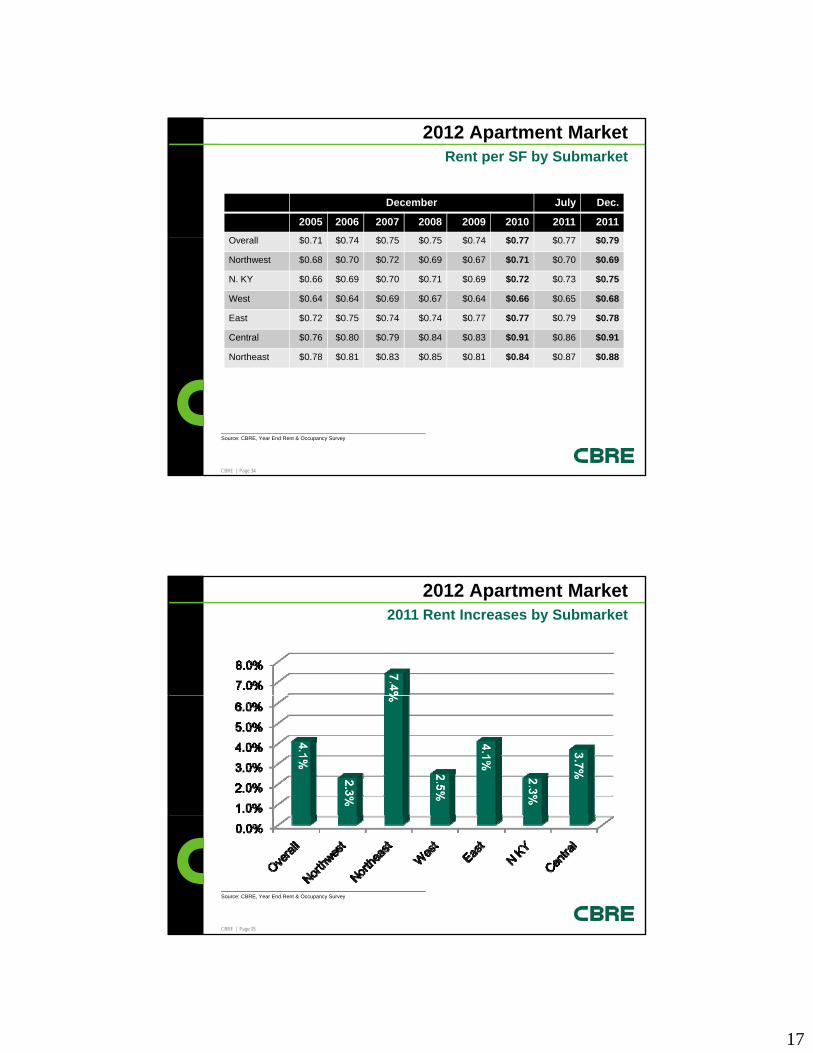
2012 Apartment MarketDevelopment
65 West | Completed 2011129 Units / 291 Beds in Clifton near University of Cincinnati
1-, 2- and 4- BR Units
CBRE | Page 25
Source: CBRE

13
2012 Apartment Market
Euclid SquareVine Street Flats
Development
36 Units on Short Vine
Opening September 2012
36 Units on Short Vine
Opening September 2012
Schiel School
CBRE | Page 26
Schiel School
Source: CBRE
102 Units on Short Vine
Opening September 2013
2012 Apartment MarketDevelopment
University Edge120 Units in Clifton
Opening September 2012
CBRE | Page 27
Source: CBRE

14
2012 Apartment MarketDevelopment
U Square at the Loop160 Units adjacent to UC Campus
Mixed Use
CBRE | Page 28
Source: CBRE
2012 Apartment MarketDevelopment
Palmera 360 Units at Butler-Warren Road & Bethany Road
1-, 2-, and 3-Bedroom Class “A+” Garden & TH Units
CBRE | Page 29
Source: CBRE

15
2012 Apartment MarketGreater Cincinnati Effective Rents
CBRE | Page 30
Source: CBRE, Year End Rent & Occupancy Survey
2012 Apartment MarketGreater Cincinnati Historical Occupancy
CBRE | Page 31
Source: CBRE, Year End Rent & Occupancy Survey

16
December July Dec.
2005 2006 2007 2008 2009 2010 2011 2011
2012 Apartment MarketRents & Occupancy | Overall Market
2005 2006 2007 2008 2009 2010 2011 2011
Occupancy 89.7% 90.9% 91.5% 90.6% 88.4% 91.8% 93.8% 93.1%
EffectiveRent
$637 $666 $680 $666 $675 $690 $709 $718
EffectiveRent Per SF
$0.71 $0.74 $0.75 $0.75 $0.74 $0.77 $0.77 $0.79
CBRE | Page 32
Source: CBRE, Year End Rent & Occupancy Survey
2012 Apartment MarketOccupancy by Submarket
December July Dec.
2005 2006 2007 2008 2009 2010 2011 2011
O ll 89 7% 90 9% 91 5% 90 6% 88 4% 91 8% 93 8% 93 1%Overall 89.7% 90.9% 91.5% 90.6% 88.4% 91.8% 93.8% 93.1%
Northwest 90.8% 90.4% 90.1% 89.0% 87.8% 91.0% 93.2% 91.9%
N. KY 91.3% 92.8% 93.9% 91.1% 88.0% 92.2% 94.2% 94.1%
West 82.3% 89.2% 89.0% 87.1% 84.8% 89.9% 90.7% 91.3%
East 91.0% 91.2% 91.7% 92.8% 90.8% 92.7% 94.3% 93.5%
Central 89.5% 89.4% 90.1% 90.5% 88.4% 90.3% 93.7% 91.6%
Northeast 90 3% 91 6% 93 2% 92 9% 89 8% 93 5% 95 1% 94 9%
CBRE | Page 33
Source: CBRE, Year End Rent & Occupancy Survey
Northeast 90.3% 91.6% 93.2% 92.9% 89.8% 93.5% 95.1% 94.9%
17
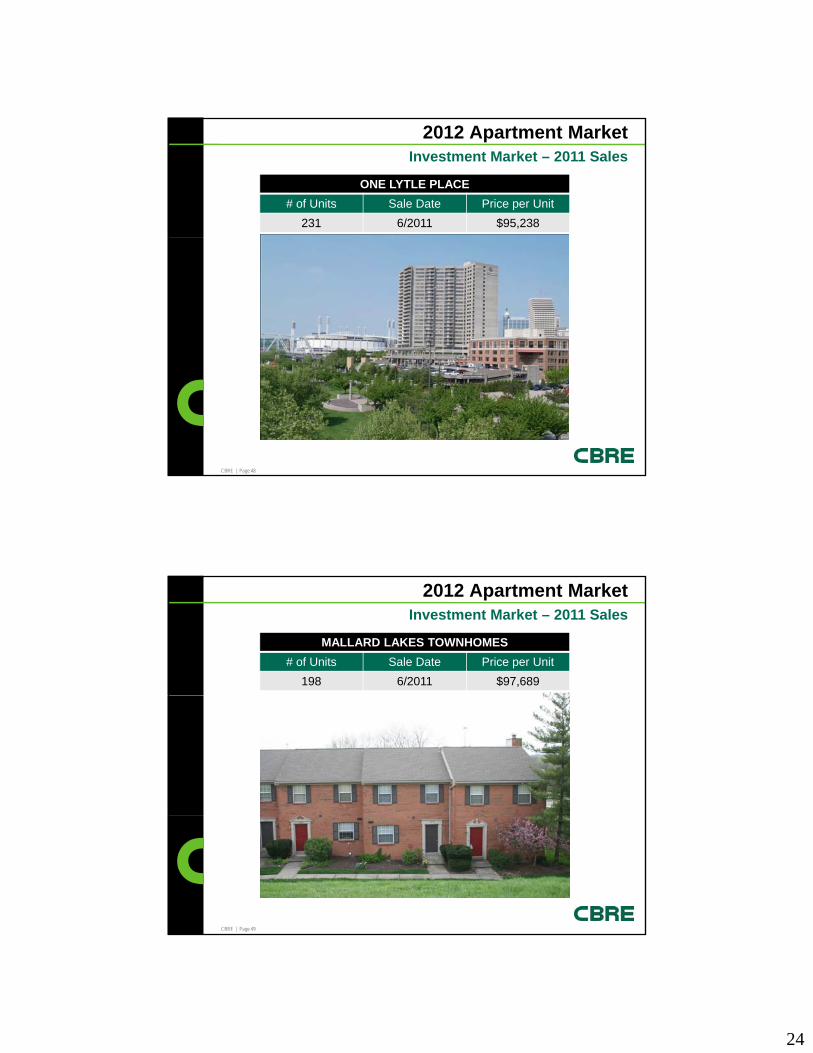
2012 Apartment MarketRent per SF by Submarket
December July Dec.
2005 2006 2007 2008 2009 2010 2011 2011
O ll $0 71 $0 74 $0 75 $0 75 $0 74 $0 77 $0 77 $0 79Overall $0.71 $0.74 $0.75 $0.75 $0.74 $0.77 $0.77 $0.79
Northwest $0.68 $0.70 $0.72 $0.69 $0.67 $0.71 $0.70 $0.69
N. KY $0.66 $0.69 $0.70 $0.71 $0.69 $0.72 $0.73 $0.75
West $0.64 $0.64 $0.69 $0.67 $0.64 $0.66 $0.65 $0.68
East $0.72 $0.75 $0.74 $0.74 $0.77 $0.77 $0.79 $0.78
Central $0.76 $0.80 $0.79 $0.84 $0.83 $0.91 $0.86 $0.91
Northeast $0 78 $0 81 $0 83 $0 85 $0 81 $0 84 $0 87 $0 88
CBRE | Page 34
Source: CBRE, Year End Rent & Occupancy Survey
Northeast $0.78 $0.81 $0.83 $0.85 $0.81 $0.84 $0.87 $0.88
2012 Apartment Market2011 Rent Increases by Submarket
CBRE | Page 35
Source: CBRE, Year End Rent & Occupancy Survey

18
2012 Apartment MarketVacancy vs. Rent Inflation
CBRE | Page 36
Source: CBRE, Year End Rent & Occupancy Survey
Dec ‘0
1
Dec ‘0
2
Dec ‘0
3
Dec ‘0
4
Dec ‘0
5
Dec ‘0
6
Dec ‘0
7
Dec ‘0
8
Dec ‘0
9
Dec ‘1
0
Dec ‘1
1
2012 Apartment Market
Percentage of Properties
Offering Concessions:
Avg. Monthly Concessions
by Style:
Greater Cincinnati Concession Summary
December 2010 2011
Efficiency $25 $27
1 Bedroom $48 $43
2 Bedroom $57 $51
31%
40%
36%
25%
CBRE | Page 37
3 Bedroom $72 $50
2008 2009 2010 2011
Source: CBRE, Year End Rent & Occupancy Survey

19
2012 Apartment Market
$400
$600
$800
1 Bedroom / 1 Bath Effective Rents by Submarket
$0
$200
$400
2007 2008 2009 2010 2011
East $555 $549 $569 $579 $586
West $461 $454 $445 $439 $449
CBRE | Page 38
Source: CBRE, Year End Rent & Occupancy Survey
N. East $676 $701 $649 $664 $744
N. West $561 $549 $539 $548 $566
Central $572 $577 $610 $672 $652
N. Ky. $552 $564 $551 $569 $600
Overall $569 $566 $573 $601 $612
2012 Apartment Market2 Bedroom / 1 Bath Effective Rents by Submarket
$400
$600
$800
$0
$200
$400
2007 2008 2009 2010 2011
East $558 $566 $609 $587 $590
West $544 $526 $499 $530 $542
CBRE | Page 39
Source: CBRE, Year End Rent & Occupancy Survey
N. East $739 $719 $660 $694 $704
N. West $612 $624 $618 $610 $637
Central $653 $660 $683 $651 $699
N. Ky. $603 $594 $587 $600 $639
Overall $624 $604 $599 $606 $631

20
2012 Apartment Market
$600
$900
$1,200
2 Bedroom / 2 Bath Effective Rents by Submarket
$0
$300
$600
2007 2008 2009 2010 2011
East $794 $819 $818 $825 $856
West $694 $642 $734 $697 $701
CBRE | Page 40
Source: CBRE, Year End Rent & Occupancy Survey
N. East $887 $926 $879 $901 $952
N. West $778 $785 $733 $724 $763
Central $940 $987 $980 $1,181 $1,120
N. Ky. $759 $758 $763 $783 $805
Overall $831 $849 $822 $850 $888
2012 Apartment Market
$900
$1,200
3 Bedroom Effective Rents by Submarket
$0
$300
$600
2007 2008 2009 2010 2011
East $757 $780 $848 $851 $856
West $783 $732 $654 $735 $770
CBRE | Page 41
Source: CBRE, Year End Rent & Occupancy Survey
N. East $1,289 $1,199 $1,089 $1,243 $1,253
N. West $807 $846 $839 $852 $849
Central $1,001 $981 $864 $975 $963
N. Ky. $752 $756 $844 $913 $848
Overall $919 $927 $904 $897 $913

21
2012 Apartment Market
$250,000,000
$300,000,000
Greater Cincinnati Multi-Housing Sales Volume
$50 000 000
$100,000,000
$150,000,000
$200,000,000
CBRE | Page 42
$0
$50,000,000
Source: CBRE
2012 Apartment MarketApartment Units Sold in Greater Cincinnati
5,422 5,210
6,450
5,450
6,819
5,1015,443
4,5984,293
2,0442,346
CBRE | Page 43
2001 2002 2003 2004 2005 2006 2007 2008 2009 2010 2011
Source: CBRE

22
2012 Apartment MarketMarket Activity is a “Barbell”
UNDER $20K PER UNIT OVER $50K PER UNIT
967 Units
$45 Million
1,575 Units
$112 Million
2,901 Units
$35 Million
CBRE | Page 44
Source: CBRE
2012 Apartment Market
$50,000
$60,000
Average Price Per Unit
$10,000
$20,000
$30,000
$40,000
CBRE | Page 45
$0
Source: CBRE

23
LAKOTA LAKE(FKA: WOODBRIDGE ON THE LAKE)
# of Units Sale Date
492 1/2011
2012 Apartment MarketInvestment Market – 2011 Sales
492 1/2011
CBRE | Page 46
BAVARIAN WOODS / RENATA / FERNCREST / PARK VALLEY
# of Units Sale Date Price per Unit
806 6/2011 $12,775
2012 Apartment MarketInvestment Market – 2011 Sales
CBRE | Page 47
24
ONE LYTLE PLACE
# of Units Sale Date Price per Unit
231 6/2011 $95,238
2012 Apartment MarketInvestment Market – 2011 Sales
CBRE | Page 48
MALLARD LAKES TOWNHOMES
# of Units Sale Date Price per Unit
198 6/2011 $97,689
2012 Apartment MarketInvestment Market – 2011 Sales
CBRE | Page 49

25
GRANDVIEW SUMMIT
# of Units Sale Date Price per Unit
192 8/2011 $91,667
2012 Apartment MarketInvestment Market – 2011 Sales
CBRE | Page 50
REMINGTON PLACE
# of Units Sale Date Price per Unit
234 10/2011 $53,419
2012 Apartment MarketInvestment Market – 2011 Sales
CBRE | Page 51

26
MAYRIDGE / LAFEUILLE / WESTBROOK
# of Units Sale Date Price per Unit
393 3/2011 – 10/2011 $16,349
2012 Apartment MarketInvestment Market – 2011 Sales
CBRE | Page 52
TIMBER HOLLOW
# of Units Sale Date Price per Unit
368 11/2011 $63,859
2012 Apartment MarketInvestment Market – 2011 Sales
CBRE | Page 53

27
2012 Apartment Market2008-2010 Cap Rates
CBRE | Page 54
Source: CBRE
2012 Apartment Market2008-2011 Cap Rates
CBRE | Page 55
Source: CBRE

28
2012 Apartment Market
Effective rents will increase 3.0%
Most new units will be “purpose-built”
Occupancy will be 93.5% at mid-year and remain
Recap of Dave’s 2011 Forecast
steady through year end
Cap rates will remain steady for “A” and “B-”grade assets. Class “C” cap rates will rise
Energy/Resource Cost Control will move to the forefront
CBRE | Page 56
2012 Apartment Market
Effective rents will increase 2.5%
Occupancy will remain above 93.0% and climb to 95.0%
2012 Forecast
Development pipeline will accelerate, weighted toward in-fill
Sale market will be active; At least $250 Million in trades
CBRE | Page 57

29
2012 Apartment Market
Dave Lockard, CCIMFirst Vice President
Steve LaMotte, Jr., CCIMSenior Vice President
Dane Wilson Senior Associate
Indianapolis-Cincinnati Multi-Housing Group
David EnglertFinancial Analyst
Emily CantleySales Assistant
Carrie BallardClient Services Specialist
CBRE | Page 58
2012 Apartment Market
To download a copy of today’s presentation, please visit our team website at:
b / h i
For more information
• www.cbre.com/mhgic –“Market Reports & Rent Surveys” Tab
If you would like to receive a hardcopy of the presentation please email:
CBRE | Page 59