Embed Size (px)
Citation preview
AMARDEEP SINGH – ENERGY MANAGER [email protected]
SANJEEV JAHAGIRDAR – MANAGER OPERATIONS [email protected]
CII NATIONAL AWARD FOR EXCELLENCE IN ENERGY MANAGEMENT 2017
JSW STEEL COATED PRODUCTS LTD, TARAPUR WORKS

JSW GROUP

PROCESS FLOWCHART & PLANT FACILITIES
Hot RollingHR Slitter,
PicklingCold Rolling
Galvanizing,
Galvalume Color Coating
Finishing(Cut to length,
Profiling)
TARAPUR
PLANT
FACILITIES
COLD ROLLING GALVANIZING / COLOR COATING CAPTIVE POWER PLANTGALVALUME
0.72 MTPA 0.761 MTPA 0.276 MTPA 30 MW

ENERGY CONSERVATION PROJECTS - I
Sr. No.
Energy Conservation Measures Financial Year
Annual Energy SavingAnnual Saving
Investment
Electricity(Lakh kWh)
Thermal(M kCal)
Rs Lakhs Rs Lakhs
1 Optimization of Induction Oven Cooling Blower at CSD3 13-14 2.11 - 9.76 Nil
2Conversion of Delta Operated Motor to Star Connection (below 5.0 HP)
14-15 0.17 - 0.78 Nil
3 Power Factor Improvement of Captive Power Plant 15-16 2.64 - 13.25 Nil
4Switching off AC Cooling Tower & Connecting with Main CT at TM5
16-17 0.64 - 3.68 Nil
Total 13 - 17 5.56 - 27.47 Nil

ENERGY CONSERVATION PROJECTS - II
Sr. No. Energy Conservation Measures
Financial Year
Annual Energy SavingAnnual Saving
Investment & ROI
Electricity(Lakh kWh)
Thermal(M kCal)
Rs Lakhs Rs Lakhs Months
1 Replacement of Old Pumps by Efficient Pumps – 2 Nos 13-14 0.38 - 1.74 5 34
2 Destagging of Boiler Feed Pump at CPP 14-15 6.76 - 31.24 5 2
3 Corrocoating of Circulating Cooling Water pump at CPP 15-16 0.79 - 3.79 4 12
4 Covering of Zinc pot Surface in CSD Lines to Avoid Heat Loss 15-16 0.90 - 4.52 0.5 1
5 Operation of Color Coating Line Compressor in Closed Loop 15-16 2.27 - 11.39 0.5 1
6 Replacement of Old Pumps by Efficient Pumps – 2 Nos 15-16 5.85 - 29.37 4 2
7Optimization of Cooling Blower in CSD-5 by Installation of Pyrometer
16-17 3.40 - 19.58 5 3
8Installation of Quench Tank & Optimization of Cooling Blower in CSD-2
16-17 3.09 - 17.80 5 3
9 VFD Installation in Agitator Motor at TM2 16-17 0.16 - 0.92 2 6
10 Optimization of CCL Cooling Tower Pump by Installing of VFD 16-17 1.31 - 7.54 4 6
11 Operation of Captive Power Plant Cooling Tower Fan by VFD 16-17 4.18 - 23.84 5 3
Total 13-17 29.09 - 151.73 40 3

ENERGY CONSERVATION PROJECTS - III
Sr. No.
Energy Conservation MeasuresFinancial
Year
Annual Energy SavingAnnual Saving
Investment & ROI
Electricity(Lakh kWh)
Thermal(M kCal)
Rs Lakhs Rs Lakhs Months
1 VFD Installation in cold well pump at CSD3 13-14 4.41 - 20.37 6 4
2 VFD Installation in cold well pump at CCL 13-14 0.68 - 3.13 6 23
3 LED Light Replacement – 238 Nos 13-14 0.21 - 0.96 10 125
4 Replacement of Old COT pump by Efficient pump 14-15 4.33 - 20.01 10 6
5 Provision of VFD in PA Fan 14-15 0.19 - 0.87 6 83
6 Replacement of Conventional lights by LED lights 15-16 1.02 - 5.15 9 21
7 Replacement of Conventional lights by LED lights 16-17 1.30 - 6.23 10 19
8 Installed VFD in Coolant pump in Cold Rolling Mill - 4 16-17 2.42 - 13.79 6 5
9 Installed VFD in Coolant pump in Cold Rolling Mill - 5 16-17 3.05 - 17.39 6 4
10 Installed VFD in Coolant pump in Cold Rolling Mill - 6 16-17 2.65 - 15.08 6 5
Total 13-17 20.26 - 102.98 75 9
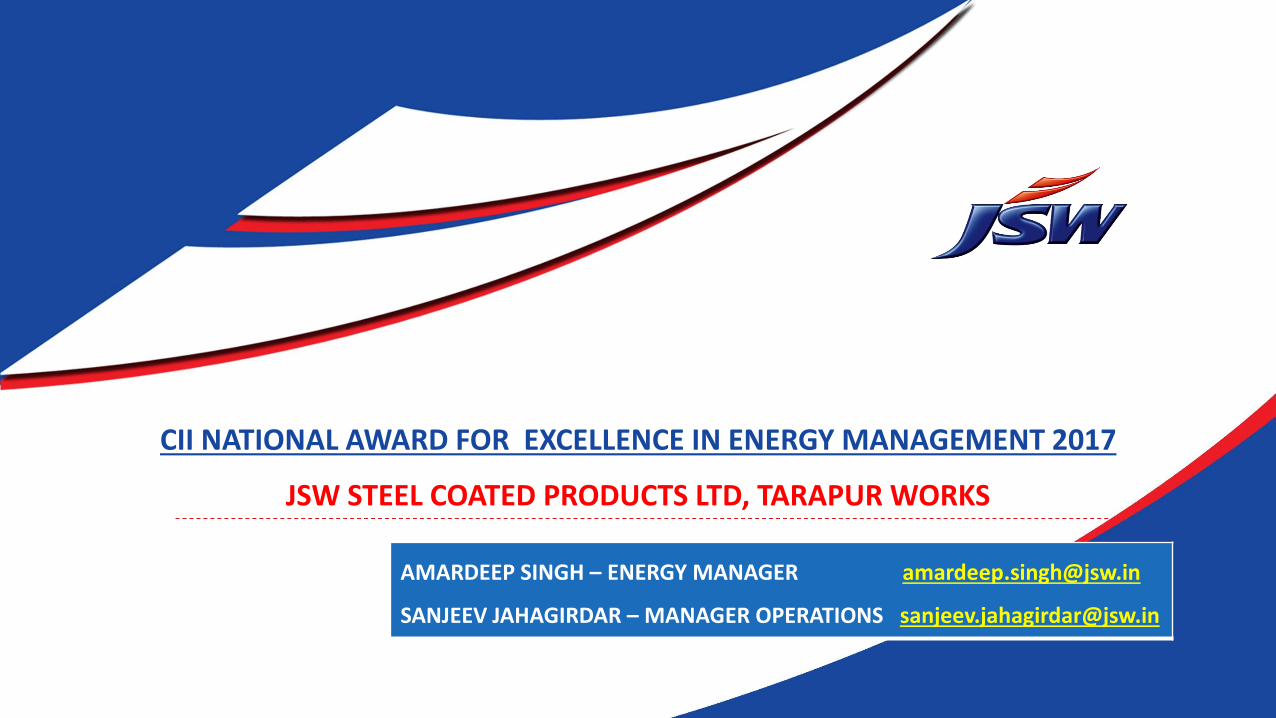
ENERGY CONSERVATION PROJECTS - IV
Sr. No.
Energy Conservation MeasuresFinancial
Year
Annual Energy SavingAnnual Saving
Investment & ROI
Electricity(Lakh Kwh)
Thermal(M Kcal)
Rs Lakhs Rs Lakhs Months
1Replacement of Conventional Lighting by LED Lights -503 Nos 14-15 0.44 2.05 30 178
2Replacement of Water Cooled Hearth roll in Furnace by Ceramic Roll 14-15 439 14.80 22 18
3Replacement of Ceramic Fiber Lining by Pyro bloc Module in CSD-3 Non-Ox Furnace 15-16 1381.1 37.93 22 7
4Technology Up gradation & Redesigning of CSD-1 Furnace 15-16 15.66 3864.7 184.71 446 29
5Variable Frequency Drive Installation in Boiler Feed Pump 15-16 11.86 59.53 60 12
6Replacement of Water Cooled Hearth Roll in Furnace by Ceramic Roll 16-17 1708.6 35.60 22 7
Total 13-17 27.96 7393.4 334.62 602 22
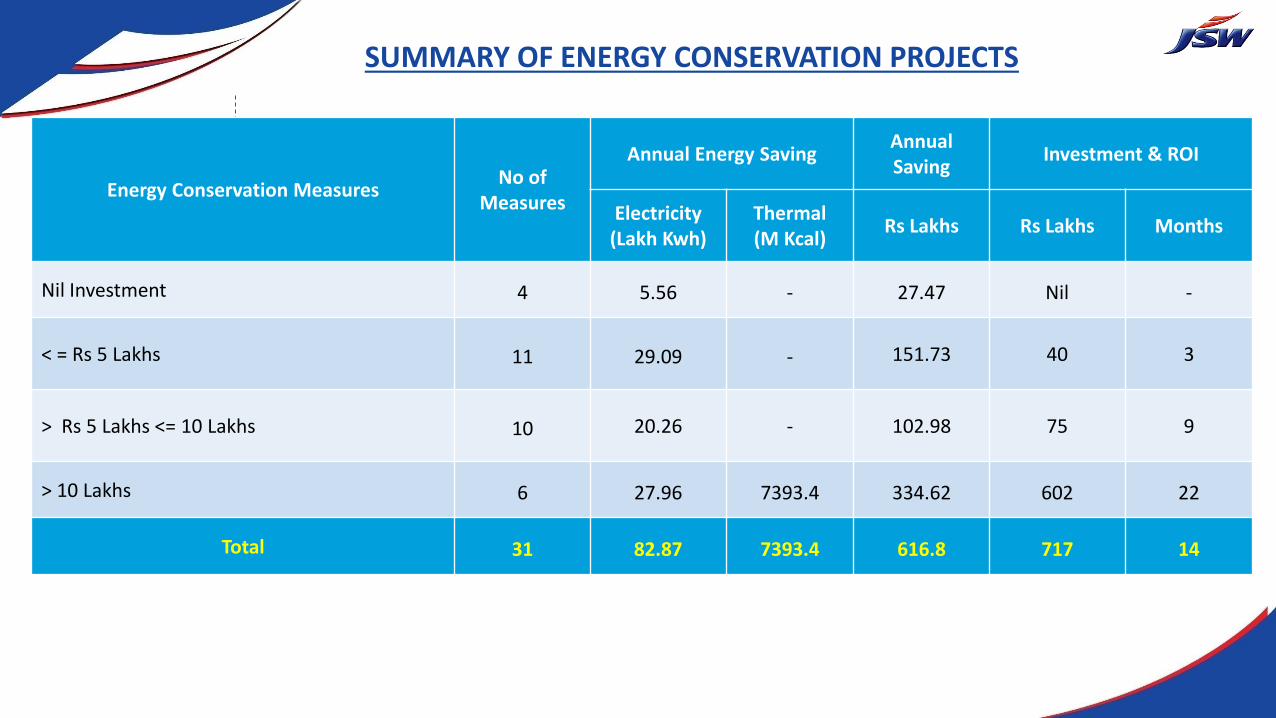
SUMMARY OF ENERGY CONSERVATION PROJECTS
Energy Conservation MeasuresNo of
Measures
Annual Energy SavingAnnual Saving
Investment & ROI
Electricity(Lakh Kwh)
Thermal(M Kcal)
Rs Lakhs Rs Lakhs Months
Nil Investment 4 5.56 - 27.47 Nil -
< = Rs 5 Lakhs 11 29.09 - 151.73 40 3
> Rs 5 Lakhs <= 10 Lakhs 10 20.26 - 102.98 75 9
> 10 Lakhs 6 27.96 7393.4 334.62 602 22
Total 31 82.87 7393.4 616.8 717 14

PLANT ENERGY CONSUMPTION & ABSOLUTE SAVINGS
Plant Energy Consumption
Energy Unit
Financial Year
2014-15 2015-16 2016-17
Electricity Consumption Lakh kWh 1793.04 1671.08 1701.72
Electricity Energy Saving Lakh kWh 11.89 40.99 22.29
% Electricity Energy Saving % 0.66 2.45 1.31
Thermal Consumption Million kCal 210393 234998 224100
Thermal Energy Saving Million kCal 439 5245.67 1708.6
% Thermal Energy Saving % 0.21 2.23 0.76
0.66
2.45
1.31
% Electrical Energy Saving
0.21
2.23
0.76
% Thermal Energy Saving

SPECIFIC ENERGY CONSUMPTION
Parameter Unit FY 2014-15 FY 2015-16 FY 2016-17% Reduction
FY 2015-16 FY 2016-17
Coated Production MT 696460 616735 672442 - -
Utilization % 91.52 81.04 88.36 10.48 % 3.16%
Electrical SEC Kwh/MT 231.90 225.59 223.88 2.72 % 3.45%
Thermal SEC Million Kcal/MT 0.3374 0.3359 0.3265 0.44 % 3.23%
231.9
225.59223.88
215
220
225
230
235
FY 2014-15 FY 2015-16 FY 2016-17
Electrical Energy SEC
0.33740.3359
0.3265
0.32
0.33
0.33
0.34
0.34
FY 2014-15 FY 2015-16 FY 2016-17
Thermal Energy SEC

BENCHMARKING – ENERGY CONSUMPTION (JSW PLANTS)
213.88
165.35 165.57
0
50
100
150
200
250
Tarapur Vasind Kalmeshwar
Plant Electricity Energy Consumption (kWh/t)
0.276
0.295
0.286
0.26
0.27
0.28
0.29
0.30
Tarapur Vasind Kalmeshwar
Plant Thermal Energy Consumption (Gcal/t)
130.77
101.37 92.56
0
50
100
150
Tarapur Vasind Kalmeshwar
CRM Electricity Energy Consumption (kWh/t) 89.02
77.665.34
0
20
40
60
80
100
Tarapur Vasind Kalmeshwar
CSD Electricity Energy Consumption (kWh/t)

BENCHMARKING CHALLENGES
COLD ROLLING MILL – (% REDUCTION)
ThicknessProduction Reduction
Power ConsumptionInput Output
mm mm MT % kWh/t
2.2 0.317 400 85.6 147.78
2.6 0.899 400 65.4 113.57
GALVANIZING / GALVALUME LINE - (RATIO)
Material
OutputThickness
Width ProductionPower
Consumption
mm mm MT kWh/t
Galvanizing 0.696 1000 200 93.83
Galvalume 0.696 1000 200 138.42
GALVANIZING / GALVALUME LINE – (PRODUCT MIX)
Material
Output Thickness
Width ProductionThermal
Consumption
mm mm MT mmbtu/t
Hard 0.50 1000 200 0.581
Soft 0.50 1000 200 0.769
Structural 0.50 1000 200 0.973
COLOR COATING LINE – (PAINT VOC)
Paint Coating
Output Thickness
Paint Qty
ProductionThermal
Consumption
mm Ltr MT mmbtu/t
Coating -1 0.38 18500 1000 0.650
Coating- 2 0.38 17000 1000 0.679
Coating - 1(Without RTO) 0.38 18500 1000 1.000
Grade of Material Thickness & Width Color Change Utilization Product Mix in Color Coating Line
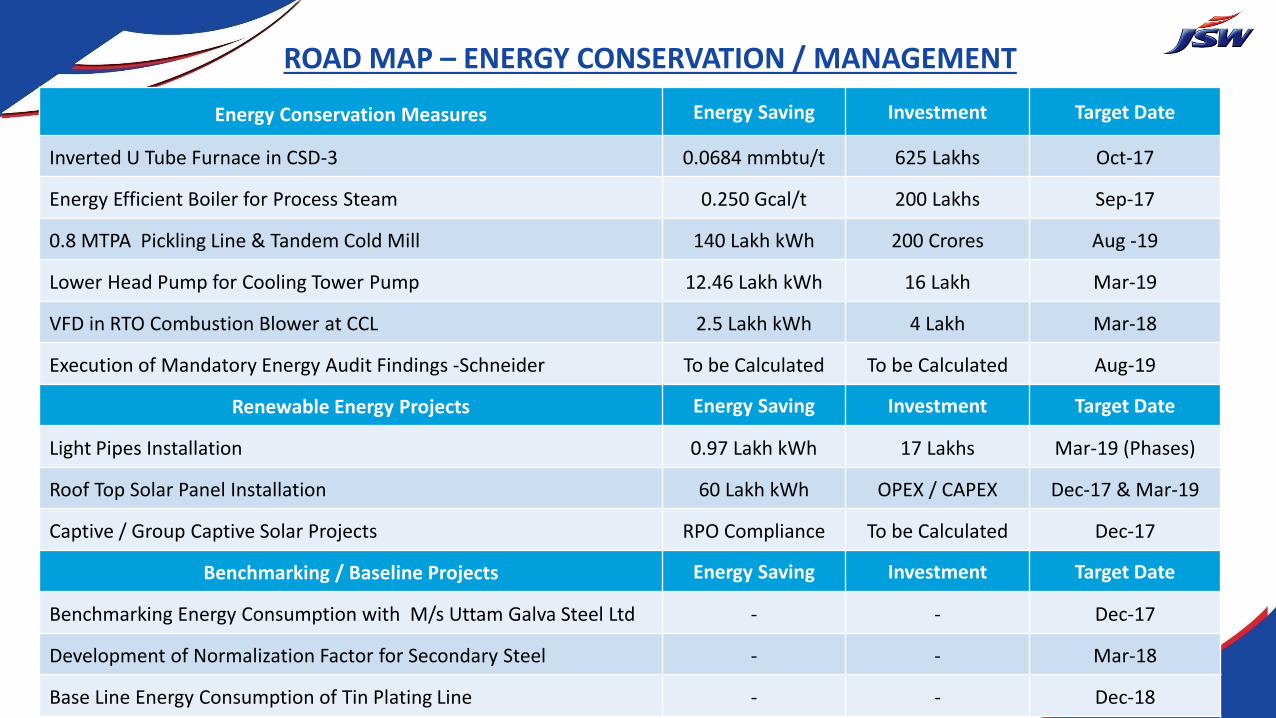
ROAD MAP – ENERGY CONSERVATION / MANAGEMENT
Energy Conservation Measures Energy Saving Investment Target Date
Inverted U Tube Furnace in CSD-3 0.0684 mmbtu/t 625 Lakhs Oct-17
Energy Efficient Boiler for Process Steam 0.250 Gcal/t 200 Lakhs Sep-17
0.8 MTPA Pickling Line & Tandem Cold Mill 140 Lakh kWh 200 Crores Aug -19
Lower Head Pump for Cooling Tower Pump 12.46 Lakh kWh 16 Lakh Mar-19
VFD in RTO Combustion Blower at CCL 2.5 Lakh kWh 4 Lakh Mar-18
Execution of Mandatory Energy Audit Findings -Schneider To be Calculated To be Calculated Aug-19
Renewable Energy Projects Energy Saving Investment Target Date
Light Pipes Installation 0.97 Lakh kWh 17 Lakhs Mar-19 (Phases)
Roof Top Solar Panel Installation 60 Lakh kWh OPEX / CAPEX Dec-17 & Mar-19
Captive / Group Captive Solar Projects RPO Compliance To be Calculated Dec-17
Benchmarking / Baseline Projects Energy Saving Investment Target Date
Benchmarking Energy Consumption with M/s Uttam Galva Steel Ltd - - Dec-17
Development of Normalization Factor for Secondary Steel - - Mar-18
Base Line Energy Consumption of Tin Plating Line - - Dec-18

INNOVATIVE PROJECTS - I
REPLACEMENT OF WATER COOLED HEARTH ROLL BY NON WATER COOLED CERAMIC ROLL – 2 Nos
Hearth Roll are used in Non Ox Furnace to support the sheet. To cool the temperature of the Hearth Roll, water is passed through it.
Water Flow through the Hearth Roll is 36m3/Hr. Temperature Gain of water across the Hearth Roll is 6 Deg C.
Vendor Sandvik Asia suggested APM Technique based Non water cooled ceramic roll for this application.
Hearth RollWater Inlet
Water Outlet
Non Ox Furnace
Furnace Temp – 1025oC
Fuel Consumption Annual Fuel Saving
Annual Saving
Investment ROIBefore After
mmbtu mmbtu mmbtu Rs Lakhs Rs Lakhs Months
6780 0 6780 35.6 22 7
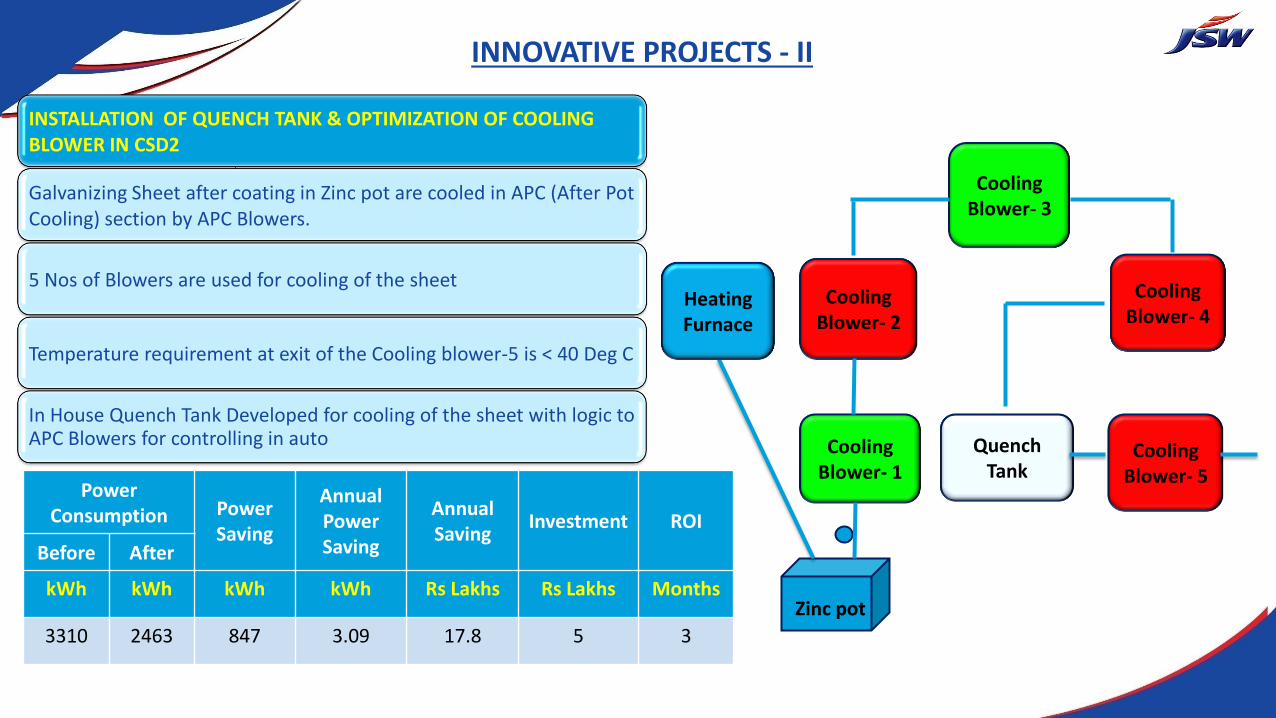
INNOVATIVE PROJECTS - II
Cooling Blower- 1
Cooling Blower- 3
Quench Tank
Cooling Blower- 4
Cooling Blower- 5
Cooling Blower- 2
Heating Furnace
Zinc pot
INSTALLATION OF QUENCH TANK & OPTIMIZATION OF COOLING BLOWER IN CSD2
Galvanizing Sheet after coating in Zinc pot are cooled in APC (After Pot Cooling) section by APC Blowers.
5 Nos of Blowers are used for cooling of the sheet
Temperature requirement at exit of the Cooling blower-5 is < 40 Deg C
In House Quench Tank Developed for cooling of the sheet with logic to APC Blowers for controlling in auto
PowerConsumption Power
Saving
Annual Power Saving
Annual Saving
Investment ROI
Before After
kWh kWh kWh kWh Rs Lakhs Rs Lakhs Months
3310 2463 847 3.09 17.8 5 3

TECHNOLOGY UPGRADATION – NON Ox FURNACE (CSD-1)
Parameter Before After
Non Ox Section
Capacity 12 TPH 16.5 TPH
Furnace Type Direct Heating Non Ox
Firing Control On/Off Ratio Control
Zone Temp Control Zone Temp Strip Temp
Recuperator NA Yes
Exhaust Blower DOL VFD
Combustion Blower DOL VFD
Non water cooled Roll 0 4
RTF Section
Firing Control On/Off Pulse Firing
Zone Temp Control Zone Temp Strip Temp
Soaking Section
Zone Temp Control NA Strip Temp
Energy Consumption
Power Consumption 55 kwh/t 40.5 kwh/t
Thermal Consumption 0.65 mmbtu/t 0.508 mmbtu/t
DHF RTF SOAKING JET COOLER
NON OX RTF SOAKING JET COOLER
Pyrometer Pyrometer Pyrometer Pyrometer
Pyrometer
Low Furnace Temp resulted in less production. Old Technology
Line Speed increased to 150 mpm by upgrading the Direct Heating Furnace with other energy saving measures.
750 Deg C
1000 Deg C
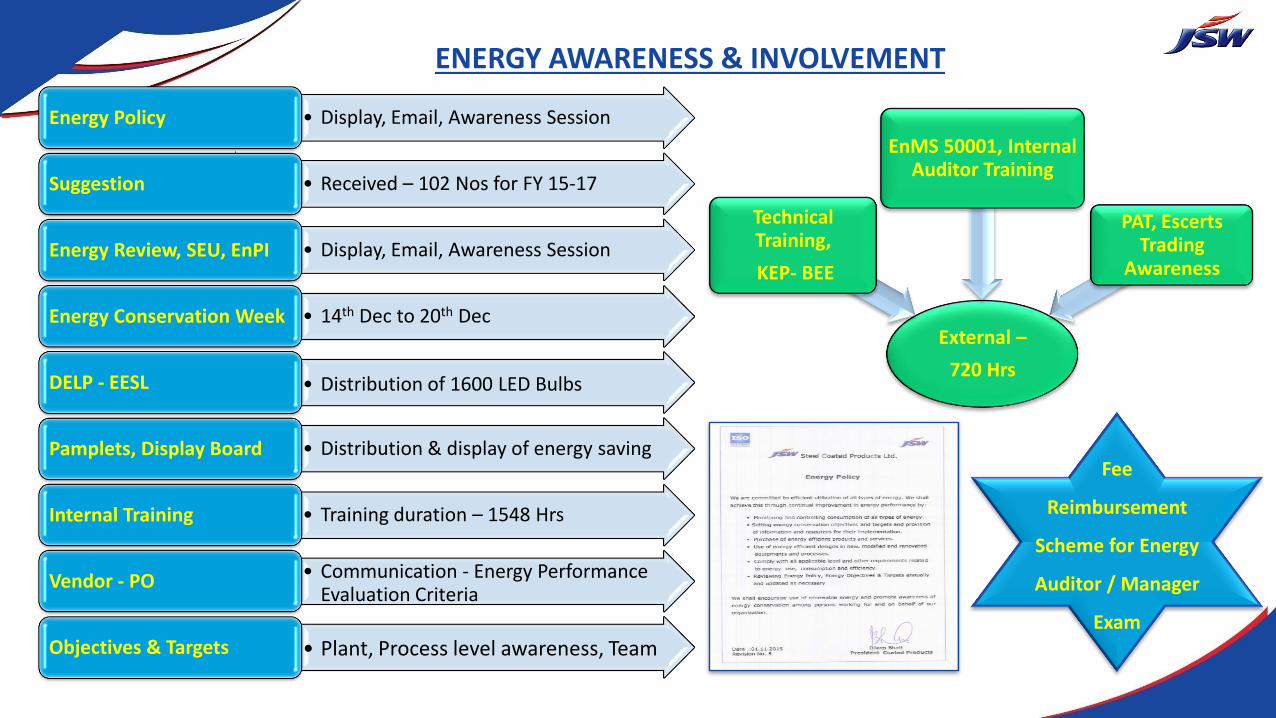
ENERGY AWARENESS & INVOLVEMENT
External –
720 Hrs
Technical Training,
KEP- BEE
EnMS 50001, Internal Auditor Training
PAT, Escerts Trading
Awareness
• Display, Email, Awareness SessionEnergy Policy
• Received – 102 Nos for FY 15-17Suggestion
• Display, Email, Awareness SessionEnergy Review, SEU, EnPI
• 14th Dec to 20th DecEnergy Conservation Week
• Distribution of 1600 LED BulbsDELP - EESL
• Distribution & display of energy saving Pamplets, Display Board
• Training duration – 1548 Hrs Internal Training
• Communication - Energy Performance Evaluation Criteria
Vendor - PO
• Plant, Process level awareness, TeamObjectives & Targets
Fee
Reimbursement
Scheme for Energy
Auditor / Manager
Exam

MANAGEMENT OF EC PROGRAMS/ TARGET SETTING
Management Commitment
Assess Current Situation
Set Goals & Targets
Implementation & Operation
Checking
Review & Evaluate
Appointment of MR
Scope & Boundaries
Energy Management Team – 10 Nos
Energy Policy , Resources Assignment
Energy Review
SEU Assessment & List – 10 Nos
RPO & PAT Target, Other Legal
Opportunities , Baseline
Prioritizing Opportunities Objectives & Action Plan EnPI Verification Plan- EMT
Responsibility – Process Owner Competence, Training & Awareness -1548 Hrs Design Procurement Operational Control, Energy Manual
Monitoring & Measurement Plan Metering Plan – Energy Meter List Audit Plan , Control of Records Compliance Assessment, CAPA
Review of Energy Policy Review of Objectives , Action Plan Review of EnPI Resources, System Improvement CAPA Approval

ENERGY MONITORING / FORMATEnergy Consumption Data of July-17
Power Consumption RLNG/Coal / HSD Consumption
Total
Required
G Cal /t
Total
Actual
G Cal /tEquipment Production
kwh /t KWH Gcal G cal/t MMBTU/t , KL/t MMBTU,Mt , KL Gcal G cal/t
ABP Require Actual Required Actual Required Actual Required Actual ABP Require Actual Required Actual Required Actual Required Actual
PreRolling
HR Slitter 51,997 2.5 2.0 129,993 105,094 112 90 0.00 0.00 - -
0.076 0.076
Pickling 52,877 9.0 6.34 6.7 335,404 354,058 288 304 0.01 0.01 - -
ETP+MEE PLANT 52,877 1.9 2.3 100,466 119,894 86 103 0.00 0.00 - -
Steam to Steel Plant (PKL) 52,877 1.0 0.5 52,877 27,062 45 23 0.00 0.00 0.013 0.013 713 713 3,492 3,492 0.066 0.066
PreRolling 52,877 9.0 11.7 11 618,740 606,108 532 521 0.010 0.010 - 0.013 0.013 713 713 3,492 3,492 0.066 0.066
Rolling
CRM-1 15,943 114.0 115.1 115.2 1,835,199 1,836,747 1,578 1,580 0.10 0.10 - -
0.107 0.107
CRM-2 5,260 133.0 149.3 148.1 785,476 778,921 676 670 0.13 0.01 - -
CRM-4 5,578 157 186.8 186.0 1,041,970 1,037,258 896 892 0.17 0.17 - -
CRM-5 17,313 84.0 89.5 89.0 1,549,514 1,541,300 1,333 1,326 0.08 0.03 - -
CRM-6 7,221 157.0 164.9 163.4 1,190,815 1,179,746 1,024 1,015 0.14 0.14 - -
Rolling 51,315 116.6 124.8 124.21 6,402,974 6,373,972 5,507 5,482 0.107 0.107 - - - - - - - - -
Galvanising (GI/GL)
CSD-1 6498 42.0 51.8 50.9 336,531 330,533 289 284 0.04 0.04 0.630 0.634 0.588 4,120 3818 1,038 962 262 0.15
0.262 0.268
CSD-2 4413 53.0 67.8 71.7 299,113 316,306 257 272 0.06 0.01 0.750 0.750 0.746 3,310 3293 834 830 210 0.19
CSD-3 20295 106 114.8 114.5 2,330,668 2,323,832 2,004 1,998 0.45 0.45 0.680 0.707 0.774 14,344 15701 3,615 3,957 911 0.19
CSD-4 3378 95 107.8 106.4 364,284 359,458 313 309 0.09 0.01 0.430 0.523 0.545 1,767 1843 445 464 112 0.14
CSD-5 16628 131.9 128.4 125.9 2,135,448 2,093,116 1,836 1,800 0.11 0.03 0.610 0.647 0.655 10,755 10887 2,710 2,743 683 0.16
GP Sliter/Alloy F/C 4,819 5.0 6.0 5.8 28,914 27,795 25 24 0.00 0.00 280 280 71 71 18 0.01
Galvanising (GI/GL) 51,212 101.3 107.3 106.4 5,494,957 5,451,040 4,726 4,688 0.092 0.092 0.640 0.675 0.699 34,575 35,821 8,713 9,027 0.170 0.176
Colour Coating (PPGI/PPGL)
CCL1 10,278 40.0 36.2 35.9 371,550 368,936 320 317 0.03 0.03 0.700 0.700 0.706 7,195 7256 1,813 1,828 457 0.178
0.201 0.200CCL2 10,723 36.0 36.3 35.5 389,138 380,676 335 327 0.03 0.03 0.650 0.650 0.643 6,970 6894 1,756 1,737 443 0.162
Colour Coating (PPGI/PPGL) 21,001 38.0 36.2 35.7 760,687 749,612 654 645 0.031 0.031 0.674 0.674 0.674 14,165 14,149 3,569 3,566 0.170 0.170
Others
Adminstration 0.6 0.6 0.5 33,000 26,019 28 22 0.00 0.00 - - - - -
0.002 0.002DG AUX SUPPLY 1.2 1 1.7 75,000 84,573 65 73 0.00 0.00 - - - - -
Store & Canteen 0.1 0.1 0.4 20,000 21,412 17 18 0.00 0.00 - - - - -
Others 51,212 2.5 2.6 128,000 132,004 110 114 0.002 0.002 - - - - - - - - -
Total 51,212 13,405,358 13,312,736 11,529 11,449 0.225 0.224 48,740 49,971 ###### 16,084 0.308 0.314 0.533 0.538
Normalized Energy Consumption for the Month of July'17 0.495

ENERGY MANAGEMENT SYSTEM
ENERGY MANAGEMENT SYSTEM – SCHNEIDER ELECTRIC

GHG EMISSIONS
GHG Emissions Unit FY 2014-15 FY 2015-16 FY 2016-17
Scope 1 Emissions tCO2 256470 239422 253254
Scope 2 Emissions tCO2 1125 958 360
Total GHG Emissions tCO2 257595 240380 253614
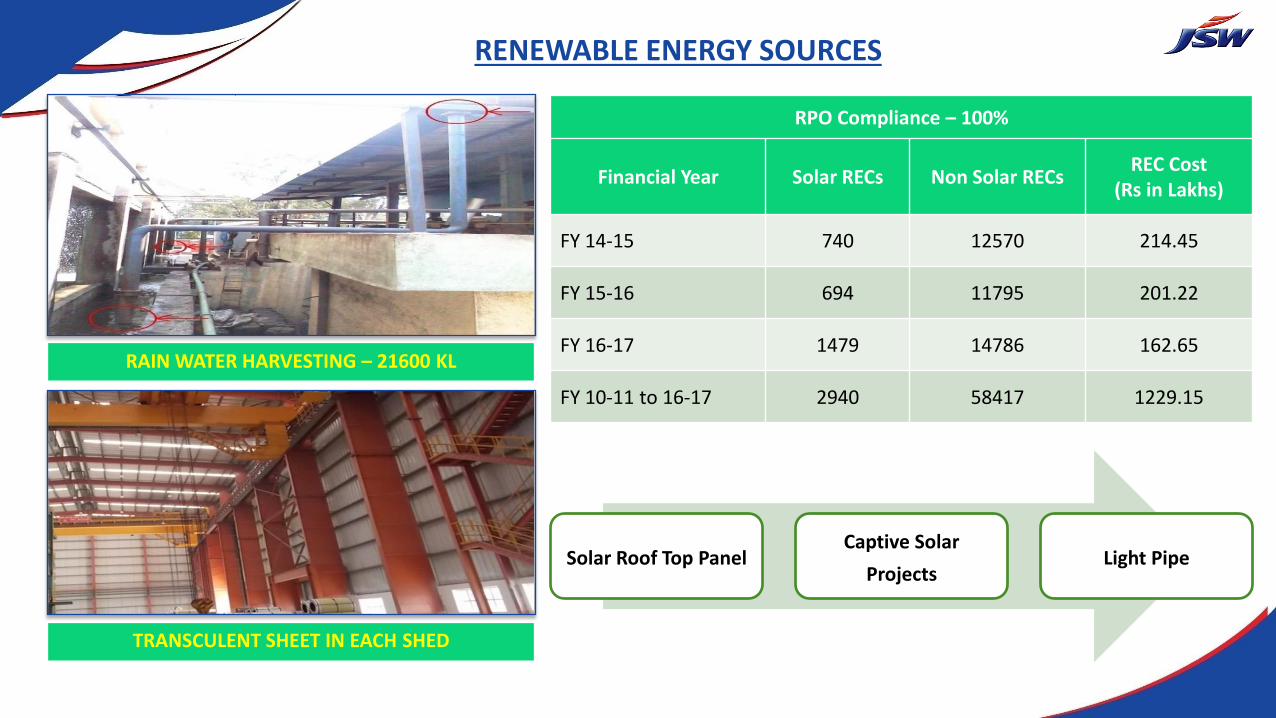
RENEWABLE ENERGY SOURCES
RPO Compliance – 100%
Financial Year Solar RECs Non Solar RECsREC Cost
(Rs in Lakhs)
FY 14-15 740 12570 214.45
FY 15-16 694 11795 201.22
FY 16-17 1479 14786 162.65
FY 10-11 to 16-17 2940 58417 1229.15
TRANSCULENT SHEET IN EACH SHED
RAIN WATER HARVESTING – 21600 KL
Solar Roof Top PanelCaptive Solar
ProjectsLight Pipe
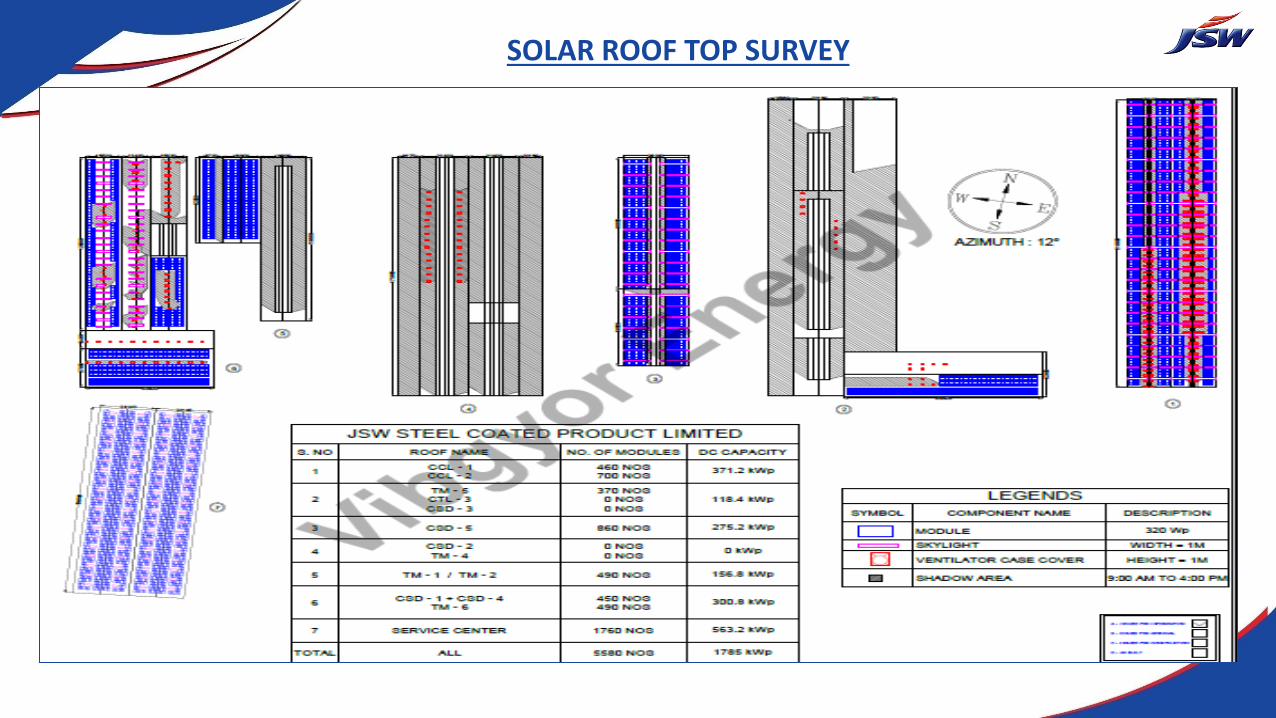
SOLAR ROOF TOP SURVEY

UTILIZATION OF WASTE
DESIGN RATING OF RTO FOR VOC FUEL CONSUMPTION
CCL1 – 300 to 700 Kg/Hr CCL2 – 300 to 440 Kg/Hr 30 - 35%

GREEN SUPPLY MANAGEMENT
Transportation – Replacement of LPG by RLNG
2,47,286 tCO2 MITIGATED
Transportation – Truck Container by Railway Rake
36,65,185 tCO2 MITIGATED

ENVIRONMENT INITIATIVES
TREE PLANTATION – 3000 Nos / YEAR DONATION OF 1000 SAPLINGS TO ITI
3 CHECK DAMS – 215 MILLION LTRS / COST RS 61 LAKHS WATER STORAGE BANK – 10 CR. LITRES
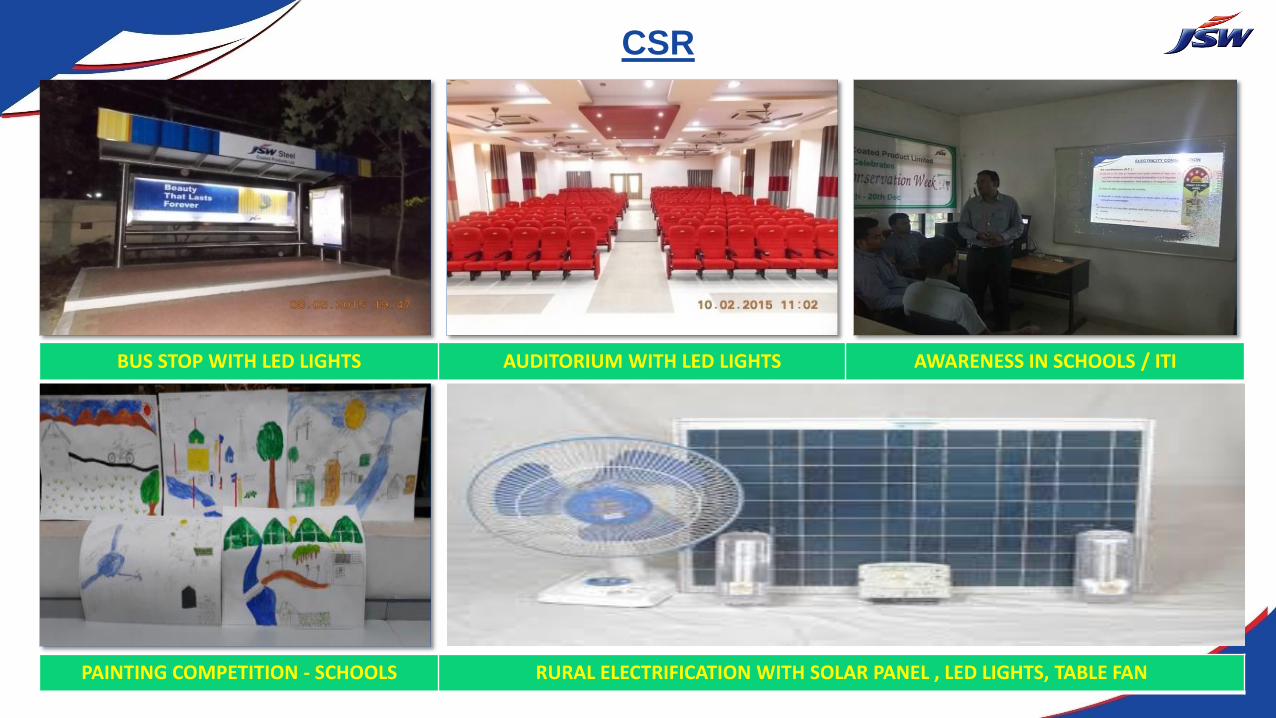
CSR
BUS STOP WITH LED LIGHTS AUDITORIUM WITH LED LIGHTS AWARENESS IN SCHOOLS / ITI
PAINTING COMPETITION - SCHOOLS RURAL ELECTRIFICATION WITH SOLAR PANEL , LED LIGHTS, TABLE FAN

CII - ENERGY AUDIT
Energy Saving Measures
Annual Energy Saving Potential
Status / Target Date
Annual Energy Saving
Electricity(Lakh Kwh)
Thermal (Million Kcal)
Electricity(Lakh Kwh)
Improve Power factor of captive power plant 2.64 Implemented 2.64
Install Light pipe 0.97 Mar-19 (Phases)
Optimize the compressed air system 11.92 Dec -16 (U/P) 2.27
Install VFD for Coolant pump for CRM 4.56 Implemented 8.12
Install correct size pump for cooling tower 15.49 Mar-19 (Phases) 1.47
Install VFD for Boiler feed water pump 10.30 Implemented 11.86
Install Micro turbine in place of PRDS 43.44 Dropped
Install VAM based Heat pump 3.52 1090 Dropped
Covered the Zinc pot surface 4.33 Implemented 0.90
Install VFD for CSD-5 Dilution Blower 0.14 Dropped
Install VFD for CSD-2 chromic dryer 0.12 Dropped
Total 97.43 1090 27.26
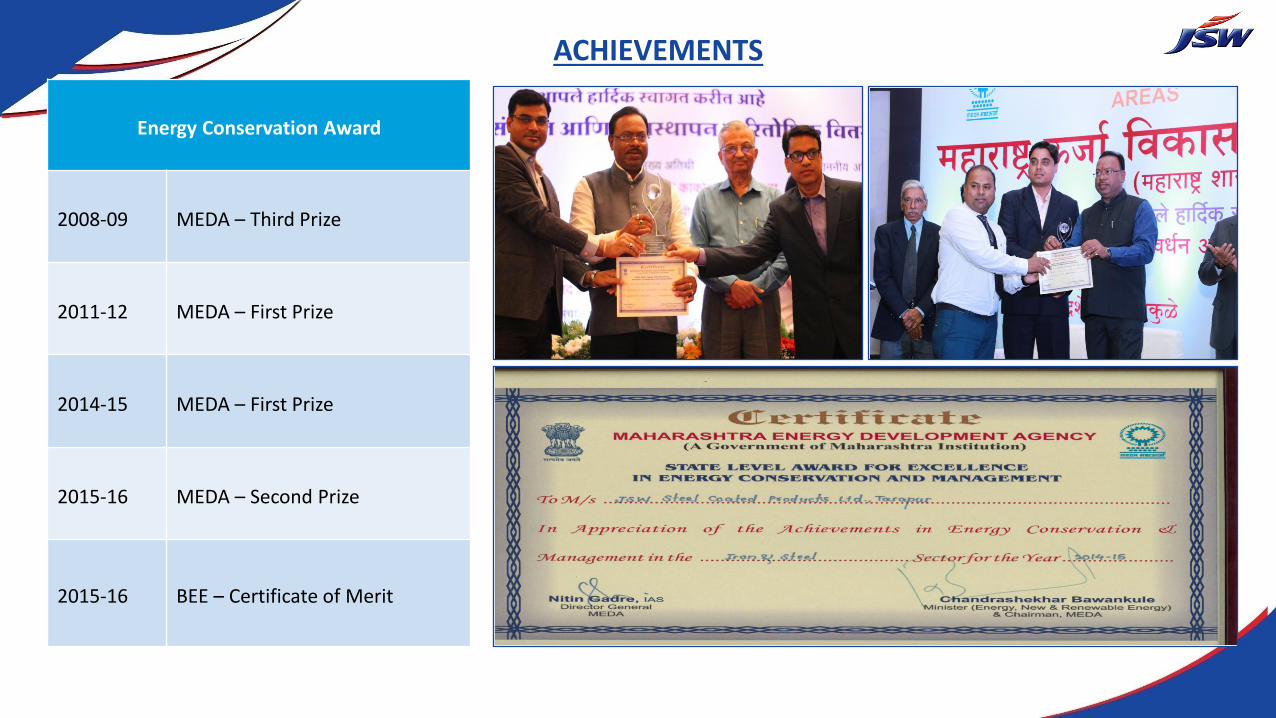
ACHIEVEMENTS
Energy Conservation Award
2008-09 MEDA – Third Prize
2011-12 MEDA – First Prize
2014-15 MEDA – First Prize
2015-16 MEDA – Second Prize
2015-16 BEE – Certificate of Merit

THANKS