Embed Size (px)
Citation preview

See discussions, stats, and author profiles for this publication at: https://www.researchgate.net/publication/285568594
Species Composition And Abundance Of Tintinnids And Copepods In The
Pichavaram Mangroves (South India)
Article in Ciencias Marinas · June 1994
DOI: 10.7773/cm.v20i3.969
CITATIONS
45
READS
67
1 author:
Some of the authors of this publication are also working on these related projects:
continuing my proejct on microzooplankton and its trophodynamic significance View project
Nallamuthu Godhantaraman
University of Madras
22 PUBLICATIONS 322 CITATIONS
SEE PROFILE
All content following this page was uploaded by Nallamuthu Godhantaraman on 25 January 2016.
The user has requested enhancement of the downloaded file.

Ciencias MarinasUniversidad Autónoma de Baja [email protected], [email protected] ISSN (Versión impresa): 0185-3880MÉXICO
1994 N. Godhantaraman
COMPOSICIÓN DE ESPECIES Y ABUNDANCIA DE TINTINIDOS Y COPEPODOS EN LOS MANGLARES DE PICHAVARAM (SUR DE LA INDIA)
Ciencias Marinas, año/vol. 20, número 003 Universidad Autónoma de Baja California
Ensenada, México pp. 371-391
Red de Revistas Científicas de América Latina y el Caribe, España y Portugal
Universidad Autónoma del Estado de México
http://redalyc.uaemex.mx

Ciencias Marinas (1994), 20(3): 371-391.
SPECIES COMPOSITION AND ABUNDANCE OF TINTINNIDS AND COPEPODS
IN THE PICHAVARAM MANGROVES (SOUTH INDIA)
COMPOSICION DE ESPECIES Y ABUNDANCIA DE TINTINIDOS Y COPEPODOS
EN LOS MANGLARES DE PICHAVARAM (SUR DE LA INDIA)
N. Godhantaraman
Centre of Advanced Study in Marine Biology Annamalai University Parangipettai 608 502
Tamil Nadu, India
Recibido en marzo de 1992; aceptado en junio de 1994
ABSTRACT
The annual pattern of distribution and abundance of tintinnids and copepods -taking them as the representatives of the major components of microzooplankton (20 to 200 pm) and mesozooplankton (200 um to 2 mm), respectively- was studied at the Pichavaram mangroves (India). Monthly sam- plings were made from January to December 1989, covering three stations. For tintinnids, density varied from 60 to 44,990 org./m3. Agglomerated tintinnids were the dominant form. The maximum abundance (80,740 org./m3) of copepods was recorded in the freshwater and neritic water mixing zone (station 2) during summer and the lowest (80 org./m3) in the freshwater zone (station 1). The genera Acartia and Acrocalanus (belonging to the suborder Calanoida), Macrosetella and Euterpina (belonging to the Harpacticoida), and Oithona (belonginp to the Cyclopoida) were coincident with the maximum species abundance at station 2. Species like Acartia southwellii and Oithona brevicornis were observed during thc lower abundance period. Calanoid and harpacticoid copepods were also dominant at station 3. A signilicant positive relationship between the abundance of tintinnids and co- pepods was observed. The seasonal distribution and abundance of tintinnids and copepods are dis- ~~ ---l 1.. _-,_rl__ &_ L..1______~:__, _____,.*___ cusseo m reumou ~0 uyurogräpu~~ä~ pararrrcrcls.
Key words: tintinnids, copepods. South India, distribution, abundance.
RESUMEN
Se estudió el patrón anual de distribución y abundancia de tintínidos y copépodos - tomados como representantes de los mayores componentes del microzooplancton (20 a 200 Pm) y mesozoo- plancton (200 um a 2 mm), respectivamente-, en los manglares de Pichavaram (India). Se tomaron muestras de enero a diciembre de 1989, en tres estaciones. La densidad de los tintínidos varió de 60 a 44,990 org./m3. Los tintínidos aglomerados fueron la forma dominante. La abundancia máxima de copépodos (80,740 org./m3 ) se registró en la zona de mezcla de agua dulce y nerítica (estación 2j durante ei verano y ia menor (80 org.im’) en ia zona de agüa dülce (esiación i). Los géneros Acartia y Acrocalanus (pertenecientes al suborden Calanoida), Macrosetella y Euterpina (pertenecientes al Harpacticoida) y Oithona (perteneciente al Cyclopoida) coincidieron con la máxima abundancia de especies en la estación 2. Se observaron especies como Acartia southwellii y Oithona
371

Ciencias Marinas, Vol. 20, No. 3. 1994
hw~~icornis en el periodo de menor abundancia. Los copépodos calanoides y harpacticoides también
dominaron en la estación 3. Se observó una notable relación positiva entre la abundancia de tintinidos
y’ copcpodos. Se discute la distribución estacional y abundancia de tintínidos y copépodos en relación
con los parámetros hidrográficos.
Palabras clave: tintínidos. copepodos, India del Sur, distribución, abundancia.
INTRODUCTION
The tropics are vvell known for the wide di-
versity in species composition, both within the
piant and animãi kingdõnis. iikeiì-ise, plaiikiõn
of the tropics are variegated and change their
composition daily (Krishnamurthy. 1962).
The plankton are broadly divisible into the
follovring based on their cell size (Dussart,
1965): ultraplankton (< 2 um), nannoplankton
(2-20 um). microrooplankton (20-200 um).
mesozooplankton (200 Pm-2 mm), megaplank-
ton (> 20 mm).
Among the planktonic organisms. the micro
and mesozooplankters play an important con-
necting role in the pelagic or aquatic food web.
They form a vital link for turnover of organic
matter and transfer of energy to higher trophic
levels of organic production between the prima-
ry producers like diatoms and the secondary
consumers like íish (Krishnamurthy et al., 1 Y7Y). Among microzooplankton, tintinnids are
common and dominant m this region. They are
the important food source of mesozooplankton.
Thesc copepods graze on the prtmary pro-
ducers. vvhich form their staplc food. Thc or-
ganisms at tcrtiary Icvel and at higher trophic
levels feed mainly upon zooplankton (Krish-
naniurthy et ai. 1979). Some studies on thc
annual distribution patterns of copepods in
relation to microzooplankton have bcen made
in the Pichavaram mangroves and adjacent bio-
topes (Krishnamurthy and Santhanam, 197.5;
Damodara Naidu e/ ~1.. 1977; Damodara Nai-
du. 1980) and elsewhcre (Beers and Stewart,
1969: Conover. 1982: Capriulo and Carpenter.
1983).
In this study,. simultaneous rn sltzc varia-
tions in species composition and population of
tintinnids and copepods (the ma.jor components
ol‘ microzooplankton and mesozooplankton, re-
spective¡\) vvcre investigated for a pcriod of
INTRODUCCION
Es bien conocida la amplia diversidad de
los trópicos en cuanto a composición de espe- _:.... .J.. 1.... . . . . . . . . .._..t “1 .I . . . ..-_. c1 -l”.._t-.. LleS oc 1”s ,c,,,us vegcra, y LLIIIIIIUL. L1 ,,lal&~“n
de los trópicos es igualmente diverso y cambia
diariamente su composición (Krishnamurthy,
1962).
En términos generales, cl plancton se divide
de acuerdo con cl tamaño de su célula (Dussart.
1965): ultraplancton (< 2 Pm). nanoplancton (2
a 20 Pm). microzooplancton (20 a 200 Pm).
mesozooplancton (200 um a 2 mm), mega-
plancton (‘ 20 mm).
Entre los organismos planctónicos, los mi-
cro y mesozooplanctónicos representan una
función importante de conexión en la red
alimentaria pelágica 0 acuática. Constituyen
un enlace vital para la renovación dc materia
orgánica y la transferencia de energía a niveles
tróficos superiores de producción orgánica
entre los productores primarios. corno las
diatomeas. y los consumidores secundarios.
como los peces (Krishnamurthy et d.. 1979).
En el microzooplancton. los tintinidos son
comunes y dominantes en esta región. Son
la fuente alimentaria importante del mcso-
zooplancton.
Estos copépodos se alimentan de produc-
tores primarios, que forman su alimento básico.
Los organismos del tercer nivel y niveles tróii-
cos superiores se alimentan principalmente de
zooplancton (Krishnamurthy et al.. 1979). Se
han efectuado algunos estudios sobre los pa-
trones de distribución anual de los copépodos
en relación con el niicrozooplancton. en los
manglares de Pichavaram y los biotopos adya-
centes (Krishnamurthy y Santhanam, 1975:
Damodara Naidu et ul., 1977: Damodara Naidu.
1980). así como en otros lugares (Bccrs y Ste-
wart, 1969; Conover, 1982; Capriulo y Carpen-
ter. 1983).
372

STUDY AREA
The present study was carried out at the Pi- chavaram mangroves located near Parangipettai (Porto Novo). India, on the Bay of Bengal sea- board (1 l”29’ N, 79”45’ E) (Fig. 1). This eco- system is uniquc as it is connected with the other aquatic biotopes, such as the estuary, the backwatcr and the sea. Such a situation pro- motes mixing of waters of varying salinity, temperature, nutrient concentrations, etc. The mixcd waters of the mangroves are very fertile and productive (Sundarardj and Krishnamurthy, 1974). enabling growth of a wide variety of or- ganisms. shelllish and finfish, besides plankton.
In the present study. three ecologicaiiy different study sites were chosen; the distance between the stations was about 1 km (Fig. 1). Station 1, Karithurai, is located in the freshwater part of the mangroves; station 2, Madai. is located in the mixing zone of freshwater and ncritic water; station 3, Pcriyakadavu, is situated in the interior area. The banks of the waterway in this area are lined by the dense mangrove vegetation.
In this tropical region, based on the climatic vjariations, the year is divisible into four clima- tic seasons: monsoon (rainy season), October to Decembcr; postmonsoon, January to March; summer, April to June; premonsoon, July to September.
The salinity of the waterways is low during thc rainy (monsoon) season and high during the summcr season. The average annual precipita- tion in this area is about 130 cm.
MATERIALS AND METHODS
Mesozooplankton samples were collected monthly (table 1) using a conical net (mesh size ll9 ltm), having a mouth area of 0.25 m2; the net was towed for five minutes to collect the surface zooplankton. A net (mesh size 54 um) vvas also towcd for five minutes for the collec- tion of microzooplankton during high tide. The net was towed horizontally (0 m depth) at the
surface water for a distance of about 50 m. í‘o collect a good numbcr of species and estimate thc abundance of mesozooplankton (copepods), 200 1 of surface water were liltered with the
En este estudio, se investigaron las varia- ciones simultáneas in situ de la composición de especies y la población de tintínidos y copépo- dos (los mayores componentes del microzoo- plancton y mesozooplancton, respectivamente), durante un año, de enero a diciembre de 1989.
AREA DE ESTUDIO
El presente estudio se llevó a cabo en los manglares de Pichavaram, localizados cerca de Parangipettai (Porto Novo), India, sobre el lito- ral dc la bahía de Bengala (1 l”29’ N, 79”45’ E) (Fig. 1). Este ecosistema es único pues está co- nectado con otros biotopos acuáticos: estuario,
remanso y mar. iai situacion promueve ia mez- cla de aguas de diferentes salinidades, tempera- turas, concentraciones de nutrientes, etc. Las aguas mezcladas de los manglares son muy fértiles y productivas (Sundararai y Krishna- murthy, 1974). Permiten el crecimiento de una amplia variedad de organismos, crustáceos y peces de escama, además de plancton.
En la presente investigación, se escogieron tres lugares de estudio diferentes ecológica- mente; la distancia entre las estaciones fue de cerca de 1 km (Fig. 1). La estación 1, Karithu- rai, se localiza en la parte de agua dulce de los manglares; la estación 2, Madai, se ubica en la zona de mezcla de agua dulce y agua nerítica; la estación 3, Periyakadavu, está situada en el área interior. Las orillas del canal de esta área están bordeadas por la densa vegetación del manglar.
En esta región tropical, con base en las variaciones climáticas, el año se divide en cua-
tro estaciones: monzón, octubre a diciembre (lluvias); postmonzón, enero a marzo; verano, abril a junio; premonzón, julio a septiembre.
Durante la temporada de lluvias (monzón), la salinidad de los canales es baja y durante el verano. alta. El promedio anual de precipitación en esta área es de cerca de 130 cm.
MATERIALES Y METODOS
Se recolectaron mensualmente muestras de
mesozoopiancton (tabia i j usando una red cóni- ca (luz de malla de ll9 Pm), con un área de boca de 0.25 m’: la red se arrastró durante cinco minutos para recolectar el zooplancton de la SU-
N. Godhantaraman: Species composition and abundance of tintinnids and copepods
373

Ciencias Marinas, Val. 20, No. 3. 1994
Figure 1. Map showing the study area. Numbers mangroves. Figura 1. Mapa del área de estudio. Los números 1 de Pichavaram.
help of a 20-I bucket (10 times). When com- pared to mesozooplankton, microzooplankton cell size is much smaller and there is a consid- erable chance of missing a few smaller-sized forms through the net. Hence, to obtain reason- able values in the tintinnid abundance the sedi- mentation technique was used, following the -eth,.A fi\f Ch.,t,,onr\r,~, /107!2(\ Arrndinn tv IIILIIIVU “I LIIIu~\IIcLIn”*u \ n / I “,. 1 .‘w”‘Un..é
this method, one-litre surface water samples were collected using polyethylene bottles and fixed with 5% neutralized formalin on board. The bottles were kept undisturbed for 48 hours till complete sedimentation; microzooplankton settled on the bottom and was used for numer- ical counts, using Utermöhl’s inverted plankton
l-3 indicate the study areas in the Pichavaram
a 3 indican las áreas de estudio en los manglares
perficie. También se arrastró cinco minutos una red (luz de malla de 54 Pm) para recolectar mi- crozooplancton durante la marea alta. La red se arrastró horizontalmente sobre la superficie del agua (0 m de profundidad), una distancia de aproximadamente 50 m. Con el fin de recolec- tar un buen número de especies y estimar la .h,,nrlanria rlpl mrcn7nnnlnnrtnn CrnnPnndnîI YYYI.UI..“.I “_. . .._“_.I__ r’-“-‘-” \--T-T----l, se filtraron 200 I de agua de la superficie con la ayuda de una cubeta de 20 1 (diez veces). El ta- maño de célula del microzooplancton compara- do con el del mesozooplancton, resulta mucho menor y es considerable la posibilidad de per- der algunas formas de las tallas menores, a través de la red. Por tanto, para obtener va-
374

N. Godhantaraman: Species composition and abundance of tintinnids and copepods
Table 1. Month, day and hour of sampling. Tabla 1. Mes. día v hora de muestreo.
Month Date Day Station 1 Station 2 Station 3
.lanuary
February
\ I-_-L I”l¿KCII
April
May
June
July
August
September
October
November
December
2/01/89 Monday
2102189 Thursday
* in, ,on P_r.._A_., Ltl”,)IOY JULUI “UY
3104189 Monday
2105i89 Tuesday
3106189 Saturday
3107189 Monday
2108189 Wednesday
6109189 Wednesday
4110189 Wednesday
3111189 Friday
3Ol12189 Saturday
8.30 a.m.
7:45 a.m.
7.1C - - J. L, p.11,.
8:15 a.m.
9:45 a.m.
lo:40 a.m.
7:15 a.m.
8:45 a.m.
8:45 a.m.
9:40 a.m.
8:45 p.m.
2:30 p.m.
9.20 a.m.
8:35 a.m.
r.,n_- Lt. 1” p.11,.
9:20 a.m.
1 0:40 a.m.
ll:35 a.m.
8:20 a.m.
9:50 a.m.
9:35 a.m.
lo:35 a.m.
9:35 a.m.
3:2O p.m.
10~20 a.m.
9:45 a.m.
c.qn - - J.L” p.11,.
1O:lO a.m.
ll:40 a.m.
12:30 a.m.
9: 15 a.m.
lo:40 a.m.
lo:20 a.m.
ll:20 a.m.
10.20 a.m.
4:20 p.m.
microscope (Utermöhl, 1958). A water sample was also collected for the measurement of hy- drographical parameters such as temperature, salinity and dissolved oxygen. Water tempera- ture was measured using a standard Ceisius thermometer. Salinity was estimated by the silver nitrate titration method and dissolved oxygen by the modified Winkler method as de- scribcd by Strickland and Parsons (1972).
RESULTS
Environmental parameters
Environmental parameters showed wide EPI‘zfi”ll ,,lr;It;nna U;nheat temnerc,t>,rr onri L>G.uLI”II~I . cA1 ICALIVIILI. .“6’L’-‘L L’nLA~b“LLU1~ u11u
salinity were recorded during the summer and lowest during the monsoon season (Figs. 2, 3). The minimum and maximum monthly tem- perature were 24.5”C (December) and 35.5”C (June), respectively. Salinity varied widely, rangmg trom 3.Y ppt (September) to 35.5 ppt (June). The dissolved oxygen values were high (6. I mlil) during the monsoon (December) and
low (3.62 mi/]) during the summer (May) sea- son (Fig. 4). Season-wise observation of dis- solved oxygen showed an inverse trend against temperature and salinity.
lores razonables de la abundancia de tintínidos, se usó la técnica de sedimentación, con el III&I- do de Shukhanova (1978). De acuerdo con este método, se recolectaron muestras de un litro de
agua superficiai, usando boteiias de poiietiieno y se fijaron con formalina neutralizada, a bordo. Las botellas se mantuvieron quietas por 48 horas, hasta que se completó la sedimentación. El microzooplancton se asentó en el fondo y fue utilizado para el conteo numérico, mediante el microscopio invertido para plancton de Utermöhl (1958). Se recolectó también una muestra de agua para medir parámetros hi- drográficos como temperatura, salinidad y oxigeno disuelto. La temperatura del agua se miA¡i. r_n ,,n +0rm,ím‘+rn ‘X+&nrlnr AP nr.lrlnr III.“,” ti”11 u11 CCLIII”III~LI” ti>LLIII”UL “\I &,“““J Celsios. La salinidad se estimó con el método de titulación con nitrato de plata, y el oxígeno disuelto con el método de Winkler, modificado tal como lo describen Strickland y Parsons
(1972).
RESULTADOS
Parámetros ambientales
Los parámetros ambientales muestran am- plias variaciones estacionales. Las mayores
375

Ciencias Marinas, Val. 20, No. 3, 1994
34
ii! 3
z oz
å I 28 W t-
26
l f I t
A-9 x-x st. 1
/ \
e-0 St. 2
0-0 O-0 St. 3
J F M A M J JASOND
MONTHS
1989
Figure 2. Monthly surface water temperature (“C). Figura 2. Temperatura (“C) del agua superficial, por mes.
0 1 1 JFMAMJJASOND
MONTHS
1989
Figure 3. Monthly surface water salinity (ppt). Figura 3. Salinidad (ppm) del agua superficial, por mes.
376

Species composition and abundance of
tintinnids
A total «f 22 species of tintinnids (Proto- zoa: Ciliata) were recorded from the waterways of the mangrovcs. The tintinnids are grouped primarily into agglomerated and non-agglomer- ated forms. Among these. agglomerated tintin- nids constituted major part (18 species) of the total species and were also found to be very im- portant contributors. both qualitatively and quanritativeiy. These i 8 species (aggiomerated forms) belong to the genera Tintinnopsis, Tin- tinnidium, Leptrotintinnus and Codonellopsis. The non-agglomerated forms comprised four species with two genera. Favella and Eutintin- nus. Tables 2-4 give the distribution of agglom- erated and non-agglomerated forms at all three stations. The distribution of tintinnids showed less variations among stations. Species like Favella hrevis, F. philippwzensls, Tintinnopsis cylindrica and T. beroidea. occurred commonly during the present study. Species like Eutin- tinnus tenuis and E. lusus-undae occurred only during the monsoon season.
Tintinnid abundance displayed impressivc spatial and temporal variations. Figure 5 shows the seasonal abundance of tintinnids. Their sea- sonal abundance varied. on average, from 3,580 to 17,670 org./m’. 4.480 to 73,540 org./m3 and 1.690 to 5 1,450 org./m3 at stations 1, 2 and 3 during monsoon and summer, respectively. The highest peak of abundance (44.990 org./m3) was recorded during .Tune at station 2: Tin!in- ~~~~~~0 ~-~~~ nopsis cylindrica, T. mortensenii and T. tubulo- su were rcsponsible for this peak abundance. The minimum abundance (60 org./m’) was re- corded during September at station 1, with the occurrence of only Tintinnopsis lohmanni and Favella brevis. The genus Tintinnopsis ranked íirst in a;l seasons during the present study. In gcncral. maximum and minimum abundance of tintinnids were recorded during the summer and monsoon at stations 2 and 3, respectively.
Species composition and abundance of
copepods
Tables 5-7 show the species occurrence at different stations. A total of 20 species of co-
temperaturas y salinidades se registraron du- rante el verano y las menores, durante las esta- ciones monzónicas (Figs. 2, 3). Las tempc- raturas mínima y máxima mensuales fueron 24.5”C (diciembre) y 35.5”C (junio), respec- tivamente. La salinidad varió ampliamente, en un intervalo de 3.9 ppm (septiembre) a 35.5 ppm (junio). Los valores de oxígeno di- suelto fueron altos (6.1 ml/l) durante el monzón (diciembre) y bajos (3.62 mlil) durante el vera- no (mayo) (Fig. 4). En el transcursode las esta- ciones, el oxígeno disuelto mostró una tenden- cia inversa contra temperatura y salinidad.
Composición de especies y abundancia de tintínidos
En los canales de los manglares, se registró un total de 22 especies de tintínidos (Protozoa: Ciliata). Los tintínidos se agrupan principal- mente en las formas aglomerada y no aglomera- da. Los tintínidos aglomerados constituyeron la mayor parte (18 especies) del total de especies y se encontró además que son contribuyentes im- portantes tanto cualitativa como cuantitativa- mente. Estas 18 especies (formas ag!omeradas) pertenecen a los géneros Tintinnopsis. Tintinni- dium, Leptrotintinnus y Codonellopsis. Las for- mas no aglomeradas comprendieron cuatro es- pecies con dos géneros, Favella y Eutintinnus. En las tablas 2 a 4, se da la distribución de las formas aglomeradas y no aglomeradas, en las tres estaciones. La distribución de tintínidos muestra menos diferencias entre las estaciones. Las esnecies como Favella brevis, F nhilinni- raí ~~ ~~ ~~~ r ----rr- nensis. Tintinnopsis cylindrica y T. beroidea, se encontraron comúnmente, durante el presente estudio. Las especies como Eutintinnus tenuis y E. lusus-undae estuvieron presentes sólo du- rante la estación del monzón.
La abundancia de tintínidos tuvo variacio-
nes espaciales y temporales impresionantes. La Fig. 5 muestra la abundancia estacional de tintí- nidos. En promedio, su abundancia varió de 3,580 a 17,670 org./m’ en la estación 1, de 44,990 a 73,540 org./m3 en la estación 2 y de 690 a 5 1,450 org./m’ en la estación 3, durante el monzón y el verano. El mayor pico de abun- dancia (44,990 org./m3) se registró durante ju- nio, en la estación 2. Tintinnopsis cylindrica, T. mortensenii y T. tubulosa fueron las respon-
K, Godhantaraman: Species composition and abundance of tintinnids and copepods
377

Ciencias Marinas, Vol. 20, NO. 3, 1994
JFMAMJJASOND
MONTHS
1989
Figure 4. Monthly surface water dissolved oxygen (ml/l). Figura 4. Oxígeno disuelto (ml/l) en el agua superficial, por mes.
Tin-Tintinnids Cop - Copepods
9 I Post monsoon 1 ,l Summer
0 Tin Cop Tin Cop
1989
Figure 5. Mean seasonal values of the abundance of tintinnids and copepods at stations 1,2 and 3. Figura 5. Valores promedio mensuales de abundancia estacional de tintínidos y copépodos, en las es- taciones 1, 2 y 3.

spwics ____
Agglomerated tintinnids
7’~,llirltlitlilrt~l irlccr~lrlt~r
7’/Ht/rlll/clir/tll />t~it?lrtrvrrlll
I.c~~~“olitltlrlrllis sitflple.~
/‘rr7lrr7t7opis hernzudemis
7?17/i17t10ps0 hcroidm
7ìrfll/lrlopsfs c~hhx-n
7’ititrnnopsis dircctn
Tir~lfrmy~sis glms
Tirztrr7t7opsi.s gracrlrs
Twtinnopsls kofoidi
Tintinnopsir lohmannr
Tinlinnopsis minuta
Tintrrlnopsis morfemenil
Tmtinnopsis nucula
Tintinnopsis radix 7.. . 1 rnrrnnopsis iz~buíosa
Tintinnopsis tocantinensis
Codonellopsis oste@eldii
Non-agglomerated tintinnids
Favella brevis
Eávella philippinemis
Eutintinnus tenuis
Ditintinnus 11rsus
.ltlll.
1.03
0.97
0.57
0.17
Feb. Mar.
0.69
1.84 0.03
2.44
0.34
0.54
0.46
2.70
0.02
0.11
0.32
0.04
0.03
0.19
v.::
0.34
0.20
Apr. Mq .lUll. .lul. Allg. Sep. Oct. NOI¡. DK.
0.19
1.95
0.94
1.03
0.18
1.84
1.34
0.15
0.55
0.11
1.94
0.02
2.44
0.48
0.34
4.17
0.34
0.43
0.06
?. rfi U.3Y
0.05
0.54
0.63
0.03
1.03
0.01
0.20
0.03
0.03
0.32
0.39
0.34
0.20
1.05
0.13
0.03
0.18
0.69
0.03
0.03
0.05
0.14
Total 2.74 3.93 6.53 2.14 6.14 9.39 1.47 2.44 0.06 2.30 1.03 0.25

Table 3. Abundance of tintinnids at station 2 ( IO1 org./m’). Tabla 3. Abundancia de tintínidos en la estación 2 ( IO3 org./m’).
Species Jan. Feb. Mar. Apr. Mv Jun. Jul. Aug. Sep. oct. Nov. Dec.
An,.lrr...ornt‘x~ t;n+;nn;rlr r\661”IIICI PIL” LIII~IIIIII”~
T~ntinnidium incertutn
Tintinnidium primitivum
Leprotintinnus simplex
Tintinnopsis hermudensis
Tintinnopsls beroidea
Tintinnopsis cylindrica
Tmtinnopsis directa
Tintinnopsis glans
Tintinnopsis gracilis
Tintlnnopsis kofoidi
Tintinnopsis lohmanni
Tintinnopsis minuta
Tintinnopsis mortensenii
Tintinnopsis nucula
Tintinrropsis radix
Tintinnopsis tubulosa
Tintinnopsis tocantinensis
Codonellopsis ostenfeldii
Non-agglomerated tintinnids
Favella hrevis
Favella phdippinensis
Eutintinnus tenuis
Eutiniinnus IIISIIS
0.32
0.04
0.03
0.12
0.25
0.25
0.93
0.14
0.02
0.19
2.34
1.06
0.82
0.32
3.41
0.63
0.09
1.75
0.03
0.93
0.10
0.03 0.32
0.03
0.15 0.02
0.06
32.42
0.03
0.27
0.06
0.24
0.19
0.16
2.47
0.77 0.01
2.43 1.03
0.75
0.02
0.32 4.32 0.03
0.67
5.42
1.82
3.97
0.03
0.27
0.39
17.43
0.29
0.35
0.43
0.13
0.03
0.02
0.03
0.19
0.13
0.27
0.33
0.12
0.03
0.07
0.59
0.13
2.79
0.13
0.06
0.02
0.03
0.10
0.02
0.03
0.62
0.19
0.02
0.04
0.03
0.05
0.02
0.03
0.03 C? E 0.
0.04 ; 2, 8 ?
2 0.06 .-
“g 2: ? w
?
0.13
0.04
Total 1.75 4.12 8.11 1.03 27.61 44.9 3.43 1.06 2.18 3.99 0.16 0.33
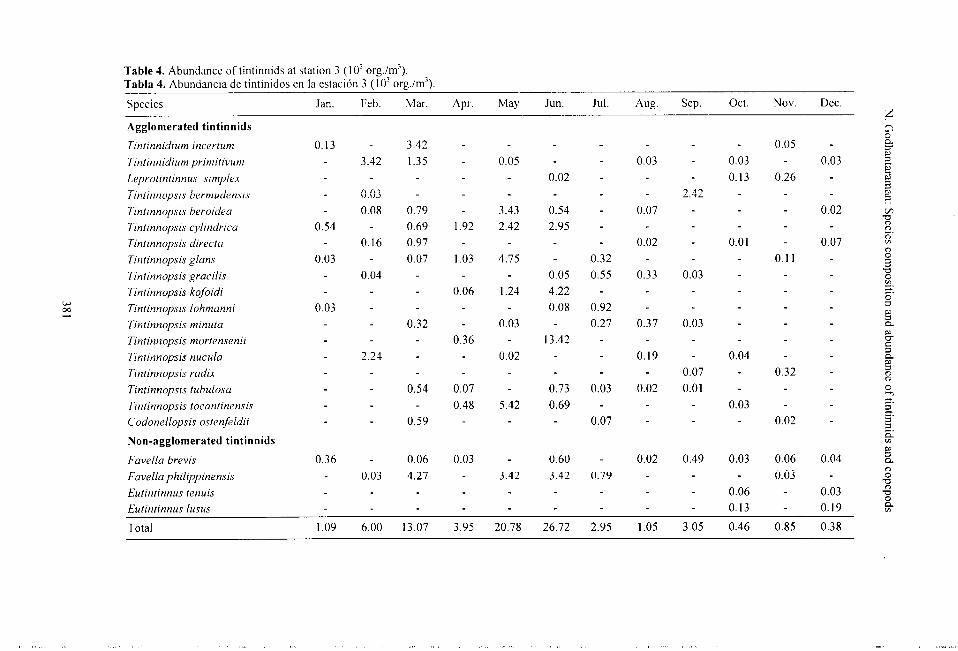
Table 4. Abundance of tintinnids at station 3 (10’ org.im’). Tabla 4. Abundancia de tintinidos en la estación 3 ( lo3 orp./m’).
Species Jan. Feb. Mar. Apr. May Jun. Jul. Aug. Sep. oct. Nov. Dec.
Agglomerated tintinnids
Tintinnidium incertum
Tintinnidium primitivum
Leprotintinnus simplex _ ‘. I inrlnnopsis bermudensis
Tlntinnopsis beroidea
Twztinnopsis cylindrica
Tintinnopsis directa
Tintinnopsis glans
Tintinnopsis gracilis
Tintinnopsis kofoidi
Tintinnopsis lohmanni
Tintinnopsis minuta
Tintinnopsis mortensenii
Tintinnopsis nucula
Tlntinnopsis radix
Tiniinnopsis íubuiosu
Tintinnopsis tocantinensis
Codonellopsis ostenfeldii
Non-agglomerated tintinnids
Favella brevis
Favella phiiippinensis
Eutintinnus tenuis
Eutintinnus lusus
0.13
0.54
0.03
0.03
0.36
3.42
6.63
0.08
0.16
0.04
2.24
0.03
3.42
1.35
0.79
0.69
0.97
0.07
0.32
0.54
0.59
0.06
4.27
0.05
1.92
3.43 0.54
2.42 2.95
1.03 4.75
0.06 1.24
0.36
0.03
0.02
0.07
0.48 5.42
0.03
3.42
0.02
0.05
4.22
0.08
13.42
0.73
0.69
0.60
3.42
0.32
0.55
0.92
0.27
0.03
0.07
0.79
0.03
0.07
0.02
0.33
0.37
0.19
O.û2
0.02
2.42
0.03
0.03
0.07
V.ûl
0.49
0.03
0.13
0.01
0.04
0.03
0.03
0.06
0.13
0.05
0.26
0.11
0.32
0.02
0.06 ^ ^_ U.03
Total 1.09 6.00 13.07 3.95 20.78 26.72 2.95 1.05 3.05 0.46 0.85 0.38 -

pepods were recorded, belonging to 13 genera and three major suborders: Calanoida (12 spp.), Harpacticoida (3 spp.) and Cyclopoida (5 spp.). The maximum and minimum numbers of cope- pods were found at station 2 in May and at sta- tion 1 in September, respectively. The genera A-_..._ “..._._I_._.._ __f P_._...____^_ l--1,.-,. nccrrrrcr, ACT”CUIU~K¿S au” ~rr“r”~U~~J. ve;luug- ing to calanoids, and Euterpina and Oithona, belonging respectively to harpacticoids and cyclopoids, were the dominant forms. Four spe- cies were common to al1 three stations: Acartia southwellii, Centropages orsinii, Euterpina acuttj-ons and Oithona rigida. The species Acartia danae, Oithona similis, Corycaeus ca- tus and Labidocera acuta occurred only in the freshwater-neritic mixing zone.
Copepod abundance showed spatial and temporal variations. Figure 5 shows the season- al abundance of copepods from the three dif- ferent stations. Their seasonal abundance var- ied, on average, from 2,280 to 46,830 org./m’, 7,490 to 180,370 org./m’ and 18,930 to 162,180 org./m3 at stations 1, 2 and 3 dur- mg the monsoon and summer, respectively. In general, species like Acartia danae, A. south- wellii, Acrocalanus longicornis, Pseudodiap- tomus serricaudatus, Centropages orsinii, Macrosetella gracilis, Microsetella rosea, Eut- erpina acutifrons, Oithona rigida, 0. brevicor- nis and Cotycaeus danae were more in terms of numerical abundarme during the present observation.
Species like Acartiu southwellii, A. danae, Acrocalanus longicornis, Macrosetella gracilis, Euterpina acutijirons and Oithona similis were responsible for this maximum abundance. Only Acartia southwellii and Oithona brevicornis oc- curred during the minimum abundance.
Correlation coefficient
Significant positive correlation was ob- served between the monthly abundance of co- pepods and tintinnids at all three stations. Table 8 shows a highly significant correlation be-
tween the monthly abundance of tintinnids and that of copepods at all three stations. It might show their food web relationship in this ecosystem.
Ciencias Marinas, Val. 20, NO. 3, 1994
sables de este pico de abundancia. La mínima abundancia (60 org./m3) se registró durante sep- tiembre, en la estación 1, sólo con la presencia de Tintinnopsis lohmanni y Favella brevis. El género Tintinnopsis se situó en el primer lugar en todas las estaciones del ano durante el pre- ^_^&^ -,.r..,J:- -..__.._I I__ _L.._A___:__ >F1IIG CSIllUI”. En g;cLIGI äl, I¿is ö”lUI”äucLas máxima y mínima de tintínidos se registraron durante el verano y el monzón en las estaciones 2 y 3, respectivamente.
Composición de especies y abundancia de copépodos
Las tablas 5 a 7 muestran la presencia de las especies en las diferentes estaciones de recolec- ción. Se registraron 20 especies de copepodos, en total, pertenecientes a 13 géneros y 3 subordenes mayores: Calanoida (12 especies), Harpacticoida (3) y Cyclopoida (5). Los núme- ros maximo y minimo de copépodos se encon- traron en la estación 2, en mayo, y Ia estación 1, en septiembre, respectivamente. Los géneros Acartia, Acrocalanus y Centropages, pertene- cientes a los calanoides, y Euterpina y Oithona, pertenecientes a los harpacticoides y ciclo-
poides, respectivamente, fueron las formas do- minantes. Cuatro especies fueron comunes a las tres estaciones: Acartia southwellii, Centro- pages orsinii, Euterpina acutifrons y Oithona rigida. Las especies Acartia danae, Oithona si- milis, Corycaeus catus y Labidocera acuta se encontraron sólo en la zona de mezcla de agua dulce y nerítica.
La abundancia de copepodos mostro varia- ciones espaciales y temporales. La Fig. 5 presenta la abundancia estacional de copepo- >- ~~ mmImm. ~~ aos en iãs tres estaciones de recoiección. Dei monzón al verano, ésta varió, en promedio, de 2,280 a 46,830 org./m3 en la estación 1, de 7,490 a 180,370 org./m’ en la estacion 2 y de 18,930 a 162,180 org./m3 en la estación 3. En general, en terminos de abundancia numéri- ca, fueron más las especies como Acartia da- nae, A. southwellii, Acrocalanus longicornis, Pseudodiaptomus serricaudatus, Centropages orsinii, Macrosetella gracilis, Microsetella rosea, Euterpina acutifrons, Oithona rigida, 0. brevicornis y Cotycaeus danae, durante esta observacion.
382

Table 5. Abundance of copepods at station 1 (10’ org./m3). Tabla 5. Abundancia de copépodos en la estación 1 ( lo3 orgh?).
Species Jan. Feb. Mar. Apr. May Jun. hl. Aug. Sep. oct. Nov. Dec.
Calanoids
Acartia spinicauda
Acartia etythraea
Acartia danae
Acartia southwellii
Paracalanus parvus
Acrgocalanus gracilis
Acrocalanus longicornis
Metacalanus aurivillii
Centropages orsinii
Centropages sp.
Pseudodiaptomus serricaudatus
Labidocera acuta
Harpacticoids
Macrosetella gracilis
Mcrosetella rosea
Euterpina acutifrons
Cyclopoids
Oithona rigida
Oithona similis
Oitkrona brevicornis
Coqxaeus danae
Coi-ycaeus catus
0.18 0.07 0.35 10.03
0.04 0.02 0.09
0.06 0.02 0.70 1.24 10.26
0.08
0.05
0.05 0.18
1.76
0.60 0.74 1.52 12.37
0.39 0.19 0.68
0.18 2.24 2.84
4.67 3.42 3.43
4.24 0.42
0.03 4.50 5.38 2.96 5.42 3.58
0.06
0.03
0.50
3.14
0.37
4.48 2.47
3.95 0.52
3.36 3.90
1.49 0.17
1.41
3.19
1.40
4.34
1.40
0.03 0.61
0.08 0.26
0.15
0.02
0.05
0.05 0.63 0.24
0.15
0.05
0.03
0.01
- Total 1.1 6.53 18.55 14.34 15.07 17.42 6.41 ll.74 0.08 1.32 0.72 0.24

Table 6. Abundance of copepods at station 2 ( lo3 org./m’). Tabla 6. Abundancia de copépodos en la estación 2 ( lo3 org./m3).
Species Jan. Feb. Mar. Apr. May Jun. Jul. Aug. Sep. oct. Nov. Dec.
Calanoids
Acrocalanus gracilis
Acrocalanus longicornis
Acartia spinicauda
Acartia erythraea
Acariia danae
Acartia southwellii
Centropages orsinii
Centropages Sp.
Labidocera acuta
Metacalanus auriviltii
Paracalanus parvus
Pseudodiaptomus serricaudatus
Harpacticoids
Macrosetella gracilis
Microsetella rosea
Euterpina acutifons
Cyclopoids
Oithona rigida
Oithona similis
Oithona brevicornis
Corycaeus danae
0.59
0.91 6.47 0.50 -
0.03
0.17
0.72 3.34
1.83 _ 0.76
1.03
0.38 0.03
4.01
9.32
40.01
0.69
0.60
0.92
0.03
0.45
0.54
3.75
34.34 0.54 19.75
5.71 0.60 12.50 0.58 0.58
0.04 0.03 0.18 0.82
2.62 0.22 0.19 -
-
0.63 -
3.35 4.72 0.54 3.49
1.31 28.02 -
5.43 4.24 0.94
3.21
0.25
0.59
0.73 0.56
1.01
3.43 6.13
1.36
13.48
0.26
8.54 5.42
0.18 0.03
2.43 9.24
0.07 1.03
1.34 0.75
0.34
0.09 -
0.32 0.22
17.41 3.47
2.75 7.42
0.20 0.84
0.39 0.17
0.27 0.27
0.13
0.05 0.32 Corycaeus catus 0.03 1.72 0.19 0.90 0.03
Tota1 2.57 5.46 24.05 24.27 80.74 75.36 8.52 59.32 18.52 2.52 4.18 1.24
c! 3 3.

Table 7. Abundance of copepods at station 3 ( lo3 org./m’). Tabla 7. Abundancia de copépodos en la estación 3 (10’ org./m’).
Species Jan. Feb. Mar. Apr. May Jun. Jul. Aug. Sep. oct. Nov. Dec.
Calanoids
Acartia etythraea
Acartia spinicauda
Acartia danae
Acartia southwellii
Paracalanus parvus
Acrocalanus gracilis
Acrocalanus longicornis
Metacalanus aurivillii
Centropages orsinii
Centropages sp.
Pseudodiaptomus serricaudatus
Labidocera acuta
Harpacticoids
Macrosetella gracilis
Microsetella rosea
Euterpina acutifons
Cyclopoids
Oithona rigida
Oithona similis
Oithona brevicornis
Cotycaeus danae
Corycaeus catus
1.06 11.30 17.39 0.32 28.40 1.21 3.36 0.02
0.17
0.49
0.09
0.34
0.02
0.47
0.17
1.53
1.02 25.95 -
0.95 -
ll.22 7.67 0.26
0.69 0.46
1.61
0.05 0.02
0.70
0.23
0.14
0.59
0.69
0.35
3.21
22.36
1.09 -
2.27 0.33
0.55 0.07
1.09 0.07
0.02 0.07
0.69
8.11
2.32
1.33
0.06
0.33
4.72 - 12.75 2.94 3.42 0.27
0.22
0.75
0.07
2.75
8.43
2.78
0.55 13.81
5.43 6.94
6.46 8.54
5.44 5.34
0.19 6.48 11.02 16.97
23.83 9.47 19.16 0.12 2.41
0.03
0.01
5.75
0.33
0.03
0.54 3.03
4.34 13.42 30.24 45.15 46.68 70.35 36.92 68.53 19.33 5.35 10.05 3.53

DISCUSSION
The variable nature of thc environmental parameters would affect the occurrence, com- position and distribution of the plankton. Among the various zooplankton, tintinnids and
copepods were the major components through- out the study period, as has been reported for different Indian mangroves: 91% by Subbaraju and Krishnamurthy (1972). 71.75% by Gos- wami and Selvakumar (1977) 89.75% by Damodara Naidu (1980) 89.30% by Bhunia and Choudhury (198 1). It would appear that the species composition and abundance of tintin- nids and copepods in the Pichavaram man- groves were rather poor when compared to the adjacent biotopes such as Vellar estuary or the coastal sea [up to 70 species by Subbaraju (1968); 49 species by Damodara Naidu (1980); 45 species by Baskaran (1984); 130 species by Krishnaswamy (1953)].
The occurrence of only a few species in the waterways of the mangrove ecosystem could be due to the shallowness of the water column, the varying water salinity because of the constant ebb and flow of tides and the highly turbid na- ture of the water. Dutta et al. (1954) and Baidya (1984) reported in Hooghly estuary of West Bengal, that the turbidity of water plays an im- portant role in the distribution of zooplankton. Higher occurrence and abundance of species at s!ations 2 and 3 might he due to the migration of neritic species into this area during high tide. The higher values of temperature and salinity ..*,.....,1,A --., ni‘._ ,,,t,;~..t0 tn thn nrpntpr ,ec”,“G” ,rray <1IJ” ~“I,III”UC~ IV LIIC- 6’bULti’L number of species found at these stations. The lower number at station 1 might be due to the frequent inflow of freshwater from the adjacent irrigation channels. The input of freshwater into sation 1 from the upland regions brings consid- erable amounts of terrigenous material and ac- counts for the highly turbid nature of the water at this station. This could have been the reason for the lower number of tintinnids and cope- pods recorded at this station throughout the year. Damodara Naidu (1980) and Palaniappan and Baskaran (1985) also observed a greater number of zooplanktonic species in the interior of the mangroves. The following reasons may be attributed to the recorded maximum abun-
Ciencias Marinas, Val. 20, No. 3, 1994
Las especies Acartia southwellii, A. danae, Acrocalanus longicornis. Macrosetella gracilis, Euterpina acutifrons y Oithona sitnilis fueron las responsables de esta máxima abundancia. Durante la abundancia mínima, únicamente se encontraron Acartia southwellii y Oithona
similis.
Coeficiente de correlación
En las tres estaciones, se observó una corre- lación positiva notable entre la abundancia mensual de copépodos y tintínidos. La tabla 8 muestra una correlación altamente significativa entre la abundancia mensual de tintínidos y la
de copépodos, en las tres estaciones. Esta puede mostrar la relación de su red alimentaria en este ecosistema.
DISCUSION
La naturaleza variable de los parámetros ambientales puede afectar la presencia, compo- sición y distribución del plancton. De la varie- dad del zooplancton, tintinidos y copépodos fueron los mayores componentes durante el pe- riodo de estudio, como sucede en diferentes manglares de la India según informan: Subbara- ju y Krishnamurthy (1972) 91%; Goswami y Selvakumar (1977) 71.75%; Damodara Naidu (1980) 89.75%; Bhunia y Choudhury (1981), 89.30%. Parece ser que la composición de espe- cies y la abundancia de tintínidos y copépodos en los manglares de Pichavaram fue más bien nnhrm c; CP rnmnc.r~ ,.nn !=J hintnnnc ~A,,ta_ pvv,ti 2, Llr ‘“LA,tJ‘uU UV11 “1”L”yV.z UUJU
centes, como el estuario Vellar 0 el mar costero [hasta 70 especies según Subbaraju (1968); 49, según Damodara Naidu (1980); 45, según Baskaran (1984); 130, según Krishnaswamy (1953)].
La presencia de sólo algunas especies en los canales dei ecosistema de manglares podía de- berse a la poca profundidad de la columna de agua, la salinidad variante del agua por el cons- tante flujo y reflujo de las mareas y la natura- leza altamente turbia del agua. Dutta et al. (1954) y Baidya (1984) informaron que, en el estuario Hooghly de Bengala Occidental, la tur- bidez del agua tiene un papel importante en la distribución del zooplancton. La mayor pre-
386

N. Godhantaraman: Spccies composition and abundance oftintinnids and copepods
Table 8. Simple correlation coefticient (r) values and probability values bctwccn the monthly ahun-
dance of copepods and tintinnids.
Tabla 8. Valores del cociiciente de correlación simple (r) y valores de probabilidad entre la abundan-
cia mensual de copepodos y tintínidos.
Station
1
2
3
Correlation cocfticient (r)
0.8626
0.7770
0.9274
Probahility value
1’ < 0.00 I
P c 0.0 I
P K 0.00 I
dance of both groups during summer: (a) for
tintinnids thc regularity of the reproductive
cycle and rapid ccll division: (b) for copcpods
to breed. propagate and colon&
During summcr. a greater number of
smaller-sized tintinnids wcre observcd. This
could be due to the relative consistency of tem-
perature and salinity regimes of the water col-
umn. The dominance of smaller-sized food
items like naked tlagcllates, smaller-sized dia-
toms and peridiniana during this season could
also be the reason for their peak abundance.
Similar observations were made by Tranter and
Abraham (197 1), Subbaraju and Krishnamurthy
(1972), Krishnamurthy and Santhanam (1975)
Damodara Naidu (1980). This observation of
smaller-sized diatoms, dinotlagellates and per-
idinians in these mangrove waters is similar to
the observation of Mani (1989) who estimated
total phytoplankton biomass (9.99 x 10’ cells/l)
with dominance of smaller-sized phytoplankton
during summer. Kannan and Krishnamurthy
(1979) also estimated the biomass of photosyn-
thetic bacterioplankton (bacteriochlorophyll
30.23 mgim’) and phytoplankton (chlorophyll a
24.57 mg/m’) in these mangrove waters.
scncia y abundancia dc cspccics cn las esta-
ciones 2 y 3 pucdc dcbcrse a la inmigracion dc
las cspccics neríticas a esta zona durante la ma-
rca alta. Los altos valores de tcmpcratura y sali-
nidad registrados pucdcn tamhicn contribuir al
alto número dc cspccics encontrado cn estas cs-
taciones. El número menor encontrado en la es-
tación 1 puede deberse al frecuente flujo en-
trante de agua dulce de los canales adyacentes
de irrigación. La entrada de agua dulce prove-
niente de las regiones altas lleva a la estacihn
Icantidades considerables de material terrígeno
y causa la naturaleza altamente turbia del agua.
Esta puede haber sido la razón de que fuera me-
nor el número de tintínidos y copepodos rcgis-
trados en esta estación durante todo el airo.
Damodara Naidu (1980) y Palaniappan y Ras-
karan (1985) también observaron un número
mayor de especies zooplanctónicas cn cl inte-
rior de los manglares. La máxima abundancia
registrada de ambos grupos durante cl verano se
puede atribuir a las siguientes razones: a) en el
caso de los tintínidos, la regularidad del ciclo
reproductivo y la rápida división celular; b) en
el caso de los copépodos, la crianza, propaga-
ción y colonización.
Por tintinnids, the species of the genus Tin- Durante el verano, SC observo un número
tinnopsis were the most important in terms of mayor dc tintinidos de menor tamano, proha-
the number of species. Species like Tintinnopsis blcmentc debido a la relativa consistencia de
cylindrica, T. mortensenii, Favella philippinen- los regímenes de temperatura y salinidad de la
sis and F. brevis contributed to the maximum columna dc agua. Durante esta estación, cl do-
abundance. This may be due to the high re- minio de elementos alimenticios dc menor ta-
productive capacity of the species. Similarly, mano, como flagelados dcscubicrtos, diatomeas
Damodara Naidu (1980) and Jcgadeesan (1986) mcnorcs y perideos, podría tambicn ser la razón
also noticed such tintinnid species dominancy dc su pico de abundancia. Trantcr y Abraham
in the bulk of the biomass of microzooplankton (1971) Subbara,ju y Krishnamurthy (1972)
in the mangrove waters and adjacent Coleroon Krishnamurthy y Santhanam (1975) y Damoda-
estuarine complex. ra Naidu (1980) han hecho observaciones simi-
387

Among the non-agglomerated tintinnids, Favella philippinensis and F. brevis were the dominant forms during the peak of tintinnid abundance. This might be due to the rapid cell division of the species and the abundance of suitable food items. A swarm of F. philippi- nensis (12,858,OOO org./m’) was also recorded in the Vellar estuary by Krishnamurthy and Damodara Naidu (1977).
Among the species of copepods, the cala- noids were represented by more species than the cyclopoids. The calanoid Acartia spp. and cyclopoid Oithona spp. were found to be domi- nant in the present study. This may be due to their continuous breeding behaviour, quick lar- val development and that they adopt well to the environmental conditions of the mangroves. This dominance of Acartia spp. among cala-
-noids was reported for the Godavari estuary
(Chandramohan, 1963) and Cochin backwaters (Menon et al., 1971; Madhupratap, 1978), and that of Oithona spp. among cyclopoids was noticed in the Vellar estuary (Chandran, 1982; Sivakumar, 1982). Similar findings were also noticed in Malaysian waters by Chong and Chua (1973), who pointed out that the abun- dance of Oithona spp. was mainly due to its high reproductive capacity.
The dominant copepods in the present study were Acartia danae, A. southwellii, Acro- calanus gracilis, Pseudodiaptomus serricauda- tus, Euterpina acutifrons, Macrosetella gracilis,Microsetella rosea, Oithona rigida and Oithona similis. The abundance of these species might be due to their continuous breeding na- ture and the suitable environmental conditions of the ecosystem. Similar dominance of this species in bulk to the biomass of macrozoo- plankton in the Mandovi and Zuari estuaries was also recorded by Dwivedi et al. (1974) and in the Vellar estuary by Thangaraj (1984).
The maximum monthly abundance of tin- tinnids coincided with the maximum monthly copepod abundance. The correlation coefficient and probability values showed a signiticant relationship between the abundance of tintin- nids and copepods. This could be attributed to the trophic relationship existing between tin- tinnids and copepods. The peak of copepod abundance (80,740 org./m’) during summer was succeeded by the peak of tintinnid abun-
Ciencias Marinas, Val. 20, No. 3, 1994
lares. Las observaciones de diatomeas menores, dinoflagelados y perideos efectuadas en las aguas de estos manglares son similares a las de Mani (1989), quien estimó la biomasa total del fitoplancton, 9.99 x lo5 cel/l, con dominio del titoplancton de tannúío mas pequefio, durante el verano. Kannan y Krishnamurthy (1979) tam- bién estimaron la biomasa del bacterioplancton fotosintético (bacterioclorofila 30.23 mg/m3), y fitoplancton (clorofila a 24.57 mg/m’), en las aguas de estos manglares.
Para los tintínidos, las especies del genero Tintinnopsis fueron las mas importantes, en términos del número de especies. Las especies como Tintinnopsis cylindrica, T. mortensenii, Favella philippinensis y F. brevis contribuye- ron a la abundancia máxima. Esto puede de- berse a la alta capacidad reproductiva de las es-
pecies. De manera parecida, Damodara Naidu (1980) y Jegadeesan (1986) notaron este domi- nio de las especies de tintínidos en la mayor parte de la biomasa del microzooplancton, en las aguas de los manglares y en el complejo es- tuarino adyacente de Coleroon.
Entre los tintínidos no aglomerados, Favel- la philippinensis y F. brevis fueron las formas dominantes durante el pico de abundancia de tintínidos. Esto puede deberse a la rápida divi- sión celular de las especies y la abundancia de elementos alimenticios apropiados. Una multi- tud de F. philippineisis (12,850,OOO org./m3) fue también registrada por Krishnamurthy y Damodara Naidu (1977) en el estuario Vellar.
Entre las especies de copépodos, los cala- noides estuvieron representados por más espe- cies que los ciclopoides. Se encontró que el calanoide Acartia spp. y el ciclopoide Oithona spp. fueron dominantes en el presente estudio. Esto puede deberse a su comportamiento repro- ductivo continuo, desarrollo larval rápido y a que se adaptan bien a las cambiantes condi- ciones ambientales de los manglares. Este do- minio de Acartia spp. entre los calanoides fue observado en el estuario de Godavari (Chandramohan, 1963), el remanso de Cochin (Menon et al., 1971; Madhupratap, 1978) y el de Oithona spp. entre los ciclopoides fue ob- servado en el estuario de Vellar (Chadran, 1982; Sivakumar, 1982). Chong y Chua (1973) encontraron proporciones similares en aguas malasias y señalaron que la abundancia de Oi-
388

N. Godhantaraman: Species composition and abundance of tintinnids and copepods
dance (44,990 org./m’) during the tail end of summer and the early premonsoon season. Damodara Naidu (1980) also observed such a significant relationship between these two groups in mangrove waters during his investigation.
thona spp. se debió principalmente a su alta ca- pacidad reproductora.
Ttlc low ablJndaflC< of nlnnlitnn rccordcd Y.-..‘-I-&- during the monsoon season might be due to the non-availability of food, low temperature and low salinity. The disturbance of the food web and minimum production of plankton during the monsoon season have been observed in many Indian estuaries and mangroves (Dutta et al., 1954; Shztty et al., 1982; Subbaraju and Krishnamurthy, 1972; Madhupratap, 1976; Damodara Naidu, 1980; Prince Jeyaseelan and Krishnamurthy, 1980; Bhunia and Choudhury, 1981). During the monsoon, the values of sa- linity decreased (3.4 and 18.7 ppt) owing to the inflow of freshwater. The low salinity would drastically affect the plankton abundance (Wilson, 1942; Damodara Naidu, 1980; Baska- ran, 1984). In the present investigation, the in- crcasc or dccrease of salinity in the water column exert cither a direct or an indirect effect on species composition and abundance. A di-
rect effect is the disappearance of some forms and replacement by others. The second effect is probably the migration of some species from one station to another to avoid either low or high salinity. The indirect effect might be due to tht: scarcity of food caused by the fluctua- tions of salinity in the waters, ultimately affect- ing the population abundance of tintinnids and copepod<.
Los copépodos dominantes en el presente estudio fueron Acartia danae. A. southwellii, Acrocalanus gracilis, Pseudodiaptomus serri- caudatus, Euterpina acutifrons, Macrosetella ornrrlir Mirrnwtolln rnron Oithnnn rioi,/n v ‘3’ --v-w-l II_._. -1-.-..- _“__, v ..,._,.l , ‘b’“‘- -’
Oithona similis. La abundancia de estas espe- cies puede deberse a su naturaleza de repro- ducción continua y a condiciones ambientales apropiadas del ecosistema. Un dominio similar de esta especie en la mayoría de la biomasa del macrozooplancton fue registrado por Dwivedi et al.( 1974), en los estuarios de Mandovi y Zuari, y por Thangaraj (1984), en el estuario de Vellar.
ACKNOWLEDGEMENTS
The author thanks K. Krishnamurthy (C.A.5 in Marine Biology, Annamalai Uni- versity) for his constant encouragement and guidance, and the Ministry of Environment & Forests, Government of India, for financia1 as- sistance to carry out thls work. 1 hanks are also due to the Director of C.A.S. in Marine Biology for the facilities provided. The partial
financia1 support extended to the author by the organizers of the I:ourth International Confer- ence on Copepoda. Japan, and the Tamil Nadu State Council for Science & Technology to participate in the conference, where a brief ver-
La abundancia máxima mensual de tintíni-
dos coincide con la abundancia máxima men- sual de copépodos. Los valores del coeficiente de correlación (r) y de probabilidad muestran una relación significativa entre la abundancia de tintínidos y copépodos. Esto puede atribuise a la relación trófica existente entre ambos. El pico de la abundancia de copépodos durante cl
verano (80,740 org.im3) fue seguido por el pico de la de tintínidos (44,990 org./m3) durante el
Íinai dei verano y ei inicio de ia estación pre- monzónica. Damodara Naidu (1980) también observó esta relación significativa entre los dos grupos, en aguas de manglares.
La baja abundancia de plancton registrada durante la estación del monzón puede deberse a la falta de disponibilidad de alimento, así como a bajas temperatura y salinidad. La perturbación de la cadena alimentaria y la mínima produc- ción de plancton durante la estación del monzón se observó en muchos estuarios y man- “lll.PC flP II Inrli:, fnl,tt5? ot “1 é,U.“., “” .- _..“... \yu.... -. . . . . 1954, ‘2hettv o[ ./ y..v..,
al., 1982; Subbaraju y Krishnamurthy, 1972; Madhupratap, 1976; Damodara Naidu, 1980; Prince Jeyaseelan y Krishnamurthy, 1980; Bhu- nia y Choudhury, 198 1). Durante el monzón, los valores de salinidad disminuyeron (3.4 y 18.7 ppm) debido a la entrada de agua dulce. La baja salinidad afecta drásticamente la abundancia de plancton (Wilson, 1942;
Damodara Naidu, 1980; Baskaran, 1984). En la presente investigación, el aumento o dismi- nución de la salinidad en la columna de agua ejerció un efecto directo o indirecto sobre la
., composlcion y abundancia de especies. Un
389

Ciencias Marinas, Vol. 20, No. 3, 1994
sion of the paper was presented, is gratefully acknowledged.
REFERENCES
Baidya, A.U. (1984). Ecology of the Copepo- da (Calanoid) components of zooplankton in Hooghly estuary, West Bengal, India. Ph.D. thesis, Calcutta University, 92 pp.
Baskaran, K. (1984). Studies in estuarine and backwater copepods. M.Phil. thesis, An- namalai University, ll6 pp.
Beers, J.R. and Stewart, G.L. (1969). Micro- zooplankton and its abundarme relative to the larger zooplankton and other seston components. Mar. Biol., 4: 182-l 89.
Bhunia, A.B. and Choudhury, A. (1981). Stu- dies on the seasonal abundance and bio- mass of crustacean zooplankton and chaetognaths in relation to ecological pa- rameters of a tidal creek (Mooriganga) of Sagar island (North), Sunderbans, West Bengal. Proc. Symp. Ecol. Anim. Popul. Zool. Surv., India, pp. l75- 183.
Capriulo, G.M. and Carpenter, E.J. (1983). Abundance, species composition and feed- ing impact of tintinnid microzooplankton in central Long Island Sound. Mar. Ecol. Prog. Ser., 10: 277-288.
Chandran, R. (1982). Hydrobiological studies in the gradient zone of the Vellar estuary. Ph.D. thesis, Annamalai University, 195
PP, Chandramohan, P. (1982). Studies on zoo-
plankton of the Godavari estuary. Ph.D. thesis, Annamalai University, 163 pp.
Chong, B.J. and Chus, T.D. (1973). A prelimi- muy study of the distribution of the cyclo- poid copepods of the family Oithonidae in Malaysian waters. Pacitic Science Associ- ation Special Symposium on Marine Science, pp. 32-36.
Conover, R.J. (1982). Interrelation between mi- crozooplankton and other plankton organ- isms. Annls. Inst. Oceanogr., Paris,
58(5): 3 l-46. Damodara Naidu, W. (1980). Studies on tin-
tinnids (Protozoa: Ciliata) of Porto NOVO region, South India. Ph.D. thesis, Anna- malai University, 28 1 pp.
efecto directo es la desaparicibn de algunas for- mas y la sustitución por otras. El segundo efec- to es probablemente la emigración de ciertas especies de una estación a otra, para evitar la baja o alta salinidad. El efecto indirecto puede deberse a la escasez de alimento causada por las fructuaciones de salinidad en las aguas, que fi-
nalmente afecta a la abundancia de la poblacibn de tintínidos y copepodos.
AGRADECIMIENTOS
El autor agradece a K. Krishnamurthy, del Centro de Estudios Avanzados en Biología Ma- rina, Universidad Annamalai, su constante estímulo y guía, y al Ministro del Ambiente y
Bosques, del Gobierno de la India, la asistencia financiera para llevar a cabo este trabajo. Se agradecen también las facilidades proporciona- das por el Director del centro de investigación mencionado. Se reconoce ampliamente el tinan- ciamiento parcial dado al autor por los organi- zadores de la Cuarta Conferencia Internacional sobre Copepoda, Japón, y el Consejo Estatal de Tamil Nadu para la Ciencia y la Tecnología, a fin de participar en la conferencia, donde se presentó una versión breve del artículo.
Traducido al espaí’iol por Olivia Gómez
Mora.
Damodara Naidu, W., Santhanam. R., Krish- namurthy, K. and Natarajan, R. (1977). The species biomass and the seasonal composition of tintinnids (Protozoa: Cilia- ta). Proc. Symp. Warm Water Zool. Spl. Publ. UNESCO/NIO, pp. 520-527.
Dussart, B.H. (1965). Les differentes categories du plancton. Hidrobiologia, 26: 72-74.
Dutta, N., Malhotra, J.C. and Bose, B.B. (1954). Hydrology and seasonal fluctua- tion of the plankton in Hooghly estuary. Symp. Mar. Freshwat. Plankton in the Indo-Pacific IPFC, Bangkok, pp. 35-47.
Dwivedi, SN., Bhargava, R.M.%, Parulekar, A.H., Selvakumar, R.A., Singbal, S.Y.S. and Sankaranarayanan, V.N. (1974).
Ecology and environmental monitoring of Mandovi, Zuari and Comburzua canal
390

N. Godhantaraman: Species composition and abundance of tintinnids and copepods
complex during monsoon months. J. In- dian Fish. Ass., 3 & 4(1 & 2): 113-130.
Goswami, S.C. and Selvakumar, R.A. (1977). Plankton studies in the estuarine system of Goa. Proc. Symp. Warm Water Zoopl. Spl. Publ. UNESCO/NIO, pp. 228-241.
Jegadeesan, P. (1986). Studies on enviro;- mental inventory of the marine zone of Coleroon estuary and inshore waters of Pazhayaru, southeast coast of India. Ph.D. thesis, Annamalai University, 277 pp.
Kanna, L. and Krishnamurthy, K. (1979). Bio- mass of photosynthetic bacterioplankton and phytoplankton. Indian J. Microbiol., 19(2): 64-68.
Krishnamurthy, K. (1962). Daily variations in marine plankton from Porto Novo, S. In- dia. J. Zool. Soc. India, 13: 180-187.
Krishnamurthy, K. and Santhanam, R. (1975). Ecology of tintinnids (Protozoa: Ciliata) in Porto Novo region. Indian J. Mar. Sc¡., 4: 181-184.
Krishnamurthy, K. and Damodara Naidu, W. (1977). Swarming of the tintinnids (Pro- tozoa: Ciliata) in the Vellar estuary. Curr. Sc¡., 46( ll): 384.
Krishnamurthy, K., Santhanam, R. and Sunda- raraj, V. (1979). The trophic tier. Marine Sciences, 209-2 17.
Krishnaswamy, S. (1953). Pelagic copepods of the Madras coast. J. Madras Univ. B., 23: 67-75, 107- 144.
Madhupratap, M. (1976). Studies on the ecol- ogy of zooplankton of Cochin backwaters (a tropical estuary). Ph.D. thesis, Cochin University.
Madhupratap, M. (1978). Studies on the ecolo- DV nf‘ Tnnnlanktnn nf f’nrhin hnrkwntws o, v_ l--ï .I....._.. -1 _“_ . . . . . __” . . . . l._.l, Mahasagar Bull. Nat. Inst. Oceanogr., 1 l(l&2): 45-46.
Mani, P. (1989). I’hytoplankton ecology of the mangrove ecosystems. Ph.D. thesis, Anna- malai University, 122 pp.
Menon, N.R., Venugopal, P. and Goswami. S.C. (1971). Total biomass and faunistic composition of zooplankton in the Cochin backwaters. J. Mar. Biol. Ass. India, 13: 220-225.
Palaniappan, R. and Baskaran, K. (1985). Dis- tribution and abundance of zooplankton in Pichavaram mangrove, South India. The mangroves. Proc. Nat. Symp. Biol. Util. Cons. Mangroves, pp. 499-504.
Prince Jeyaseelan, M.J. and Krishnamurthy, K. (1980). Role of mangrove forests of Pi- chavaram as fish nurseries. Proc. Indian Natn. Sc¡. Atad. B., 46: 48-53.
Shetty, H.P.C., Saha, S.B. and Ghosh, B.B. (1982). Observation on the distribution and fluctuations of plankton in the Hooghly-Maltah estuary system, with notes on their relation to commercial iish landings. Indian J. Fish., 8: 326-363.
Shukhanova, Z.N. (1978). Settling without the inverted microscope. In: A. Sournia (ed.), Phytoplankton Manual UNESCO, Page Brothers (Noruie) Ltd., 97 pp.
Sivakumar, V. (1982). An environmental in- ventory of the tidal zone of the Vellar es- tuary. Ph.D. thesis, Annamalai Universi-
ty, 178 PP. Strickland, J.D.H. and Parsons, T.R. (1972). A
practica1 handbook of seawater analysis. Bull. Fish. Res. Bd. Canada, 167: 310.
Subbaraju, R.C. (1968). Studies on planktonic copepods of estuarine and inshore waters at Porto Novo (S. India). Ph.D. thesis,
Annamalai üniversity. Subbaraju, R.C. and Krishnamurthy, K. (1972).
Ecological aspects of plankton production. Mar. Biol., 14: 25-31.
Sundaramj, V. and Krishnamurthy, K. (1974). Studies on phytoplankton pigments in Por- to Novo waters (India). 1. Mangrove. J. Exp. Mar. Biol. Ecol., 14: 275-284.
Thnnourai G < (198A\ Frnhinlnm nf !t~g ~.a- . ..1.. b _‘_,> -.-. \‘, _ . ,. -___._._C1, _. rine zone of the Vellar estuary. Ph.D. the- sis, Annamalai University, 192 pp.
Tranter, D.J. and Abraham, A. (1971). Cocxis- tcnce of species of Acartiidae (Copepoda) in the Cochin backwaters, a monsoonal es- tuarine lagoon. Mar. Biol., ll : 222-241.
Utermöhl, H. (1958). Zur Vervollkommnung dcr quantitativen phytoplankton methodik. Mitt. Int. Verein. Theor. Angew. Limnol., 9: 38.
Wilson, C.B. (1942). Carnegie Inst. Wash. Pub.. 536.
391
View publication statsView publication stats