Embed Size (px)
Citation preview

CICC CSI Select 100 ETF Stock codes: 83093 (RMB counter),
3093 (HKD counter)
CICC Bloomberg Barclays China Treasury 1-10 Years ETF
Stock codes: 83079 (RMB counter), 3079 (HKD counter)
ICBC CICC USD Money Market ETF
Stock codes: 9011 (USD counter), 3011 (HKD counter)
For the year ended 31 December 2020
Annual Report
CICC Fund Series
CICC Fund Series Annual Report
Year ended 31 December 2020
Contents Page(s) Administration and management 1 Manager’s report 2 - 4 Trustee’s report 5 Independent auditor’s report 6 - 10 Statements of assets and liabilities 11 - 14 Statements of comprehensive income 15 - 17 Statements of changes in net assets attributable to unitholders 18 - 21 Statements of cash flows 22 - 27 Notes to the financial statements 28 - 60 Portfolio statement (Unaudited) 61 - 69 Statement of movements in portfolio holdings (Unaudited) 70 - 83 Performance record (Unaudited) 84 - 86 Underlying index constituent stocks disclosure (Unaudited) 87

CICC Fund Series Annual Report
Year ended 31 December 2020
1
Administration and management Manager Directors of the Manager China International Capital Corporation Hong Kong Asset Management Limited 29/F, One International Finance Centre 1 Harbour View Street Central Hong Kong
Mr. Feng Ping Mr. Lin Ning Ms. Ma Kui Mr. Wong King Fung
Legal Counsel to the Manager Trustee and Registrar Deacons 5/F, Alexandra House 18 Chater Road Central Hong Kong
Brown Brothers Harriman Trustee Services (Hong Kong) Limited 13/F, Man Yee Building 68 Des Voeux Road Central Central Hong Kong
Auditor Service Agent KPMG 8/F, Prince’s Building 10 Chater Road Central Hong Kong Public Interest Entity Auditor registered in accordance with the Financial Reporting Council Ordinance
HK Conversion Agency Services Limited 1/F, One & Two Exchange Square 8 Connaught Place Central Hong Kong
Investment Adviser for ICBC CICC USD Money Market ETF
Listing Agent
ICBC Asset Management (Global) Company Limited Unit 2507-2510, 25/F, ICBC Tower 3 Garden Road, Central Hong Kong
China International Capital Corporation Hong Kong Securities Limited 29/F, One International Finance Centre 1 Harbour View Street Central Hong Kong

CICC Fund Series Annual Report
Year ended 31 December 2020
2
Manager’s report CICC CSI Select 100 ETF Introduction The CICC CSI Select 100 ETF (the “Sub-Fund”), a sub-fund of the CICC Fund Series (the “Trust”), was launched on 30 November 2018 and commenced trading under the stock codes 3093 for the HKD counter and 83093 for the RMB counter on The Stock Exchange of Hong Kong Limited (the “SEHK”) on 5 December 2018. Each Sub-Fund is a Hong Kong unit trust authorised under the Securities and Futures Ordinance (Cap. 571) of Hong Kong. The Sub-Fund is benchmarked against the CSI CICC Select 100 Index. The manager of the Sub-Fund is China International Capital Corporation Hong Kong Asset Management Limited (the “Manager”) and the trustee is Brown Brothers Harriman Trustee Services (Hong Kong) Limited (the “Trustee”). Performance of the Sub-Fund The investment objective of the Sub-Fund is to provide investment results that, before fees and expenses, closely correspond to the performance of the CSI CICC Select 100 Index (the “Index”). There can be no assurance that the Sub-Fund will achieve its investment objective. The table below illustrates the comparison between the Sub-Fund's performance and that of the Index during the following period:
YTD 1-month 3-month 6-month Inception Sub-Fund’s Total
Return (%) 6.89% -0.79% 5.56% 13.29% 34.69%
Index Benchmark (%) 8.32% -0.75% 5.80% 14.03% 38.61% Activities of the Index The CSI CICC Select 100 Index underwent two reviews during the year. The Sub-Fund uses representative sampling strategy by investing directly in a representative sample of securities in the CSI CICC Select 100 Index. China International Capital Corporation Hong Kong Asset Management Limited 30 April 2021
CICC Fund Series Annual Report
Year ended 31 December 2020
3
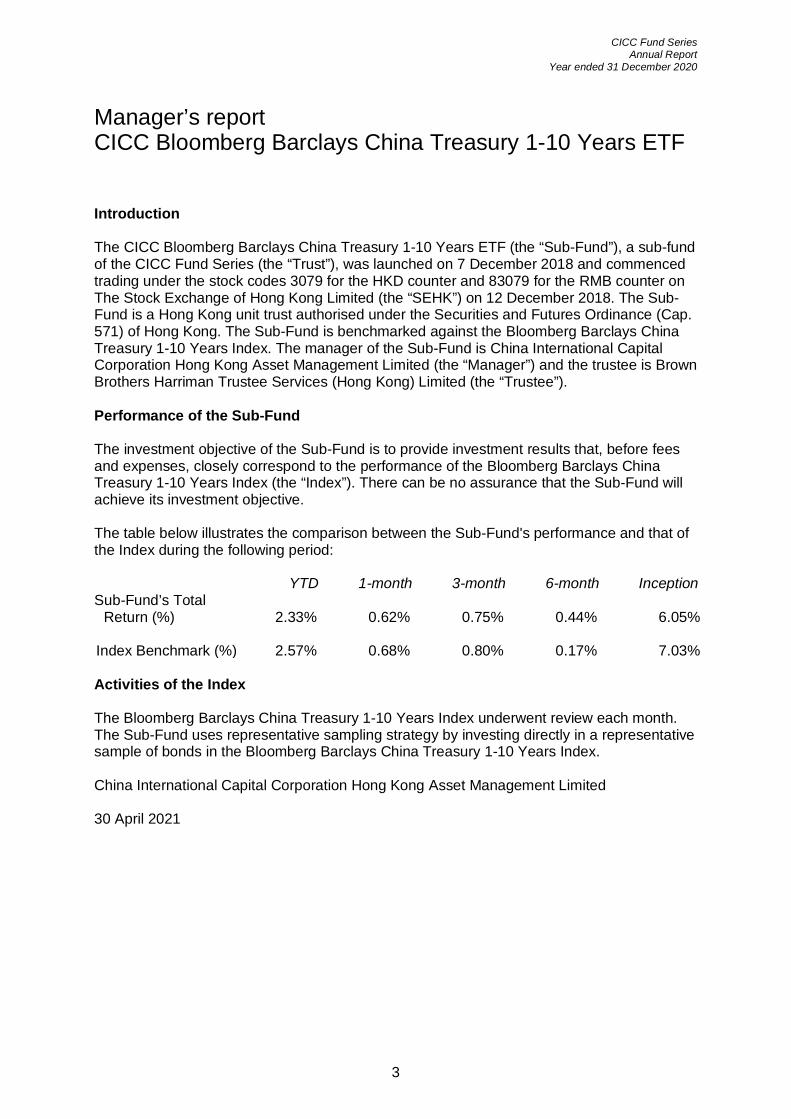
Manager’s report CICC Bloomberg Barclays China Treasury 1-10 Years ETF Introduction The CICC Bloomberg Barclays China Treasury 1-10 Years ETF (the “Sub-Fund”), a sub-fund of the CICC Fund Series (the “Trust”), was launched on 7 December 2018 and commenced trading under the stock codes 3079 for the HKD counter and 83079 for the RMB counter on The Stock Exchange of Hong Kong Limited (the “SEHK”) on 12 December 2018. The Sub-Fund is a Hong Kong unit trust authorised under the Securities and Futures Ordinance (Cap. 571) of Hong Kong. The Sub-Fund is benchmarked against the Bloomberg Barclays China Treasury 1-10 Years Index. The manager of the Sub-Fund is China International Capital Corporation Hong Kong Asset Management Limited (the “Manager”) and the trustee is Brown Brothers Harriman Trustee Services (Hong Kong) Limited (the “Trustee”). Performance of the Sub-Fund The investment objective of the Sub-Fund is to provide investment results that, before fees and expenses, closely correspond to the performance of the Bloomberg Barclays China Treasury 1-10 Years Index (the “Index”). There can be no assurance that the Sub-Fund will achieve its investment objective. The table below illustrates the comparison between the Sub-Fund's performance and that of the Index during the following period:
YTD 1-month 3-month 6-month Inception Sub-Fund’s Total
Return (%) 2.33% 0.62% 0.75% 0.44% 6.05%
Index Benchmark (%) 2.57% 0.68% 0.80% 0.17% 7.03% Activities of the Index The Bloomberg Barclays China Treasury 1-10 Years Index underwent review each month. The Sub-Fund uses representative sampling strategy by investing directly in a representative sample of bonds in the Bloomberg Barclays China Treasury 1-10 Years Index. China International Capital Corporation Hong Kong Asset Management Limited 30 April 2021

CICC Fund Series Annual Report
Year ended 31 December 2020
4
Manager’s report ICBC CICC USD Money Market ETF Introduction The ICBC CICC USD Money Market ETF (the “Sub-Fund”), a sub-fund of the CICC Fund Series (previously known as CICC ETF Series) (the “Trust”), was launched on 14 June 2019 and commenced trading under the stock codes 3011 for the HKD counter and 9011 for the USD counter on The Stock Exchange of Hong Kong Limited (the “SEHK”) on 18 June 2019. The Sub-Fund is a Hong Kong unit trust authorized under the Securities and Futures Ordinance (Cap. 571) of Hong Kong and is an actively managed exchange traded fund under Chapters 8.2 and 8.10 of the Code on Unit Trusts and Mutual Funds (the “Code”). On 18 November 2019, two unlisted classes of units, namely Class A (USD) and Class I (USD) was established for the Sub-Fund. Through Class A (USD) and Class I (USD), subscriptions to and redemptions from the Sub-Fund may be made by investors at their Net Asset Value (“NAV”). The manager of the Sub-Fund is China International Capital Corporation Hong Kong Asset Management Limited (the “Manager”). The investment adviser of the Sub-Fund is ICBC Asset Management (Global) Company Limited (the “Investment Adviser”) and the trustee is Brown Brothers Harriman Trustee Services (Hong Kong) Limited (the “Trustee”). Performance of the Sub-Fund The Sub-Fund’s objective is to invest in short-term deposits and high quality money market investments. The Sub-Fund seeks to achieve a return in US Dollars in line with prevailing money market rates, with primary considerations of both capital preservation and liquidity. There can be no assurance that the Sub-Fund will achieve its investment objective. The Sub-Fund seeks to achieve its investment objective by investing primarily (i.e. not less than 70% of the NAV of the Sub-Fund in US Dollars-denominated and settled short-term deposits and high quality money market investments issued by governments, quasi-governments, international organizations and financial institutions. The Sub-Fund offers both listed class of units and unlisted class of units. The table below illustrates the performance of the respective classes of units of the Sub-Fund during the following period: YTD 1-month 3-month 6-month Inception Listed Class 1.30% 0.05% 0.17% 0.41% 2.63% Unlisted Class A (USD) 1.19% 0.05% 0.14% 0.35% 1.42% Unlisted Class I (USD) 1.26% 0.05% 0.16% 0.39% 1.50% China International Capital Corporation Hong Kong Asset Management Limited 30 April 2021

CICC Fund Series Annual Report
Year ended 31 December 2020
5
Trustee’s report CICC CSI Select 100 ETF CICC Bloomberg Barclays China Treasury 1-10 Years ETF ICBC CICC USD Money Market ETF We hereby confirm that, in our opinion, the Manager of the Sub-Funds within the Trust has, in all material respects, managed the Sub-Funds in accordance with the provisions of the Trust Deed dated 5 November 2018, as amended from time to time, for the year ended 31 December 2020.
) ) For and on behalf of ) Brown Brothers Harriman Trustee ) Services (Hong Kong) Limited, ) Trustee ) 30 April 2021

kpmg
6
Independent auditor’s report to the unitholders CICC CSI Select 100 ETF CICC Bloomberg Barclays China Treasury 1-10 Years ETF ICBC CICC USD Money Market ETF Opinion We have audited the financial statements of CICC CSI Select 100 ETF (“CSI Select”), CICC Bloomberg Barclays China Treasury 1-10 Years ETF (“BBCT”) and ICBC CICC USD Money Market ETF (“MM”), collectively the “Sub-Funds” of CICC Fund Series (the “Trust”) set out on pages 11 to 60 which comprise the statement of assets and liabilities as at 31 December 2020, the statement of comprehensive income, the statement of changes in net assets attributable to unitholders and the statement of cash flows for the year ended 31 December 2020 and notes to the financial statements, including a summary of significant accounting policies. In our opinion, the financial statements give a true and fair view of the financial position of the Sub-Funds of the Trust as at 31 December 2020 and of their financial transactions and cash flows for the year then ended in accordance with International Financial Reporting Standards (“IFRSs”) issued by the International Accounting Standards Board (“IASB”). Basis for opinion We conducted our audit in accordance with International Standards on Auditing (“ISAs”) issued by the International Auditing and Assurance Standards Board (“IAASB”). Our responsibilities under those standards are further described in the Auditor’s responsibilities for the audit of the financial statements section of our report. We are independent of the Trust and its Sub-Funds in accordance with the International Ethics Standards Board for Accountants’ Code of Ethics for Professional Accountants (“IESBA Code”) and we have fulfilled our other ethical responsibilities in accordance with the Code. We believe that the audit evidence we have obtained is sufficient and appropriate to provide a basis for our opinion.
kpmg
7
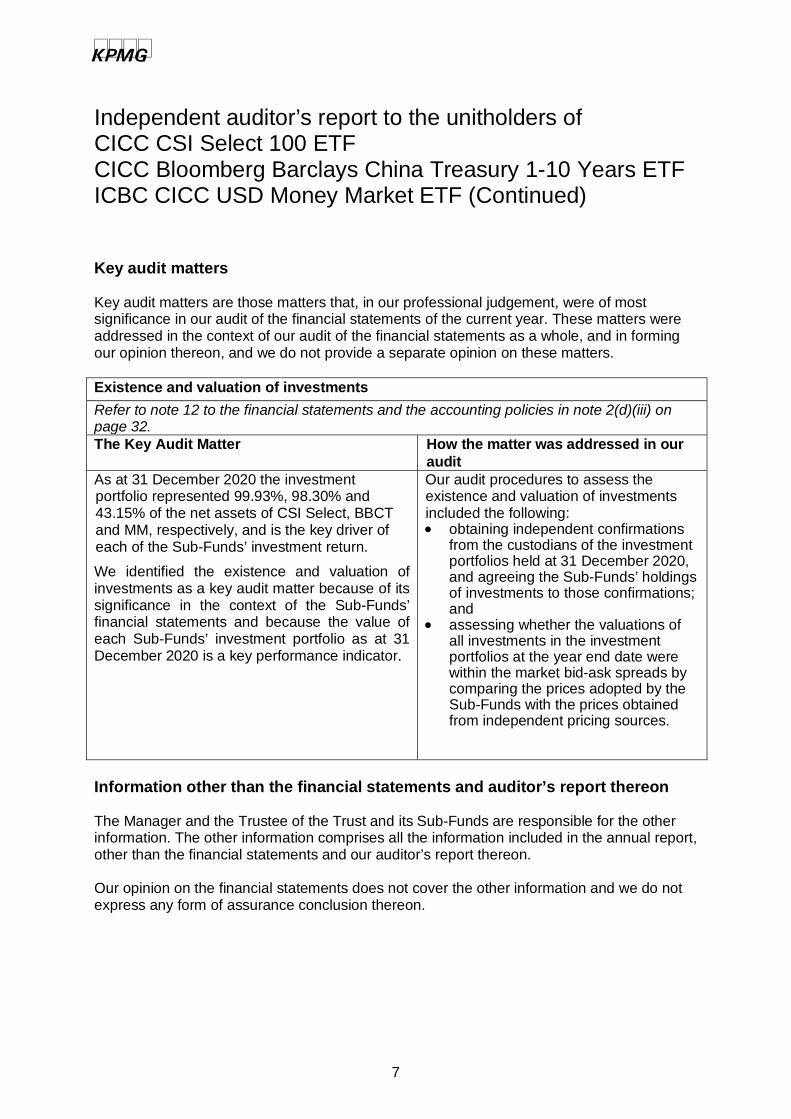
Independent auditor’s report to the unitholders of CICC CSI Select 100 ETF CICC Bloomberg Barclays China Treasury 1-10 Years ETF ICBC CICC USD Money Market ETF (Continued) Key audit matters Key audit matters are those matters that, in our professional judgement, were of most significance in our audit of the financial statements of the current year. These matters were addressed in the context of our audit of the financial statements as a whole, and in forming our opinion thereon, and we do not provide a separate opinion on these matters. Existence and valuation of investments Refer to note 12 to the financial statements and the accounting policies in note 2(d)(iii) on page 32. The Key Audit Matter How the matter was addressed in our
audit As at 31 December 2020 the investment portfolio represented 99.93%, 98.30% and 43.15% of the net assets of CSI Select, BBCT and MM, respectively, and is the key driver of each of the Sub-Funds’ investment return. We identified the existence and valuation of investments as a key audit matter because of its significance in the context of the Sub-Funds’ financial statements and because the value of each Sub-Funds’ investment portfolio as at 31 December 2020 is a key performance indicator.
Our audit procedures to assess the existence and valuation of investments included the following: • obtaining independent confirmations
from the custodians of the investment portfolios held at 31 December 2020, and agreeing the Sub-Funds’ holdings of investments to those confirmations; and
• assessing whether the valuations of all investments in the investment portfolios at the year end date were within the market bid-ask spreads by comparing the prices adopted by the Sub-Funds with the prices obtained from independent pricing sources.
Information other than the financial statements and auditor’s report thereon The Manager and the Trustee of the Trust and its Sub-Funds are responsible for the other information. The other information comprises all the information included in the annual report, other than the financial statements and our auditor’s report thereon. Our opinion on the financial statements does not cover the other information and we do not express any form of assurance conclusion thereon.

kpmg
8
Independent auditor’s report to the unitholders of CICC CSI Select 100 ETF CICC Bloomberg Barclays China Treasury 1-10 Years ETF ICBC CICC USD Money Market ETF (Continued) Information other than the financial statements and auditor’s report thereon (continued) In connection with our audit of the financial statements, our responsibility is to read the other information and, in doing so, consider whether the other information is materially inconsistent with the financial statements or our knowledge obtained in the audit or otherwise appears to be materially misstated. If, based on the work we have performed, we conclude that there is a material misstatement of this other information, we are required to report that fact. We have nothing to report in this regard. Responsibilities of the Manager and the Trustee of the Trust and its Sub-Funds The Manager and the Trustee of the Trust and its Sub-Funds are responsible for the preparation of the financial statements that give a true and fair view in accordance with IFRSs issued by the IASB, and for such internal control as the Manager and the Trustee determine is necessary to enable the preparation of financial statements that are free from material misstatement, whether due to fraud or error. In preparing the financial statements, the Manager and the Trustee of the Trust and its Sub-Funds are responsible for assessing the Trust and its Sub-Funds’ ability to continue as a going concern, disclosing, as applicable, matters related to going concern and using the going concern basis of accounting unless the Manager and the Trustee of the Trust and its Sub-Funds either intend to liquidate the Trust or its Sub-Funds or to cease operations, or have no realistic alternative but to do so. In addition, the Manager and the Trustee of the Trust and its Sub-Funds are required to ensure that the financial statements have been properly prepared in accordance with the relevant provisions of the Trust Deed dated 5 November 2018, as amended (“Trust Deed”) from time to time, and the relevant disclosure provisions of Appendix E of the Code on Unit Trusts and Mutual Funds (the “SFC Code”) issued by the Hong Kong Securities and Futures Commission. Auditor’s responsibilities for the audit of the financial statements Our objectives are to obtain reasonable assurance about whether the financial statements as a whole are free from material misstatement, whether due to fraud or error, and to issue an auditor’s report that includes our opinion. This report is made solely to you, as a body, and for no other purpose. We do not assume responsibility towards or accept liability to any other person for the contents of this report.
kpmg
9
Independent auditor’s report to the unitholders of CICC CSI Select 100 ETF CICC Bloomberg Barclays China Treasury 1-10 Years ETF ICBC CICC USD Money Market ETF (Continued) Auditor’s responsibilities for the audit of the financial statements (continued) Reasonable assurance is a high level of assurance but is not a guarantee that an audit conducted in accordance with ISAs will always detect a material misstatement when it exists. Misstatements can arise from fraud or error and are considered material if, individually or in the aggregate, they could reasonably be expected to influence the economic decisions of users taken on the basis of these financial statements. In addition, we are required to assess whether the financial statements of the Sub-Funds of the Trust have been properly prepared, in all material respects, in accordance with the relevant provisions of the Trust Deed and the relevant disclosure provisions of Appendix E of the SFC Code As part of an audit in accordance with ISAs, we exercise professional judgement and maintain professional scepticism throughout the audit. We also: Identify and assess the risks of material misstatement of the financial statements, whether
due to fraud or error, design and perform audit procedures responsive to those risks, and obtain audit evidence that is sufficient and appropriate to provide a basis for our opinion. The risk of not detecting a material misstatement resulting from fraud is higher than for one resulting from error, as fraud may involve collusion, forgery, intentional omissions, misrepresentations or the override of internal control.
Obtain an understanding of internal control relevant to the audit in order to design audit
procedures that are appropriate in the circumstances, but not for the purpose of expressing an opinion on the effectiveness of the Sub-Funds of the Trust’s internal control.
Evaluate the appropriateness of accounting policies used and the reasonableness of
accounting estimates and related disclosures made by the Manager and the Trustee. Conclude on the appropriateness of the Manager’s and the Trustee’s use of the going
concern basis of accounting and, based on the audit evidence obtained, whether a material uncertainty exists related to events or conditions that may cast significant doubt on the Trust’s or any of its Sub-Funds’ ability to continue as a going concern. If we conclude that a material uncertainty exists, we are required to draw attention in our auditor’s report to the related disclosures in the financial statements or, if such disclosures are inadequate, to modify our opinion. Our conclusions are based on the audit evidence obtained up to the date of our auditor’s report. However, future events or conditions may cause the Trust or all or any of its Sub-Funds to cease to continue as a going concern.
Evaluate the overall presentation, structure and content of the financial statements,
including the disclosures, and whether the financial statements represent the underlying transactions and events in a manner that achieves fair presentation.
kpmg
10
Independent auditor’s report to the unitholders of CICC CSI Select 100 ETF CICC Bloomberg Barclays China Treasury 1-10 Years ETF ICBC CICC USD Money Market ETF (Continued) Auditor’s responsibilities for the audit of the financial statements (continued) We communicate with the Manager and the Trustee of the Trust and its Sub-Funds regarding, among other matters, the planned scope and timing of the audit and significant audit findings, including any significant deficiencies in internal control that we identify during our audit. We also provide the Manager and the Trustee of the Trust and its Sub-Funds with a statement that we have complied with relevant ethical requirements regarding independence and communicate with them all relationships and other matters that may reasonably be thought to bear on our independence and, where applicable, actions taken to eliminate threats or safeguards applied. From the matters communicated with the Manager and the Trustee of the Trust and its Sub-Funds, we determine the matter that was of most significance in the audit of the financial statements of the current year and is therefore the key audit matter. We describe this matter in our auditor’s report unless law or regulation precludes public disclosure about the matter or when, in extremely rare circumstances, we determine that a matter should not be communicated in our report because the adverse consequences of doing so would reasonably be expected to outweigh the public interest benefits of such communication. Report on matters under the relevant provisions of the Trust Deed and the relevant disclosure provisions of Appendix E of the SFC Code In our opinion, the financial statements of the Sub-Funds of the Trust have been properly prepared, in all material respects, in accordance with the relevant disclosure provisions of the Trust Deed and the relevant provisions of Appendix E of the SFC Code. The engagement partner on the audit resulting in this independent auditor’s report is Ko Sze Man. Certified Public Accountants 8th Floor, Prince’s Building 10 Chater Road Central, Hong Kong 30 April 2021

CICC Fund Series Annual Report
Year ended 31 December 2020
11
Statement of assets and liabilities as at 31 December 2020
CICC CSI
Select 100 ETF
Note 31 December
2020 31 December
2019 RMB RMB Assets Financial assets at fair value through profit or
loss 5,6(c) 48,906,872 75,932,405 Cash and cash equivalents 6(c) 125,232 854,119 Expenses reimbursement receivables from
the Manager 6(c) 1,082,306 865,762 Other receivables and prepayments 34,728 -
Total assets 50,149,138 77,652,286 ------------------- ------------------- Liabilities Audit fee payables (87,627) (89,425) Management fee payables 6(c) (912,210) (576,195) Administration fee payables 6(c) (65,565) (80,070) Trustee and registrar fees payables 6(c) (9,153) (39,589) Establishment cost payables 6(c) - (429,182) Custody fee payables 6(c) (21,956) (28,106) Transaction costs payables 6(c) (21,170) (30,150) Other payables and accruals (92,527) (72,712)
Total liabilities (1,210,208) (1,345,429) ------------------- -------------------
Net assets attributable to unitholders 48,938,930 76,306,857
Representing: Total equity 48,938,930 76,306,857
Total number of units in issue 9 4,500,000 7,500,000
Net assets value per unit 9 10.88 10.17
The notes on page 28 to 60 form part of these financial statements.
CICC Fund Series Annual Report
Year ended 31 December 2020
12
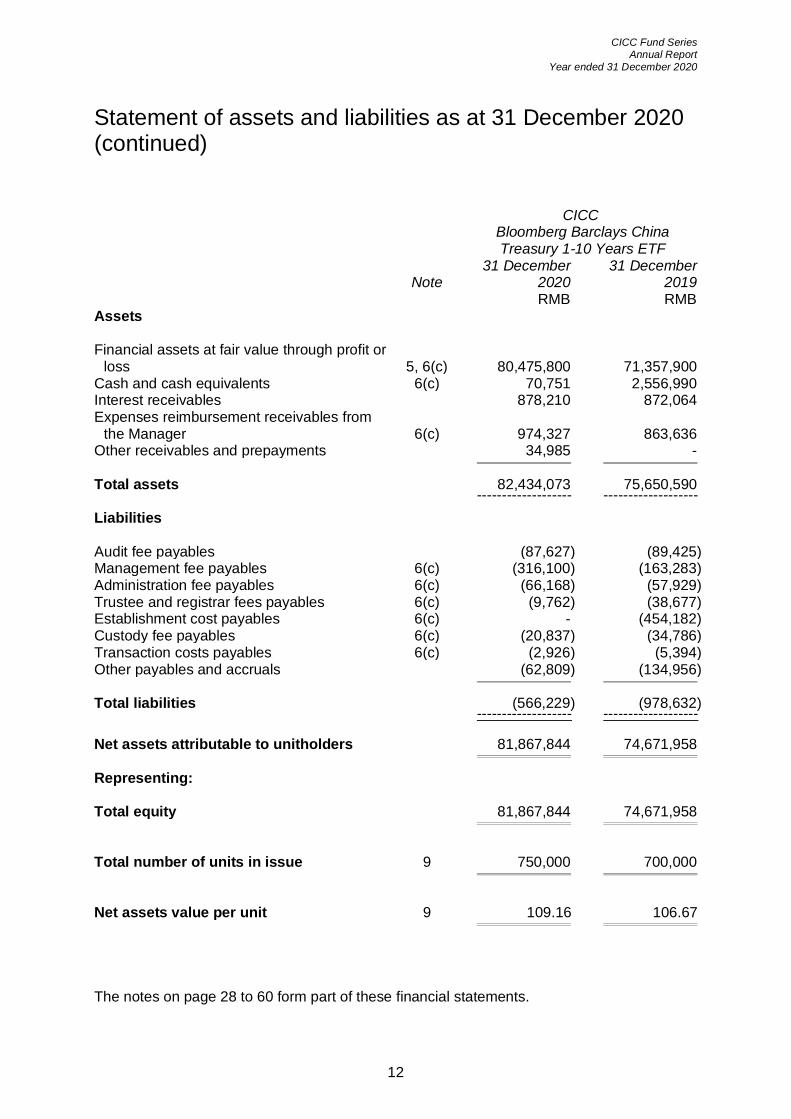
Statement of assets and liabilities as at 31 December 2020 (continued)
CICC Bloomberg Barclays China Treasury 1-10 Years ETF
Note 31 December
2020 31 December
2019 RMB RMB
Assets Financial assets at fair value through profit or
loss 5, 6(c) 80,475,800 71,357,900 Cash and cash equivalents 6(c) 70,751 2,556,990 Interest receivables 878,210 872,064 Expenses reimbursement receivables from
the Manager 6(c) 974,327 863,636 Other receivables and prepayments 34,985 -
Total assets 82,434,073 75,650,590 ------------------- ------------------- Liabilities Audit fee payables (87,627) (89,425) Management fee payables 6(c) (316,100) (163,283) Administration fee payables 6(c) (66,168) (57,929) Trustee and registrar fees payables 6(c) (9,762) (38,677) Establishment cost payables 6(c) - (454,182) Custody fee payables 6(c) (20,837) (34,786) Transaction costs payables 6(c) (2,926) (5,394) Other payables and accruals (62,809) (134,956)
Total liabilities (566,229) (978,632) ------------------- -------------------
Net assets attributable to unitholders 81,867,844 74,671,958
Representing: Total equity 81,867,844 74,671,958
Total number of units in issue 9 750,000 700,000
Net assets value per unit 9 109.16 106.67
The notes on page 28 to 60 form part of these financial statements.

CICC Fund Series Annual Report
Year ended 31 December 2020
13
Statement of assets and liabilities as at 31 December 2020 (continued)
ICBC CICC USD
Money Market ETF
Note 31 December
2020 31 December
2019 USD USD
Assets Financial assets at fair value through profit or
loss 5, 6(c) 234,000,000 62,873,564 Time deposits 6(c) 118,313,853 8,999,945 Cash and cash equivalents 6(c) 189,520,202 169,110,295 Interest receivables 982,871 471,285 Expenses reimbursement receivables from
the Manager 6(c) 88,751 260,652 Other receivables and prepayments 2,487 -
Total assets 542,908,164 241,715,741 ------------------- ------------------- Liabilities Audit fee payables (13,285) (12,847) Management fee payables 6(c) (336,542) (147,897) Administration fee payables 6(c) (178,368) (34,521) Trustee and registrar fees payables 6(c) (87,556) (15,460) Establishment cost payables 6(c) - (170,000) Custody fee payables 6(c) (11,316) (9,392) Transaction costs payables 6(c) (42,507) (11,626) Other payables and accruals (6,875) (5,481)
Total liabilities (676,449) (407,224) ------------------- -------------------
Net assets attributable to unitholders 542,231,715 241,308,517
The notes on page 28 to 60 form part of these financial statements.

CICC Fund Series Annual Report
Year ended 31 December 2020
14
Statement of assets and liabilities as at 31 December 2020 (continued)
ICBC CICC USD
Money Market ETF
Note 31 December
2020 31 December
2019 USD USD
Representing: Total financial liabilities 542,231,715 241,308,517
Listed Class 448,508,150 186,421,252 Unlisted Class A 17,020,316 3,868,223 Unlisted Class I 76,703,249 51,019,042
Number of units in issue Listed Class 9 437,000 184,000 Unlisted Class A 9 16,604 3,819 Unlisted Class I 9 74,769 50,359
Net assets value per unit Listed Class 9 1,026.33 1,013.16 Unlisted Class A 9 1,025.04 1,012.99 Unlisted Class I 9 1,025.87 1,013.10
Approved by the Manager and the Trustee on 30 April 2021 ) ) For and on behalf of ) China International Capital Corporation ) Hong Kong Asset Management Limited, ) Manager ) ) ) For and on behalf of ) Brown Brothers Harriman Trustee Services ) (Hong Kong) Limited, ) Trustee ) The notes on page 28 to 60 form part of these financial statements.

CICC Fund Series Annual Report
Year ended 31 December 2020
15
Statement of comprehensive income for the year ended 31 December 2020
CICC CSI
Select 100 ETF
Note 31 December
2020
Period from 30 November 2018 (date of inception) to
31 December 2019
RMB RMB Income Dividend income 1,724,136 2,328,053 Other income - 35 Expense reimbursements 645,726 865,762 Net gains from financial assets at fair value
through profit or loss 3 1,010,273 16,144,906 Net foreign exchange gain/(losses) 76 (2) Net gains/(losses) from duties and charges 184,420 (29,467)
Total net income 3,564,631 19,309,287 ------------------- ------------------- Expenses Management fee 6(c) (336,015) (576,195) Interest expenses 6(a) - (9) Custody fee 6(a) (83,426) (28,106) Trustee and registrar fees 6(a) (34,852) (39,589) Audit fee 6(a) (90,215) (89,425) Administration fee 6(a) (262,148) (80,070) Establishment cost expenses 6(a) - (488,177) Transaction costs 6(a), 8 (215,581) (222,199) Other operating expenses 6(a) (231,107) (279,730)
Total expenses (1,253,344) (1,803,500) ------------------- ------------------- Taxation 4 (172,414) (233,330)
Increase in net assets attributable to unitholders and total comprehensive income for the year/period 2,138,873 17,272,457
The notes on page 28 to 60 form part of these financial statements.

CICC Fund Series Annual Report
Year ended 31 December 2020
16
Statement of comprehensive income for the year ended 31 December 2020 (continued)
CICC Bloomberg Barclays China Treasury
1-10 Years ETF
Note 31 December
2020
Period from 7 December
2018 (date of inception) to
31 December 2019
RMB RMB Income Interest income 2,400,720 2,497,486 Other income 5,799 - Expense reimbursements 564,873 863,636 Net (losses)/gains from financial assets at fair
value through profit or loss 3 (362,314) 208,273 Net foreign exchange gains 3 - Net (losses)/gains from duties and charges (2,592) 200,913
Total net income 2,606,489 3,770,308 ------------------- ------------------- Expenses Management fee 6(c) (152,817) (163,283) Trustee and registrar fees 6(a) (37,288) (38,677) Custody fee 6(a) (82,307) (34,786) Audit fee 6(a) (90,214) (89,425) Administration fee 6(a) (263,735) (57,929) Establishment cost expenses 6(a) - (488,177) Transaction costs 6(a), 8 (7,185) (5,394) Other operating expenses 6(a) (198,877) (272,702)
Total expenses (832,423) (1,150,373) ------------------- ------------------- Taxation 4 (580) (377)
Increase in net assets attributable to unitholders and total comprehensive income for the year/period 1,773,486 2,619,558
The notes on page 28 to 60 form part of these financial statements.

CICC Fund Series Annual Report
Year ended 31 December 2020
17
Statement of comprehensive income for the year ended 31 December 2020 (continued)
ICBC CICC USD
Money Market ETF
Note 31 December
2020
Period from 14 June 2019
(date of inception) to
31 December 2019
USD USD Income Interest income 6,291,348 2,118,785 Other income 3,885 - Expense reimbursements 268,786 260,652 Net losses from financial assets at fair value
through profit or loss 3 - (1,041)
Total net income 6,564,019 2,378,396 ------------------- ------------------- Expenses Management fee 6(c) (1,080,960) (196,177) Custody fee 6(a) (9,153) (9,392) Trustee and registrar fees 6(a) (81,042) (15,460) Establishment cost expenses 6(a) - (170,000) Audit fee 6(a) (13,383) (12,847) Administration fee 6(a) (170,186) (34,521) Transaction costs 6(a), 8 (40,127) (11,626) Other operating expenses 6(a) (28,572) (12,904)
Total expenses (1,423,423) (462,927) ------------------- ------------------- Taxation 4 - -
Increase in net assets attributable to unitholders and total comprehensive income for the year/period 5,140,596 1,915,469
The notes on page 28 to 60 form part of these financial statements.
CICC Fund Series Annual Report
Year ended 31 December 2020
18
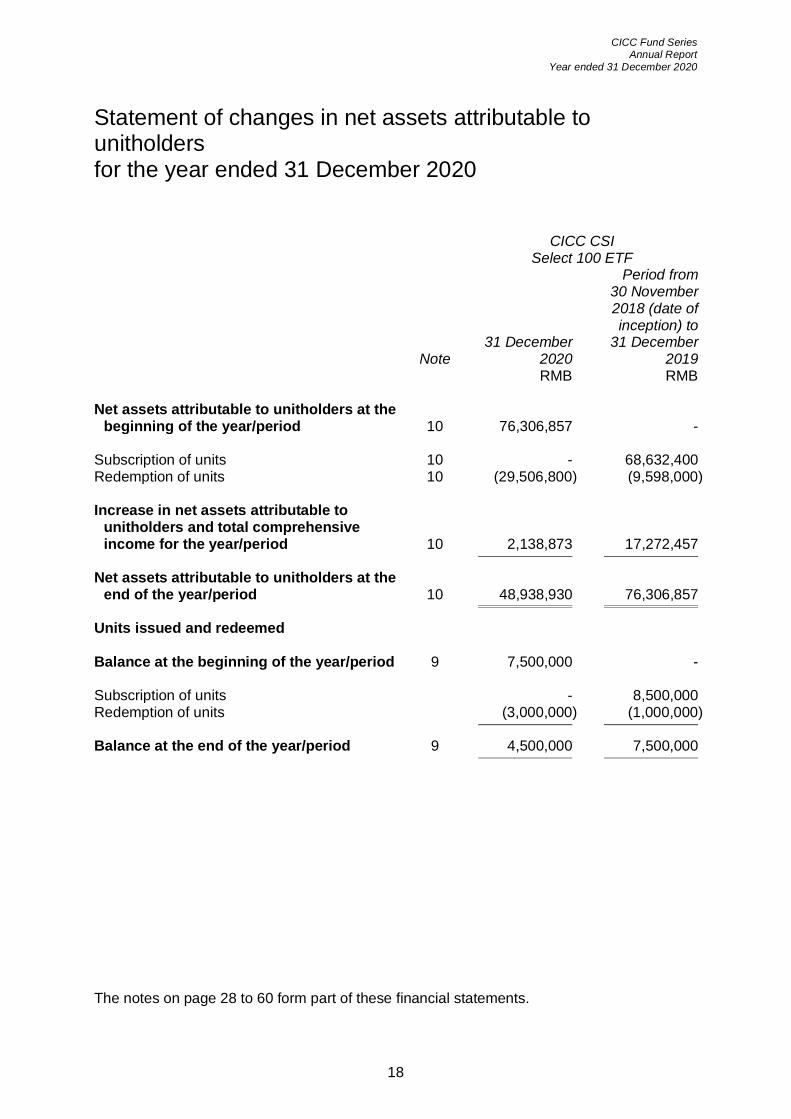
Statement of changes in net assets attributable to unitholders for the year ended 31 December 2020
CICC CSI
Select 100 ETF
Note 31 December
2020
Period from 30 November 2018 (date of inception) to
31 December 2019
RMB RMB
Net assets attributable to unitholders at the beginning of the year/period 10 76,306,857 -
Subscription of units 10 - 68,632,400 Redemption of units 10 (29,506,800) (9,598,000) Increase in net assets attributable to
unitholders and total comprehensive income for the year/period 10 2,138,873 17,272,457
Net assets attributable to unitholders at the end of the year/period 10 48,938,930 76,306,857
Units issued and redeemed Balance at the beginning of the year/period 9 7,500,000 - Subscription of units - 8,500,000 Redemption of units (3,000,000) (1,000,000)
Balance at the end of the year/period 9 4,500,000 7,500,000
The notes on page 28 to 60 form part of these financial statements.
CICC Fund Series Annual Report
Year ended 31 December 2020
19
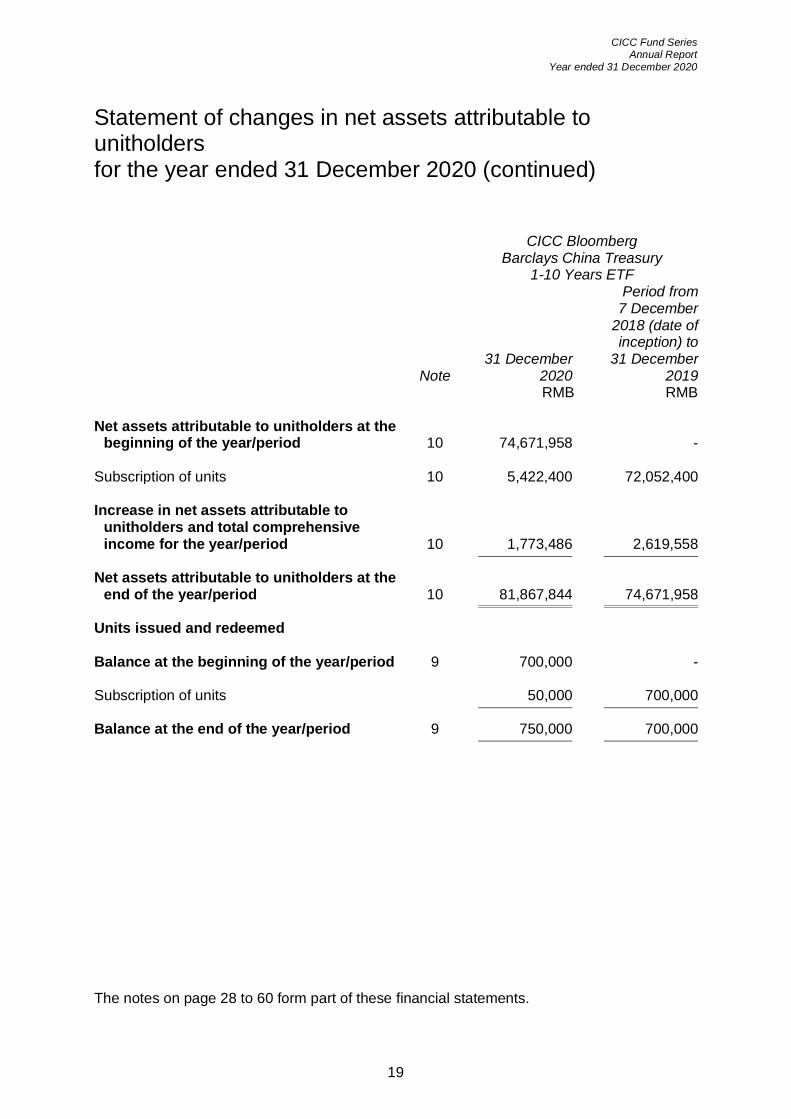
Statement of changes in net assets attributable to unitholders for the year ended 31 December 2020 (continued)
CICC Bloomberg Barclays China Treasury
1-10 Years ETF
Note 31 December
2020
Period from 7 December
2018 (date of inception) to
31 December 2019
RMB RMB Net assets attributable to unitholders at the
beginning of the year/period 10 74,671,958 - Subscription of units 10 5,422,400 72,052,400 Increase in net assets attributable to
unitholders and total comprehensive income for the year/period 10 1,773,486 2,619,558
Net assets attributable to unitholders at the end of the year/period 10 81,867,844 74,671,958
Units issued and redeemed Balance at the beginning of the year/period 9 700,000 - Subscription of units 50,000 700,000
Balance at the end of the year/period 9 750,000 700,000
The notes on page 28 to 60 form part of these financial statements.

CICC Fund Series Annual Report
Year ended 31 December 2020
20
Statement of changes in net assets attributable to unitholders for the year ended 31 December 2020 (continued)
ICBC CICC USD
Money Market ETF
Note 31 December
2020
Period from 14 June 2019
(date of inception) to
31 December 2019
USD USD
Net assets attributable to unitholders at the beginning of the year/period 10 241,308,517 -
Subscription of units 10 - Listed Class 517,757,805 214,864,476 - Unlisted Class A 51,298,587 7,163,684 - Unlisted Class I 105,755,822 50,933,866
Redemption of units 10 - Listed Class (259,845,760) (30,267,659) - Unlisted Class A (38,296,960) (3,301,319) - Unlisted Class I (80,886,892) - Increase in net assets attributable to
unitholders and total comprehensive income for the year/period 10 5,140,596 1,915,469
Net assets attributable to unitholders at the end of the year/period 10 542,231,715 241,308,517
The notes on page 28 to 60 form part of these financial statements.

CICC Fund Series Annual Report
Year ended 31 December 2020
21
Statement of changes in net assets attributable to unitholders for the year ended 31 December 2020 (continued)
ICBC CICC USD
Money Market ETF
Note 31 December
2020
Period from 14 June 2019
(date of inception) to
31 December 2019
USD USD Units issued and redeemed Balance at the beginning of the year/period 9 - Listed Class 184,000 - - Unlisted Class A 3,819 - - Unlisted Class I 50,359 - Subscription of units - Listed Class 507,000 214,000 - Unlisted Class A 50,339 7,080 - Unlisted Class I 103,657 50,359
Redemption of units - Listed Class (254,000) (30,000) - Unlisted Class A (37,554) (3,261) - Unlisted Class I (79,247) -
Balance at the end of the year/period 9 - Listed Class 437,000 184,000 - Unlisted Class A 16,604 3,819 - Unlisted Class I 74,769 50,359
The notes on page 28 to 60 form part of these financial statements.
CICC Fund Series Annual Report
Year ended 31 December 2020
22
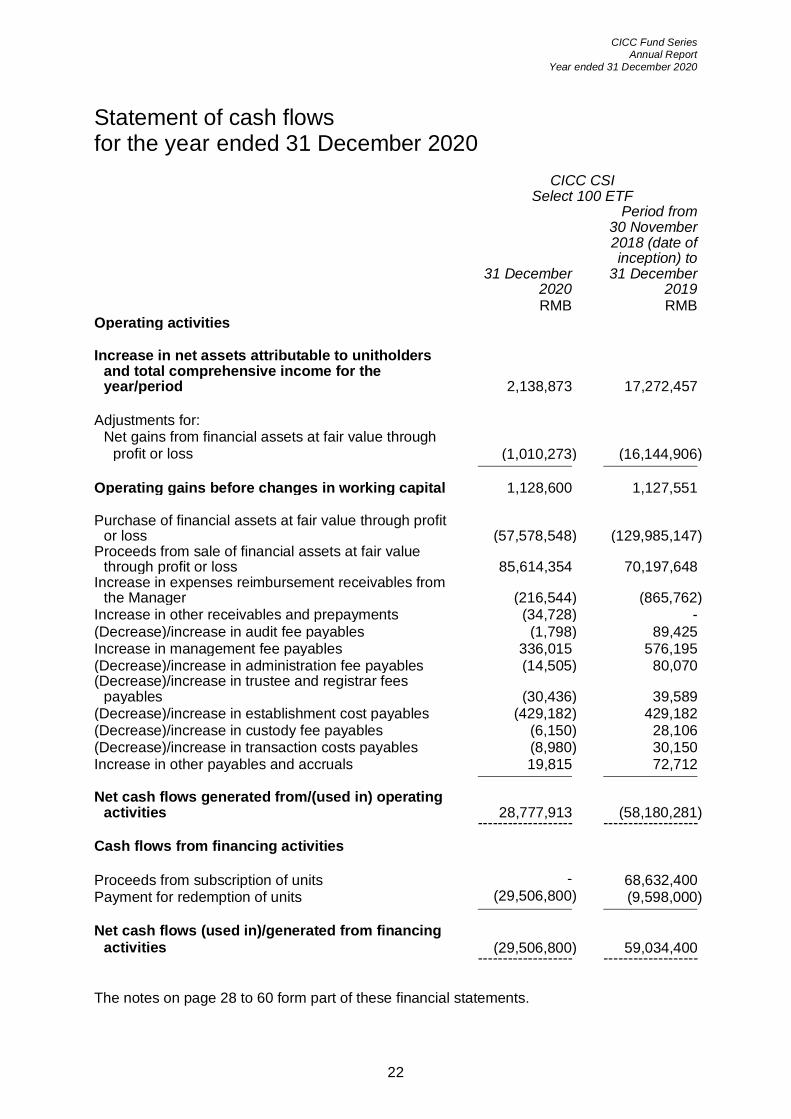
Statement of cash flows for the year ended 31 December 2020
CICC CSI
Select 100 ETF
31 December
2020
Period from 30 November 2018 (date of inception) to
31 December 2019
RMB RMB Operating activities Increase in net assets attributable to unitholders
and total comprehensive income for the year/period 2,138,873 17,272,457
Adjustments for:
Net gains from financial assets at fair value through profit or loss (1,010,273) (16,144,906)
Operating gains before changes in working capital 1,128,600 1,127,551 Purchase of financial assets at fair value through profit
or loss (57,578,548) (129,985,147) Proceeds from sale of financial assets at fair value
through profit or loss 85,614,354 70,197,648 Increase in expenses reimbursement receivables from
the Manager (216,544) (865,762) Increase in other receivables and prepayments (34,728) - (Decrease)/increase in audit fee payables (1,798) 89,425 Increase in management fee payables 336,015 576,195 (Decrease)/increase in administration fee payables (14,505) 80,070 (Decrease)/increase in trustee and registrar fees
payables (30,436) 39,589 (Decrease)/increase in establishment cost payables (429,182) 429,182 (Decrease)/increase in custody fee payables (6,150) 28,106 (Decrease)/increase in transaction costs payables (8,980) 30,150 Increase in other payables and accruals 19,815 72,712
Net cash flows generated from/(used in) operating activities 28,777,913 (58,180,281)
------------------- ------------------- Cash flows from financing activities
Proceeds from subscription of units - 68,632,400 Payment for redemption of units (29,506,800) (9,598,000)
Net cash flows (used in)/generated from financing activities (29,506,800) 59,034,400
------------------- -------------------
The notes on page 28 to 60 form part of these financial statements.

CICC Fund Series Annual Report
Year ended 31 December 2020
23
Statement of cash flows for the year ended 31 December 2020 (continued)
CICC CSI
Select 100 ETF
31 December
2020
Period from 30 November 2018 (date of inception) to
31 December 2019
RMB RMB Net (decrease)/increase in cash and cash
equivalents (728,887) 854,119 Cash and cash equivalents at the beginning of the
year/period 854,119 -
Cash and cash equivalents at the end of the year/period 125,232 854,119
Analysis of cash and cash equivalents Cash at bank 125,232 854,119
Net cash flows from operating activities include: Dividend income 1,724,136 2,328,053
The notes on page 28 to 60 form part of these financial statements.

CICC Fund Series Annual Report
Year ended 31 December 2020
24
Statement of cash flows for the year ended 31 December 2020 (continued)
CICC Bloomberg Barclays China Treasury
1-10 Years ETF
31 December
2020
Period from 7 December
2018 (date of inception) to
31 December 2019
RMB RMB Operating activities Increase in net assets attributable to unitholders
and total comprehensive income for the year/period 1,773,486 2,619,558
Adjustments for:
Net losses/(gains) from financial assets at fair value through profit or loss 362,314 (208,273)
Operating gains before changes in working capital 2,135,800 2,411,285
Purchase of financial assets at fair value through profit or loss (19,480,214) (71,149,627)
Proceeds from sale of financial assets at fair value through profit or loss 10,000,000 -
Increase in interest receivables (6,146) (872,064) Increase in expenses reimbursement receivables
from the Manager (110,691) (863,636) Increase in other receivables and prepayments (34,985) - (Decrease)/increase in audit fee payables (1,798) 89,425 Increase in management fee payables 152,817 163,283 Increase in administration fee payables 8,239 57,929 (Decrease)/increase in trustee and registrar fees
payables (28,915) 38,677 (Decrease)/increase in establishment cost payables (454,182) 454,182 (Decrease)/increase in custody fee payables (13,949) 34,786 (Decrease)/increase in transaction costs payables (2,468) 5,394 (Decrease)/increase in other payables and accruals (72,147) 134,956
Net cash flows used in operating activities (7,908,639) (69,495,410) ------------------- ------------------- Cash flows from financing activity Proceeds from subscription of units 5,422,400 72,052,400
Net cash flows generated from financing activities 5,422,400 72,052,400 ------------------- ------------------- The notes on page 28 to 60 form part of these financial statements.

CICC Fund Series Annual Report
Year ended 31 December 2020
25
Statement of cash flows for the year ended 31 December 2020 (continued)
CICC Bloomberg Barclays China Treasury
1-10 Years ETF
31 December
2020
Period from 7 December
2018 (date of inception) to
31 December 2019
RMB RMB Net (decrease)/increase in cash and cash
equivalents (2,486,239) 2,556,990 Cash and cash equivalents at the beginning of the
year/period 2,556,990 -
Cash and cash equivalents at the end of the year/period 70,751 2,556,990
Analysis of cash and cash equivalents Cash at bank 70,751 2,556,990
Net cash flows from operating activities include: Interest income 2,394,574 1,625,422
The notes on page 28 to 60 form part of these financial statements.
CICC Fund Series Annual Report
Year ended 31 December 2020
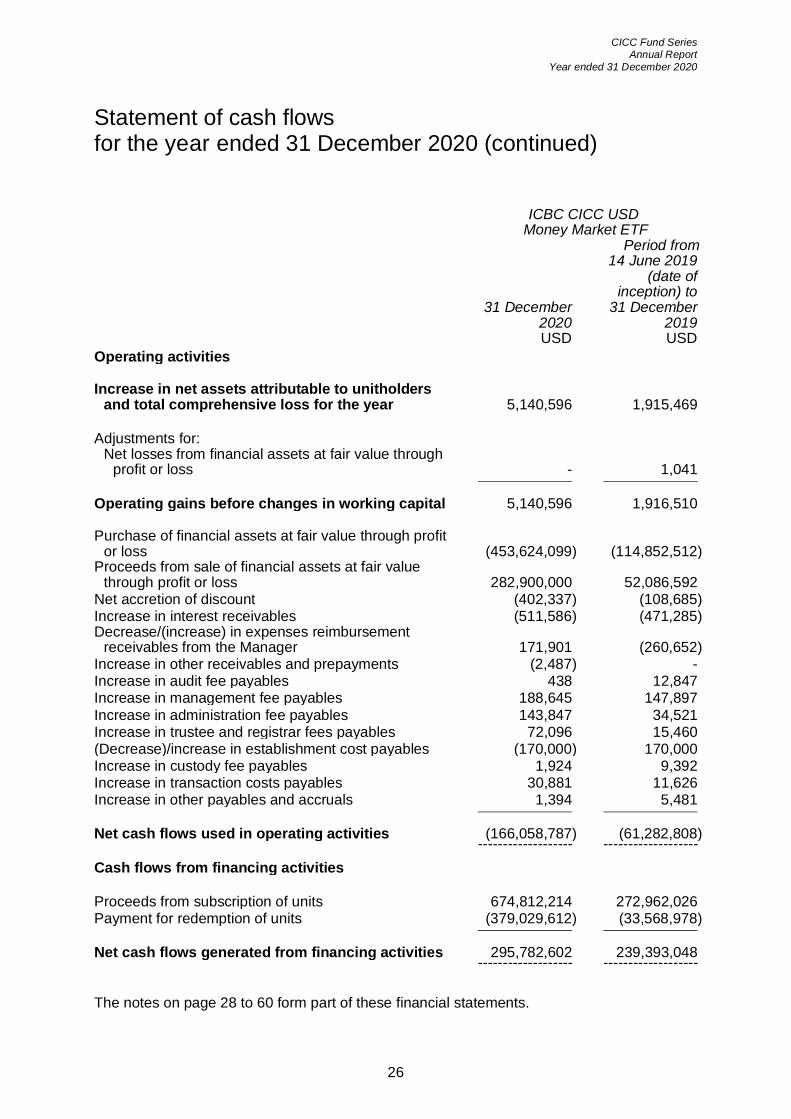
26
Statement of cash flows for the year ended 31 December 2020 (continued)
ICBC CICC USD
Money Market ETF
31 December
2020
Period from 14 June 2019
(date of inception) to
31 December 2019
USD USD Operating activities Increase in net assets attributable to unitholders
and total comprehensive loss for the year 5,140,596 1,915,469 Adjustments for:
Net losses from financial assets at fair value through profit or loss - 1,041
Operating gains before changes in working capital 5,140,596 1,916,510 Purchase of financial assets at fair value through profit
or loss (453,624,099) (114,852,512) Proceeds from sale of financial assets at fair value
through profit or loss 282,900,000 52,086,592 Net accretion of discount (402,337) (108,685) Increase in interest receivables (511,586) (471,285) Decrease/(increase) in expenses reimbursement
receivables from the Manager 171,901 (260,652) Increase in other receivables and prepayments (2,487) - Increase in audit fee payables 438 12,847 Increase in management fee payables 188,645 147,897 Increase in administration fee payables 143,847 34,521 Increase in trustee and registrar fees payables 72,096 15,460 (Decrease)/increase in establishment cost payables (170,000) 170,000 Increase in custody fee payables 1,924 9,392 Increase in transaction costs payables 30,881 11,626 Increase in other payables and accruals 1,394 5,481
Net cash flows used in operating activities (166,058,787) (61,282,808) ------------------- ------------------- Cash flows from financing activities Proceeds from subscription of units 674,812,214 272,962,026 Payment for redemption of units (379,029,612) (33,568,978)
Net cash flows generated from financing activities 295,782,602 239,393,048 ------------------- ------------------- The notes on page 28 to 60 form part of these financial statements.

CICC Fund Series Annual Report
Year ended 31 December 2020
27
Statement of cash flows for the period ended 31 December 2020 (continued)
ICBC CICC USD
Money Market ETF
31 December
2020
Period from 14 June 2019
(date of inception) to
31 December 2019
USD USD Net increase in cash and cash equivalents 129,723,815 178,110,240 Cash and cash equivalents at the beginning of the
year/period 178,110,240 -
Cash and cash equivalents at the end of the year/period 307,834,055 178,110,240
Analysis of cash and cash equivalents Cash at bank 1,913,985 20,560,361 Short term deposits with maturities of 3 months or less 187,606,217 148,549,934
Total cash and cash equivalents on statement of assets and liabilities 189,520,202 169,110,295
Time deposits (with original maturities over 3 months) 118,313,853 8,999,945
Cash and cash equivalents on statement of cash flows at the end of the year/period 307,834,055 178,110,240
Net cash flows from operating activities include: Interest income 5,779,762 1,647,500
The notes on page 28 to 60 form part of these financial statements.

CICC Fund Series Annual Report
Year ended 31 December 2020
28
Notes to the financial statements
1 The Trust CICC Fund Series (the “Trust”) is a Hong Kong umbrella unit trust established under a trust deed dated 5 November 2018 and as amended from time to time (the “Trust Deed”) between China International Capital Corporation Hong Kong Asset Management Limited (the “Manager”) and Brown Brothers Harriman Trustee Services (Hong Kong) Limited (the “Trustee”), and governed by the laws of Hong Kong. The Amended and Restated Trust Deed was dated on 12 November 2019, and further supplemented on 23 April 2020 and 9 November 2020. As at 31 December 2020, there are five (2019: three) sub-funds under the Trust. The names of the sub-funds, their relevant benchmark and date of commencement of operations are set out as below:
Sub-Fund Benchmark index
Date of commencement of
operations CICC CSI Select 100 ETF CSI CICC Select 100 Index 30 November 2018 CICC Bloomberg Barclays China
Treasury 1-10 Years ETF Bloomberg Barclays China Treasury 1-10 Years Index 7 December 2018
ICBC CICC USD Money Market ETF - 14 June 2019 CICC Hong Kong Equity Fund - 14 May 2020 CICC HKD Money Market ETF - 30 November 2020 The dates of inception and the dates of listing on the Stock Exchange of Hong Kong of each Sub-Fund are set out below: Sub-Fund Dates of inception Dates of listing CICC CSI Select 100 ETF 30 November 2018 5 December 2018 CICC Bloomberg Barclays China
Treasury 1-10 Years ETF 7 December 2018 12 December 2018 ICBC CICC USD Money Market ETF 14 June 2019 18 June 2019 CICC Hong Kong Equity Fund 14 May 2020 N/A CICC HKD Money Market ETF 30 November 2020 2 December 2020 The Trust and its sub-funds (collectively, the “Sub-Funds” or individually a “Sub-Fund”) are authorised under the Section 104 of the Hong Kong Securities and Futures Ordinance (the “SFO”). CICC CSI Select 100 ETF and CICC Bloomberg Barclays China Treasury 1-10 Years ETF fall under Chapters 7 and 8.6 of the Hong Kong Code on Unit Trusts and Mutual Funds (the “SFC Code”). CICC Hong Kong Equity Fund falls under Chapter 7 of the SFC Code. ICBC CICC USD Money Market ETF and CICC HKD Money Market ETF fall under Chapters 7, 8.2 and 8.10 of the SFC Code. CICC Hong Kong Equity Fund is unlisted. Its financial statements have been prepared separately and consequently are not included in these financial statements. The first financial year-end of the CICC HKD Money Market ETF will be 31 December 2021.

CICC Fund Series Annual Report
Year ended 31 December 2020
29
1 The Trust (continued) The investment objectives of CICC CSI Select 100 ETF and ETF CICC Bloomberg Barclays China Treasury 1-10 Years ETF are to provide investment results that, before fees and expenses, closely correspond to the performance of its benchmark index. The investment objective of ICBC CICC USD Money Market ETF is to achieve a return in US dollars in line with prevailing money market rates, by investing in short-term deposits and high quality money market investments. There can be no assurance that each of the Sub-Funds will achieve their investment objectives. The Trust Deed does not contain any requirement that a combined set of financial statements for the Trust itself be prepared. The investment activities of the Trust are managed by the Manager and the administration of the Trust is delegated to Brown Brothers Harriman & Co. (the “Administrator”).
2 Significant accounting polices
(a) Statement of compliance The financial statements have been prepared in accordance with all applicable International Financial Reporting Standards (“IFRSs”), which collective term includes all applicable individual International Financial Reporting Standards, International Accounting Standards (“IASs”), and Interpretations issued by International Accounting Standards Board (“IASB”), the relevant disclosure provisions of the Trust Deed and the relevant disclosure requirements of the Code issued by the Hong Kong Securities and Futures Commission (the “SFC”). A summary of the significant accounting policies adopted by each Sub-Fund is set out below. The IASB has issued certain new and revised IFRSs that are available for early adoption for the current accounting year of the Sub-Funds. The Sub-Funds have not applied any new standard or interpretation that is not yet effective for the current and prior accounting periods (see note 16).
(b) Basis of preparation of the financial statements The financial statements of CICC CSI Select 100 ETF and CICC Bloomberg Barclays China Treasury 1-10 Years ETF are presented in Renminbi Yuan (“RMB”), which is the functional currency. All values are rounded to the nearest RMB except when otherwise indicated. The financial statements of ICBC CICC USD Money Market ETF are presented in United States dollars “USD”, which is the functional currency. All values are rounded to the nearest USD except when otherwise indicated. The financial statements are prepared on a fair value basis for financial assets and financial liabilities at fair value through profit or loss. Other financial assets and financial liabilities are stated at amortised cost. The preparation of financial statements in conformity with IFRSs requires management to make judgements, estimates and assumptions that affect the application of policies and reported amounts of assets, liabilities, income and expenses. The estimates and associated assumptions are based on historical experience and various other factors that are believed to be reasonable under the circumstances, the results of which form the basis of making the judgements about carrying values of assets and liabilities that are not readily apparent from other sources. Actual results may differ from these estimates.

CICC Fund Series Annual Report
Year ended 31 December 2020
30
2 Significant accounting polices (continued) Current financial statements were prepared in respect of the year from 1 January 2020 to 31 December 2020. The comparative figures shown on the statement of comprehensive income, the statement of changes in net assets attributable to unitholders, the statement of cash flows and related notes are not comparable so far as they relate to a longer/shorter period than the prior period. The estimates and underlying assumptions are reviewed on an ongoing basis. Revisions to accounting estimates are recognised in the year/period in which the estimate is revised if the revision affects only that period, or in the period of the revision and future periods if the revision affects both current and future periods.
(c) Foreign currency translation Foreign currency transactions during the year/period are translated into the functional currency of each Sub-Fund at the exchange rates ruling at the transaction dates. Monetary assets and liabilities denominated in foreign currency are translated into the functional currency at the foreign exchange rates ruling at the reporting date. Non-monetary assets and liabilities denominated in foreign currency that are measured at fair value are re-translated into the functional currencies at the exchange rate at the date on which the fair value was determined. Foreign currency exchange differences arising on translation and realised gains and losses on disposals or settlements of monetary assets and liabilities are recognised in profit or loss.
(d) Financial assets and financial liabilities (i) Recognition and initial measurement
The Sub-Fund initially recognises financial assets and financial liabilities at fair value through profit or loss (FVTPL) on the trade date, which is the date on which the Sub-Fund become a party to the contractual provisions of the instruments. Other financial assets and financial liabilities are recognised on the date on which they are originated. A financial asset or financial liability is measured initially at fair value plus, for an item not at FVTPL, transaction costs that are directly attributable to its acquisition or issue.
(ii) Classification and subsequent measurement
On initial recognition, the Sub-Fund classifies financial assets as measured at amortised cost or FVTPL. A financial asset is measured at amortised cost if it meets both of the following conditions and is not designated as at FVTPL: - it is held within a business model whose objective is to hold assets to collect
contractual cash flows; and
- its contractual terms give rise on specified dates to cash flows that are solely payments of principal and interest on the principal amount outstanding.
All other financial assets of the Sub-Fund are measured at FVTPL.
CICC Fund Series Annual Report
Year ended 31 December 2020
31
2 Significant accounting policies (continued) Financial assets – Business model assessment In making an assessment of the objective of the business model in which a financial asset is held, the Sub-Fund considers all of the relevant information about how the business is managed, including: - the documented investment strategy and the execution of this strategy in practice.
This includes whether the investment strategy focuses on earning contractual interest income, maintaining a particular interest rate profile, matching the duration of the financial assets to the duration of any related liabilities or expected cash outflows or realising cash flows through the sale of the assets;
- how the performance of the portfolio is evaluated and reported to the Sub-Fund’s
management;
- the risks that affect the performance of the business model (and the financial assets held within that business model) and how those risks are managed;
- how managers of the business are compensated – e.g. whether compensation is
based on the fair value of the assets managed or the contractual cash flows collected; and
- the frequency, volume and timing of sales of financial assets in prior periods, the
reasons for such sales and expectations about future sales activity.
Transfers of financial assets to third parties in transactions that do not qualify for derecognition are not considered sales for this purpose, consistent with the Sub-Fund’s continuing recognition of the assets. Financial assets that are held for trading or are managed and whose performance is evaluated on a fair value basis are measured at FVTPL. Financial assets – Assessing whether contractual cash flows are solely payments of principal and interest For the purposes of this assessment, “principal” is defined as the fair value of the financial asset on initial recognition. “Interest” is defined as consideration for the time value of money and for the credit risk associated with the principal amount outstanding during a particular period of time and for other basic lending risks and costs (e.g. liquidity risk and administrative costs), as well as a profit margin. In assessing whether the contractual cash flows are solely payments of principal and interest, the Sub-Fund considers the contractual terms of the instrument. This includes assessing whether the financial asset contains a contractual term that could change the timing or amount of contractual cash flows such that it would not meet this condition. In making this assessment, the Sub-Fund considers: - contingent events that would change the amount or timing of cash flows;
- terms that may adjust the contractual coupon rate, including variable-rate features;

CICC Fund Series Annual Report
Year ended 31 December 2020
32
2 Significant accounting policies (continued)
- prepayment and extension features; and
- terms that limit the group’s claim to cash flows from specified assets (e.g. non-recourse features).
Financial assets – Reclassification Financial assets are not reclassified subsequent to their initial recognition unless the Sub-Fund were to change its business model for management of financial assets, in which case all affected financial assets would be reclassified on the first day of the first reporting period following the change in the business model. Financial liabilities – Classification, subsequent measurement and gains and losses Financial liabilities are classified as measured at amortised cost or FVTPL. A financial liability is classified as at FVTPL if it is classified as held-for-trading, it is a derivative or it is designated as such on initial recognition. Financial liabilities at FVTPL are measured at fair value and net gains and losses, including any interest expense, are recognised in profit or loss. Other financial liabilities are subsequently measured at amortised cost using the effective interest method. Interest expense and foreign exchange gains and losses are recognised in profit or loss. Any gain or loss on derecognition is also recognised in profit or loss.
(iii) Fair value measurement principles
Fair value is the price that would be received to sell an asset or paid to transfer a liability in an orderly transaction between market participants at the measurement date in the principal or, in its absence, the most advantageous market to which the Sub-Fund has access at that date. The fair value of a liability reflects its non-performance risk. When available, the Sub-Fund measures the fair value of an instrument using the quoted price in an active market for that instrument provided such price is within the bid ask spread. A market is regarded as active if transactions for the asset or liability take place with sufficient frequency and volume to provide pricing information on an ongoing basis. In circumstances where the quoted price is not within the bid ask spread, the Manager of the Sub-Fund will determine the points within the bid ask spread that are most representative of the fair value. When there is no quoted price in an active market, the Sub-Fund uses valuation techniques that maximise the use of relevant observable inputs and minimise the use of unobservable inputs. The chosen valuation technique incorporates all the factors that market participants would take into account in pricing a transaction.

CICC Fund Series Annual Report
Year ended 31 December 2020
33
2 Significant accounting policies (continued) The best evidence of the fair value of a financial instrument at initial recognition is normally the transaction price i.e. the fair value of the consideration given or received. If the Sub-Fund determines that the fair value at initial recognition differs from the transaction price and the fair value is evidenced neither by a quoted price in an active market for an identical asset or liability nor based on a valuation technique that uses only data from observable markets, the financial instrument is initially measured at fair value, adjusted to defer the difference between the fair value at initial recognition and the transaction price. Subsequently, that difference is recognised in profit or loss on an appropriate basis over the life of the instrument but no later than when the valuation is supported wholly by observable market data or the transaction is closed out. CICC CSI Select 100 ETF and ICBC CICC USD Money Market ETF measure the financial assets at fair value through profit or loss using the last trade price in an active market or quoted price by trading brokers. The financial assets at fair value through profit or loss of CICC Bloomberg Barclays China Treasury 1-10 Years ETF are priced on the bid side at 6 p.m. (Tokyo Time) by Bloomberg’s evaluated pricing service, Bloomberg Valuation Service (“BVAL”).
(iv) Amortised cost measurement principles The amortised cost of a financial asset or liability is the amount at which the financial asset or liability is measured at initial recognition, minus principal repayments, plus or minus the cumulative amortisation using the effective interest method of any difference between the initial amount recognised and the maturity amount and, for financial assets, adjusted for any loss allowance.
(v) Impairment
Each Sub-Fund recognises loss allowances for expected credit losses (“ECLs”) on financial assets measured at amortised cost. Each Sub-Fund measures loss allowances at an amount equal to lifetime ECLs, except for the following, which are measured at 12-month ECLs: - Financial assets that are determined to have low credit risk at the reporting date;
and
- other financial assets for which credit risk (i.e. the risk of default occurring over the expected life of the financial instrument) has not increased significantly since initial recognition.
When determining whether the credit risk of a financial asset has increased significantly since initial recognition and when estimating ECLs, each Sub-Fund considers reasonable and supportable information that is relevant and available without undue cost or effort. This includes both quantitative and qualitative information and analysis, based on each Sub-Fund’s historical experience and informed credit assessment and including forward-looking information. The Sub-Fund assume that the credit risk on a financial asset has increased significantly if it is more than 30 days past due.

CICC Fund Series Annual Report
Year ended 31 December 2020
34
2 Significant accounting policies (continued) The Sub-Fund consider a financial asset to be in default when: - the borrower is unlikely to pay its credit obligations to the group in full, without
recourse by the group to actions such as realising security (if any is held); or
- the financial asset is more than 90 days past due.
Lifetime ECLs are the ECLs that result from all possible default events over the expected life of a financial instrument. 12-month ECLs are the portion of ECLs that result from default events that are possible within the 12 months after the reporting date (or a shorter period if the expected life of the instrument is less than 12 months). The maximum period considered when estimating ECLs is the maximum contractual period over which the Sub-Fund is exposed to credit risk. Measurement of ECLs ECLs are a probability-weighted estimate of credit losses. Credit losses are measured as the present value of all cash shortfalls (i.e. the difference between the cash flows due to the entity in accordance with the contract and the cash flows that the group expects to receive). ECLs are discounted at the effective interest rate of the financial asset. Credit-impaired financial assets At each reporting date, the Sub-Fund assesses whether financial assets carried at amortised cost are credit-impaired. A financial asset is “credit-impaired” when one or more events that have a detrimental impact on the estimated future cash flows of the financial asset have occurred. Evidence that a financial asset is credit-impaired includes the following observable data: - significant financial difficulty of the borrower or issuer;
- a breach of contract such as a default or being more than 90 days past due;
- it is probable that the borrower will enter bankruptcy or other financial
reorganisation; or
- the disappearance of an active market for a security because of financial difficulties.
Presentation of allowance for ECL in the statement of financial position Loss allowances for financial assets measured at amortised cost are deducted from the gross carrying amount of the assets.

CICC Fund Series Annual Report
Year ended 31 December 2020
35
2 Significant accounting policies (continued) Write-off policy The gross carrying amount of a financial asset is written off when the Sub-Fund has no reasonable expectations of recovering a financial asset in its entirety or a portion thereof.
(vi) Derecognition
Each Sub-Fund derecognises a financial asset when the contractual rights to the cash flows from the asset expire, or they transfer the rights to receive the contractual cash flows in a transaction in which substantially all of the risks and rewards of ownership of the financial asset are transferred or in which each Sub-Fund neither transfers nor retains substantially all of the risks and rewards of ownership and does not retain control of the financial asset. On derecognition of a financial asset, the difference between the carrying amount of the assets (or the carrying amount allocated to the portion of the asset that is derecognised) and the consideration received (including any new asset obtained less any new liability assumed) is recognised in profit or loss. Any interest in such transferred financial assets that is created or retained by the Sub-Fund is recognised as a separate asset or liability. If a Sub-Fund enters into transactions whereby it transfers assets recognised on its statement of assets and liabilities, but retains either all or substantially all of the risks and rewards of the transferred assets or a portion of them, then the transferred assets are not derecognised. Transfers of assets with retention of all or substantially all of the risks and rewards include sale and repurchase transactions. The Sub-Fund uses the weighted average method to determine realised gains and losses on derecognition. A financial liability is derecognised when the obligation specified in the contract is discharged, cancelled or expired.
(vii) Offsetting Financial assets and liabilities are offset and the net amount is reported in the statement of assets and liabilities when the Sub-Fund has a legally enforceable right to offset the recognised amounts and the transactions are intended to be settled on a net basis or simultaneously, e.g. through a market clearing mechanism. Income and expenses are presented on a net basis for gains and losses from financial instruments at fair value through profit and loss and foreign exchange gains and losses.

CICC Fund Series Annual Report
Year ended 31 December 2020
36
2 Significant accounting policies (continued)
(e) Cash and cash equivalents Cash and cash equivalents comprises deposits with banks and highly liquid financial assets with maturities of three months or less from the acquisition date that are subject to an insignificant risk of changes in their fair value and are used by the Sub-Fund for the purpose of meeting short-term commitments, other than cash collateral provided in respect of derivatives, securities sold short and securities borrowing transactions. Bank overdrafts that are repayable on demand and form an integral part of the Sub-Fund’s cash management are also included as a component of cash and cash equivalents for the purpose of the statement of cash flows.
(f) Revenue recognition Revenue is recognised when control over a service is transferred to the customer at the amount of promised consideration to which the Sub-Fund is expected to be entitled, excluding those amounts collected on behalf of third parties. Revenue excludes value added tax or other sales taxes and is after deduction of any trade discounts. Where the contract contains a variable consideration, the Sub-Fund estimates the amount of consideration which it will be entitled in exchange for transferring the promised services to a customer and includes in the transaction price some or all of the variable consideration estimated, such that revenue is only recognised to the extent that it is highly probable that a significant reversal in the amount of cumulative revenue recognised will not occur. Further details of the Sub-Fund’s revenue and other income recognition policies are as follows: (i) Dividends
Dividend income from listed investments is recognised on the ex-dividend date. Dividend income from equity securities designated as at fair value through profit and loss and unit trusts is recognised in profit or loss in a separate line item. In some cases, the Sub-Fund may choose to receive dividends in the form of additional shares rather than cash. In such cases, the Sub-Fund recognises the dividend income for the amount of the equivalent cash dividend with the corresponding debit treated as an additional investment.
(ii) Interest income
Interest income is recognised in profit or loss as it accrues, using the effective interest rate method. The effective interest rate is the rate that exactly discounts the estimated future cash payments and receipts through the expected life of the financial instrument (or, when appropriate, a shorter period) to the carrying amount of the financial instrument on initial recognition. When calculating the effective interest rate, the Sub-Fund estimates future cash flows considering all contractual terms of the financial instrument, but not future credit losses. Dividends and interest income received by the Sub-Fund may be subject to non-recoverable withholding tax imposed in the country of origin. This income is recorded gross of such taxes and the withholding tax is recognised in the profit and loss as incurred.
(g) Expenses All expenses are recognised in profit or loss on an accrual basis.

CICC Fund Series Annual Report
Year ended 31 December 2020
37
2 Significant accounting policies (continued)
(h) Establishment cost The establishment costs of the Sub-Funds consist of costs incurred to establish the Sub-Funds and enable them legally to do business. The Manager intends to reimburse the establishment costs to the extent that the annual ongoing charges ratio of the respective Sub-Fund (or Class) can be maintained at a level set out in note 6(a).
(i) Related parties (a) A person, or a close member of that person’s family, is related to a Sub-Fund if that
person:
(i) has control or joint control over the Sub-Fund; (ii) has significant influence over the Sub-Fund; or (iii) is a member of the key management personnel of the Sub-Fund.
(b) An entity is related to a Sub-Fund if any of the following conditions applies:
(i) The entity and the Sub-Fund are members of the same group (which means that each parent, subsidiary and fellow subsidiary is related to the others);
(ii) One entity is an associate or joint venture of the other entity (or an associate or
joint venture of a member of a group of which the other entity is a member); (iii) Both entities are joint ventures of the same third party; (iv) One entity is a joint venture of a third entity and the other entity is an associate of
the third entity; (v) The entity is a post-employment benefit plan for the benefit of employees of
either the group or an entity related to the group. (vi) The entity is controlled or jointly controlled by a person identified in (a). (vii) A person identified in (a)(i) has significant influence over the entity or is a
member of the key management personnel of the entity (or of a parent of the entity).
(viii) The entity, or any member of a group of which it is a part, provides key
management personnel services to the group or to the group’s parent.
Close members of the family of a person are those family members who may be expected to influence, or be influenced by, that person in their dealings with the entity.
(j) Subscriptions and redemptions Each Sub-Fund recognises unitholders’ subscriptions and allots units upon receipt of a valid subscription application and derecognises them upon receipt of a valid redemption application.
CICC Fund Series Annual Report
Year ended 31 December 2020
38
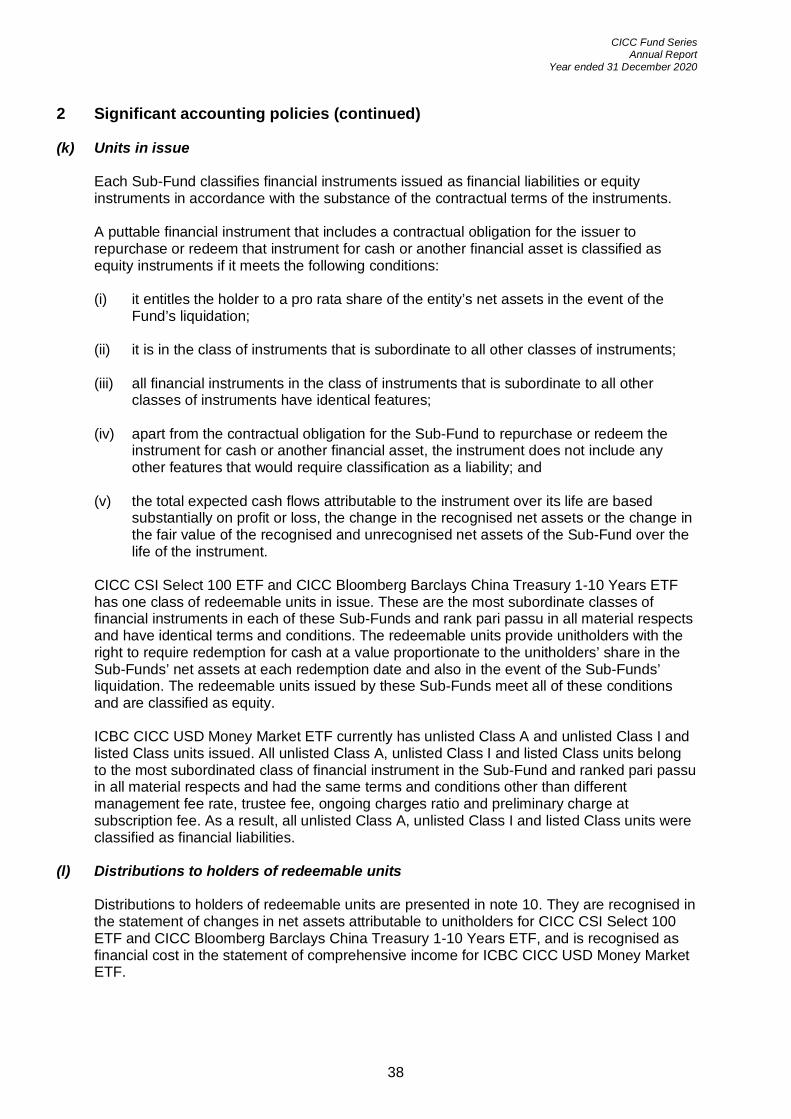
2 Significant accounting policies (continued)
(k) Units in issue Each Sub-Fund classifies financial instruments issued as financial liabilities or equity instruments in accordance with the substance of the contractual terms of the instruments. A puttable financial instrument that includes a contractual obligation for the issuer to repurchase or redeem that instrument for cash or another financial asset is classified as equity instruments if it meets the following conditions: (i) it entitles the holder to a pro rata share of the entity’s net assets in the event of the
Fund’s liquidation; (ii) it is in the class of instruments that is subordinate to all other classes of instruments; (iii) all financial instruments in the class of instruments that is subordinate to all other
classes of instruments have identical features; (iv) apart from the contractual obligation for the Sub-Fund to repurchase or redeem the
instrument for cash or another financial asset, the instrument does not include any other features that would require classification as a liability; and
(v) the total expected cash flows attributable to the instrument over its life are based
substantially on profit or loss, the change in the recognised net assets or the change in the fair value of the recognised and unrecognised net assets of the Sub-Fund over the life of the instrument.
CICC CSI Select 100 ETF and CICC Bloomberg Barclays China Treasury 1-10 Years ETF has one class of redeemable units in issue. These are the most subordinate classes of financial instruments in each of these Sub-Funds and rank pari passu in all material respects and have identical terms and conditions. The redeemable units provide unitholders with the right to require redemption for cash at a value proportionate to the unitholders’ share in the Sub-Funds’ net assets at each redemption date and also in the event of the Sub-Funds’ liquidation. The redeemable units issued by these Sub-Funds meet all of these conditions and are classified as equity. ICBC CICC USD Money Market ETF currently has unlisted Class A and unlisted Class I and listed Class units issued. All unlisted Class A, unlisted Class I and listed Class units belong to the most subordinated class of financial instrument in the Sub-Fund and ranked pari passu in all material respects and had the same terms and conditions other than different management fee rate, trustee fee, ongoing charges ratio and preliminary charge at subscription fee. As a result, all unlisted Class A, unlisted Class I and listed Class units were classified as financial liabilities.
(l) Distributions to holders of redeemable units Distributions to holders of redeemable units are presented in note 10. They are recognised in the statement of changes in net assets attributable to unitholders for CICC CSI Select 100 ETF and CICC Bloomberg Barclays China Treasury 1-10 Years ETF, and is recognised as financial cost in the statement of comprehensive income for ICBC CICC USD Money Market ETF.

CICC Fund Series Annual Report
Year ended 31 December 2020
39
2 Significant accounting policies (continued) Distribution income is recognised in accordance with the Trust Deed, with over-distributions in one period permitted to be adjusted as a deduction of distributable income in the following period.
(m) Segment reporting An operating segment is a component of the Sub-Fund that engages in business activities from which it may earn revenues and incur expenses, including revenues and expenses that relate to transactions with any of the Sub-Fund’s other components, whose operating results are reviewed regularly by the chief operating decision maker to make decisions about information is available. Segment results that are reported to the chief operating decision maker include items directly attributable to a segment as well as those that can be allocated on a reasonable basis. The chief operating decision maker of the Sub-Fund is identified as the Manager.
3 Net gains/(losses) from financial assets at fair value through profit or loss
CICC CSI Select 100 ETF
Year ended 31 December
2020
CICC Bloomberg Barclays China Treasury 1-10
Years ETF Year ended
31 December 2020
ICBC CICC USD Money Market
ETF Year ended
31 December 2020
RMB RMB USD Net realised gains/(losses) on
financial assets at fair value through profit or loss 5,883,898 (71,051) -
Net unrealised losses on financial assets at fair value through profit or loss (4,873,625) (291,263) -
1,010,273 (362,314) -

CICC Fund Series Annual Report
Year ended 31 December 2020
40
3 Net gains/(losses) from financial assets at fair value through profit or loss (continued)
CICC CSI Select 100 ETF
For the period ended
31 December 2019
CICC Bloomberg Barclays China
Treasury 1-10 Years ETF
For the period ended 31
December 2019
ICBC CICC USD Money Market
ETF For the period
ended 31 December
2019 RMB RMB USD Net realised gains/(losses) on
financial assets at fair value through profit or loss 9,048,530 - (1,041)
Net unrealised gains on financial assets at fair value through profit or loss 7,096,376 208,273 -
16,144,906 208,273 (1,041)
4 Taxation
No provision for Hong Kong profits tax has been made in the financial statements as the Sub-Funds are exempt from taxation under section 26A(1A) of the Hong Kong Inland Revenue Ordinance. Interest income and dividend income received by the Sub-Funds may be subject to non-recoverable withholding tax imposed in the country of origin. Interest income and dividend income are recorded gross of such taxes and the withholding tax is recognised in profit or loss as taxation expenses as incurred. Realised gains on disposal of investment securities received by the Sub-Funds may be subject to capital gains tax imposed in the country in which the investment security is listed. Realised gains are recorded gross of such taxes and the capital gains tax is recognised in profit or loss as taxation expenses as incurred.

CICC Fund Series Annual Report
Year ended 31 December 2020
41
5 Investments
CICC CSI Select 100 ETF
31 December 2020
CICC Bloomberg
Barclays China Treasury 1-10
Years ETF 31 December
2020
ICBC CICC USD Money Market
ETF 31 December
2020 RMB RMB USD Financial assets at fair value
through profit or loss Securities and bonds China market - Common stocks 48,906,872 - - - Government bonds - 80,475,800 - Other transferable securities Hong Kong market - Fixed rate notes - - 120,000,000 Oversea markets - Fixed rate notes - - 114,000,000
Total 48,906,872 80,475,800 234,000,000
CICC Fund Series Annual Report
Year ended 31 December 2020
42
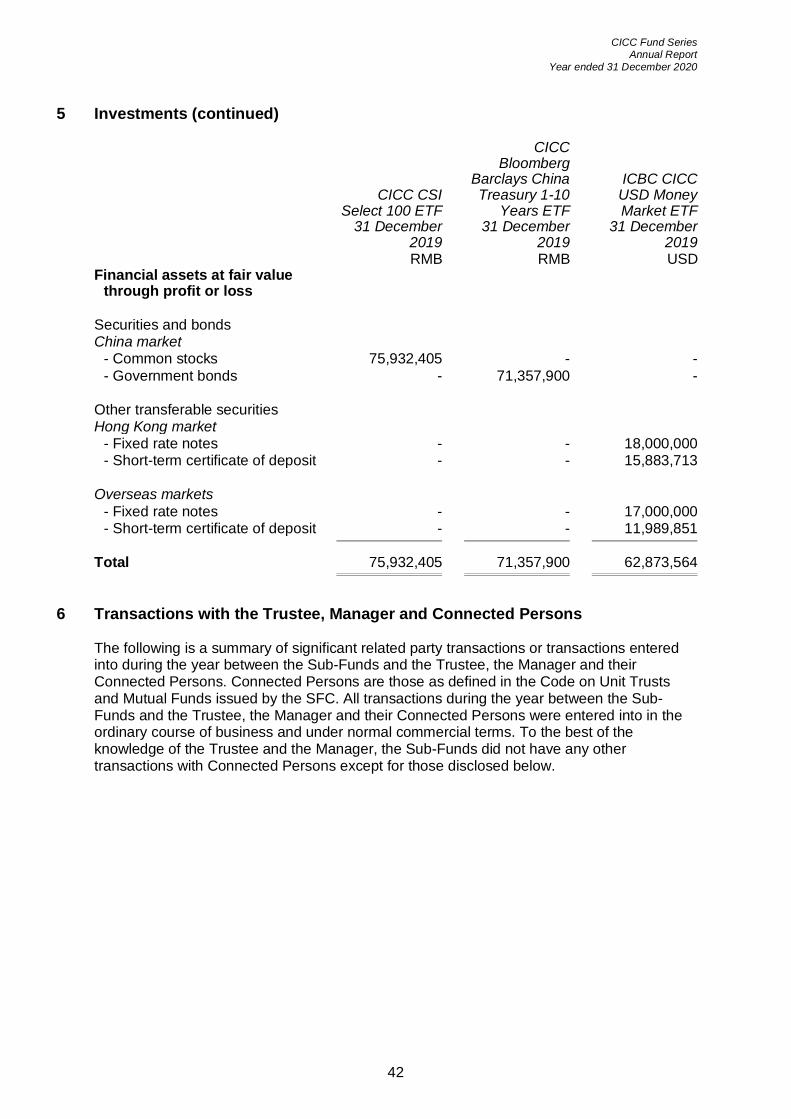
5 Investments (continued)
CICC CSI Select 100 ETF
31 December 2019
CICC Bloomberg
Barclays China Treasury 1-10
Years ETF 31 December
2019
ICBC CICC USD Money Market ETF
31 December 2019
RMB RMB USD Financial assets at fair value
through profit or loss Securities and bonds China market
- Common stocks 75,932,405 - - - Government bonds - 71,357,900 -
Other transferable securities Hong Kong market
- Fixed rate notes - - 18,000,000 - Short-term certificate of deposit - - 15,883,713
Overseas markets
- Fixed rate notes - - 17,000,000 - Short-term certificate of deposit - - 11,989,851
Total 75,932,405 71,357,900 62,873,564
6 Transactions with the Trustee, Manager and Connected Persons
The following is a summary of significant related party transactions or transactions entered into during the year between the Sub-Funds and the Trustee, the Manager and their Connected Persons. Connected Persons are those as defined in the Code on Unit Trusts and Mutual Funds issued by the SFC. All transactions during the year between the Sub-Funds and the Trustee, the Manager and their Connected Persons were entered into in the ordinary course of business and under normal commercial terms. To the best of the knowledge of the Trustee and the Manager, the Sub-Funds did not have any other transactions with Connected Persons except for those disclosed below.

CICC Fund Series Annual Report
Year ended 31 December 2020
43
6 Transactions with the Trustee, Manager and Connected Persons (continued)
(a) The Management fee of calculated as percentage of the Net asset value of the Sub Fund and each Sub-Fund is accrued daily and calculated as at each Dealing Day. It is payable out of the Sub-Fund monthly in arrears.
Management Fee
per annum CICC CSI Select 100 ETF 0.68% CICC Bloomberg Barclays China Treasury 1-10 Years ETF 0.20% ICBC CICC USD Money Market ETF
- Listed Class 0.245% - Unlisted Class A 0.295% - Unlisted Class I 0.195%
ICBC CICC USD Money Market ETF employs a single management fee structure in respect of the Listed Class Units, with the Sub-Fund paying all of its fees, costs and expenses (and its due proportion of any costs and expenses of the Trust allocated to it) attributable to the Listed Class Units as a single flat fee (the “Listed Class Management Fee”). Fees and expenses taken into account in determining the Listed Class Management Fee include, but are not limited to, the Manager’s fee, the Investment Adviser’s fees, Trustee’s fee, Registrar’s fees, fees of the Service Agent, fees and expenses of the auditors, securities transaction fee, ordinary out-of-pocket expenses incurred by the Manager or the Trustee. The Listed Class Management Fee does not include brokerage and transaction costs, fees and extraordinary items such as litigation expenses. For a Sub-Fund (or Class) which does not employ a single management fee structure, the Manager intends to reimburse the respective Sub-Fund (or Class) to the extent that the annual ongoing charges ratio can be maintained at a level which is close to below:
Annual ongoing charges ratio
CICC CSI Select 100 ETF 0.88% CICC Bloomberg Barclays China Treasury 1-10 Years ETF 0.35% ICBC CICC USD Money Market ETF
- Unlisted Class A 0.395% - Unlisted Class I 0.295%
Accordingly, the fees and expenses borne by the Manager during the year/period were:
Year ended 31 December
2020
Period ended 31 December
2019 CICC CSI Select 100 ETF RMB 645,726 RMB 865,762 CICC Bloomberg Barclays China Treasury 1-10 Years ETF RMB 564,873 RMB 863,636 ICBC CICC USD Money Market ETF USD 268,786 USD 260,652

CICC Fund Series Annual Report
Year ended 31 December 2020
44
6 Transactions with the Trustee, Manager and Connected Persons (continued)
(b) Information relating to balances outstanding as at the date of financial statements, the administrator fee, trustee fee and transfer agent fee paid during the year is set out in note 6(c).
(c) Information relating to related party transactions is set out below:
CICC CSI Select 100
ETF Year ended
31 December 2020
CICC Bloomberg Barclays China Treasury 1-10
Years ETF Year ended
31 December 2020
ICBC CICC USD Money Market ETF Year ended
31 December 2020
RMB RMB USD Rate of management fee (note 6(a)) - Listed Class 0.68% 0.20% 0.25% - Unlisted Class A - - 0.30% - Unlisted Class I - - 0.20% Management fee for the year 336,015 152,817 1,080,960 Management fee payables at the
year end 912,210 316,100 336,542 Expenses reimbursement
receivables from the Manager at the year end 1,082,306 974,327 88,751
Administration fee payables at the year end 65,565 66,168 178,368
Transfer agent fee payables at the year end 7,972 7,869 40,578
Trustee fee payables at the year end 1,181 1,893 46,978
Interest income earned from financial assets issued by the affiliated companies of the Manager - - 849,654
Interest income earned from financial assets issued by the affiliated company of the Investment Adviser - - 58,434
Interest income earned from time deposit in the affiliated company of the Investment Adviser - - 158,656
Time deposits balance under the affiliated company of the Investment Adviser - - 38,999,988
Interest income earned from cash deposit in the Custodian - - 1,920
Custody fee and transaction costs payables at the year end 43,126 23,763 53,823
Investments in financial assets issued by the affiliated companies of the Manager - - 81,000,000
Bank balance under the Custodian 125,232 70,751 1,913,985 Securities balance under the
Custodian 48,906,872 80,475,800 234,000,000

CICC Fund Series Annual Report
Year ended 31 December 2020
45
6 Transactions with the Trustee, Manager and Connected Persons (continued)
CICC CSI Select 100 ETF
Period from 30 November 2018 (date of inception) to
31 December 2019
CICC Bloomberg Barclays China Treasury 1-10
Years ETF Period from
7 December 2018
(date of inception) to
31 December 2019
ICBC CICC USD Money Market ETF Period from
17 June 2019 (date of
inception) to 31 December
2019 RMB RMB USD Rate of management fee - Listed Class 0.68% 0.20% - 0.28% 0.25% - Unlisted Class A - - 0.30% - Unlisted Class I - - 0.20% Management fee for the period 576,195 163,283 196,177 Management fee payables at the
period end 576,195 163,283 147,897 Expenses reimbursement receivables
from the Manager at the period end 865,762 863,636 260,652 Establishment cost payables at the
period end 429,182 454,182 170,000 Administration fee payables at the
period end 80,070 57,929 34,521 Transfer agent fee payables at the
period end 31,091 30,859 7,332 Trustee fee payables at the period
end 8,498 7,818 8,128 Interest income earned from
financial assets issued by the affiliated companies of the Manager - - 287,957
Interest income earned from financial assets issued by the affiliated company of the Investment Adviser - - 69,767
Interest income earned from cash deposit in the Custodian - - 14,491
Custody fee and transaction costs payables at the period end 58,256 40,180 21,018
Investments in financial assets issued by the affiliated companies of the Manager - - 35,000,000
Bank balance under the Custodian 854,119 2,556,990 269,417 Securities balance under the
Custodian 75,932,405 71,357,900 62,873,564

CICC Fund Series Annual Report
Year ended 31 December 2020
46
6 Transactions with the Trustee, Manager and Connected Persons (continued)
(d) Transactions with the funds and mandates managed by the Manager and Investment Adviser During the year ended 31 December 2020, the Sub-Funds bought and sold those units to other funds and mandates managed by the Manager, Investment Adviser and/or their affiliates at prevailing net assets value per unit on the trade date.
CICC CSI Select 100
ETF Year ended
31 December 2020
CICC Bloomberg Barclays China Treasury 1-10
Years ETF Year ended
31 December 2020
ICBC CICC USD Money Market ETF Year ended
31 December 2020
RMB RMB USD Subscription of units - Listed Class - - 514,715,419 - Unlisted Class A - - 51,298,587 - Unlisted Class I - - 70,355,822 Redemption of units - Listed Class (29,506,800) - (259,845,760) - Unlisted Class A - - (38,296,960) - Unlisted Class I - - (65,879,116)
CICC CSI Select 100 ETF
Period from 30 November 2018 (date of inception) to
31 December 2019
CICC Bloomberg Barclays China Treasury 1-10
Years ETF Period from
7 December 2018
(date of inception)
to 31December 2019
ICBC CICC USD Money Market ETF Period from
17 June 2019 (date of
inception) to 31 December
2019 RMB RMB USD Subscription of units - Listed Class 68,632,400 72,052,400 212,862,934 - Unlisted Class A - - 7,163,684 - Unlisted Class I - - 50,933,866 Redemption of units - Listed Class (9,598,000) - (30,267,659) - Unlisted Class A - - (3,301,319) - Unlisted Class I - - -

CICC Fund Series Annual Report
Year ended 31 December 2020
47
6 Transactions with the Trustee, Manager and Connected Persons (continued)
(e) Investment transactions with connected persons of the Manager China International Capital Corporation Hong Kong Securities Limited, acting as the broker of Sub-Funds, was an affiliate of the Manager.
Aggregate value
of purchases and
sales of securities
Total commission
paid
% of the Sub-Fund’s
total transactions
during the year
Average Commission
rate As at 31 December 2020 % % CICC CSI Select 100 ETF RMB
118,471,720 RMB 59,236 82.70% 0.05%
ICBC CICC USD Money
Market ETF USD
156,000,000 - 34.39% -
As at 31 December 2019 CICC CSI Select 100 ETF RMB
186,715,519 RMB 93,358 93.27% 0.05%
ICBC CICC USD Money
Market ETF USD
83,000,000 - 49.72% -

CICC Fund Series Annual Report
Year ended 31 December 2020
48
6 Transactions with the Trustee, Manager and Connected Persons (continued)
(f) Holdings of units The Manager, Investment Adviser and their affiliates may transact in the units of the Sub-Funds.
CICC CSI Select 100
ETF 31 December
2020
CICC Bloomberg Barclays China Treasury 1-10
Years ETF 31 December
2020
ICBC CICC USD Money Market ETF
31 December 2020
Unit Unit Unit Manager and its affiliates China International Capital
Corporation Hong Kong Asset Management Limited - CICCHK - Unlisted Class I - - 4,196
China International Capital Corporation Hong Kong Asset Management Limited - CECEP - - 2,833 - Unlisted Class I
China International Capital Corporation Hong Kong Asset Management Limited - CICCWI2 4,158,000 650,000 - - Listed Class
China International Capital Corporation Hong Kong Securities Limited - Listed Class 10,000 200 134,143 - Unlisted Class A - - 16,604 - Unlisted Class I - - 18,152
Investment Adviser and its
affiliates ICBC (Asia) Nominee Limited -
ICBC (Asia) Trustee Company Limited - China Prosperity Funds - Greater China Fund - Listed Class - - 159,000 - Unlisted Class I - - 29,684

CICC Fund Series Annual Report
Year ended 31 December 2020
49
6 Transactions with the Trustee, Manager and Connected Persons (continued)
CICC CSI Select 100 ETF
31 December 2019
CICC Bloomberg Barclays China Treasury 1-10
Years ETF 31 December
2019
ICBC CICC USD Money Market ETF
31 December 2019
Unit Unit Unit Manager and its affiliates China International Capital
Corporation Hong Kong Asset Management Limited - CSII - Unlisted Class I - - 4,938
China International Capital Corporation Hong Kong Asset Management Limited - SIG - Unlisted Class I - - 6,911
China International Capital Corporation Hong Kong Asset Management Limited - CICCWI2 - Listed Class 7,158,000 650,000 1,000
China International Capital Corporation Hong Kong Securities Limited - Listed Class - 200 14 - Unlisted Class A - - 3,819 - Unlisted Class I - - 8,826
Investment Adviser and its
affiliates ICBC (Asia) Nominee Limited -
ICBC (Asia) Trustee Company Limited - China Prosperity Funds - Greater China Fund - Listed Class - - 120,000 - Unlisted Class I - - 29,684
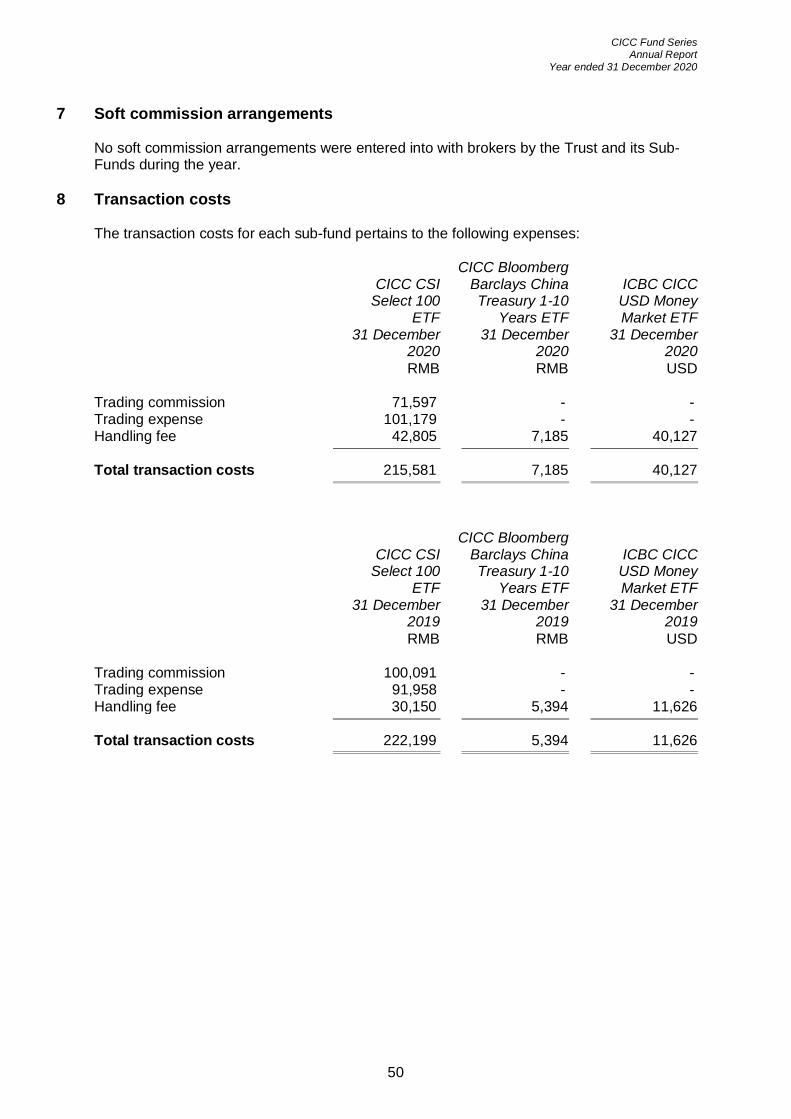
CICC Fund Series Annual Report
Year ended 31 December 2020
50
7 Soft commission arrangements No soft commission arrangements were entered into with brokers by the Trust and its Sub-Funds during the year.
8 Transaction costs The transaction costs for each sub-fund pertains to the following expenses:
CICC CSI Select 100
ETF 31 December
2020
CICC Bloomberg Barclays China Treasury 1-10
Years ETF 31 December
2020
ICBC CICC USD Money Market ETF
31 December 2020
RMB RMB USD Trading commission 71,597 - - Trading expense 101,179 - - Handling fee 42,805 7,185 40,127
Total transaction costs 215,581 7,185 40,127
CICC CSI Select 100
ETF 31 December
2019
CICC Bloomberg Barclays China Treasury 1-10
Years ETF 31 December
2019
ICBC CICC USD Money Market ETF
31 December 2019
RMB RMB USD Trading commission 100,091 - - Trading expense 91,958 - - Handling fee 30,150 5,394 11,626
Total transaction costs 222,199 5,394 11,626

CICC Fund Series Annual Report
Year ended 31 December 2020
51
9 Units in issue Number of units in issue as at 31 December
CICC CSI Select 100 ETF
31 December 2020
CICC Bloomberg Barclays China Treasury 1-10
Years ETF 31 December
2020
ICBC CICC USD Money Market
ETF 31 December
2020 Unit Unit Unit Balance at the end of the year - Listed Class 4,500,000 750,000 437,000 - Unlisted Class A - - 16,604 - Unlisted Class I - - 74,769
31 December
2019 31 December
2019 31 December
2019 Unit Unit Unit Balance at the end of the period - Listed Class 7,500,000 700,000 184,000 - Unlisted Class A - - 3,819 - Unlisted Class I - - 50,359
Net asset value per unit as at 31 December
CICC CSI Select 100 ETF
31 December 2020
CICC Bloomberg Barclays China Treasury 1-10
Years ETF 31 December
2020
ICBC CICC USD Money Market
ETF 31 December
2020 Unit Unit Unit Balance at the end of the year - Listed Class 10.88 109.16 1,026.33 - Unlisted Class A - - 1,025.04 - Unlisted Class I - - 1,025.87
31 December
2019
31 December
2019
31 December
2019 Unit Unit Unit Balance at the end of the
period - Listed Class 10.17 106.67 1,013.16 - Unlisted Class A - - 1,012.99 - Unlisted Class I - - 1,013.10

CICC Fund Series Annual Report
Year ended 31 December 2020
52
10 Distributions Each Sub-Fund did not pay any distributions year/period ended 31 December 2020 and 2019.
CICC CSI Select 100 ETF
Year ended 31 December
2020
CICC Bloomberg Barclays China Treasury 1-10
Years ETF Year ended
31 December 2020
ICBC CICC USD Money Market
ETF Year ended
31 December 2020
RMB RMB USD Amount available for
distribution at the beginning of the year 76,306,857 74,671,958 241,308,517
Subscription of units - 5,422,400 674,812,214 Redemption of units (29,506,800) - (379,029,612) Profit before distributions 2,138,873 1,773,486 5,140,596
Amount available for distribution at the end of the year 48,938,930 81,867,844 542,231,715
CICC CSI Select 100 ETF
For the period ended
31 December 2019
CICC Bloomberg Barclays China Treasury 1-10
Years ETF For the period
ended 31 December
2019
ICBC CICC USD Money Market
ETF For the period
ended 31 December
2019 RMB RMB USD Amount available for
distribution at the beginning of the period - - -
Subscription of units 68,632,400 72,052,400 272,962,026 Redemption of units (9,598,000) - (33,568,978) Profit before distributions 17,272,457 2,619,558 1,915,469
Amount available for distribution at the end of the period 76,306,857 74,671,958 241,308,517
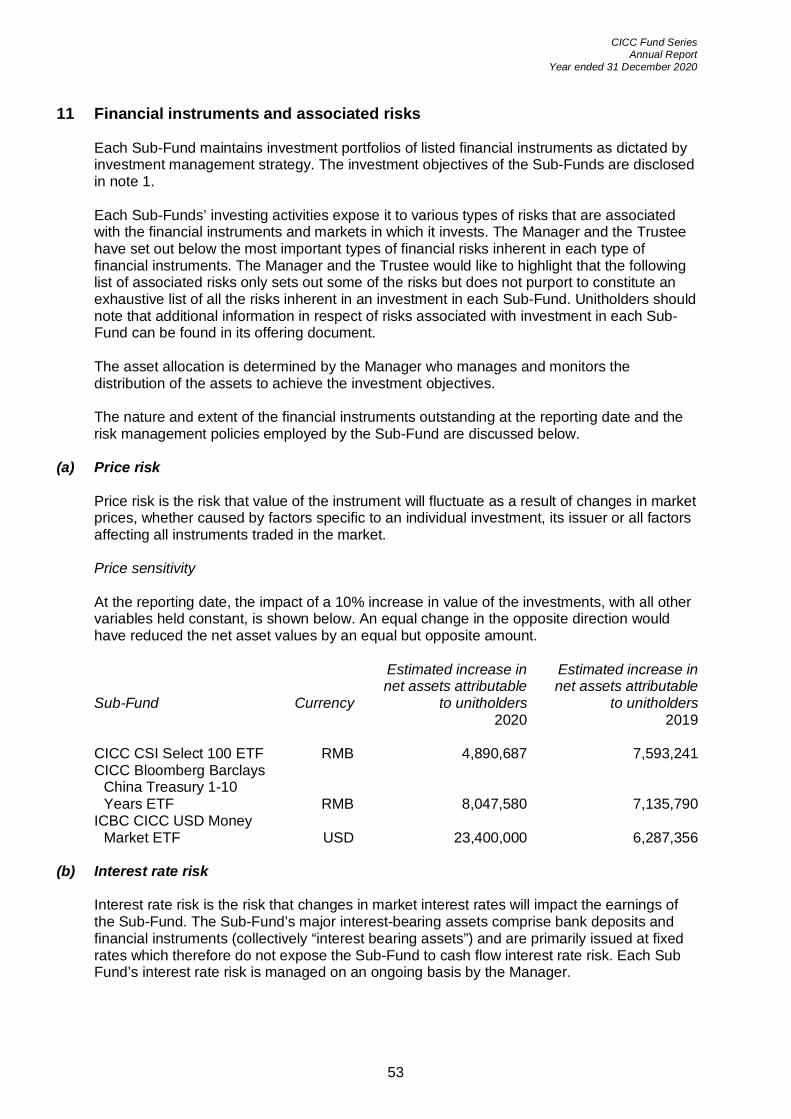
CICC Fund Series Annual Report
Year ended 31 December 2020
53
11 Financial instruments and associated risks Each Sub-Fund maintains investment portfolios of listed financial instruments as dictated by investment management strategy. The investment objectives of the Sub-Funds are disclosed in note 1. Each Sub-Funds’ investing activities expose it to various types of risks that are associated with the financial instruments and markets in which it invests. The Manager and the Trustee have set out below the most important types of financial risks inherent in each type of financial instruments. The Manager and the Trustee would like to highlight that the following list of associated risks only sets out some of the risks but does not purport to constitute an exhaustive list of all the risks inherent in an investment in each Sub-Fund. Unitholders should note that additional information in respect of risks associated with investment in each Sub-Fund can be found in its offering document. The asset allocation is determined by the Manager who manages and monitors the distribution of the assets to achieve the investment objectives. The nature and extent of the financial instruments outstanding at the reporting date and the risk management policies employed by the Sub-Fund are discussed below.
(a) Price risk Price risk is the risk that value of the instrument will fluctuate as a result of changes in market prices, whether caused by factors specific to an individual investment, its issuer or all factors affecting all instruments traded in the market. Price sensitivity At the reporting date, the impact of a 10% increase in value of the investments, with all other variables held constant, is shown below. An equal change in the opposite direction would have reduced the net asset values by an equal but opposite amount.
Sub-Fund Currency
Estimated increase in net assets attributable
to unitholders
Estimated increase in net assets attributable
to unitholders 2020 2019
CICC CSI Select 100 ETF RMB 4,890,687 7,593,241 CICC Bloomberg Barclays
China Treasury 1-10 Years ETF RMB 8,047,580 7,135,790
ICBC CICC USD Money Market ETF USD 23,400,000 6,287,356
(b) Interest rate risk
Interest rate risk is the risk that changes in market interest rates will impact the earnings of the Sub-Fund. The Sub-Fund’s major interest-bearing assets comprise bank deposits and financial instruments (collectively “interest bearing assets”) and are primarily issued at fixed rates which therefore do not expose the Sub-Fund to cash flow interest rate risk. Each Sub Fund’s interest rate risk is managed on an ongoing basis by the Manager.
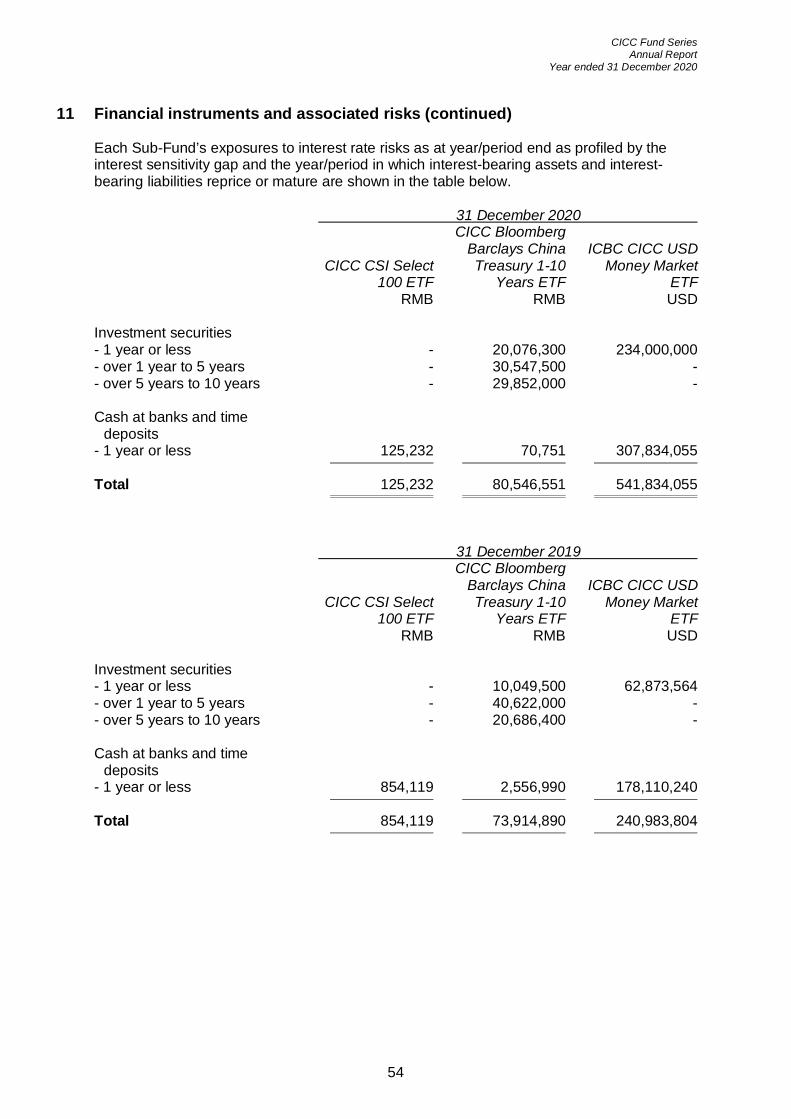
CICC Fund Series Annual Report
Year ended 31 December 2020
54
11 Financial instruments and associated risks (continued) Each Sub-Fund’s exposures to interest rate risks as at year/period end as profiled by the interest sensitivity gap and the year/period in which interest-bearing assets and interest-bearing liabilities reprice or mature are shown in the table below. 31 December 2020
CICC CSI Select
100 ETF
CICC Bloomberg Barclays China Treasury 1-10
Years ETF
ICBC CICC USD Money Market
ETF RMB RMB USD
Investment securities - 1 year or less - 20,076,300 234,000,000 - over 1 year to 5 years - 30,547,500 - - over 5 years to 10 years - 29,852,000 - Cash at banks and time
deposits - 1 year or less 125,232 70,751 307,834,055
Total 125,232 80,546,551 541,834,055
31 December 2019
CICC CSI Select
100 ETF
CICC Bloomberg Barclays China Treasury 1-10
Years ETF
ICBC CICC USD Money Market
ETF RMB RMB USD
Investment securities - 1 year or less - 10,049,500 62,873,564 - over 1 year to 5 years - 40,622,000 - - over 5 years to 10 years - 20,686,400 - Cash at banks and time
deposits - 1 year or less 854,119 2,556,990 178,110,240
Total 854,119 73,914,890 240,983,804

CICC Fund Series Annual Report
Year ended 31 December 2020
55
11 Financial instruments and associated risks (continued) Interest rate sensitivity At the date of statement of financial position, assuming all other factors unchanged, it is estimated that an increase in interest rates of 100 basis points would result in an increase in the amount of the comprehensive income of: - CICC CSI Select 100 ETF by RMB 1,252 (2019: RMB 8,541), - CICC Bloomberg Barclays China Treasury 1-10 Years ETF by RMB 805,466 (2019: RMB
739,149), and - ICBC CICC USD Money Market ETF by USD 5,418,341 (2019: USD 2,409,838). The impact of the decrease in interest rates to the comprehensive income is considered to be minimal.
(c) Currency risk For CICC CSI Select 100 ETF and CICC Bloomberg Barclays China Treasury 1-10 Years ETF, all financial instruments at 31 December 2020 and 2019 are denominated in RMB which is Sub-Funds’ functional currency, therefore these Sub-Fund is not subject to any significant currency risk. For ICBC CICC USD Money Market ETF, all financial instruments at 31 December 2020 and 2019 are denominated in USD and HKD. As the HKD is pegged to the USD, the Sub-Fund is not subject to any significant currency risk.
(d) Credit risk Credit risk is the risk that a counterparty to a financial instrument will fail to discharge an obligation or commitment that it has entered into with the Sub-Fund. The Sub-Fund’s exposure to credit risk is monitored by the Manager on an ongoing basis. At 31 December 2020 and 2019, part of the Sub-Fund’s financial assets is exposed to credit risk. These include investments in financial assets and cash and cash equivalents, if any, placed with the Custodian. The Sub-Fund’s investments in financial assets, time deposits and cash placed with banks exposed to credit risk with the following credit ratings equivalent to which provided by Standard & Poor’s, Moody’s and Fitch rating services expressed as a percentage of total exposure of investments in financial assets, time deposits and cash placed with banks:
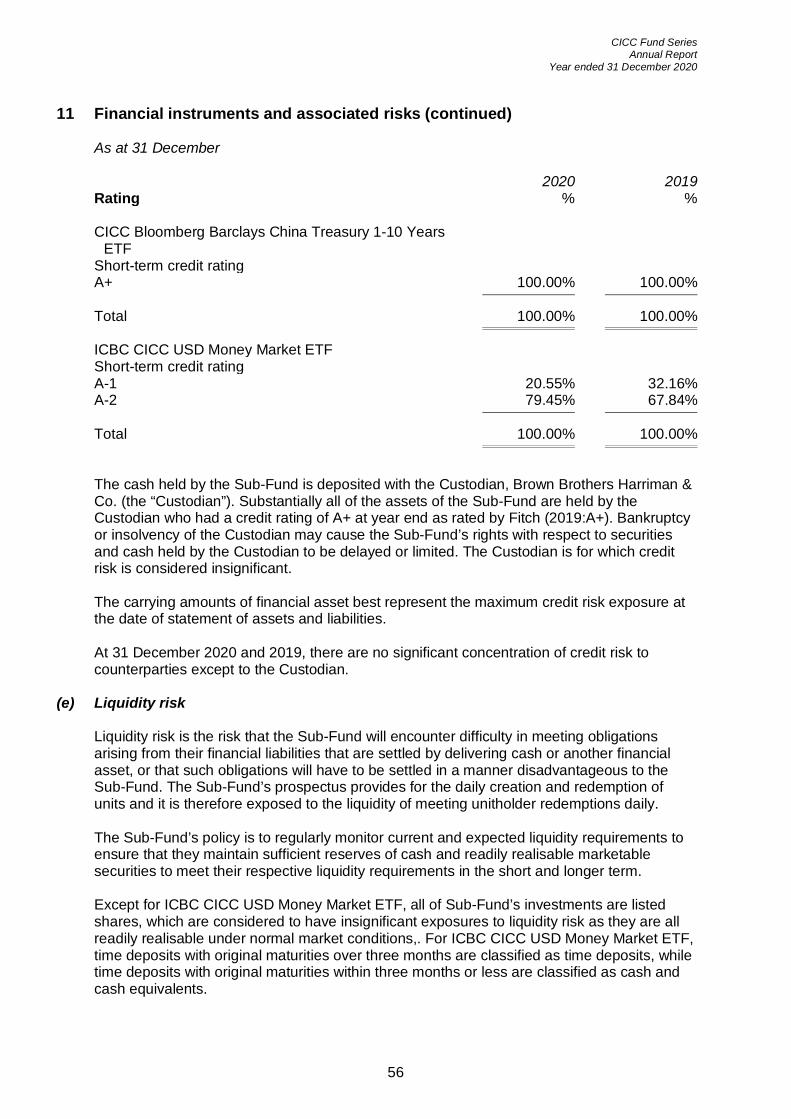
CICC Fund Series Annual Report
Year ended 31 December 2020
56
11 Financial instruments and associated risks (continued) As at 31 December 2020 2019 Rating % % CICC Bloomberg Barclays China Treasury 1-10 Years
ETF Short-term credit rating A+ 100.00% 100.00%
Total 100.00% 100.00%
ICBC CICC USD Money Market ETF Short-term credit rating A-1 20.55% 32.16% A-2 79.45% 67.84%
Total 100.00% 100.00%
The cash held by the Sub-Fund is deposited with the Custodian, Brown Brothers Harriman & Co. (the “Custodian”). Substantially all of the assets of the Sub-Fund are held by the Custodian who had a credit rating of A+ at year end as rated by Fitch (2019:A+). Bankruptcy or insolvency of the Custodian may cause the Sub-Fund’s rights with respect to securities and cash held by the Custodian to be delayed or limited. The Custodian is for which credit risk is considered insignificant. The carrying amounts of financial asset best represent the maximum credit risk exposure at the date of statement of assets and liabilities. At 31 December 2020 and 2019, there are no significant concentration of credit risk to counterparties except to the Custodian.
(e) Liquidity risk Liquidity risk is the risk that the Sub-Fund will encounter difficulty in meeting obligations arising from their financial liabilities that are settled by delivering cash or another financial asset, or that such obligations will have to be settled in a manner disadvantageous to the Sub-Fund. The Sub-Fund’s prospectus provides for the daily creation and redemption of units and it is therefore exposed to the liquidity of meeting unitholder redemptions daily. The Sub-Fund’s policy is to regularly monitor current and expected liquidity requirements to ensure that they maintain sufficient reserves of cash and readily realisable marketable securities to meet their respective liquidity requirements in the short and longer term. Except for ICBC CICC USD Money Market ETF, all of Sub-Fund’s investments are listed shares, which are considered to have insignificant exposures to liquidity risk as they are all readily realisable under normal market conditions,. For ICBC CICC USD Money Market ETF, time deposits with original maturities over three months are classified as time deposits, while time deposits with original maturities within three months or less are classified as cash and cash equivalents.

CICC Fund Series Annual Report
Year ended 31 December 2020
57
11 Financial instruments and associated risks (continued) All other financial liabilities disclosed in the statement of assets and liabilities mature within three months from the date of the statement of assets and liabilities or are repayable on demand. Each Sub-Fund’s liquidity risk is managed on a daily basis by the Manager in accordance with the policies and procedures in place. Each Sub-Fund’s redemption policy allows redemption to be made by participating dealers with baskets of securities and a minor cash component or wholly with cash.
(f) Capital management Each Sub-Fund’s capital as at the reporting date is represented by the respective net assets attributable to unitholders. Each Sub-Fund’s objective in managing the capital is to ensure a stable and strong base to provide investment results that correspond closely to the return of the respective underlying index, with a balance for managing liquidity risk arising from the redemptions. The Manager manages the capital of each Sub-Fund in accordance with each Sub-Fund’s investment objectives and policies stated in the Sub-Funds’ Prospectus. There were no changes in the policies and procedures during the year with respect to the Sub-Fund’s approach to its capital management. The Sub-Fund is not subject to externally imposed capital requirements. The amount and the movement of equity are stated in the statement of changes in net assets attributable to unitholders. As the redeemable units are redeemed on demand at the unitholders’ option, the actual level of redemption may differ significantly from historical experience.
12 Fair value information Each Sub-Fund’s financial instruments are measured at fair value at the reporting date. Fair value estimates are made at a specific point in time, based on market conditions and information about the financial instruments. Usually, fair values can be reliably determined within a reasonable range. For certain other financial instruments, including amounts due from brokers, interest and dividends receivables, cash at banks, amounts due to brokers, distribution payable, accruals and other payables, the carrying amounts approximate fair values due to the immediate or short-term nature of these financial instruments. Valuation of financial instruments Each Sub-Fund’s accounting policy on fair value measurements is detailed in the significant accounting policy in note 2(d)(iii). Each Sub-Fund measures fair values using the following fair value hierarchy that reflects the significance of the inputs used in making the measurements. Level 1: Inputs that are quoted market prices (unadjusted) in active markets for identical
instruments.

CICC Fund Series Annual Report
Year ended 31 December 2020
58
12 Fair value information (continued) Level 2: Inputs other than quoted prices included within Level 1 that are observable
either directly (i.e. as prices) or indirectly (i.e. derived from prices). The category includes instruments valued using: quoted market price in active markets for similar instruments; quoted prices for identical or similar instruments in markets that are considered less than active; or other valuation techniques in which all significant inputs are directly or indirectly observable from market data.
Level 3: Inputs that are unobservable. This category includes all instruments for which
the valuation technique includes inputs not based on observable data and the unobservable inputs have a significant effect on the instrument’s valuation. This category includes instruments that are valued based on quoted prices for similar instruments but for which significant unobservable adjustments or assumptions are required to reflect differences between the instruments.
When fair values of listed and quoted investments at the reporting date are based on quoted market prices or binding dealer price quotations in an active market, without any deduction for transactions costs, the instruments are included within Level 1 of the hierarchy. When fair values of debt securities at the reporting date represent quoted prices in markets that are considered less than active or consensus prices derived by third parties using valuation techniques where all significant inputs are directly or indirectly observable from market data, those debt securities are included within Level 2 of the hierarchy. Fair values of derivatives are determined by valuation techniques. Level 3 investment consisted of equity instrument which has been suspended for trading and in these financial statements it is revalued from last traded price before suspension based on relevant news and information. For all other financial instruments, their carrying amounts approximate fair value due to the intermediate or short-term nature of these financial instruments. The following analyses financial instruments at fair value through profit or loss at the reporting date, by the level in the fair value hierarchy into which the fair value measurement is categorised. CICC CSI Select 100 ETF Level 1 Level 2 Level 3 Total RMB RMB RMB RMB As at 31 December 2020 Financial assets at fair value
through profit or loss Investments: Common stocks 48,906,872 - - 48,906,872
48,906,872 - - 48,906,872
As at 31 December 2019
Financial assets at fair value through profit or loss
Investments:
Common stocks 75,932,405 - - 75,932,405
75,932,405 - - 75,932,405

CICC Fund Series Annual Report
Year ended 31 December 2020
59
12 Fair value information (continued) CICC Bloomberg Barclays China Treasury 1-10 Years ETF Level 1 Level 2 Level 3 Total RMB RMB RMB RMB As at 31 December 2020 Financial assets at fair value
through profit or loss Investments: Government bonds - 80,475,800 - 80,475,800
- 80,475,800 - 80,475,800
As at 31 December 2019 Financial assets at fair value
through profit or loss Investments: Government bonds - 71,357,900 - 71,357,900
- 71,357,900 - 71,357,900
ICBC CICC USD Money Market ETF Level 1 Level 2 Level 3 Total USD USD USD USD As at 31 December 2020 Financial assets at fair value
through profit or loss Short term: Fixed rate notes - 234,000,000 - 234,000,000
- 234,000,000 - 234,000,000
As at 31 December 2019 Financial assets at fair value
through profit or loss Short term: Fixed rate notes - 35,000,000 - 35,000,000 Short term certificate of
deposits - 27,873,564 - 27,873,564
- 62,873,564 - 62,873,564
CICC Fund Series Annual Report
Year ended 31 December 2020
60
12 Fair value information (continued) There were no transfers of financial instruments between Level 1 and Level 2, or transfers into or out of Level 3 during the year/period. The Sub-Fund accounts for investments it transfers in and out of each level at the end of the year.
13 Reconciliation of net asset value The net asset value (“NAV”) presented in the financial statements and that quoted for pricing purpose at the year end (“Dealing NAV”) are not materially different for the year/period ended 31 December 2020 and 2019.
14 Segment information The Manager makes the strategic resource allocation on behalf of the Sub-Fund and determines the operating segments based on the internal reporting used to make strategic decisions. The Manager’s asset allocation decisions are based on one single and integrated investment strategy for the Sub-Fund, and the Sub-Fund’s performance is evaluated on an overall basis. Accordingly, the Manager considers that the Sub-Fund has one single operating segment which is investing in a portfolio of financial instruments to generate investment returns in accordance with the investment objectives stipulated in the Prospectus. All revenues and losses generated from investments by the Sub-Fund are disclosed in note 3. The segment information provided to the Manager is the same as that disclosed in the statement of comprehensive income and the statement of assets and liabilities.
15 Contingent liabilities and capital commitments As at 31 December 2020, there were no contingent liabilities or capital commitments outstanding.
16 Possible impact of amendments, new standards and interpretations issued but not yet effective for the year ended 31 December 2020 Up to the date of issue of these financial statements, the IASB has issued a number of amendments and new standards which are not yet effective for the year ended 31 December 2020 and which have not been adopted in these financial statements. These include the following which may be relevant to the Sub-fund.
Effective for accounting periods
beginning on or after Annual Improvements to IFRSs 2018-2020 Cycle 1 January 2022 Amendments to IAS 1, Classification of Liabilities as Current or
Non-current 1 January 2023
The Sub-Funds are in the process of making an assessment of what the impact of these developments are expected to be in the period of initial application. So far it has concluded that the adoption of them is unlikely to have a significant impact on the financial statements.

CICC Fund Series Annual Report
Year ended 31 December 2020
61
Portfolio statement as at 31 December 2020 (Unaudited) CICC CSI Select 100 ETF
Investments Holdings Fair Value
RMB % of
Net Assets Financial assets at fair value through profit or
loss Listed Securities Common Stocks China Communication Services China South Publishing & Media Group Co Ltd 13,100 124,843 0.26% Focus Media Information Technology Co Ltd 185,100 1,826,937 3.73% Oriental Pearl Group Co Ltd 37,400 334,356 0.68% Wasu Media Holding Co Ltd 10,400 89,024 0.18%
Total Communication Services 2,375,160 4.85%
Consumer Discretionary Anhui Zhongding Sealing Parts Co Ltd 13,300 155,743 0.32% Changchun Faway Automobile Components Co Ltd 9,600 96,384 0.20% Chongqing Zongshen Power Machinery Co Ltd 12,500 96,375 0.20% Chow Tai Seng Jewellery Co Ltd 5,200 138,580 0.28% FAWER Automotive Parts Co Ltd 12,800 93,952 0.19% Guangdong Xinbao Electrical Appliances Holdings
Co Ltd 5,800 245,050 0.50% Guangzhou Automobile Group Co Ltd 16,900 224,601 0.46% Haier Smart Home Co Ltd 69,000 2,015,490 4.12% Hisense Home Appliances Group Co Ltd 7,900 113,839 0.23% Huayu Automotive Systems Co Ltd 28,800 830,016 1.70% Jason Furniture Hangzhou Co Ltd 1,100 77,561 0.16% Lao Feng Xiang Co Ltd 2,300 104,259 0.21% Midea Group Co Ltd 28,500 2,805,540 5.73% SAIC Motor Corp Ltd 62,800 1,534,832 3.14% Shanghai Yuyuan Tourist Mart Group Co Ltd 28,400 252,476 0.51% TCL Technology Group Corp 252,300 1,786,284 3.65% Weifu High-Technology Group Co Ltd 8,600 199,434 0.41% Wuchan Zhongda Group Co Ltd 46,200 201,894 0.41% Xiamen Comfort Science & Technology Group Co
Ltd 6,700 90,115 0.18% Xiamen Intretech Inc 2,500 160,825 0.33%
Total Consumer Discretionary 11,223,250 22.93%
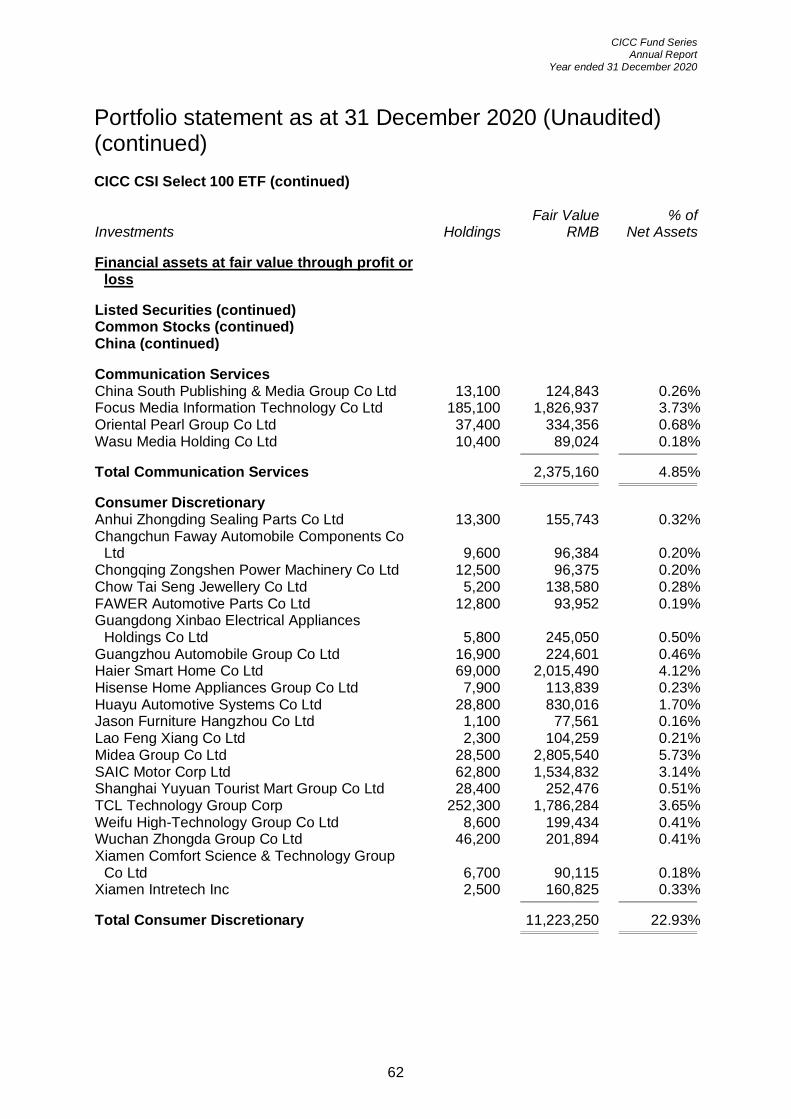
CICC Fund Series Annual Report
Year ended 31 December 2020
62
Portfolio statement as at 31 December 2020 (Unaudited) (continued) CICC CSI Select 100 ETF (continued)
Investments Holdings Fair Value
RMB % of
Net Assets Financial assets at fair value through profit or
loss Listed Securities (continued) Common Stocks (continued) China (continued) Communication Services China South Publishing & Media Group Co Ltd 13,100 124,843 0.26% Focus Media Information Technology Co Ltd 185,100 1,826,937 3.73% Oriental Pearl Group Co Ltd 37,400 334,356 0.68% Wasu Media Holding Co Ltd 10,400 89,024 0.18%
Total Communication Services 2,375,160 4.85%
Consumer Discretionary Anhui Zhongding Sealing Parts Co Ltd 13,300 155,743 0.32% Changchun Faway Automobile Components Co
Ltd 9,600 96,384 0.20% Chongqing Zongshen Power Machinery Co Ltd 12,500 96,375 0.20% Chow Tai Seng Jewellery Co Ltd 5,200 138,580 0.28% FAWER Automotive Parts Co Ltd 12,800 93,952 0.19% Guangdong Xinbao Electrical Appliances
Holdings Co Ltd 5,800 245,050 0.50% Guangzhou Automobile Group Co Ltd 16,900 224,601 0.46% Haier Smart Home Co Ltd 69,000 2,015,490 4.12% Hisense Home Appliances Group Co Ltd 7,900 113,839 0.23% Huayu Automotive Systems Co Ltd 28,800 830,016 1.70% Jason Furniture Hangzhou Co Ltd 1,100 77,561 0.16% Lao Feng Xiang Co Ltd 2,300 104,259 0.21% Midea Group Co Ltd 28,500 2,805,540 5.73% SAIC Motor Corp Ltd 62,800 1,534,832 3.14% Shanghai Yuyuan Tourist Mart Group Co Ltd 28,400 252,476 0.51% TCL Technology Group Corp 252,300 1,786,284 3.65% Weifu High-Technology Group Co Ltd 8,600 199,434 0.41% Wuchan Zhongda Group Co Ltd 46,200 201,894 0.41% Xiamen Comfort Science & Technology Group
Co Ltd 6,700 90,115 0.18% Xiamen Intretech Inc 2,500 160,825 0.33%
Total Consumer Discretionary 11,223,250 22.93%

CICC Fund Series Annual Report
Year ended 31 December 2020
63
Portfolio statement as at 31 December 2020 (Unaudited) (continued) CICC CSI Select 100 ETF (continued)
Investments Holdings Fair Value
RMB % of
Net Assets Financial assets at fair value through profit or
loss Listed Securities (continued) Common Stocks (continued) China (continued) Consumer Staples Beijing Dabeinong Technology Group Co Ltd 53,700 518,742 1.06% Henan Shuanghui Investment & Development
Co Ltd 18,700 877,778 1.79% Inner Mongolia Yili Industrial Group Co Ltd 60,000 2,662,200 5.44% Tecon Biology Co Ltd 13,600 144,024 0.30%
Total Consumer Staples 4,202,744 8.59%
Energy China Shenhua Energy Co Ltd 60,300 1,086,003 2.22%
Total Energy 1,086,003 2.22%
Financials Avic Capital Co Ltd 98,400 430,992 0.88% China Merchants Securities Co Ltd 65,900 1,538,106 3.15% GF Securities Co Ltd 54,100 880,748 1.80% Guotai Junan Securities Co Ltd 82,400 1,444,472 2.95%
Total Financials 4,294,318 8.78%
Health Care China Resources Sanjiu Medical &
Pharmaceutical Co Ltd 10,000 249,400 0.51% Guangzhou Baiyunshan Pharmaceutical
Holdings Co Ltd 12,700 371,475 0.76% Jinyu Bio-Technology Co Ltd 24,000 501,360 1.02% Shanghai Kehua Bio-Engineering Co Ltd 7,500 115,650 0.24% Xiamen Kingdomway Group Co 4,500 156,015 0.32% Yunnan Baiyao Group Co Ltd 9,400 1,067,840 2.18%
Total Health Care 2,461,740 5.03%
Industrials Beijing New Building Materials PLC 18,000 720,900 1.47% Camel Group Co Ltd 12,100 113,135 0.23%

CICC Fund Series Annual Report
Year ended 31 December 2020
64
Portfolio statement as at 31 December 2020 (Unaudited) (continued) CICC CSI Select 100 ETF (continued)
Investments Holdings Fair Value
RMB % of
Net Assets Financial assets at fair value through profit or
loss Listed Securities (continued) Common Stocks (continued) China (continued) Industrials (continued) China Gezhouba Group Co Ltd 50,500 332,290 0.68% China Meheco Co Ltd 9,700 139,001 0.28% China National Chemical Engineering Co Ltd 45,100 264,737 0.54% China Railway Group Ltd 182,900 963,883 1.97% China State Construction Engineering Corp Ltd 377,100 1,874,187 3.83% CNHTC Jinan Truck Co Ltd 4,900 154,154 0.32% Fujian Longking Co Ltd 15,600 138,528 0.28% Fujian Longma Environmental Sanitation
Equipment Co Ltd 7,600 122,208 0.25% Hangcha Group Co Ltd 13,000 273,130 0.56% Hangxiao Steel Structure Co Ltd 23,600 88,500 0.18% Jiangsu Expressway Co Ltd 9,000 82,890 0.17% Jiangsu Linyang Energy Co Ltd 18,900 149,688 0.31% Ningbo Zhoushan Port Co Ltd 57,800 226,576 0.46% Shandong Hi-speed Co Ltd 11,400 70,452 0.14% Shanghai Construction Group Co Ltd 81,400 245,014 0.50% Shanghai Hanbell Precise Machinery Co Ltd 3,800 57,304 0.12% Shanghai Mechanical & Electrical Industry Co
Ltd 5,800 112,868 0.23% Shanghai Tunnel Engineering Co Ltd 34,400 186,104 0.38% Sichuan Road & Bridge Co Ltd 34,500 155,595 0.32% TangShan Port Group Co Ltd 54,100 134,168 0.27% Weichai Power Co Ltd 87,600 1,383,204 2.83% Xiamen C & D Inc 31,100 255,331 0.52% Xinjiang Goldwind Science & Technology Co Ltd 58,200 829,350 1.70% Zhejiang Wanliyang Co Ltd 12,200 108,824 0.22% Zhejiang Weixing New Building Materials Co Ltd 11,500 215,050 0.44% Zhejiang Yankon Group Co Ltd 15,900 58,512 0.12% Zhuzhou Kibing Group Co Ltd 29,400 376,320 0.77%
Total Industrials 9,831,903 20.09%
Information Technology Chaozhou Three-Circle Group Co Ltd 19,700 733,825 1.50% MLS Co Ltd 12,900 188,211 0.38%

CICC Fund Series Annual Report
Year ended 31 December 2020
65
Portfolio statement as at 31 December 2020 (Unaudited) (continued) CICC CSI Select 100 ETF (continued)
Investments Holdings Fair Value
RMB % of
Net Assets Financial assets at fair value through profit or
loss Listed Securities (continued) Common Stocks (continued) China (continued) Information Technology (continued) Shenzhen Topband Co Ltd 16,000 129,760 0.27%
Total Information Technology 1,051,796 2.15%
Materials CSG Holding Co Ltd 25,500 188,190 0.38% DeHua TB New Decoration Materials Co Ltd 9,000 80,730 0.17% Fangda Special Steel Technology Co Ltd 19,700 136,718 0.28% Guangdong Tapai Group Co Ltd 13,000 165,620 0.34% Hongda Xingye Co Ltd 28,400 85,200 0.17% Inner Mongolia Junzheng Energy & Chemical
Industry Group Co Ltd 61,700 305,415 0.62% ORG Technology Co Ltd 30,500 150,670 0.31% Shenzhen Jinjia Group Co Ltd 16,000 147,680 0.30% Xinyangfeng Agricultural Technology Co Ltd 11,900 190,400 0.39% Yintai Gold Co Ltd 30,400 261,744 0.54% Zibo Qixiang Tengda Chemical Co Ltd 12,900 107,844 0.22% Zijin Mining Group Co Ltd 247,300 2,297,417 4.69%
Total Materials 4,117,628 8.41%
Real Estate China Merchants Shekou Industrial Zone
Holdings Co Ltd 61,800 821,322 1.68% China Vanke Co Ltd 85,100 2,442,370 4.99% Financial Street Holdings Co Ltd 21,800 140,610 0.29% Gemdale Corp 45,300 611,550 1.25% Greenland Holdings Corp Ltd 66,700 388,861 0.79% Shanghai Lujiazui Finance & Trade Zone
Development Co Ltd 16,000 171,200 0.35% Shanghai Shimao Co Ltd 20,500 94,505 0.19%
Total Real Estate 4,670,418 9.54%
Utilities China National Nuclear Power Co Ltd 113,800 559,896 1.14%

CICC Fund Series Annual Report
Year ended 31 December 2020
66
Portfolio statement as at 31 December 2020 (Unaudited) (continued) CICC CSI Select 100 ETF (continued)
Investments Holdings Fair Value
RMB % of
Net Assets Financial assets at fair value through profit or
loss Listed Securities (continued) Common Stocks (continued) China (continued) Utilities (continued) China Yangtze Power Co Ltd 120,700 2,312,612 4.73% Hubei Energy Group Co Ltd 70,300 272,764 0.56% Shenergy Co Ltd 71,000 370,620 0.76% Shenzhen Gas Corp Ltd 10,500 76,020 0.15%
Total Utilities 3,591,912 7.34%
Total China 48,906,872 99.93%
Total Common Stocks 48,906,872 99.93%
Total Listed Securities 48,906,872 99.93%
Total investments, at fair value 48,906,872 99.93%
Other assets 32,058 0.07%
Net assets attributable to unitholders 48,938,930 100.00%
Total investments, at cost 46,684,121

CICC Fund Series Annual Report
Year ended 31 December 2020
67
Portfolio statement as at 31 December 2020 (Unaudited) (continued) CICC Bloomberg Barclays China Treasury 1-10 Years ETF
Investments Holdings Fair Value
RMB % of
Net Assets Financial assets at fair value through profit or
loss Listed Bonds Government Bonds China China Government Bond Series 1714
3.47% due 13/07/2022 10,000,000 10,124,300 12.37% China Government Bond Series 1718
3.59% due 03/08/2027 10,000,000 10,312,900 12.60% China Government Bond Series 1807
3.42% due 12/04/2021 10,000,000 10,028,800 12.25% China Government Bond Series 1820
3.60% due 06/09/2025 10,000,000 10,299,300 12.58% China Government Bond Series 1821
3.17% due 11/10/2021 10,000,000 10,047,500 12.27% China Government Bond Series 1823
3.29% due 18/10/2023 10,000,000 10,123,900 12.37% China Government Bond Series 1915
3.13% due 21/11/2029 10,000,000 9,940,900 12.14% China Government Bond Series INBK
2.68% due 21/05/2030 10,000,000 9,598,200 11.72%
Total China 80,475,800 98.30%
Total Government Bonds 80,475,800 98.30%
Total Listed Bonds 80,475,800 98.30%
Total investments, at fair value 80,475,800 98.30%
Other assets 1,392,044 1.70%
Net assets attributable to unitholders 81,867,844 100.00%
Total investments, at cost 80,558,790

CICC Fund Series Annual Report
Year ended 31 December 2020
68
Portfolio statement as at 31 December 2020 (Unaudited) (continued) ICBC CICC USD Money Market ETF
Investments Holdings Fair Value
USD % of
Net Assets Financial assets at fair value through profit or
loss Other Transferable Securities Short Term Fixed Rate Notes Bermuda Haitong International Securities Group Ltd
1.10% due 09/02/2021 30,000,000 30,000,000 5.53%
Total Bermuda 30,000,000 5.53%
Hong Kong CICC Financial Trading Ltd
0.82% due 24/02/2021 10,000,000 10,000,000 1.84% CICC Financial Trading Ltd
0.92% due 22/02/2021 10,000,000 10,000,000 1.84% CICC Financial Trading Ltd
0.92% due 29/03/2021 10,000,000 10,000,000 1.84% CICC Financial Trading Ltd
1.02% due 17/03/2021 10,000,000 10,000,000 1.84% Guotai Junan Financial Products Ltd
1.05% due 19/01/2021 20,000,000 20,000,000 3.69% Guotai Junan Financial Products Ltd
1.05% due 28/01/2021 10,000,000 10,000,000 1.85% Guotai Junan International Holdings Ltd
1.10% due 27/01/2021 20,000,000 20,000,000 3.69% Guotai Junan International Holdings Ltd
1.10% due 09/04/2021 20,000,000 20,000,000 3.69% Guotai Junan Financial Products Ltd
1.25% due 10/02/2021 10,000,000 10,000,000 1.85%
Total Hong Kong 120,000,000 22.13%
Virgin Islands CICC Financial Products Ltd
1.00% due 16/03/2021 4,000,000 4,000,000 0.74% CICC Financial Products Ltd
1.05% due 20/05/2021 5,000,000 5,000,000 0.92% CICC Financial Products Ltd
1.05% due 20/05/2021 7,000,000 7,000,000 1.29% CICC Financial Products Ltd
1.67% due 29/01/2021 15,000,000 15,000,000 2.77%

CICC Fund Series Annual Report
Year ended 31 December 2020
69
Portfolio statement as at 31 December 2020 (Unaudited) (continued) ICBC CICC USD Money Market ETF (continued)
Investments Holdings Fair Value
USD % of
Net Assets Financial assets at fair value through
profit or loss Short Term (continued) Fixed Rate Notes (continued) Virgin Islands (continued) CICC Financial Products Ltd
1.70% due 25/01/2021 10,000,000 10,000,000 1.85% CMB International Global Products Limited
0.83% due 04/03/2021 3,000,000 3,000,000 0.55% CSI Financial Products Ltd
1.30% due 13/01/2021 10,000,000 10,000,000 1.85% Huatai International Financial Products
Limited 0.90% due 16/06/2021 10,000,000 10,000,000 1.84% Huatai International Financial Products
Limited 1.10% due 25/03/2021 10,000,000 10,000,000 1.84% Huatai International Financial Products
Limited 1.40% due 15/12/2021 10,000,000 10,000,000 1.84%
Total Virgin Islands 84,000,000 15.49%
Total Fixed Rate Notes 234,000,000 43.15%
Total Short Term 234,000,000 43.15%
Total Other Transferable Securities 234,000,000 43.15%
Total investments, at fair value 234,000,000 43.15% Other assets 308,231,715 56.85%
Net assets attributable to unitholders 542,231,715 100.00%
Total investments, at cost 234,000,000
As at 31 December 2020 48.20 days Weighted average maturity 48.20 days Weighted average life
Fair Value
USD % of
Net Assets Daily liquid assets 118,551,869 21.86% Weekly liquid assets 128,613,129 23.72%

CICC Fund Series Annual Report
Year ended 31 December 2020
70
Statements of movements in portfolio holdings for the year ended 31 December 2020 (Unaudited) CICC CSI Select 100 ETF
Investments
Beginning holding
balance as at 31
December 2019 Additions
Corporate Actions Disposals
Closing holding
balance as at 31
December 2020
Agricultural Bank of China
Ltd 883,600 39,900 - (923,500) - Anhui Zhongding Sealing
Parts Co Ltd - 13,300 - - 13,300 Avic Capital Co Ltd - 98,400 - - 98,400 Bank of China Ltd 496,800 26,500 - (523,300) - Bank of Communications
Co Ltd 633,700 27,000 - (660,700) - Beijing Capital
Development Co Ltd - 8,800 - (18,800) - Beijing Dabeinong
Technology Group Co Ltd - 53,700 - - 53,700
Beijing New Building Materials PLC - 18,000 - - 18,000
Beijing Urban Construction Investment & Development Co Ltd 24,720 - - (24,720) -
By-health Co Ltd - 11,500 - (11,500) - Camel Group Co Ltd - 28,000 - (15,900) 12,100 Chacha Food Co Ltd 5,900 800 - (6,700) - Changchun Faway
Automobile Components Co Ltd - 9,600 - - 9,600
Chaozhou Three-Circle Group Co Ltd - 23,200 - (3,500) 19,700
China Construction Bank Corp 158,302 - - (158,302) -
China Fortune Land Development Co Ltd 27,800 900 5,280 (33,980) -
China Gezhouba Group Co Ltd 65,100 50,500 - 65,100) 50,500
China Life Insurance Co Ltd 39,200 - - (39,200) -
China Meheco Co Ltd - 9,700 - - 9,700 China Merchants Bank
Co Ltd 97,800 4,000 - (101,800) - China Merchants
Securities Co Ltd - 67,900 - (2,000) 65,900

CICC Fund Series Annual Report
Year ended 31 December 2020
71
Statements of movements in portfolio holdings for the year ended 31 December 2020 (Unaudited) (continued) CICC CSI Select 100 ETF (continued)
Investments
Beginning holding
balance as at 31
December 2019 Additions
Corporate Actions Disposals
Closing holding
balance as at 31
December 2020
China Merchants Shekou
Industrial Zone Holdings Co Ltd - 61,800 - - 61,800
China National Chemical Engineering Co Ltd 46,500 45,100 - (46,500) 45,100
China National Nuclear Power Co Ltd - 113,800 - - 113,800
China Railway Construction Corp Ltd 108,400 - - (108,400) -
China Railway Group Ltd 192,000 182,900 - (192,000) 182,900 China Railway Tielong
Container Logistics Co Ltd - 13,300 - (13,300) -
China Resources Sanjiu Medical & Pharmaceutical Co Ltd - 10,000 - - 10,000
China Shenhua Energy Co Ltd 77,700 14,700 - (32,100) 60,300
China South Publishing & Media Group Co Ltd 16,900 10,000 - (13,800) 13,100
China Southern Airlines Co Ltd 81,000 - - (81,000) -
China State Construction Engineering Corp Ltd 494,700 99,900 - (217,500) 377,100
China Vanke Co Ltd 124,500 14,700 - (54,100) 85,100 China Yangtze Power Co
Ltd - 129,800 - (9,100) 120,700 Chongqing Department
Store Co Ltd 6,500 - - (6,500) - Chongqing Zongshen
Power Machinery Co Ltd - 12,500 - - 12,500 Chow Tai Seng Jewellery
Co Ltd - 5,200 - - 5,200 CITIC Securities Co Ltd 163,400 8,800 - (172,200) - CNHTC Jinan Truck Co Ltd - 4,900 - - 4,900 CSG Holding Co Ltd 33,000 6,200 - (13,700) 25,500 Daqin Railway Co Ltd 140,100 - - (140,100) - Dashang Co Ltd 3,900 - - (3,900) - DeHua TB New Decoration
Materials Co Ltd - 9,000 - - 9,000

CICC Fund Series Annual Report
Year ended 31 December 2020
72
Statements of movements in portfolio holdings for the year ended 31 December 2020 (Unaudited) (continued) CICC CSI Select 100 ETF (continued)
Investments
Beginning holding
balance as at 31
December 2019 Additions
Corporate Actions Disposals
Closing holding
balance as at 31
December 2020
Fangda Special Steel
Technology Co Ltd - 19,700 - - 19,700 FAWER Automotive Parts
Co Ltd - 12,800 - - 12,800 Financial Street Holdings
Co Ltd 28,100 21,800 - (28,100) 21,800 Focus Media Information
Technology Co Ltd - 185,100 - - 185,100 Fujian Longking Co Ltd - 15,600 - - 15,600 Fujian Longma
Environmental Sanitation Equipment Co Ltd 7,900 3,000 - (3,300) 7,600
Fuyao Glass Industry Group Co Ltd - 20,500 - (20,500) -
G-bits Network Technology Xiamen Co Ltd 1,000 100 - (1,100) -
Gemdale Corp - 45,300 - - 45,300 GF Securities Co Ltd 69,700 54,100 - (69,700) 54,100 Great Wall Motor Co Ltd 28,400 - - (28,400) - Greenland Holdings Corp
Ltd - 66,700 - - 66,700 Guangdong Ellington
Electronics Technology Co Ltd - 5,800 - (5,800) -
Guangdong Tapai Group Co Ltd - 13,000 - - 13,000
Guangdong Xinbao Electrical Appliances Holdings Co Ltd 8,600 2,400 - (5,200) 5,800
Guangxi Guiguan Electric Power Co Ltd 55,700 - - (55,700) -
Guangxi Liuzhou Pharmaceutical Co Ltd 4,800 - 1,000 (5,800) -
Guangzhou Automobile Group Co Ltd - 16,900 - - 16,900
Guangzhou Baiyunshan Pharmaceutical Holdings Co Ltd - 12,700 - - 12,700
Guotai Junan Securities Co Ltd - 82,400 - - 82,400
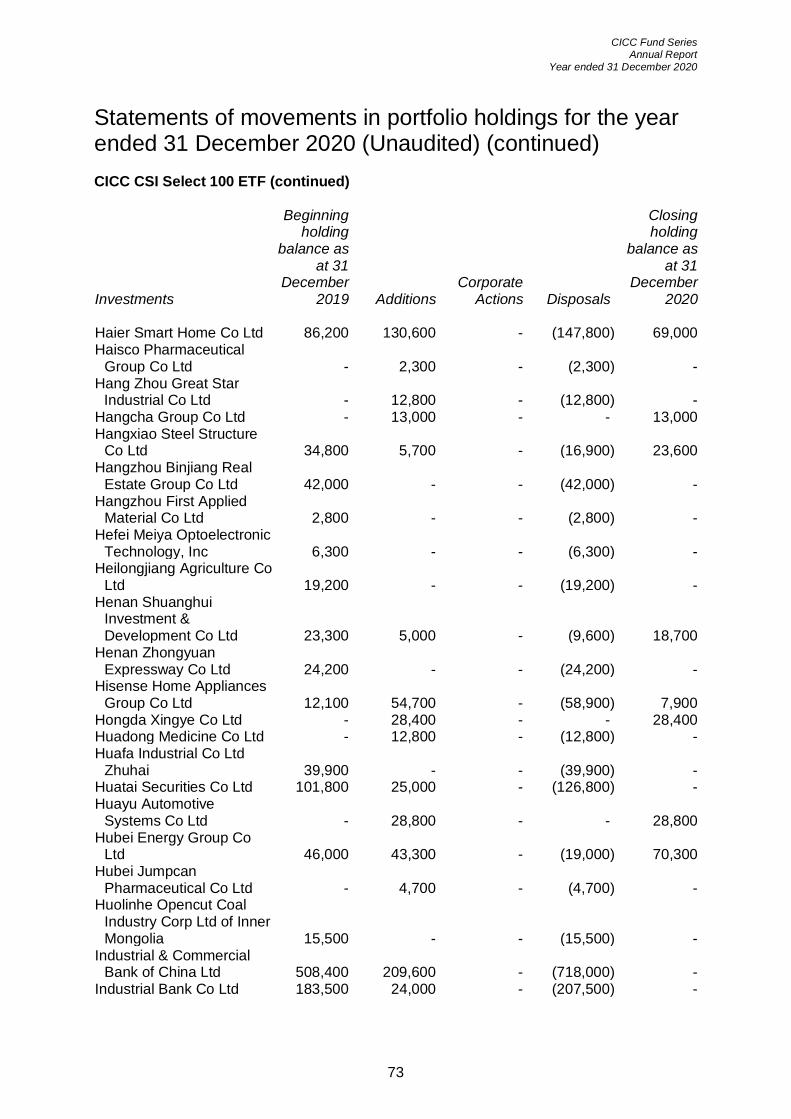
CICC Fund Series Annual Report
Year ended 31 December 2020
73
Statements of movements in portfolio holdings for the year ended 31 December 2020 (Unaudited) (continued) CICC CSI Select 100 ETF (continued)
Investments
Beginning holding
balance as at 31
December 2019 Additions
Corporate Actions Disposals
Closing holding
balance as at 31
December 2020
Haier Smart Home Co Ltd 86,200 130,600 - (147,800) 69,000 Haisco Pharmaceutical
Group Co Ltd - 2,300 - (2,300) - Hang Zhou Great Star
Industrial Co Ltd - 12,800 - (12,800) - Hangcha Group Co Ltd - 13,000 - - 13,000 Hangxiao Steel Structure
Co Ltd 34,800 5,700 - (16,900) 23,600 Hangzhou Binjiang Real
Estate Group Co Ltd 42,000 - - (42,000) - Hangzhou First Applied
Material Co Ltd 2,800 - - (2,800) - Hefei Meiya Optoelectronic
Technology, Inc 6,300 - - (6,300) - Heilongjiang Agriculture Co
Ltd 19,200 - - (19,200) - Henan Shuanghui
Investment & Development Co Ltd 23,300 5,000 - (9,600) 18,700
Henan Zhongyuan Expressway Co Ltd 24,200 - - (24,200) -
Hisense Home Appliances Group Co Ltd 12,100 54,700 - (58,900) 7,900
Hongda Xingye Co Ltd - 28,400 - - 28,400 Huadong Medicine Co Ltd - 12,800 - (12,800) - Huafa Industrial Co Ltd
Zhuhai 39,900 - - (39,900) - Huatai Securities Co Ltd 101,800 25,000 - (126,800) - Huayu Automotive
Systems Co Ltd - 28,800 - - 28,800 Hubei Energy Group Co
Ltd 46,000 43,300 - (19,000) 70,300 Hubei Jumpcan
Pharmaceutical Co Ltd - 4,700 - (4,700) - Huolinhe Opencut Coal
Industry Corp Ltd of Inner Mongolia 15,500 - - (15,500) -
Industrial & Commercial Bank of China Ltd 508,400 209,600 - (718,000) -
Industrial Bank Co Ltd 183,500 24,000 - (207,500) -

CICC Fund Series Annual Report
Year ended 31 December 2020
74
Statements of movements in portfolio holdings for the year ended 31 December 2020 (Unaudited) (continued) CICC CSI Select 100 ETF (continued)
Investments
Beginning holding
balance as at 31
December 2019 Additions
Corporate Actions Disposals
Closing holding
balance as at 31
December 2020
Inner Mongolia Junzheng
Energy & Chemical Industry Group Co Ltd - 61,700 - - 61,700
Inner Mongolia Yili Industrial Group Co Ltd 123,500 60,000 - (123,500) 60,000
Jason Furniture Hangzhou Co Ltd 4,800 900 - (4,600) 1,100
Jiangsu Expressway Co Ltd 13,300 9,000 - (13,300) 9,000
Jiangsu Linyang Energy Co Ltd - 18,900 - - 18,900
Jiangsu Yanghe Brewery Joint-Stock Co Ltd - 9,100 - (9,100) -
Jiangsu Yangnong Chemical Co Ltd 4,300 - - (4,300) -
Jiangxi Wannianqing Cement Co Ltd - 7,000 - (7,000) -
Jinke Properties Group Co Ltd - 31,200 - (31,200) -
Jinyu Bio-Technology Co Ltd - 24,000 - - 24,000
Joyoung Co Ltd 7,200 500 - (7,700) - KingClean Electric Co Ltd 2,100 - (2,100) - Kingfa Sci & Tech Co Ltd 41,700 - - (41,700) - Lao Feng Xiang Co Ltd 3,400 600 - (1,700) 2,300 Liaoning Wellhope Agri-
Tech JSC Ltd - 4,000 - (4,000) - Lomon Billions Group Co
Ltd - 14,800 - (14,800) - Loncin Motor Co Ltd 27,700 - - (27,700) - Luzhou Laojiao Co Ltd - 11,000 - (11,000) - Markor International Home
Furnishings Co Ltd 33,400 - - (33,400) - Metallurgical Corp of
China Ltd - 104,500 - (104,500) - Midea Group Co Ltd 62,500 28,800 - (62,800) 28,500 MLS Co Ltd 10,300 12,900 - (10,300) 12,900 New Hope Liuhe Co Ltd 49,600 3,600 - (53,200) - Ningbo Sanxing Medical
Electric Co Ltd - 10,100 - (10,100) -

CICC Fund Series Annual Report
Year ended 31 December 2020
75
Statements of movements in portfolio holdings for the year ended 31 December 2020 (Unaudited) (continued) CICC CSI Select 100 ETF (continued)
Investments
Beginning holding
balance as at 31
December 2019 Additions
Corporate Actions Disposals
Closing holding
balance as at 31
December 2020
Ningbo Zhoushan Port Co
Ltd - 57,800 - - 57,800 Oceanwide Holdings Co
Ltd 42,100 - - (42,100) - ORG Technology Co Ltd - 30,500 - - 30,500 Ping An Insurance Group
Co of China Ltd 40,300 - - (40,300) - Poly Developments &
Holdings Group Co Ltd - 108,000 - (108,000) - RiseSun Real Estate
Development Co Ltd 40,900 - - (40,900) - SAIC Motor Corp Ltd - 64,000 - (1,200) 62,800 SDIC Power Holdings Co
Ltd - 49,600 - (49,600) - Seazen Holdings Co Ltd 21,200 700 - (21,900) - Shandong Buchang
Pharmaceuticals Co Ltd 13,410 - - (13,410) - Shandong Chenming
Paper Holdings Ltd - 19,500 - (19,500) - Shandong Hi-speed Co Ltd - 11,400 - - 11,400 Shandong Linglong Tyre
Co Ltd 11,300 1,000 - (12,300) - Shandong Sun Paper
Industry JSC Ltd - 22,700 - (22,700) - Shanghai Construction
Group Co Ltd 104,900 81,400 - (104,900) 81,400 Shanghai Flyco Electrical
Appliance Co Ltd - 700 - (700) - Shanghai Hanbell Precise
Machinery Co Ltd - 3,800 - - 3,800 Shanghai International Port
Group Co Ltd 76,400 3,600 - (80,000) - Shanghai Kehua Bio-
Engineering Co Ltd - 7,500 - - 7,500 Shanghai Lujiazui Finance
& Trade Zone Development Co Ltd 20,720 3,900 - (8,620) 16,000
Shanghai Mechanical & Electrical Industry Co Ltd - 5,800 - - 5,800

CICC Fund Series Annual Report
Year ended 31 December 2020
76
Statements of movements in portfolio holdings for the year ended 31 December 2020 (Unaudited) (continued) CICC CSI Select 100 ETF (continued)
Investments
Beginning holding
balance as at 31
December 2019 Additions
Corporate Actions Disposals
Closing holding
balance as at 31
December 2020
Shanghai Oriental Pearl
Group Co Ltd - 37,400 - - 37,400 Shanghai Pudong
Development Bank Co Ltd - 175,300 - (175,300) - Shanghai Pudong Road &
Bridge Construction Co Ltd 20,900 - - (20,900) - Shanghai Shimao Co Ltd - 26,300 - (5,800) 20,500 Shanghai Tongji Science &
Technology Industrial Co Ltd 13,500 - - (13,500) -
Shanghai Tunnel Engineering Co Ltd 44,400 34,400 - (44,400) 34,400
Shanghai Yuyuan Tourist Mart Group Co Ltd - 28,400 - - 28,400
Shanghai Zhangjiang High-Tech Park Development Co Ltd - 11,300 - (11,300) -
Shenergy Co Ltd 57,800 37,000 - (23,800) 71,000 Shengyi Technology Co Ltd 26,800 - - (26,800) - Shenzhen Gas Corp Ltd 15,500 10,500 - (15,500) 10,500 Shenzhen Jinjia Group Co
Ltd 20,700 16,000 - (20,700) 16,000 Shenzhen Overseas
Chinese Town Co Ltd - 60,000 - (60,000) - Shenzhen Tagen Group Co
Ltd - 19,100 - (19,100) - Shenzhen Topband Co Ltd - 16,000 - - 16,000 Sichuan Road & Bridge Co
Ltd - 40,600 - (6,100) 34,500 Sieyuan Electric Co Ltd 14,300 - - (14,300) - Skyworth Digital Co Ltd 11,600 - - (11,600) - TangShan Port Group Co
Ltd 69,800 13,100 - (28,800) 54,100 TBEA Co Ltd 87,500 2,900 - (90,400) - TCL Corp - 252,300 - - 252,300 Tecon Biology Co Ltd - 18,300 - (4,700) 13,600 Tibet Summit Resources Co
Ltd - 4,000 - (4,000) -

CICC Fund Series Annual Report
Year ended 31 December 2020
77
Statements of movements in portfolio holdings for the year ended 31 December 2020 (Unaudited) (continued) CICC CSI Select 100 ETF (continued)
Investments
Beginning holding
balance as at 31
December 2019 Additions
Corporate Actions Disposals
Closing holding
balance as at 31
December 2020
Titan Wind Energy Suzhou
Co Ltd 24,000 - - (24,000) - Toly Bread Co Ltd - 2,800 - (2,800) - Tongling Jingda Special
Magnet Wire Co Ltd - 19,600 - (19,600) - Wasu Media Holding Co
Ltd - 10,400 - - 10,400 Weichai Power Co Ltd - 87,600 - - 87,600 Weifu High-Technology
Group Co Ltd - 10,700 - (2,100) 8,600 Wens Foodstuffs Group Co
Ltd 87,600 4,800 10,880 (103,280) - Wuchan Zhongda Group
Co Ltd 46,500 46,200 - (46,500) 46,200 Xiamen C & D, Inc - 31,100 - - 31,100 Xiamen Comfort Science &
Technology Group Co Ltd - 6,700 - - 6,700 Xiamen Intretech, Inc - 2,500 - - 2,500 Xiamen Kingdomway
Group Co - 4,500 - - 4,500 Xinjiang Goldwind Science
& Technology Co Ltd - 65,200 - (7,000) 58,200 Xinyangfeng Agricultural
Technology Co Ltd - 11,900 - - 11,900 Yifan Pharmaceutical Co
Ltd 17,000 1,400 - (18,400) - Yintai Gold Co Ltd - 23,600 6,800 - 30,400 Yixintang Pharmaceutical
Group Co Ltd - 4,100 - (4,100) - Yonghui Superstores Co
Ltd - 56,000 - (56,000) - Youngor Group Co Ltd 40,900 10,400 - (51,300) - Yunnan Baiyao Group Co
Ltd - 10,100 - (700) 9,400 Zhejiang China
Commodities City Group Co Ltd 64,100 - - (64,100) -
Zhejiang Hangmin Co Ltd 14,445 - - (14,445) -

CICC Fund Series Annual Report
Year ended 31 December 2020
78
Statements of movements in portfolio holdings for the year ended 31 December 2020 (Unaudited) (continued) CICC CSI Select 100 ETF (continued)
Investments
Beginning holding
balance as at 31
December 2019 Additions
Corporate Actions Disposals
Closing holding
balance as at 31
December 2020
Zhejiang Jingxin
Pharmaceutical Co Ltd 15,600 - - (15,600) - Zhejiang Meida Industrial
Co Ltd 6,900 - - (6,900) - Zhejiang NHU Co Ltd - 18,800 - (18,800) - Zhejiang Runtu Co Ltd - 10,100 - (10,100) - Zhejiang Wanliyang Co Ltd - 12,200 - - 12,200 Zhejiang Weixing New
Building Materials Co Ltd - 11,500 - - 11,500 Zhejiang Yankon Group Co
Ltd 23,500 15,900 - (23,500) 15,900 Zhejiang Yongtai
Technology Co Ltd 16,600 - - (16,600) - Zhengzhou Yutong Bus Co
Ltd 31,300 - - (31,300) - Zhongtian Financial Group
Co Ltd 99,000 - - (99,000) - Zhuzhou Kibing Group Co
Ltd 43,500 7,100 - (21,200) 29,400 Zibo Qixiang Tengda
Chemical Co Ltd - 12,900 - - 12,900 Zijin Mining Group Co Ltd 327,000 61,000 - (140,700) 247,300

CICC Fund Series Annual Report
Year ended 31 December 2020
79
Statements of movements in portfolio holdings for the year ended 31 December 2020 (Unaudited) (continued) CICC Bloomberg Barclays China Treasury 1-10 Years ETF
Investments
Beginning holding
balance as at 31
December 2019 Additions
Corporate Actions Disposals
Closing holding
balance as at 31
December 2020
China Government Bond
Series 1714 10,000,000 - - - 10,000,000 China Government Bond
Series 1718 10,000,000 - - - 10,000,000 China Government Bond
Series 1807 10,000,000 - - - 10,000,000 China Government Bond
Series 1820 10,000,000 - - - 10,000,000 China Government Bond
Series 1821 10,000,000 - - - 10,000,000 China Government Bond
Series 1822 10,000,000 - - (10,000,000) - China Government Bond
Series 1823 10,000,000 - - - 10,000,000 China Government Bond
Series 1915 - 10,000,000 - - 10,000,000 China Government Bond
Series INBK - 10,000,000 - - 10,000,000

CICC Fund Series Annual Report
Year ended 31 December 2020
80
Statements of movements in portfolio holdings for the year ended 31 December 2020 (Unaudited) (continued) ICBC CICC USD Money Market ETF
Investments
Beginning holding
balance as at 31
December 2019 Additions
Corporate Actions Disposals
Closing holding
balance as at 31
December 2020
Agricultural Bank of China
Ltd 0.00% due 24/6/2020 - 15,000,000 (15,000,000) - - Agricultural Bank of China
Ltd 0.00% due 20/07/2020 - 1,000,000 (1,000,000) - -
Agricultural Bank of China Ltd 0.00% due 23/07/2020 - 6,000,000 (6,000,000) - -
Bank of China Ltd 0.00% due 18/03/2020 2,000,000 - (2,000,000) - -
Bank of Communications Co Ltd 0.00% due 23/11/2020 - 25,000,000 (25,000,000) - -
Bank of Communications Co Ltd 2.31% due 24/02/2020 10,000,000 - (10,000,000) - -
Bank of Communications Co Ltd 2.32% due 20/07/2020 900,000 - (900,000) - -
China Construction Bank Corp 0.00% due 21/02/2020 5,000,000 - (5,000,000) - -
CICC Financial Products Ltd 1.00% due 16/03/2021 - 4,000,000 - - 4,000,000
CICC Financial Products Ltd 1.05% due 20/05/2021 - 5,000,000 - - 5,000,000
CICC Financial Products Ltd 1.05% due 20/05/2021 - 7,000,000 - - 7,000,000

CICC Fund Series Annual Report
Year ended 31 December 2020
81
Statements of movements in portfolio holdings for the year ended 31 December 2020 (Unaudited) (continued) ICBC CICC USD Money Market ETF (continued)
Investments
Beginning holding
balance as at 31
December 2019 Additions
Corporate Actions Disposals
Closing holding
balance as at 31
December 2020
CSI Financial Products Ltd
1.30% due 13/01/2021 - 10,000,000 - - 10,000,000 CICC Financial Products Ltd
1.67% due 29/01/2021 - 15,000,000 - - 15,000,000 CICC Financial Products Ltd
1.70% due 25/01/2021 - 10,000,000 - - 10,000,000 CICC Financial Products Ltd
2.00% due 14/09/2020 - 4,000,000 (4,000,000) - - CICC Financial Products Ltd
2.50% due 24/04/2020 - 6,500,000 (6,500,000) - - CICC Financial Products Ltd
2.55% due 17/04/2020 - 4,500,000 (4,500,000) - - CICC Financial Products Ltd
2.70% due 9/01/2020 10,000,000 - (10,000,000) - - CICC Financial Products Ltd
2.80% due 19/11/2020 7,000,000 - (7,000,000) - - CICC Financial Trading Ltd
0.00% due 15/12/2020 - - - - - CICC Financial Trading Ltd
0.73% due 17/12/2020 - 10,000,000 (10,000,000) - - CICC Financial Trading Ltd
0.85% due 16/11/2020 - 10,000,000 (10,000,000) - - CICC Financial Trading Ltd
0.92% due 29/03/2021 - 10,000,000 - - 10,000,000 CICC Financial Trading Ltd
0.82% due 24/02/2021 - 10,000,000 - - 10,000,000
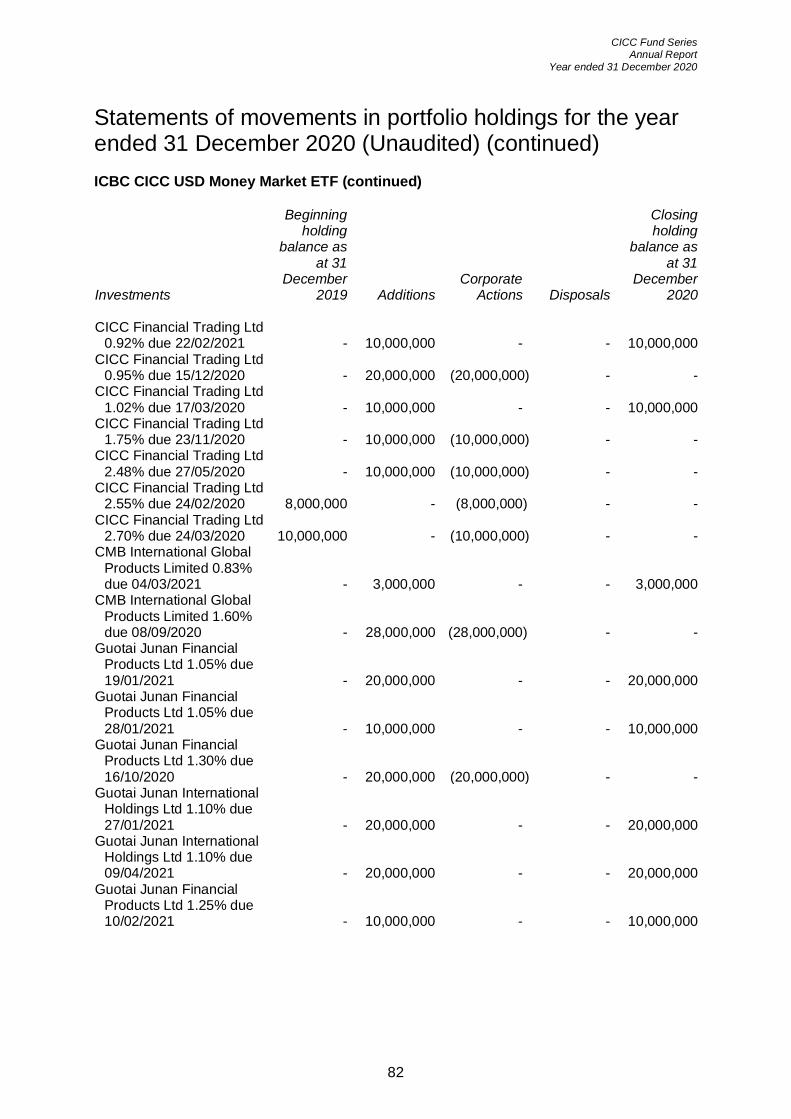
CICC Fund Series Annual Report
Year ended 31 December 2020
82
Statements of movements in portfolio holdings for the year ended 31 December 2020 (Unaudited) (continued) ICBC CICC USD Money Market ETF (continued)
Investments
Beginning holding
balance as at 31
December 2019 Additions
Corporate Actions Disposals
Closing holding
balance as at 31
December 2020
CICC Financial Trading Ltd
0.92% due 22/02/2021 - 10,000,000 - - 10,000,000 CICC Financial Trading Ltd
0.95% due 15/12/2020 - 20,000,000 (20,000,000) - - CICC Financial Trading Ltd
1.02% due 17/03/2020 - 10,000,000 - - 10,000,000 CICC Financial Trading Ltd
1.75% due 23/11/2020 - 10,000,000 (10,000,000) - - CICC Financial Trading Ltd
2.48% due 27/05/2020 - 10,000,000 (10,000,000) - - CICC Financial Trading Ltd
2.55% due 24/02/2020 8,000,000 - (8,000,000) - - CICC Financial Trading Ltd
2.70% due 24/03/2020 10,000,000 - (10,000,000) - - CMB International Global
Products Limited 0.83% due 04/03/2021 - 3,000,000 - - 3,000,000
CMB International Global Products Limited 1.60% due 08/09/2020 - 28,000,000 (28,000,000) - -
Guotai Junan Financial Products Ltd 1.05% due 19/01/2021 - 20,000,000 - - 20,000,000
Guotai Junan Financial Products Ltd 1.05% due 28/01/2021 - 10,000,000 - - 10,000,000
Guotai Junan Financial Products Ltd 1.30% due 16/10/2020 - 20,000,000 (20,000,000) - -
Guotai Junan International Holdings Ltd 1.10% due 27/01/2021 - 20,000,000 - - 20,000,000
Guotai Junan International Holdings Ltd 1.10% due 09/04/2021 - 20,000,000 - - 20,000,000
Guotai Junan Financial Products Ltd 1.25% due 10/02/2021 - 10,000,000 - - 10,000,000

CICC Fund Series Annual Report
Year ended 31 December 2020
83
Statements of movements in portfolio holdings for the year ended 31 December 2020 (Unaudited) (continued) ICBC CICC USD Money Market ETF (continued)
Investments
Beginning holding
balance as at 31
December 2019 Additions
Corporate Actions Disposals
Closing holding
balance as at 31
December 2020
Haitong International
Securities Group Ltd 1.10% due 09/02/2021 - 30,000,000 - - 30,000,000
Huatai International Financial Products Limited 0.90% due 16/06/2021 - 10,000,000 - - 10,000,000
Huatai International Financial Products Limited 1.10% due 25/03/2021 - 10,000,000 - - 10,000,000
Huatai International Financial Products Limited 1.40% due 15/12/2021 - 10,000,000 - - 10,000,000
Huatai International Financial Products Limited 1.55% due 24/09/2020 - 10,000,000 (10,000,000) - -
Huatai International Financial Products Limited 1.60% due 05/10/2020 - 20,000,000 (20,000,000) - -
Huatai International Financial Products Limited 1.80% due 15/12/2021 - 10,000,000 (10,000,000) - -
Industrial & Commercial Bank 0.00% due 26/06/2020 - 10,000,000 (10,000,000) - -
Shanghai Pudong Development Bank Co Ltd 2.35% due 24/02/2020 10,000,000 - (10,000,000) - -
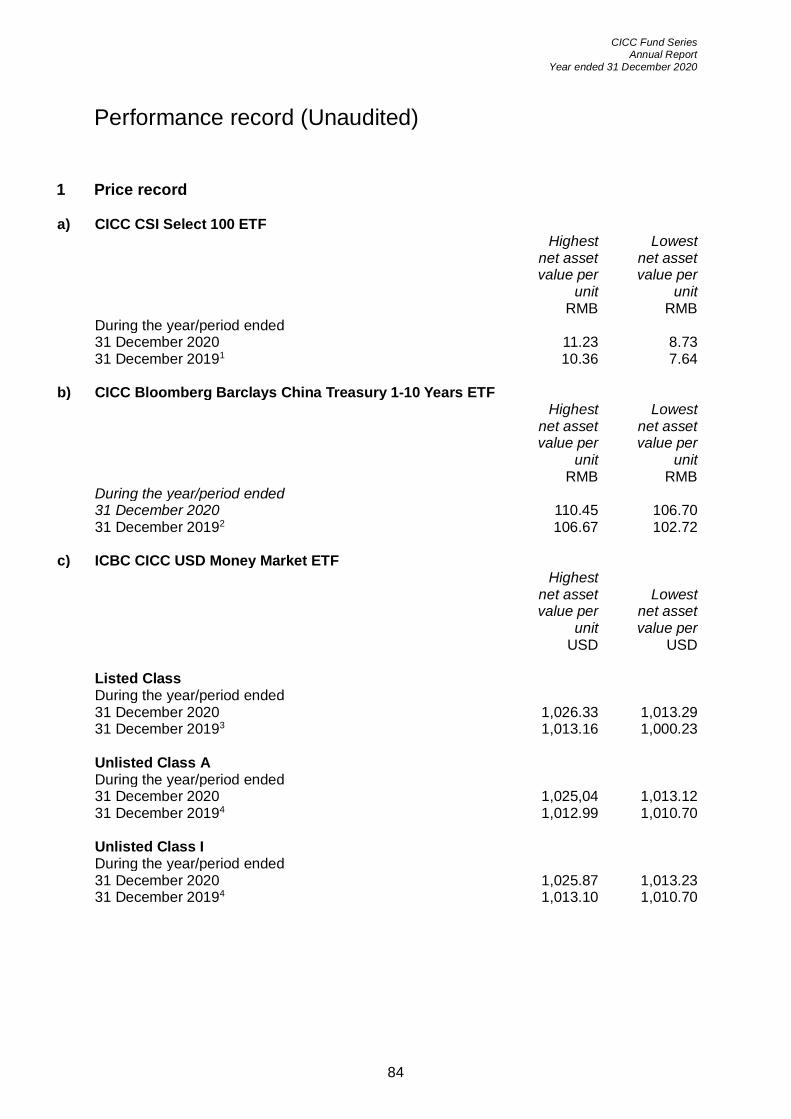
CICC Fund Series Annual Report
Year ended 31 December 2020
84
Performance record (Unaudited)
1 Price record
a) CICC CSI Select 100 ETF
Highest net asset value per
unit
Lowest net asset value per
unit RMB RMB During the year/period ended 31 December 2020 11.23 8.73 31 December 20191 10.36 7.64
b) CICC Bloomberg Barclays China Treasury 1-10 Years ETF
Highest net asset value per
unit
Lowest net asset value per
unit RMB RMB During the year/period ended 31 December 2020 110.45 106.70 31 December 20192 106.67 102.72
c) ICBC CICC USD Money Market ETF
Highest net asset value per
unit
Lowest net asset value per
USD USD Listed Class During the year/period ended 31 December 2020 1,026.33 1,013.29 31 December 20193 1,013.16 1,000.23 Unlisted Class A During the year/period ended 31 December 2020 1,025,04 1,013.12 31 December 20194 1,012.99 1,010.70
Unlisted Class I During the year/period ended 31 December 2020 1,025.87 1,013.23 31 December 20194 1,013.10 1,010.70

CICC Fund Series Annual Report
Year ended 31 December 2020
85
Performance record (Unaudited) (continued)
1 Price record (continued) 1 The financial period of CICC CSI Select 100 ETF extended from 30 November 2018 to 31
December 2019 2 The financial period of CICC Bloomberg Barclays China Treasury 1-10 Years ETF
extended from 7 December 2018 to 31 December 2019 3 The financial period of ICBC CICC USD Money Market ETF (Listed Class) extended from
14 June 2019 to 31 December 2019 4 The financial period of ICBC CICC USD Money Market ETF (Unlisted Class A and
Unlisted Class I) extended from 18 November 2019 to 31 December 2019
2 Total net asset value and net asset value per unit a) CICC CSI Select 100 ETF
Total net
asset value
Net asset value
per unit RMB RMB As at 31 December 2020 48,938,930 10.88 31 December 2019 76,306,857 10.17
b) CICC Bloomberg Barclays China Treasury 1-10 Years ETF
Total net
asset value
Net asset value
per unit USD USD As at 31 December 2020 81,867,844 109.16 31 December 2019 74,671,958 106.67

CICC Fund Series Annual Report
Year ended 31 December 2020
86
Performance record (Unaudited) (continued)
2 Total net asset value and net asset value per unit (continued)
c) ICBC CICC USD Money Market ETF
Total net
asset value
Net asset value
per unit USD USD Listed Class As at 31 December 2020 448,508,150 1,026.33 31 December 2019 186,421,252 1,013.16 Unlisted Class A As at 31 December 2020 17,020,316 1,025.04 31 December 2019 3,868,223 1,012.99 Unlisted Class I As at 31 December 2020 76,703,249 1,025.87 31 December 2019 51,019,042 1,013.10
3 Performance of the Sub-Fund and the underlying index For the year ended 31 December 2020 Performance CICC CSI Select 100 ETF 6.89% CSI CICC Select 100 Index 8.32% CICC Bloomberg Barclays China Treasury 1-10 Years ETF 2.33% Bloomberg Barclays China Treasury 1-10 Years Index 2.57% ICBC CICC USD Money Market ETF Listed Class 1.30% ICBC CICC USD Money Market ETF Unlisted Class A 1.19% ICBC CICC USD Money Market ETF Unlisted Class I 1.26% Investors should note that investments involve risks and not all investment risks are predictable. Prices of Sub-Funds’ units may go up as well as down and past performance information presented is not indicative of future performance. Investors should read the Prospectus of the Trust including the full text of the risk factors stated therein (such as the arrangement in the event that each Sub-Fund is delisted) in detail before making any investment decision.

CICC Fund Series Annual Report
Year ended 31 December 2020
87
Underlying index constituent stocks disclosure (Unaudited) Pursuant to the SFC Code, it allows the Sub-Fund to invest up to 30% of Sub-Fund's total net asset value in Government and other public securities of the same issue. As at 31 December 2020, CICC Bloomberg Barclays China Treasury 1-10 Years ETF invests in eight government and other public securities that individually accounted for more than 10% but less than 30% of the net asset value of the CICC Bloomberg Barclays China Treasury 1-10 Years ETF as at 31 December 2020. For the year ended 31 December 2020 CICC Bloomberg Barclays China Treasury 1-10 Years ETF % of Investments Net Assets Government Bonds China China Government Bond Series 1714
3.47% due 13/07/2022 12.37% China Government Bond Series 1718
3.59% due 03/08/2027 12.60% China Government Bond Series 1807
3.42% due 12/04/2021 12.25% China Government Bond Series 1820
3.60% due 06/09/2025 12.58% China Government Bond Series 1821
3.17% due 11/10/2021 12.27% China Government Bond Series 1823
3.29% due 18/10/2023 12.37% China Government Bond Series 1915
3.13% due 21/11/2029 12.14% China Government Bond Series INBK
2.68% due 21/05/2030 11.72% There were no constituent securities held by CICC CSI Select 100 ETF that individually accounted for more than 10% of the underlying index as at 31 December 2020.