Embed Size (px)
Citation preview

CIC Key Indicatorsfor Hollins University
Jamie Redwine
Office of Institutional Research
June 2005

Introduction
Using most recent IPEDS data available(usually 2002-3)
Compares national group of small & midsize private colleges and universities
16 key indicators: Enrollment Faculty Tuition & Fin Aid Resources & Expenditures

Sort criteria for each indicator (3)
Region – e.g. Southeast Financial resources = net tuition revenue
per student and long-term investments per undergrad student converted to %
FTE enrollment -- (750-1500)

Selected Indicators – Part A
StudentsChange in enrollmentChange in first-year enrollmentGraduation rate
FacultyStudent/faculty ratioPart-time faculty %

CHANGE IN ENROLLMENT FROM PREVIOUS YEAR (%): BY REGION
DEFINITION. The percentage change in total student enrollment from the previous year to the year indicated.
Fall 99 Fall 00 Fall 01 Fall 02 Fall 03
HOLLINS
U 3.4% -2.6% 4.4% 4.0% -5.5%

Change in enrollment from pevious year %
SOUTHEAST REGION (n=193). In addition to the median, which is the 50th percentile, this chart shows the 75th and 25thpercentiles for the region.
Fall 99 Fall 00 Fall 01 Fall 02 Fall 0375th Percentile 5.0% 7.2% 7.8% 6.5% 6.7%50th Percentile 1.8% 3.0% 3.2% 1.4% 1.9%25th Percentile -2.0% -0.8% -0.7% -1.8% -2.4%
National (743) 1.8% 3.4% 2.0% 2.2% 2.3%HOLLINS U 3.4% -2.6% 4.4% 4.0% -5.5%
-4%
-2%
0%
2%
4%
6%
8%
10%
Fall 99 Fall 00 Fall 01 Fall 02 Fall 03
75th Percentile
50th Percentile
25th Percentile
National (743)
HOLLINS U
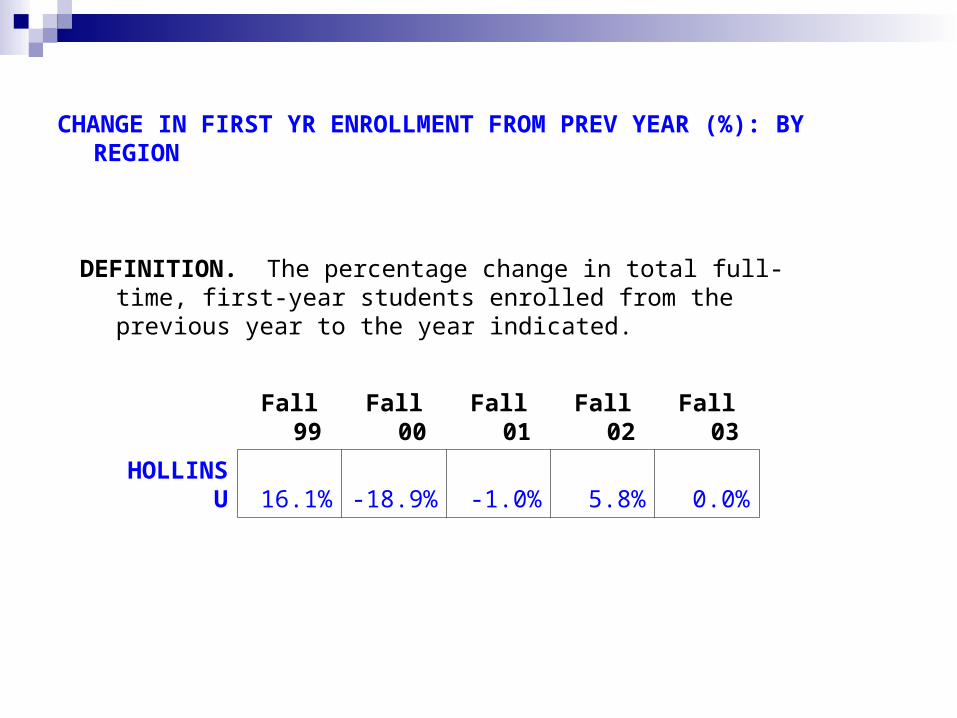
CHANGE IN FIRST YR ENROLLMENT FROM PREV YEAR (%): BY REGION
DEFINITION. The percentage change in total full-time, first-year students enrolled from the previous year to the year indicated.
Fall 99 Fall 00 Fall 01 Fall 02 Fall 03
HOLLINS U 16.1% -18.9% -1.0% 5.8% 0.0%

Change in First-Year EnrollmentSOUTHEAST REGION (n=190). In addition to the median, which is the 50th percentile, this chart shows the 75th and 25thpercentiles for the region.
Fall 99 Fall 00 Fall 01 Fall 02 Fall 0375th Percentile 14.9% 16.1% 10.6% 9.3% 10.9%50th Percentile 1.0% 0.6% 1.5% -0.8% -0.7%25th Percentile -9.3% -8.0% -8.2% -10.4% -9.0%
National (732) 1.2% 2.1% -0.4% 0.7% 1.9%HOLLINS U 16.1% -18.9% -1.0% 5.8%
-15%
-10%
-5%
0%
5%
10%
15%
20%
Fall 99 Fall 00 Fall 01 Fall 02 Fall 03
75th Percentile
50th Percentile
25th Percentile
National (732)
HOLLINS U

GRADUATION RATE (%): BY ENROLLMENT SIZE
DEFINITION. The six-year, cohort graduation rate for full-time, first-year undergraduate students. (All national and regional data are presented as medians.)
Fall 99 Fall 00 Fall 01 Fall 02 Fall 03
HOLLINS U 70.5% 65.9% 67.8% 65.0% 64.5%
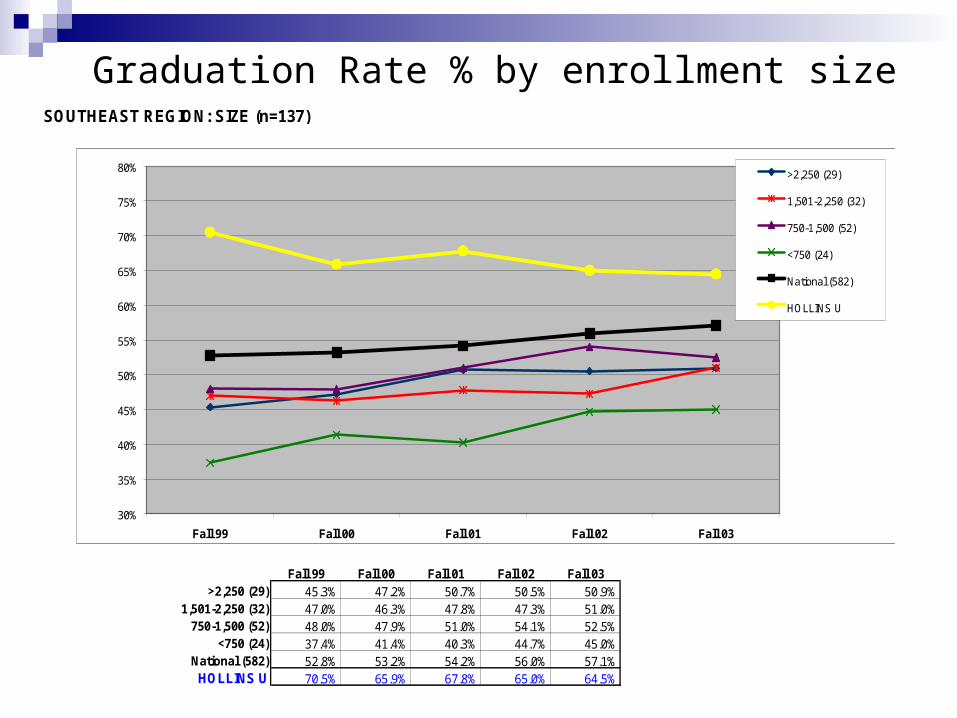
Graduation Rate % by enrollment sizeSOUTHEAST REGION: SIZE (n=137)
Fall 99 Fall 00 Fall 01 Fall 02 Fall 03>2,250 (29) 45.3% 47.2% 50.7% 50.5% 50.9%
1,501-2,250 (32) 47.0% 46.3% 47.8% 47.3% 51.0%750-1,500 (52) 48.0% 47.9% 51.0% 54.1% 52.5%
<750 (24) 37.4% 41.4% 40.3% 44.7% 45.0%National (582) 52.8% 53.2% 54.2% 56.0% 57.1%HOLLINS U 70.5% 65.9% 67.8% 65.0% 64.5%
30%
35%
40%
45%
50%
55%
60%
65%
70%
75%
80%
Fall 99 Fall 00 Fall 01 Fall 02 Fall 03
>2,250 (29)
1,501-2,250 (32)
750-1,500 (52)
<750 (24)
National (582)
HOLLINS U

STUDENT/FACULTY RATIO: BY ENROLLMENT SIZE
DEFINITION. Student FTE divided by faculty FTE. Because IPEDS does not separate "instructional" faculty from "research" and "public service" faculty, this ratio may be somewhat lower than expected for some institutions. Data on faculty are collected every other year. (All national and regional data are presented as medians.)
Fall 97 Fall 99 Fall 01 Fall 03Y1 to Y4
Chang
HU
10.8
10.5
10.3
9.7 -10%

Student/Faculty Ratio by enrollment sizeSOUTHEAST REGION: SIZE (n=189)
Fall 97 Fall 99 Fall 01 Fall 03 Y1 to Y4 Change
>2,250 (36) 16.1 15.7 16.4 16.9 5%1,501-2,250 (44) 16.3 15.1 15.4 16.0 -2%
750-1,500 (72) 13.5 14.0 13.7 13.2 -2%<750 (37) 14.2 13.2 13.0 13.8 -3%
National (722) 14.1 14.1 14.0 13.9 -1%HOLLINS U 10.8 10.5 10.3 9.7 -10%
10
12
14
16
18
20
Fall 97 Fall 99 Fall 01 Fall 03
>2,250 (36)
1,501-2,250 (44)
750-1,500 (72)
<750 (37)
National (722)
HOLLINS U

PART-TIME FACULTY (%): BY ENROLLMENT SIZE
DEFINITION. FTE of part-time faculty as a percentage of total faculty FTE. Data on faculty are collected every other year. (All national and regional data are presented as medians.)
Fall 97 Fall 99 Fall 01 Fall 03
HOLLINS U 12.2% 13.5% 14.1% 13.8%

Part-time Faculty % by enrollment sizeSOUTHEAST REGION: SIZE (n=111)
Fall 97 Fall 99 Fall 01 Fall 03>2,250 (28) 19.6% 18.5% 21.0% 17.5%
1,501-2,250 (24) 18.1% 17.9% 18.7% 17.4%750-1,500 (39) 17.2% 17.4% 16.9% 15.4%
<750 (20) 11.7% 13.4% 13.8% 13.7%National (483) 18.3% 19.0% 19.6% 19.5%HOLLINS U 12.2% 13.5% 14.1% 13.8%
0%
5%
10%
15%
20%
25%
30%
35%
Fall 97 Fall 99 Fall 01 Fall 03
>2,250 (28)
1,501-2,250 (24)
750-1,500 (39)
<750 (20)
National (483)
HOLLINS U

Part B - Financial
Tuition Revenue & Financial AidTuition Price Institutional AidTuition RevenueTuition Dependency
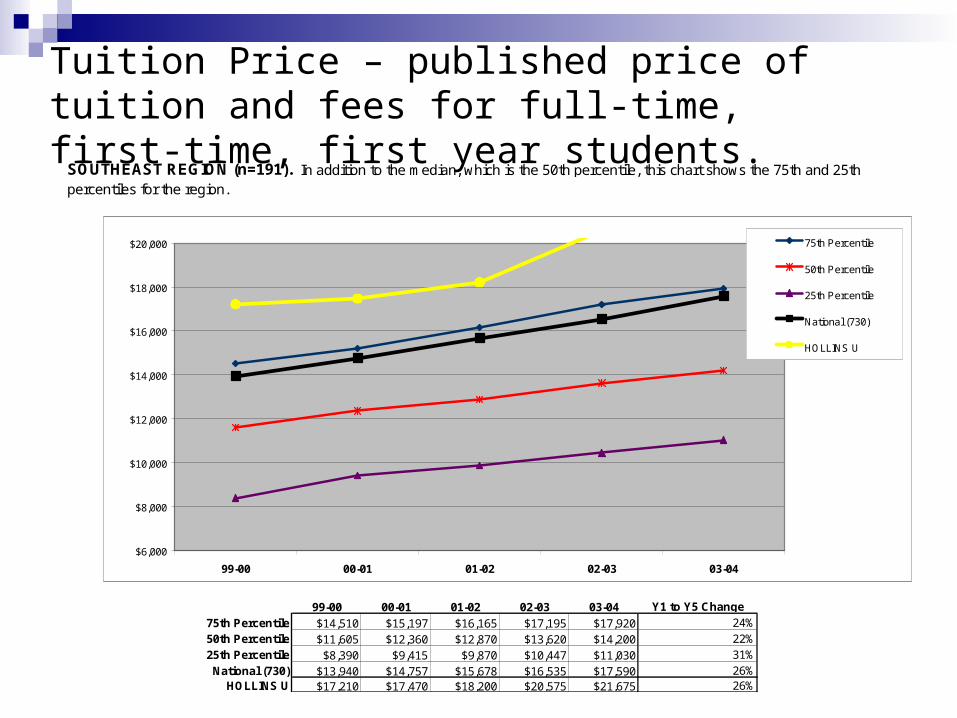
Tuition Price – published price of tuition and fees for full-time, first-time, first year students.
SOUTHEAST REGION (n=191). In addition to the median, which is the 50th percentile, this chart shows the 75th and 25thpercentiles for the region.
99-00 00-01 01-02 02-03 03-04 Y1 to Y5 Change
75th Percentile $14,510 $15,197 $16,165 $17,195 $17,920 24%50th Percentile $11,605 $12,360 $12,870 $13,620 $14,200 22%25th Percentile $8,390 $9,415 $9,870 $10,447 $11,030 31%
National (730) $13,940 $14,757 $15,678 $16,535 $17,590 26%HOLLINS U $17,210 $17,470 $18,200 $20,575 $21,675 26%
$6,000
$8,000
$10,000
$12,000
$14,000
$16,000
$18,000
$20,000
99-00 00-01 01-02 02-03 03-04
75th Percentile
50th Percentile
25th Percentile
National (730)
HOLLINS U

Total amount of institution student aid divided by total student FTE.
98-99 99-00 00-01 01-02 02-03 Y1 to Y5 Change
75th Percentile $4,704 $4,936 $5,034 $5,494 $6,034 28%50th Percentile $3,120 $3,139 $3,466 $3,625 $3,977 27%25th Percentile $1,835 $2,006 $2,087 $2,164 $2,396 31%
National (665) $3,625 $3,750 $4,014 $4,238 $4,583 26%HOLLINS U $6,093 $6,346 $6,933 $6,961 $7,279 19%
$1,000
$2,000
$3,000
$4,000
$5,000
$6,000
$7,000
$8,000
98-99 99-00 00-01 01-02 02-03
75th Percentile
50th Percentile
25th Percentile
National (665)
HOLLINS U
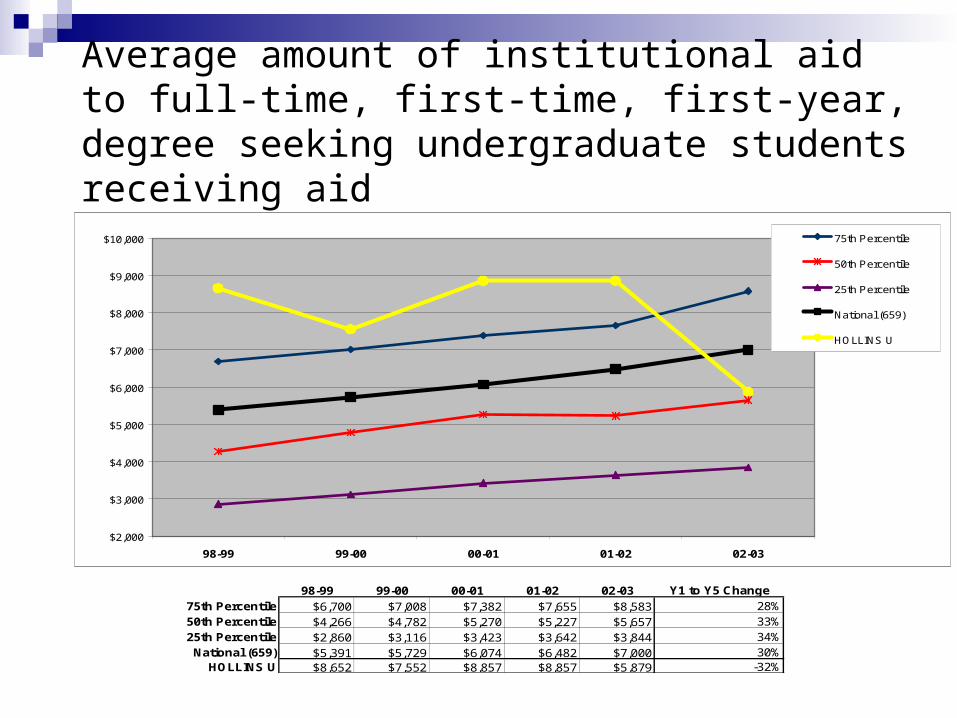
Average amount of institutional aid to full-time, first-time, first-year, degree seeking undergraduate students receiving aid
98-99 99-00 00-01 01-02 02-03 Y1 to Y5 Change75th Percentile $6,700 $7,008 $7,382 $7,655 $8,583 28%50th Percentile $4,266 $4,782 $5,270 $5,227 $5,657 33%25th Percentile $2,860 $3,116 $3,423 $3,642 $3,844 34%
National (659) $5,391 $5,729 $6,074 $6,482 $7,000 30%HOLLINS U $8,652 $7,552 $8,857 $8,857 $5,879 -32%
$2,000
$3,000
$4,000
$5,000
$6,000
$7,000
$8,000
$9,000
$10,000
98-99 99-00 00-01 01-02 02-03
75th Percentile
50th Percentile
25th Percentile
National (659)
HOLLINS U

Total tuition and fee revenue less institutional financial aid per student
98-99 99-00 00-01 01-02 02-03 Y1 to Y5 Change
75th Percentile $8,699 $9,018 $9,438 $9,623 $9,888 14%50th Percentile $6,713 $7,171 $7,515 $7,891 $8,294 24%25th Percentile $5,598 $5,868 $5,992 $6,472 $6,808 22%
National (718) $8,721 $9,263 $9,446 $9,871 $10,338 19%HOLLINS U $9,097 $9,298 $9,505 $9,471 $9,818 8%
$5,000
$6,000
$7,000
$8,000
$9,000
$10,000
$11,000
$12,000
$13,000
$14,000
98-99 99-00 00-01 01-02 02-03
75th Percentile
50th Percentile
25th Percentile
National (718)
HOLLINS U

Percentage change in total tuition revenue minus total institutional aid from the previous year
98-99 99-00 00-01 01-02 02-0375th Percentile 14.7% 11.8% 13.1% 16.0% 13.6%50th Percentile 7.5% 4.6% 7.6% 8.6% 7.4%25th Percentile -2.0% -3.4% 0.9% 3.2% 2.2%
National (718) 5.9% 5.9% 6.9% 7.5% 7.3%HOLLINS U -12.2% 5.6% -0.4% 4.0% 7.8%
-5%
0%
5%
10%
15%
20%
98-99 99-00 00-01 01-02 02-03
75th Percentile
50th Percentile
25th Percentile
National (718)
HOLLINS U

Percentage of educational and general expenditures covered by total net tuition revenue
98-99 99-00 00-01 01-02 02-0375th Percentile 56.2% 56.7% 56.8% 59.9% 60.2%50th Percentile 44.3% 43.4% 45.0% 45.9% 47.5%25th Percentile 34.8% 35.0% 37.1% 35.6% 36.6%
National (726) 54.6% 54.9% 54.3% 54.9% 56.1%HOLLINS U 34.6% 35.1% 33.4% 32.8% 32.6%
30%
35%
40%
45%
50%
55%
60%
65%
70%
98-99 99-00 00-01 01-02 02-03
75th Percentile
50th Percentile
25th Percentile
National (726)
HOLLINS U

Resources and Expenditures
Change in net assets Long-term investments Instructional cost Educational and General Expenditures

Percentage change in net assets during fiscal year (return on net assets ratio)
98-99 99-00 00-01 01-02 02-03>2,250 (203) 9.1% 8.8% 2.6% -0.2% 2.5%
1,501-2,250 (195) 8.6% 8.2% 1.1% -0.2% 1.6%750-1,500 (215) 7.7% 5.8% 0.5% -2.8% 1.0%
<750 (103) 6.2% 5.0% 0.8% 0.1% -0.5%National (716) 8.3% 7.6% 1.1% -0.8% 1.5%
HOLLINS U 1.2% -0.5% 3.0% -5.7% 1.8%
-10%
-5%
0%
5%
10%
15%
20%
98-99 99-00 00-01 01-02 02-03
>2,250 (203)
1,501-2,250 (195)
750-1,500 (215)
<750 (103)
National (716)
HOLLINS U

Long-term investments divided by undergraduate student FTE (endowment per student)
98-99 99-00 00-01 01-02 02-03 Y1 to Y5 Change
>2,250 (36) $16,499 $17,175 $16,713 $16,776 $14,926 -10%1,501-2,250 (42) $15,334 $16,817 $16,906 $15,360 $13,071 -15%
750-1,500 (68) $25,363 $26,366 $25,536 $21,967 $22,803 -10%<750 (32) $15,216 $15,617 $14,017 $13,491 $14,802 -3%
National (684) $19,231 $20,086 $18,591 $17,567 $17,378 -10%HOLLINS U $128,347 $117,183 $126,037 $112,865 $113,508 -12%
$0
$10,000
$20,000
$30,000
$40,000
$50,000
98-99 99-00 00-01 01-02 02-03
>2,250 (36)
1,501-2,250 (42)
750-1,500 (68)
<750 (32)
National (684)
HOLLINS U
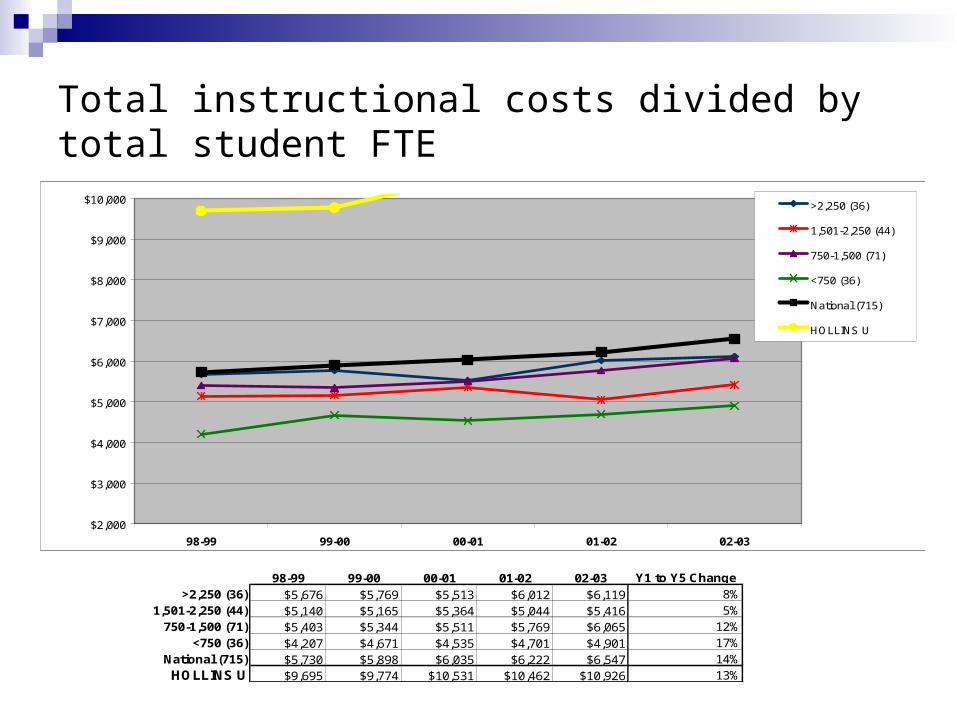
Total instructional costs divided by total student FTE
98-99 99-00 00-01 01-02 02-03 Y1 to Y5 Change
>2,250 (36) $5,676 $5,769 $5,513 $6,012 $6,119 8%1,501-2,250 (44) $5,140 $5,165 $5,364 $5,044 $5,416 5%
750-1,500 (71) $5,403 $5,344 $5,511 $5,769 $6,065 12%<750 (36) $4,207 $4,671 $4,535 $4,701 $4,901 17%
National (715) $5,730 $5,898 $6,035 $6,222 $6,547 14%HOLLINS U $9,695 $9,774 $10,531 $10,462 $10,926 13%
$2,000
$3,000
$4,000
$5,000
$6,000
$7,000
$8,000
$9,000
$10,000
98-99 99-00 00-01 01-02 02-03
>2,250 (36)
1,501-2,250 (44)
750-1,500 (71)
<750 (36)
National (715)
HOLLINS U

Total educational and general expenditures divided by total student FTE
98-99 99-00 00-01 01-02 02-03 Y1 to Y5 Change
>2,250 (36) $15,459 $15,777 $16,035 $16,624 $17,072 10%1,501-2,250 (44) $14,838 $16,603 $17,328 $17,462 $17,397 17%
750-1,500 (70) $17,238 $17,441 $18,393 $18,682 $19,599 14%<750 (36) $15,671 $15,787 $16,296 $16,959 $17,908 14%
National (719) $16,411 $17,096 $17,707 $18,234 $18,619 13%HOLLINS U $26,299 $26,488 $28,440 $28,853 $30,090 14%
$10,000
$12,000
$14,000
$16,000
$18,000
$20,000
$22,000
$24,000
$26,000
98-99 99-00 00-01 01-02 02-03
>2,250 (36)
1,501-2,250 (44)
750-1,500 (70)
<750 (36)
National (719)
HOLLINS U

Review of IndicatorsIndicators Covered
US News CIC 1 Enrollment y2 6-yr grad rate y3 freshman retention rate4 Classes < 205 Classes > 506 AVG fac salary7 Profs with highest degree8 Student/fac ratio y9 % Full-time faculty y
10 AVG SAT scores11 Freshman in top 10%12 Accept rate13 Educational Expenditures per student y14 Alumni giving rate15 Tuition Price16 Institutional aid per student17 AVG institutional aid per FY student18 Net tuition revenue per student (minus institutnl aid)19 Tuition Dependency (%) for edu and general expenditures20 Change in net assets21 Endowment per undergrad student22 Educational and general expenditures per student