Embed Size (px)
Citation preview
The accompanying notes are an integral part of these financial statements.
CIBC Canadian Index Fund
Annual Financial Statementsfor the financial year ended December 31, 2015
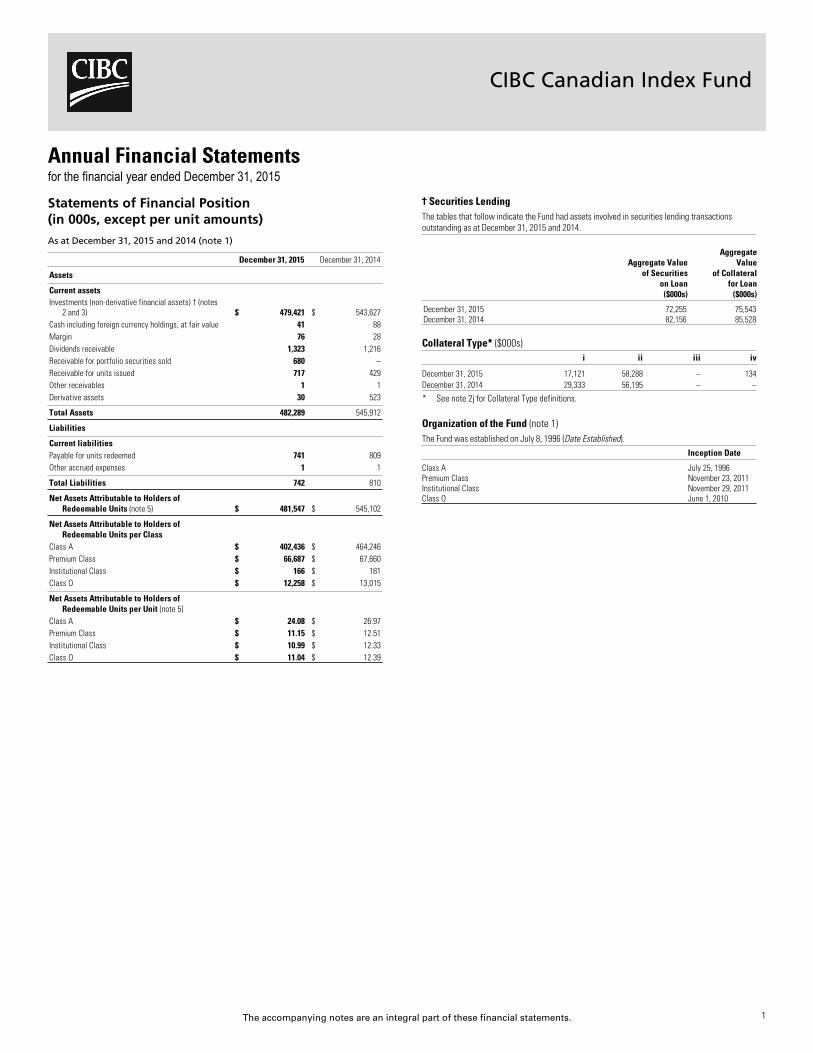
† Securities LendingThe tables that follow indicate the Fund had assets involved in securities lending transactionsoutstanding as at December 31, 2015 and 2014.
Aggregate Valueof Securities
on Loan($000s)
AggregateValue
of Collateralfor Loan
($000s)x
x
December 31, 2015 72,255 75,543x
December 31, 2014 82,156 85,528x
Collateral Type* ($000s)i ii iii iv
xx
December 31, 2015 17,121 58,288 – 134x
December 31, 2014 29,333 56,195 – –x
x
* See note 2j for Collateral Type definitions.
Organization of the Fund (note 1)The Fund was established on July 8, 1996 (Date Established).
Inception Datexx
Class A July 25, 1996x
Premium Class November 23, 2011x
Institutional Class November 29, 2011x
Class O June 1, 2010xx
Statements of Financial Position(in 000s, except per unit amounts)
As at December 31, 2015 and 2014 (note 1)
December 31, 2015 December 31, 2014x
x
Assetsxxx
Current assetsx
Investments (non-derivative financial assets) † (notes2 and 3) $ 479,421 $ 543,627
x
Cash including foreign currency holdings, at fair value 41 88x
Margin 76 28x
Dividends receivable 1,323 1,216x
Receivable for portfolio securities sold 680 –x
Receivable for units issued 717 429x
Other receivables 1 1x
Derivative assets 30 523xxx
Total Assets 482,289 545,912xxx
Liabilitiesxxx
Current liabilitiesx
Payable for units redeemed 741 809x
Other accrued expenses 1 1xxx
Total Liabilities 742 810xxx
Net Assets Attributable to Holders ofRedeemable Units (note 5) $ 481,547 $ 545,102
xxx
Net Assets Attributable to Holders ofRedeemable Units per Class
x
Class A $ 402,436 $ 464,246x
Premium Class $ 66,687 $ 67,660x
Institutional Class $ 166 $ 181x
Class O $ 12,258 $ 13,015xxx
Net Assets Attributable to Holders ofRedeemable Units per Unit (note 5)
x
Class A $ 24.08 $ 26.97x
Premium Class $ 11.15 $ 12.51x
Institutional Class $ 10.99 $ 12.33x
Class O $ 11.04 $ 12.39x
1
The accompanying notes are an integral part of these financial statements.
CIBC Canadian Index Fund
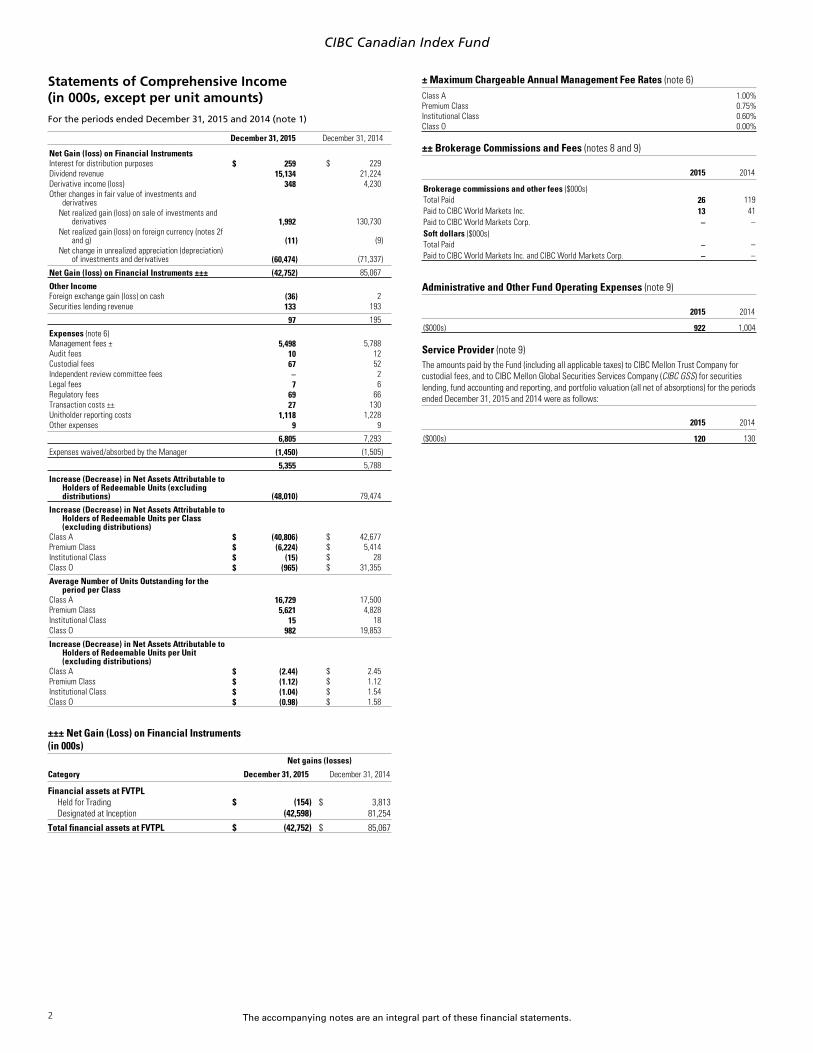
Statements of Comprehensive Income(in 000s, except per unit amounts)
For the periods ended December 31, 2015 and 2014 (note 1)
December 31, 2015 December 31, 2014x
x
Net Gain (loss) on Financial Instrumentsx
Interest for distribution purposes $ 259 $ 229x
Dividend revenue 15,134 21,224x
Derivative income (loss) 348 4,230x
Other changes in fair value of investments andderivatives
x
Net realized gain (loss) on sale of investments andderivatives 1,992 130,730
x
Net realized gain (loss) on foreign currency (notes 2fand g) (11) (9)
x
Net change in unrealized appreciation (depreciation)of investments and derivatives (60,474) (71,337)
xxx
Net Gain (loss) on Financial Instruments ±±± (42,752) 85,067xx
x
Other Incomex
Foreign exchange gain (loss) on cash (36) 2x
Securities lending revenue 133 193xxx
97 195xx
x
Expenses (note 6)x
Management fees ± 5,498 5,788x
Audit fees 10 12x
Custodial fees 67 52x
Independent review committee fees – 2x
Legal fees 7 6x
Regulatory fees 69 66x
Transaction costs ±± 27 130x
Unitholder reporting costs 1,118 1,228x
Other expenses 9 9xxx
6,805 7,293xx
x
Expenses waived/absorbed by the Manager (1,450) (1,505)xx
x
5,355 5,788xx
x
Increase (Decrease) in Net Assets Attributable toHolders of Redeemable Units (excludingdistributions) (48,010) 79,474
xx
x
Increase (Decrease) in Net Assets Attributable toHolders of Redeemable Units per Class(excluding distributions)
x
Class A $ (40,806) $ 42,677x
Premium Class $ (6,224) $ 5,414x
Institutional Class $ (15) $ 28x
Class O $ (965) $ 31,355xxx
Average Number of Units Outstanding for theperiod per Class
x
Class A 16,729 17,500x
Premium Class 5,621 4,828x
Institutional Class 15 18x
Class O 982 19,853xxx
Increase (Decrease) in Net Assets Attributable toHolders of Redeemable Units per Unit(excluding distributions)
x
Class A $ (2.44) $ 2.45x
Premium Class $ (1.12) $ 1.12x
Institutional Class $ (1.04) $ 1.54x
Class O $ (0.98) $ 1.58x
x
±±± Net Gain (Loss) on Financial Instruments(in 000s)
Net gains (losses)
Category December 31, 2015 December 31, 2014x..
Financial assets at FVTPL..
Held for Trading $ (154) $ 3,813..
Designated at Inception (42,598) 81,254......
Total financial assets at FVTPL $ (42,752) $ 85,067..
± Maximum Chargeable Annual Management Fee Rates (note 6)xx
Class A 1.00%x
Premium Class 0.75%x
Institutional Class 0.60%x
Class O 0.00%xx
±± Brokerage Commissions and Fees (notes 8 and 9)
2015 2014x
x
Brokerage commissions and other fees ($000s)x
Total Paid 26 119x
Paid to CIBC World Markets Inc. 13 41x
Paid to CIBC World Markets Corp. – –x
Soft dollars ($000s)x
Total Paid – –x
Paid to CIBC World Markets Inc. and CIBC World Markets Corp. – –xx
Administrative and Other Fund Operating Expenses (note 9)
2015 2014x
x
($000s) 922 1,004xx
Service Provider (note 9)The amounts paid by the Fund (including all applicable taxes) to CIBC Mellon Trust Company forcustodial fees, and to CIBC Mellon Global Securities Services Company (CIBC GSS) for securitieslending, fund accounting and reporting, and portfolio valuation (all net of absorptions) for the periodsended December 31, 2015 and 2014 were as follows:
2015 2014x
x
($000s) 120 130xx
2
The accompanying notes are an integral part of these financial statements.
CIBC Canadian Index Fundx
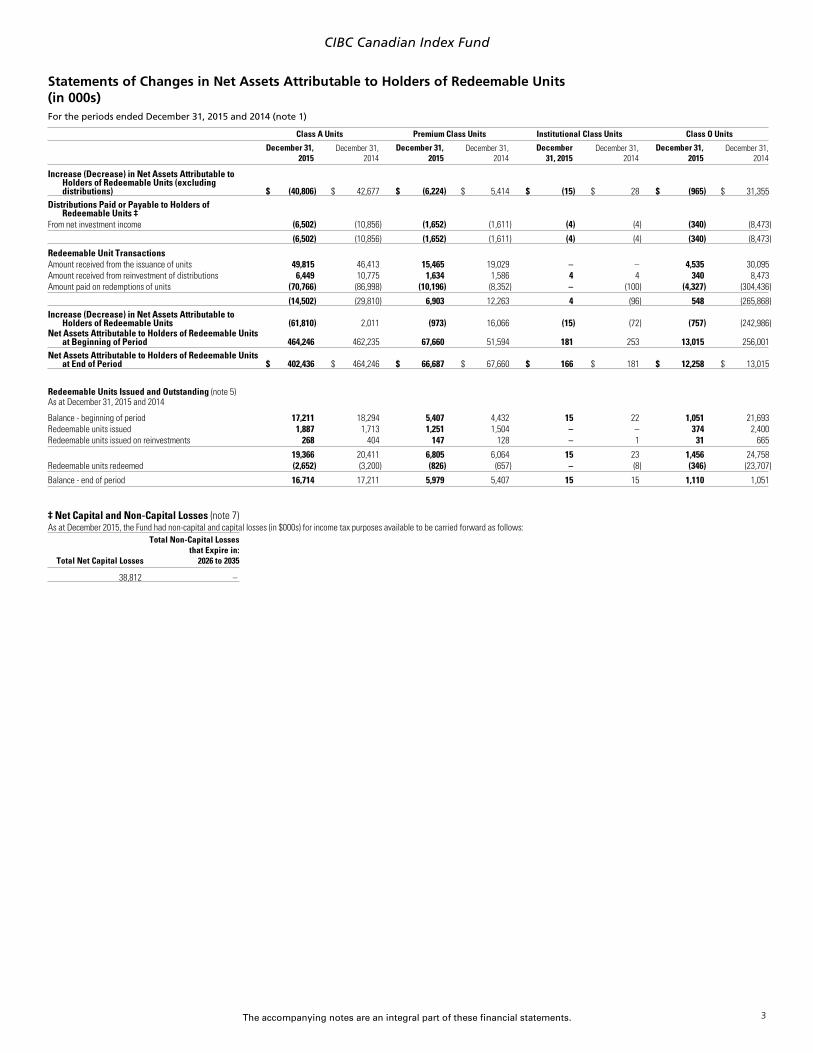
Statements of Changes in Net Assets Attributable to Holders of Redeemable Units(in 000s)For the periods ended December 31, 2015 and 2014 (note 1)
Class A Units Premium Class Units Institutional Class Units Class O Units
December 31,2015
December 31,2014
December 31,2015
December 31,2014
December31, 2015
December 31,2014
December 31,2015
December 31,2014
xx.
Increase (Decrease) in Net Assets Attributable toHolders of Redeemable Units (excludingdistributions) $ (40,806) $ 42,677 $ (6,224) $ 5,414 $ (15) $ 28 $ (965) $ 31,355
xxx.
Distributions Paid or Payable to Holders ofRedeemable Units ‡
x.
From net investment income (6,502) (10,856) (1,652) (1,611) (4) (4) (340) (8,473)x.xx
(6,502) (10,856) (1,652) (1,611) (4) (4) (340) (8,473)xxx.
Redeemable Unit Transactionsx.
Amount received from the issuance of units 49,815 46,413 15,465 19,029 – – 4,535 30,095x.
Amount received from reinvestment of distributions 6,449 10,775 1,634 1,586 4 4 340 8,473x.
Amount paid on redemptions of units (70,766) (86,998) (10,196) (8,352) – (100) (4,327) (304,436)x.xx
(14,502) (29,810) 6,903 12,263 4 (96) 548 (265,868)xxx.
Increase (Decrease) in Net Assets Attributable toHolders of Redeemable Units (61,810) 2,011 (973) 16,066 (15) (72) (757) (242,986)
x.
Net Assets Attributable to Holders of Redeemable Unitsat Beginning of Period 464,246 462,235 67,660 51,594 181 253 13,015 256,001
x.xx
Net Assets Attributable to Holders of Redeemable Unitsat End of Period $ 402,436 $ 464,246 $ 66,687 $ 67,660 $ 166 $ 181 $ 12,258 $ 13,015
xxx.
Redeemable Units Issued and Outstanding (note 5)x.
As at December 31, 2015 and 2014x.
Balance - beginning of period 17,211 18,294 5,407 4,432 15 22 1,051 21,693x.
Redeemable units issued 1,887 1,713 1,251 1,504 – – 374 2,400x.
Redeemable units issued on reinvestments 268 404 147 128 – 1 31 665x.xx
19,366 20,411 6,805 6,064 15 23 1,456 24,758x.
Redeemable units redeemed (2,652) (3,200) (826) (657) – (8) (346) (23,707)x.xx
Balance - end of period 16,714 17,211 5,979 5,407 15 15 1,110 1,051x
x
‡ Net Capital and Non-Capital Losses (note 7)As at December 2015, the Fund had non-capital and capital losses (in $000s) for income tax purposes available to be carried forward as follows:
Total Net Capital Losses
Total Non-Capital Lossesthat Expire in:
2026 to 2035x..
38,812 –.
.
3
The accompanying notes are an integral part of these financial statements.
CIBC Canadian Index Fundx
x
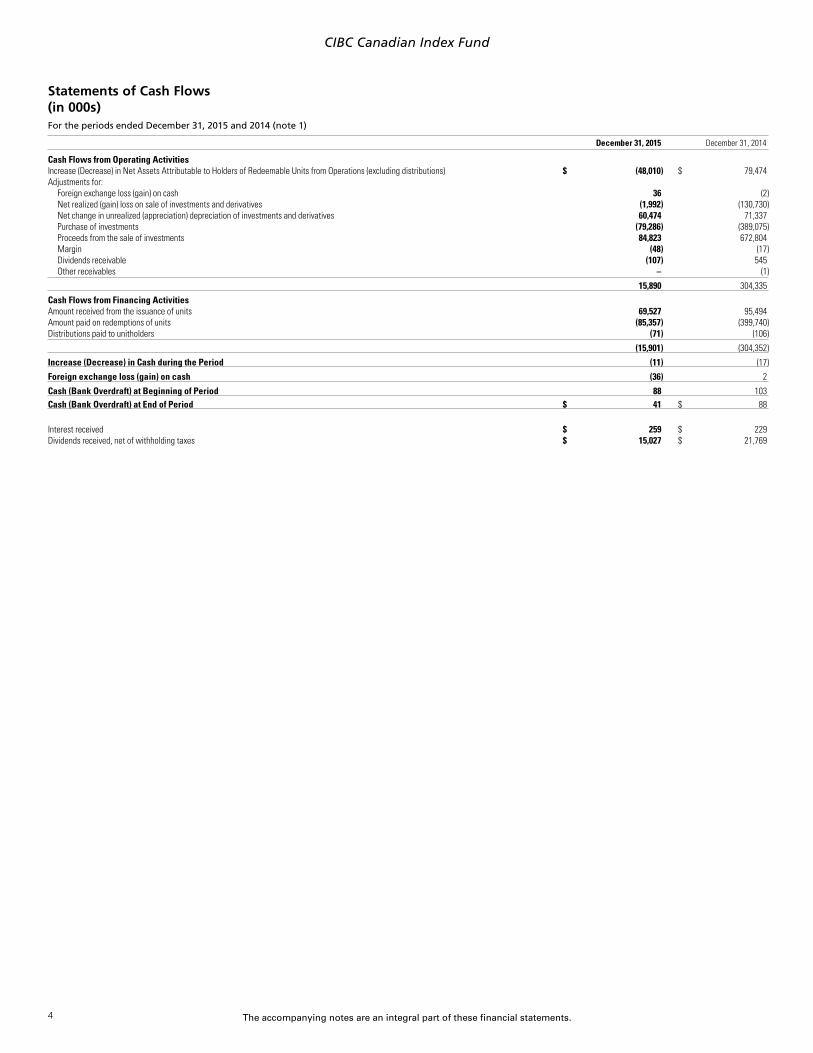
Statements of Cash Flows(in 000s)For the periods ended December 31, 2015 and 2014 (note 1)
December 31, 2015 December 31, 2014xx.
Cash Flows from Operating Activitiesx.
Increase (Decrease) in Net Assets Attributable to Holders of Redeemable Units from Operations (excluding distributions) $ (48,010) $ 79,474x.
Adjustments for:x.
Foreign exchange loss (gain) on cash 36 (2)x.
Net realized (gain) loss on sale of investments and derivatives (1,992) (130,730)x.
Net change in unrealized (appreciation) depreciation of investments and derivatives 60,474 71,337x.
Purchase of investments (79,286) (389,075)x.
Proceeds from the sale of investments 84,823 672,804x.
Margin (48) (17)x.
Dividends receivable (107) 545x.
Other receivables – (1)x.xx
15,890 304,335xxx.
Cash Flows from Financing Activitiesx.
Amount received from the issuance of units 69,527 95,494x.
Amount paid on redemptions of units (85,357) (399,740)x.
Distributions paid to unitholders (71) (106)x.xx
(15,901) (304,352)xxx.
Increase (Decrease) in Cash during the Period (11) (17)xxx.
Foreign exchange loss (gain) on cash (36) 2xxx.
Cash (Bank Overdraft) at Beginning of Period 88 103xxx.
Cash (Bank Overdraft) at End of Period $ 41 $ 88x
x.
Interest received $ 259 $ 229x.
Dividends received, net of withholding taxes $ 15,027 $ 21,769
4

The accompanying notes are an integral part of these financial statements.
CIBC Canadian Index Fund
x
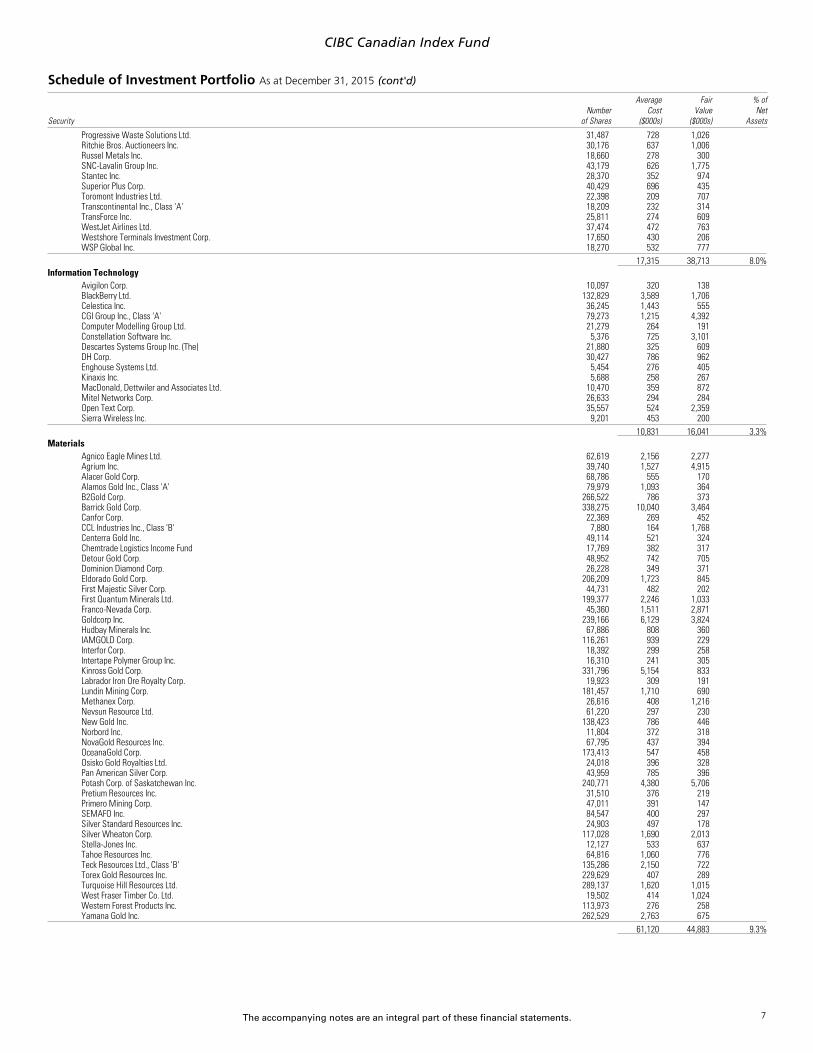
Schedule of Investment Portfolio As at December 31, 2015
SecurityNumber
of Shares
AverageCost
($000s)
FairValue
($000s)
% ofNet
Assets
CANADIAN EQUITIESx
Consumer Discretionary..
Aimia Inc. 49,699 795 468..
Amaya Inc. 30,323 1,002 528..
AutoCanada Inc. 4,589 395 111..
BRP Inc. 10,505 314 209..
Canadian Tire Corp. Ltd., Class 'A' 20,574 742 2,431..
Cineplex Inc. 17,842 326 848..
Cogeco Cable Inc. 7,187 235 444..
Corus Entertainment Inc., Class 'B' 21,563 391 233..
DHX Media Ltd. 32,474 319 275..
Dollarama Inc. 33,023 548 2,640..
Dorel Industries Inc., Class 'B' 9,015 264 282..
EnerCare Inc. 24,548 351 392..
Gildan Activewear Inc. 66,646 493 2,622..
Great Canadian Gaming Corp. 13,040 265 202..
Hudson's Bay Co. 33,849 654 613..
Intertain Group Ltd. (The) 19,602 357 195..
Linamar Corp. 13,020 251 973..
Magna International Inc., Class 'A' 110,491 2,115 6,201..
Martinrea International Inc. 25,223 221 265..
Quebecor Inc., Class 'B' 25,340 362 858..
Restaurant Brands International Inc. 64,734 2,908 3,350..
RONA Inc. 28,213 415 348..
Shaw Communications Inc., Class 'B' 113,282 1,742 2,696..
Thomson Reuters Corp. 92,783 3,618 4,863..
Uni-Select Inc. 5,790 319 397..
....
19,402 32,444 6.7%..x
Consumer Staples..
Alimentation Couche-Tard Inc., Class 'B' 120,789 472 7,357..
Cott Corp. 29,380 267 448..
Empire Co. Ltd., Class 'A' 46,191 777 1,189..
George Weston Ltd. 13,718 917 1,467..
Jean Coutu Group (PJC) Inc. (The), Class 'A' 24,393 308 437..
Loblaw Cos. Ltd. 63,010 2,820 4,117..
Maple Leaf Foods Inc. 27,109 398 644..
Metro Inc., Class 'A' 69,194 509 2,681..
North West Co. Inc. (The) 15,004 259 430..
Saputo Inc. 73,568 723 2,435..
....
7,450 21,205 4.4%..x
Energy..
Advantage Oil & Gas Ltd. 51,259 715 360..
AltaGas Ltd. 42,164 1,250 1,303..
ARC Resources Ltd. 97,963 2,428 1,636..
Athabasca Oil Corp. 92,050 1,387 142..
Baytex Energy Corp. 59,258 1,591 265..
Birchcliff Energy Ltd. 29,049 370 117..
Bonavista Energy Corp. 54,353 1,451 99..
Bonterra Energy Corp. 8,092 465 139..
Cameco Corp. 114,734 1,346 1,958..
Canadian Energy Services & Technology Corp. 54,508 340 211..
Canadian Natural Resources Ltd. 315,370 3,844 9,530..
Canadian Oil Sands Ltd. 144,692 4,121 1,197..
Cenovus Energy Inc. 238,129 3,678 4,167..
Crescent Point Energy Corp. 144,778 4,670 2,334..
Crew Energy Inc. 36,796 521 149..
Enbridge Inc. 248,399 3,450 11,426..
Enbridge Income Fund Holdings Inc. 22,076 578 619..
Encana Corp. 239,680 3,846 1,685..
Enerflex Ltd. 20,811 183 277..
Enerplus Corp. 60,392 2,856 287..
Ensign Energy Services Inc. 38,964 321 288..
Freehold Royalties Ltd. 21,191 369 230..
Gibson Energy Inc. 36,175 799 500..
Gran Tierra Energy Inc. 81,147 577 244..
Husky Energy Inc. 86,928 1,283 1,244..
Imperial Oil Ltd. 73,712 1,477 3,323..
Inter Pipeline Ltd. 96,697 2,425 2,148..
Kelt Exploration Ltd. 36,529 415 155..
Keyera Corp. 49,400 660 1,989..
MEG Energy Corp. 44,383 2,049 356..
Mullen Group Ltd. 26,969 671 378..
Nuvista Energy Ltd. 39,954 306 163..
Paramount Resources Ltd., Class 'A' 16,265 602 100..
Parex Resources Inc. 37,570 457 382..
Parkland Fuel Corp. 25,994 400 605..
Pason Systems Inc. 19,798 238 384..
Pembina Pipeline Corp. 106,721 2,312 3,218..
Pengrowth Energy Corp. 155,458 2,227 159..
Penn West Petroleum Ltd. 144,634 5,000 169..
Peyto Exploration & Development Corp. 45,815 1,026 1,139
5

The accompanying notes are an integral part of these financial statements.
CIBC Canadian Index Fund
Schedule of Investment Portfolio As at December 31, 2015 (cont'd)
SecurityNumber
of Shares
AverageCost
($000s)
FairValue
($000s)
% ofNet
Assets..
PrairieSky Royalty Ltd. 43,287 1,386 949..
Precision Drilling Corp. 82,614 1,414 452..
Raging River Exploration Inc. 50,481 341 422..
Secure Energy Services Inc. 32,205 380 269..
Seven Generations Energy Ltd., Class 'A' 44,515 713 600..
ShawCor Ltd. 18,220 296 511..
Suncor Energy Inc. 416,674 7,050 14,884..
Surge Energy Inc. 64,113 445 135..
TORC Oil & Gas Ltd. 32,146 369 166..
Tourmaline Oil Corp. 53,212 1,761 1,189..
TransCanada Corp. 204,335 6,297 9,234..
Trinidad Drilling Ltd. 63,976 402 136..
Veresen Inc. 82,530 1,112 731..
Vermilion Energy Inc. 31,292 1,189 1,177..
Whitecap Resources Inc. 85,897 974 779..
....
86,833 86,709 18.0%..x
Financials..
Alaris Royalty Corp. 9,309 323 219..
Allied Properties REIT 22,420 495 708..
Artis REIT 37,842 375 484..
Bank of Montreal 184,816 7,218 14,431..
Bank of Nova Scotia 345,982 9,913 19,365..
Boardwalk REIT 11,979 217 568..
Brookfield Asset Management Inc., Class 'A' 248,848 2,817 10,862..
Canaccord Genuity Group Inc. 26,842 329 137..
Canadian Apartment Properties REIT 36,885 516 990..
Canadian Imperial Bank of Commerce 114,505 5,775 10,442..
Canadian Western Bank 23,012 266 538..
Chartwell Retirement 50,575 368 642..
CI Financial Corp. 69,151 2,035 2,116..
Colliers International Group Inc. 9,500 175 587..
Cominar REIT 46,239 758 680..
CREIT 20,806 474 875..
Crombie REIT 22,340 290 286..
Dream Global REIT 28,108 265 243..
Dream Office REIT 31,732 797 551..
Element Financial Corp. 110,600 1,520 1,847..
Fairfax Financial Holdings Ltd. 6,312 1,759 4,146..
First Capital Realty Inc. 32,322 519 593..
FirstService Corp. 8,874 107 496..
Genworth MI Canada Inc. 11,611 296 309..
Granite Real Estate Investment Trust, Stapled Units 14,552 544 552..
Great-West Lifeco Inc. 83,789 1,789 2,893..
H&R REIT 78,678 1,549 1,578..
Home Capital Group Inc. 19,418 278 523..
Horizons S&P/TSX 60 Index ETF 198,723 5,052 4,994..
IGM Financial Inc. 25,628 549 906..
Industrial Alliance Insurance and Financial Services Inc. 29,433 679 1,299..
Intact Financial Corp. 38,207 1,550 3,388..
Laurentian Bank of Canada 7,439 219 359..
Manulife Financial Corp. 567,880 12,307 11,778..
National Bank of Canada 96,894 1,504 3,906..
Northview Apartment REIT 12,769 354 224..
Onex Corp. 23,234 454 1,971..
Power Corp. of Canada 104,534 1,859 3,025..
Power Financial Corp. 70,299 1,259 2,236..
Pure Industrial Real Estate Trust 54,734 267 239..
RioCan REIT 91,863 1,566 2,176..
Royal Bank of Canada 427,119 12,427 31,671..
Smart REIT 31,832 609 961..
Sun Life Financial Inc. 176,416 5,339 7,612..
TMX Group Ltd. 6,997 232 251..
Toronto-Dominion Bank (The) 533,749 11,947 28,951..
Tricon Capital Group Inc. 28,060 306 254..
....
100,246 183,862 38.2%..x
Health Care..
Concordia Healthcare Corp. 10,830 850 612..
Extendicare Inc. 24,840 248 240..
ProMetic Life Sciences Inc. 130,125 343 437..
Valeant Pharmaceuticals International Inc. 92,350 5,112 12,981..
....
6,553 14,270 3.0%..x
Industrials..
Aecon Group Inc. 17,716 304 273..
Air Canada 82,413 283 841..
ATS Automation Tooling Systems Inc. 21,291 293 242..
Badger Daylighting Ltd. 11,047 322 270..
Bombardier Inc., Class 'B' 535,622 4,076 718..
Boyd Group Income Fund 4,714 274 312..
CAE Inc. 79,755 597 1,224..
Canadian National Railway Co. 227,985 3,124 17,635..
Canadian Pacific Railway Ltd. 40,005 1,667 7,070..
Finning International Inc. 49,968 621 933..
New Flyer Industries Inc. 10,698 288 303
6
The accompanying notes are an integral part of these financial statements.
CIBC Canadian Index Fund
Schedule of Investment Portfolio As at December 31, 2015 (cont'd)
SecurityNumber
of Shares
AverageCost
($000s)
FairValue
($000s)
% ofNet
Assets..
Progressive Waste Solutions Ltd. 31,487 728 1,026..
Ritchie Bros. Auctioneers Inc. 30,176 637 1,006..
Russel Metals Inc. 18,660 278 300..
SNC-Lavalin Group Inc. 43,179 626 1,775..
Stantec Inc. 28,370 352 974..
Superior Plus Corp. 40,429 696 435..
Toromont Industries Ltd. 22,398 209 707..
Transcontinental Inc., Class 'A' 18,209 232 314..
TransForce Inc. 25,811 274 609..
WestJet Airlines Ltd. 37,474 472 763..
Westshore Terminals Investment Corp. 17,650 430 206..
WSP Global Inc. 18,270 532 777..
....
17,315 38,713 8.0%..x
Information Technology..
Avigilon Corp. 10,097 320 138..
BlackBerry Ltd. 132,829 3,589 1,706..
Celestica Inc. 36,245 1,443 555..
CGI Group Inc., Class 'A' 79,273 1,215 4,392..
Computer Modelling Group Ltd. 21,279 264 191..
Constellation Software Inc. 5,376 725 3,101..
Descartes Systems Group Inc. (The) 21,880 325 609..
DH Corp. 30,427 786 962..
Enghouse Systems Ltd. 5,454 276 405..
Kinaxis Inc. 5,688 258 267..
MacDonald, Dettwiler and Associates Ltd. 10,470 359 872..
Mitel Networks Corp. 26,633 294 284..
Open Text Corp. 35,557 524 2,359..
Sierra Wireless Inc. 9,201 453 200..
....
10,831 16,041 3.3%..x
Materials..
Agnico Eagle Mines Ltd. 62,619 2,156 2,277..
Agrium Inc. 39,740 1,527 4,915..
Alacer Gold Corp. 68,786 555 170..
Alamos Gold Inc., Class 'A' 79,979 1,093 364..
B2Gold Corp. 266,522 786 373..
Barrick Gold Corp. 338,275 10,040 3,464..
Canfor Corp. 22,369 269 452..
CCL Industries Inc., Class 'B' 7,880 164 1,768..
Centerra Gold Inc. 49,114 521 324..
Chemtrade Logistics Income Fund 17,769 382 317..
Detour Gold Corp. 48,952 742 705..
Dominion Diamond Corp. 26,228 349 371..
Eldorado Gold Corp. 206,209 1,723 845..
First Majestic Silver Corp. 44,731 482 202..
First Quantum Minerals Ltd. 199,377 2,246 1,033..
Franco-Nevada Corp. 45,360 1,511 2,871..
Goldcorp Inc. 239,166 6,129 3,824..
Hudbay Minerals Inc. 67,886 808 360..
IAMGOLD Corp. 116,261 939 229..
Interfor Corp. 18,392 299 258..
Intertape Polymer Group Inc. 16,310 241 305..
Kinross Gold Corp. 331,796 5,154 833..
Labrador Iron Ore Royalty Corp. 19,923 309 191..
Lundin Mining Corp. 181,457 1,710 690..
Methanex Corp. 26,616 408 1,216..
Nevsun Resource Ltd. 61,220 297 230..
New Gold Inc. 138,423 786 446..
Norbord Inc. 11,804 372 318..
NovaGold Resources Inc. 67,795 437 394..
OceanaGold Corp. 173,413 547 458..
Osisko Gold Royalties Ltd. 24,018 396 328..
Pan American Silver Corp. 43,959 785 396..
Potash Corp. of Saskatchewan Inc. 240,771 4,380 5,706..
Pretium Resources Inc. 31,510 376 219..
Primero Mining Corp. 47,011 391 147..
SEMAFO Inc. 84,547 400 297..
Silver Standard Resources Inc. 24,903 497 178..
Silver Wheaton Corp. 117,028 1,690 2,013..
Stella-Jones Inc. 12,127 533 637..
Tahoe Resources Inc. 64,816 1,060 776..
Teck Resources Ltd., Class 'B' 135,286 2,150 722..
Torex Gold Resources Inc. 229,629 407 289..
Turquoise Hill Resources Ltd. 289,137 1,620 1,015..
West Fraser Timber Co. Ltd. 19,502 414 1,024..
Western Forest Products Inc. 113,973 276 258..
Yamana Gold Inc. 262,529 2,763 675..
....
61,120 44,883 9.3%..
7
The accompanying notes are an integral part of these financial statements.
CIBC Canadian Index Fund
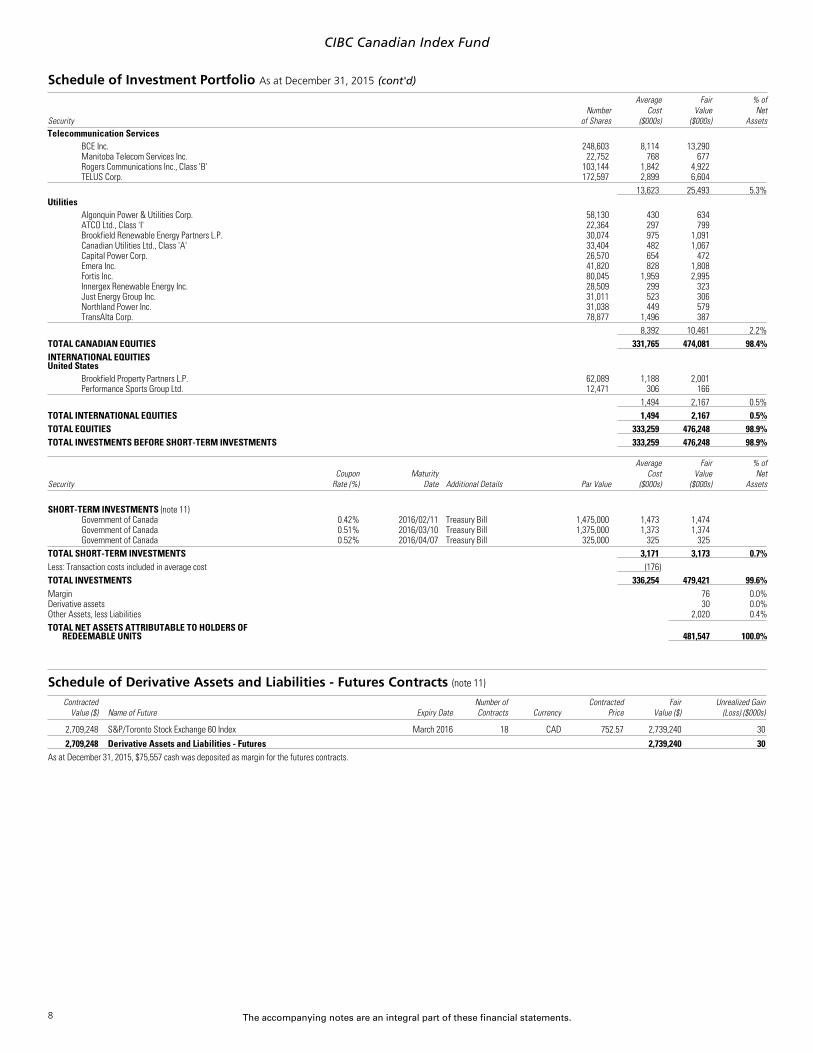
Schedule of Investment Portfolio As at December 31, 2015 (cont'd)
SecurityNumber
of Shares
AverageCost
($000s)
FairValue
($000s)
% ofNet
Assetsx
Telecommunication Services..
BCE Inc. 248,603 8,114 13,290..
Manitoba Telecom Services Inc. 22,752 768 677..
Rogers Communications Inc., Class 'B' 103,144 1,842 4,922..
TELUS Corp. 172,597 2,899 6,604..
....
13,623 25,493 5.3%..x
Utilities..
Algonquin Power & Utilities Corp. 58,130 430 634..
ATCO Ltd., Class 'I' 22,364 297 799..
Brookfield Renewable Energy Partners L.P. 30,074 975 1,091..
Canadian Utilities Ltd., Class 'A' 33,404 482 1,067..
Capital Power Corp. 26,570 654 472..
Emera Inc. 41,820 828 1,808..
Fortis Inc. 80,045 1,959 2,995..
Innergex Renewable Energy Inc. 28,509 299 323..
Just Energy Group Inc. 31,011 523 306..
Northland Power Inc. 31,038 449 579..
TransAlta Corp. 78,877 1,496 387..
....
8,392 10,461 2.2%..
..
TOTAL CANADIAN EQUITIES 331,765 474,081 98.4%..
..
INTERNATIONAL EQUITIESx
United States..
Brookfield Property Partners L.P. 62,089 1,188 2,001..
Performance Sports Group Ltd. 12,471 306 166..
....
1,494 2,167 0.5%..
..
TOTAL INTERNATIONAL EQUITIES 1,494 2,167 0.5%..
..
TOTAL EQUITIES 333,259 476,248 98.9%..
..
TOTAL INVESTMENTS BEFORE SHORT-TERM INVESTMENTS 333,259 476,248 98.9%..
SecurityCoupon
Rate (%)Maturity
Date Additional Details Par Value
AverageCost
($000s)
FairValue
($000s)
% ofNet
Assetsx
..
SHORT-TERM INVESTMENTS (note 11)..
Government of Canada 0.42% 2016/02/11 Treasury Bill 1,475,000 1,473 1,474..
Government of Canada 0.51% 2016/03/10 Treasury Bill 1,375,000 1,373 1,374..
Government of Canada 0.52% 2016/04/07 Treasury Bill 325,000 325 325..
..
..
TOTAL SHORT-TERM INVESTMENTS 3,171 3,173 0.7%..
..
Less: Transaction costs included in average cost (176).
..
..
TOTAL INVESTMENTS 336,254 479,421 99.6%..
..
Margin 76 0.0%..
Derivative assets 30 0.0%..
Other Assets, less Liabilities 2,020 0.4%..
..
..
TOTAL NET ASSETS ATTRIBUTABLE TO HOLDERS OFREDEEMABLE UNITS 481,547 100.0%
.
...
x
x
Schedule of Derivative Assets and Liabilities - Futures Contracts (note 11)
ContractedValue ($) Name of Future Expiry Date
Number ofContracts Currency
ContractedPrice
FairValue ($)
Unrealized Gain(Loss) ($000s)
x..
2,709,248 S&P/Toronto Stock Exchange 60 Index March 2016 18 CAD 752.57 2,739,240 30......
2,709,248 Derivative Assets and Liabilities - Futures 2,739,240 30..
..
As at December 31, 2015, $75,557 cash was deposited as margin for the futures contracts.
8
The accompanying notes are an integral part of these financial statements.
CIBC Canadian Index Fund
Supplemental Schedule to Schedule of Investment Portfolio
Offsetting Arrangements (note 2d)
The Fund may enter into various master netting arrangements or other similar agreements that do not meet the criteria for offsetting in the Statements of Financial Position but still allowfor the related amounts to be set off in certain circumstances, such as bankruptcy or the termination of the contracts.
As at December 31, 2015 and 2014, the Fund did not enter into any arrangements whereby the financial instruments were eligible for offset.
Interests in Underlying Funds (note 4)
As at December 31, 2015 and 2014, the Fund had no significant investments in underlying funds.
9
The accompanying notes are an integral part of these financial statements.
CIBC Canadian Index Fund
Financial Instrument RisksInvestment Objective: CIBC Canadian Index Fund (the Fund) seeks to provide long-termgrowth through capital appreciation. The Fund is managed to obtain a return thatapproximates the performance of the S&P/TSX Composite Index, which is intended torepresent the Canadian equity market and includes the largest companies listed on theTSX.
Investment Strategies: The Fund uses passive management strategies to create aportfolio with characteristics similar to the S&P/TSX Composite Index, allowing the Fundto obtain a return that approximates the performance of that index.
Significant risks that are relevant to the Fund are discussed here. General information onrisk management and specific discussion on concentration, credit, currency, interest rate,liquidity, and other price/market risk can be found in note 2 of the financial statements.
In the following risk tables, Net Assets is defined as meaning “Net assets attributable toholders of redeemable units".
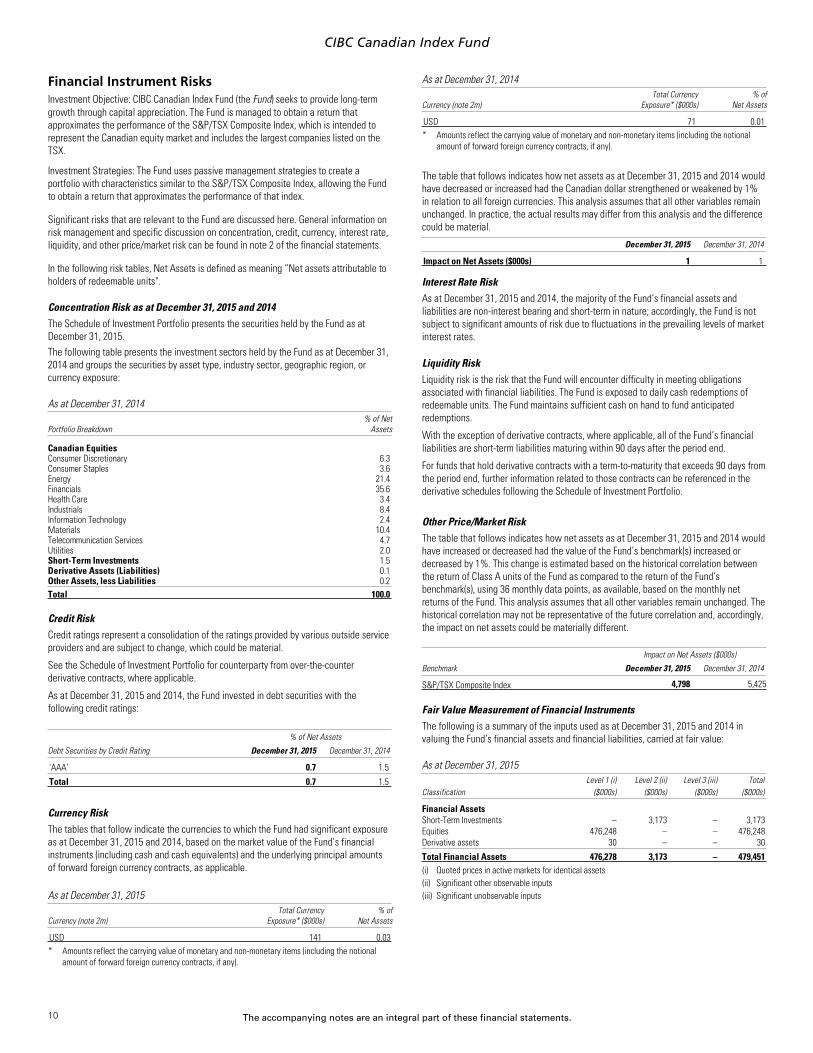
Concentration Risk as at December 31, 2015 and 2014The Schedule of Investment Portfolio presents the securities held by the Fund as atDecember 31, 2015.The following table presents the investment sectors held by the Fund as at December 31,2014 and groups the securities by asset type, industry sector, geographic region, orcurrency exposure:
As at December 31, 2014
Portfolio Breakdown% of Net
Assetsx
x
Canadian Equitiesx
Consumer Discretionary 6.3x
Consumer Staples 3.6x
Energy 21.4x
Financials 35.6x
Health Care 3.4x
Industrials 8.4x
Information Technology 2.4x
Materials 10.4x
Telecommunication Services 4.7x
Utilities 2.0x
Short-Term Investments 1.5x
Derivative Assets (Liabilities) 0.1x
Other Assets, less Liabilities 0.2xxx
Total 100.0xx
Credit RiskCredit ratings represent a consolidation of the ratings provided by various outside serviceproviders and are subject to change, which could be material.
See the Schedule of Investment Portfolio for counterparty from over-the-counterderivative contracts, where applicable.
As at December 31, 2015 and 2014, the Fund invested in debt securities with thefollowing credit ratings:
.
% of Net Assets
Debt Securities by Credit Rating December 31, 2015 December 31, 2014x
x
'AAA' 0.7 1.5xxx
Total 0.7 1.5xx
Currency RiskThe tables that follow indicate the currencies to which the Fund had significant exposureas at December 31, 2015 and 2014, based on the market value of the Fund's financialinstruments (including cash and cash equivalents) and the underlying principal amountsof forward foreign currency contracts, as applicable.
As at December 31, 2015
Currency (note 2m)Total Currency
Exposure* ($000s)% of
Net Assetsx
x
USD 141 0.03xxx
* Amounts reflect the carrying value of monetary and non-monetary items (including the notionalamount of forward foreign currency contracts, if any).
As at December 31, 2014
Currency (note 2m)Total Currency
Exposure* ($000s)% of
Net Assetsx
x
USD 71 0.01xxx
* Amounts reflect the carrying value of monetary and non-monetary items (including the notionalamount of forward foreign currency contracts, if any).
The table that follows indicates how net assets as at December 31, 2015 and 2014 wouldhave decreased or increased had the Canadian dollar strengthened or weakened by 1%in relation to all foreign currencies. This analysis assumes that all other variables remainunchanged. In practice, the actual results may differ from this analysis and the differencecould be material.
December 31, 2015 December 31, 2014x
x
Impact on Net Assets ($000s) 1 1xx
Interest Rate RiskAs at December 31, 2015 and 2014, the majority of the Fund’s financial assets andliabilities are non-interest bearing and short-term in nature; accordingly, the Fund is notsubject to significant amounts of risk due to fluctuations in the prevailing levels of marketinterest rates.
Liquidity RiskLiquidity risk is the risk that the Fund will encounter difficulty in meeting obligationsassociated with financial liabilities. The Fund is exposed to daily cash redemptions ofredeemable units. The Fund maintains sufficient cash on hand to fund anticipatedredemptions.
With the exception of derivative contracts, where applicable, all of the Fund’s financialliabilities are short-term liabilities maturing within 90 days after the period end.
For funds that hold derivative contracts with a term-to-maturity that exceeds 90 days fromthe period end, further information related to those contracts can be referenced in thederivative schedules following the Schedule of Investment Portfolio.
Other Price/Market RiskThe table that follows indicates how net assets as at December 31, 2015 and 2014 wouldhave increased or decreased had the value of the Fund’s benchmark(s) increased ordecreased by 1%. This change is estimated based on the historical correlation betweenthe return of Class A units of the Fund as compared to the return of the Fund’sbenchmark(s), using 36 monthly data points, as available, based on the monthly netreturns of the Fund. This analysis assumes that all other variables remain unchanged. Thehistorical correlation may not be representative of the future correlation and, accordingly,the impact on net assets could be materially different..
Impact on Net Assets ($000s)
Benchmark December 31, 2015 December 31, 2014x
x
S&P/TSX Composite Index 4,798 5,425xx
Fair Value Measurement of Financial InstrumentsThe following is a summary of the inputs used as at December 31, 2015 and 2014 invaluing the Fund’s financial assets and financial liabilities, carried at fair value:
As at December 31, 2015Level 1 (i) Level 2 (ii) Level 3 (iii) Total
Classification ($000s) ($000s) ($000s) ($000s)xx
Financial Assetsx
Short-Term Investments – 3,173 – 3,173x
Equities 476,248 – – 476,248x
Derivative assets 30 – – 30xxx
Total Financial Assets 476,278 3,173 – 479,451xx
x
(i) Quoted prices in active markets for identical assetsx
(ii) Significant other observable inputsx
(iii) Significant unobservable inputs
10
The accompanying notes are an integral part of these financial statements.
CIBC Canadian Index Fund
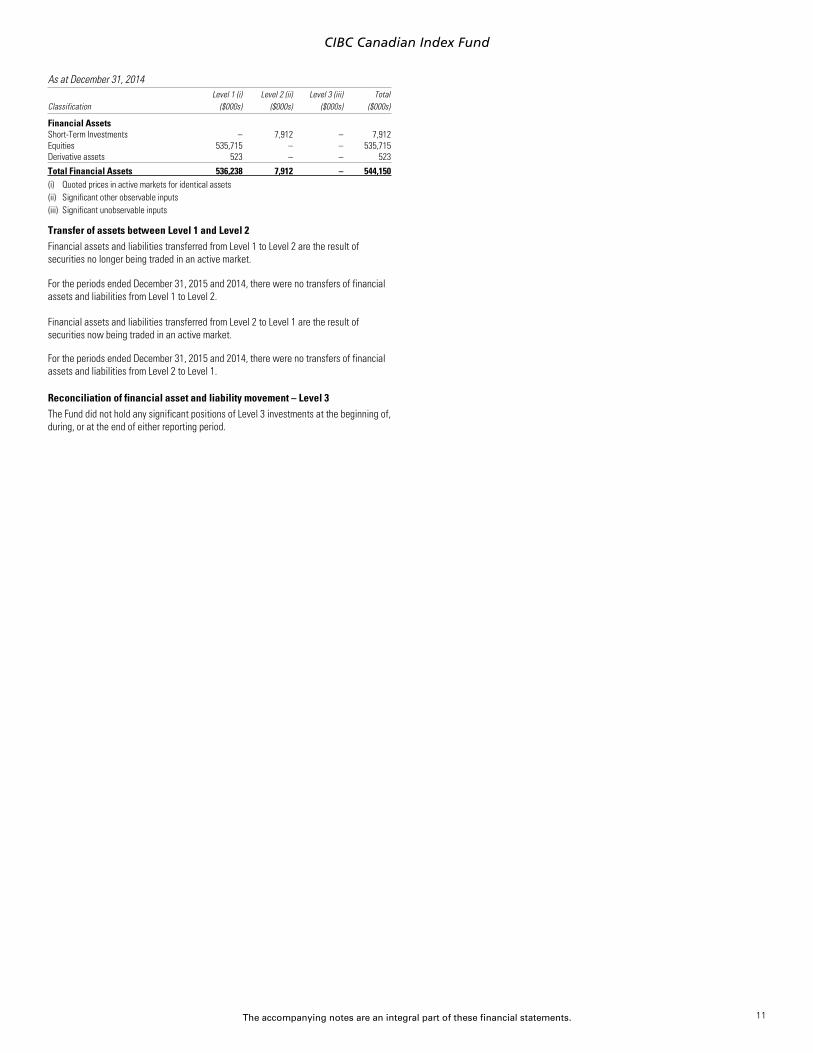
As at December 31, 2014Level 1 (i) Level 2 (ii) Level 3 (iii) Total
Classification ($000s) ($000s) ($000s) ($000s)xx
Financial Assetsx
Short-Term Investments – 7,912 – 7,912x
Equities 535,715 – – 535,715x
Derivative assets 523 – – 523xxx
Total Financial Assets 536,238 7,912 – 544,150xx
x
(i) Quoted prices in active markets for identical assetsx
(ii) Significant other observable inputsx
(iii) Significant unobservable inputs
Transfer of assets between Level 1 and Level 2Financial assets and liabilities transferred from Level 1 to Level 2 are the result ofsecurities no longer being traded in an active market.
For the periods ended December 31, 2015 and 2014, there were no transfers of financialassets and liabilities from Level 1 to Level 2.
Financial assets and liabilities transferred from Level 2 to Level 1 are the result ofsecurities now being traded in an active market.
For the periods ended December 31, 2015 and 2014, there were no transfers of financialassets and liabilities from Level 2 to Level 1.
Reconciliation of financial asset and liability movement – Level 3The Fund did not hold any significant positions of Level 3 investments at the beginning of,during, or at the end of either reporting period.
11
Notes to Financial Statements
x
As at and for the periods as disclosed in the financial statements (see note 1)
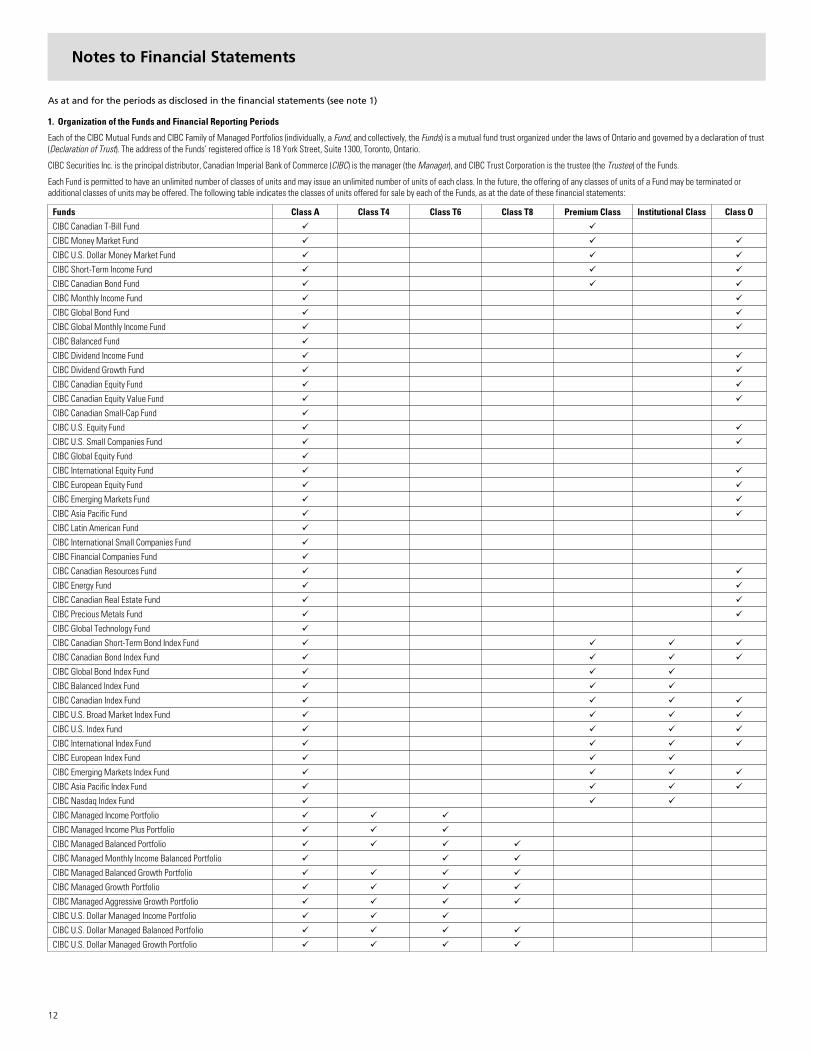
1. Organization of the Funds and Financial Reporting Periods
Each of the CIBC Mutual Funds and CIBC Family of Managed Portfolios (individually, a Fund, and collectively, the Funds) is a mutual fund trust organized under the laws of Ontario and governed by a declaration of trust(Declaration of Trust). The address of the Funds’ registered office is 18 York Street, Suite 1300, Toronto, Ontario.
CIBC Securities Inc. is the principal distributor, Canadian Imperial Bank of Commerce (CIBC) is the manager (the Manager), and CIBC Trust Corporation is the trustee (the Trustee) of the Funds.
Each Fund is permitted to have an unlimited number of classes of units and may issue an unlimited number of units of each class. In the future, the offering of any classes of units of a Fund may be terminated oradditional classes of units may be offered. The following table indicates the classes of units offered for sale by each of the Funds, as at the date of these financial statements:x
Funds Class A Class T4 Class T6 Class T8 Premium Class Institutional Class Class Ox..
CIBC Canadian T-Bill Fund ü ü..
CIBC Money Market Fund ü ü ü..
CIBC U.S. Dollar Money Market Fund ü ü ü..
CIBC Short-Term Income Fund ü ü ü..
CIBC Canadian Bond Fund ü ü ü..
CIBC Monthly Income Fund ü ü..
CIBC Global Bond Fund ü ü..
CIBC Global Monthly Income Fund ü ü..
CIBC Balanced Fund ü..
CIBC Dividend Income Fund ü ü..
CIBC Dividend Growth Fund ü ü..
CIBC Canadian Equity Fund ü ü..
CIBC Canadian Equity Value Fund ü ü..
CIBC Canadian Small-Cap Fund ü..
CIBC U.S. Equity Fund ü ü..
CIBC U.S. Small Companies Fund ü ü..
CIBC Global Equity Fund ü..
CIBC International Equity Fund ü ü..
CIBC European Equity Fund ü ü..
CIBC Emerging Markets Fund ü ü..
CIBC Asia Pacific Fund ü ü..
CIBC Latin American Fund ü..
CIBC International Small Companies Fund ü..
CIBC Financial Companies Fund ü..
CIBC Canadian Resources Fund ü ü..
CIBC Energy Fund ü ü..
CIBC Canadian Real Estate Fund ü ü..
CIBC Precious Metals Fund ü ü..
CIBC Global Technology Fund ü..
CIBC Canadian Short-Term Bond Index Fund ü ü ü ü..
CIBC Canadian Bond Index Fund ü ü ü ü..
CIBC Global Bond Index Fund ü ü ü..
CIBC Balanced Index Fund ü ü ü..
CIBC Canadian Index Fund ü ü ü ü..
CIBC U.S. Broad Market Index Fund ü ü ü ü..
CIBC U.S. Index Fund ü ü ü ü..
CIBC International Index Fund ü ü ü ü..
CIBC European Index Fund ü ü ü..
CIBC Emerging Markets Index Fund ü ü ü ü..
CIBC Asia Pacific Index Fund ü ü ü ü..
CIBC Nasdaq Index Fund ü ü ü..
CIBC Managed Income Portfolio ü ü ü..
CIBC Managed Income Plus Portfolio ü ü ü..
CIBC Managed Balanced Portfolio ü ü ü ü..
CIBC Managed Monthly Income Balanced Portfolio ü ü ü..
CIBC Managed Balanced Growth Portfolio ü ü ü ü..
CIBC Managed Growth Portfolio ü ü ü ü..
CIBC Managed Aggressive Growth Portfolio ü ü ü ü..
CIBC U.S. Dollar Managed Income Portfolio ü ü ü..
CIBC U.S. Dollar Managed Balanced Portfolio ü ü ü ü..
CIBC U.S. Dollar Managed Growth Portfolio ü ü ü üx
12
p / 2 Notes to Financial Statements
Each class of units may charge a different management fee. Operating expenses can be either common or class-specific. Class-specific expenses are allocated on a class-by-class basis. As a result, a separate netasset value per unit is calculated for each class of units.
Class A units are available to all investors on a no-load basis with a minimum investment of $500. Investors may have to pay a short-term trading fee if applicable.
Class T4, T6, and T8 units have the same characteristics as Class A units, except that they each intend to pay a fixed distribution amount per unit, which also results in a separate net asset value per unit for each class,and may have different minimum investment requirements.
Premium Class units are available to investors on a no-load basis with a minimum investment of $100,000 for CIBC Canadian T-Bill Fund and CIBC Money Market Fund, US$100,000 for CIBC U.S. Dollar Money MarketFund, $50,000 for CIBC Short-Term Income Fund, CIBC Canadian Bond Fund, CIBC Canadian Short-Term Bond Index Fund, CIBC Canadian Bond Index Fund, CIBC Global Bond Index Fund, CIBC Balanced Index Fund,CIBC Canadian Index Fund, CIBC U.S. Broad Market Index Fund, CIBC U.S. Index Fund, CIBC International Index Fund, CIBC European Index Fund, CIBC Emerging Markets Index Fund, CIBC Asia Pacific Index Fund, andCIBC Nasdaq Index Fund, and US$50,000 for the U.S. dollar purchase option of CIBC U.S. Broad Market Index Fund and CIBC Nasdaq Index Fund. Management fees charged in respect of Premium Class units are lowerthan those charged in respect of Class A units.
Institutional Class units are available to investors with a minimum investment of $50,000. Institutional Class units are available to investors participating in programs that do not require the payment of sales charges byinvestors and do not require the payment of service or trailing commissions to dealers, and others who pay an annual fee to their dealer. For these investors, we “unbundle” the typical distribution costs and charge alower management fee. Potential investors include institutional clients, clients of “fee-for-service” investment advisors, dealer sponsored “wrap accounts”, and others who pay an annual fee to their dealer instead oftransactional sales charges and where the dealer does not receive service fees or trailing commissions from the Manager.
Class O units are only available to certain investors who have been approved by and have entered into a Class O unit account agreement with the Manager or whose dealer or discretionary manager offers separatelymanaged accounts or similar programs and has entered into a Class O unit account agreement with the Manager. These investors are typically financial services companies, including the Manager, that use Class Ounits of a fund to facilitate offering other products to investors. No management fees or operating expenses are charged to a fund in respect of Class O units; instead, a negotiated management fee is charged by theManager directly to, or as directed by, Class O unitholders or dealers and discretionary managers on behalf of unitholders.
The date upon which each Fund was established by Declaration of Trust (Date Established) and the date upon which each class of units of each Fund was first sold to the public (Inception Date) are reported in footnoteOrganization of the Fund on the Statements of Financial Position.
The Schedule of Investment Portfolio of each of the Funds is as at December 31, 2015. The Statements of Financial Position of each of the Funds are as at December 31, 2015 and 2014. The Statements ofComprehensive Income, Statements of Changes in Net Assets Attributable to Holders of Redeemable Units, and the Statements of Cash Flows of each of the Funds are for the years ended December 31, 2015 and2014, except for Funds or classes established during either period, in which case the information presented is from the Date Established or the Inception Date to December 31, 2015 or 2014.
These financial statements were approved for issuance by the Manager on March 2, 2016.
2. Summary of Significant Accounting Policies
These financial statements have been prepared in accordance with International Financial Reporting Standards (IFRS) as published by the International Accounting Standards Board (IASB). The Funds adopted IFRS in2014 as required by Canadian securities legislation and the Canadian Accounting Standards Board. Previously, the Funds prepared their financial statements in accordance with Canadian generally acceptedaccounting principles (GAAP) as defined in Part V of the CPA Canada Handbook.
The financial statements have been prepared on a going concern basis using the historical cost convention. However, each Fund is an investment entity and primarily all financial assets and financial liabilities aremeasured at fair value in accordance with IFRS. Accordingly, the Funds’ accounting policies for measuring the fair value of investments and derivatives are consistent with those used in measuring the Net Asset Valuefor transactions with unitholders. In applying IFRS, these financial statements include estimates and assumptions made by management that affect the reported amounts of assets, liabilities, income, and expensesduring the reporting periods. However, existing circumstances and assumptions may change due to market changes or circumstances arising beyond the control of the Funds. Such changes are reflected in theassumptions when they occur.
These financial statements have been presented in Canadian dollars, which is the Funds’ functional currency (unless otherwise noted).
a) Financial Instruments
Classification and recognition of financial instruments
In accordance with IAS 39 Financial Instruments: Recognition and Measurement, financial assets and financial liabilities are classified at initial recognition into the following categories:
Financial assets and liabilities at fair value through profit or loss (“FVTPL”)
This category is sub-divided into:
l Financial instruments classified as Held For Trading: Financial assets and liabilities are classified as Held For Trading if they are acquired for the purpose of selling and/or repurchasing in the near term, andare acquired principally for the purpose of generating a profit from short-term fluctuations in price. Derivatives and securities sold short held by the Funds are classified as Held For Trading and do not meetthe definition of effective hedging instruments as defined by IAS 39.
l Financial instruments designated as FVTPL through inception: All investments held by the Funds, excluding those classified as Held For Trading (discussed above), are designated as fair value through profitor loss upon initial recognition. These financial assets are designated upon initial recognition on the basis that they are part of a group of financial assets that are managed and have their performanceevaluated on a fair value basis, in accordance with risk management and investment strategies of the Funds, as set out in the Funds’ prospectus.
Loans and receivables
The Funds include in this category receivable balances relating to portfolio investments and other short-term receivables such as receivable for units issued.
Other financial liabilities
This category includes all financial liabilities, other than those classified as fair value through profit or loss. The Funds include in this category amounts relating to payables for portfolio securities purchased and otheraccrued liabilities such as payable for units redeemed and distributions payable to holders of redeemable units.
All Funds have contractual obligations to distribute cash to the unitholders. As a result, each Fund's obligation for net assets attributable to holders of redeemable units represents a financial liability and is presentedat the redemption amount.
b) Risk management
The Funds’ overall risk management approach includes formal guidelines that govern the extent of exposure to various types of risk, including diversification within asset classes and limits on the exposure to individualinvestments and counterparties. In addition, derivative financial instruments may be used to manage certain risk exposures. The Manager also has various internal controls to oversee the Funds’ investment activities,including monitoring compliance with the investment objectives and strategies, internal guidelines, and securities regulations. Please refer to each Fund’s Supplemental Schedule to Schedule of Investment Portfoliofor specific risk disclosures.
Fair value of financial instruments by using valuation techniques
Financial instruments are valued at their fair value which is defined as the price that would be received to sell an asset or paid to transfer a liability in an orderly transaction between market participants at themeasurement date. Refer to notes 3a to 3f for valuation of each specific type of financial instrument held by the Funds. The fair value of financial assets and liabilities traded in active markets are based on quotedmarket prices at the close of trading on the reporting date. The Funds use the last traded market price for both financial assets and financial liabilities where the last traded price falls within that day’s bid-ask spread.In circumstances where the last traded price is not within the bid-ask spread, the Manager determines the price that is most representative of fair value based on the specific facts and circumstances.
For financial assets and financial liabilities that are not traded in an active market, fair value is determined using valuation techniques.
The Funds classify fair value measurement within a hierarchy which gives the highest priority to unadjusted quoted prices in active markets for identical assets or liabilities (Level 1) and the lowest priority tounobservable inputs (Level 3). The three levels of the fair value hierarchy are:
Level 1: Quoted prices (unadjusted) in active markets for identical assets or liabilities that the entity can access at the measurement date;
13
Notes to Financial Statements p / 3
Level 2: Inputs other than quoted prices included within Level 1 that are observable for the asset or liability, either directly or indirectly; and
Level 3: Inputs are unobservable for the asset or liability.
If inputs are used to measure an asset’s or liability’s fair value, the classification within the hierarchy is based on the lowest level input that is significant to the fair value measurement. Each Fund’s fair value hierarchyclassification of its assets and liabilities is included in the Supplemental Schedule to Schedule of Investment Portfolio.
The carrying values of all non-investment assets and liabilities approximate their fair values due to their short-term nature. Fair values are classified as Level 1 when the related security or derivative is actively tradedand a quoted price is available. If an instrument classified as Level 1 subsequently ceases to be actively traded, it is transferred out of Level 1. In such cases, instruments are reclassified into Level 2, unless themeasurement of its fair value requires the use of significant unobservable inputs, in which case it is classified as Level 3.
The Manager is responsible for performing the fair value measurements included in the financial statements of a Fund, including the Level 3 measurements. The Manager obtains pricing from third-party pricingvendors and the pricing is reviewed daily. At each financial reporting date, the Manager reviews and approves all Level 3 fair value measurements. The Funds also have a Valuation Committee which meets quarterly toperform detailed reviews of the valuations of investments held by the Funds which includes discussion on Level 3 measurements.
Credit risk
Credit risk is the risk that a counterparty to a financial instrument, such as a fixed income security or a derivative contract, will fail to discharge an obligation or commitment that it has entered into with the Funds. Thevalue of fixed income securities and derivatives as presented on the Schedule of Investment Portfolio includes consideration of the creditworthiness of the issuer and, accordingly, represents the maximum credit riskexposure of the Funds. Certain Funds may invest in short-term fixed income securities issued or guaranteed primarily by the Government of Canada or any Canadian provincial government, obligations of Canadianchartered banks or trust companies, and commercial paper with approved credit ratings. The risk of default on these short-term fixed income securities is considered low and these securities primarily have creditratings of ‘A-1 (Low)’ or higher (as rated by Standard & Poor’s, a division of McGraw Hill Financial, Inc., or equivalent rating from another rating service).
The Funds may engage in securities lending transactions. The credit risk related to securities lending transactions is limited by the fact that the value of cash or securities held as collateral by the Funds in connectionwith these transactions is at least 102% of the fair value of the securities loaned. The collateral and loaned securities are marked to market on each business day. Further information regarding the collateral andsecurities on loan can be found in the footnotes to the Statements of Financial Position and in note 2j.
Currency risk
Currency risk is the risk that the value of an investment will fluctuate due to changes in foreign exchange rates. Mutual funds may invest in securities denominated or traded in currencies other than the Funds’reporting currency.
Interest rate risk
Prices of fixed income securities generally increase when interest rates decline and decrease when interest rates rise. This risk is known as interest rate risk. Prices of longer-term fixed income securities will generallyfluctuate more in response to interest rate changes than would shorter-term securities. Due to the nature of short-term fixed income securities with a remaining term-to-maturity of less than one year, theseinvestments are not generally exposed to a significant risk that their value will fluctuate in response to changes in the prevailing levels of market interest rates.
Liquidity risk
The Funds are exposed to daily cash redemptions of redeemable units. Generally, the Funds retain sufficient cash and cash equivalent positions to maintain adequate liquidity. However, liquidity risk also involves theability to sell an asset for cash easily and at a fair price. Some securities are illiquid due to legal restrictions on their resale, the nature of the investment, or simply a lack of interested buyers for a particular security orsecurity type. Certain securities may become less liquid due to changes in market conditions, such as interest rate changes or market volatility, which could impair the ability of a Fund to sell such securities quickly or ata fair price. Difficulty in selling securities could result in a loss or a lower return for a Fund.
Other price/market risk
Other price/market risk is the risk that the value of investments will fluctuate as a result of changes in market conditions. Several factors can influence market trends, such as economic developments, changes ininterest rates, political changes, and catastrophic events. All investments are exposed to other price/market risk.
c) Investment Transactions, Income Recognition, and Recognition of Realized and Unrealized Gains and Losses
i) Interest for distribution purposes shown on the Statements of Comprehensive Income represents the coupon interest received by the Fund accounted for on an accrual basis. The Funds do not amortizepremiums paid or discounts received on the purchase of fixed income securities except for zero coupon bonds, which are amortized on a straight-line basis.
ii) Dividend income is recorded on the ex-dividend date.
iii) Securities that are exchange-traded are recorded at fair value established by the last traded market price when that price falls within that day’s bid-ask spread. Debt securities are recorded at fair value,established by the last traded price on the over-the-counter market (OTC) when that price falls within that day’s bid-ask spread. In circumstances where the last traded price is not within the bid-ask spread,the Manager determines the price that is most representative of fair value based on the specific facts and circumstances. Unlisted securities are recorded at fair value using fair valuation techniquesestablished by the Manager in establishing a fair value.
iv) Realized gains and losses on investments and unrealized appreciation or depreciation of investments are calculated using the average cost, excluding transaction costs, of the related investments.
v) Investment income is the sum of income paid to the fund that is generated from a fund’s investment fund holdings.
vi) Other income is the sum of income, excluding transaction costs, other than that which is separately classified on the Statements of Comprehensive Income.
d) Offsetting
Financial assets and liabilities are offset and the net amount reported in the Statements of Financial Position, if there is a currently enforceable legal right to offset the recognized amounts and there is an intention tosettle on a net basis, or to realize the asset and settle the liability simultaneously.
Where applicable, additional information can be found in the table Offsetting Arrangements as part of the Supplemental Schedule to Schedule of Investment Portfolio. This supplemental schedule discloses the OTCderivatives which are subject to offsetting.
e) Portfolio Securities
The cost of securities of a Fund is determined in the following manner: securities are purchased and sold at a market-traded price to arrive at a value for the position traded. The total purchased value represents thetotal cost of the security to the Fund. When additional units of the same security are purchased, the cost of those additional units is added to the total security cost. When units of the same security are sold, theproportionate cost of the units of the security sold is deducted from the total security cost. If there is a return of capital paid by a security, the amount of this return of capital is deducted from the total security cost.This method of tracking security cost is known as “average cost” and the current total for any one security is referred to as the “adjusted cost base” or “ACB” of the security. Transaction costs incurred in portfoliotransactions are excluded from the average cost of investments and are recognized immediately in Increase (Decrease) in Net Assets Attributable to Holders of Redeemable Units and are presented as a separateexpense item in the financial statements.
The difference between the fair value of securities and their average cost, excluding transaction costs, represents the unrealized appreciation (depreciation) in value of the portfolio investments. The applicable periodchange in unrealized appreciation (depreciation) of investments is included on the Statements of Comprehensive Income.
Short-term investments on the Schedule of Investment Portfolio are presented at their amortized cost which approximates the fair value. Accrued interest for bonds is disclosed separately on the Statements ofFinancial Position.
f) Foreign Exchange
The value of investments and other assets and liabilities denominated in foreign currencies is translated into Canadian dollars, which is the Funds’ functional and presentation currency (except for CIBC U.S. DollarMoney Market Fund, CIBC U.S. Dollar Managed Income Portfolio, CIBC U.S. Dollar Managed Balanced Portfolio, and CIBC U.S. Dollar Managed Growth Portfolio, which are valued in U.S. dollars) at the current ratesprevailing on each valuation date.
14

p / 4 Notes to Financial Statements
Purchases and sales of investments, income, and expenses are translated into Canadian dollars, which is the Funds’ functional and presentation currency (with the exception of the above-mentioned Funds which arevalued in U.S. dollars) at the foreign exchange rates prevailing on the dates of such transactions. Foreign currency translation gains (losses) on investments and income transactions are included in Net realized gain(loss) on foreign currency and in Income, respectively, on the Statements of Comprehensive Income.
g) Forward Foreign Currency Contracts
The Funds may enter into forward foreign currency contracts for either hedging or non-hedging purposes where such activity is consistent with their investment objectives and as permitted by the Canadian securitiesregulatory authorities.
Changes in the fair value of forward foreign currency contracts are included in derivative assets or derivative liabilities on the Statements of Financial Position, and are recorded as an Increase (decrease) in unrealizedappreciation (depreciation) of investments and derivatives during the applicable period on the Statements of Comprehensive Income.
The gain or loss arising from the difference between the value of the original forward foreign currency contract and the value of such contract at close or delivery is realized and recorded as Net realized gain (loss) onforeign currency for Funds that use the forward foreign currency contracts for hedging, or as Derivative income (loss) from forward foreign currency contracts for Funds that do not use the forward foreign currencycontracts for hedging.
h) Futures Contracts
The margin deposits with brokers relating to futures contracts are included in Margin on the Statements of Financial Position. Any change in the margin requirement is settled daily and included in Receivable forportfolio securities sold or Payable for portfolio securities purchased on the Statements of Financial Position.
Any difference between the settlement value at the close of business on each valuation date and the settlement value at the close of business on the previous valuation date is recorded as Derivative income (loss)from futures contracts on the Statements of Comprehensive Income.
i) Options
Premiums paid for purchased call and put options are included in derivative assets and subsequently measured at fair value on the Statements of Financial Position. When a purchased option expires, the Fund willrealize a loss in the amount of the cost of the option. For a closing transaction, the Fund will realize a gain or loss depending on whether the proceeds are greater or less than the premium paid at the time of purchase.When a purchased call option is exercised, the cost of the security purchased is increased by the premium paid at the time of purchase.
Premiums received from writing options are included in derivative liabilities and subsequently measured at fair value on the Statements of Financial Position as initial reductions in the value of investments. Premiumsreceived from writing options that expire unexercised are recorded as realized gains and reported as Net gain (loss) on sale of investments and derivatives on the Statements of Comprehensive Income. For a closingtransaction, if the cost of closing the transaction exceeds the premium received, the Fund will record a realized loss or, if the premium received at the time the option was written is greater than the amount paid, theFund will record a realized gain and are reported as Net gain (loss) on sale of investments and derivatives. If a written put option is exercised, the cost for the security delivered is reduced by the premiums received atthe time the option was written.
j) Securities Lending
A Fund may lend portfolio securities in order to earn additional revenue, which is disclosed on the Statements of Comprehensive Income. The loaned assets of any one Fund are not permitted to exceed 50% of thefair value of the assets of that Fund (excluding collateral debt for the loaned securities). The minimum allowable collateral is 102% of the fair value of the loaned securities as per the requirements of NationalInstrument 81-102- Investment Funds. Collateral can consist of the following:
i) Cash.
ii) Qualified securities;
iii) Irrevocable letters of credit issued by a Canadian financial institution that is not the counterparty, or an affiliate counterparty, of the fund in the transaction, if evidences of indebtedness of the Canadianfinancial institution that are rated as short-term debt by an approved credit rating organization have an approved credit rating.
iv) Securities that are immediately convertible into securities of the same issuer, class, or type, and the same term, as the securities loaned.
The fair value of the loaned securities is determined on the close of any valuation date and any additional required collateral is delivered to the Fund on the next business day. The securities on loan continue to beincluded on the Schedule of Investment Portfolio and are included in the total value on the Statements of Financial Position in Investments (non-derivative financial assets) at fair value. Where applicable, a Fund’ssecurities lending transactions are reported in footnote Securities Lending on the Statements of Financial Position.
k) Multi-Class Structured Funds
The realized and unrealized capital gains or losses, income, and common expenses (other than class-specific operating expenses and management fees) of the Fund are allocated on each valuation date to theunitholders in proportion to the respective prior day’s net asset value, which includes unitholder trades dated for that day, of each class of units at the date on which the allocation is made. All class-specific operatingexpenses and management fees do not require allocation. All class-specific operating expenses are paid by the Manager and are collected from the Funds on a recoverable basis.
l) Loans and Receivables, Other Assets and Liabilities
Loans and Receivables, other assets and liabilities (other than those classified as FVTPL) are recorded at cost, which approximates their fair value, with the exception of net assets attributable to holders of redeemableunits which are presented at the redemption value.x
x..x
m) Legend of Abbreviations
The following is a list of abbreviations (foreign currency translation and others) that may be used on the Schedule of Investment Portfolio:
x
Currency Abbreviations
x..
AED – United Arab Emirates Dirham JPY – Japanese Yen..
ARS – Argentine Peso KRW – South Korean Won..
AUD – Australian Dollar MAD – Morocco Dirham..
BRL – Brazilian Real MXN – Mexican Peso..
CAD – Canadian Dollar MYR – Malaysian Ringgit..
CHF – Swiss Franc NOK – Norwegian Krone..
CLP – Chilean Peso NZD – New Zealand Dollar..
CNY – Chinese Renminbi PEN – Peruvian Nuevo Sol..
COP – Colombian Peso PHP – Philippine Peso..
CZK – Czech Koruna PKR – Pakistan Rupee..
DKK – Danish Krone PLN – Polish Zloty..
EGP – Egyptian Pound RUB – Russian Ruble..
EUR – Euro SEK – Swedish Krona..
GBP – British Pound SGD – Singapore Dollar..
HKD – Hong Kong Dollar THB – Thai Baht..
HUF – Hungarian Forint TRY – New Turkish Lira
15
Notes to Financial Statements p / 5
..
IDR – Indonesian Rupiah TWD – Taiwan Dollar..
ILS – Israeli Shekel USD – United States Dollar..
INR – Indian Rupee VEF – Venezuelan Bolivar Fuerte..
JOD – Jordanian Dinars ZAR – South African Rand..
Other Abbreviations
..
ADR – American Depositary Receipt..
CVO – Contingent Value Obligations..
ETF – Exchange-Traded Fund..
GDR – Global Depositary Receipt Securities..
NVDR – Non-Voting Depositary Receiptxxxxxxxx
n) Standards issued but not yet effective
Standards issued but not yet effective up to the date of issuance of the Funds’ financial statements are listed below. The Funds intend to adopt applicable standards when they become effective.
IFRS 9, Financial Instruments - Classification and Measurement
In July 2014, the IASB issued the final version of IFRS 9 Financial Instruments which reflects all phases of the financial instruments project and replaces IAS 39 Financial Instruments: Recognition and Measurementand all previous versions of IFRS 9. The standard introduces new requirements for classification and measurement, impairment, and hedge accounting. IFRS 9 is effective for annual periods beginning on or afterJanuary 1, 2018, with early application permitted. The Funds are in the process of assessing the impact of IFRS 9.
o) Increase (decrease) in Net Assets Attributable to Holders of Redeemable Units per Unit
Increase (decrease) in net assets attributable to holders of redeemable units per unit of each class is calculated by dividing the Increase (decrease) in net assets attributable to holders of redeemable units (excludingdistributions), as reported on the Statements of Comprehensive Income, by the weighted average number of units in issue during the related period.
3. Valuation of Investments
The valuation date (Valuation Date) for a Fund is any day when the Manager’s head office is open for business. The Manager may, at its discretion, establish other Valuation Dates.
The value of the investments or assets of a Fund is determined as follows:
a) Cash and Other Assets
Cash, accounts receivable, dividends receivable, distributions receivable, and interest receivable are valued at fair value or at their recorded cost, plus or minus any foreign exchange between recognition of the assetby the Fund and the current Valuation Date, which approximates fair value.
b) Bonds, Debentures, and Other Debt Obligations
Bonds, debentures, and other debt obligations are fair valued using the last traded price provided by a recognized vendor upon the close of trading on a Valuation Date, whereby the last traded price falls within thatday’s bid-ask spread. If the last traded price does not fall within that day’s bid-ask spread, the Manager will then determine the price that is most representative of fair value based on the specific facts andcircumstances.
c) Listed Securities, Unlisted Securities, and Fair Value Pricing of Foreign Securities
Any security that is listed or traded on a securities exchange is fair valued using the last traded price, whereby the last traded price falls within that day’s bid-ask spread or, if there is no traded price on that exchangeor the last traded price does not fall within that day’s bid-ask spread and in the case of securities traded on an OTC market, at the fair value as determined by the Manager as an appropriate basis for valuation. In suchsituations, a fair value will be determined by the Manager to establish current value. If any securities are inter-listed or traded on more than one exchange or market, the Manager will use the principal exchange ormarket for the fair value of such securities.
Units of each mutual fund in which a Fund invests will be valued at fair value using the most recent net asset value quoted by the Trustee or Manager of the mutual fund on the Valuation Date.
Unlisted securities are fair valued using the last traded price quoted by a recognized dealer, or the Manager may determine a price that more accurately reflects the fair value of these securities if the Manager feelsthe last traded price does not reflect fair value.
Fair value pricing is designed to avoid stale prices and to provide a more accurate fair value, and may assist in the deterrence of harmful short-term or excessive trading in the Fund. When securities listed or traded onmarkets or exchanges that close prior to North or South American markets or exchanges are valued by the Manager at their fair market value, instead of using quoted or published prices, the prices of such securitiesused to calculate the Fund’s net assets or net asset value may differ from quoted or published prices of such securities.
d) Derivatives
Long positions in options, debt-like securities, and listed warrants are fair valued using the last traded price as established on either their principal trading exchange or by a recognized dealer in such securities,whereby the last traded price falls within that day’s bid-ask spread and the credit rating of each counterparty (as rated by Standard & Poor’s, a division of McGraw Hill Financial, Inc.) meets or exceeds the minimumapproved credit rating.
When any option is written by any Fund, the premium received by the Fund will be reflected as a liability that will be valued at an amount equal to the current fair value of the option that would have the effect ofclosing the position. Any difference resulting from revaluation shall be treated as an unrealized gain or loss on investment; the liability shall be deducted in arriving at the net assets attributable to holders ofredeemable units of the Fund. The securities that are the subject of a written option, if any, will be valued in the manner described above for listed securities.
Futures contracts, forward contracts, or swaps will be valued at fair value of the gain or loss, if any, that would be realized on the Valuation Date if the position in the futures contracts, forward contracts, or swapswere to be closed out.
Margin paid or deposited in respect of futures contracts and forward contracts will be reflected as an account receivable and margin consisting of assets other than cash will be noted as held as collateral.
Other derivatives and margin are fair valued in a manner that the Manager determines to represent their fair value.
e) Restricted Securities
Restricted securities purchased by any Fund will be fair valued in a manner that the Manager determines to represent their fair value.
f) Other Investments
All other investments of the Funds will be fair valued in accordance with the laws of the Canadian securities regulatory authorities where applicable.
The value of any security or other property of a Fund for which a market quotation is not readily available or where the market quotations do not properly reflect the fair value of such securities will be determined bythe Manager by valuing the securities at their fair value. In such situations, fair value will be determined using fair valuation techniques that most accurately reflect their fair value as established by the Manager.
4. Interest in Underlying Funds
The Funds may invest in other investment funds (Underlying Funds). Each Underlying Fund invests in a portfolio of assets to generate returns in the form of investment income and capital appreciation for itsunitholders. Each Underlying Fund finances its operations primarily through the issuance of redeemable units, which are puttable at the unitholder’s option and entitle the unitholder to a proportionate share of theUnderlying Fund’s net assets. The funds’ interests in Underlying Funds held in the form of redeemable units, are reported in their Schedule of Investments at fair value, which represents the Funds’ maximum exposureon those investments. The Funds' interests in Underlying Funds as at the prior year period ends are presented in the Financial Instruments Risks - Concentration Risk section in the Supplemental Schedule to Schedule
16
p / 6 Notes to Financial Statements
of Investment Portfolio. Distributions earned from Underlying Funds are included in “Investment Income” in the Statements of Comprehensive Income. The total realized and change in unrealized gains (losses) arisingfrom Underlying Funds are also included in the Statement of Comprehensive Income. The Funds do not provide any additional significant financial or other support to Underlying Funds.
Where applicable, the table “Interests in Underlying Funds” is presented as part of the Supplemental Schedule to Schedule of Investment Portfolio provides additional information on the Funds’ investments inUnderlying Funds where the ownership interest exceeds 20% of each Underlying Fund.
5. Redeemable Units Issued and Outstanding
Each Fund is permitted to have an unlimited number of classes of units and may issue an unlimited number of units of each class. The outstanding units represent the net assets attributable to holders of redeemableunits of a Fund. Each unit has no par value and the value of each unit is the net asset value as determined on each valuation date. Settlement of the cost for units issued is completed as per security regulations inplace at the time of issue. Distributions made by a Fund and reinvested by unitholders in additional units also constitute issued redeemable units of a Fund.
Units are redeemed at the net assets attributable to holders of a redeemable unit per unit of a Fund. A right to redeem units of a Fund may be suspended with the approval of the Canadian securities regulatoryauthorities or when normal trading is suspended on a stock, options, or futures exchange within Canada or outside of Canada on which securities or derivatives that make up more than 50% of the value or underlyingexposure of the total assets of a Fund, not including any liabilities of a Fund, are traded and when those securities or derivatives are not traded on any other exchange that represents a reasonably practical alternativefor a Fund. The Fund is not subject to any externally imposed capital requirements.
The capital received by a Fund is utilized within the respective investment mandate of the Fund. This includes the ability to make liquidity available to satisfy unitholder unit redemption requirements upon aunitholder’s request.
Changes in issued and outstanding units for the years ended December 31, 2015 and 2014 can be found on the Statements of Changes in Net Assets Attributable to Holders of Redeemable Units.x
6. Management Fees and Operating Expenses
Management fees are based on the net asset value of the Funds and are calculated daily. Management fees are paid to the Manager in consideration for providing, or arranging for the provision of, management,distribution, and portfolio advisory services. The maximum annual management fee expressed as a percentage of the average net asset value for each class of units of the Fund is reported in footnote MaximumChargeable Annual Management Fee Rates on the Statements of Comprehensive Income. For Class O units, management fees are negotiated with and paid by, or as directed by, unitholders, or dealers anddiscretionary managers on behalf of unitholders.
In addition to the management fees, the Funds are responsible for all expenses relating to the operation and conduct of the business of the Funds, including interest, operating, and administrative costs (other thanadvertising and promotional expenses, which are the responsibility of the Manager), brokerage fees, commissions, spreads, regulatory fees, Independent Review Committee fees, taxes, audit and legal fees andexpenses, safekeeping and custodial fees, investor servicing costs, and costs of unitholder reports, prospectuses, and other reports. All class-specific operating expenses are paid by the Manager and recovered fromthe Funds. The Funds do not pay a fee to the Trustee.
The Manager may recover from a Fund less than the actual class-specific operating expenses paid by the Manager, resulting in the Manager absorbing class-specific expenses. The Manager may also charge to a Fundless than the maximum management fee in footnote Maximum Chargeable Annual Management Fee Rates on the Statements of Comprehensive Income, resulting in the Manager waiving management fees.
At its sole discretion, the Manager may stop absorbing class-specific operating expenses and/or waiving management fees at any time. Class-specific operating expenses absorbed and/or management fees waivedby the Manager are disclosed on the Statements of Comprehensive Income.
In some cases, the Manager may charge management fees to a Fund that are less than the management fees the Manager is entitled to charge in respect of certain investors in a Fund. The difference in the amount ofthe management fees will be paid out by the Fund to the applicable investors as a distribution of additional units of the Fund (Management Fee Distributions). Management Fee Distributions are negotiable betweenthe Manager and the investor and are dependent primarily on the size of the investor’s investment in the Fund. Management Fee Distributions paid to qualified investors do not adversely impact the Fund or any of theFund’s other investors. The Manager may increase or decrease the amount of Management Fee Distributions to certain investors from time to time.
Certain Funds may invest in units of other Funds (the Underlying Funds). Where a Fund invests in units of an Underlying fund, the Fund does not pay duplicate management fees on the portion of its assets that it investsin units of the Underlying Fund. In addition, the Fund will not pay duplicate sales fees or redemption fees with respect to the purchase or redemption by it of units of the Underlying Fund. Some of the Underlying Fundsheld by the Funds may offer Management Fee Distributions. Such Management Fee Distributions of an Underlying Fund will be paid out as required for taxable distribution payments by a Fund. The manager of anUnderlying Fund may, in some cases, waive a portion of an Underlying Fund’s management fee and/or absorb a portion of an Underlying Fund’s operating expenses.
7. Income Taxes and Withholding Taxes
The Funds qualify as mutual fund trusts under the Income Tax Act (Canada). No income tax is payable by the Funds on net income and/or net realized capital gains that are distributed to unitholders. In addition, incometaxes payable on undistributed net realized capital gains are refundable on a formula basis when units of the Funds are redeemed. Sufficient net income and realized capital gains of the Funds have been, or will be,distributed to the unitholders such that no tax is payable by the Funds and, accordingly, no provision for income taxes has been made in the financial statements. Occasionally, a Fund may pay distributions in excess ofthe net income and net realized capital gains of the Fund. This excess distribution is called a return of capital and is non-taxable to the unitholder. However, a return of capital reduces the average cost of theunitholder’s units for tax purposes, which may result in a capital gain to the unitholder to the extent the average cost becomes less than zero.
CIBC U.S. Dollar Money Market Fund, CIBC U.S. Dollar Managed Income Portfolio, CIBC U.S. Dollar Managed Balanced Portfolio, and CIBC U.S. Dollar Managed Growth Portfolio may realize net foreign currency gainsand losses on the translation of their net realized capital gains to Canadian dollars for tax purposes. These gains will be distributed to investors annually unless these Funds elect to retain them, with the result that thetax would be payable by the Funds.
Non-capital losses that arose in 2006 and thereafter are available to be carried forward for 20 years.
Capital losses for income tax purposes may be carried forward indefinitely and applied against capital gains realized in future years. Where applicable, a Fund’s net capital and non-capital losses are reported infootnote Net Capital and Non-Capital Losses on the Statements of Changes in Net Assets Attributable to Holders of Redeemable Units.
The Funds have a taxation year-end of December 15 (except for CIBC Canadian T-Bill Fund, CIBC Money Market Fund, CIBC U.S. Dollar Money Market Fund which have a taxation year-end of December 31).
The Funds currently incur withholding taxes imposed by certain countries on investment income and capital gains. Such income and gains are recorded on a gross basis and the related withholding taxes are shown asa separate expense in the Statements of Comprehensive Income.
8. Brokerage Commissions and Fees
The total commissions paid by the Funds to brokers in connection with portfolio transactions are reported in footnote Brokerage Commissions and Fees on the Statements of Comprehensive Income of each Fund whereapplicable. In allocating brokerage business, consideration may be given by the portfolio sub-advisors of the Funds to dealers that furnish research, statistical analysis, and other securities to portfolio sub-advisors thatprocess trades through such dealers (referred to in the industry as “soft dollar” arrangements). These goods and services are paid for with a portion of brokerage commissions and assist the portfolio sub-advisors withtheir investment decision-making services to the Funds. The total soft dollar payments paid by the Funds to brokers are reported in footnote Brokerage Commissions and Fees on the Statements of ComprehensiveIncome of each Fund. In addition, the Manager may enter into commission recapture arrangements with certain dealers with respect to the Fund. Any commission recaptured will be paid to the applicable Fund.
Fixed income and certain other securities are transacted in an OTC market, where participants are dealing as principals. Such securities are generally traded on a net basis and do not normally involve brokeragecommissions, but will typically include a “spread” (being the difference between the bid and the offer prices on the security of the applicable marketplace).
Spreads associated with fixed income securities trading and certain other securities are not ascertainable and, for that reason, are not included in the dollar amounts. In addition, the soft dollar amounts only includethe value of research and other services supplied by a third party to CIBC Asset Management Inc. (CAMI or the Portfolio Advisor) and any portfolio sub-advisors, as the value of the services supplied to the PortfolioAdvisor and any portfolio sub-advisors by the dealer is not ascertainable. When these services benefit more than one Fund, the costs are allocated among the Funds based on transaction activity or some other fairbasis as determined by the Portfolio Advisor and any portfolio sub-advisors.x
9. Related Party Transactions
CIBC and its affiliates have the following roles and responsibilities with respect to the Funds and receive the fees described below in connection with their roles and responsibilities. The Funds may hold securities ofCIBC. CIBC and its affiliates may also be involved in underwriting or lending to issuers of securities that may be held by the Funds, have purchased or sold securities from or to the Funds while acting as principal, havepurchased or sold securities from or to the Funds on behalf of another investment fund managed by CIBC or an affiliate, and also may have been involved as a counterparty to derivative transactions. Management feespayable and other accrued expenses on the Statements of Financial Position are amounts generally payable to a related party of the Fund.
17
Notes to Financial Statements p / 7
Manager, Trustee, Portfolio Advisor, and certain Portfolio Sub-Advisors of the Funds
CIBC is the Manager, CIBC Trust Corporation is the Trustee, and CAMI is the portfolio advisor of each of the Funds. American Century Investment Management, Inc. (ACI) is a portfolio sub-advisor to certain Funds.Although not an affiliate, CIBC currently owns a 41% equity interest in ACI. On December 21, 2015, CIBC announced that it entered into a definitive agreement to sell its minority position in ACI. The sale is expected tobe completed in the first half of 2016 and is subject to regulatory approval.
The Manager also arranges for fund administrative services (other than advertising and promotional, which are the responsibility of the Manager), legal, investor servicing, and costs of unitholder reports,prospectuses, and other reports. The Manager is the registrar and transfer agent for the Funds and provides, or arranges for the provision of, all other administrative services required by the Funds. The dollar amount(including all applicable taxes) of all fund administrative expenses (net of absorptions) that the Manager recovers from a Fund is reported in footnote Administrative and Other Fund Operating Expenses on theStatements of Comprehensive Income.
Brokerage Arrangements and Soft Dollars
The Portfolio Advisor generally delegates trading and execution authority to the portfolio sub-advisors.
The Portfolio Advisor and portfolio sub-advisors make decisions, including the selection of markets and dealers and the negotiation of commissions, with respect to the purchase and sale of portfolio securities, certainderivative products (including futures), and the execution of portfolio transactions. Brokerage business may be allocated by the Portfolio Advisor or portfolio sub-advisors, including ACI, to CIBC World Markets Inc. andCIBC World Markets Corp., each a subsidiary of CIBC. The total commissions paid to related brokers in connection with portfolio transactions are reported in footnote Brokerage Commissions and Fees on theStatements of Comprehensive Income of each Fund.
CIBC World Markets Inc. and CIBC World Markets Corp. may also earn spreads on the sale of fixed income and other securities, and certain derivative products (including forwards) to the Funds. Dealers, includingCIBC World Markets Inc. and CIBC World Markets Corp., may furnish goods and services, other than order execution, to the Portfolio Advisor and portfolio sub-advisors, including ACI, that process trades through them(referred to in the industry as “soft dollar” arrangements). These goods and services are paid for with a portion of brokerage commissions and assist the Portfolio Advisor and portfolio sub-advisors with theirinvestment decision-making services to the Fund or relate directly to executing portfolio transactions on behalf of the Fund. As per terms of the portfolio sub-advisory agreements, such soft dollar arrangements are incompliance with applicable laws. Custodial fees directly related to portfolio transactions incurred by a Fund, otherwise payable by the Fund, shall be paid by CAMI, and/or dealer(s) directed by CAMI, up to the amountof the credits generated under soft dollar arrangements from trading on behalf of the Fund, or a portion of the Fund, during that month. The total soft dollar payments paid by the Fund to related brokers are reported infootnote Brokerage Commissions and Fees on the Statements of Comprehensive Income of each Fund. In addition, the Manager may enter into commission recapture arrangements with certain dealers with respect tothe Funds. Any commission recaptured will be paid to the relevant Fund.
Spreads associated with fixed income, other securities, and certain derivative products (including forwards) are not ascertainable and, for that reason, are not included in the dollar values. In addition, the soft dollaramounts only include the value of research and other services supplied by a third party to the Portfolio Advisor and portfolio sub-advisors, as the value of the services supplied to the Portfolio Advisor and portfoliosub-advisors by the dealer is not ascertainable. When these services benefit more than one Fund, the costs are allocated among the Funds based on transaction activity or some other fair basis as determined by thePortfolio Advisor and portfolio sub-advisors.
Custodian
The custodian holds all cash and securities for the Funds and ensures that those assets are kept separate from any other cash or securities that the custodian might be holding. The custodian also provides otherservices to the Funds including record keeping and processing of foreign exchange transactions. CIBC Mellon Trust Company is the custodian of the Funds (the Custodian). The Custodian may hire sub-custodians forthe Funds. The fees and spreads for services of the Custodian directly related to the execution of portfolio transactions by a Fund, or a portion of a Fund, are paid by CAMI and/or dealer(s) directed by CAMI up to theamount of the credits generated under soft dollar arrangements from trading on behalf of the Funds during that month. All other fees for the services of the Custodian are paid by the Manager, and charged to theFunds on a recoverable basis. CIBC owns a 50% interest in CIBC Mellon Trust Company.
Service Provider
CIBC Mellon Global Securities Services Company (CIBC GSS) provides certain services to the Funds, including securities lending, fund accounting and reporting, and portfolio valuation. Such servicing fees are paid bythe Manager and charged to the Funds on a recoverable basis. CIBC indirectly owns a 50% interest in CIBC GSS.
The dollar amount paid by the Funds (including all applicable taxes) to CIBC Mellon Trust Company for custodial fees (net of absorptions) and to CIBC GSS for securities lending, fund accounting and reporting, andportfolio valuation (net of absorptions) for the years ended December 31, 2015 and 2014 is reported in footnote Service Provider on the Statements of Comprehensive Income.
10. Hedging
Certain foreign currency denominated positions have been hedged, or partially hedged, by forward foreign currency contracts as part of the investment strategies of certain Funds. These hedges are indicated by ahedging reference number on the Schedule of Investment Portfolio and a corresponding hedging reference number on the Schedule of Derivative Assets and Liabilities - Forward Foreign Currency Contracts for thoseFunds.
11. Collateral on Specified Derivatives
Short-term investments may be used as collateral for futures contracts outstanding with brokers.x
18
Independent Auditors’ Report
x
To the Unitholders ofxxxxxxxxx
xx
x..
CIBC Canadian T-Bill Fund CIBC Canadian Real Estate Fund..
CIBC Money Market Fund CIBC Precious Metals Fund..
CIBC U.S. Dollar Money Market Fund CIBC Global Technology Fund..
CIBC Short-Term Income Fund CIBC Canadian Short-Term Bond Index Fund..
CIBC Canadian Bond Fund CIBC Canadian Bond Index Fund..
CIBC Monthly Income Fund CIBC Global Bond Index Fund..
CIBC Global Bond Fund CIBC Balanced Index Fund..
CIBC Global Monthly Income Fund CIBC Canadian Index Fund..
CIBC Balanced Fund CIBC U.S. Broad Market Index Fund..
CIBC Dividend Income Fund CIBC U.S. Index Fund..
CIBC Dividend Growth Fund CIBC International Index Fund..
CIBC Canadian Equity Fund CIBC European Index Fund..
CIBC Canadian Equity Value Fund CIBC Emerging Markets Index Fund..
CIBC Canadian Small-Cap Fund CIBC Asia Pacific Index Fund..
CIBC U.S. Equity Fund CIBC Nasdaq Index Fund..
CIBC U.S. Small Companies Fund CIBC Managed Income Portfolio..
CIBC Global Equity Fund CIBC Managed Income Plus Portfolio..
CIBC International Equity Fund CIBC Managed Balanced Portfolio..
CIBC European Equity Fund CIBC Managed Monthly Income Balanced Portfolio..
CIBC Emerging Markets Fund CIBC Managed Balanced Growth Portfolio..
CIBC Asia Pacific Fund CIBC Managed Growth Portfolio..
CIBC Latin American Fund CIBC Managed Aggressive Growth Portfolio..
CIBC International Small Companies Fund CIBC U.S. Dollar Managed Income Portfolio..
CIBC Financial Companies Fund CIBC U.S. Dollar Managed Balanced Portfolio..
CIBC Canadian Resources Fund CIBC U.S. Dollar Managed Growth Portfolio..
CIBC Energy Fund....
(collectively, the “Funds”)xx
We have audited the accompanying financial statements of the Funds, which comprise the statements of financial position as at December 31, 2015 and 2014, and the statements of comprehensive income, changes innet assets attributable to holders of redeemable units and cash flows for the years then ended, and a summary of significant accounting policies and other explanatory information.
Management's responsibility for the financial statementsManagement is responsible for the preparation and fair presentation of these financial statements in accordance with International Financial Reporting Standards, and for such internal control as managementdetermines is necessary to enable the preparation of financial statements that are free from material misstatement, whether due to fraud or error.
Auditors’ responsibilityOur responsibility is to express an opinion on these financial statements based on our audits. We conducted our audits in accordance with Canadian generally accepted auditing standards. Those standards requirethat we comply with ethical requirements and plan and perform the audit to obtain reasonable assurance about whether the financial statements are free from material misstatement.
An audit involves performing procedures to obtain audit evidence about the amounts and disclosures in the financial statements. The procedures selected depend on the auditors’ judgment, including the assessmentof the risks of material misstatement of the financial statements, whether due to fraud or error. In making those risk assessments, the auditors consider internal control relevant to the Funds' preparation and fairpresentation of the financial statements in order to design audit procedures that are appropriate in the circumstances, but not for the purpose of expressing an opinion on the effectiveness of the Funds' internalcontrol. An audit also includes evaluating the appropriateness of accounting policies used and the reasonableness of accounting estimates made by management, as well as evaluating the overall presentation of thefinancial statements.
We believe that the audit evidence we have obtained in our audits is sufficient and appropriate to provide a basis for our audit opinion.
OpinionIn our opinion, the financial statements present fairly, in all material respects, the financial position of each of the Funds as at December 31, 2015 and 2014, and their financial performance and their cash flows for theyears then ended in accordance with International Financial Reporting Standards.xxxxxxxx
Toronto, CanadaMarch 11, 2016
19

This page is intentionally left blank.
“Standard & Poor’s®”, "S&P®", and “S&P/TSX Composite” are trademarks of Standard & Poor's and have been licensed for use by CIBC. "TSX" is a trademark of TSX, Inc. and hasbeen licensed for use by Standard & Poor’s. The Fund is not sponsored, endorsed, sold, or promoted by Standard & Poor's or TSX, Inc. and neither Standard & Poor’s nor TSX, Inc.make any representation regarding the advisability of investing in the Fund.

CIBC Mutual FundsCIBC Family of Managed Portfolios
CIBC
18 York Street, Suite 1300Toronto, Ontario
M5J 2T8
CIBC Securities Inc.1-800-465-3863
Websitewww.cibc.com/mutualfunds
CIBC Securities Inc. is a wholly-owned subsidiary of CIBC and is the principal distributor of the CIBC Mutual Funds and the CIBC Family of Managed Portfolios. CIBC Family ofManaged Portfolios are mutual funds that primarily invest in other CIBC Mutual Funds. To obtain a copy of the simplified prospectus, call CIBC Securities Inc. at 1-800-465-3863 or askyour advisor.