Embed Size (px)
Citation preview

CIBC Investor Presentation
February 23rd, 2017
First Quarter, 2017

Forward-Looking StatementsA NOTE ABOUT FORWARD-LOOKING STATEMENTS: From time to time, we make written or oral forward-looking statements within the meaning of certain securities laws, including in thisreport, in other filings with Canadian securities regulators or the SEC and in other communications. All such statements are made pursuant to the “safe harbour” provisions of, and areintended to be forward-looking statements under applicable Canadian and U.S. securities legislation, including the U.S. Private Securities Litigation Reform Act of 1995. These statementsinclude, but are not limited to, statements made in the “Overview – Financial results”, “Overview – Significant events”, “Overview – Outlook for calendar year 2017”, “Financial condition –Capital resources”, “Management of risk – Risk overview”, “Management of risk – Credit risk”, “Management of risk – Market risk”, “Management of risk – Liquidity risk”, “Accounting andcontrol matters – Critical accounting policies and estimates”, and “Accounting and control matters – Regulatory developments” sections of this report and other statements about ouroperations, business lines, financial condition, risk management, priorities, targets, ongoing objectives, strategies, the regulatory environment in which we operate and outlook for calendaryear 2017 and subsequent periods. Forward-looking statements are typically identified by the words “believe”, “expect”, “anticipate”, “intend”, “estimate”, “forecast”, “target”,“objective” and other similar expressions or future or conditional verbs such as “will”, “should”, “would” and “could”. By their nature, these statements require us to make assumptions,including the economic assumptions set out in the “Overview – Outlook for calendar year 2017” section of this report, and are subject to inherent risks and uncertainties that may be generalor specific. A variety of factors, many of which are beyond our control, affect our operations, performance and results, and could cause actual results to differ materially from theexpectations expressed in any of our forward-looking statements. These factors include: credit, market, liquidity, strategic, insurance, operational, reputation and legal, regulatory andenvironmental risk; the effectiveness and adequacy of our risk management and valuation models and processes; legislative or regulatory developments in the jurisdictions where weoperate, including the Dodd-Frank Wall Street Reform and Consumer Protection Act and the regulations issued and to be issued thereunder, the Organisation for Economic Co-operation andDevelopment Common Reporting Standard, and regulatory reforms in the United Kingdom and Europe, the Basel Committee on Banking Supervision’s global standards for capital and liquidityreform, and those relating to the payments system in Canada; amendments to, and interpretations of, risk-based capital guidelines and reporting instructions, and interest rate and liquidityregulatory guidance; the resolution of legal and regulatory proceedings and related matters; the effect of changes to accounting standards, rules and interpretations; changes in ourestimates of reserves and allowances; changes in tax laws; changes to our credit ratings; political conditions and developments, including changes relating to economic or trade matters; thepossible effect on our business of international conflicts and the war on terror; natural disasters, public health emergencies, disruptions to public infrastructure and other catastrophicevents; reliance on third parties to provide components of our business infrastructure; potential disruptions to our information technology systems and services; increasing cyber securityrisks which may include theft of assets, unauthorized access to sensitive information, or operational disruption; social media risk; losses incurred as a result of internal or external fraud;anti-money laundering; the accuracy and completeness of information provided to us concerning clients and counterparties; the failure of third parties to comply with their obligations to usand our affiliates or associates; intensifying competition from established competitors and new entrants in the financial services industry including through internet and mobile banking;technological change; global capital market activity; changes in monetary and economic policy; currency value and interest rate fluctuations, including as a result of market and oil pricevolatility; general business and economic conditions worldwide, as well as in Canada, the U.S. and other countries where we have operations, including increasing Canadian household debtlevels and global credit risks; our success in developing and introducing new products and services, expanding existing distribution channels, developing new distribution channels andrealizing increased revenue from these channels; changes in client spending and saving habits; our ability to attract and retain key employees and executives; our ability to successfullyexecute our strategies and complete and integrate acquisitions and joint ventures; the risk that expected synergies and benefits of the acquisition of PrivateBancorp, Inc. will not berealized within the expected time frame or at all or the possibility that the acquisition does not close when expected or at all because required regulatory, shareholder or other approvalsare not received or other conditions to the closing are not satisfied on a timely basis or at all; and our ability to anticipate and manage the risks associated with these factors. This list is notexhaustive of the factors that may affect any of our forward-looking statements. These and other factors should be considered carefully and readers should not place undue reliance on ourforward-looking statements. Any forward-looking statements contained in this report represent the views of management only as of the date hereof and are presented for the purpose ofassisting our shareholders and financial analysts in understanding our financial position, objectives and priorities and anticipated financial performance as at and for the periods ended onthe dates presented, and may not be appropriate for other purposes. We do not undertake to update any forward-looking statement that is contained in this report or in othercommunications except as required by law.
Investor Relations contacts:John Ferren, Senior Vice-President 416 980-2088Investor Relations Fax Number 416 980-5028Visit the Investor Relations section at www.cibc.com
2

CIBC OverviewVictor DodigPresident and Chief Executive Officer

First Quarter, 2017 Financial ReviewKevin GlassSenior Executive Vice-President and Chief Financial Officer
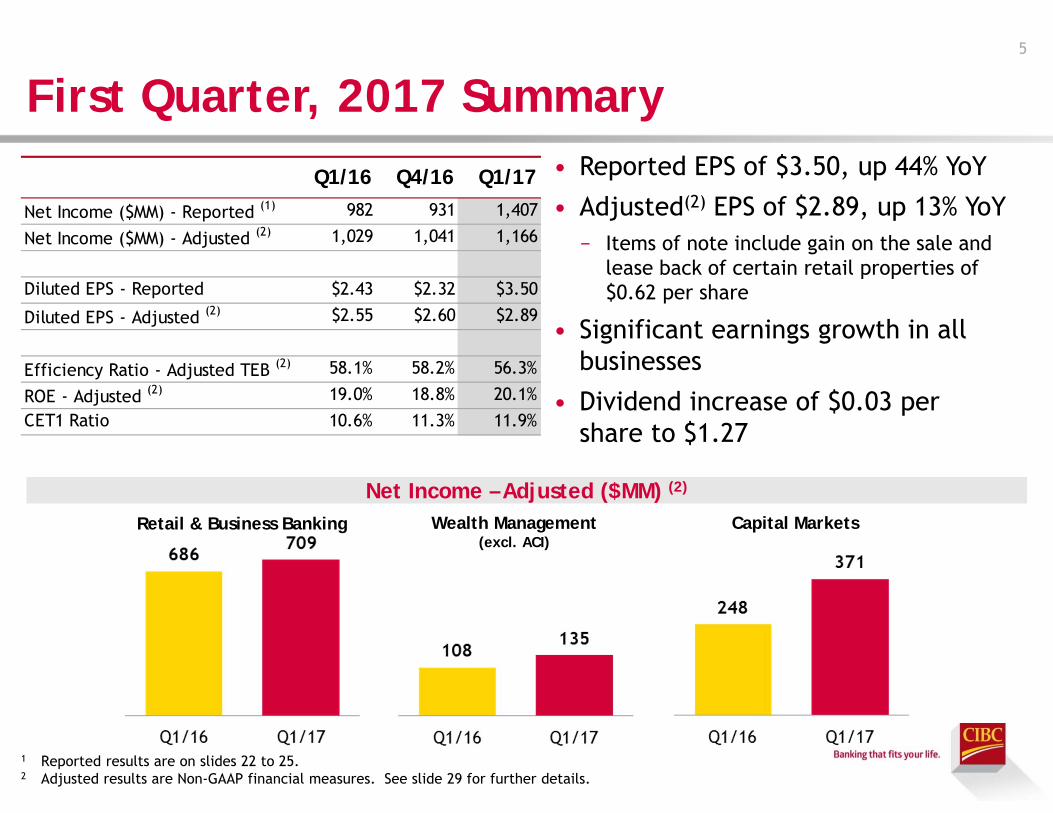
First Quarter, 2017 Summary• Reported EPS of $3.50, up 44% YoY
• Adjusted(2) EPS of $2.89, up 13% YoY− Items of note include gain on the sale and
lease back of certain retail properties of $0.62 per share
• Significant earnings growth in all businesses
• Dividend increase of $0.03 per share to $1.27
5
Net Income – Adjusted ($MM) (2)
Retail & Business Banking Wealth Management(excl. ACI)
Capital Markets
1 Reported results are on slides 22 to 25.2 Adjusted results are Non-GAAP financial measures. See slide 29 for further details.
Q1/16 Q4/16 Q1/17
Net Income ($MM) - Reported (1) 982 931 1,407
Net Income ($MM) - Adjusted (2) 1,029 1,041 1,166
Diluted EPS - Reported $2.43 $2.32 $3.50
Diluted EPS - Adjusted (2) $2.55 $2.60 $2.89
Efficiency Ratio - Adjusted TEB (2) 58.1% 58.2% 56.3%
ROE - Adjusted (2) 19.0% 18.8% 20.1%CET1 Ratio 10.6% 11.3% 11.9%
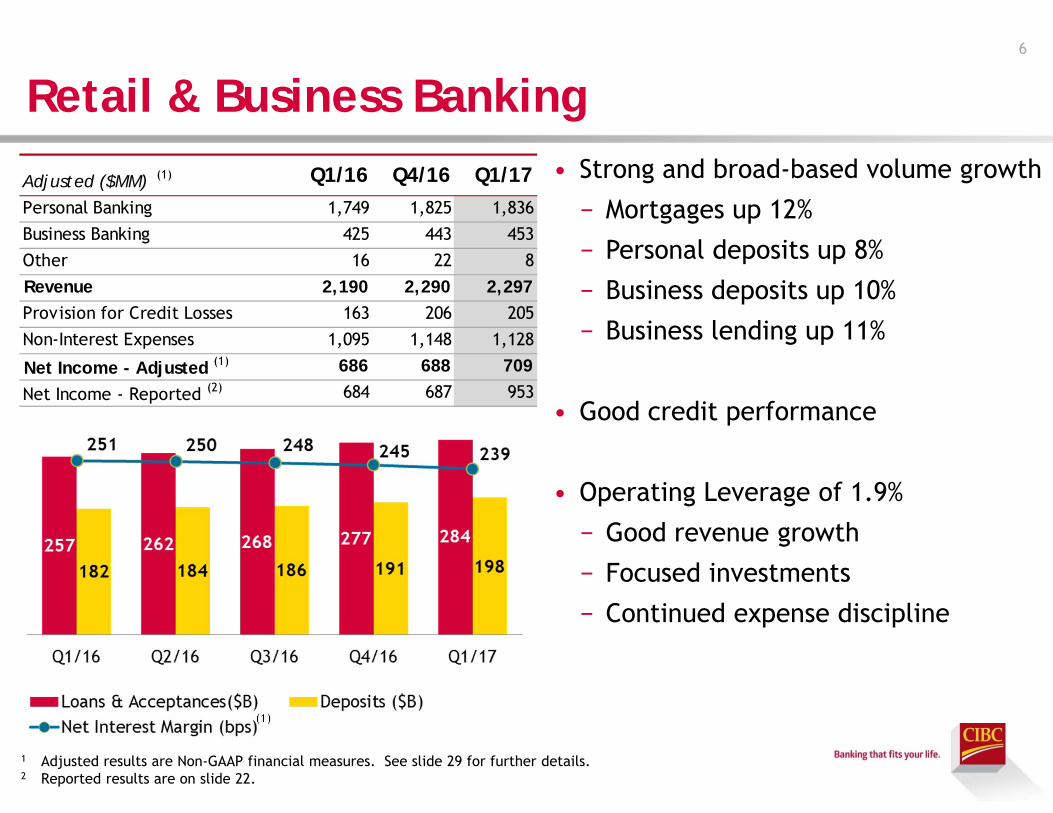
Retail & Business Banking• Strong and broad-based volume growth
− Mortgages up 12%
− Personal deposits up 8%
− Business deposits up 10%
− Business lending up 11%
• Good credit performance
• Operating Leverage of 1.9%
− Good revenue growth
− Focused investments
− Continued expense discipline
6
(1)
1 Adjusted results are Non-GAAP financial measures. See slide 29 for further details.2 Reported results are on slide 22.
Adjusted ($MM) (1) Q1/16 Q4/16 Q1/17Personal Banking 1,749 1,825 1,836 Business Banking 425 443 453 Other 16 22 8 Revenue 2,190 2,290 2,297 Provision for Credit Losses 163 206 205 Non-Interest Expenses 1,095 1,148 1,128
Net Income - Adjusted (1) 686 688 709
Net Income - Reported (2) 684 687 953
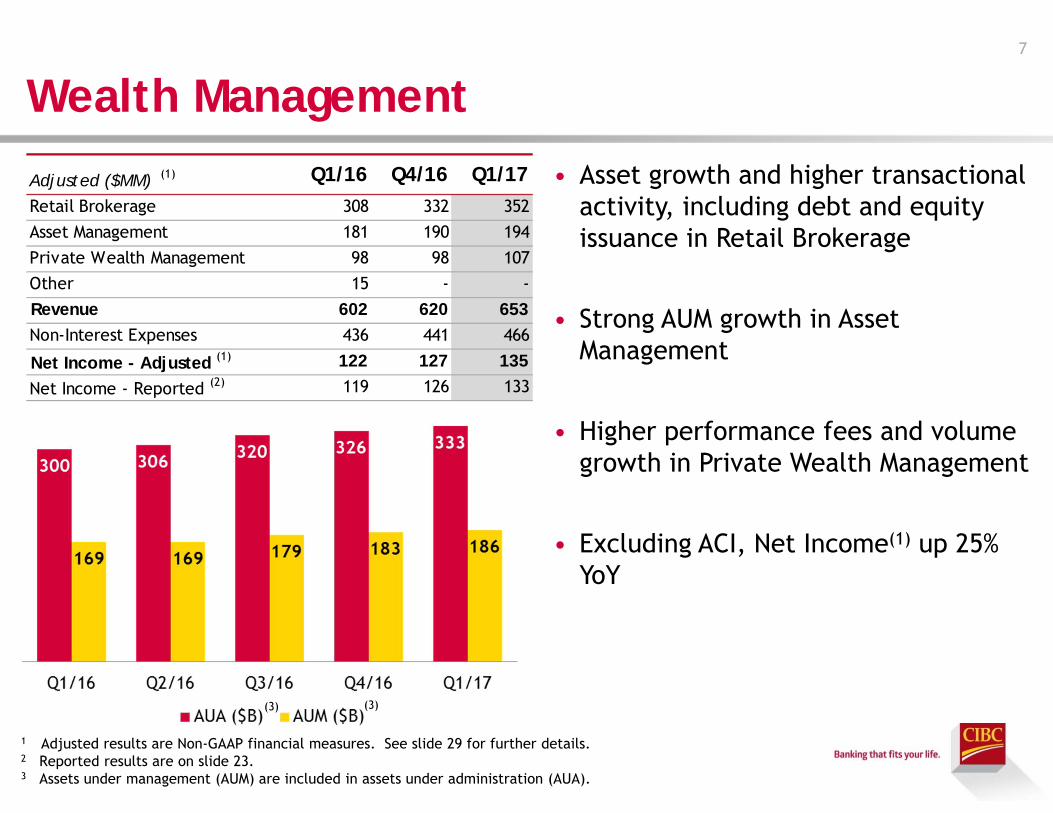
Wealth Management• Asset growth and higher transactional
activity, including debt and equity issuance in Retail Brokerage
• Strong AUM growth in Asset Management
• Higher performance fees and volume growth in Private Wealth Management
• Excluding ACI, Net Income(1) up 25% YoY
7
1 Adjusted results are Non-GAAP financial measures. See slide 29 for further details.2 Reported results are on slide 23.3 Assets under management (AUM) are included in assets under administration (AUA).
(3)(3)
Adjusted ($MM) (1) Q1/16 Q4/16 Q1/17Retail Brokerage 308 332 352 Asset Management 181 190 194 Private Wealth Management 98 98 107 Other 15 - -Revenue 602 620 653 Non-Interest Expenses 436 441 466
Net Income - Adjusted (1) 122 127 135
Net Income - Reported (2) 119 126 133
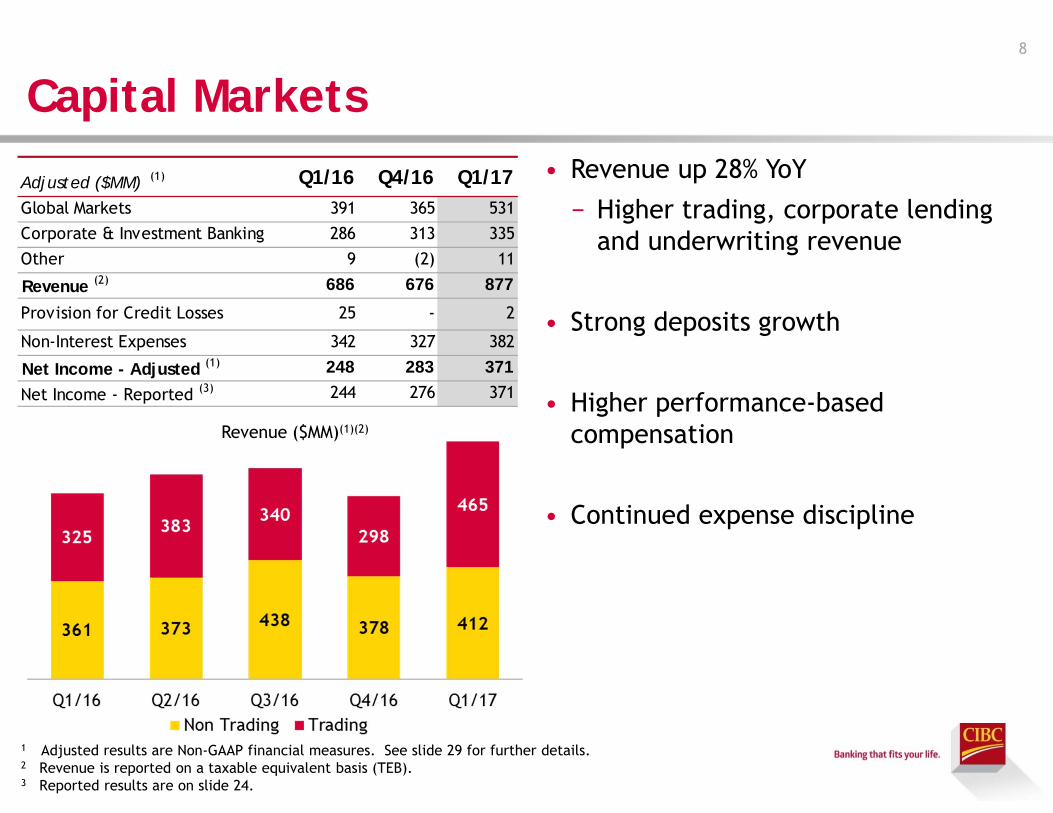
Capital Markets• Revenue up 28% YoY
− Higher trading, corporate lending and underwriting revenue
• Strong deposits growth
• Higher performance-based compensation
• Continued expense discipline
8
1 Adjusted results are Non-GAAP financial measures. See slide 29 for further details.2 Revenue is reported on a taxable equivalent basis (TEB).3 Reported results are on slide 24.
Revenue ($MM)(1)(2)
Adjusted ($MM) (1) Q1/16 Q4/16 Q1/17Global Markets 391 365 531 Corporate & Investment Banking 286 313 335 Other 9 (2) 11
Revenue (2) 686 676 877
Provision for Credit Losses 25 - 2
Non-Interest Expenses 342 327 382
Net Income - Adjusted (1) 248 283 371
Net Income - Reported (3) 244 276 371
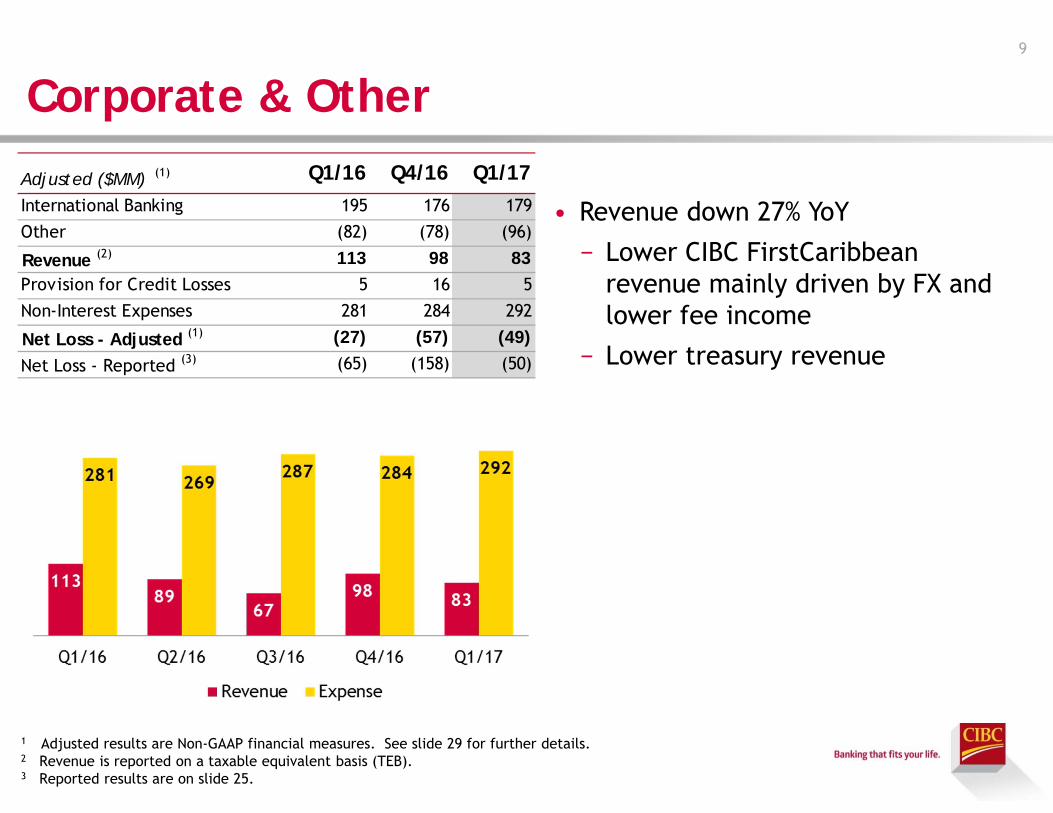
Corporate & Other
• Revenue down 27% YoY
− Lower CIBC FirstCaribbeanrevenue mainly driven by FX and lower fee income
− Lower treasury revenue
9
1 Adjusted results are Non-GAAP financial measures. See slide 29 for further details.2 Revenue is reported on a taxable equivalent basis (TEB).3 Reported results are on slide 25.
Adjusted ($MM) (1) Q1/16 Q4/16 Q1/17International Banking 195 176 179 Other (82) (78) (96)
Revenue (2) 113 98 83 Provision for Credit Losses 5 16 5 Non-Interest Expenses 281 284 292
Net Loss - Adjusted (1) (27) (57) (49)
Net Loss - Reported (3) (65) (158) (50)
10
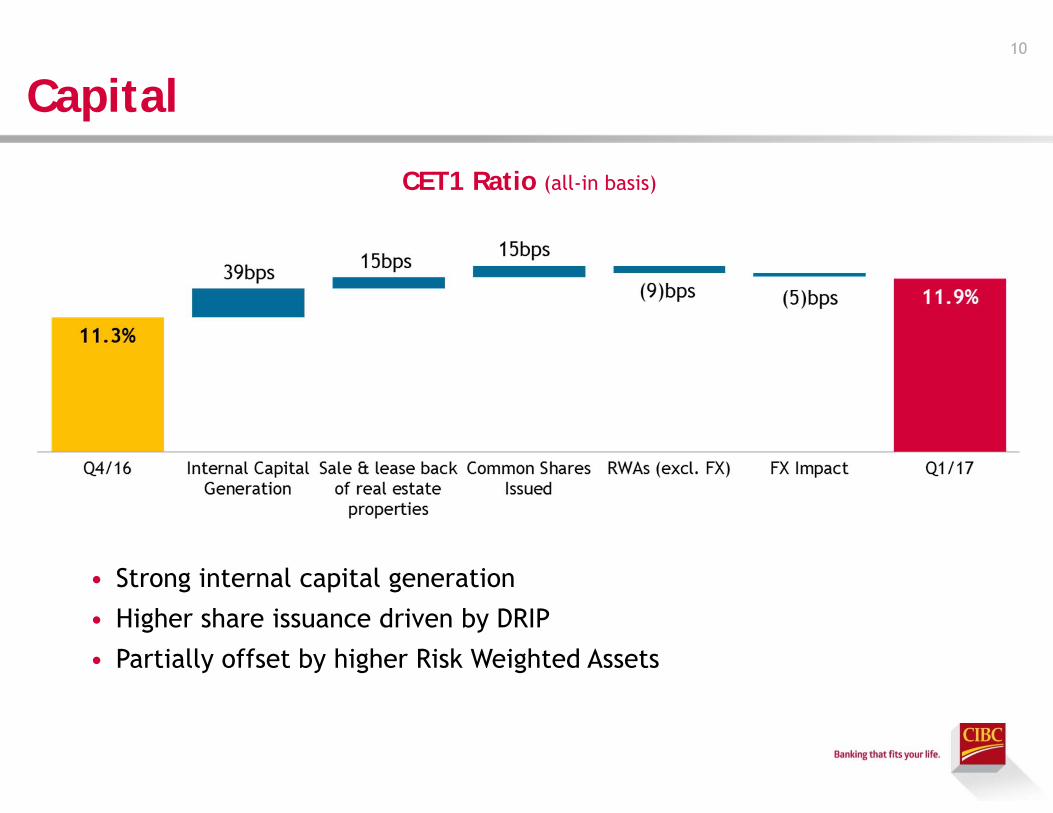
CET1 Ratio (all-in basis)
Capital
• Strong internal capital generation
• Higher share issuance driven by DRIP
• Partially offset by higher Risk Weighted Assets
First Quarter, 2017Risk ReviewLaura Dottori-AttanasioSenior Executive Vice-President and Chief Risk Officer
193
284
203 222 212
0.26%
0.38%
0.26% 0.27% 0.26%
Q1/16 Q2/16 Q3/16 Q4/16 Q1/17
Adjusted PCL Rate (Impaired Loans)
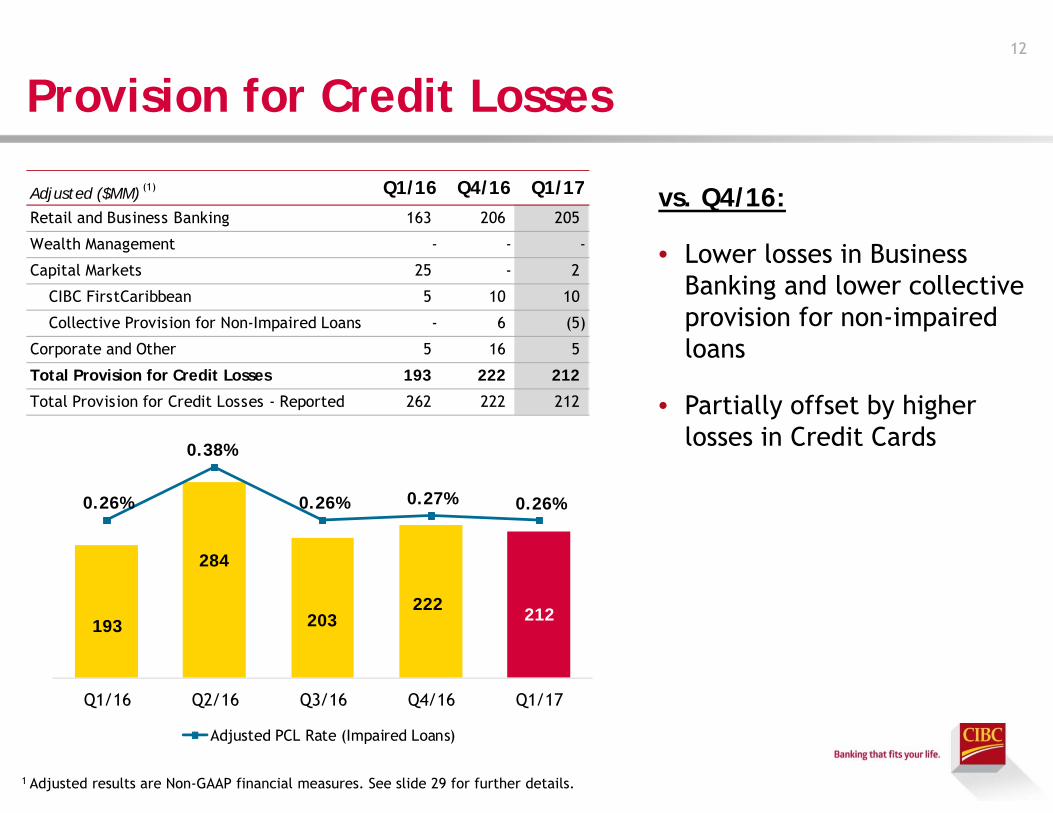
Provision for Credit Losses
1 Adjusted results are Non-GAAP financial measures. See slide 29 for further details.
vs. Q4/16:
• Lower losses in Business Banking and lower collective provision for non-impaired loans
• Partially offset by higher losses in Credit Cards
12
Adjusted ($MM) (1) Q1/16 Q4/16 Q1/17Retail and Business Banking 163 206 205
Wealth Management - - -
Capital Markets 25 - 2
CIBC FirstCaribbean 5 10 10
Collective Provision for Non-Impaired Loans - 6 (5)
Corporate and Other 5 16 5
Total Provision for Credit Losses 193 222 212
Total Provision for Credit Losses - Reported 262 222 212
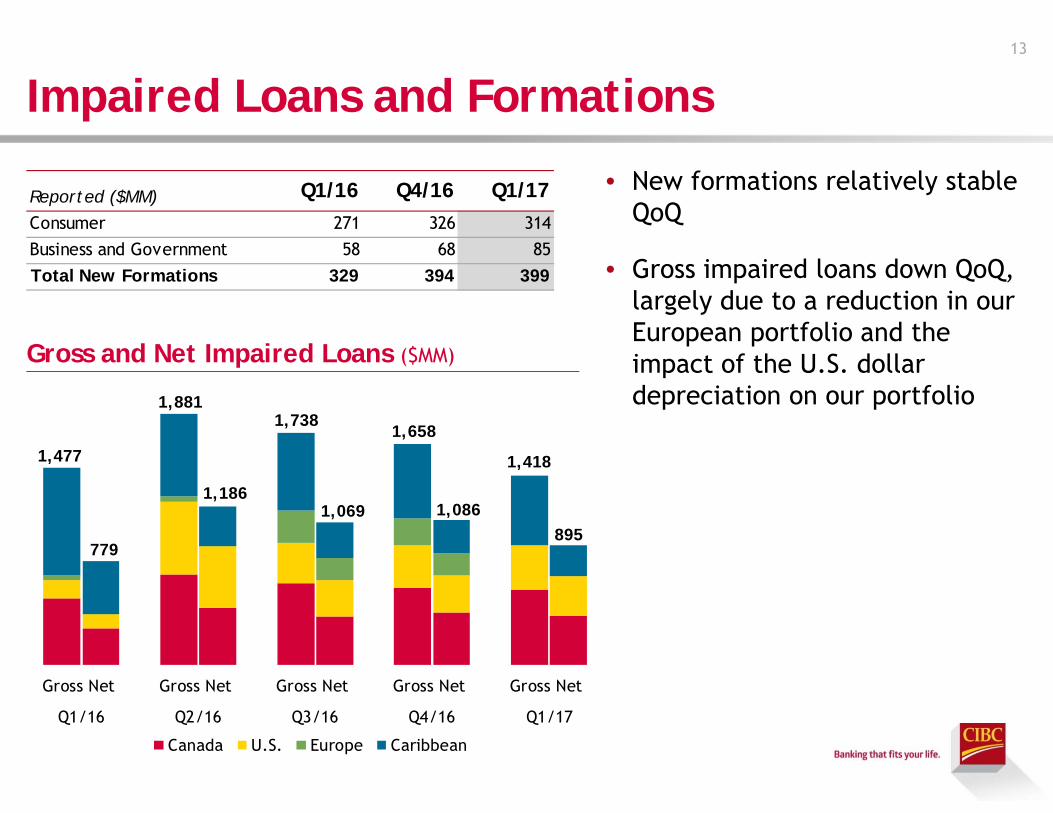
Impaired Loans and Formations
• New formations relatively stable QoQ
• Gross impaired loans down QoQ, largely due to a reduction in our European portfolio and the impact of the U.S. dollar depreciation on our portfolio
Gross and Net Impaired Loans ($MM)
13
Reported ($MM) Q1/16 Q4/16 Q1/17Consumer 271 326 314 Business and Government 58 68 85 Total New Formations 329 394 399
Gross Net Gross Net Gross Net Gross Net Gross Net
Q1/16 Q2/16 Q3/16 Q4/16 Q1/17
Canada U.S. Europe Caribbean
1,477
779
1,881
1,186
1,738
1,069
1,658
1,086
1,418
895
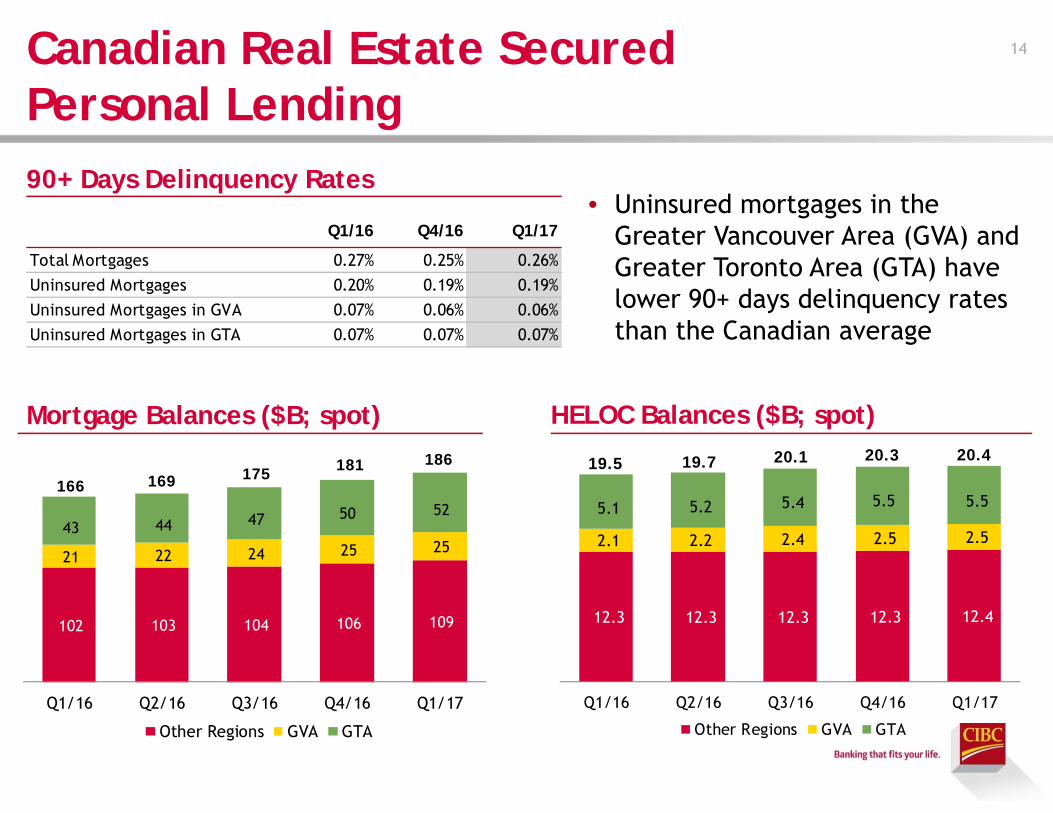
Canadian Real Estate Secured Personal Lending
14
Mortgage Balances ($B; spot) HELOC Balances ($B; spot)
• Uninsured mortgages in the Greater Vancouver Area (GVA) and Greater Toronto Area (GTA) have lower 90+ days delinquency rates than the Canadian average
90+ Days Delinquency Rates
Q1/16 Q4/16 Q1/17
Total Mortgages 0.27% 0.25% 0.26%Uninsured Mortgages 0.20% 0.19% 0.19%Uninsured Mortgages in GVA 0.07% 0.06% 0.06%Uninsured Mortgages in GTA 0.07% 0.07% 0.07%
102 103 104 106 109
21 22 24 25 25 43 44 47 50 52
Q1/16 Q2/16 Q3/16 Q4/16 Q1/17
Other Regions GVA GTA
166 169 175 181 186
12.3 12.3 12.3 12.3 12.4
2.1 2.2 2.4 2.5 2.5
5.1 5.2 5.4 5.5 5.5
Q1/16 Q2/16 Q3/16 Q4/16 Q1/17
Other Regions GVA GTA
19.5 19.7 20.1 20.3 20.4
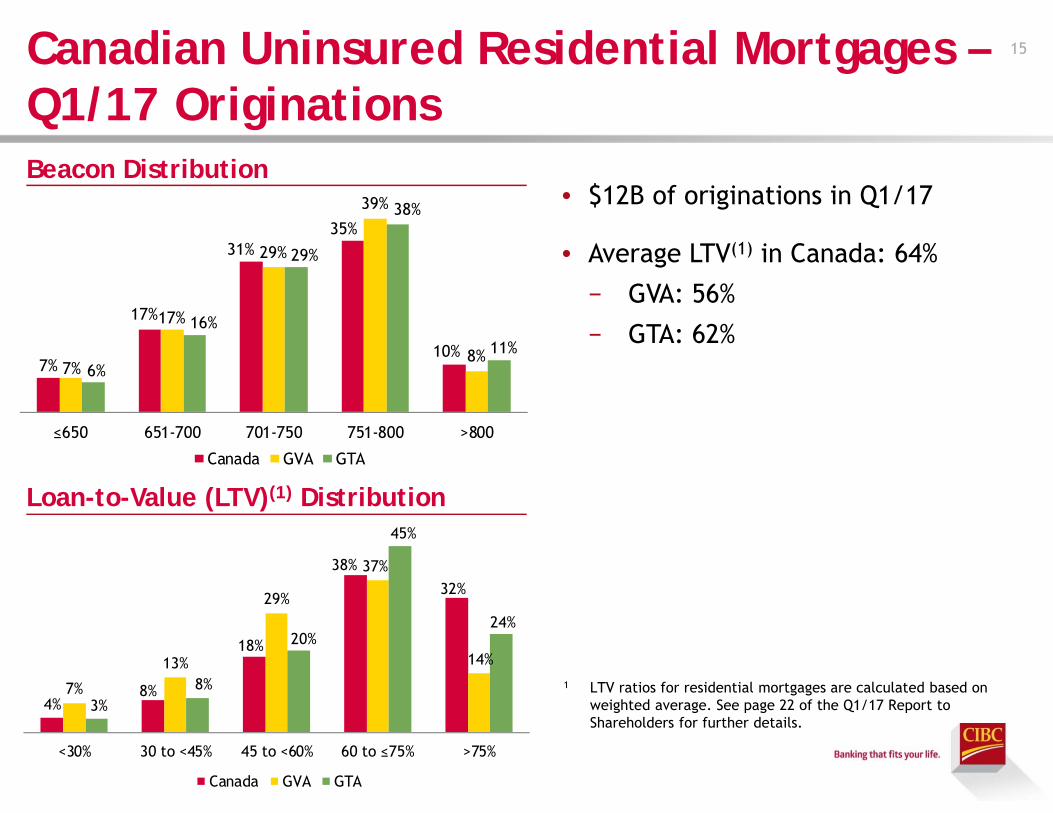
Canadian Uninsured Residential Mortgages –Q1/17 Originations
15
1 LTV ratios for residential mortgages are calculated based on weighted average. See page 22 of the Q1/17 Report to Shareholders for further details.
Beacon Distribution
Loan-to-Value (LTV)(1) Distribution
• $12B of originations in Q1/17
• Average LTV(1) in Canada: 64%
− GVA: 56%
− GTA: 62%7%
17%
31%35%
10%7%
17%
29%
39%
8%6%
16%
29%
38%
11%
≤650 651-700 701-750 751-800 >800
Canada GVA GTA
4%8%
18%
38%
32%
7%
13%
29%
37%
14%
3%8%
20%
45%
24%
<30% 30 to <45% 45 to <60% 60 to ≤75% >75%
Canada GVA GTA
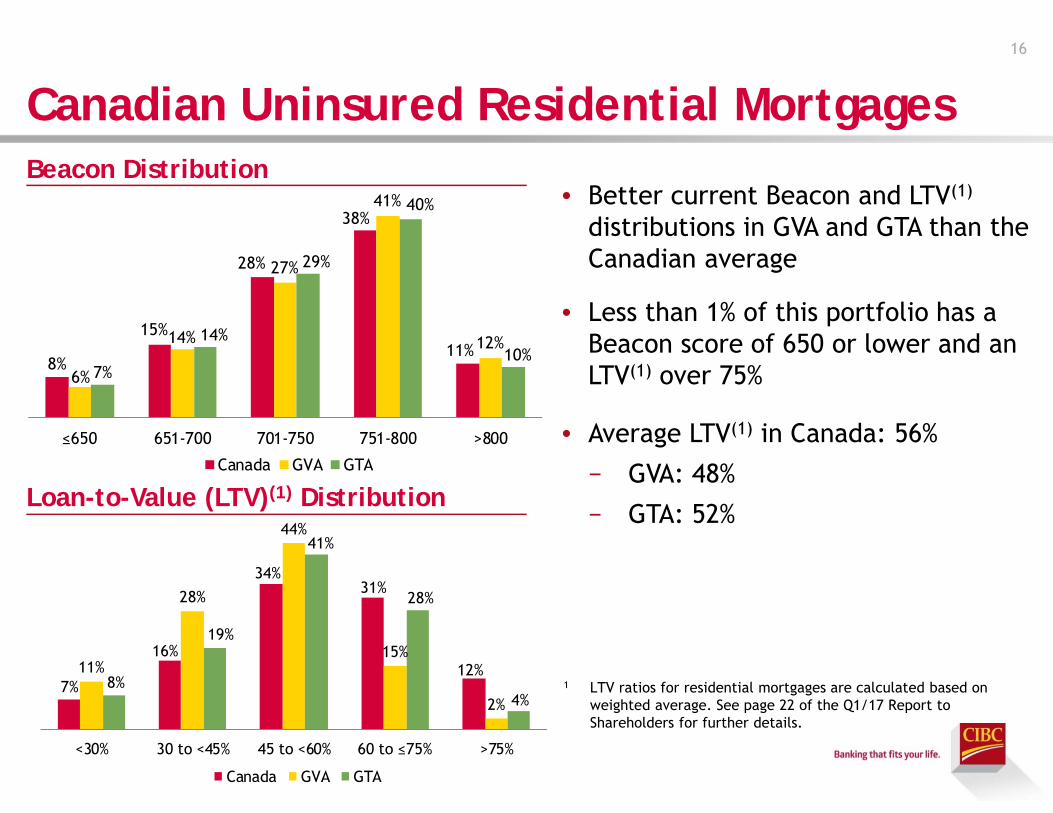
Canadian Uninsured Residential Mortgages16
Beacon Distribution
Loan-to-Value (LTV)(1) Distribution
• Better current Beacon and LTV(1)
distributions in GVA and GTA than the Canadian average
• Less than 1% of this portfolio has a Beacon score of 650 or lower and an LTV(1) over 75%
• Average LTV(1) in Canada: 56%
− GVA: 48%
− GTA: 52%
1 LTV ratios for residential mortgages are calculated based on weighted average. See page 22 of the Q1/17 Report to Shareholders for further details.
8%
15%
28%
38%
11%
6%
14%
27%
41%
12%
7%
14%
29%
40%
10%
≤650 651-700 701-750 751-800 >800
Canada GVA GTA
7%
16%
34%31%
12%11%
28%
44%
15%
2%8%
19%
41%
28%
4%
<30% 30 to <45% 45 to <60% 60 to ≤75% >75%
Canada GVA GTA
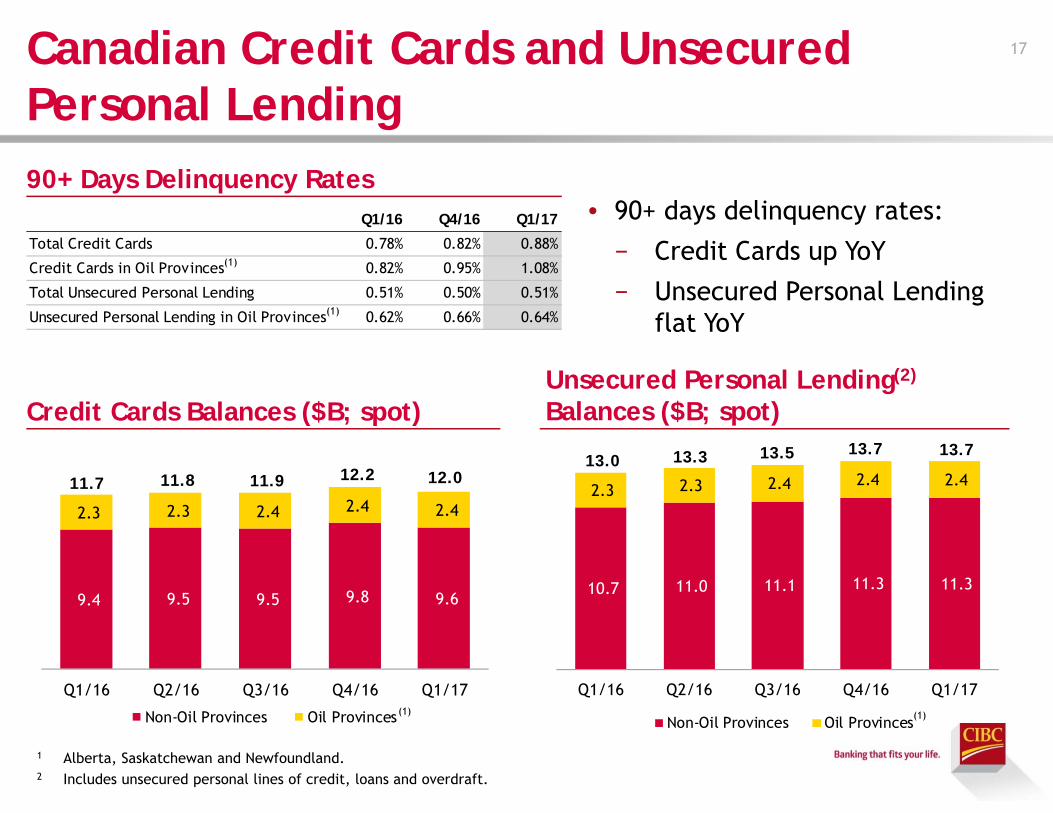
9.4 9.5 9.5 9.8 9.6
2.3 2.3 2.4 2.4 2.4
Q1/16 Q2/16 Q3/16 Q4/16 Q1/17
Non-Oil Provinces Oil Provinces
11.7 11.8 11.9 12.2 12.0
10.7 11.0 11.1 11.3 11.3
2.3 2.3 2.4 2.4 2.4
Q1/16 Q2/16 Q3/16 Q4/16 Q1/17
Non-Oil Provinces Oil Provinces
13.0 13.3 13.5 13.7 13.7
Canadian Credit Cards and Unsecured Personal Lending
17
Credit Cards Balances ($B; spot)Unsecured Personal Lending(2)
Balances ($B; spot)
• 90+ days delinquency rates:
− Credit Cards up YoY
− Unsecured Personal Lending flat YoY
90+ Days Delinquency Rates
1 Alberta, Saskatchewan and Newfoundland.2 Includes unsecured personal lines of credit, loans and overdraft.
(1) (1)
Q1/16 Q4/16 Q1/17
Total Credit Cards 0.78% 0.82% 0.88%
Credit Cards in Oil Provinces(1) 0.82% 0.95% 1.08%
Total Unsecured Personal Lending 0.51% 0.50% 0.51%
Unsecured Personal Lending in Oil Provinces(1) 0.62% 0.66% 0.64%
(15)
(10)
(5)
0
5
10
15
20
25
(15)
(10)
(5)
0
5
10
15
20
25
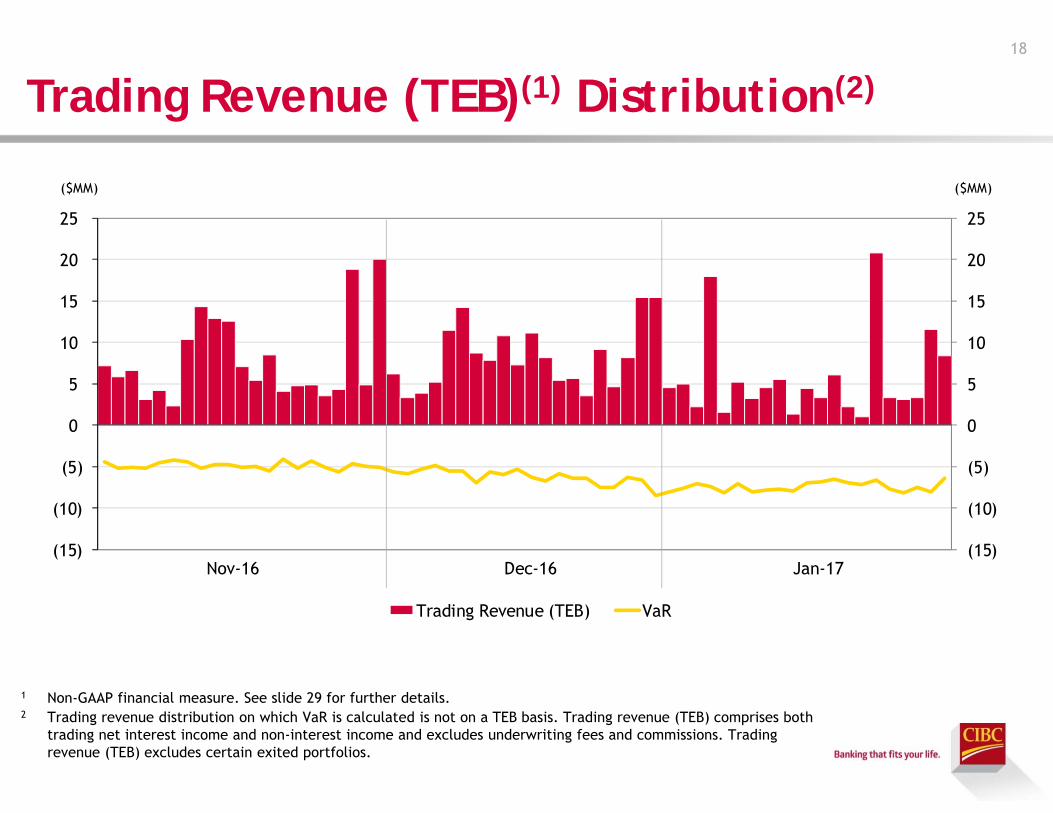
Trading Revenue (TEB) VaR
($MM)
Nov-16 Dec-16 Jan-17
($MM)
18
Trading Revenue (TEB)(1) Distribution(2)
1 Non-GAAP financial measure. See slide 29 for further details.2 Trading revenue distribution on which VaR is calculated is not on a TEB basis. Trading revenue (TEB) comprises both
trading net interest income and non-interest income and excludes underwriting fees and commissions. Trading revenue (TEB) excludes certain exited portfolios.

Appendix
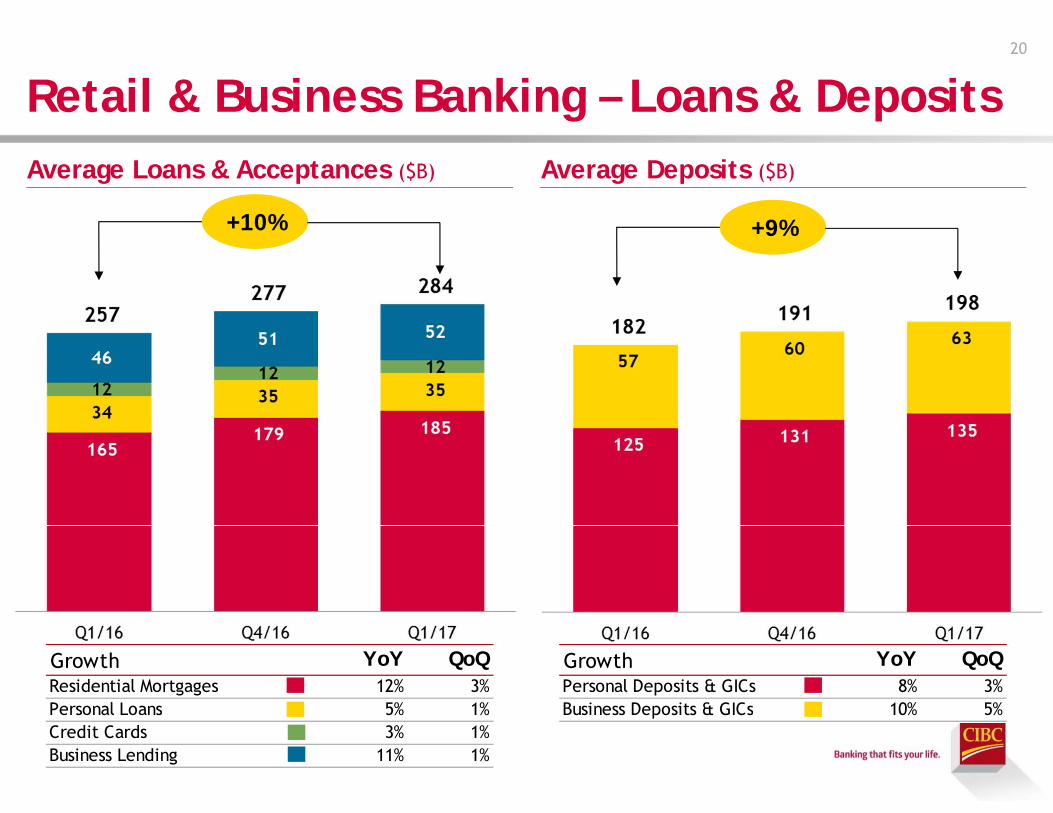
Retail & Business Banking – Loans & Deposits20
Average Loans & Acceptances ($B) Average Deposits ($B)
+10% +9%
Growth YoY QoQResidential Mortgages 12% 3%Personal Loans 5% 1%Credit Cards 3% 1%Business Lending 11% 1%
Growth YoY QoQPersonal Deposits & GICs 8% 3%Business Deposits & GICs 10% 5%
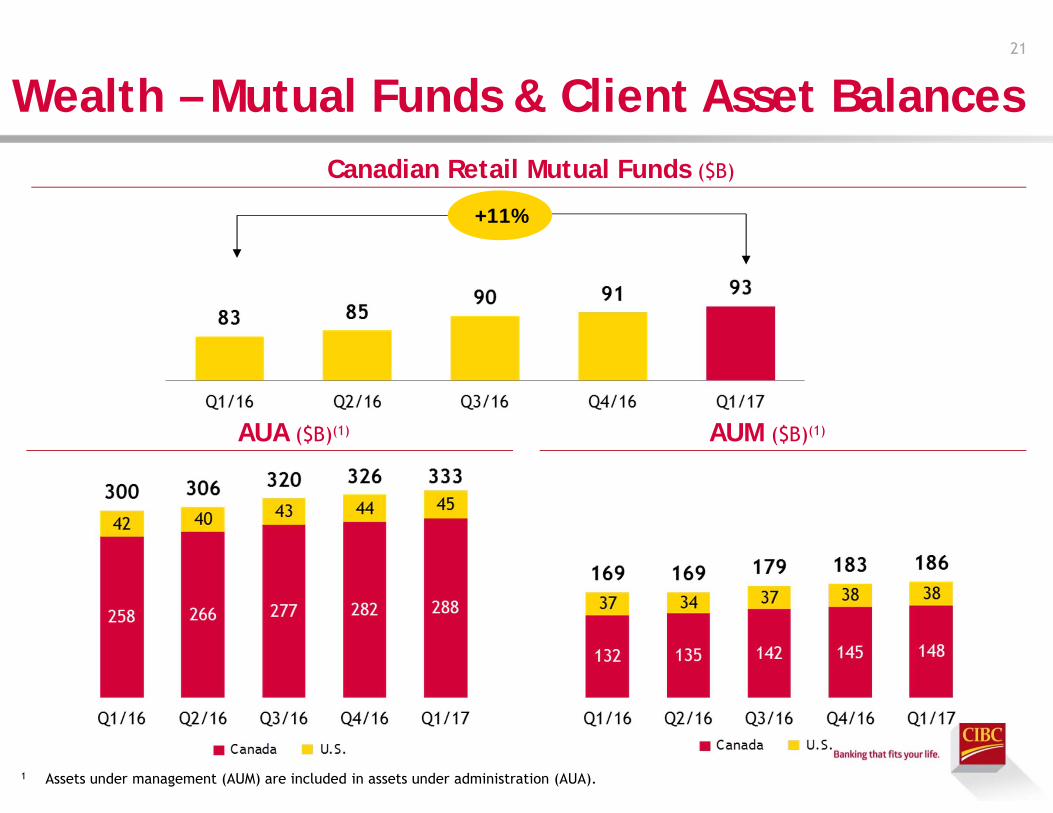
Wealth – Mutual Funds & Client Asset Balances21
AUA ($B)(1) AUM ($B)(1)
Canadian Retail Mutual Funds ($B)
+11%
1 Assets under management (AUM) are included in assets under administration (AUA).
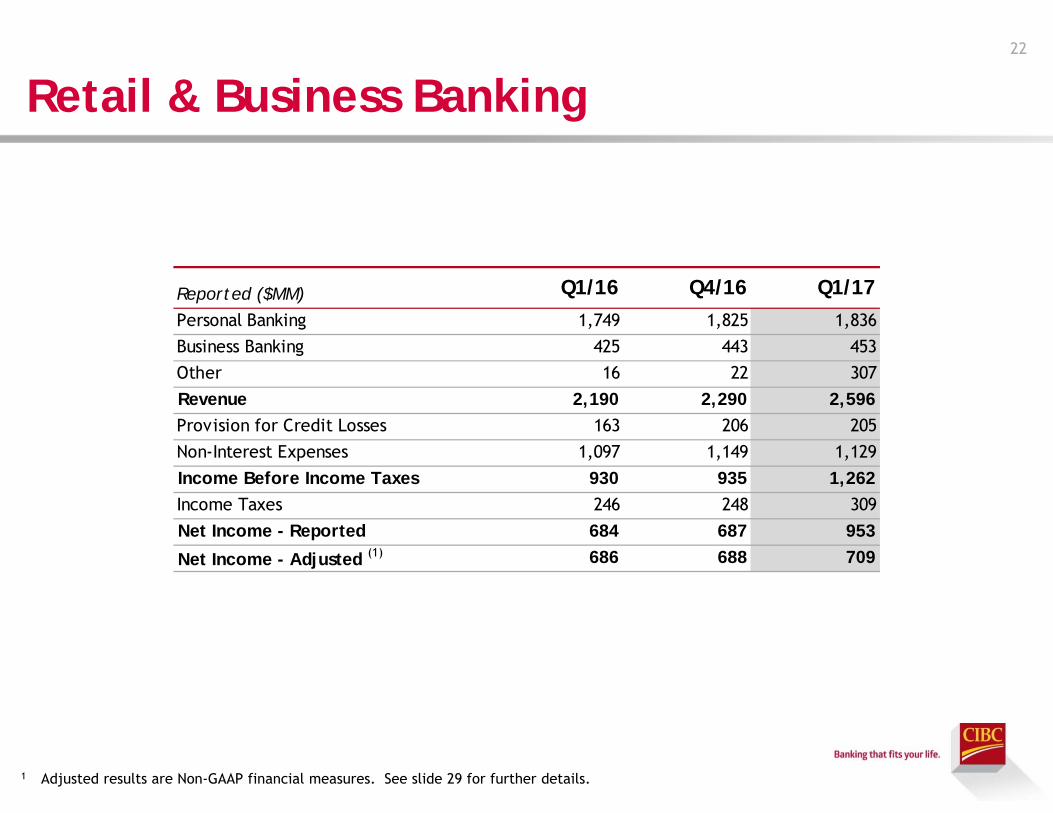
Retail & Business Banking22
1 Adjusted results are Non-GAAP financial measures. See slide 29 for further details.
Reported ($MM) Q1/16 Q4/16 Q1/17Personal Banking 1,749 1,825 1,836 Business Banking 425 443 453 Other 16 22 307 Revenue 2,190 2,290 2,596 Provision for Credit Losses 163 206 205 Non-Interest Expenses 1,097 1,149 1,129 Income Before Income Taxes 930 935 1,262 Income Taxes 246 248 309 Net Income - Reported 684 687 953
Net Income - Adjusted (1) 686 688 709
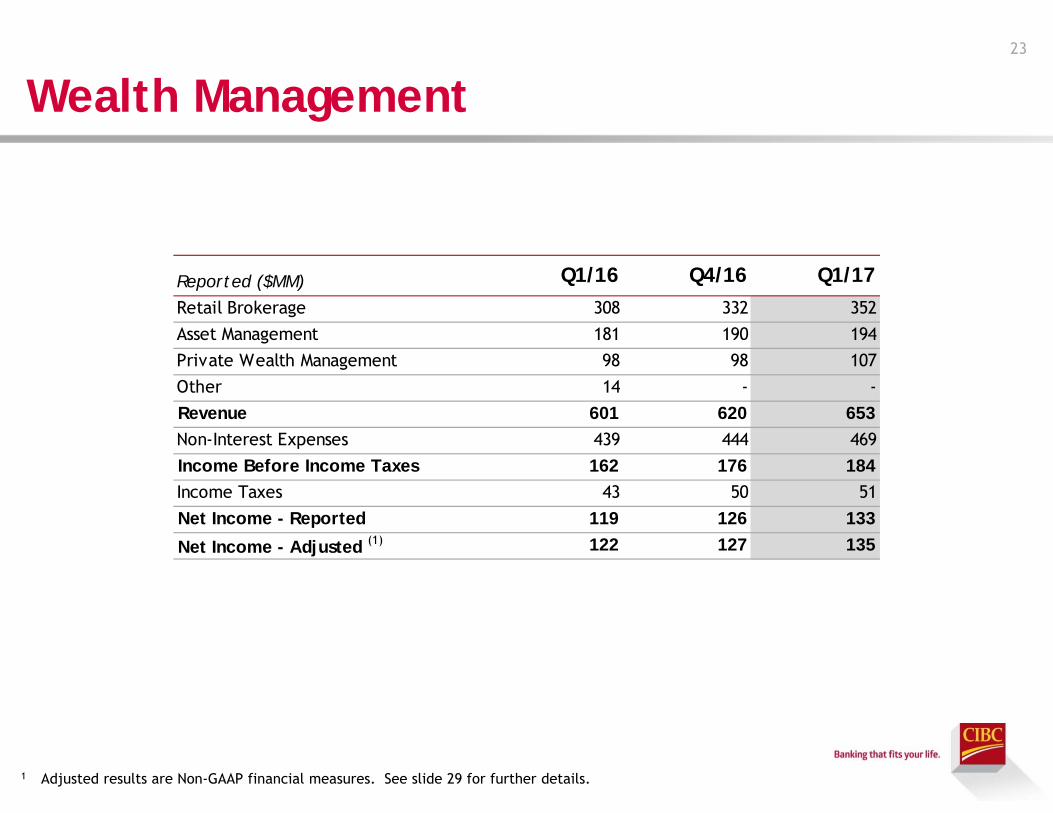
Wealth Management23
1 Adjusted results are Non-GAAP financial measures. See slide 29 for further details.
Reported ($MM) Q1/16 Q4/16 Q1/17Retail Brokerage 308 332 352 Asset Management 181 190 194 Private Wealth Management 98 98 107 Other 14 - -Revenue 601 620 653 Non-Interest Expenses 439 444 469 Income Before Income Taxes 162 176 184 Income Taxes 43 50 51 Net Income - Reported 119 126 133
Net Income - Adjusted (1) 122 127 135
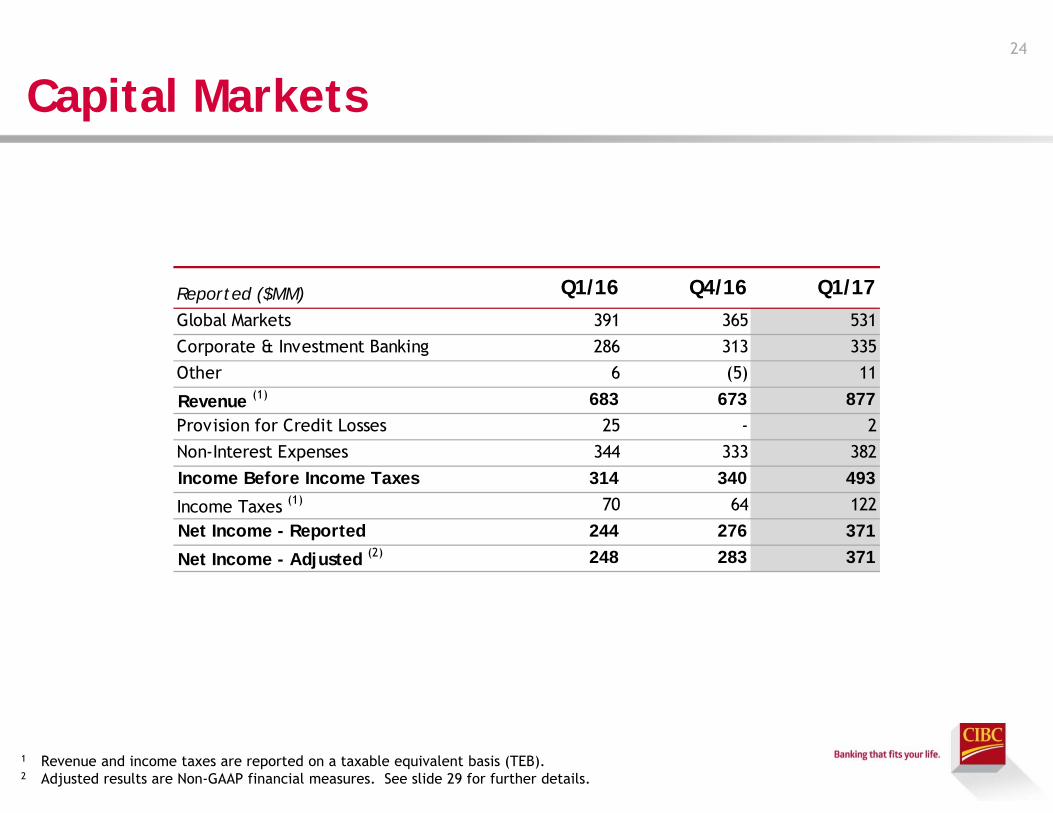
Capital Markets24
1 Revenue and income taxes are reported on a taxable equivalent basis (TEB).2 Adjusted results are Non-GAAP financial measures. See slide 29 for further details.
Reported ($MM) Q1/16 Q4/16 Q1/17Global Markets 391 365 531 Corporate & Investment Banking 286 313 335 Other 6 (5) 11
Revenue (1) 683 673 877 Provision for Credit Losses 25 - 2 Non-Interest Expenses 344 333 382 Income Before Income Taxes 314 340 493
Income Taxes (1) 70 64 122 Net Income - Reported 244 276 371
Net Income - Adjusted (2) 248 283 371
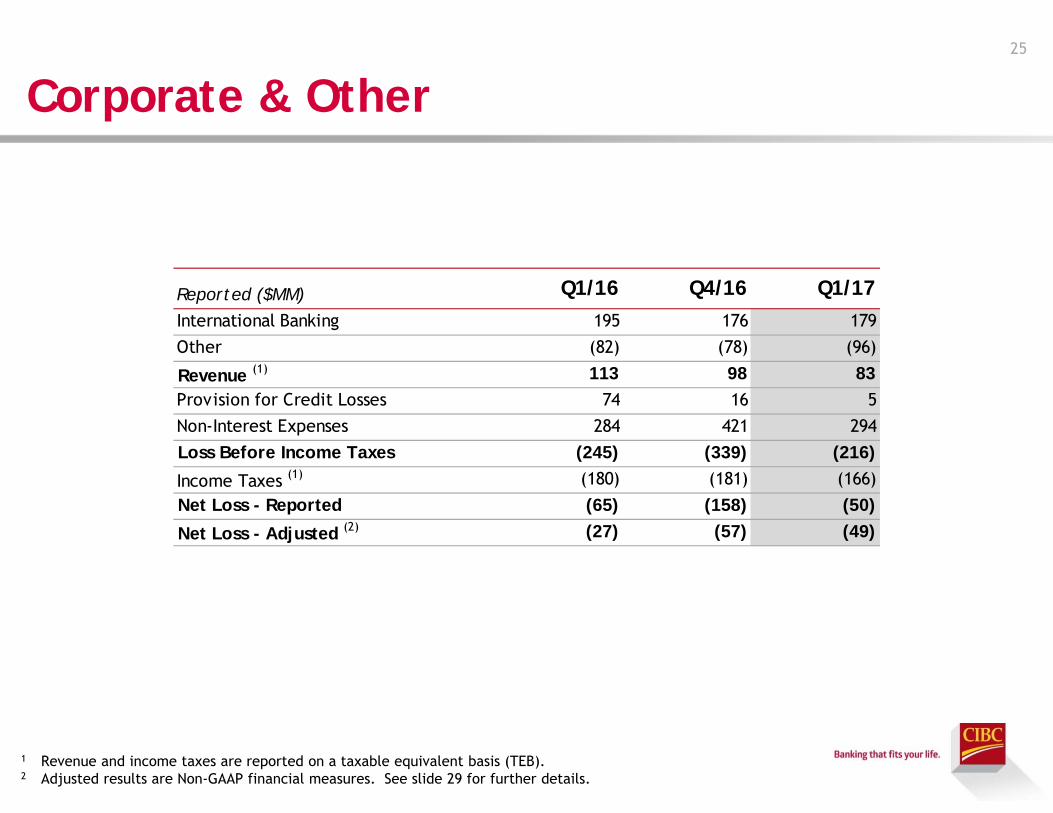
Corporate & Other25
1 Revenue and income taxes are reported on a taxable equivalent basis (TEB).2 Adjusted results are Non-GAAP financial measures. See slide 29 for further details.
Reported ($MM) Q1/16 Q4/16 Q1/17International Banking 195 176 179 Other (82) (78) (96)
Revenue (1) 113 98 83 Provision for Credit Losses 74 16 5 Non-Interest Expenses 284 421 294 Loss Before Income Taxes (245) (339) (216)
Income Taxes (1) (180) (181) (166)Net Loss - Reported (65) (158) (50)
Net Loss - Adjusted (2) (27) (57) (49)
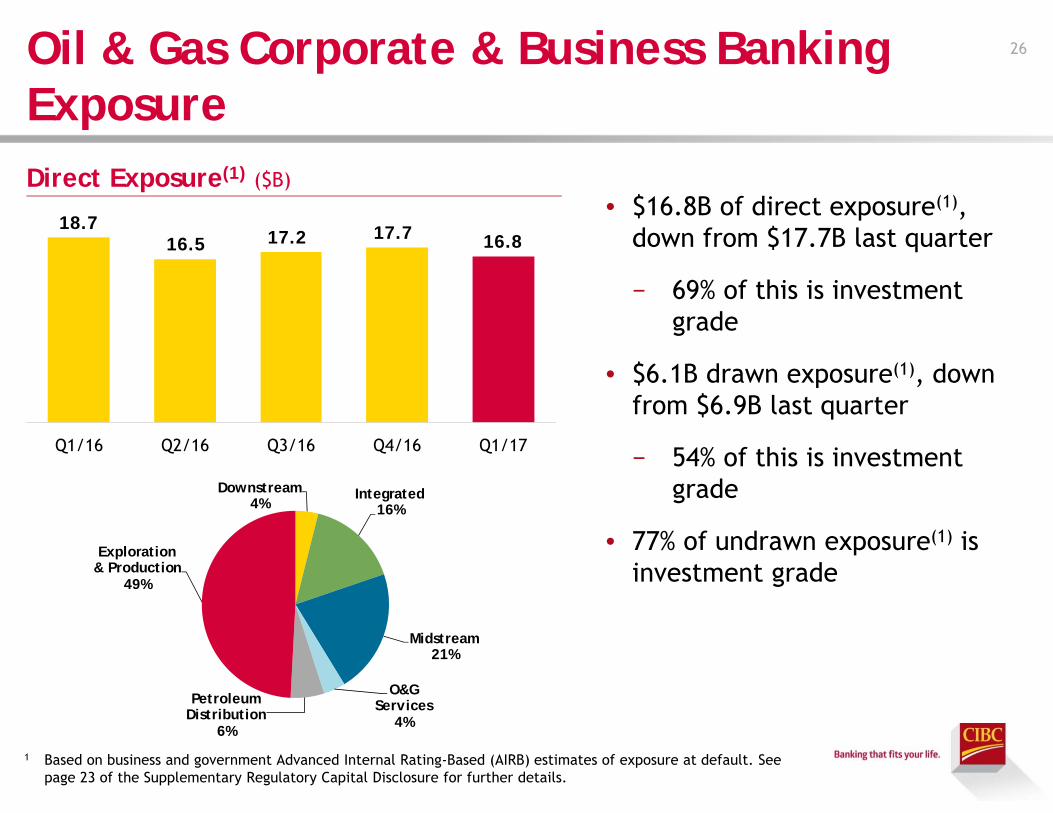
Oil & Gas Corporate & Business Banking Exposure
1 Based on business and government Advanced Internal Rating-Based (AIRB) estimates of exposure at default. See page 23 of the Supplementary Regulatory Capital Disclosure for further details.
• $16.8B of direct exposure(1), down from $17.7B last quarter
− 69% of this is investment grade
• $6.1B drawn exposure(1), down from $6.9B last quarter
− 54% of this is investment grade
• 77% of undrawn exposure(1) is investment grade
Direct Exposure(1) ($B)
26
Downstream4%
Integrated16%
Midstream21%
O&G Services
4%
Petroleum Distribution
6%
Exploration & Production
49%
18.7 16.5 17.2 17.7 16.8
Q1/16 Q2/16 Q3/16 Q4/16 Q1/17
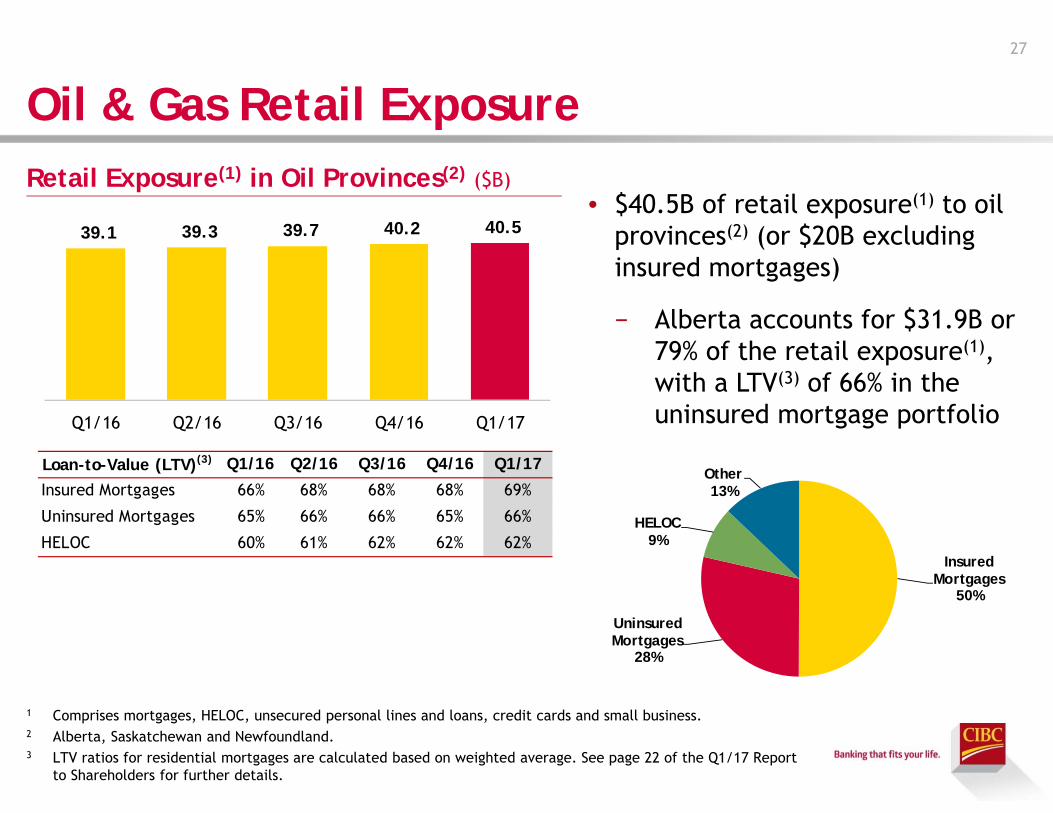
Insured Mortgages
50%
Uninsured Mortgages
28%
HELOC9%
Other13%
Oil & Gas Retail ExposureRetail Exposure(1) in Oil Provinces(2) ($B)
27
39.1 39.3 39.7 40.2 40.5
Q1/16 Q2/16 Q3/16 Q4/16 Q1/17
• $40.5B of retail exposure(1) to oil provinces(2) (or $20B excluding insured mortgages)
− Alberta accounts for $31.9B or 79% of the retail exposure(1), with a LTV(3) of 66% in the uninsured mortgage portfolio
Loan-to-Value (LTV)(3) Q1/16 Q2/16 Q3/16 Q4/16 Q1/17
Insured Mortgages 66% 68% 68% 68% 69%
Uninsured Mortgages 65% 66% 66% 65% 66%
HELOC 60% 61% 62% 62% 62%
1 Comprises mortgages, HELOC, unsecured personal lines and loans, credit cards and small business.2 Alberta, Saskatchewan and Newfoundland.3 LTV ratios for residential mortgages are calculated based on weighted average. See page 22 of the Q1/17 Report
to Shareholders for further details.
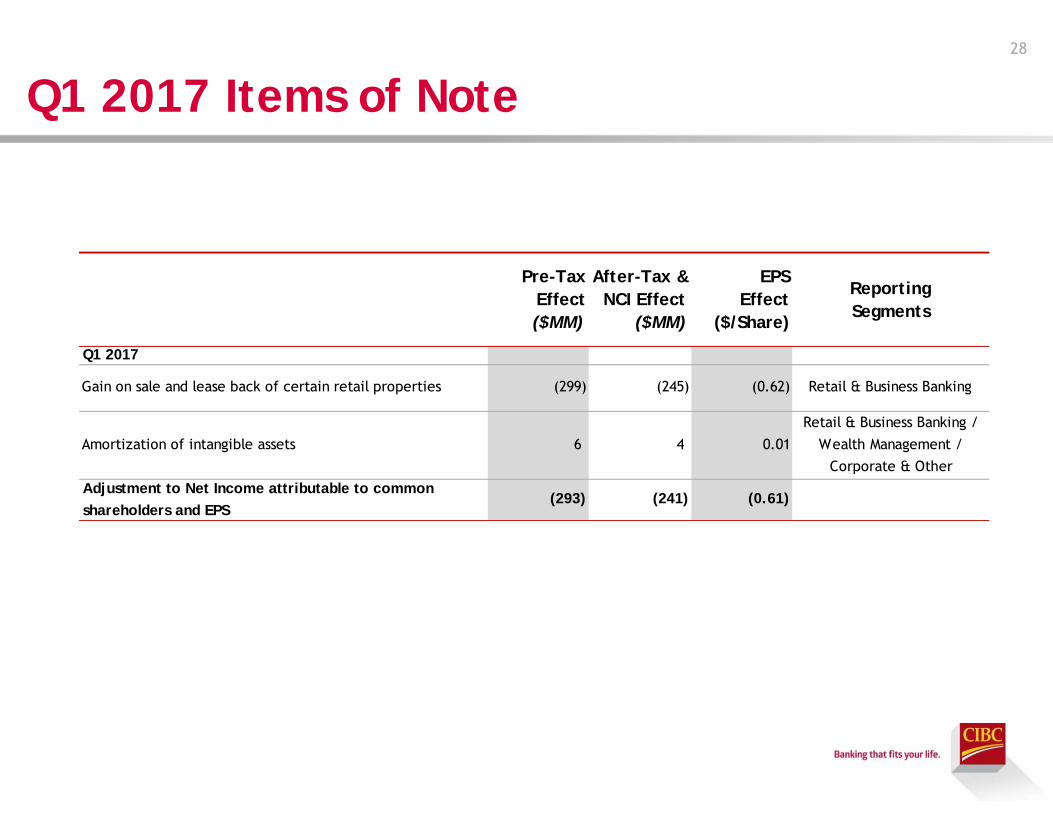
Q1 2017 Items of Note28
Pre-Tax Effect ($MM)
After-Tax & NCI Effect
($MM)
EPSEffect
($/Share)
ReportingSegments
Q1 2017
Gain on sale and lease back of certain retail properties (299) (245) (0.62) Retail & Business Banking
Amortization of intangible assets 6 4 0.01Retail & Business Banking /
Wealth Management / Corporate & Other
Adjustment to Net Income attributable to common shareholders and EPS
(293) (241) (0.61)
Non-GAAP Financial Measures29
• Adjusted results are Non-GAAP financial measures that do not have any standardized meaning prescribed by GAAP and are therefore unlikely to be comparable to similar measures presented by other issuers.
• For further details on items of note see slide 28 of this presentation; for Non-GAAP measures and reconciliation of Non-GAAP to GAAP measures see pages 1 and 2 of the Q1/17 Supplementary Financial Information and pages 13 and 14 of the 2016 Annual Report available on www.cibc.com.