Embed Size (px)
DESCRIPTION
Market update for all zip codes in Chula Vista for the week up to Feb 3, 2010
Citation preview

MARKET UPDATEMcMillin Realty's
· Current Real Estate Market Conditions for Single Family Homes· Trends in Pricing· Current Levels of Supply and Demand· Value Metrics
· Report for the week ofFebruary 01, 2010
· Presented by Liz Klaser'sMcMillin Realtywww.mcmillinrealty.com - [email protected]
CHULA VISTA, CA
Powered by Altos Research LLC | www.altosresearch.com | Copyright © 2005-2009 Altos Research LLC

Median List Price
Median Lot Size
26.1
Percent Relisted (reset DOM)
2102
2.5
7 %
Median Number of Bathrooms
145
Inventory of Properties Listed
$ 180
Percent Flip (price increased)
6,501 - 8,000 sqft
Median House Size (sq ft)
$ 379,450
17 %
4.0
Market Action Index
Median Number of Bedrooms
Asking Price Per Square Foot
7 %
Percent of Properties with Price Decrease
Buyer's Advantage
==
±+
±+
≠≠
≠≠
Altos Research Value Statistics
Most Expensive Listing
Average Days on Market (DoM)
Bottom/Fourth
Lower/Third
Upper/Second
Top/First
This Week Real-Time Market Profile Trend
The Market Action Index answers the question "How's the Market?" By measuringthe current rate of sale versus the amount of the inventory. Index above 30implies a seller's advantage. Below 30, conditions give the advantage to thebuyer.
Supply and Demand
Characteristics per Quartile
6 113217
1332.5 10
3.0
19
145
4.0 153
134
25
8
0.25 - 0.50acre
42
$ 339,000
19
18
153
3.5
4,501 -6,500 sqft
113.0
1466 6,501 -8,000 sqft
153
$ 260,000
4.0
169
4,501 -6,500 sqft$ 413,900
5.0$ 540,000
8
14
2407
Inventory is up and Market Action istrending down recently. While days-on-market appears to be trendinglower, the overall conditions areweakening a bit.
Monday February 1, 2010
McMillin Realty | www.mcmillinrealty.com | 866-694-6491
153
1804
2.0
The median list price in CHULA VISTA,CA this week is $379,450. The 612properties have been on the marketfor an average of 145 days.
Most expensive 25% of properties
Upper-middle 25% of properties
Lower-middle 25% of properties
Least expensive 25% of properties
Quartile Median Price Lot Size Beds Baths Age Inventory New Absorbed DOMSq. Ft.
No change
Strong upward trend Strong downward trend
Slight upward trend Slight downward trend±+
== ≠≠
≠=
CHULA VISTA,CA
City Overview
Least Expensive Listing
Average List Price
Average Age of Listing
612
$ 3,800,000
$ 170,000
$ 430,071
19
Trend Key:
The Market Action Index has beentrending lower for several weekswhile prices have remainedrelatively stable. If inventorycontinues to grow relative todemand however, it is likely that wewill see downward pressure onpricing.
Page 2 of 31
Single Family Homes in

McMillin Realty | www.mcmillinrealty.com | 866-694-6491
City OverviewCHULA VISTA,
CA
Monday February 1, 2010
Median PriceThe market seems to have paused around this plateau. The Market Action Index is a good leading indicator for the durability ofthis trend.
90-day Average7-day Average
Quartile PricesPrices have settled at a price plateau across the board. Prices in all four quartiles are basically mixed. Look for a persistent shift(up or down) in the Market Action Index before prices move from these current levels.
First/Top Second/Upper Third/Lower Fourth/Bottom
Page 3 of 31
Single Family Homes in

McMillin Realty | www.mcmillinrealty.com | 866-694-6491
City OverviewCHULA VISTA,
CA
Monday February 1, 2010
Price per Square FootThe market plateau is seen across the price and value. The price per square foot and median list price have both beenreasonably stagnant. Watch the Market Action Index for persistent changes as a leading indicator before the market moves fromthese levels.
90-day Average7-day Average
Inventory of Properties Listed for SaleInventory has been climbing lately. Note that rising inventory alone does not signal a weakening market. Look to the MarketAction Index and Days on Market trends to gauge whether buyer interest is keeping up with available supply.
90-day Average7-day Average
Page 4 of 31
Single Family Homes in

McMillin Realty | www.mcmillinrealty.com | 866-694-6491
City OverviewCHULA VISTA,
CA
Monday February 1, 2010
Market Action IndexThe CHULA VISTA market is currently in the Buyer's Advantgae zone (below 30), though not strongly so. The 90-day MarketAction Index stands this week at 26.14 so buyers should expect find reasonable levels of selection.
Buyers/Sellers Cutoff90-day Average
Market Action Index per QuartileNot surprisingly given the overall Market Action Index, all quartiles are in the Buyer's Market zone with several months ofinventory given the current rate of demand for homes in the quartile. Watch the quartile for changes before the overall marketshifts. Often one end of the market (e.g. the low end) will improve and signal a strengthening market before the whole group
First/Top Second/Upper Third/Lower Fourth/Bottom
Buyers/Sellers Cutoff
Residential house prices are a function of supply and demand, and market conditions can be characterized byanalyzing those factors. Watch this index for sustained changes: if the index falls into the Buyer’s Advantagezone (below 30) for a long period, prices are likely in for a downward correction.
The Market Action Index (MAI) illustrates a blance between supply and demand using a statistical function of thecurrent rate of sale versus current inventory.
Page 5 of 31
Single Family Homes in
McMillin Realty | www.mcmillinrealty.com | 866-694-6491
City OverviewCHULA VISTA,
CA
Monday February 1, 2010
Days on MarketThe properties have been on the market for an average of 145 days. Half of the listings have come newly on the market in thepast 84 or so days.
90-day Average7-day Average
Days on Market per QuartileIt is not uncommon for the higher priced homes in an area to take longer to sell than those in the lower quartiles.
First/Top Second/Upper Third/Lower Fourth/Bottom
Page 6 of 31
Single Family Homes in

Median List Price
Median Lot Size
29.7
Percent Relisted (reset DOM)
1672
2.0
7 %
Median Number of Bathrooms
148
Inventory of Properties Listed
$ 176
Percent Flip (price increased)
6,501 - 8,000 sqft
Median House Size (sq ft)
$ 285,000
19 %
4.0
Market Action Index
Median Number of Bedrooms
Asking Price Per Square Foot
3 %
Percent of Properties with Price Decrease
Buyer's Advantage
==
±+
±+
≠≠
≠≠
Altos Research Value Statistics
Most Expensive Listing
Average Days on Market (DoM)
Bottom/Fourth
Lower/Third
Upper/Second
Top/First
This Week Real-Time Market Profile Trend
The Market Action Index answers the question "How's the Market?" By measuringthe current rate of sale versus the amount of the inventory. Index above 30implies a seller's advantage. Below 30, conditions give the advantage to thebuyer.
Supply and Demand
Characteristics per Quartile
15 22223
1442.0 48
3.0
6
157
3.0 29
139
5
5
8,001 -10,000 sqft
51
$ 252,900
1
2
29
2.5
6,501 -8,000 sqft
22.5
1294 8,001 -10,000 sqft
29
$ 225,000
4.0
153
6,501 -8,000 sqft$ 313,500
4.0$ 401,250
43
3
1714
Inventory is up and Market Action istrending down recently. While days-on-market appears to be trendinglower, the overall conditions areweakening a bit.
Monday February 1, 2010
McMillin Realty | www.mcmillinrealty.com | 866-694-6491
28
1582
2.0
The median list price in CHULA VISTA,CA 91911 this week is $285,000. The115 properties have been on themarket for an average of 148 days.
Most expensive 25% of properties
Upper-middle 25% of properties
Lower-middle 25% of properties
Least expensive 25% of properties
Quartile Median Price Lot Size Beds Baths Age Inventory New Absorbed DOMSq. Ft.
No change
Strong upward trend Strong downward trend
Slight upward trend Slight downward trend±+
== ≠≠
≠=
CHULA VISTA,CA 91911
Neighborhood Detail
Least Expensive Listing
Average List Price
Average Age of Listing
115
$ 1,495,000
$ 170,000
$ 314,426
41
Trend Key:
The Market Action Index has beentrending lower for several weekswhile prices have remainedrelatively stable. If inventorycontinues to grow relative todemand however, it is likely that wewill see downward pressure onpricing.
Page 7 of 31
Single Family Homes in

McMillin Realty | www.mcmillinrealty.com | 866-694-6491
Neighborhood DetailCHULA VISTA,
CA 91911
Monday February 1, 2010
Median PriceWe continue to see prices in this zip code hovering around these current levels, even though they bumped up a bit this week.Look for a persistent up-shift in the Market Action Index before we see prices move significantly from here.
90-day Average7-day Average
Quartile PricesIn the quartile market segments, we see prices in this zip code have settled at a price plateau across the board. Prices in allfour quartiles are basically mixed. Look for a persistent shift (up or down) in the Market Action Index before prices move fromthese current levels.
First/Top Second/Upper Third/Lower Fourth/Bottom
Page 8 of 31
Single Family Homes in

McMillin Realty | www.mcmillinrealty.com | 866-694-6491
Neighborhood DetailCHULA VISTA,
CA 91911
Monday February 1, 2010
Price per Square FootThe market plateau is seen across the price and value. The price per square foot and median list price have both beenreasonably stagnant. Watch the Market Action Index for persistent changes as a leading indicator before the market moves fromthese levels.
90-day Average7-day Average
Inventory of Properties Listed for SaleInventory has been climbing lately. Note that rising inventory alone does not signal a weakening market. Look to the MarketAction Index and Days on Market trends to gauge whether buyer interest is keeping up with available supply.
90-day Average7-day Average
Page 9 of 31
Single Family Homes in
McMillin Realty | www.mcmillinrealty.com | 866-694-6491
Neighborhood DetailCHULA VISTA,
CA 91911
Monday February 1, 2010
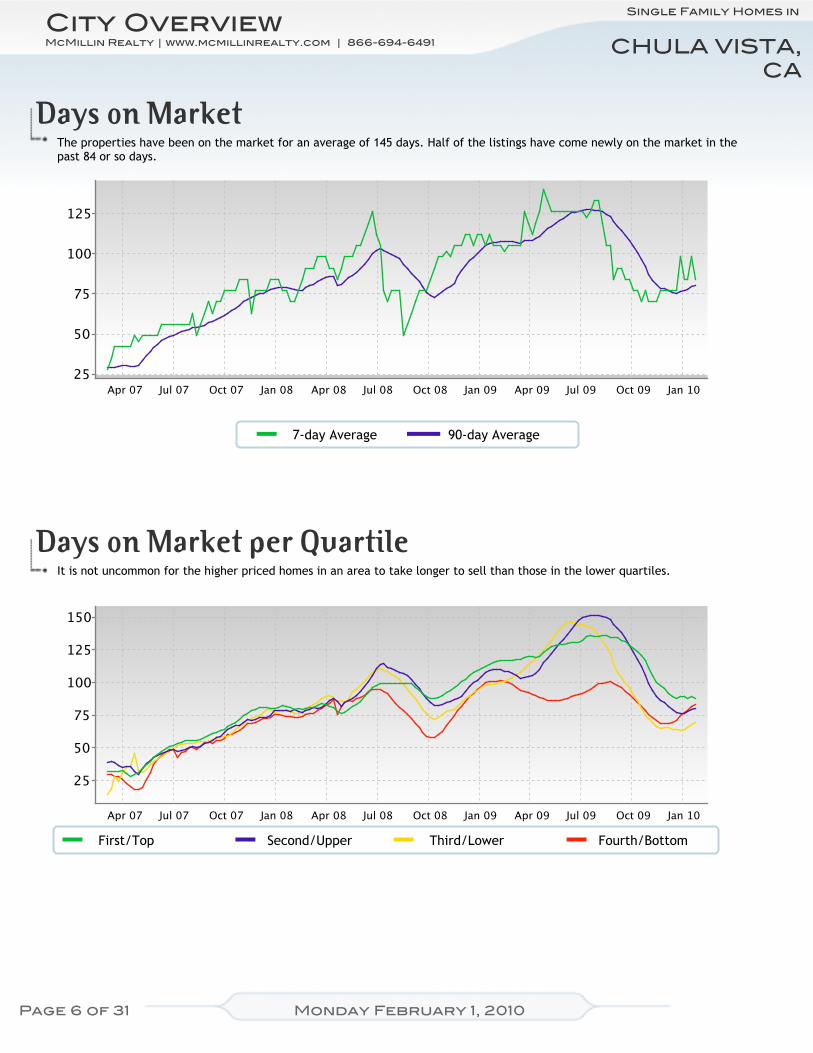
Market Action IndexThe CHULA VISTA, 91911 market is currently in the Buyer's Advantgae zone (below 30), though not strongly so. The 90-dayMarket Action Index stands this week at 29.71 so buyers should expect find reasonable levels of selection.
Buyers/Sellers Cutoff90-day Average
Market Action Index per QuartileThe middle of this zip code (Quartiles 2 and 3) are in the Buyer's Market zone with several months of inventory given the currentlevels of demand. Notice that Quartiles 2 and 3 (the middle of the market) are showing weaker demand than either end.
First/Top Second/Upper Third/Lower Fourth/Bottom
Buyers/Sellers Cutoff
Residential house prices are a function of supply and demand, and market conditions can be characterized byanalyzing those factors. Watch this index for sustained changes: if the index falls into the Buyer’s Advantagezone (below 30) for a long period, prices are likely in for a downward correction.
The Market Action Index (MAI) illustrates a blance between supply and demand using a statistical function of thecurrent rate of sale versus current inventory.
Page 10 of 31
Single Family Homes in

McMillin Realty | www.mcmillinrealty.com | 866-694-6491
Neighborhood DetailCHULA VISTA,
CA 91911
Monday February 1, 2010
Days on MarketThe properties have been on the market for an average of 148 days. Half of the listings have come newly on the market in thepast 84 or so days.
90-day Average7-day Average
Days on Market per QuartileIt is not uncommon for the higher priced homes in an area to take longer to sell than those in the lower quartiles.
First/Top Second/Upper Third/Lower Fourth/Bottom
Page 11 of 31
Single Family Homes in

Median List Price
Median Lot Size
24.6
Percent Relisted (reset DOM)
1860
2.5
5 %
Median Number of Bathrooms
138
Inventory of Properties Listed
$ 201
Percent Flip (price increased)
6,501 - 8,000 sqft
Median House Size (sq ft)
$ 365,000
23 %
4.0
Market Action Index
Median Number of Bedrooms
Asking Price Per Square Foot
7 %
Percent of Properties with Price Decrease
Buyer's Advantage
==
==
±+
±+
≠≠
Altos Research Value Statistics
Most Expensive Listing
Average Days on Market (DoM)
Bottom/Fourth
Lower/Third
Upper/Second
Top/First
This Week Real-Time Market Profile Trend
The Market Action Index answers the question "How's the Market?" By measuringthe current rate of sale versus the amount of the inventory. Index above 30implies a seller's advantage. Below 30, conditions give the advantage to thebuyer.
Supply and Demand
Characteristics per Quartile
14 43056
852.5 24
3.0
4
161
3.0 28
140
9
2
0.25 - 0.50acre
60
$ 329,500
4
6
28
3.2
6,501 -8,000 sqft
32.5
1272 6,501 -8,000 sqft
28
$ 250,438
4.0
167
4,501 -6,500 sqft$ 399,000
4.5$ 615,000
22
4
2022
The Market Action Index has beentrending down lately, while inventoryis climbing. These trends imply aweakening market.
Monday February 1, 2010
McMillin Realty | www.mcmillinrealty.com | 866-694-6491
28
1650
2.0
The median list price in CHULA VISTA,CA 91910 this week is $365,000. The112 properties have been on themarket for an average of 138 days.
Most expensive 25% of properties
Upper-middle 25% of properties
Lower-middle 25% of properties
Least expensive 25% of properties
Quartile Median Price Lot Size Beds Baths Age Inventory New Absorbed DOMSq. Ft.
No change
Strong upward trend Strong downward trend
Slight upward trend Slight downward trend±+
== ≠≠
≠=
CHULA VISTA,CA 91910
Neighborhood Detail
Least Expensive Listing
Average List Price
Average Age of Listing
112
$ 2,999,500
$ 195,000
$ 484,861
33
Trend Key:
The Market Action Index has beentrending lower for several weekswhile prices have remainedrelatively stable. If inventorycontinues to grow relative todemand however, it is likely that wewill see downward pressure onpricing.
Page 12 of 31
Single Family Homes in

McMillin Realty | www.mcmillinrealty.com | 866-694-6491
Neighborhood DetailCHULA VISTA,
CA 91910
Monday February 1, 2010
Median PriceThe market for this zip code continues its bounce again this week. We're a long way from the market's high point so watch theMarket Action Index to predict how long this trend will last.
90-day Average7-day Average
Quartile PricesIn the quartile market segments, we see price for this zip code in general with price stagnation in recent weeks. Quartile 4 isdown, while the rest of the market is basically flat. Look to the Market Action Index to determine if this plateau is the stage fora prolonged price decline.
First/Top Second/Upper Third/Lower Fourth/Bottom
Page 13 of 31
Single Family Homes in

McMillin Realty | www.mcmillinrealty.com | 866-694-6491
Neighborhood DetailCHULA VISTA,
CA 91910
Monday February 1, 2010
Price per Square FootIn a market where prices are rising fairly consistently, price per square foot is essentially flat. This often implies that newhomes coming on the market are pricier, and also larger than older homes. As a result the value one can buy stays the same.
90-day Average7-day Average
Inventory of Properties Listed for SaleInventory has been climbing lately. Note that rising inventory alone does not signal a weakening market. Look to the MarketAction Index and Days on Market trends to gauge whether buyer interest is keeping up with available supply.
90-day Average7-day Average
Page 14 of 31
Single Family Homes in
McMillin Realty | www.mcmillinrealty.com | 866-694-6491
Neighborhood DetailCHULA VISTA,
CA 91910
Monday February 1, 2010
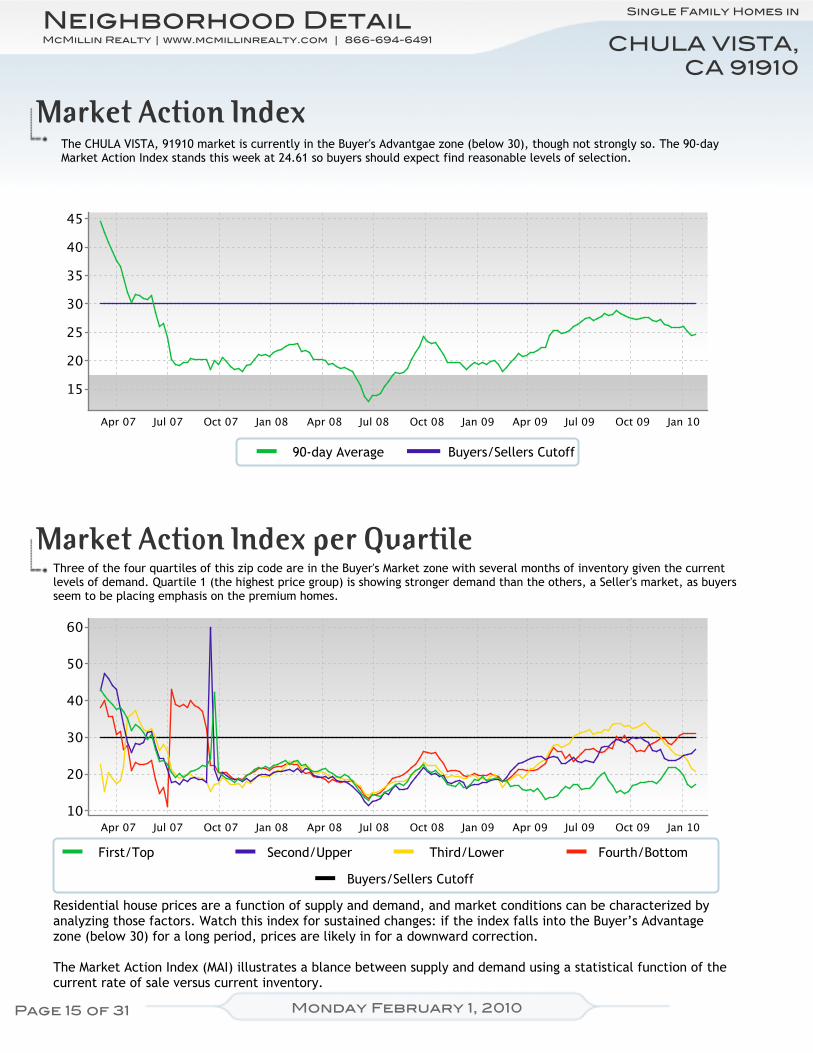
Market Action IndexThe CHULA VISTA, 91910 market is currently in the Buyer's Advantgae zone (below 30), though not strongly so. The 90-dayMarket Action Index stands this week at 24.61 so buyers should expect find reasonable levels of selection.
Buyers/Sellers Cutoff90-day Average
Market Action Index per QuartileThree of the four quartiles of this zip code are in the Buyer's Market zone with several months of inventory given the currentlevels of demand. Quartile 1 (the highest price group) is showing stronger demand than the others, a Seller's market, as buyersseem to be placing emphasis on the premium homes.
First/Top Second/Upper Third/Lower Fourth/Bottom
Buyers/Sellers Cutoff
Residential house prices are a function of supply and demand, and market conditions can be characterized byanalyzing those factors. Watch this index for sustained changes: if the index falls into the Buyer’s Advantagezone (below 30) for a long period, prices are likely in for a downward correction.
The Market Action Index (MAI) illustrates a blance between supply and demand using a statistical function of thecurrent rate of sale versus current inventory.
Page 15 of 31
Single Family Homes in

McMillin Realty | www.mcmillinrealty.com | 866-694-6491
Neighborhood DetailCHULA VISTA,
CA 91910
Monday February 1, 2010
Days on MarketThe properties have been on the market for an average of 138 days. Half of the listings have come newly on the market in thepast 70 or so days.
90-day Average7-day Average
Days on Market per QuartileIt is not uncommon for the higher priced homes in an area to take longer to sell than those in the lower quartiles.
First/Top Second/Upper Third/Lower Fourth/Bottom
Page 16 of 31
Single Family Homes in

Median List Price
Median Lot Size
24.9
Percent Relisted (reset DOM)
2310
2.5
4 %
Median Number of Bathrooms
144
Inventory of Properties Listed
$ 172
Percent Flip (price increased)
4,501 - 6,500 sqft
Median House Size (sq ft)
$ 399,000
14 %
4.0
Market Action Index
Median Number of Bedrooms
Asking Price Per Square Foot
7 %
Percent of Properties with Price Decrease
Buyer's Advantage
==
±+
±+
==
≠≠
Altos Research Value Statistics
Most Expensive Listing
Average Days on Market (DoM)
Bottom/Fourth
Lower/Third
Upper/Second
Top/First
This Week Real-Time Market Profile Trend
The Market Action Index answers the question "How's the Market?" By measuringthe current rate of sale versus the amount of the inventory. Index above 30implies a seller's advantage. Below 30, conditions give the advantage to thebuyer.
Supply and Demand
Characteristics per Quartile
6 03040
1192.5 6
3.0
3
172
3.0 28
127
3
2
6,501 -8,000 sqft
9
$ 364,950
5
3
29
3.5
4,501 -6,500 sqft
02.5
1544 2.5 - 5.0acres
28
$ 295,000
4.0
158
4,501 -6,500 sqft$ 429,500
5.0$ 499,950
6
0
2462
The Market Action Index has beentrending down lately, while inventoryand days-on-market are climbing. Thetrends imply a weakening market.
Monday February 1, 2010
McMillin Realty | www.mcmillinrealty.com | 866-694-6491
28
2153
2.5
The median list price in CHULA VISTA,CA 91915 this week is $399,000. The113 properties have been on themarket for an average of 144 days.
Most expensive 25% of properties
Upper-middle 25% of properties
Lower-middle 25% of properties
Least expensive 25% of properties
Quartile Median Price Lot Size Beds Baths Age Inventory New Absorbed DOMSq. Ft.
No change
Strong upward trend Strong downward trend
Slight upward trend Slight downward trend±+
== ≠≠
≠=
CHULA VISTA,CA 91915
Neighborhood Detail
Least Expensive Listing
Average List Price
Average Age of Listing
113
$ 685,000
$ 239,580
$ 399,698
8
Trend Key:
The Market Action Index has beentrending lower for several weekswhile prices have remainedrelatively stable. If inventorycontinues to grow relative todemand however, it is likely that wewill see downward pressure onpricing.
Page 17 of 31
Single Family Homes in
McMillin Realty | www.mcmillinrealty.com | 866-694-6491
Neighborhood DetailCHULA VISTA,
CA 91915
Monday February 1, 2010
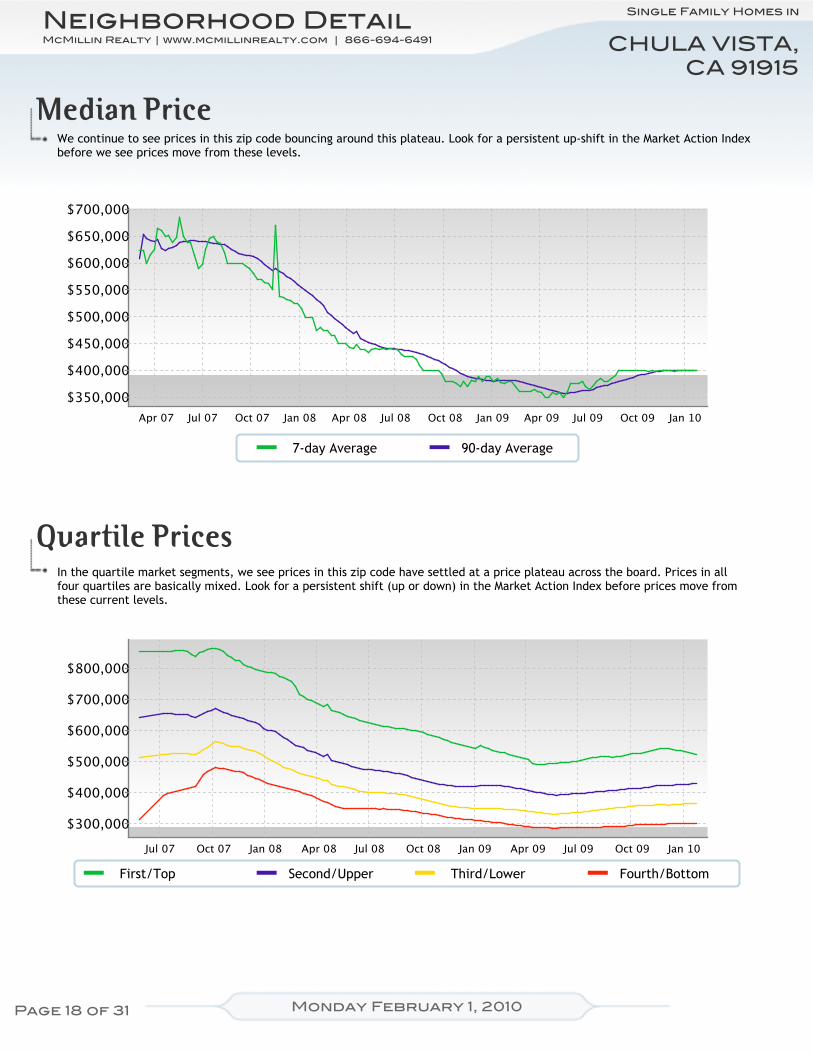
Median PriceWe continue to see prices in this zip code bouncing around this plateau. Look for a persistent up-shift in the Market Action Indexbefore we see prices move from these levels.
90-day Average7-day Average
Quartile PricesIn the quartile market segments, we see prices in this zip code have settled at a price plateau across the board. Prices in allfour quartiles are basically mixed. Look for a persistent shift (up or down) in the Market Action Index before prices move fromthese current levels.
First/Top Second/Upper Third/Lower Fourth/Bottom
Page 18 of 31
Single Family Homes in
McMillin Realty | www.mcmillinrealty.com | 866-694-6491
Neighborhood DetailCHULA VISTA,
CA 91915
Monday February 1, 2010
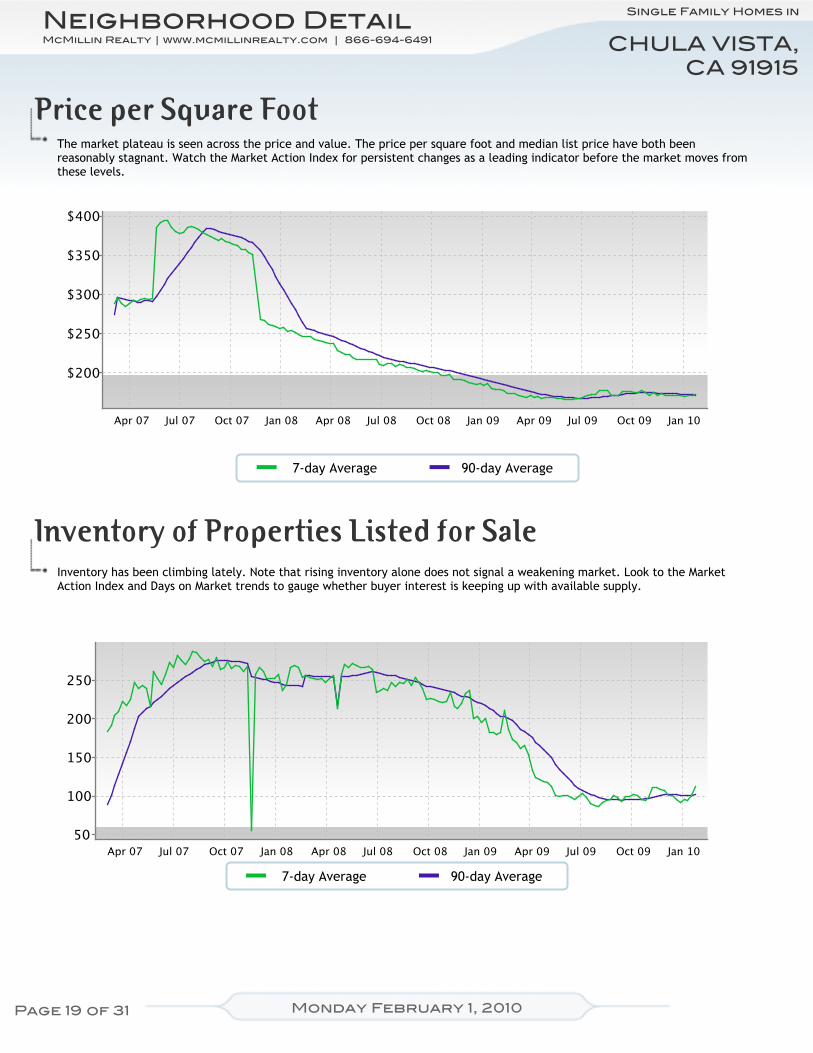
Price per Square FootThe market plateau is seen across the price and value. The price per square foot and median list price have both beenreasonably stagnant. Watch the Market Action Index for persistent changes as a leading indicator before the market moves fromthese levels.
90-day Average7-day Average
Inventory of Properties Listed for SaleInventory has been climbing lately. Note that rising inventory alone does not signal a weakening market. Look to the MarketAction Index and Days on Market trends to gauge whether buyer interest is keeping up with available supply.
90-day Average7-day Average
Page 19 of 31
Single Family Homes in

McMillin Realty | www.mcmillinrealty.com | 866-694-6491
Neighborhood DetailCHULA VISTA,
CA 91915
Monday February 1, 2010
Market Action IndexThe CHULA VISTA, 91915 market is currently in the Buyer's Advantgae zone (below 30), though not strongly so. The 90-dayMarket Action Index stands this week at 24.90 so buyers should expect find reasonable levels of selection.
Buyers/Sellers Cutoff90-day Average
Market Action Index per QuartileNot surprisingly, all quartiles are in the Buyer's Market zone with several months of inventory given the current levels ofdemand. Watch the quartiles for changes before the overall market shifts.
First/Top Second/Upper Third/Lower Fourth/Bottom
Buyers/Sellers Cutoff
Residential house prices are a function of supply and demand, and market conditions can be characterized byanalyzing those factors. Watch this index for sustained changes: if the index falls into the Buyer’s Advantagezone (below 30) for a long period, prices are likely in for a downward correction.
The Market Action Index (MAI) illustrates a blance between supply and demand using a statistical function of thecurrent rate of sale versus current inventory.
Page 20 of 31
Single Family Homes in
McMillin Realty | www.mcmillinrealty.com | 866-694-6491
Neighborhood DetailCHULA VISTA,
CA 91915
Monday February 1, 2010
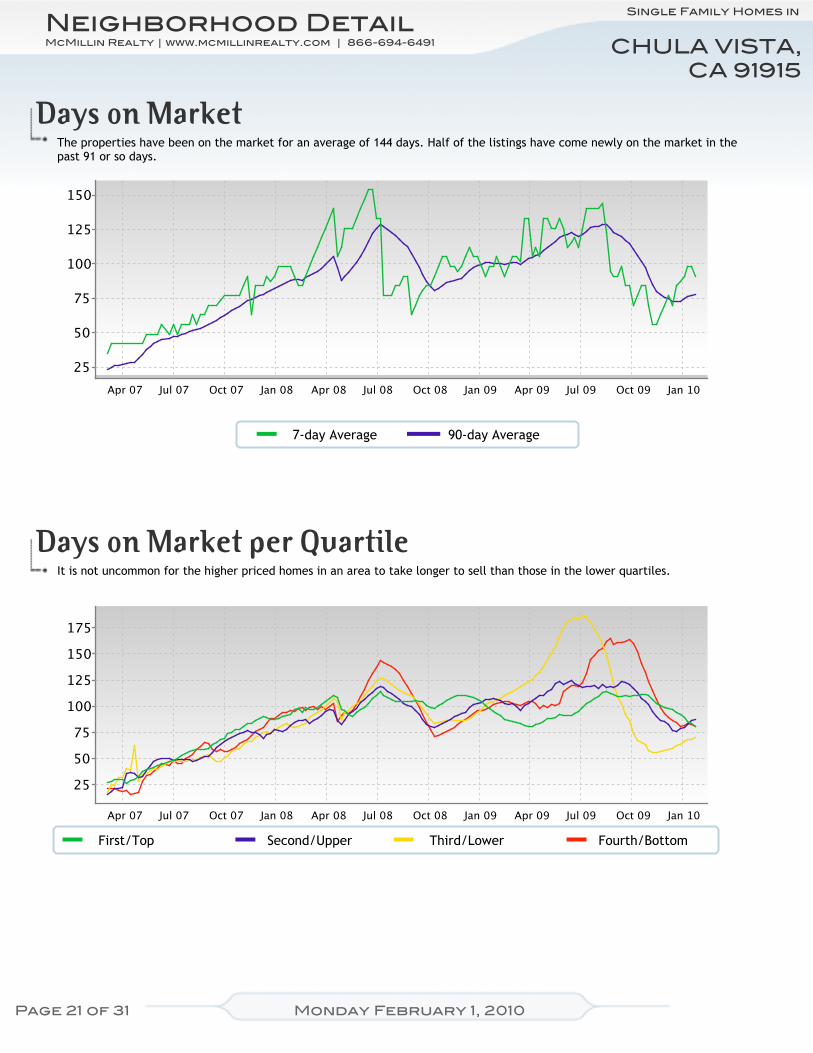
Days on MarketThe properties have been on the market for an average of 144 days. Half of the listings have come newly on the market in thepast 91 or so days.
90-day Average7-day Average
Days on Market per QuartileIt is not uncommon for the higher priced homes in an area to take longer to sell than those in the lower quartiles.
First/Top Second/Upper Third/Lower Fourth/Bottom
Page 21 of 31
Single Family Homes in

Median List Price
Median Lot Size
22.0
Percent Relisted (reset DOM)
3024
3.5
1 %
Median Number of Bathrooms
184
Inventory of Properties Listed
$ 174
Percent Flip (price increased)
8,001 - 10,000 sqft
Median House Size (sq ft)
$ 499,900
12 %
5.0
Market Action Index
Median Number of Bedrooms
Asking Price Per Square Foot
5 %
Percent of Properties with Price Decrease
Strong Buyer's
==
≠≠
±+
≠≠
==
Altos Research Value Statistics
Most Expensive Listing
Average Days on Market (DoM)
Bottom/Fourth
Lower/Third
Upper/Second
Top/First
This Week Real-Time Market Profile Trend
The Market Action Index answers the question "How's the Market?" By measuringthe current rate of sale versus the amount of the inventory. Index above 30implies a seller's advantage. Below 30, conditions give the advantage to thebuyer.
Supply and Demand
Characteristics per Quartile
4 24235
1933.0 6
4.0
6
146
5.0 21
183
2
3
0.50 - 1.0acre
7
$ 465,000
0
2
21
4.5
6,501 -8,000 sqft
13.5
2150 4,501 -6,500 sqft
21
$ 390,000
5.0
213
8,001 -10,000 sqft$ 575,000
5.0$ 670,000
5
1
3617
Demand measured by the MarketAction Index is increasing and days-on-market is trending downward.Even as more properties comeavailable, these are positive trendsfor the market.
Monday February 1, 2010
McMillin Realty | www.mcmillinrealty.com | 866-694-6491
20
2656
2.5
The median list price in CHULA VISTA,CA 91914 this week is $499,900. The83 properties have been on themarket for an average of 184 days.
Most expensive 25% of properties
Upper-middle 25% of properties
Lower-middle 25% of properties
Least expensive 25% of properties
Quartile Median Price Lot Size Beds Baths Age Inventory New Absorbed DOMSq. Ft.
No change
Strong upward trend Strong downward trend
Slight upward trend Slight downward trend±+
== ≠≠
≠=
CHULA VISTA,CA 91914
Neighborhood Detail
Least Expensive Listing
Average List Price
Average Age of Listing
83
$ 3,800,000
$ 322,000
$ 642,981
6
Trend Key:
Home sales have been exceedingnew inventory for several weeks.Since this is a Buyer's market pricesare not yet moving higher as excessinventory is consumed. However,the as supply and demand trendscontinue, the market moves into theSeller's zone, and we are likely tosee upward pressure on pricing.
Page 22 of 31
Single Family Homes in
McMillin Realty | www.mcmillinrealty.com | 866-694-6491
Neighborhood DetailCHULA VISTA,
CA 91914
Monday February 1, 2010
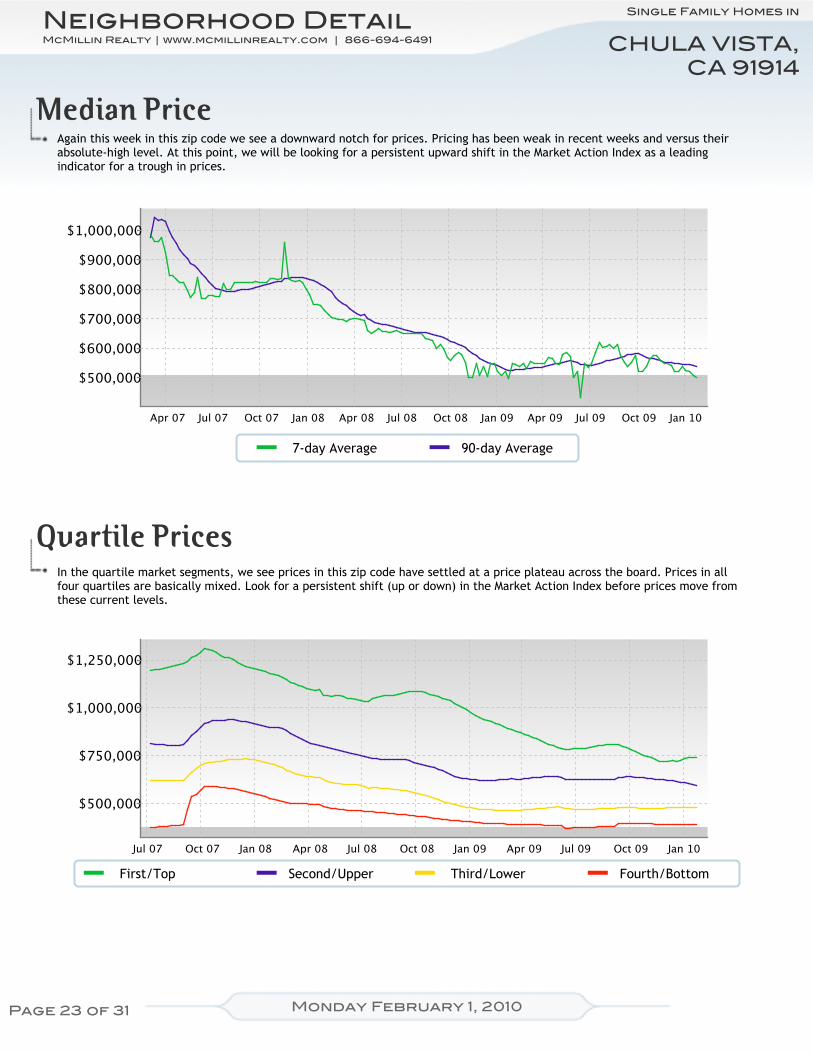
Median PriceAgain this week in this zip code we see a downward notch for prices. Pricing has been weak in recent weeks and versus theirabsolute-high level. At this point, we will be looking for a persistent upward shift in the Market Action Index as a leadingindicator for a trough in prices.
90-day Average7-day Average
Quartile PricesIn the quartile market segments, we see prices in this zip code have settled at a price plateau across the board. Prices in allfour quartiles are basically mixed. Look for a persistent shift (up or down) in the Market Action Index before prices move fromthese current levels.
First/Top Second/Upper Third/Lower Fourth/Bottom
Page 23 of 31
Single Family Homes in

McMillin Realty | www.mcmillinrealty.com | 866-694-6491
Neighborhood DetailCHULA VISTA,
CA 91914
Monday February 1, 2010
Price per Square FootDespite recently falling prices, the price per square foot has stayed reasonably flat. This implies that there's a portion of themarket being priced at a premium. You can investigate this condition in the quartile details.
90-day Average7-day Average
Inventory of Properties Listed for SaleInventory has been climbing lately. Note that rising inventory alone does not signal a weakening market. Look to the MarketAction Index and Days on Market trends to gauge whether buyer interest is keeping up with available supply.
90-day Average7-day Average
Page 24 of 31
Single Family Homes in

McMillin Realty | www.mcmillinrealty.com | 866-694-6491
Neighborhood DetailCHULA VISTA,
CA 91914
Monday February 1, 2010
Market Action IndexThe CHULA VISTA, 91914 market is currently quite strongly in the Buyer's Advantage zone (below 30). The 90-day Market ActionIndex stands at 21.96. With several months of inventory available at the current sales rate, buyers should find ample choice.
Buyers/Sellers Cutoff90-day Average
Market Action Index per QuartileNot surprisingly, all quartiles are in the Buyer's Market zone with several months of inventory given the current levels ofdemand. Watch the quartiles for changes before the overall market shifts.
First/Top Second/Upper Third/Lower Fourth/Bottom
Buyers/Sellers Cutoff
Residential house prices are a function of supply and demand, and market conditions can be characterized byanalyzing those factors. Watch this index for sustained changes: if the index falls into the Buyer’s Advantagezone (below 30) for a long period, prices are likely in for a downward correction.
The Market Action Index (MAI) illustrates a blance between supply and demand using a statistical function of thecurrent rate of sale versus current inventory.
Page 25 of 31
Single Family Homes in

McMillin Realty | www.mcmillinrealty.com | 866-694-6491
Neighborhood DetailCHULA VISTA,
CA 91914
Monday February 1, 2010
Days on MarketThe properties have been on the market for an average of 184 days. Half of the listings have come newly on the market in thepast 98 or so days.
90-day Average7-day Average
Days on Market per QuartileIt is not uncommon for the higher priced homes in an area to take longer to sell than those in the lower quartiles.
First/Top Second/Upper Third/Lower Fourth/Bottom
Page 26 of 31
Single Family Homes in

Median List Price
Median Lot Size
26.9
Percent Relisted (reset DOM)
2123
2.5
12 %
Median Number of Bathrooms
133
Inventory of Properties Listed
$ 176
Percent Flip (price increased)
4,501 - 6,500 sqft
Median House Size (sq ft)
$ 379,900
15 %
4.0
Market Action Index
Median Number of Bedrooms
Asking Price Per Square Foot
9 %
Percent of Properties with Price Decrease
Buyer's Advantage
==
±+
±+
==
≠≠
Altos Research Value Statistics
Most Expensive Listing
Average Days on Market (DoM)
Bottom/Fourth
Lower/Third
Upper/Second
Top/First
This Week Real-Time Market Profile Trend
The Market Action Index answers the question "How's the Market?" By measuringthe current rate of sale versus the amount of the inventory. Index above 30implies a seller's advantage. Below 30, conditions give the advantage to thebuyer.
Supply and Demand
Characteristics per Quartile
7 33114
1062.5 8
3.0
5
123
4.0 47
162
6
2
6,501 -8,000 sqft
8
$ 350,000
4
5
48
3.5
4,501 -6,500 sqft
33.0
1613 Less than4,500 sqft
47
$ 310,000
4.0
139
4,501 -6,500 sqft$ 410,850
5.0$ 495,000
8
2
2500
The Market Action Index has beentrending down lately, while inventoryand days-on-market are climbing. Thetrends imply a weakening market.
Monday February 1, 2010
McMillin Realty | www.mcmillinrealty.com | 866-694-6491
47
1901
2.5
The median list price in CHULA VISTA,CA 91913 this week is $379,900. The189 properties have been on themarket for an average of 133 days.
Most expensive 25% of properties
Upper-middle 25% of properties
Lower-middle 25% of properties
Least expensive 25% of properties
Quartile Median Price Lot Size Beds Baths Age Inventory New Absorbed DOMSq. Ft.
No change
Strong upward trend Strong downward trend
Slight upward trend Slight downward trend±+
== ≠≠
≠=
CHULA VISTA,CA 91913
Neighborhood Detail
Least Expensive Listing
Average List Price
Average Age of Listing
189
$ 875,000
$ 191,000
$ 392,627
10
Trend Key:
The Market Action Index has beentrending lower for several weekswhile prices have remainedrelatively stable. If inventorycontinues to grow relative todemand however, it is likely that wewill see downward pressure onpricing.
Page 27 of 31
Single Family Homes in

McMillin Realty | www.mcmillinrealty.com | 866-694-6491
Neighborhood DetailCHULA VISTA,
CA 91913
Monday February 1, 2010
Median PriceWe continue to see prices in this zip code bouncing around this plateau. Look for a persistent up-shift in the Market Action Indexbefore we see prices move from these levels.
90-day Average7-day Average
Quartile PricesIn the quartile market segments, we see prices in this zip code have settled at a price plateau across the board. Prices in allfour quartiles are basically mixed. Look for a persistent shift (up or down) in the Market Action Index before prices move fromthese current levels.
First/Top Second/Upper Third/Lower Fourth/Bottom
Page 28 of 31
Single Family Homes in

McMillin Realty | www.mcmillinrealty.com | 866-694-6491
Neighborhood DetailCHULA VISTA,
CA 91913
Monday February 1, 2010
Price per Square FootThe market plateau is seen across the price and value. The price per square foot and median list price have both beenreasonably stagnant. Watch the Market Action Index for persistent changes as a leading indicator before the market moves fromthese levels.
90-day Average7-day Average
Inventory of Properties Listed for SaleInventory has been climbing lately. Note that rising inventory alone does not signal a weakening market. Look to the MarketAction Index and Days on Market trends to gauge whether buyer interest is keeping up with available supply.
90-day Average7-day Average
Page 29 of 31
Single Family Homes in

McMillin Realty | www.mcmillinrealty.com | 866-694-6491
Neighborhood DetailCHULA VISTA,
CA 91913
Monday February 1, 2010
Market Action IndexThe CHULA VISTA, 91913 market is currently in the Buyer's Advantgae zone (below 30), though not strongly so. The 90-dayMarket Action Index stands this week at 26.86 so buyers should expect find reasonable levels of selection.
Buyers/Sellers Cutoff90-day Average
Market Action Index per QuartileNot surprisingly, all quartiles are in the Buyer's Market zone with several months of inventory given the current levels ofdemand. Watch the quartiles for changes before the overall market shifts.
First/Top Second/Upper Third/Lower Fourth/Bottom
Buyers/Sellers Cutoff
Residential house prices are a function of supply and demand, and market conditions can be characterized byanalyzing those factors. Watch this index for sustained changes: if the index falls into the Buyer’s Advantagezone (below 30) for a long period, prices are likely in for a downward correction.
The Market Action Index (MAI) illustrates a blance between supply and demand using a statistical function of thecurrent rate of sale versus current inventory.
Page 30 of 31
Single Family Homes in
McMillin Realty | www.mcmillinrealty.com | 866-694-6491
Neighborhood DetailCHULA VISTA,
CA 91913
Monday February 1, 2010
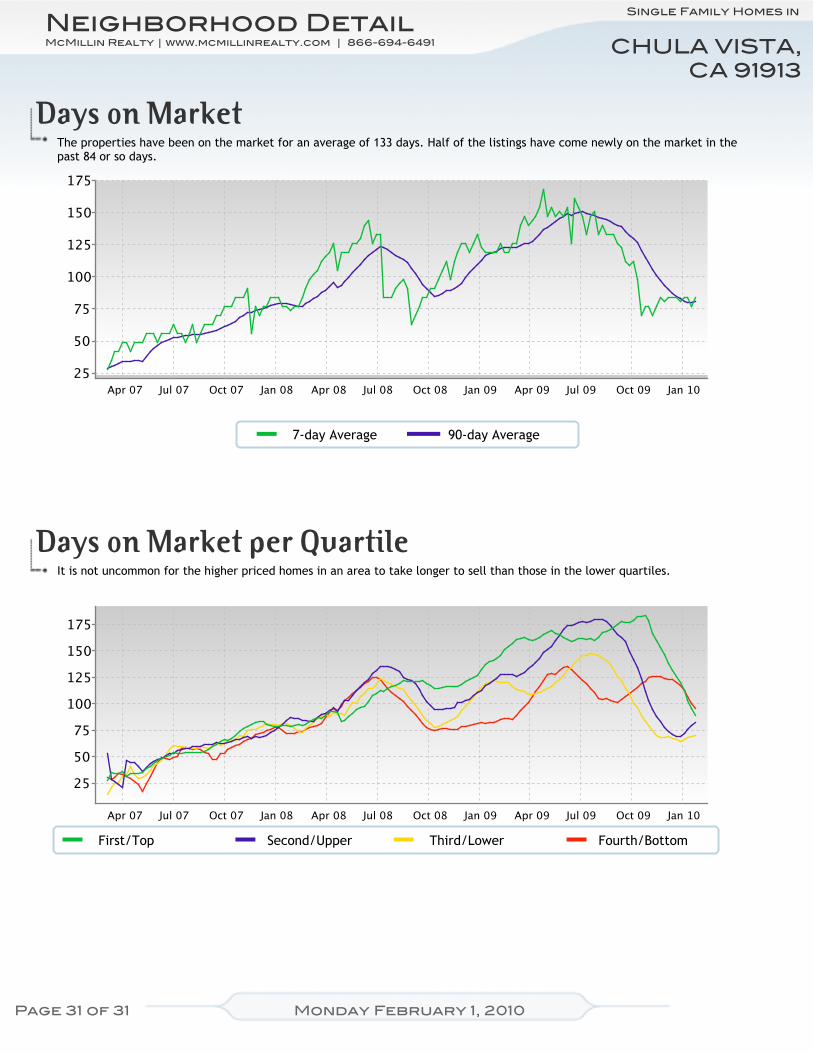
Days on MarketThe properties have been on the market for an average of 133 days. Half of the listings have come newly on the market in thepast 84 or so days.
90-day Average7-day Average
Days on Market per QuartileIt is not uncommon for the higher priced homes in an area to take longer to sell than those in the lower quartiles.
First/Top Second/Upper Third/Lower Fourth/Bottom
Page 31 of 31
Single Family Homes in