Embed Size (px)
Citation preview

Using Nightingale to Inform Your Quality Improvement Work
Chuck Mercier, MD
April 5, 2016 1
Using Nightingale to Inform Your Quality Improvement Work
NICQ NEXT2 Quality Improvement Collaborative
Jacksonville: April , 2016
Chuck Mercier, MD
Disclosures

Using Nightingale to Inform Your Quality Improvement Work
Chuck Mercier, MD
April 5, 2016 2
Learning Objectives
Participants will demonstrate they can
1. Navigate Nightingale to select appropriate measures for NICU NEXT2 Quality Collaborative work;
2. Create center‐based project‐specific data tables and graphs;
3. Compare and contrast data need for very small, small, medium and large tests of change or outcome.
Login Page
• https://vtoxford.org
• If you forgot your password, click on Forgot your password?
• If you need access, click on Need a login and password?

Using Nightingale to Inform Your Quality Improvement Work
Chuck Mercier, MD
April 5, 2016 3
Home Page
• To view reports, click on Nightingale Tables and Charts, choose a category from the drop‐down menu, or click on click here in the green box below the drop‐down menu
Query Navigation
• Category: Choose a group of measure types to view
• Population: All VLBW Infants (default); 501 to 1500g; 22 to 29 weeks; Expanded
• Location: All Infants (default); Inborn; Outborn
• Comparison Group: Network (default); NICU Type*
• Measure: Items within categories
• Group By (Measure pages only): Birth Weight 10‐level (default), Birth Weight 5‐level, Gestational Age Category, Gestational Age Week, Birth Location, Outborn Category, Birth Year
• Year: Default is current calendar year because Nightingale reflects most up‐to‐date data

Using Nightingale to Inform Your Quality Improvement Work
Chuck Mercier, MD
April 5, 2016 4
Category Page
• Click on a measure to go to a Measure page• Click on the question mark to open the data definition• Click on RA to go to the risk‐adjusted page for that measure
– applies to Key Performance Measures only
Measure Page
• Use the Group By drop‐down menu to change the display
• To see all data for that measure by year, choose Group By: Birth Year

Using Nightingale to Inform Your Quality Improvement Work
Chuck Mercier, MD
April 5, 2016 5
Infant List
• Click on one of the birth weight categories to get a birth weight specific list
• Click on All to get a list of ALL infants
Infant List
• Infant lists are sorted by Infant ID as a default.
• Every list identifies infants by 4 key variables
• You can click on the word at the top of any column to sort by that attribute.

Using Nightingale to Inform Your Quality Improvement Work
Chuck Mercier, MD
April 5, 2016 6
I know my measure, but…
• Click on Tools > Data Definitions
I know my measure, but…
• Click on one of the Nightingale Data Definitions categories, OR
• Click on Index

Using Nightingale to Inform Your Quality Improvement Work
Chuck Mercier, MD
April 5, 2016 7
…where is it?
• Click on your measure
• Find the Definition, Eligibility, Available Date, and Category Location
√
√
√
√ √ √
Reports Download
• Repository of PDF reports created by Vermont Oxford Network• Click on the name of the report to download• Search for a report by keyword in the box at the top of the File column or filter by
document type, year, or category

Using Nightingale to Inform Your Quality Improvement Work
Chuck Mercier, MD
April 5, 2016 8
Working from a report…
• Is there an opportunity for improvement here?
Working from a report…
Q3, Q1 Mean = Comparative Network values (caveats!)2007 % = Your Center’s performance
Q3
Q1
Minimum
Maximum
NETWORK
CENTER
MEDIAN
MEAN

Using Nightingale to Inform Your Quality Improvement Work
Chuck Mercier, MD
April 5, 2016 9
Making Nightingale Work for You
Big Dot
Small Dot
● Chronic Lung Disease
Nasal CPAP
● CPAP B4 ETT
● DR CPAP
Aim: To reduce chronic lung disease for inborn infants 26‐29 weeks GA by 10% from
baseline (averaged over 5 years) by December 2017
Vermont Children’s HospitalSummary of Measures
Homeroom: Minimizing Chronic Lung Disease
Outcome Measures Source Venue Priority (notes)
Chronic Lung Disease Nightingale based Homeroom Aim Primary Outcome
Pneumothorax Nightingale based Site Primary Balance
Any Ventilation Nightingale based Site Secondary (Resource)
Any Surfactant Nightingale based Site Secondary (Resource)
Home O2 Nightingale based Site Secondary (Resource)
Family bundle Center based Site Primary Family
Process Measures Source Venue Priority (notes)
DRCPAP Nightingale based Homeroom Aim Primary Process of care
DRETT Nightingale based Site Secondary (Resource)
DR Surf Nightingale based Site Secondary (Resource / proxy)
CPAP Before ETT Vent Nightingale based Site Secondary (Resource)
Vent After Early CPAP Nightingale based Site Secondary (Resource)
Surf After 2 hours Nightingale based Site Secondary (Resource)
Caffeine use Center based Site Secondary
Care algorithm deviation Center based Site Secondary (Algorithm)

Using Nightingale to Inform Your Quality Improvement Work
Chuck Mercier, MD
April 5, 2016 10
Making Nightingale Work for You
Big Dot
Small Dot
●
●
●
Aim: To improve nutrition and feeding practices for infants 26‐29 weeks GA
by December 2017
Center –Based Collaborative Dashboard(Nightingale‐Based)

Using Nightingale to Inform Your Quality Improvement Work
Chuck Mercier, MD
April 5, 2016 11
Care Measures – Center ValuesMinimizing Chronic Lung Disease
Vermont Children’s Hospital2010 – 2012
Download Data
• Choose file format to download (most often Excel)

Using Nightingale to Inform Your Quality Improvement Work
Chuck Mercier, MD
April 5, 2016 12
Download Data –Web Administrators
• Web Services Administrators can download files of raw, infant‐level data
• Data keys (PDF files) explain the variable names and values
***SIDE BAR ***
Download Data ‐Web Administrators
• Save as an Excel spreadsheet (e.g. VON Raw Data Summary 2015)
• Choose target columns
***SIDE BAR ***

Using Nightingale to Inform Your Quality Improvement Work
Chuck Mercier, MD
April 5, 2016 13
Download Data –Web Administrators
***SIDE BAR ***
• Field Name = Column Header
• Codes and Ranges = Cell entries
***SIDE BAR ***
Download Data –Web Administrators

Using Nightingale to Inform Your Quality Improvement Work
Chuck Mercier, MD
April 5, 2016 14
What’s in a Name
• SURFX → Field Name
• Surfactant At Any Time → Measure Name
– Surfactant → Group Measure Name
– Respiratory Care → Category
***SIDE BAR ***
How do I make my own…?
• Determine your “study” group inclusion criteria
– Population; Location; Group by; Mortality (Survival)
– Click <ALL> to view patient level data
– Consider PRE‐Download sorting
• Download (SAVE OPTIONS>Download as Excel)
• Save as an Excel workbook
– Download format is type: Web Page
– Label inclusion criteria
– Consider Post‐Download sorting

Using Nightingale to Inform Your Quality Improvement Work
Chuck Mercier, MD
April 5, 2016 15
How do I make my own…?
• ALWAYs label (Population; Location; Group by; Year)• Consider ALWAYs keeping Infant ID to your left most column• Sort by measure of primary of interest (your right most column)• If eliminating patients, consider amending label• Example: GA 22‐29 weeks, All Infants, by GA Week, Eliminated Early Deaths, 2014
How do I make my own…?
• Determine your “measures”
– Use identical Population, Location, Group by, Year
– Do not Pre‐Sort
• Download
– copy and past all rows and columns to Baseline Excel spreadsheet
• Reconcile by patient

Using Nightingale to Inform Your Quality Improvement Work
Chuck Mercier, MD
April 5, 2016 16
How do I make my own…?
• Hide or delete redundant columns• Track patients eliminated from baseline
Allows first pass reconciliation
How do I make my own…?
• Sorted, cleaned• Two discrepancies attributable to infant death after 12 hours
Infants 1611, 1614• One discrepancy attributable to early infant death
Infant 1612• One discrepancy attributable to cranial imaging = NO
Infant 1579? Population (denominator) implication

Using Nightingale to Inform Your Quality Improvement Work
Chuck Mercier, MD
April 5, 2016 17
The Measure Conundrum
• Define the denominator for every variable
– What is the infant population at risk?
– If each of the cases had NOT acquired the condition (e.g. had the disease), would s/he still be included in the population?
• Define the numerator for every variable
– What is the case definition?
– If each of the non‐cases in the population had acquired the condition, would s/he have been included as a case?
The Measure Conundrum
• Specified morbidities: CLD and/or PVL
– Population of infants at risk: 20
– Infants with CLD alone: 5
– Infants with PVL alone: 5
– Infants with CLD and PVL: 5
• What is the rate of CLD?
• What is the rate of PVL?
• What is the rate of specified morbidities?
• How does this impact your aim statement?

Using Nightingale to Inform Your Quality Improvement Work
Chuck Mercier, MD
April 5, 2016 18
Case Studies
Population: infants at risk Cases
Case Studies
• Case 1: DRCPAP=Yes, DRETT=Yes
– Interpretation
– Impact on improvement
• Case 2: Surf AT, DR Surf, Surf>2
– Interpretation
– Impact on improvement

Using Nightingale to Inform Your Quality Improvement Work
Chuck Mercier, MD
April 5, 2016 19
Charts
• What should we be working on?
Charts
• What should we be improving?
• By how much should we aim to improve?

Using Nightingale to Inform Your Quality Improvement Work
Chuck Mercier, MD
April 5, 2016 20
Charts
• Which patients are cases; which are controls
Charts
• How have we performed over time?

Using Nightingale to Inform Your Quality Improvement Work
Chuck Mercier, MD
April 5, 2016 21
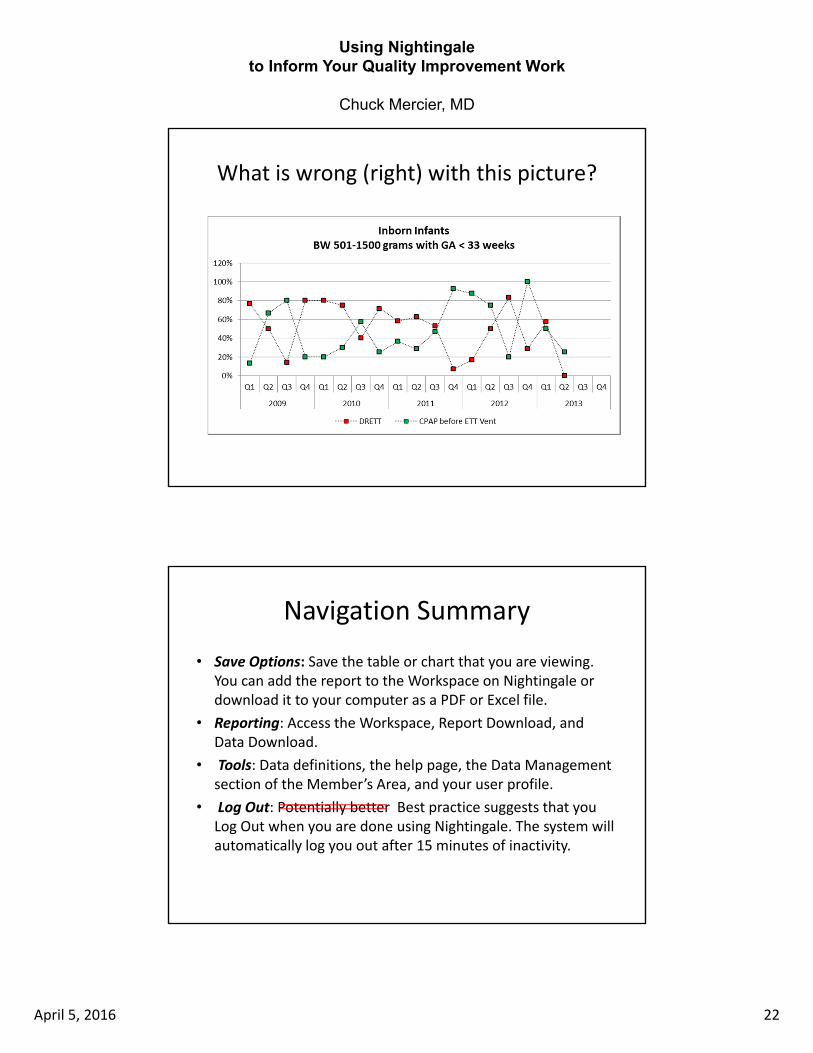
What is wrong (right) with this picture?
What is wrong (right) with this picture?
Using Nightingale to Inform Your Quality Improvement Work
Chuck Mercier, MD
April 5, 2016 22
What is wrong (right) with this picture?
Navigation Summary
• Save Options: Save the table or chart that you are viewing. You can add the report to the Workspace on Nightingale or download it to your computer as a PDF or Excel file.
• Reporting: Access the Workspace, Report Download, and Data Download.
• Tools: Data definitions, the help page, the Data Management section of the Member’s Area, and your user profile.
• Log Out: Potentially better Best practice suggests that you Log Out when you are done using Nightingale. The system will automatically log you out after 15 minutes of inactivity.

Using Nightingale to Inform Your Quality Improvement Work
Chuck Mercier, MD
April 5, 2016 23
Nightingale Internet Reporting System
• Reporting Hub
– Center data within 30 minutes of submission
– Download PDF reports
– Risk‐adjusted results