Embed Size (px)
Citation preview

Chronic Disease Area Profile Data as at November 2017

NWMPHN Chronic Disease Profile Data as at July 2017 2
TABLE OF CONTENTS
1 CHRONIC DISEASE AREA PROFILE...................................................................................... 3 SUMMARY .................................................................................................................................. 3 1.1 Analysis notes .................................................................................................................. 3 1.2 About chronic disease ...................................................................................................... 3 1.3 Target populations ........................................................................................................... 4 1.4 Chronic disease in north western melbourne phn .......................................................... 6 1.5 Service response ............................................................................................................ 11 1.6 Future opportunities ...................................................................................................... 13
2 OTHER DATA .................................................................................................................. 14 2.1 Self reported prevalence of chronic disease ................................................................. 14
INDEX OF FIGURES AND TABLES Figure 1: Patient age-specific prevalence of 2 or more chronic conditions ............................................................................... 4 Figure 2: Historical and forecast population of people aged 70 or older and 85 and older in NWMPHN catchment (ABS ERP, ABS Census 2016, VIF2016) ....................................................................................................................................................... 5 Figure 3: 2016 and forecast 2026 population of people aged 70 or older by LGA NWMPHN catchment (ABS Census and VIF2016) ..................................................................................................................................................................................... 5 Figure 4: Deciles of Index of Relative Socioeconomic Disadvantage (IRSD) 2011 ...................................................................... 6 Figure 5: Self reported prevalence of asthma, type 2 diabetes, and heart disease ................................................................ 14 Figure 6: Self reported prevalence of high blood pressure and arthritis ................................................................................. 14
Table 1: Standardised ratio of estimated number of people aged 18 years with specified health determinant (2014-15) ...... 7 Table 2: Standardised ratio of estimated number of people with chronic health condition 2011–12 ...................................... 8 Table 3: Standardised ratio of avoidable deaths, persons aged 0 to 74 years (2010 to 2014) .................................................. 8 Table 4: Potentially preventable hospitalisations per 100,000 people (age-standardised) in 2015–16 by NWMPHN SA3 area ................................................................................................................................................................................................... 9 Table 5: Standardised ratio of hospital admission rates for selected conditions, public and private hospitals (2012-13) ...... 11 Table 6: Patients and services per 100,000 people for GP multidisciplinary case conferencing items by provider location (SA3 areas) ............................................................................................................................................................................... 12 Table 7: Patients and services per 1000 people for GP Heath Assessment items by provider location (SA3 areas) ............... 12 Table 8: Population aged 70+ in the NWMPHN municipalities 2016 and projected to 2031 .................................................. 15 Table 9: Population aged 85+ in the NWMPHN municipalities 2016 and projected to 2031 .................................................. 15 Table 10: Patients and services per 100,000 people for asthma care planning items by provider location (SA3 areas) ......... 16 Table 11: Patients and services per 100,000 people for cervical screening items by provider location (SA3 areas) ............... 16 Table 12: Patients and services per 100,000 people for diabetes care planning items by provider location (SA3 areas) ....... 17 Table 13: Patients and services per 100,000 people for medication review items by provider location (SA3 areas).............. 17 Table 14: Patients and services per 100,000 people for mental health care planning items by provider location (SA3 areas) ................................................................................................................................................................................................. 18 Table 15: PBS prescriptions dispensed, decile of age and sex standardised rate, by SA3, 2013–14 ....................................... 19

NWMPHN Chronic Disease Profile Data as at July 2017 3
1 CHRONIC DISEASE AREA PROFILE
SUMMARY
• Chronic conditions have complex and multiple causes; are generally long-term and persistent, and often lead to a gradual deterioration of health and loss of independence.
• Many chronic conditions occur across the life cycle, although they become more prevalent with older age. More than 70 per cent of people aged over 60 have two or more chronic conditions. Higher prevalence is experienced by people in the lowest socioeconomic areas.
• There is forecast to be more than a 95% increase in the number of people aged over 70 in the 15 years to 2031.
• These broad patterns of chronic disease are represented in the NWMPHN by: o Higher prevalence of key precursors of chronic disease in some of the growth and
peri-urban locations (overweight and obesity, tobacco consumption, low dietary fruit and exercise)
o Higher rates of chronic health conditions, preventable hospitalisation and avoidable deaths have a similar correlation to the socioeconomic determinants.
• General practice is offered incentives for improvements in chronic disease management, through MBS items for case conferencing and health care assessments. The uptake of these items across the region has been variable with low rates in many of the high chronic disease areas.
1.1 Analysis notes
Throughout this profile, colour schemes have been added to tables to provide a ranking within a comparison population. In most analyses where Local Government Area (LGA) values or rates are displayed, the colours correspond to the decile of the value within the distribution comprised of Greater Melbourne LGAs.
In other words, the 31 Greater Melbourne LGA’s are ranked in order and arranged into approximately 10 groups (~3 in each). For purposes of consistency, if an LGA within the NWMPHN catchment is performing worse than the median Greater Melbourne LGA it is red, the deeper the red the worse it is. The better performing LGAs are coloured varying shades of green.
1.2 About chronic disease
The term 'chronic disease' covers a wide group of conditions, illnesses and diseases.
Chronic conditions have complex and multiple causes; are generally long-term and persistent, and often lead to a gradual deterioration of health and loss of independence. While not usually immediately life threatening, chronic conditions are the most common and leading cause of premature mortality.
Many chronic conditions occur across the life cycle, although they become more prevalent with older age. More than 70 per cent of people aged over 60 have two or more chronic conditions (Figure 1). Higher prevalence of chronic conditions is experienced by people in the lowest socioeconomic areas and those in rural and remote communities.

NWMPHN Chronic Disease Profile Data as at July 2017 4
They can result from the complex interaction of external factors and biological causes, usually over a long period, and can lead to functional limitations and disability. If the biological and metabolic changes that occur during these long latency periods were identified, early intervention strategies, including prevention, treatment and management plans, may be implemented. Once present, chronic diseases often persist throughout a person's life, so there is generally a need for long-term management by individuals and health professionals.1
Figure 1: Patient age-specific prevalence of 2 or more chronic conditions2
Although chronic diseases cover a diverse group of conditions the following chronic diseases are typically used as markers of prevalence, as they pose significant health problems, have been the focus of ongoing national surveillance efforts, and actions can be taken to prevent them:
• Arthritis • Asthma • Back pain and problems • Cancer (such as lung and colorectal cancer) • Cardiovascular disease (such as coronary heart disease and stroke) • Chronic obstructive pulmonary disease (COPD) • Diabetes
1.3 Target populations
As the prevalence of chronic disease is related to age of the population, an understanding of the age distribution of the current and projected population is important. The current Victorian government population projections estimate that there will be more than a 95% increase in the number of people aged over 70 in the 15 years to 2031 (Figure 2, p 5). This growth is forecast to be concentrated in the Local Government Areas (LGAs) of Melbourne, Brimbank, Hume, Melton and Wyndham (Figure 3, p.5).
1 AIHW 2016. Australia's health 2016. Australia's health no. 15. Cat. no. AUS 199. Canberra: AIHW. 2 Harrison C, Britt H, Miller G, et al Examining different measures of multimorbidity, using a large prospective cross-sectional study in Australian general practice BMJ Open 2014;4:e004694. doi: 10.1136/bmjopen-2013-004694
0102030405060708090
100
0-9 10-19 20-29 30-39 40-49 50-59 60-69 70-79 80-89 90+
% o
f pop
ulat
on
Age group

NWMPHN Chronic Disease Profile Data as at July 2017 5
Figure 2: Historical and forecast population of people aged 70 or older and 85 and older in NWMPHN catchment (ABS ERP, ABS Census 2016, VIF2016)
Figure 3: 2016 and forecast 2026 population of people aged 70 or older by LGA NWMPHN catchment (ABS Census and VIF2016)
-
50,000
100,000
150,000
200,000
250,000
300,000
2010 2015 2020 2025 2030
70+ 85+

NWMPHN Chronic Disease Profile Data as at July 2017 6
1.4 Chronic disease in north western melbourne phn
1.4.1 Determinants of chronic disease In addition to the age profile of the community, there are a number of other key determinants related to chronic disease prevalence. These include lifestyle related health behaviours and biomedical factors such as: tobacco use; physical activity and exercise; and body weight.
Additionally, the broad features of society and socioeconomic characteristics (ie. affluence, employment, education) contribute to the achievement of positive lifestyle related health behaviours and the establishment of chronic disease.
The Index of Relative Socioeconomic Disadvantage is a standardized approach developed by the ABS for the measurement of socioeconomic disadvantage. Figure 4 illustrates the variation across the area with some highly-advantaged areas and some very disadvantaged areas.
Figure 4: Deciles of Index of Relative Socioeconomic Disadvantage (IRSD) 2011
Source: ABS Census 2011

NWMPHN Chronic Disease Profile Data as at July 2017 7
Data on the prevalence of protective health behaviours indicates a generally higher overall level of achievement in Victoria when compared to the Australian average, but with significant variation across LGAs in the NWMPHN region (Table 1, p.7). The general impression of the trend in the data is that the populations of the inner city have generally lower rates of the indicator, with higher rates in the growth and peri-urban areas.
Table 1: Standardised ratio of estimated number of people aged 18 years with specified health determinant (2014-15)
Region LGA Name
Overweight (but not
obese) Obese High waist
measurement Current
smokers
≥2 alcoholic drinks per
day 3
Adequate fruit
intake
No or low exercise in
previous week
Inner city Maribyrnong (C) 106.7 78.4 94.8 97.7 72.5 95.5 98.1
Melbourne (C) 92.8 54.7 76.5 62.8 95.5 96.2 87.8
Yarra (C) 104.0 58.2 84.5 85.3 127.3 96.8 85.7
Suburban Brimbank (C) 105.5 98.0 96.5 108.0 51.5 93.7 109.9
Darebin (C) 106.4 85.7 97.0 95.9 77.4 97.9 99.1
Hobsons Bay (C) 108.6 89.2 97.9 103.0 87.2 96.9 99.0
Moonee Valley (C) 108.7 87.3 95.2 86.0 89.0 98.7 93.8
Moreland (C) 106.8 86.8 99.5 88.8 79.2 97.6 97.1
Growth area Hume (C) 106.4 119.1 104.0 117.4 58.4 94.2 108.4
Melton (C) 109.0 127.6 107.5 110.6 66.4 95.8 103.3
Wyndham (C) 109.3 112.6 106.9 97.8 65.8 98.7 102.7
Peri-urban Macedon Ranges (S) 107.7 106.0 102.5 89.2 108.9 96.6 94.8
Moorabool (S) 106.3 125.7 104.8 115.0 103.2 94.6 102.0
Victoria 105.2 95.6 98.4 97.0 89.9 96.7 98.5
Australia 100.0 100.0 100.0 100.0 100.0 100.0 100.0
Source: PHIDU 2017. Highlights on a red (poorer performance) to green (better performance) scale
Note: The standardised ratio is a measure of the overall experience of a comparison population (LGA) in terms of the standard population (Australia) by calculating the ratio of observed prevalence to expected prevalence in the comparison population.
3 Estimated number of people aged 15 years and over
NWMPHN Chronic Disease Profile Data as at July 2017 8
1.4.2 Prevalence of chronic disease The data below illustrates the variation in prevalence and avoidable deaths from selected chronic health conditions. Apart from diabetes and circulatory disease, there are generally lower rates of prevalent illness in the inner locations and higher in growth and peri-urban LGAs (Table 2, below).
Table 2: Standardised ratio of estimated number of people with chronic health condition 2011–12
Region LGA Name Diabetes mellitus
High blood cholesterol
Circulatory system Asthma COPD
Musculo skeletal Arthritis
Inner city Maribyrnong (C) 127.3 98.0 105.2 87.1 75.2 90.8 84.5
Melbourne (C) 86.3 107.6 94.9 76.3 71.2 86.6 82.4
Yarra (C) 104.2 98.1 98.6 93.4 79.7 93.9 83.9
Suburban Brimbank (C) 163.4 96.7 96.1 82.3 69.4 91.7 92.4
Darebin (C) 123.9 98.5 100.5 95.3 77.8 96.1 101.4
Hobsons Bay (C) 104.9 99.1 99.5 100.3 77.7 94.1 95.7
Moonee Valley (C) 103.8 100.2 94.6 94.0 76.0 95.4 91.0
Moreland (C) 124.0 98.8 99.6 92.5 77.4 95.4 101.6
Growth area Hume (C) 134.7 97.8 96.0 98.9 79.0 100.6 102.5
Melton (C) 111.1 98.1 101.4 105.8 77.5 98.6 95.8
Wyndham (C) 101.5 99.3 95.4 92.7 74.1 91.6 86.9
Peri-urban Macedon Ranges (S) 61.6 104.9 90.2 128.3 78.6 96.8 91.4
Moorabool (S) 69.0 100.4 97.0 128.2 85.0 101.3 96.8
Victoria 87.7 101.7 96.1 106.7 78.0 96.1 94.9
Australia 100.0 100.0 100.0 100.0 100.0 100.0 100.0
Source: PHIDU 2017. Highlights on a red (poorer performance) to green (better performance) scale
A different pattern is illustrated in examining avoidable deaths (Table 3), in that Maribyrnong has high rates across most conditions, unlike the other inner city LGAs, and Macedon Ranges has low rates unlike the other growth and peri-urban locations.
Table 3: Standardised ratio of avoidable deaths, persons aged 0 to 74 years (2010 to 2014)
Region LGA Name Cancer Diabetes Circulatory IHD Cerebrovasc Respiratory COPD
Inner city Maribyrnong (C) 92.6 151.1* 120.9** 127.2* 105.7 123.6 123.2
Melbourne (C) 65.5** 40.6* 76.6* 77.8 70.6 70.2* 79.6
Yarra (C) 90.8 120.0 83.6 79.6 105.0 86.8 79.4
Suburban Brimbank (C) 82.7* 154.8** 99.9 89.6 122.6 67.6** 65.5**
Darebin (C) 94.0 73.9 107.8 117.0* 93.4 82.3 84.1
Hobsons Bay (C) 112.9** 77.4 103.4 104.3 115.6 118.8 114.6
Moonee Valley (C) 76.6** 108.7 82.6* 88.9 78.8 73.5 75.6
Moreland (C) 106.7 131.2 100.7 105.5 97.7 68.9* 69.7*
Growth area Hume (C) 96.0 110.0 109.4 114.0 88.6 113.5* 112.8
Melton (C) 93.2 133.7 104.7 102.6 112.0 111.7 107.9
Wyndham (C) 86.7 83.7 86.0 81.8* 99.6 98.2 96.2
Peri-urban Macedon Ranges (S) 80.2** 58.8 74.2** 69.5* 78.4 61.2* 66.4
Moorabool (S) 97.2 69.9 97.2 95.9 107.4 114.1 107.7
Victoria 97.1** 86.8** 90.4** 89.2** 96.6 87.4** 86.3**
Australia 100.0 100.0 100.0 100.0 100.0 100.0 100.0
Source: PHIDU 2017. Highlights on a red (poorer performance) to green (better performance) scale
*statistically significant, at the 95% confidence level, **statistically significant, at the 99% confidence level

NWMPHN Chronic Disease Profile Data as at July 2017 9
1.4.3 Potentially Preventable Hospitalisations Analysis of Potentially Preventable Hospitalisations (PPH) provides another lens to examine the impact of chronic disease on the community. It is used as a health system performance indicator of accessibility and effectiveness in the Australian National Healthcare Agreement.
This indicator has been developed to provide an estimation on the level of admissions to hospital for a condition where the hospitalisation could potentially have been prevented through the provision of appropriate individualised preventative health interventions and early disease management. These interventions would usually be delivered in primary care and community-based care settings (including by general practitioners, medical specialists, dentists, nurses and allied health professionals).
A key limitation is that not all the hospitalisations captured by the indicator could have been prevented, at least in the short term. While some of these admissions could have been prevented by more effective management in the period leading up to hospitalisation, other admissions may reflect chronically ill or elderly patients who have received optimum management in primary care. While the chronic conditions leading to hospitalisation may have been prevented through primary prevention initiatives (such as quit smoking interventions or physical activity programs), the long time lag between disease onset and complications leading to hospital admission means that such initiatives may take many years to impact on admission rates.
Despite these limitations, it does provide a geographic analysis of the different levels of burden across the community with higher PPH levels in the outer metropolitan areas of Melton-Bacchus Marsh, Wyndham and Tullamarine-Broadmeadows. The inner areas of Melbourne, Yarra, Essendon and Darebin-South have lower reported PPH levels.
Table 4: Potentially preventable hospitalisations per 100,000 people (age-standardised) in 2015–16 by NWMPHN SA3 area
SA4 SA3 name Total
PPH rate
Headline conditions
Cellulitis
Kidney and urinary
tract infections
Chronic obstructive pulmonary
disease (COPD)
Congestive heart
failure Diabetes
complications
Melbourne - Inner Brunswick - Coburg 2,295 240 215 190 273 155
Darebin - South 2,043 132 233 157 232 146
Essendon 2,199 133 154 163 188 155
Melbourne City 2,479 174 203 190 207 263
Yarra 2,166 139 212 158 198 111
Melbourne - N East Darebin - North 2,857 170 249 260 336 272
Melbourne - N West Keilor 2,170 202 199 161 207 142
Macedon Ranges 1,992 97 174 204 122 144
Moreland - North 2,785 201 244 230 313 244
Sunbury 2,727 208 178 295 202 281
Tulla – Bmeadows 3,077 204 247 294 339 249
Melbourne - West Brimbank 2,573 158 200 202 304 276
Hobsons Bay 2,301 161 200 156 192 212
Maribyrnong 2,437 152 189 234 284 237
Melton - B Marsh 2,599 194 207 258 237 256
Wyndham 2,747 210 276 311 242 265

NWMPHN Chronic Disease Profile Data as at July 2017 10
SA4 SA3 name Total
PPH rate
Headline conditions
Cellulitis
Kidney and urinary
tract infections
Chronic obstructive pulmonary
disease (COPD)
Congestive heart
failure Diabetes
complications
NWMPHN 2,515 178 219 221 260 225
Other Victorian PHNs
Eastern Melbourne 2,304 186 220 157 201 164
South Eastern Melb 2,665 224 295 241 213 183
Gippsland 2,913 287 260 285 206 241
Murray 2,826 262 266 321 214 210
Western Victoria 2,491 191 223 251 175 181
Australia 2,643 253 288 260 211 183
Sources: AIHW analysis of the National Hospital Morbidity Database and Australian Bureau of Statistics, Estimated Resident Population. http://www.myhealthycommunities.gov.au/our-reports/potentially-preventable-hospitalisations-update/july-2017/web-update
Highlights on a red (poorer performance) to green (better performance) scale

NWMPHN Chronic Disease Profile Data as at July 2017 11
1.5 Service response
1.5.1 Use of services The assessment of the level of service use can be used as a measure of both the adequacy of the availability of services and the impact of the condition on a population. The data below provides initial analysis on the level of chronic disease management in hospitals and general practice.
Hospitalisation The data in Table 5 (below) illustrates the variation in the hospital admission rates across the NWMPHN area for selected chronic diseases, illustrating generally lower admission rates in the inner locations and higher rates in the growth areas and peri-urban locations. This trend appears to be in line with the data presented earlier.
Table 5: Standardised ratio of hospital admission rates for selected conditions, public and private hospitals (2012-13)
Region LGA Name Circulatory Respiratory Cancer Dialysis
Inner city Maribyrnong (C) 91.6** 73.5** 78.2** 144.2**
Melbourne (C) 75.8** 69.9** 93.2** 81.6**
Yarra (C) 77.7** 72.4** 97.6** 108.8**
Suburban Brimbank (C) 97.6 75.8** 79.9** 155.8**
Darebin (C) 96.5* 80.4** 105.7** 185.9**
Hobsons Bay (C) 98.8 73.6** 96.9** 94.0**
Moonee Valley (C) 93.8** 77.8** 103.2 106.3**
Moreland (C) 97.4 91.2** 97.9** 107.8**
Growth area Hume (C) 107.7** 103.3 102.6** 161.2**
Melton (C) 115.1** 92.7** 95.0** 167.2**
Wyndham (C) 112.5** 78.9** 90.6** 96.0**
Peri-urban Macedon Ranges (S) 87.2** 83.7** 99.2** 41.4**
Moorabool (S) 109.0* 119.9** 103.2** ..
Victoria 99.0** 90.5** 104.7** 101.8**
Australia 100.0 100.0 100.0 100.0
Source: PHIDU 2017. Highlights on a red (poorer performance) to green (better performance) scale
*statistically significant, at the 95% confidence level, **statistically significant, at the 99% confidence level
General practice chronic disease management plan There are a range of MBS items to assist general practice and allied health to in the management of patients with chronic disease through specific items for health assessments and undertaking multidisciplinary case conferencing. The release of MBS data by small area provides some insight into the uptake of these items across the NWMPHN area.
Table 6 and 7 (below) provides data on the variation in take-up of GP multidisciplinary case conferencing and GP Health Assessments by SA3 area. These data illustrate a wide variation in utilisation across the catchment. Overall there has been an increase in the per capita uptake in the case conferencing, and a static rate in Health Assessments. Low rates of Health Assessments in Melbourne City and Yarra would be partially explained by the younger age profile in those areas. Data for additional chronic disease items is provided in Table 10 to Table 14.

NWMPHN Chronic Disease Profile Data as at July 2017 12
Table 6: Patients and services per 100,000 people for GP multidisciplinary case conferencing items by provider location (SA3 areas)
Patients per 100k people Services per 100k people SA4 SA3 2013 2014 2015 2016 2013 2014 2015 2016 Melbourne - Inner Brunswick - Coburg 32.6 35.3 40.7 43.5 53.0 57.7 65.4 79.3 Darebin - South 9.3 8.3 6.6 8.4 13.7 12.6 9.1 12.5 Essendon 28.5 34.1 33.8 33.0 38.2 51.8 46.3 41.2 Melbourne City 5.9 8.3 15.9 17.4 8.9 11.3 26.4 26.8 Yarra 10.6 12.7 18.6 17.3 13.5 17.5 25.1 23.5 Melbourne - N East Darebin - North 5.4 9.6 19.3 22.8 8.3 15.3 29.6 34.9 Melbourne - N West Keilor 2.2 6.1 5.2 5.5 2.5 8.2 7.3 6.5 Macedon Ranges 55.5 62.7 68.1 74.9 86.7 98.9 102.5 111.4 Moreland - North 17.7 14.7 14.2 13.7 27.0 26.1 24.3 22.5 Sunbury 19.6 35.5 48.7 50.3 24.5 44.1 58.1 67.5 Tulla - Bmeadow 25.4 34.2 50.2 57.4 33.0 51.2 83.6 96.8 Melbourne - West Brimbank 10.1 13.4 19.7 24.3 13.7 20.6 29.5 33.6 Hobsons Bay 7.9 15.5 19.3 28.7 11.1 20.8 30.6 49.6 Maribyrnong 0.8 1.7 4.4 9.0 1.0 1.9 4.6 10.8 Melton - B Marsh 27.5 41.6 47.8 56.7 37.8 60.6 68.8 83.8 Wyndham 17.9 22.4 25.9 29.5 27.5 34.2 42.3 45.1 Victoria Victoria 16.3 21.8 27.3 32.4 25.6 34.5 43.0 50.7 Australia Australia 18.1 24.0 30.8 37.3 31.3 41.2 53.4 65.3
Source: MBS Statistics http://www.health.gov.au/internet/main/publishing.nsf/Content/PHN-MBS_Data, ABS ERP. Item numbers: 735, 739, 743, 747, 750, 758, 10997. Highlights on a red (lower) to green (higher) scale
Table 7: Patients and services per 1000 people for GP Heath Assessment items by provider location (SA3 areas)
Patients per 1000 people Services per 1000 people SA4 SA3 2013 2014 2015 2016 2013 2014 2015 2016 Melbourne - Inner Brunswick - Coburg 30.1 31.8 36.5 30.3 30.5 32.3 36.7 30.4 Darebin - South 38.2 29.1 27.9 29.0 38.6 29.3 28.0 29.2 Essendon 41.2 40.3 44.7 46.5 41.9 41.1 45.1 46.8 Melbourne City 8.1 11.4 11.2 12.3 8.2 11.6 11.2 12.4 Yarra 16.5 15.5 19.4 18.8 16.6 15.7 19.4 18.8 Melbourne - N East Darebin - North 29.0 29.4 32.8 30.6 29.3 29.9 32.9 30.6 Melbourne - N West Keilor 21.4 25.3 27.4 32.5 21.5 25.6 27.4 32.7 Macedon Ranges 29.2 27.2 26.0 25.1 29.5 27.4 26.2 25.3 Moreland - North 44.9 50.7 45.4 43.7 45.9 51.6 45.6 43.8 Sunbury 39.0 30.5 26.7 24.9 39.4 30.9 26.8 25.0 Tulla - Bmeadow 25.5 32.6 36.0 30.7 25.9 33.4 36.4 31.0 Melbourne - West Brimbank 27.8 30.2 28.6 27.4 28.2 30.6 28.8 27.7 Hobsons Bay 20.2 27.7 23.4 25.6 20.4 28.4 23.5 25.6 Maribyrnong 32.5 33.3 35.7 31.7 33.2 33.9 36.0 31.8 Melton - B Marsh 22.1 30.2 33.0 30.3 22.5 30.7 33.1 30.4 Wyndham 25.0 29.8 27.7 19.9 26.1 30.7 27.9 20.0 Victoria Victoria 29.0 31.5 32.1 30.6 29.6 32.1 32.4 31.1 Australia Australia 36.7 41.2 43.6 42.9 38.3 43.3 46.4 47.0
Source: MBS Statistics http://www.health.gov.au/internet/main/publishing.nsf/Content/PHN-MBS_Data, ABS ERP. Item numbers: 701, 703, 705, 707, 715, 10987. Highlights on a red (lower) to green (higher) scale

NWMPHN Chronic Disease Profile Data as at July 2017 13
1.6 Future opportunities
The data presented above illustrates the existing challenges for the NWMPHN and allows the identification of a number of opportunities to improve the level of chronic disease management. These include:
• Increasing work with primary care agencies and local government to increase the impact of primary prevention programs.
• Improve the reach of chronic disease management programs in the high population growth areas and those with high prevalence of disease and risk factors.
NWMPHN Chronic Disease Profile Data as at July 2017 14
2 OTHER DATA
2.1 Self reported prevalence of chronic disease
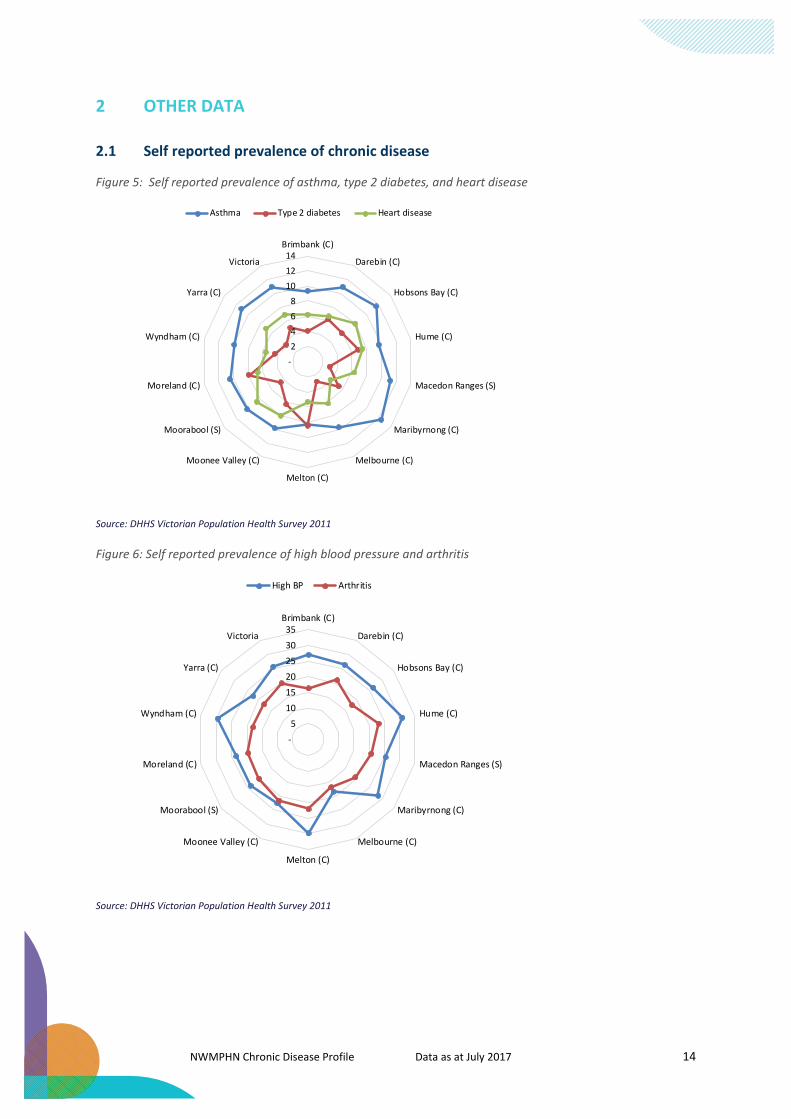
Figure 5: Self reported prevalence of asthma, type 2 diabetes, and heart disease
Source: DHHS Victorian Population Health Survey 2011
Figure 6: Self reported prevalence of high blood pressure and arthritis
Source: DHHS Victorian Population Health Survey 2011
- 2 4 6 8
10 12 14Brimbank (C)
Darebin (C)
Hobsons Bay (C)
Hume (C)
Macedon Ranges (S)
Maribyrnong (C)
Melbourne (C)
Melton (C)
Moonee Valley (C)
Moorabool (S)
Moreland (C)
Wyndham (C)
Yarra (C)
Victoria
Asthma Type 2 diabetes Heart disease
- 5
10 15 20 25 30 35Brimbank (C)
Darebin (C)
Hobsons Bay (C)
Hume (C)
Macedon Ranges (S)
Maribyrnong (C)
Melbourne (C)
Melton (C)
Moonee Valley (C)
Moorabool (S)
Moreland (C)
Wyndham (C)
Yarra (C)
Victoria
High BP Arthritis

NWMPHN Chronic Disease Profile Data as at July 2017 15
Table 8: Population aged 70+ in the NWMPHN municipalities 2016 and projected to 2031
Region LGA 2016 ABS Census
2031 projection VIF2016
% growth 2016-2031
Pop growth 2016-31
Inner Maribyrnong (C) 5,570 10,357 86% 4,787 Melbourne (C) 5,643 18,693 231% 13,050
Yarra (C) 5,977 12,709 113% 6,732
Suburban Brimbank (C) 17,191 31,925 86% 14,734 Darebin (C) 15,701 20,190 29% 4,489 Hobsons Bay (C) 9,207 15,067 64% 5,860 Moonee Valley (C) 13,465 19,650 46% 6,185
Moreland (C) 17,044 21,027 23% 3,983
Growth Hume (C) 12,976 31,023 139% 18,047 Melton (C) 6,666 22,593 239% 15,927
Wyndham (C) 9,912 30,600 209% 20,688
Periurban Macedon Ranges (S) 4,930 10,179 106% 5,249
Moorabool (S) 3,080 7,228 135% 4,148
Grand Total 127,362 251,240 97% 123,878
Source: ABS Census and VIF2016
Table 9: Population aged 85+ in the NWMPHN municipalities 2016 and projected to 2031
Region LGA 2016 ABS Census
2031 projection VIF2016
% growth 2016-2031
Pop growth 2016-31
Inner Maribyrnong (C) 1,371 1,907 39% 536 Melbourne (C) 1,252 3,918 213% 2,666
Yarra (C) 1,075 2,352 119% 1,277
Suburban Brimbank (C) 2,927 5,855 100% 2,928 Darebin (C) 3,730 4,307 15% 577 Hobsons Bay (C) 1,966 3,055 55% 1,089 Moonee Valley (C) 2,963 4,370 47% 1,407
Moreland (C) 4,321 4,693 9% 372
Growth Hume (C) 1,883 5,125 172% 3,242 Melton (C) 897 4,605 413% 3,708
Wyndham (C) 1,453 5,508 279% 4,055
Periurban Macedon Ranges (S) 810 1,855 129% 1,045
Moorabool (S) 483 1,359 181% 876
Grand Total 25,131 48,909 95% 23,778
Source: ABS Census and VIF2016
NWMPHN Chronic Disease Profile Data as at July 2017 16
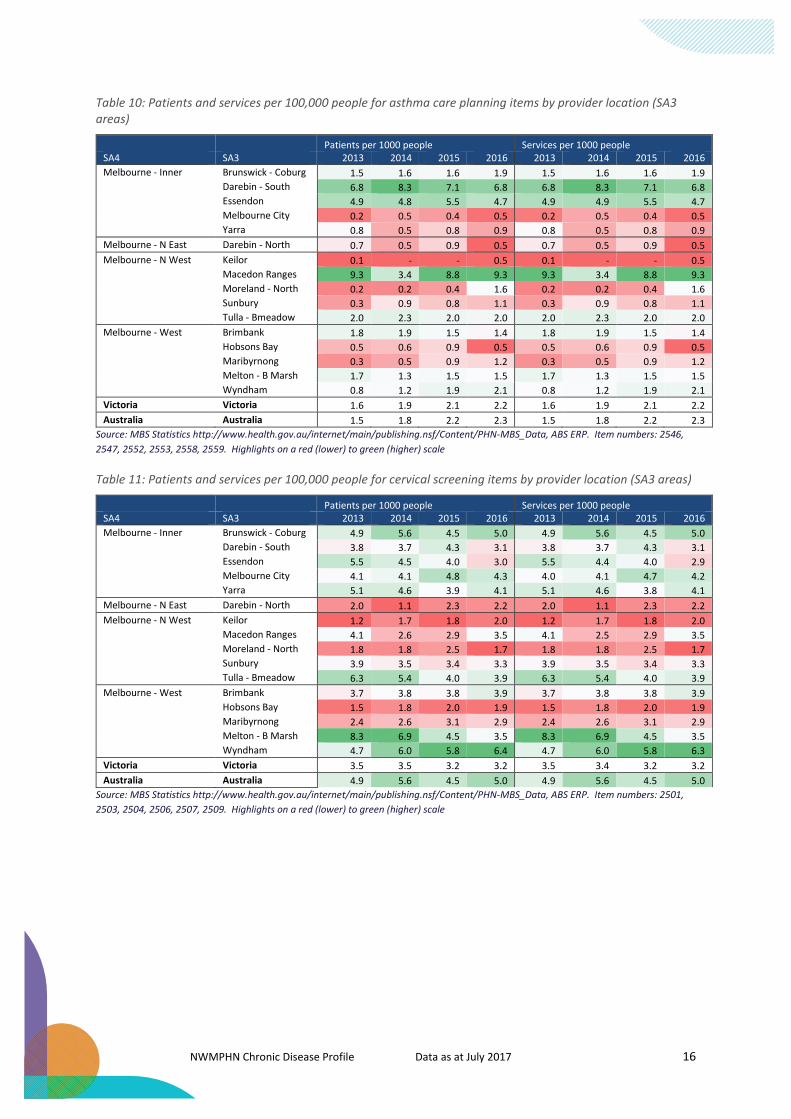
Table 10: Patients and services per 100,000 people for asthma care planning items by provider location (SA3 areas)
Patients per 1000 people Services per 1000 people SA4 SA3 2013 2014 2015 2016 2013 2014 2015 2016 Melbourne - Inner Brunswick - Coburg 1.5 1.6 1.6 1.9 1.5 1.6 1.6 1.9 Darebin - South 6.8 8.3 7.1 6.8 6.8 8.3 7.1 6.8 Essendon 4.9 4.8 5.5 4.7 4.9 4.9 5.5 4.7 Melbourne City 0.2 0.5 0.4 0.5 0.2 0.5 0.4 0.5 Yarra 0.8 0.5 0.8 0.9 0.8 0.5 0.8 0.9 Melbourne - N East Darebin - North 0.7 0.5 0.9 0.5 0.7 0.5 0.9 0.5 Melbourne - N West Keilor 0.1 - - 0.5 0.1 - - 0.5 Macedon Ranges 9.3 3.4 8.8 9.3 9.3 3.4 8.8 9.3 Moreland - North 0.2 0.2 0.4 1.6 0.2 0.2 0.4 1.6 Sunbury 0.3 0.9 0.8 1.1 0.3 0.9 0.8 1.1 Tulla - Bmeadow 2.0 2.3 2.0 2.0 2.0 2.3 2.0 2.0 Melbourne - West Brimbank 1.8 1.9 1.5 1.4 1.8 1.9 1.5 1.4 Hobsons Bay 0.5 0.6 0.9 0.5 0.5 0.6 0.9 0.5 Maribyrnong 0.3 0.5 0.9 1.2 0.3 0.5 0.9 1.2 Melton - B Marsh 1.7 1.3 1.5 1.5 1.7 1.3 1.5 1.5 Wyndham 0.8 1.2 1.9 2.1 0.8 1.2 1.9 2.1 Victoria Victoria 1.6 1.9 2.1 2.2 1.6 1.9 2.1 2.2 Australia Australia 1.5 1.8 2.2 2.3 1.5 1.8 2.2 2.3
Source: MBS Statistics http://www.health.gov.au/internet/main/publishing.nsf/Content/PHN-MBS_Data, ABS ERP. Item numbers: 2546, 2547, 2552, 2553, 2558, 2559. Highlights on a red (lower) to green (higher) scale
Table 11: Patients and services per 100,000 people for cervical screening items by provider location (SA3 areas)
Patients per 1000 people Services per 1000 people SA4 SA3 2013 2014 2015 2016 2013 2014 2015 2016 Melbourne - Inner Brunswick - Coburg 4.9 5.6 4.5 5.0 4.9 5.6 4.5 5.0 Darebin - South 3.8 3.7 4.3 3.1 3.8 3.7 4.3 3.1 Essendon 5.5 4.5 4.0 3.0 5.5 4.4 4.0 2.9 Melbourne City 4.1 4.1 4.8 4.3 4.0 4.1 4.7 4.2 Yarra 5.1 4.6 3.9 4.1 5.1 4.6 3.8 4.1 Melbourne - N East Darebin - North 2.0 1.1 2.3 2.2 2.0 1.1 2.3 2.2 Melbourne - N West Keilor 1.2 1.7 1.8 2.0 1.2 1.7 1.8 2.0 Macedon Ranges 4.1 2.6 2.9 3.5 4.1 2.5 2.9 3.5 Moreland - North 1.8 1.8 2.5 1.7 1.8 1.8 2.5 1.7 Sunbury 3.9 3.5 3.4 3.3 3.9 3.5 3.4 3.3 Tulla - Bmeadow 6.3 5.4 4.0 3.9 6.3 5.4 4.0 3.9 Melbourne - West Brimbank 3.7 3.8 3.8 3.9 3.7 3.8 3.8 3.9 Hobsons Bay 1.5 1.8 2.0 1.9 1.5 1.8 2.0 1.9 Maribyrnong 2.4 2.6 3.1 2.9 2.4 2.6 3.1 2.9 Melton - B Marsh 8.3 6.9 4.5 3.5 8.3 6.9 4.5 3.5 Wyndham 4.7 6.0 5.8 6.4 4.7 6.0 5.8 6.3 Victoria Victoria 3.5 3.5 3.2 3.2 3.5 3.4 3.2 3.2 Australia Australia 4.9 5.6 4.5 5.0 4.9 5.6 4.5 5.0
Source: MBS Statistics http://www.health.gov.au/internet/main/publishing.nsf/Content/PHN-MBS_Data, ABS ERP. Item numbers: 2501, 2503, 2504, 2506, 2507, 2509. Highlights on a red (lower) to green (higher) scale

NWMPHN Chronic Disease Profile Data as at July 2017 17
Table 12: Patients and services per 100,000 people for diabetes care planning items by provider location (SA3 areas)
Patients per 1000 people Services per 1000 people SA4 SA3 2013 2014 2015 2016 2013 2014 2015 2016 Melbourne - Inner Brunswick - Coburg 12.2 11.7 13.9 12.5 12.2 11.7 13.9 12.5 Darebin - South 17.9 20.4 18.8 19.6 17.9 20.5 18.8 19.6 Essendon 16.7 14.7 13.6 10.9 16.7 14.7 13.6 10.9 Melbourne City 1.7 2.3 2.2 2.0 1.7 2.3 2.2 2.0 Yarra 5.6 6.0 6.8 6.2 5.6 6.0 6.8 6.2 Melbourne - N East Darebin - North 10.5 11.0 11.7 9.5 10.5 11.0 11.7 9.5 Melbourne - N West Keilor 11.0 13.5 12.4 13.4 11.0 13.5 12.4 13.0 Macedon Ranges 15.5 17.4 16.6 16.1 15.6 17.4 16.7 16.1 Moreland - North 11.6 15.6 15.0 13.9 11.7 15.7 15.0 13.9 Sunbury 12.9 11.9 10.4 10.0 12.8 11.9 10.4 10.0 Tulla - Bmeadow 9.8 12.1 11.9 12.9 9.9 12.1 11.9 12.9 Melbourne - West Brimbank 10.6 11.3 10.3 9.6 10.6 11.3 10.3 9.6 Hobsons Bay 12.0 13.5 13.6 14.6 12.0 13.5 13.6 14.6 Maribyrnong 12.0 12.0 12.1 10.5 12.0 12.0 12.1 10.5 Melton - B Marsh 8.9 10.8 12.2 12.1 8.9 10.8 12.2 12.1 Wyndham 6.7 7.9 7.5 6.5 6.7 7.8 7.5 6.5 Victoria Victoria 9.6 10.7 10.8 10.7 9.6 10.7 10.8 10.7 Australia Australia 9.5 10.6 10.9 11.1 9.5 10.6 10.9 11.1
Source: MBS Statistics http://www.health.gov.au/internet/main/publishing.nsf/Content/PHN-MBS_Data, ABS ERP. Item numbers: 2517, 2518, 2521, 2522, 2525, 2526. Highlights on a red (lower) to green (higher) scale
Table 13: Patients and services per 100,000 people for medication review items by provider location (SA3 areas)
Patients per 1000 people Services per 1000 people SA4 SA3 2013 2014 2015 2016 2013 2014 2015 2016 Melbourne - Inner Brunswick - Coburg 13.8 13.2 7.8 8.3 13.8 13.5 7.9 8.3 Darebin - South 12.4 12.6 9.9 7.5 12.4 12.6 10.3 7.6 Essendon 9.5 9.1 7.3 8.5 9.5 9.2 7.3 8.5 Melbourne City 2.2 1.9 2.7 2.5 2.2 1.9 2.7 2.5 Yarra 2.6 3.0 2.4 3.4 2.7 3.0 2.4 3.4 Melbourne - N East Darebin - North 7.0 7.3 5.5 4.3 7.0 7.3 5.6 4.4 Melbourne - N West Keilor 8.4 6.8 5.5 7.3 8.4 6.9 5.7 7.6 Macedon Ranges 10.3 8.1 3.4 7.6 10.4 8.1 3.4 7.7 Moreland - North 12.1 9.3 7.0 6.5 12.2 9.3 7.1 6.6 Sunbury 7.5 9.8 2.9 4.0 7.5 9.8 2.9 4.1 Tulla - Bmeadow 6.8 6.2 6.6 5.2 6.9 6.2 6.7 5.3 Melbourne - West Brimbank 5.5 5.6 3.7 6.3 5.5 5.6 3.8 6.4 Hobsons Bay 5.2 5.9 3.0 3.7 5.3 6.0 3.0 3.7 Maribyrnong 7.4 7.1 5.1 5.9 7.4 7.1 5.1 5.9 Melton - B Marsh 5.7 5.7 3.6 4.4 5.7 5.7 3.6 4.4 Wyndham 3.1 4.4 3.7 3.1 3.1 4.4 3.7 3.1 Victoria Victoria 8.5 7.8 5.5 6.1 8.5 7.8 5.5 6.1 Australia Australia 7.3 6.9 4.9 5.5 7.3 6.9 4.9 5.5
Source: MBS Statistics http://www.health.gov.au/internet/main/publishing.nsf/Content/PHN-MBS_Data, ABS ERP. Item numbers: 900, 903. Highlights on a red (lower) to green (higher) scale

NWMPHN Chronic Disease Profile Data as at July 2017 18
Table 14: Patients and services per 100,000 people for mental health care planning items by provider location (SA3 areas)
Patients per 1000 people Services per 1000 people SA4 SA3 2013 2014 2015 2016 2013 2014 2015 2016 Melbourne - Inner Brunswick - Coburg 137.7 151.5 160.2 171.9 175.2 197.2 204.4 223.0 Darebin - South 108.2 109.2 120.8 136.0 140.2 145.4 160.4 185.0 Essendon 118.3 123.6 132.8 141.3 146.0 148.2 163.7 172.2 Melbourne City 108.5 125.6 135.2 138.8 152.5 187.5 205.2 204.4 Yarra 147.5 152.2 160.7 167.3 190.5 191.6 202.2 206.2 Melbourne - N East Darebin - North 59.8 61.5 66.9 72.5 87.6 89.5 92.1 102.8 Melbourne - N West Keilor 54.7 60.1 64.7 73.0 71.9 76.4 79.5 88.6 Macedon Ranges 82.8 89.7 99.5 126.2 108.0 121.0 137.3 171.7 Moreland - North 53.1 56.4 62.2 65.4 65.2 68.6 72.8 77.0 Sunbury 117.2 126.3 142.3 149.4 157.6 179.2 210.9 214.9 Tulla - Bmeadow 91.5 101.6 108.3 118.6 119.4 136.1 140.1 155.8 Melbourne - West Brimbank 69.9 77.3 83.1 86.4 95.5 104.8 116.2 119.6 Hobsons Bay 60.2 74.3 81.3 91.7 72.0 90.2 98.2 116.5 Maribyrnong 79.8 80.7 94.9 108.8 99.5 99.1 119.1 135.5 Melton - B Marsh 99.3 107.3 112.5 127.1 179.9 187.0 195.9 216.5 Wyndham 74.7 88.0 91.1 104.6 100.0 123.3 120.3 143.3 Victoria Victoria 87.6 95.3 102.6 111.8 117.5 127.9 139.0 151.6 Australia Australia 75.9 83.3 90.5 99.1 100.0 109.7 119.2 131.0
Source: MBS Statistics http://www.health.gov.au/internet/main/publishing.nsf/Content/PHN-MBS_Data, ABS ERP. Item numbers: 2700, 2701, 2712, 2713, 2715, 2717. Highlights on a red (lower) to green (higher) scale

NWMPHN Chronic Disease Profile Data as at July 2017 19
Table 15: PBS prescriptions dispensed, decile of age and sex standardised rate, by SA3, 2013–14
SA4 SA3
Asthma medicines people aged 3 to 19 years
Asthma medicines people aged 20 to 44 years
Asthma and COPD medicines people aged 45 years and over.
Asthma and related respiratory admissions to hospital people aged 3 to 19 years#
Asthma admissions to hospital people aged 20 to 44 years, 2010–11 to 2012–13 ##
Asthma and COPD admissions to hospital aged 45 years and over.##
Heart failure admissions to hospital people aged 40 years and over. #
PBS prescriptions dispensed for anticholinesterase medicines people aged 65 years and over, 2013–14 *
Melbourne - Inner Bwick - Coburg 9 9 6 1 8 7 1 6
Darebin - South 8 9 8 6 7 9 3 3 Essendon 9 9 8 5 8 9 6 5 Melbourne City 8 10 9 1 8 9 7 2 Yarra 5 9 7 5 6 8 9 2 Melbourne - NE Darebin - North 7 8 4 7 8 6 2 2
Melbourne - NW Keilor 7 7 9 1 5 9 4 6
Macedon Ranges 5 5 7 7 6 10 6 4
Moreland - North 6 8 5 1 6 7 2 6
Sunbury 2 3 3 7 1 6 7 4
Tulla - Bmeadows 6 6 2 3 4 2 1 4
Melbourne - West Brimbank 4 7 5 1 2 8 2 8
Hobsons Bay 8 7 6 5 7 9 5 5 Maribyrnong 6 9 2 1 6 7 3 8
Melton - B Marsh 5 6 2 4 3 5 3 6
Wyndham 7 7 4 6 5 5 4 8
Deciles of rates: 1 = lowest 10% of rates; 10 = highest 10% of rates. Highlights on a red (lower) to green (higher) scale
Sources: National Health Performance Authority analysis of Pharmaceutical Benefits Scheme (PBS) statistics 2013–14 (data supplied 10/04/2015) and Australian Bureau of Statistics Estimated Resident Population 30 June 2013. Full data specifications at http://meteor.aihw.gov.au/content/index.phtml/itemId/623427
# Sources: National Health Performance Authority analysis of Admitted Patient Care National Minimum Data Sets from 2010–11 to 2012–13 (data supplied 09/04/2014) and Australian Bureau of Statistics Estimated Resident Population 30 June 2013. Full data specifications at http://meteor.aihw.gov.au/content/index.phtml/itemId/623427
## Sources: National Health Performance Authority analysis of Admitted Patient Care National Minimum Data Set 2012–13 (data supplied 09/04/2014) and Australian Bureau of Statistics Estimated Resident Population 30 June 2013. Full data specifications at http://meteor.aihw.gov.au/content/index.phtml/itemId/623427
* Sources: National Health Performance Authority analysis of Pharmaceutical Benefits Scheme (PBS) statistics 2013–14 (data supplied 19/03/2015) and Australian Bureau of Statistics Estimated Resident Population 30 June 2013. Full data specifications at http://meteor.aihw.gov.au/content/index.phtml/itemId/623427


![Cardiovascular disease [autosaved]](https://img.pdfslide.us/doc/110x75/554b2ab7b4c905d3088b4ab0/cardiovascular-disease-autosaved.jpg)