Embed Size (px)
Citation preview
bulle
tin 1
37
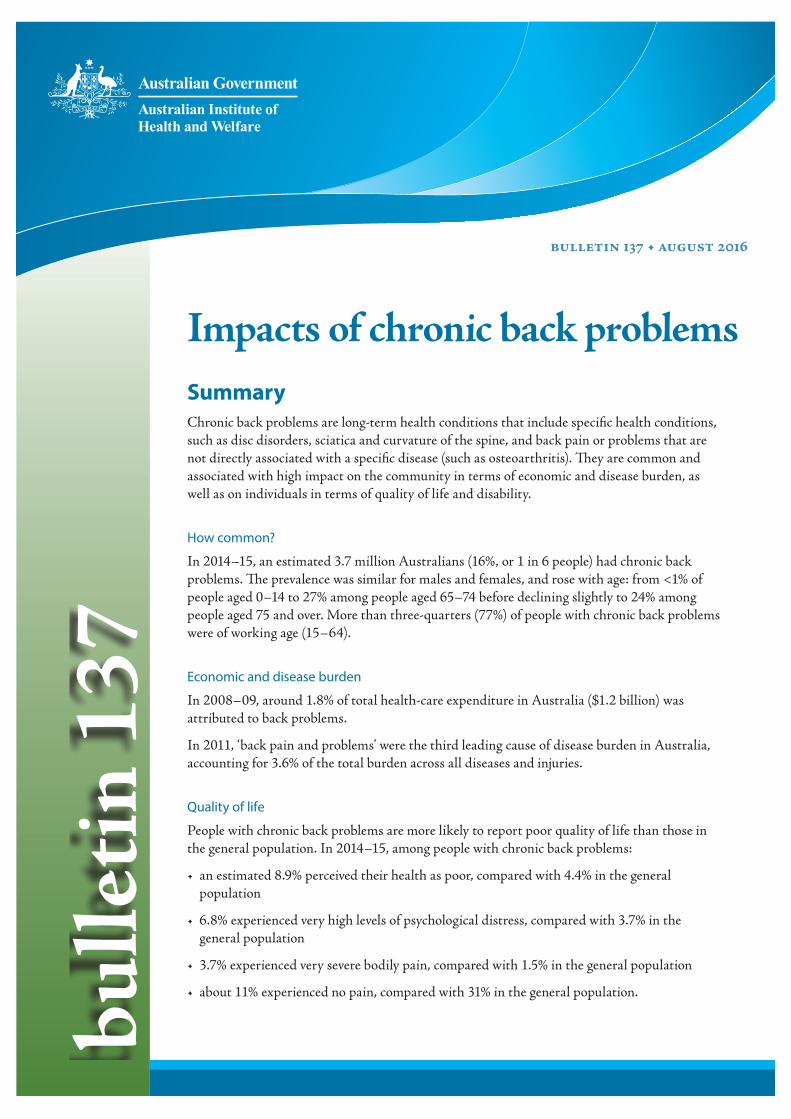
Impacts of chronic back problemsSummaryChronic back problems are long-term health conditions that include specific health conditions, such as disc disorders, sciatica and curvature of the spine, and back pain or problems that are not directly associated with a specific disease (such as osteoarthritis). They are common and associated with high impact on the community in terms of economic and disease burden, as well as on individuals in terms of quality of life and disability.
How common?
In 2014–15, an estimated 3.7 million Australians (16%, or 1 in 6 people) had chronic back problems. The prevalence was similar for males and females, and rose with age: from <1% of people aged 0–14 to 27% among people aged 65–74 before declining slightly to 24% among people aged 75 and over. More than three-quarters (77%) of people with chronic back problems were of working age (15–64).
Economic and disease burden
In 2008–09, around 1.8% of total health-care expenditure in Australia ($1.2 billion) was attributed to back problems.
In 2011, ‘back pain and problems’ were the third leading cause of disease burden in Australia, accounting for 3.6% of the total burden across all diseases and injuries.
Quality of life
People with chronic back problems are more likely to report poor quality of life than those in the general population. In 2014–15, among people with chronic back problems:
population
general population
2
Impacts of chronic back problems
Disability
Among people with a disability, those who have a chronic back problem are more likely than those without a chronic back problem to report limitations and restrictions in relation to mobility, self-care, employment and social participation.
In 2012, 28% of the population with a disability (around 1.2 million people) had both disability and a chronic back problem. Of those:
ContentsSummary . . . . . . . . . . . . . . . . . . . . . . . . . . . . . . . . . . . . . . . . . . . . . . . . . . . . . . . . . . . . . . . . . . . . . 1
Introduction . . . . . . . . . . . . . . . . . . . . . . . . . . . . . . . . . . . . . . . . . . . . . . . . . . . . . . . . . . . . . . . . . . . 3
Definition of chronic back problems . . . . . . . . . . . . . . . . . . . . . . . . . . . . . . . . . . . . . . . . . . . . . . . . . . 3
Data sources . . . . . . . . . . . . . . . . . . . . . . . . . . . . . . . . . . . . . . . . . . . . . . . . . . . . . . . . . . . . . . . . . . . . . . . . 3
Impact on the community . . . . . . . . . . . . . . . . . . . . . . . . . . . . . . . . . . . . . . . . . . . . . . . . . . . . . . 4
Prevalence . . . . . . . . . . . . . . . . . . . . . . . . . . . . . . . . . . . . . . . . . . . . . . . . . . . . . . . . . . . . . . . . . . . . . . . . . . 4
Economic burden. . . . . . . . . . . . . . . . . . . . . . . . . . . . . . . . . . . . . . . . . . . . . . . . . . . . . . . . . . . . . . . . . . . . 4
Disease burden . . . . . . . . . . . . . . . . . . . . . . . . . . . . . . . . . . . . . . . . . . . . . . . . . . . . . . . . . . . . . . . . . . . . . . 5
Impact on the individual . . . . . . . . . . . . . . . . . . . . . . . . . . . . . . . . . . . . . . . . . . . . . . . . . . . . . . . 6
Age, sex and risk factors . . . . . . . . . . . . . . . . . . . . . . . . . . . . . . . . . . . . . . . . . . . . . . . . . . . . . . . . . . . . . 6
Quality of life . . . . . . . . . . . . . . . . . . . . . . . . . . . . . . . . . . . . . . . . . . . . . . . . . . . . . . . . . . . . . . . . . . . . . . . . 7
Disability . . . . . . . . . . . . . . . . . . . . . . . . . . . . . . . . . . . . . . . . . . . . . . . . . . . . . . . . . . . . . . . . . . . . . . . . . . . 9
Discussion . . . . . . . . . . . . . . . . . . . . . . . . . . . . . . . . . . . . . . . . . . . . . . . . . . . . . . . . . . . . . . . . . . . 11
Data quality . . . . . . . . . . . . . . . . . . . . . . . . . . . . . . . . . . . . . . . . . . . . . . . . . . . . . . . . . . . . . . . . . . 12
Acknowledgments . . . . . . . . . . . . . . . . . . . . . . . . . . . . . . . . . . . . . . . . . . . . . . . . . . . . . . . . . . . . 14
References . . . . . . . . . . . . . . . . . . . . . . . . . . . . . . . . . . . . . . . . . . . . . . . . . . . . . . . . . . . . . . . . . . . 14
3
Impacts of chronic back problems
IntroductionChronic back problems are a common condition, affecting around 3.7 million Australians.
In addition to being common, chronic back problems are associated with high impact on the community in terms of economic and disease burden, as well as on individuals in terms of quality of life and disability.
At the population level, chronic back problems contribute to substantial economic burden in terms of health-care costs and lost productivity, and substantial disease burden in terms of years of healthy life lost, principally due to disability.
At the individual level, people with chronic back problems are more likely to perceive their health as poor, and experience increased levels of pain and psychological distress (measures of poor quality of life). They are also more likely to experience reduced levels of participation and functioning (measures of disability).
This bulletin complements other recent work done by the Australian Institute of Health and Welfare (AIHW) on the impact of chronic back problems in Australia (AIHW 2016a, 2016b).
Definition of chronic back problemsThis bulletin focuses on chronic back problems as classified in the Australian Bureau of Statistics (ABS) National Health Survey (NHS) 2014–15 and the 2012 Survey of Disability, Ageing and Carers (SDAC). The data sources are described in the following section.
In this context, chronic back problems comprise long-term health conditions that have lasted at least 6 months, or are likely to last 6 months or more, and which are categorised as:
disc disorders (such as a herniated disc or disc degeneration)
sciatica and curvature of the spine
back pain/problems not elsewhere classified.
Back pain or back problems that are caused by another condition, such as osteoporosis or osteoarthritis, are not included. For this reason, the total prevalence and impact of back problems presented here are likely to be underestimates.
The concept of ‘back pain and problems’ used in the Australian Burden of Disease Study (AIHW 2016a) includes the categories named in this section.
Data sourcesTwo main data sources are used for the analysis presented in this bulletin:
4
Impacts of chronic back problems
ABS NHS 2014–15 data are used to provide information on the prevalence of chronic back problems in Australia, a profile of people with chronic back problems, and the quality-of-life measures of perceived health status, psychological distress and pain. Estimates of these measures for the general population (including those with chronic back problems) are presented for comparison.
ABS 2012 SDAC data are used to provide information on chronic back problems among people reporting a disability, including measures of activity limitations, and restrictions in workforce and social participation. Comparison is made between people with disability who have chronic back problems and those who have disability but no chronic back problems.
Data are also sourced from the Australian Burden of Disease Study 2011, to provide information on the burden of ‘back pain and problems’ at a population level.
It is important to note that the data from both the NHS and SDAC are self-reported and rely heavily on respondents knowing and providing accurate information about their health conditions. These data are also point-in-time snapshots, meaning it is not possible to examine the causal relationship between chronic back problems and risk factors (such as overweight and obesity), quality-of-life measures, or disability.
Descriptions of the data sources and their limitations are provided in the ‘Data quality’ section.
Supplementary tables S1–S9 are available online, at <www.aihw.gov.au/arthritis-and-musculoskeletal-conditions/data/>.
Impact on the communityPrevalenceChronic back problems are common in Australia. In 2014–15, an estimated 3.7 million Australians (16%, or around 1 in 6 people) had chronic back problems (ABS 2015).
Prevalence was similar for males and females, and rose with age: from <1% of people aged 0–14 to 27% among people aged 65–74 before declining slightly to 24% among people aged 75 and over.
More than three-quarters (77%) of people with chronic back problems were of working age (15–64).
Economic burdenChronic back problems are associated with substantial health-care costs.
Based on data from the 2008–09 AIHW Disease Expenditure Database, back problems accounted for 1.8% (nearly $1.2 billion) of total health-care expenditure allocated to disease groups (AIHW 2014).
Nearly one-half (48%, $560 million) of this expenditure was for hospital-admitted patient services, followed by out-of-hospital medical expenses (39%, $464 million) and prescription pharmaceuticals (13%, $153 million).
5
Impacts of chronic back problems
These estimates are for direct health expenditure costs that can be allocated to a disease and exclude a range of costs, such as capital expenditure, some non-admitted patient services and public health programs, costs incurred by individuals with chronic back problems (including physiotherapy and over-the-counter medicines) and indirect costs (including lost productivity).
Many of these costs, in addition to direct health expenditure, were included in a study conducted by Arthritis and Osteoporosis Victoria (2013). That study estimated the total annual cost of back problems to the community to be $4.8 billion.
Disease burdenBurden of disease analysis is a technique used to assess and compare the impact of different diseases, conditions or injuries (referred to collectively as causes) on a population. It uses information from a range of sources to quantify the fatal and non-fatal effects of diseases and injuries into a measure known as the disability-adjusted life year (DALY).
Based on data from the Australian Burden of Disease Study 2011, ‘back pain and problems’ ranked third after coronary heart disease (7.7%) and other musculoskeletal conditions (4.1%) in terms of disease burden, accounting for 3.6% of the total burden (DALYs) (AIHW 2016a). The burden of back pain and problems was higher for females (3.9%) than for males (3.4%).
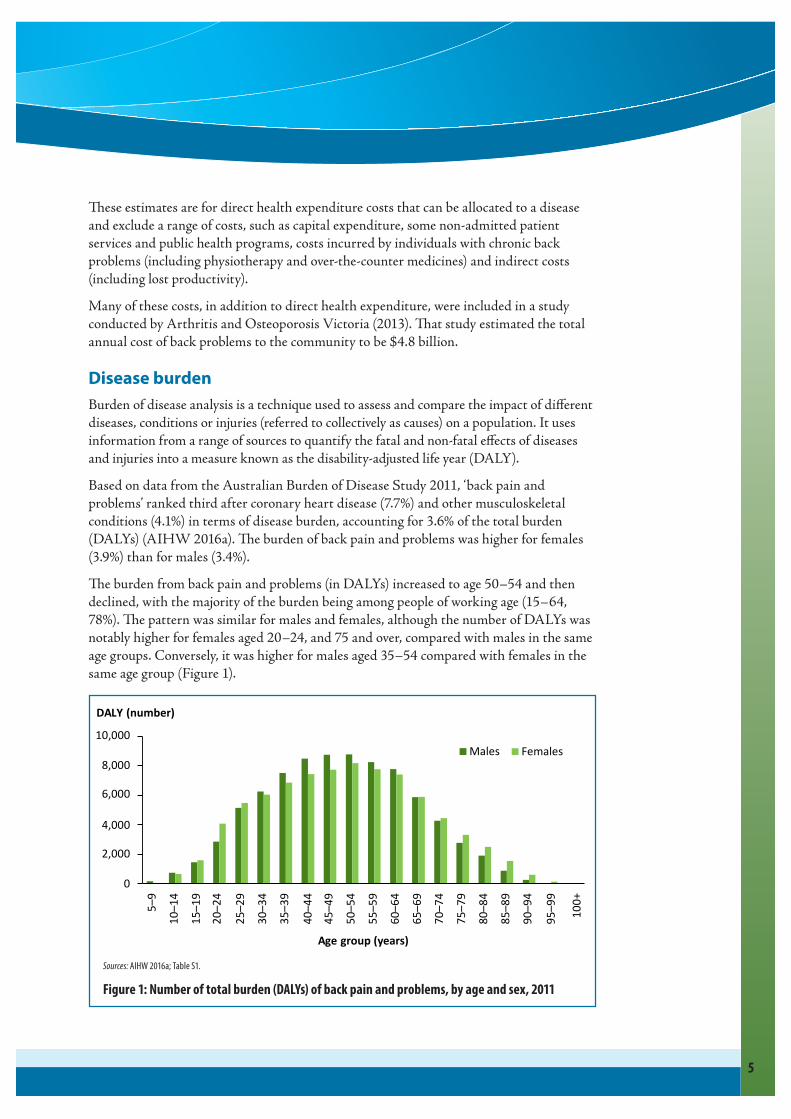
The burden from back pain and problems (in DALYs) increased to age 50–54 and then declined, with the majority of the burden being among people of working age (15–64, 78%). The pattern was similar for males and females, although the number of DALYs was notably higher for females aged 20–24, and 75 and over, compared with males in the same age groups. Conversely, it was higher for males aged 35–54 compared with females in the same age group (Figure 1).
0
2,000
4,000
6,000
8,000
10,000
5–9
10–14
15–19
20–24
25–29
30–34
35–39
40–44
45–49
50–54
55–59
60–64
65–69
70–74
75–79
80–84
85–89
90–94
95–99
100+
Age group (years)
Males Females
DALY (number)
Sources: AIHW 2016a; Table S1.
Figure 1: Number of total burden (DALYs) of back pain and problems, by age and sex, 2011
6
Impacts of chronic back problems
Back pain and problems accounted for 7.3% of the non-fatal burden (years lived with disability (YLD) and was the second leading contributor of non-fatal burden after other musculoskeletal conditions (7.8%). The non-fatal burden of back pain and problems was slightly higher for males (7.5%, ranking second after other musculoskeletal conditions), than for females (7.1%, ranking third after other musculoskeletal conditions and anxiety disorders).
Back pain and problems were not an important cause of fatal burden (years of life lost (YLL) in Australia, accounting for 0.1% of the total YLL.
Impact on the individualMuch of the substantial impact of chronic back problems in Australia is carried by the people living with these conditions.
Although it is difficult to measure individual impact in terms of costs (expenses), it is possible to measure individual impact in terms of age, sex and risk factors, quality of life (perceived health status, psychological distress, pain) and disability (activity limitation and participation restriction).
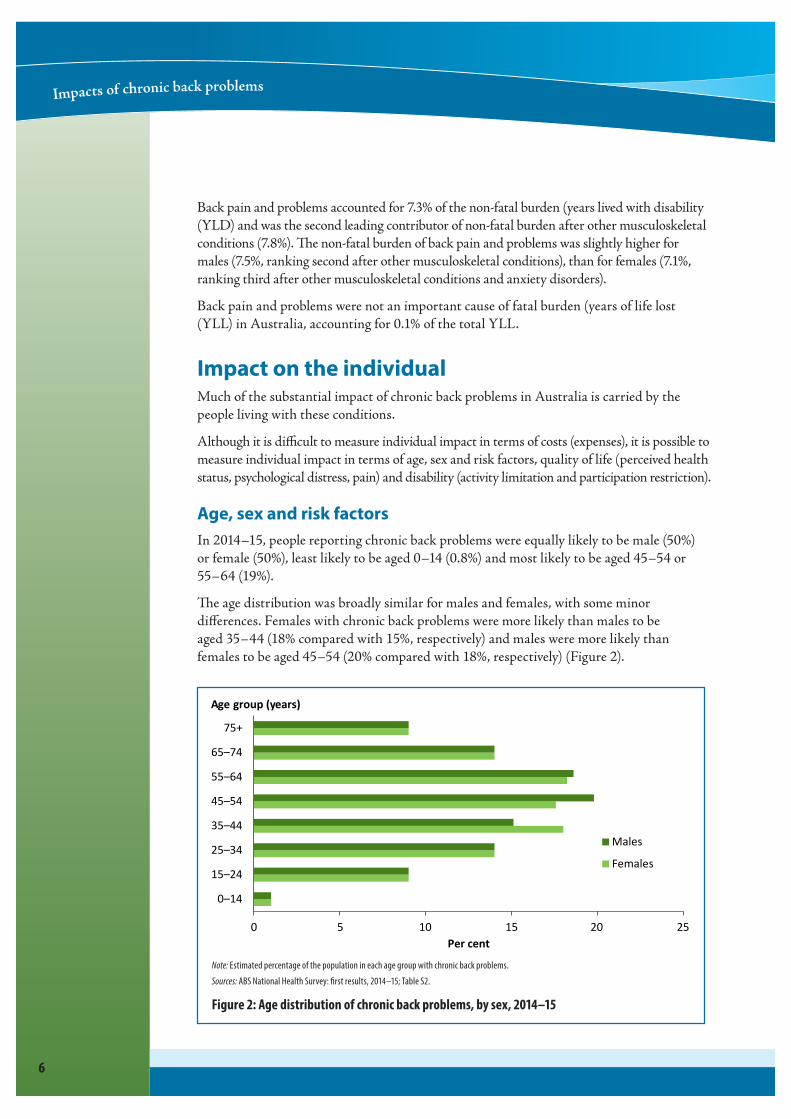
Age, sex and risk factorsIn 2014–15, people reporting chronic back problems were equally likely to be male (50%) or female (50%), least likely to be aged 0–14 (0.8%) and most likely to be aged 45–54 or 55–64 (19%).
The age distribution was broadly similar for males and females, with some minor differences. Females with chronic back problems were more likely than males to be aged 35–44 (18% compared with 15%, respectively) and males were more likely than females to be aged 45–54 (20% compared with 18%, respectively) (Figure 2).
0 5 10 15 20 25
0–14
15–24
25–34
35–44
45–54
55–64
65–74
75+
Per cent
Males
Females
Age group (years)
Note: Estimated percentage of the population in each age group with chronic back problems. Sources: ABS National Health Survey: first results, 2014–15; Table S2.
Figure 2: Age distribution of chronic back problems, by sex, 2014–15
7
Impacts of chronic back problems
Chronic back problems are associated with several factors, such as age, physical fitness, smoking, being overweight and type of occupation (for example, those that require lifting, bending, twisting, pulling and pushing) (Jørgensen et al. 2013).
In 2014–15, 16% of people with chronic back problems were current daily smokers, 38% were physically inactive (did not do any exercise) and 33% were obese (ABS 2015). These risk factors were more commonly reported by people with chronic back problems than those in the general population, although not greatly so (in the general population, 15% were current daily smokers, 35% were physically inactive and 28% were obese).
Quality of lifeHealth-related quality of life is a measure of how a person’s health affects what they are able to do and how they feel. It is used to describe an individual’s perception of how a disease or condition affects their physical, psychological and social wellbeing.
Chronic back problems are often associated with poor mental health, including depression, anxiety and psychological distress (Bener et al. 2013), which can in turn be related to increased experience of pain.
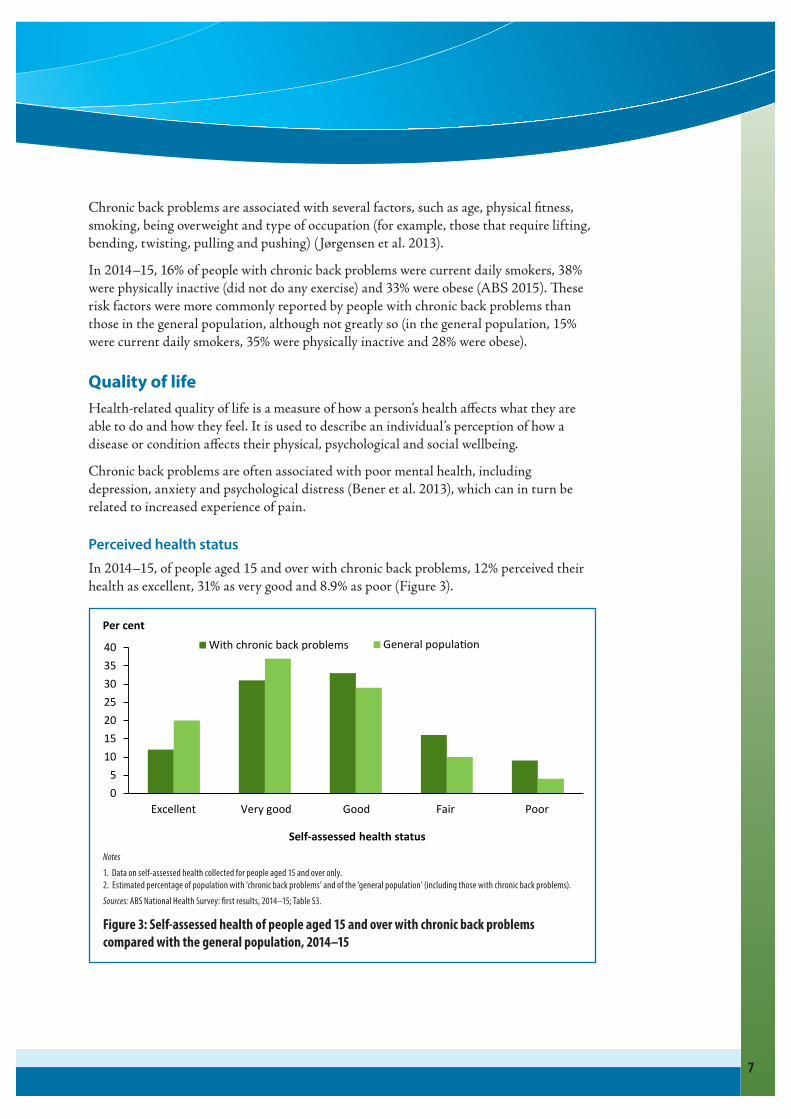
Perceived health statusIn 2014–15, of people aged 15 and over with chronic back problems, 12% perceived their health as excellent, 31% as very good and 8.9% as poor (Figure 3).
0
5
10
15
20
25
30
35
40
Excellent Very good Good Fair Poor
Per cent
Self-assessed health status
With chronic back problems General population
Notes1. Data on self-assessed health collected for people aged 15 and over only.2. Estimated percentage of population with ‘chronic back problems’ and of the ‘general population’ (including those with chronic back problems).Sources: ABS National Health Survey: first results, 2014–15; Table S3.
Figure 3: Self-assessed health of people aged 15 and over with chronic back problems compared with the general population, 2014–15

8
Impacts of chronic back problems
People with chronic back problems were less likely than those in the general population to perceive their health status as excellent or very good and more likely to perceive their health as poor (4.4% in the general population).
Psychological distressIn 2014–15, 6.8% of people aged 18 and over with chronic back problems experienced very high levels of psychological distress, which was higher than that experienced by the general population (3.7%) (Figure 4).
0
10
20
30
40
50
60
70
80
Low Moderate High Very high
Per cent
Level of distress
With chronic back problems General population
Notes1. Data for psychological distress collected for people aged 18 and over.2. Estimated percentage of population with ‘chronic back problems’ and of the ‘general population’ (including those with chronic back problems).Sources: ABS National Health Survey: first results, 2014–15; Table S4.
Figure 4: Psychological distress experienced by people aged 18 and over with chronic back problems compared with the general population, 2014–15
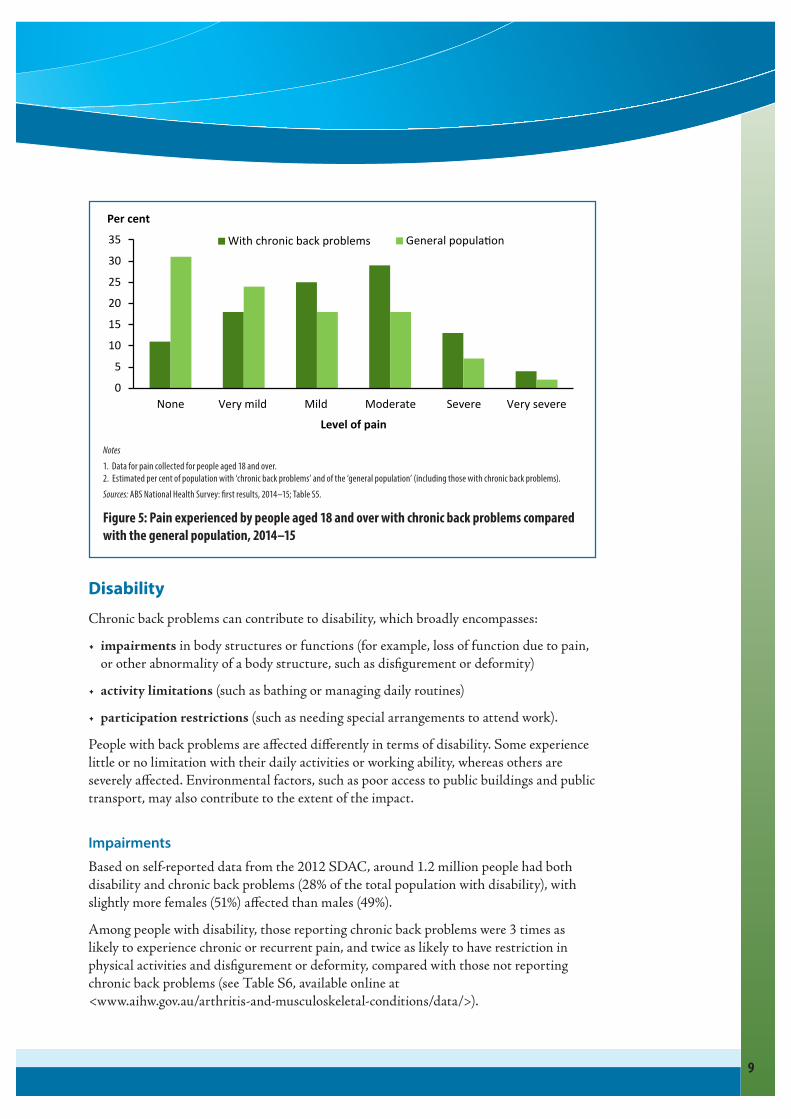
PainIn 2014–15, 89% of people aged 18 and over with chronic back problems experienced pain in the 4 weeks prior to interview. The experience of pain in these people was generally towards the very mild to moderate end of the spectrum (Figure 5). However, 13% of people with chronic back problems experienced severe bodily pain and 3.7% experienced very severe bodily pain.
The proportion of people with chronic back problems experiencing very severe and severe bodily pain was higher than that experienced by the general population (7% severe and 1.5% very severe, respectively).
Impacts of chronic back problems
9
0
5
10
15
20
25
30
35
None Very mild Mild Moderate Severe Very severe
Per cent
Level of pain
With chronic back problems General population
Notes1. Data for pain collected for people aged 18 and over.2. Estimated per cent of population with ‘chronic back problems’ and of the ‘general population’ (including those with chronic back problems).Sources: ABS National Health Survey: first results, 2014–15; Table S5.
Figure 5: Pain experienced by people aged 18 and over with chronic back problems compared with the general population, 2014–15
DisabilityChronic back problems can contribute to disability, which broadly encompasses:
impairments in body structures or functions (for example, loss of function due to pain, or other abnormality of a body structure, such as disfigurement or deformity)
activity limitations (such as bathing or managing daily routines)
participation restrictions (such as needing special arrangements to attend work).
People with back problems are affected differently in terms of disability. Some experience little or no limitation with their daily activities or working ability, whereas others are severely affected. Environmental factors, such as poor access to public buildings and public transport, may also contribute to the extent of the impact.
ImpairmentsBased on self-reported data from the 2012 SDAC, around 1.2 million people had both disability and chronic back problems (28% of the total population with disability), with slightly more females (51%) affected than males (49%).
Among people with disability, those reporting chronic back problems were 3 times as likely to experience chronic or recurrent pain, and twice as likely to have restriction in physical activities and disfigurement or deformity, compared with those not reporting chronic back problems (see Table S6, available online at <www.aihw.gov.au/arthritis-and-musculoskeletal-conditions/data/>).
10
Impacts of chronic back problems
Activity limitationsPeople with disability and chronic back problems may require assistance with everyday activities, and the level of need for that assistance can vary.
Activities related to self-care, mobility and communication are referred to as ‘core activities’. In 2012, people with disability and chronic back problems were 30–80% more likely than those not reporting chronic back problems to experience difficulty or need assistance with core activities, as well as other activities, such as property maintenance, household chores and health care (see Table S7, available online at <www.aihw.gov.au/arthritis-and-musculoskeletal-conditions/data/>). These differences were statistically significant.
Although results show that, among people with disability, those with chronic back problems had less difficulty with paperwork and communication than those without chronic back problems, the difference was not statistically significant.
Among people with disability, limitations in activities such as using transport (both public and private) and meal preparation were similar for people with chronic back problems and for those without chronic back problems.
Participation restrictionsPeople with disability and chronic back problems may confront a range of challenges that affect their ability to participate in everyday activities, such as employment or social activities.
Employment restrictions
Employment restrictions include the need to change jobs or duties, reduce hours, adapt to new circumstances, or cease working altogether, as a result of disability.
In 2012, about 540,000 (77%) of working-age people (aged 15–64) with disability and chronic back problems had employment restrictions, and 158,600 (23%) had no employment restriction (although they may have experienced core activity limitations).
Of all people with disability and chronic back problems who had employment restrictions, 44% were permanently unable to work.
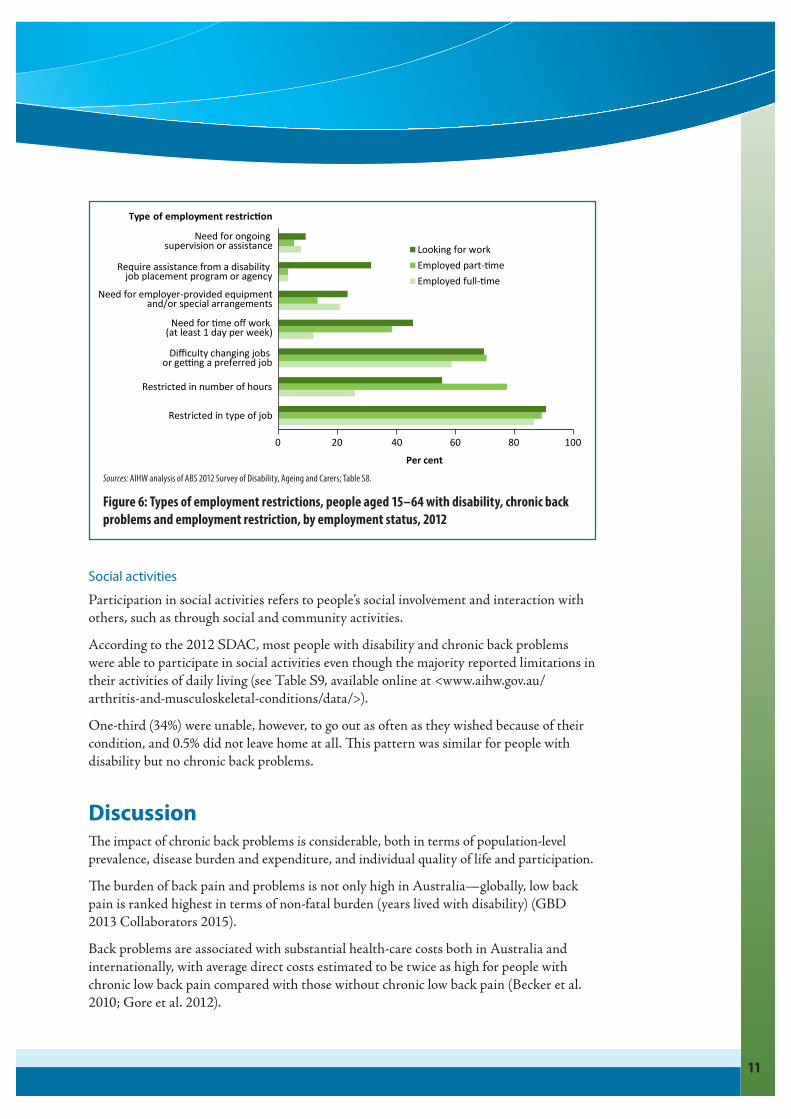
The prevalence and type of employment restriction experienced by people with disability and chronic back problems varied by employment status. People employed full-time were more likely to have employment restrictions (22%) than those working part-time (17%) and those looking for work (4.5%).
Restriction in the type of job they could do was the most commonly reported employment restriction for all 3 employment status groups (around 90%), followed by restriction in the number of hours worked among people employed part-time (78%) and difficulty changing jobs or getting a preferred job among people employed full-time (59%) or employed part-time or looking for work (around 70%) (Figure 6).
Impacts of chronic back problems
11
0 20 40 60 80 100
Restricted in type of job
Restricted in number of hours
Di culty changing jobs
or ge ng a preferred job
Need for time o work
(at least 1 day per week)
Need for employer-provided equipment
and/or special arrangements
Require assistance from a disability
job placement program or agency
Need for ongoing
supervision or assistance
Per cent
Looking for work
Employed part-time
Employed full-time
Type of employment restriction
Sources: AIHW analysis of ABS 2012 Survey of Disability, Ageing and Carers; Table S8.
Figure 6: Types of employment restrictions, people aged 15–64 with disability, chronic back problems and employment restriction, by employment status, 2012
Social activities
Participation in social activities refers to people’s social involvement and interaction with others, such as through social and community activities.
According to the 2012 SDAC, most people with disability and chronic back problems were able to participate in social activities even though the majority reported limitations in their activities of daily living (see Table S9, available online at <www.aihw.gov.au/ arthritis-and-musculoskeletal-conditions/data/>).
One-third (34%) were unable, however, to go out as often as they wished because of their condition, and 0.5% did not leave home at all. This pattern was similar for people with disability but no chronic back problems.
DiscussionThe impact of chronic back problems is considerable, both in terms of population-level prevalence, disease burden and expenditure, and individual quality of life and participation.
The burden of back pain and problems is not only high in Australia—globally, low back pain is ranked highest in terms of non-fatal burden (years lived with disability) (GBD 2013 Collaborators 2015).
Back problems are associated with substantial health-care costs both in Australia and internationally, with average direct costs estimated to be twice as high for people with chronic low back pain compared with those without chronic low back pain (Becker et al. 2010; Gore et al. 2012).
12
Impacts of chronic back problems
The burden of back problems is projected to increase. The study conducted by Arthritis and Osteoporosis Victoria (2013) projected the number of Australians with back problems to rise by 31% to 3.8 million (a rise of 0.9 million people) by 2032, based on population increase alone (ABS 2013b). The degree of burden will, however, depend on the severity and duration of new cases.
In Australia, people with chronic back problems report reduced quality of life (in terms of perceived health status, psychological distress and pain) compared with the prevalence of those measures in the general population. Our finding is consistent with international studies that show persistent back problems are linked to increased psychological distress (Bener et al. 2013) and that this effect is amplified for people with back problems and other comorbid conditions (Bollegala et al. 2011; Schofield et al. 2012). This could be verified in the Australian situation by building on existing comorbidities work to examine quality-of-life measures (AIHW 2016b).
This bulletin has also shown that most people of working age (15–64) with disability and chronic back problems experienced employment restrictions, with a substantial proportion permanently unable to work. Our finding is similar to international and Australian studies that show low back pain is a leading cause of work absence, inability to work and premature exit from the workforce, lost productive life years and receipt of disability benefits (Brage et al. 2010; Costa-Black et al. 2010; Schofield et al. 2015).
Other studies show that low back pain can limit the ability of a person to stand or sit for long periods of time and affect their ability to participate in work (Sá et al. 2015). This could be verified in the Australian context by building on the current bulletin to examine associations between chronic back problems, employment status and sitting time.
Given the findings in this bulletin and other studies, reducing the impact of back problems at both population and individual levels is important—and many back problems can be prevented or effectively managed.
A systematic review of interventions to prevent low back pain suggests that a combination of education and exercise may reduce a person’s risk of developing an episode of low back pain (Steffens et al. 2016). Management at the individual level as well as in health-care settings—such as general practice, allied health, specialist surgeries and hospitals—can help limit pain, maximise function and optimise quality of life.
Data quality
National Health Survey (NHS)The NHS, conducted about every 3 years by the ABS, is designed to obtain national information on the health status of Australians, their use of health services and facilities, and health-related aspects of their lifestyle (ABS 2015). The most recent survey was conducted in 2014–15. This NHS was conducted from a sample of approximately 14,700 private dwellings across Australia. Urban and rural areas in all states and territories were included, while Very remote areas of Australia and discrete Aboriginal and Torres Strait Islander communities were excluded. Non-private dwellings such as hotels, motels, hospitals, nursing homes and short-stay caravan parks were excluded.
13
Impacts of chronic back problems
While the NHS provides a vast array of nationally representative data, there are some limitations that need to be considered.
Most data collected by the NHS are self-reported by respondents and, therefore, rely heavily on the respondents knowing and providing accurate information. The NHS is designed to prompt respondents so that the most accurate information is collected, but there may be reasons why the information may be compromised.
The cross-sectional nature of the survey and exclusions should also be taken into account.
Also, some questions were asked of people aged 15 and over, others of adults 18 years and over. For example, information on:
More information on NHS data quality can be found in National Health Survey: first results, 2014–15 (ABS 2015), available at <http://www.abs.gov.au/ausstats/[email protected]/mf/4364.0.55.001?OpenDocument>.
Survey of Disability, Ageing and Carers (SDAC)Conducted by the ABS, the SDAC collects national information on people with disabilities, older people (aged 65 or over) and their carers (ABS 2013a).
There are 2 components of the SDAC:
care facilities)
and nursing homes).
The survey excludes people in correctional institutions.
The latest SDAC was conducted in 2015. The results of that study were not available in time for this bulletin and so data from the 2012 survey are used.
The survey collects data on disability due to impairments, activity limitations and/or participation restrictions, and also collects information about the role of various diseases and health conditions in disability (for those with a disability as per the SDAC’s initial screening questions which relate to activity limitations).
The data quality declaration for the 2012 SDAC can be found in Disability, ageing and carers, Australia: summary of findings, 2012 (ABS 2013a), available at <http://www.abs.gov.au/ausstats/[email protected]/mf/4430.0>.
Burden of diseaseBurden of disease analysis is a technique used to assess and compare the impact of different diseases, conditions or injuries (referred to collectively as causes) on a population. It uses information from a range of sources to quantify the fatal and non-fatal effects of diseases and injuries.
14
Impacts of chronic back problems
More details on burden of disease methodology can be found in AIHW (2016a), available at <http://www.aihw.gov.au/publication-detail/?id=60129555173>.
Terms used in burden of disease studiesattributable burden: The disease burden attributed to a particular risk factor. It is the reduction in fatal and non-fatal burden that would have occurred if exposure to the risk factor had been avoided (or more precisely had been at its theoretical minimum).DALY (disability-adjusted life year): Measure (in years) of healthy life lost, either through premature death defined as dying before the expected life span at the age of death (YLL) or, equivalently, through living with ill health due to illness or injury (YLD).incidence: The number of new cases (of an illness or event) occurring during a given period.prevalence: The number of cases of a disease or injury in a population at a given time.YLD (years lived with disability): A measure of the years of what could have been a healthy life but were instead spent in states of less than full health. YLD represent non-fatal burden.YLL (years of life lost): Years of life lost due to premature death, defined as dying before the global ideal life span at the age of death. YLL represent fatal burden.
AcknowledgmentsThis bulletin was written by Naila Rahman with input from Mardi Ellis, Ann Hunt, Jen Kerrigan and Xing-yan Wen.
The bulletin was reviewed by Lynelle Moon, Geoff Neideck, Felicity Murdoch, Melinda Petrie, Mark Cooper-Stanbury and Louise York from the Australian Institute of Health and Welfare (AIHW) and members of the National Arthritis and Other Musculoskeletal Conditions Monitoring Advisory Group.
The Australian Government Department of Health funded this project.
ReferencesArthritis and Osteoporosis Victoria 2013. A problem worth solving. Elsternwick: Arthritis and Osteoporosis Victoria.
ABS (Australian Bureau of Statistics) 2013a. Disability, ageing and carers, Australia: summary of results, 2012. ABS cat. no. 4430.0. Canberra: ABS.
ABS 2013b. Population projections, Australia, 2012 (base) to 2101. ABS cat. no. 3222.0. Canberra: ABS.
ABS 2015. National Health Survey: first results, 2014–15. ABS cat. no. 4364.0.55.001. Canberra: ABS.
AIHW (Australian Institute of Health and Welfare) 2014. Health-care expenditure on arthritis and other musculoskeletal conditions 2008–09. Arthritis series no. 20. Cat. no. PHE 177. Canberra: AIHW.
15
Impacts of chronic back problems
AIHW 2016a. Australian Burden of Disease Study: impacts and causes of illness and death in Australia 2011. Australian Burden of Disease Study series no. 3. Cat. no. BOD 4. Canberra: AIHW.
AIHW 2016b. Back problems, associated comorbidities and risk factors. Canberra: AIHW. Viewed 18 June 2016, <http://www.aihw.gov.au/back-problems/associated-comorbidities-and-risk-factors/>.
Becker A, Held H, Redaelli M, Strauch K, Chenot JF, Leonhardt C et al. 2010. Low back pain in primary care: costs of care and prediction of future health care utilisation. Spine (Phila Pa 1976) 35(18):1714–20.
Bener A, Verjee M, Dafeeah EE, Falah O, Al-Juhaishi T, Schlogl J et al. 2013. Psychological factors: anxiety, depression, and somatization symptoms in low back pain patients. Journal of Pain Research 6:95–101.
Bollegala D, Perruccio AV & Badley EM 2011. Combined impact of concomitant arthritis and back problems on health status: results from a nationally representative health survey. Arthritis Care & Research (Hoboken) 63(11):1584–91.
Brage S, Ihlebaek C, Natvig B & Bruusqaard D 2010. Musculoskeletal disorders as causes of sick leave and disability benefits. Tidsskr Nor Laegeforen 130:2369–70.
Costa-Black KM, Loisel P, Anema JR & Pransky G 2010. Back pain and work. Best Practice and Research Clinical Rheumatology 24(2):227–40.
GBD (Global Burden of Disease) 2013 Collaborators 2015. Global, regional, and national incidence, prevalence, and years lived with disability for 301 acute and chronic diseases and injuries in 188 countries, 1990–2013: a systematic analysis for the Global Burden of Disease Study 2013. The Lancet 386:743–800.
Gore M, Sadosky A, Stacey BR, Tai KS & Leslie D 2012. The burden of chronic low back pain: clinical comorbidities, treatment patterns, and health care costs in usual care settings. Spine (Phila Pa 1976) 37(11):E668–77.
Jørgensen MB, Korshøj M, Lagersted-Olsen J, Villumsen M, Mortensen OS, Skotte J et al. 2013. Physical activities at work and risk of musculoskeletal pain and its consequences: protocol for a study with objective field measures among blue-collar workers. BMC Musculoskeletal Disorders 14:213. doi:10.1186/1471-2474-14-213.
Sá KN, Dias RSE, Souza I, Lessa I & Baptista AF 2015. Functional impact of low back pain in the population of Salvador-Bahia, Brazil. Brazilian Journal of Medicine and Human Health 3(2):44–54.
Schofield DJ, Callander EJ, Shrestha RN, Passey ME, Percival R & Kelly SJ 2012. Association between comorbidities and labour force participation amongst persons with back problems. Pain 153(10):2068–72.
Schofield DJ, Shrestha RN, Cunich M, Tanton R, Passey ME & Veerman LJ 2015. Lost productive life years caused by chronic conditions in Australians aged 45–64 years, 2010–2030. The Medical Journal of Australia 203(6):260. doi:10.5694/mja15.00132.
Steffens D, Maher CG, Pereira LS, Stevens ML, Oliveira VC, Chapple M et al. 2016. Prevention of low back pain: a systematic review and meta-analysis. JAMA Internal Medicine 176(2):199–208.
The Australian Institute of Health and Welfare is a major national agency which provides reliable, regular and relevant information and statistics on Australia’s health and welfare.
The Institute’s purpose is to provide authoritative information and statistics to promote better health and wellbeing among Australians.
© Australian Institute of Health and Welfare 2016
This product, excluding the AIHW logo, Commonwealth Coat of Arms and any material owned by a third party or protected by a trademark, has been released under a Creative Commons BY 3.0 (CCBY 3.0) licence. Excluded material owned by third parties may include, for example, design and layout, images obtained under licence from third parties and signatures. We have made all reasonable efforts to identify and label material owned by third parties.
You may distribute, remix and build upon this work. However, you must attribute the AIHW as the copyright holder of the work in compliance with our attribution policy available at <www.aihw.gov.au/copyright/>. The full terms and conditions of this licence are available at <http://creativecommons.org/licenses/by/3.0/au/>.
This publication is part of the Australian Institute of Health and Welfare’s bulletin series. A complete list of the Institute’s publications is available from the Institute’s website <www.aihw.gov.au>.
ISSN 2205-5010 (PDF)ISSN 1446-9820 (Print)
ISBN 978-1-74249-974-1 (PDF)ISBN 978-1-74249-975-8 (Print)
Suggested citationAustralian Institute of Health and Welfare 2016. Impacts of chronic back problems. Bulletin 137. Cat. no. AUS 204. Canberra: AIHW.
Australian Institute of Health and WelfareBoard Chair DirectorDr Mukesh C Haikerwal AO Mr Barry Sandison
Any enquiries relating to copyright or comments on this publication should be directed to:
Digital and Media Communications UnitAustralian Institute of Health and WelfareGPO Box 570Canberra ACT 2601Tel: (02) 6244 1000Email: [email protected]
Published by the Australian Institute of Health and Welfare.
Please note that there is the potential for minor revisions of data in this report. Please check the online version at <www.aihw.gov.au> for any amendments.