Embed Size (px)
Citation preview

U.S. DEPARTMENT OF THE INTERIOR U.S. GEOLOGICAL SURVEY
Chromium geochemistry of serpentinous sediment in the Willow core, Santa Clara County, CA
Christopher J. Oze1*, Matthew J. LaForce2, Carl M. Wentworth3, Randall T. Hanson4, Dennis K. Bird1, and Robert G. Coleman1,3
Open-File Report 03-251
2003
1Department of Geological and Environmental Sciences, Stanford University, Stanford,
CA 94305-2115
2Department of Geosciences, San Francisco State University, San Francisco, CA 94132-
4163
3U.S. Geological Survey, Menlo Park, CA
4U.S. Geological Survey, San Diego, CA
* Corresponding Author: Contact at [email protected]
This report is preliminary and has not been reviewed for conformity with U.S. Geological Survey editorial standards or with the North American Stratigraphic code. Any use of trade, product or firm names is for descriptive purposes only and does not imply endorsement by the U.S. Government.
Chromium geochemistry of serpentinous sediment in the Willow Ccore, Santa Clara County, CA
Christopher J. Oze, Matthew J. LaForce, Carl M. Wentworth, Randall T. Hanson, Dennis K. Bird, and Robert G. Coleman
INTRODUCTION Weathering of ultramafic rocks particularly rich in serpentine is known to produce soils and sediments with high concentrations of chromium (Cr) and other biologically toxic trace elements including Ni and Mn (Alexander et al., 1989; Brooks, 1987; Gasser and Dahlgren, 1994; Gough et al., 1989; Schreier et al., 1987). Serpentinite bedrock and overlying serpentinous sediment were recently encountered at the bottom of the 256.6 meter deep (842 feet) Willow multiple-aquifer ground-water monitoring-well site completed by the U.S. Geological Survey (USGS) in March 2001, in the southern Santa Clara Valley, CA (Figure 1). The presence of the serpentinous bedrock and sediment provided an opportunity to evaluate the geochemistry of Cr in a natural water saturated system. Although measured aqueous Cr concentrations are low (<4.6 µg/L) in the ground-water samples (R.T. Hanson, USGS, 2001, written communication), the aquifer material warrants study to ensure that the serpentinous bedrock and sediments of the deeper aquifers are not potential natural sources of Cr. Chromium is a trace element in most natural environments where it occurs as Cr(III), a non-hazardous species and a micronutrient, and/or as Cr(VI), a toxin to living cells and a Class A human carcinogen by inhalation (Cohen et al., 1993; Daugherty, 1992). Chromium(III) is considered chemically immobile because it forms highly stable (oxy)hydroxides and surface complexes, whereas, Cr(VI) is a weakly adsorbing (oxy)anion and consequently is chemically mobile (Ball and Nordstrom, 1998; Fendorf, 1995). Chromium in serpentinite sediments and soils is initially present in the form of Cr(III) in Cr-bearing minerals such as chromite (Cr-spinel), fuchsite (Cr-mica), uvarovite (Cr-garnet), kämmererite (Cr-chlorite), and tawmawite (Cr-epidote). Naturally occurring high valence manganese oxides, such as birnessite (δ-MnO2), are known to oxidize aqueous Cr(III) to Cr(VI) (Fendorf et al., 1992; Fendorf et al., 1993). The potential for Cr(III) to oxidize forming Cr(VI) is a function of the concentration of high valence manganese oxides, the redox conditions (elevated pH and Eh and increased dissolved O2(aq)), and microbial oxidation (Becquer et al., 2003; Bruce et al., 1997).
This report addresses the following elements in an investigation to evaluate the potential for release and oxidation of Cr: 1) determining extractable and total element concentrations in sediments versus depth in order to identify areas of Cr enrichment, 2) evaluating the distribution and concentrations of Cr with respect to mineralogy and 3) assessing the potential redox environment of the ground water at the Willow monitoring-well site. The oxidation state of Cr in the sediment and ground water has not been measured and will not be presented in this paper. Additionally, not all the Cr-bearing
2

phases have been identified. These crucial elements for describing the geochemistry of Cr can be resolved by using methods such as X-ray adsorption spectroscopy (XAS). This research provides preliminary information for assessing the short-term and long-term hazards associated with Cr in sediments derived from ultramafic rocks and their metamorphic derivatives (serpentinites).
BACKGROUND
The Willow core (WILLOW1) was obtained from a multiple-well ground water monitoring-well site in the Santa Clara Basin drilled as part of a cooperative study between the USGS and the Santa Clara Valley Water District (SCVWD) to improve SCVWD’s ability to monitor and manage ground water in the basin. The monitoring-well site (Longitude 121.903W, Latitude 37.316N, ground elevation 35.1 m above sea level) is located in Willow Glen on the northwest bank of Los Gatos Creek southeast of Hwy 280 and northeast of Lincoln Avenue (Figure 1).
Figure 2 illustrates the relevant geologic units present in the Willow Core as a function of depth. The 17-meter thick (56 feet) serpentinous section occurs beneath ~225 meters (738 feet) of Quaternary alluvial clay, silt, sand, and gravel, and is separated from the underlying serpentinite bedrock by ~6 meters (18 feet) of gravel (Figure 2). Both this basal gravel and most of the overlying alluvium contain greywacke and greenstone clasts, which together indicate a source in the Santa Cruz Mountains to the southwest. The serpentinous section, in contrast, consists of brown silty clay and silty sand containing fragments of serpentinite. The absence of other clasts here suggests a local source, consistent with being derived from nearby exposures of the underlying serpentinite (Figure 2).
MATERIALS AND METHODS
The Willow core was taken on March 30-31, 2001, using a Christensen1 94mm wireline coring device that yields a 64mm core. After collection, sections of the core were sliced along the long axis and refrigerated at 38±2°F. It is important to note that these cores experienced a range of temperature changes during collection and transport and were exposed to the atmosphere before refrigeration. Individual samples were collected from the split cores using a scoop and kept refrigerated until analysis. Four samples (WE1, WE2, WE3, and WE4) from four separate sections (Cores 33, 34, 36, and 37) were were analyzed for pH (saturation paste), electrical conductivity (EC), ammonium acetate extractable (Ca, K, Mg, and Na), diethylenetriaminepentaacetic acid (DTPA) extractable, organic carbon (Walkley-Black), and total nitrogen (Leco). The pH was determined using a 1:1 mixture by volume of sediment to deionized water. Electrical conductivity (EC) in deciSiemens per meter (dS/m) was determined using the same soil mixture.
1 The use of firm, trade, or brand names in this report is for identification purposes only and does not constitute endorsement by the U.S. Geological Survey.
3
Ammonium acetate was used to measure the concentration of extractable K, Ca, Mg, and Na within the soil. The procedure involved weighing 2 g of sediment and adding 25 mL of ammonium acetate (20M NH4OAc) followed by mixing on an orbital shaker for 30 minutes. The solution was filtered using a Whatman #42 filter paper (pore size: 2.5 µm). Potassium, Ca, Mg, and Na concentrations were analyzed using atomic absorption spectrophotometry (AAS).
Diethylenetriaminepentaacetic acid (DTPA) extraction was used to measure extractable trace metals including Cd, Cr, Cu, Fe, Mn, Ni, Pb, and Zn. This extraction method is used to determine the bioavailibility of metals or plant-available nutrients. Approximately 10g of sediment was placed in a 120 mL extraction vessel and 20 mL of DTPA extraction agent was added. Samples were shaken for two hours, filtered, and analyzed via AAS for Cd, Cr, Cu, Fe, Mn, Ni, Pb, and Zn concentrations. Organic carbon (C) was measured using the Walkley-Black titration method (Mebius, 1960). Approximately 0.5 g of sediment was weighed and reacted with 5 mL of 2.0M potassium chromate (K2Cr2O7) followed by the rapid addition of 10 mL concentrated sulfuric (H2SO4) acid. The bottle was cooled for 30 minutes at room temperature and diluted with 100 mL of deionized water. Next, 0.30 mL of 0.025M ortho-phenanthroline-ferrous solution was added and the solution titrated to the endpoint using 1.0M ferrous sulfate (FeSO4). Total nitrogen (N) of soil samples was obtained using an automated combustion method as described by Sweeny (1989). Approximately 150 mg of air-dried and sieved (40 mesh) soil was placed in a tin foil encapsulating cup. A Leco total nitrogen analyzer1 with resistance furnace was then used to determine total nitrogen. Total element concentrations for sediment and rock samples were obtained by completely dissolving the samples using a mixture of hot, concentrated nitric, perchloric, and hydrofluoric acids. Elemental concentrations were measured in the supernatant using inductively coupled optical emission spectrophotometry (ICP-OES). Samples were not dried before analysis. Mineral identification and relative metal concentrations were completed for selected samples using a JEOL 5600LV environmental scanning electron microscope1 (SEM) equipped with an EDS thin-window energy dispersive X-ray detector. Preparation for SEM analyses required oven-drying 2 grams of sample, mounting the sample on an aluminum stage, and coating the sample with a gold film. The EDS detector was used to qualitatively evaluate the mineralogy of each sample.
4

Mineral identification and chemistry was determined by electron probe microanalysis on an automated JEOL 733A electron microprobe operated at 15 kV accelerating potential and 15 nA beam current. Calibration was conducted using natural geologic standards. Beam width for analysis was 10 µm. Raw counts were collected over 20 seconds and were constant with time indicating that elemental drift was negligible. Samples for these analyses were prepared by a series of epoxy impregnations that were polished until smooth.
RESULTS
Chemical properties (pH, EC, organic C, and total N) for four sediment samples from the Willow monitoring-well site are summarized in Table 1. The pH of the sediment is slightly alkaline (pH from 7.8 to 8.0). The EC of the system ranges from 0.4 to 1.1 dS/m (deciSiemens per meter). This range of EC indicates relatively few dissolved inorganic solutes such as salts. The organic C content of the sediment is 0.2 % and total N concentrations range from 0.02% to 0.03%.
Ammonium acetate extractable Ca, K, Mg, and Na ranges are 1,738-3,372 mg/kg, 163.5-148 mg/kg, 890-2,361 mg/kg, and 113-218 mg/kg, respectively (Table 1). The lowest concentrations were detected in sample WE1 and the highest concentrations correspond to the bottom of the core (sample WE4). A general trend of increasing Ca, K, Mg, and Na extractability with depth is present in the core. Extractable Ca/Mg ratios progressively decrease from 2.0 (WE1, top) to 1.4 (WE4, bottom).
DTPA extractable metal concentrations listed in Table 1 are Zn (<0.05 mg/kg), Fe (8.3-23.3 mg/kg) Cu (0.3-0.5 mg/kg), Mn (3.8-6.6 mg/kg), Cd (<0.1 mg/kg), Cr (<0.1 mg/kg), Ni (0.11-2.5 mg/kg), and Pb (0.1-0.3 mg/kg). The concentration of DTPA extractable metals increases with depth. Iron is the most abundant bioavailable metal in the sediment, whereas, Cr and Cd are both below detection limits (~0.1 mg/kg).
In Tables 2 and 3, total major (Al, Ca, Fe, K, Mg, Na, and Ti) and trace element (Ba, Co, Cr, Cu, Mn, Ni, P, Pb, Sr, V, Zn, and Hg) concentrations with corresponding depths are listed for the sediments and rocks. Total major and trace element concentrations of the sediment samples vary significantly with depth. Selected total trace metal concentration ranges for the sediment are Cr (195-1155 mg/kg), Mn (525-1,975 mg/kg), Ni (282-2,830 mg/kg), and Hg (270-670 mg/kg). Serpentine bedrock samples (OZ4 and OZ5) are also enriched with Mg, Cr, Ni, and Mn and depleted in Hg. The contrast in total element concentrations (Tables 2 and 3) versus DTPA extractable metal concentrations (Table 1) demonstrates a majority of the metals in the sediment are not easily extractable or bioavailable.
A correlation diagram (Table 4) based on the relationship of selected cations illustrates the potential Cr-bearing phases/minerals using values from Tables 2 and 3. Chromium is positively correlated with Fe, Mg, Mn, and Ni suggesting Cr may be related to (oxy)hydroxides, spinels, Fe-Mg smectite, and Fe-Mg vermiculites. These minerals are common in serpentine soils (Bulmer et al., 1992; Gasser and Dahlgren, 1994; Wildman et
5

al., 1968). The negative correlation of Cr with respect to Al, Ca, K, and Na suggests Cr is not related to minerals such as gibbsite, muscovite, or feldspar.
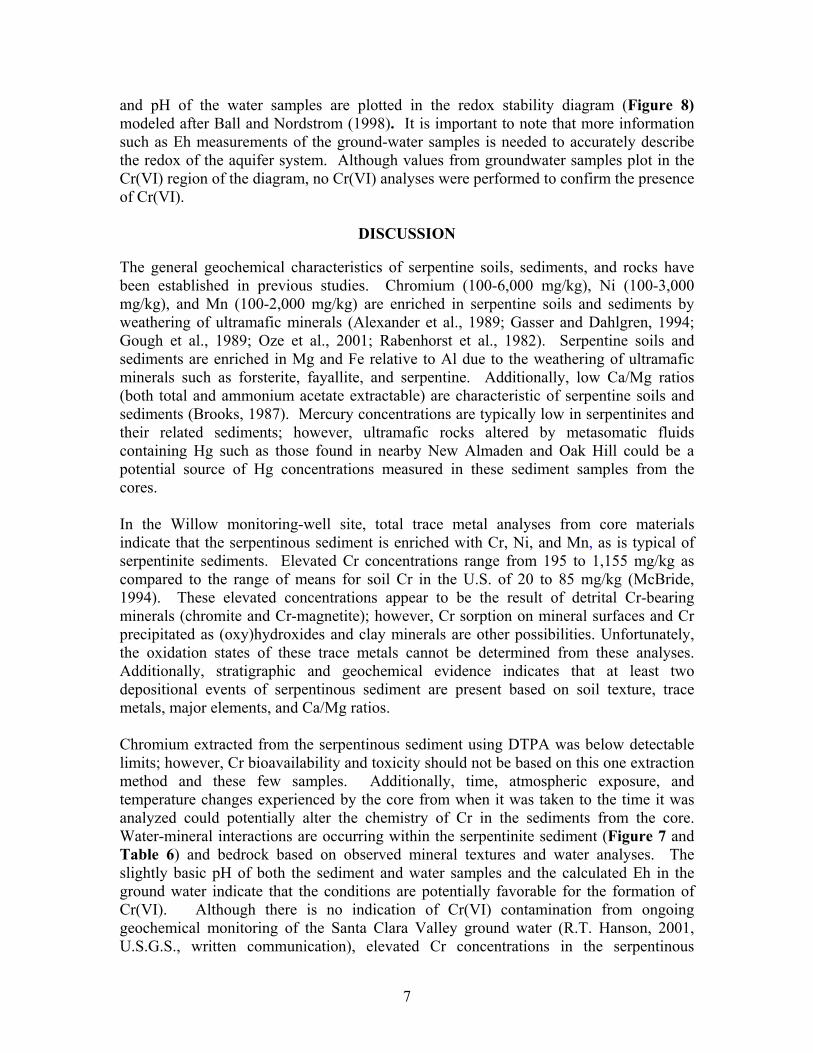
Total major and trace element concentrations are plotted versus depth (refer to Figure 2 for sample locations, core numbers, and depths). These plots include the following: a) Cr, Ni, and Mn (Figure 3) b) Al, Fe, and Mg (Figure 4) c) Ca/Mg ratio (Figure 5) and d) Hg (Figure 6). Chromium, Ni, and Mn concentrations (mg/kg) versus depth (meters) in Figure 3 demonstrate that there are two comparatively distinct units: a) low Cr (<400 mg/kg), low Ni (<900 mg/kg), and high Mn (500-1,250 mg/kg) and b) high Cr (700-1,250 mg/kg), Ni (2,000-2,750 mg/kg), and Mn (700-2,000 mg/kg). Total Cr and Ni concentrations are greater in Core 34 (depth: 227.15-228.30 m) and Core 37 (depth: 237.74-238.9 m) compared to those in Core 32 (depth: 224.94-225.79 m), Core 33 (depth: 225.95-227.01 m), and Core 36 (depth: 230.22-231.46 m). Total Al, Fe, and Mg concentrations versus depth in Figure 4 demonstrate Mg and Fe are enriched with respect to Al in Cores 34 and 37, which are the same cores that have elevated concentrations of Cr and Ni (Figure 3). Total Ca/Mg ratios presented in Figure 5 demonstrate two distinct units. Low Ca/Mg ratios correspond to areas of Cr, Ni, Mn, Mg, and Fe enrichment shown in Figures 3 and 4. The opposite is true where Ca/Mg ratios are greater than 0.2. Mercury concentrations were measured for three samples and these values range from 270 to 670 mg/kg as shown in Figure 6. Mercury enrichment is more prominent where no serpentinite clasts are present (Sample OZ2, Core 36).
The mineralogy and chemistry of the Cr-bearing phases in both the sediment and rock were identified using the scanning electron microprobe (SEM) and the electron microprobe. Scanning electron microprobe analyses for samples WC3A (Core 34, depth: 227.28 meters), WC4A (Core 36, depth: 229.84 meters), and WC5A (Core 37, depth: 237.31 meters) determined serpentine, clay minerals, quartz, and Fe-oxides are present, but no Cr-bearing minerals such as chromite, Cr-magnetite, kämmererite, uvarovite, and/or tawmawite were detected using this method. Backscattering electron (BSE) images of chromite and Cr-magnetite are shown in Figure 7 and the corresponding analyses for these minerals are listed in Table 5. Figure 7a illustrates the texture of serpentinous sediment and the mineralogy of Core 34 (depth: 227.15-228.30 m) that is dominantly serpentine, quartz, chromite (WL34C1 in Table 5), Cr-magnetite, magnetite and clays. A high magnification BSE image of chromite (shown in Figure 7b) demonstrates chromite (W34C1 in Table 5) is actively dissolving forming feathery Cr-enriched magnetite (W34C2 in Table 5) adjacent the chromite grain. In Figure 7c, the mineralogy of the bedrock is composed dominantly of serpentine, magnetite, chromite, and Cr-magnetite. Chromite in the bedrock demonstrates zones of Cr, Fe, and Al enrichment evident in the analyses for WLA2 and WLA3 listed in Table 5. Although no Eh measurements were made for the ground-water samples characterized in Table 6, concentrations of dissolved oxygen (O2(aq) in mg/L) were measured. The ion concentrations and dissolved oxygen were incorporated into the program Visual Minteq 2.02 to calculate the Eh of the water samples (Table 6). The calculated Eh values of water samples WLL01-1 and WLL01-3 are 740.61 mV and 777.35 mV respectively. These dissolved oxygen activities are near the upper stability region of water. The Eh
6
and pH of the water samples are plotted in the redox stability diagram (Figure 8) modeled after Ball and Nordstrom (1998). It is important to note that more information such as Eh measurements of the ground-water samples is needed to accurately describe the redox of the aquifer system. Although values from groundwater samples plot in the Cr(VI) region of the diagram, no Cr(VI) analyses were performed to confirm the presence of Cr(VI).
DISCUSSION The general geochemical characteristics of serpentine soils, sediments, and rocks have been established in previous studies. Chromium (100-6,000 mg/kg), Ni (100-3,000 mg/kg), and Mn (100-2,000 mg/kg) are enriched in serpentine soils and sediments by weathering of ultramafic minerals (Alexander et al., 1989; Gasser and Dahlgren, 1994; Gough et al., 1989; Oze et al., 2001; Rabenhorst et al., 1982). Serpentine soils and sediments are enriched in Mg and Fe relative to Al due to the weathering of ultramafic minerals such as forsterite, fayallite, and serpentine. Additionally, low Ca/Mg ratios (both total and ammonium acetate extractable) are characteristic of serpentine soils and sediments (Brooks, 1987). Mercury concentrations are typically low in serpentinites and their related sediments; however, ultramafic rocks altered by metasomatic fluids containing Hg such as those found in nearby New Almaden and Oak Hill could be a potential source of Hg concentrations measured in these sediment samples from the cores.
In the Willow monitoring-well site, total trace metal analyses from core materials indicate that the serpentinous sediment is enriched with Cr, Ni, and Mn, as is typical of serpentinite sediments. Elevated Cr concentrations range from 195 to 1,155 mg/kg as compared to the range of means for soil Cr in the U.S. of 20 to 85 mg/kg (McBride, 1994). These elevated concentrations appear to be the result of detrital Cr-bearing minerals (chromite and Cr-magnetite); however, Cr sorption on mineral surfaces and Cr precipitated as (oxy)hydroxides and clay minerals are other possibilities. Unfortunately, the oxidation states of these trace metals cannot be determined from these analyses. Additionally, stratigraphic and geochemical evidence indicates that at least two depositional events of serpentinous sediment are present based on soil texture, trace metals, major elements, and Ca/Mg ratios.
Chromium extracted from the serpentinous sediment using DTPA was below detectable limits; however, Cr bioavailability and toxicity should not be based on this one extraction method and these few samples. Additionally, time, atmospheric exposure, and temperature changes experienced by the core from when it was taken to the time it was analyzed could potentially alter the chemistry of Cr in the sediments from the core. Water-mineral interactions are occurring within the serpentinite sediment (Figure 7 and Table 6) and bedrock based on observed mineral textures and water analyses. The slightly basic pH of both the sediment and water samples and the calculated Eh in the ground water indicate that the conditions are potentially favorable for the formation of Cr(VI). Although there is no indication of Cr(VI) contamination from ongoing geochemical monitoring of the Santa Clara Valley ground water (R.T. Hanson, 2001, U.S.G.S., written communication), elevated Cr concentrations in the serpentinous
7

sediment, Cr-bearing mineral textures, the estimated redox environment, and water chemistry indicate the formation of Cr(VI) is a possibility for selected water-bearing sediments in the lower aquifers of the ground-water system. Based on the analyses and observations presented in this report, reinjecting oxygenated water into these deeper aquifers composed of serpentinous sediments such as the Willow cores could possibly promote Cr oxidation in sediment known to have increased concentrations of Cr.
ACKNOWLEDGEMENTS This work is associated with the ongoing study of the ground water basin beneath the Santa Clara Valley by the Santa Clara Valley Water District and the U.S. Geological Survey. Capture of intermittent cores in the serpentinous section in a 20% coring program for the Willow well, under the guidance of M.W. Newhouse of the U.S.G.S., made the work possible. We thank R.T. Hanson, Project Chief for the groundwater part of the U.S.G.S study, for advice and sharing of unpublished data on water chemistry. Detailed physical descriptions and digital photographs of the Willow cores were made by J. C. Tinsley, S.K. Brooks, S.K. Mills, and M.I. Pimentel of the U.S.G.S.
REFERENCES CITED
Alexander, E.B., Adamson, C., Zinke, P.J., and Graham, R.C. (1989) Soils and conifer forest productivity on serpentinized peridotite of the Trinity Ophiolite, California. Soil Science, 148(6), 412-423.
Ball, J.W., and Nordstrom, D.K. (1998) Critical-evaluation and selection of standard state thermodynamic properties for chromium metal and its aqueous ions ; hydrolysis species ; oxides ; and hydroxides. Journal of Chemical and Engineering Data, 43(6), 895-918.
Becquer, T., Quantin, C., Sicot, M., and Boudot, J.P. (2003) Chromium availability in ultramafic soils from New Caledonia. Science of the Total Environment, 301(1-3), 251-261.
Brooks, R.R. (1987) Serpentine and Its Vegetation. 454 p. Dioscorides Press, Portland. Bruce, C.E., Petura, J.C., Vitale, R.J., and Mussoline, G.R. (1997) Oxidation-reduction chemistry of
chromium: Relevance tot he regulation and remediation of chromate-contaminated soils. Journal of Soil Contamination, 6(6), 569-580.
Bulmer, C.E., Lavkulich, L.M., and Schreier, H.E. (1992) Morphology, chemistry, and mineralogy of soils derived from serpentinite and tephra in Southwestern British Columbia. Soil Science, 154(1), 72-82.
Cohen, M.D., Kargacin, B., Klein, C.B., and Costa, A.M. (1993) Mechanisms of chromium carcinogenicity and toxicity. Critical Reviews in Toxicology, 23(3), 255-281.
Daugherty, M.L. (1992) Toxicity Summary for Chromium. Chemical Hazard Evaluation and Communication Group, p. 26. Oak Ridge National Laboratory, Oak Ridge.
Fendorf, S.E., Fendorf, M., Sparks, D.L., and Gronsky, R. (1992) Inhibitory mechanisms of Cr(III) oxidation by δ−MnO2. Journal of Colloid and Interface Science, 153(1), 37-54.
Fendorf, S.E., Zasoski, R.J., and Burau, R.G. (1993) Competing metal ion influences on chromium (III) oxidation by birnessite. Soil Science Society of America Journal, 57(6), 1508-1515.
Gasser, U.G., and Dahlgren, R.A. (1994) Solid-phase speciation and surface association of metals in serpentinitic soils. Soil Science, 158(6), 409-420.
Gough, L.P., Meadows, G.R., Jackson, L.L., and Dudka, S. (1989) Biogeochemistry of a highly serpentinized, chromite-rich ultramafic area, Tehama County, California. U.S. Geological Survey Bulletin 1901, 1-24.
McBride, M.B. (1994) Environmental Chemistry of Soils. Oxford University Press, New York. Mebius, L.J. (1960) A rapid method for the determination of organic carbon in soil. Anal. Chim. Acta, 22,
120-124.
8

Oze, C.J., Fendorf, S.E., and Bird, D.K. (2001) Assessing the stability of chromium at contaminated sites by proxy of chromium geochemistry in serpentine soils. Geological Society of America, 2001 Annual Meeting, Abstracts with Programs, 33(6), 228.
Rabenhorst, M.C., Foss, J.E., and Fanning, D.S. (1982) Genesis of Maryland soils formed from serpentinite. Soil Science Society of America Journal, 46, 607-616.
Schreier, H., Omueti, J.A., and Lavkulich, L.M. (1987) Weathering processes of asbestos-rich serpentinitic sediments. Soil Science Society of America Journal, 51, 993-999.
Sweeny, R.A. (1989) Generic combustion method for determination of crude protein in feeds: Collaborative study. Assoc. Off. Anal. Chem., 72, 770-774.
Wildman, W.E., Jackson, M.L., and Whittig, L.D. (1968) Iron-rich montmorillonite formation in soils derived from serpentinite. Soil Science Society of America Proceedings, 32, 787-794.
9

LIST OF TABLES
Table 1. pH, electrical conductivity, extractable cations, extractable metals, organic
content, and total nitrogen
Table 2. Total major element concentrations (Al, Ca, Fe, K, Mg, Na, and Ti)
Table 3. Total trace element concentrations (Ba, Co, Cr, Cu, Mn, Ni, P, Pb, Sr, V, Zn,
and Hg)
Table 4. Correlation diagram of selected major and trace elements
Table 5. Electron microprobe analyses for minerals in Figure 7
Table 6. Water chemistry for the Willow Core monitoring well, Santa Clara Valley, CA
LIST OF FIGURES
Figure 1. Geologic map with the position of the Willow core
Figure 2. Willow cross section with corresponding data
Figure 3. Cr, Ni, and Mn concentrations versus depth
Figure 4. Al, FeTOTAL, and Mg concentrations versus depth
Figure 5. Ca/Mg concentration ratios versus depth
Figure 6. Hg concentrations versus depth
Figure 7. Backscattering images of Cr-bearing minerals
Figure 8. Chromium stability diagram based on Eh and pH with well water samples
from the Willow core
10

Table 1. Summary of pH, electrical conductivity, extractable cations, extractable metals, organic carbon, and total nitrogen
Saturated Paste Ammonium Acetate Extract (mg kg-1) DTPA-Extract
(mg kg-1) Walkley-Black Leco
Sample Core Depth (m)
pH EC (dS/m) Ca K Mg Na Fe Cu Mn Cd Cr Ni Pb OC (%) Total N (%)
WE1 WLL01-33C-1 226.04 8.0 0.7 1,738 63.5 890 113 8.3 0.3 3.8 <0.1 <0.1 0.11 0.2 0.2 0.02WE2 WLL01-34C-1 227.73 7.9 0.4 2,704 68.1 1778 222 22.3 0.3 4.9 <0.1 <0.1 2.5 0.1 0.2 0.03WE3 WLL01-36C-1 230.53 7.9 1.1 3,184 175 1926 194 17.0 0.5 6.9 <0.1 <0.1 0.68 0.3 0.2 0.03WE4 WLL01-37C-1 238.55 7.8 0.4 3,372 148 2361 218 23.3 0.5 6.6 <0.1 <0.1 2.0 0.2 0.2 0.02

Table 2. Total major element concentrations in sediment and bedrock samples
SAMPLE CORE Depth (m) Al (%) Ca (%) Fe (%) K (%) Mg (%) Na (%) Ti (%) Ca/Mg WC1A WLL01-32C-1 224.99 7.16 1.03 4.73 1.38 3.12 1.45 0.46 0.33OZ1
WLL01-32C-1 225.34 7.38 1.05 5.03 1.46 3.79 1.16 0.39 0.28WC1B WLL01-32C-1 225.63 6.76 0.86 4.21 1.36 3.22 1.37 0.41 0.27WC2A WLL01-33C-1 226.035 5.77 1.02 3.75 1.16 3.82 1.3 0.33 0.27WC2B WLL01-33C-1 226.64 6.49 0.88 3.82 1.25 3.19 1.52 0.38 0.28WC2C WLL01-33C-1 226.98 6.17 0.87 3.77 1.2 3.37 1.47 0.34 0.26WC3A WLL01-34C-1 227.48 2.06 0.54 7.64 0.35 8.61 0.23 0.12 0.06WC3B WLL01-34C-1 227.725 1.05 0.45 6.49 0.14 11.3 0.11 0.05 0.04WC3C WLL01-34C-1 227.99 3.63 0.79 6.12 0.54 5.57 0.52 0.26 0.14WC4A WLL01-36C-1 230.52 5.89 0.86 5.17 1.11 3.04 1.1 0.44 0.28OZ2 WLL01-36C-1 231.1 6.02 0.95 4.66 1.09 2.65 1.13 0.38 0.36
WC5A WLL01-37C-1 238.14 2.09 0.64 7.39 0.32 7.59 0.44 0.11 0.08WC5B WLL01-37C-1 238.27 3.04 0.73 7.15 0.48 4.86 0.74 0.17 0.15OZ3 WLL01-37C-1 238.54 3.27 0.7 6.9 0.54 5.51 0.63 0.17 0.13OZ4a WLL 039-1C 253.29 0.2 0.03 4.79 <0.01 >15.00 <0.01 <0.01 OZ5a WLL 042-5C
256.49
0.2
0.21
5.45
0.01
>15.00
<0.01
<0.01
a Serpentinite rock

Table 3. Total trace element concentrations (mg kg-1) in sediment and bedrock samples
Ba Co Cr Cu Mn Ni P Pb Sr V Zn HgSAMPLE CORE Depth (meters) ------------------------------------------------mg kg-1-----------------------------------------------
WC1A WLL01-32C-1 224.99 380 31 231 45 525 337 480 12 86 136 86OZ1 WLL01-32C-1 225.34
390 41 301 47 770 424 440 16 77 127 94 480 WC1B WLL01-32C-1 225.63 390 29 201 41 730 319 440 14 82 121 556
WC2A WLL01-33C-1 226.035 360 25 278 35 650 298 350 12 74 105 66WC2B WLL01-33C-1 226.64 400 24 195 36 620 282 400 12 86 111 80WC2C WLL01-33C-1 226.98 400 26 225 34 640 436 360 12 87 105 68WC3A WLL01-34C-1 227.48 160 123 1150 28 1135 2830 110 6 39 60 70WC3B WLL01-34C-1 227.725 90 137 892 17 1200 2800 60 2 31 44 48WC3C WLL01-34C-1 227.99 390 145 857 23 1975 2050 130 8 57 69 64WC4A WLL01-36C-1 230.52 320 54 324 39 935 802 360 8 74 109 82OZ2 WLL01-36C-1 231.1 350 39 311 39 890 615 410 10 73 112 80 670
WC5A WLL01-37C-1 238.14 150 149 1065 25 1400 2670 90 6 60 49 58WC5B WLL01-37C-1 238.27 200 107 749 34 930 2210 140 12 80 52 58OZ3 WLL01-37C-1 238.54 230 116 1155 36 1130 2170 170 10 65 59 70 270OZ4a WLL 039-1C 253.29 30 109 702 8 395 2180 30 6 1 14 38 <10OZ5a
WLL 042-5C
256.49
60
119
803
9
510
2260
30
2
11
18
34
<10
a Serpentinite rock Note: Ag, Bi, Cd, Mo, and W concentrations in all samples are below detectable limits.

Table 4. Correlation diagram of selected major and trace elements from Tables 2 and 3
Cr Al Ca Fe K Mg Na Mn NiCr 1.00Al -0.92 1.00Ca -0.82 0.93 1.00Fe 0.94 -0.86 -0.78 1.00K -0.92 0.99 0.91 -0.87 1.00
Mg 0.79 -0.90 -0.90 0.73 -0.87 1.00Na -0.92 0.94 0.87 -0.90 0.95 -0.90 1.00Mn 0.73 -0.68 -0.56 0.66 -0.73 0.56 -0.77 1.00Ni 0.96 -0.97 -0.91 0.94 -0.98 0.87 -0.97 0.73 1.00

Table 5. Electron microprobe analyses for minerals in Figure 7
Sample SiO2 Al2O3 NiO FeO* MnO Cr2O3 MgO CaO Na2O K2O TOTAL Mineral WL34C1 0.00 12.26 0.02 21.56 1.41 54.61 9.65 0.00 0.01 0.00 99.53 Chromite W34C1
0.67 9.76 0.01 26.00 1.47 53.63 8.33 0.00 0.00 0.00 99.87 Chromite W34C2 2.21 0.26 0.40 90.28 0.32 4.07 2.04 0.00 0.02 0.00 99.62 Cr-Magnetite WLA2 0.15 4.72 0.02 38.05 1.92 51.48 2.50 0.00 0.02 0.00 98.87 Chomite WLA3
0.00
19.81
0.03
24.54
1.25
45.97
9.48
0.00
0.01
0.00
101.08
Chromite
Note: FeO* refers to total iron as Fe2+

Table 6. Water chemistry for the Willow core monitoring well, Santa Clara Valley, CA
WILO1-1 WILO1-2 WILO1-3 WILO1-4 WILO1-5 WILO1-6 Depth (m) 237.74 176.78 135.63 108.20 70.10 24.38pH (field) 7.6 7.6 7.4 7.2 7.3 6.8
pH (lab) 7.8 ---- 7.6 ---- 7.5 7.1 T ( C ) 24.5 23.3 23.7 22.4 21 20.7 O2 0.1 0.2 2.7 4.6 6.6 6.8 Ca 39.4 ---- 66.8 ---- 90.5 70.5 Mg 32.7 ---- 19.9 ---- 30.1 34.2 NH4 <0.041 <0.041 <0.041 <0.041 <0.041 <0.041 Na 83.1 ---- 35.1 ---- 35.1 37.9 K 2 ---- 1.9 ---- 2.2 1.7 Cl 152 ---- 40.5 ---- 47.9 47.5
Organic C 0.21 0.19 0.26 ---- 0.35 0.47 P 1.3 0.645 0.312 3.59 0.39 0.089
SiO2(aq) 30.3 ---- 25.4 ---- 28 22 SO4
-2 29.2 ---- 44.8 ---- 67.9 69.2 Alkalinity 175 ---- 210 ---- 268 243
Alk(CaCO3) 170 200 200 ---- 260 230 Al 4 ---- 4 ---- 3 <1 As 1.7 ---- 0.6 ---- 1.3 0.6 B 165 ---- 100 ---- 91 106 Ba 119 ---- 102 ---- 123 107 Cr <0.8 ---- 3.6 ---- 4.6 1 Fe <10 ---- <10 ---- <10 <10 Mn 39 ---- 4 ---- 5 4
mg/
L
µg/L

Figure 1. Map of field area and geology

Figure 2. Willow core cross section with sampling locations and sediment descriptions

Figure 3. Chromium, Ni, and Mn concentrations (mg/kg) versus depth (meters) measured using analyses from Table 3.
Concentration (mg/kg)
0 500 1000 1500 2000 2500 3000
Dep
th (m
eter
s)
224
226
228
230
232
234
236
238
240
ChromiumNickelManganese

Figure 4. Aluminum, Fe, and Mg concentrations (Wt. %) versus depth (meters) measured using analyses from Table 3.
Concentration (Wt. %)
0 2 4 6 8 10 12
Dep
th (m
eter
s)
224
226
228
230
232
234
236
238
240
AluminumTotal IronMagnesium
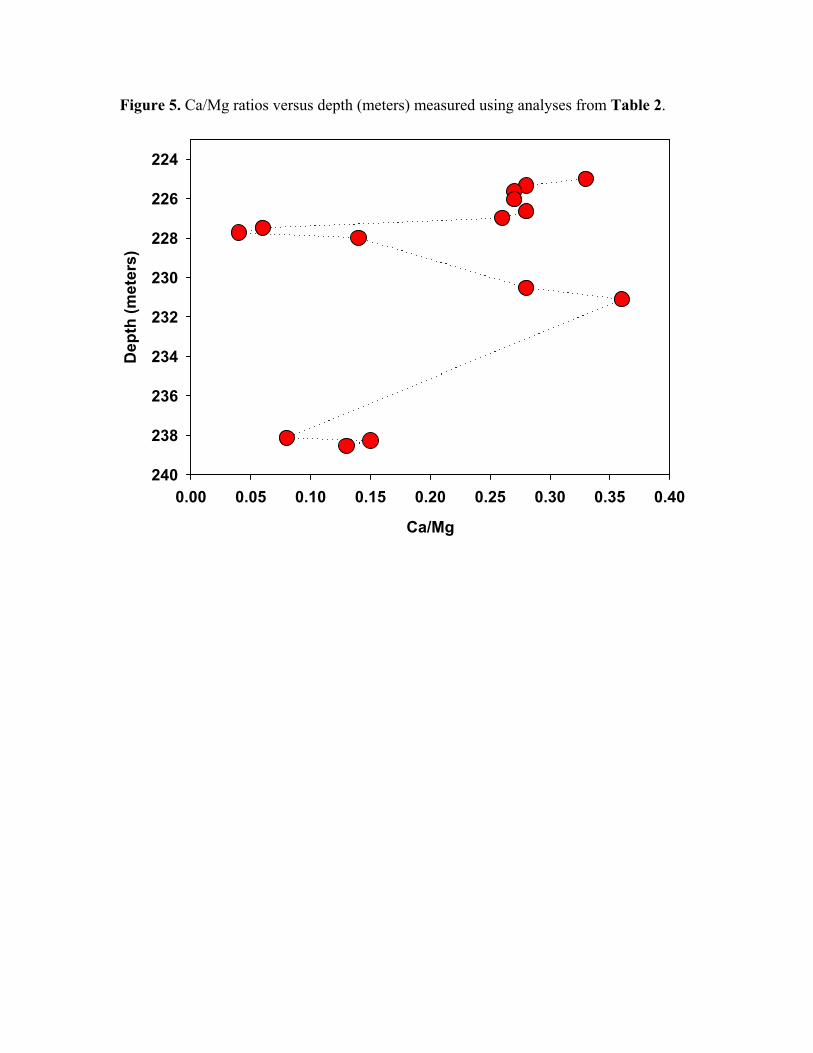
Figure 5. Ca/Mg ratios versus depth (meters) measured using analyses from Table 2.
Ca/Mg
0.00 0.05 0.10 0.15 0.20 0.25 0.30 0.35 0.40
Dep
th (m
eter
s)
224
226
228
230
232
234
236
238
240
Figure 6. Mercury concentrations (mg/kg) versus depth (meters) using analyses from Table 3.
Dep
th (m
eter
s)
224
226
228
230
232
234
23615kV X35 500µm 21 38 SEIConcentration (mg/kg)
200 300 400 500 600 700
238
240
Mercury
15kV X35 500µm 21 38 SEI
Figure 7. Backscattering images (electron microprobe) of sediment and rock samples from WILLOW1. Analyses for labeled points are located in Table 5. Images above include : a)WLL01-34c-1: Yellow-colored minerals are either magnetite or chromite (Cr-oxide) b) WLL01-34c-1: Weathering of chromite (W34c1) to Cr-magnetite (W34c2) is seen in this sample and c) WL039-1c-shoe: The mineralogy of the bedrock (WL830) is composed of serpentine, magnetite, and chromite.

Figure 8. Stability diagram of Cr under a range of redox potential and pH conditions. Measured pH and calculated Eh (volts) values of the Willow well water occupy the space indicated in the diagram (green).