Embed Size (px)
Citation preview
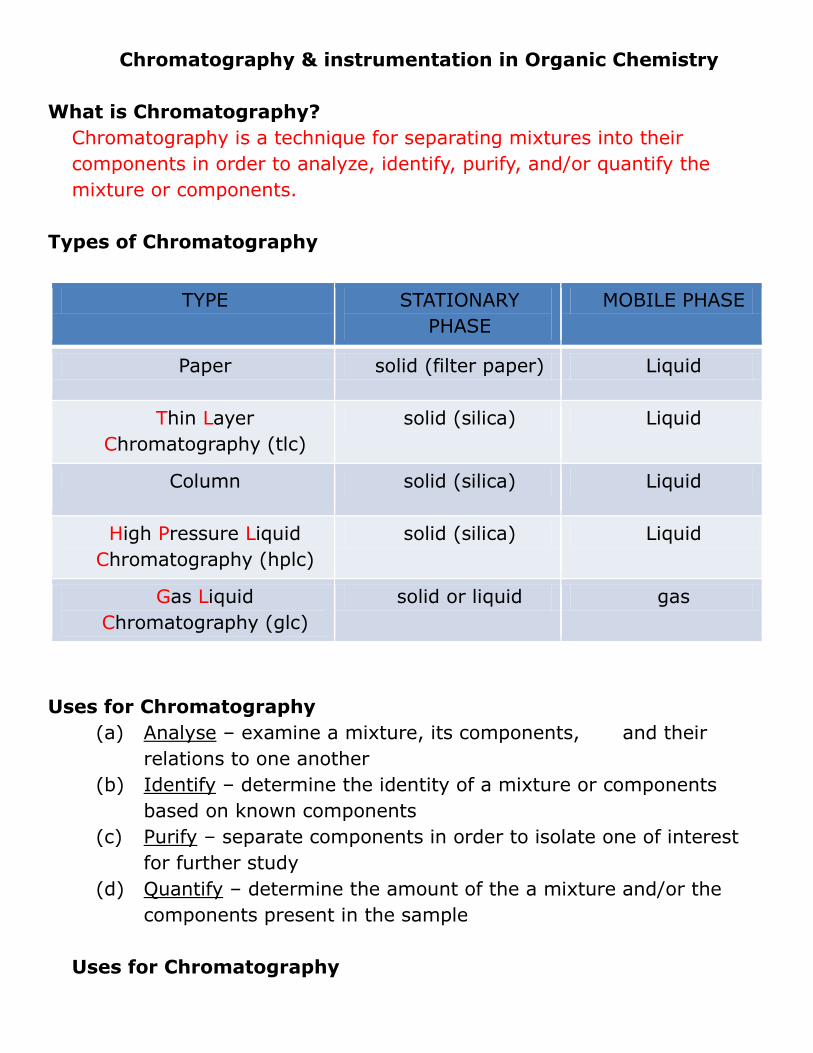
Chromatography & instrumentation in Organic Chemistry
What is Chromatography?
Chromatography is a technique for separating mixtures into their
components in order to analyze, identify, purify, and/or quantify the
mixture or components.
Types of Chromatography
TYPE STATIONARY
PHASE
MOBILE PHASE
Paper solid (filter paper) Liquid
Thin Layer
Chromatography (tlc)
solid (silica) Liquid
Column solid (silica) Liquid
High Pressure Liquid
Chromatography (hplc)
solid (silica) Liquid
Gas Liquid
Chromatography (glc)
solid or liquid gas
Uses for Chromatography
(a) Analyse – examine a mixture, its components, and their
relations to one another
(b) Identify – determine the identity of a mixture or components
based on known components
(c) Purify – separate components in order to isolate one of interest
for further study
(d) Quantify – determine the amount of the a mixture and/or the
components present in the sample
Uses for Chromatography
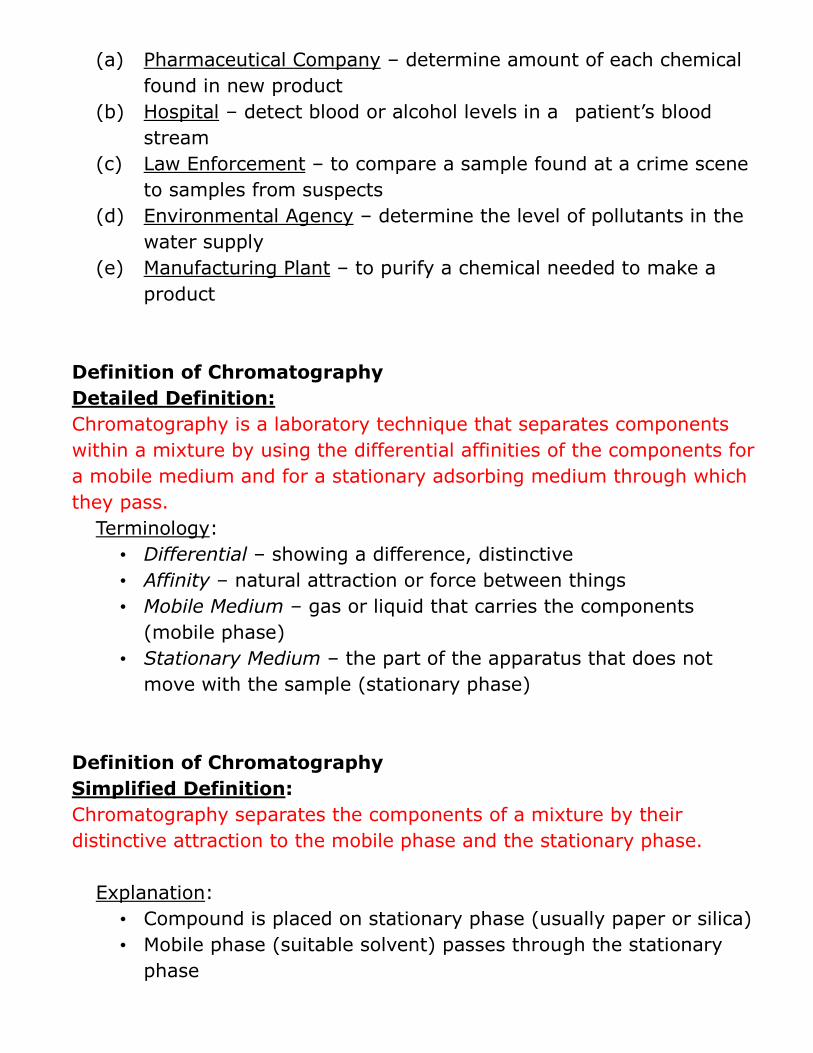
(a) Pharmaceutical Company – determine amount of each chemical
found in new product
(b) Hospital – detect blood or alcohol levels in a patient’s blood
stream
(c) Law Enforcement – to compare a sample found at a crime scene
to samples from suspects
(d) Environmental Agency – determine the level of pollutants in the
water supply
(e) Manufacturing Plant – to purify a chemical needed to make a
product
Definition of Chromatography
Detailed Definition:
Chromatography is a laboratory technique that separates components
within a mixture by using the differential affinities of the components for
a mobile medium and for a stationary adsorbing medium through which
they pass.
Terminology:
• Differential – showing a difference, distinctive
• Affinity – natural attraction or force between things
• Mobile Medium – gas or liquid that carries the components
(mobile phase)
• Stationary Medium – the part of the apparatus that does not
move with the sample (stationary phase)
Definition of Chromatography
Simplified Definition:
Chromatography separates the components of a mixture by their
distinctive attraction to the mobile phase and the stationary phase.
Explanation:
• Compound is placed on stationary phase (usually paper or silica)
• Mobile phase (suitable solvent) passes through the stationary
phase
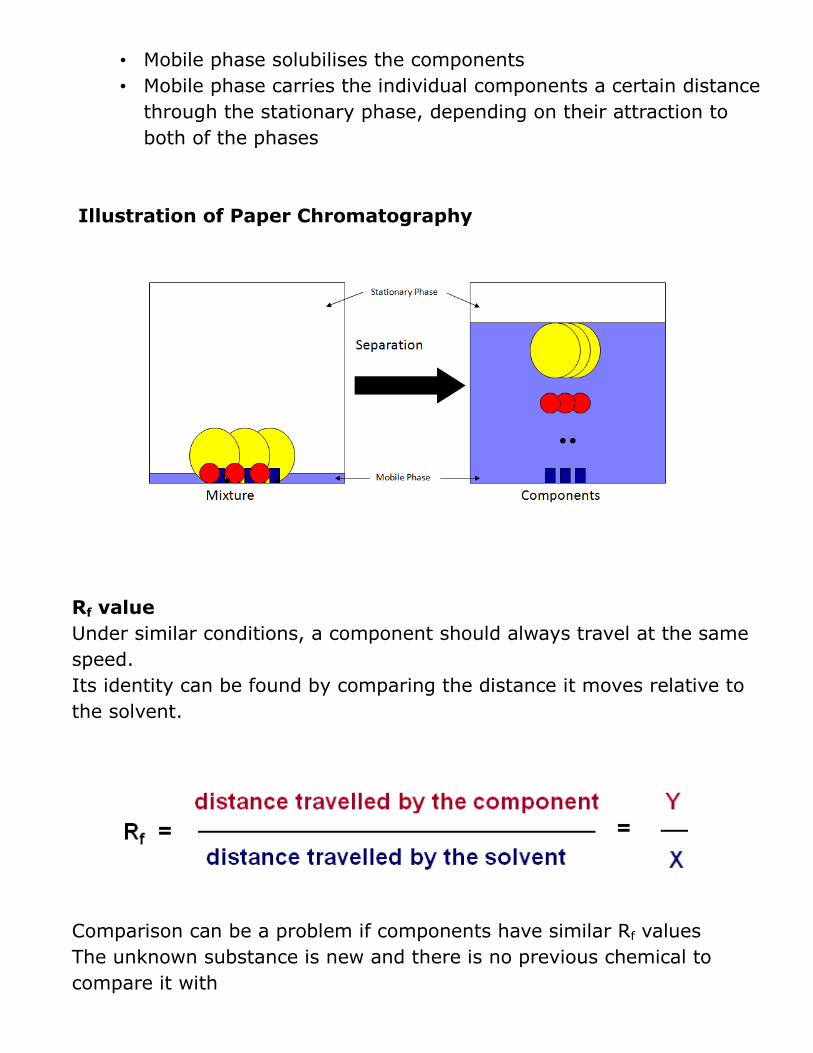
• Mobile phase solubilises the components
• Mobile phase carries the individual components a certain distance
through the stationary phase, depending on their attraction to
both of the phases
Illustration of Paper Chromatography
Rf value
Under similar conditions, a component should always travel at the same
speed.
Its identity can be found by comparing the distance it moves relative to
the solvent.
Comparison can be a problem if components have similar Rf values
The unknown substance is new and there is no previous chemical to
compare it with
Types of Chromatography
(a) Paper Chromatography – separates dried liquid samples with a
liquid solvent (mobile phase) and a paper strip (stationary phase)
(b) Thin-Layer Chromatography – separates dried liquid samples with
a liquid solvent (mobile phase) and a glass plate covered with a
thin layer of alumina or silica gel (stationary phase)
(c) Column Liquid Chromatography – separates liquid samples with a
liquid solvent (mobile phase) and a column composed of solid
beads (stationary phase)
(d) Gas Chromatography (GLC & HPLC) – separates vaporized
samples with a carrier gas (mobile phase) and a column
composed of a Liquid or of solid beads (stationary phase)
Paper Chromatography
Stationary phase
Paper (Filter or Chromatography)
Mobile phase
Suitable organic solvent (water /Alcohol)
Thin Layer Chromatography
Here the mobile phase is a liquid
Flowing past a thin layer of powder on a solid support (silica).
Substances that are less attracted to the solid or are more soluble in the
liquid move faster.
And so move further up the plate by the time that the process has been
stopped by taking the plate out of the liqiud. - larger Rf
The surface of the plate consists of a very thin layer of silica on a plastic
or aluminum backing. The silica is very polar. This is the stationary
phase. Spot the material at the origin (bottom) of the TLC plate.
Place the plate into a glass jar with a small amount of a solvent in the
glass jar. This solvent acts as the moving phase.
Remove the plate from the bottle when the solvent is close to the top of
the plate.
Non-polar compounds will be less strongly attracted to the plate and will
spend more time in the moving phase. This compound will move faster
and will appear closer to the top of the plate.
Polar compounds will be more strongly attracted to the plate and will
spend less time in the moving phase and appear lower on the plate.
Be sure to remove the TLC plate when it appears that the solvent front
isn’t moving!
Reason: the solvent is evaporating as it moves up the plate.
Results: If you don’t remove the plate all of the spots will appear near
the top of the plate!!!!! This isn’t a pretty sight and makes it difficult to
get good Rf values!
Visualization Method
Some plates shows colored spots. Most of the time, the spots won’t show
unless they are visualized! Vizualization is a method that is used to
render the TLC spots visible.
A visualization method can be:
(a) Ultraviolet light
(b) Iodine vapors to stain spots
(c) Colored reagents to stain spots
(d) Reagents that selectively stain spots while leaving others
unaffected.
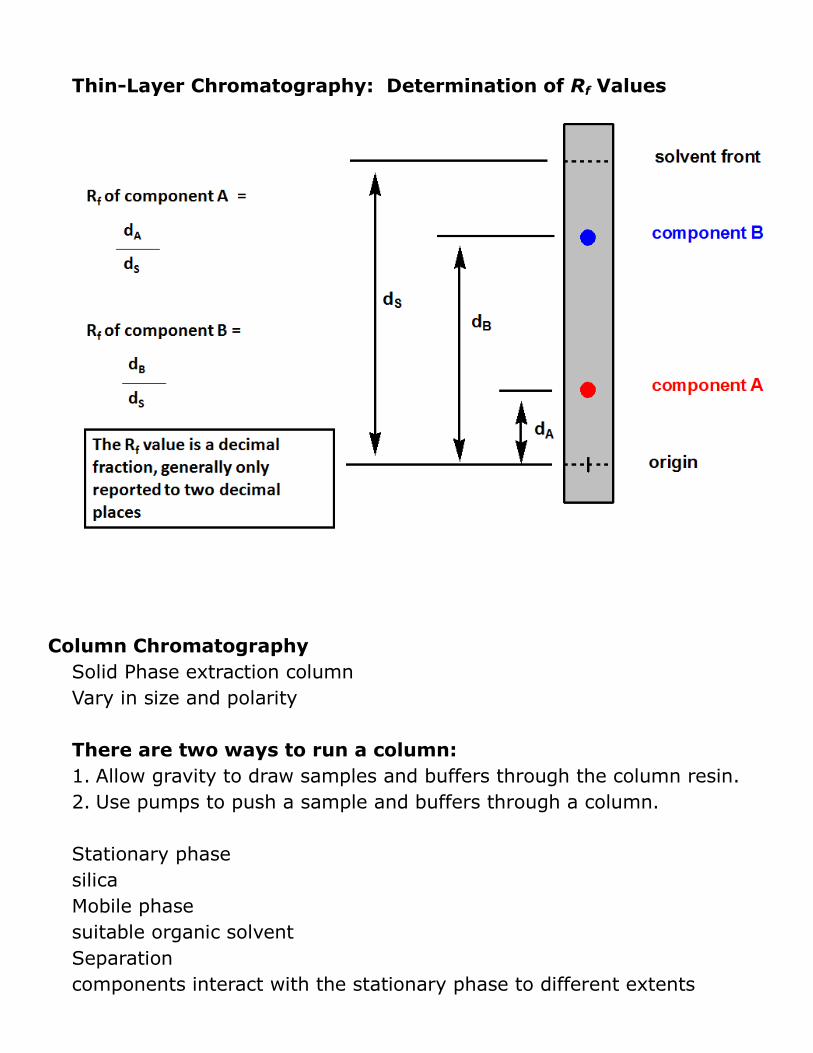
Thin-Layer Chromatography: Determination of Rf Values
Column Chromatography
Solid Phase extraction column
Vary in size and polarity
There are two ways to run a column:
1. Allow gravity to draw samples and buffers through the column resin.
2. Use pumps to push a sample and buffers through a column.
Stationary phase
silica
Mobile phase
suitable organic solvent
Separation
components interact with the stationary phase to different extents
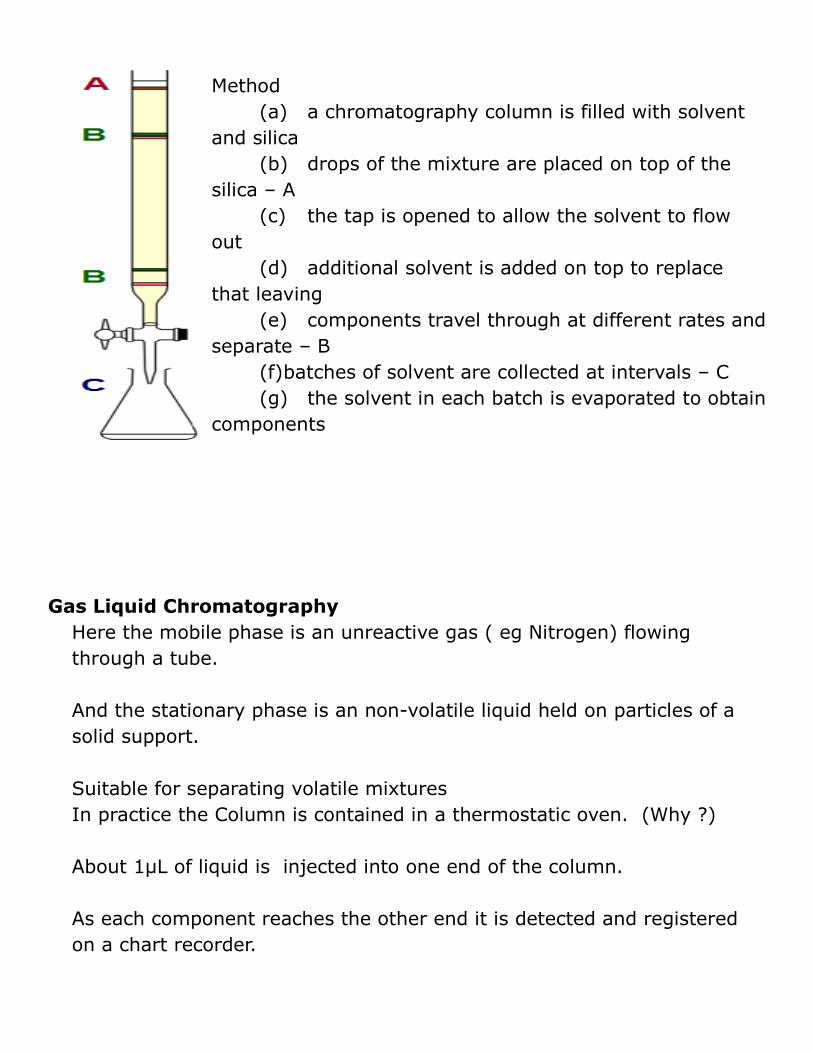
Method
(a) a chromatography column is filled with solvent
and silica
(b) drops of the mixture are placed on top of the
silica – A
(c) the tap is opened to allow the solvent to flow
out
(d) additional solvent is added on top to replace
that leaving
(e) components travel through at different rates and
separate – B
(f) batches of solvent are collected at intervals – C
(g) the solvent in each batch is evaporated to obtain
components
Gas Liquid Chromatography
Here the mobile phase is an unreactive gas ( eg Nitrogen) flowing
through a tube.
And the stationary phase is an non-volatile liquid held on particles of a
solid support.
Suitable for separating volatile mixtures
In practice the Column is contained in a thermostatic oven. (Why ?)
About 1μL of liquid is injected into one end of the column.
As each component reaches the other end it is detected and registered
on a chart recorder.
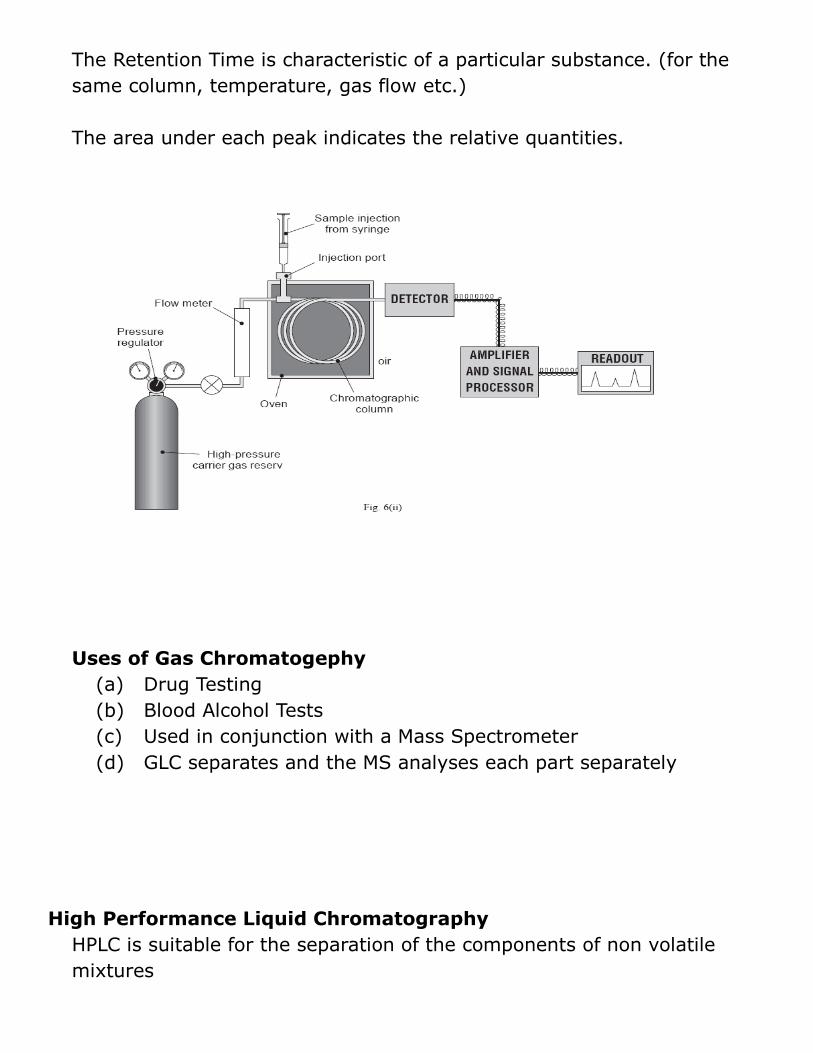
The Retention Time is characteristic of a particular substance. (for the
same column, temperature, gas flow etc.)
The area under each peak indicates the relative quantities.
Uses of Gas Chromatogephy
(a) Drug Testing
(b) Blood Alcohol Tests
(c) Used in conjunction with a Mass Spectrometer
(d) GLC separates and the MS analyses each part separately
High Performance Liquid Chromatography
HPLC is suitable for the separation of the components of non volatile
mixtures
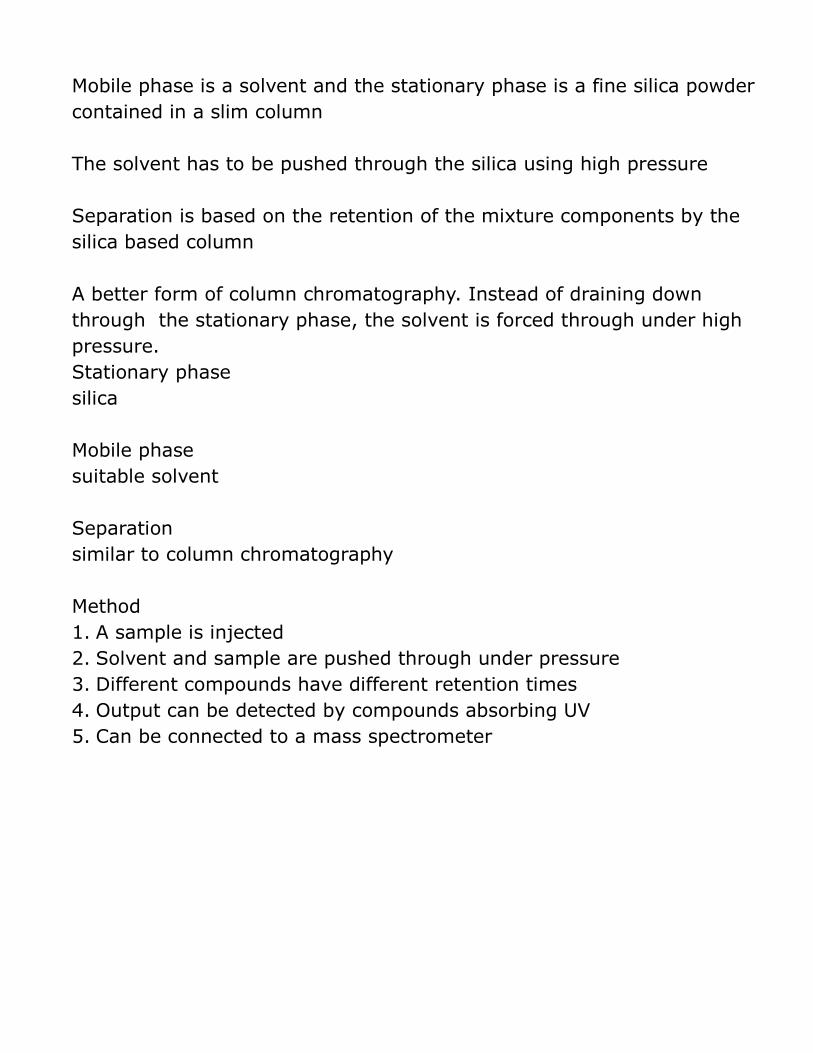
Mobile phase is a solvent and the stationary phase is a fine silica powder
contained in a slim column
The solvent has to be pushed through the silica using high pressure
Separation is based on the retention of the mixture components by the
silica based column
A better form of column chromatography. Instead of draining down
through the stationary phase, the solvent is forced through under high
pressure.
Stationary phase
silica
Mobile phase
suitable solvent
Separation
similar to column chromatography
Method
1. A sample is injected
2. Solvent and sample are pushed through under pressure
3. Different compounds have different retention times
4. Output can be detected by compounds absorbing UV
5. Can be connected to a mass spectrometer
Uses
Used where mixtures are less volatile and so cannot be separated using
GC
Used to analyse vitamins in food and growth promoters in meat
Spectroscopy
Spectroscopy is analysis of the interaction between electromagnetic
radiation and matter.
Different types of radiation interact in characteristic ways with different
samples of matter
The interaction is often unique and serves as a diagnostic "fingerprint" for
the presence of a particular material in a sample
Spectroscopy is also a sensitive quantitative technique that can
determine trace concentrations of substances.
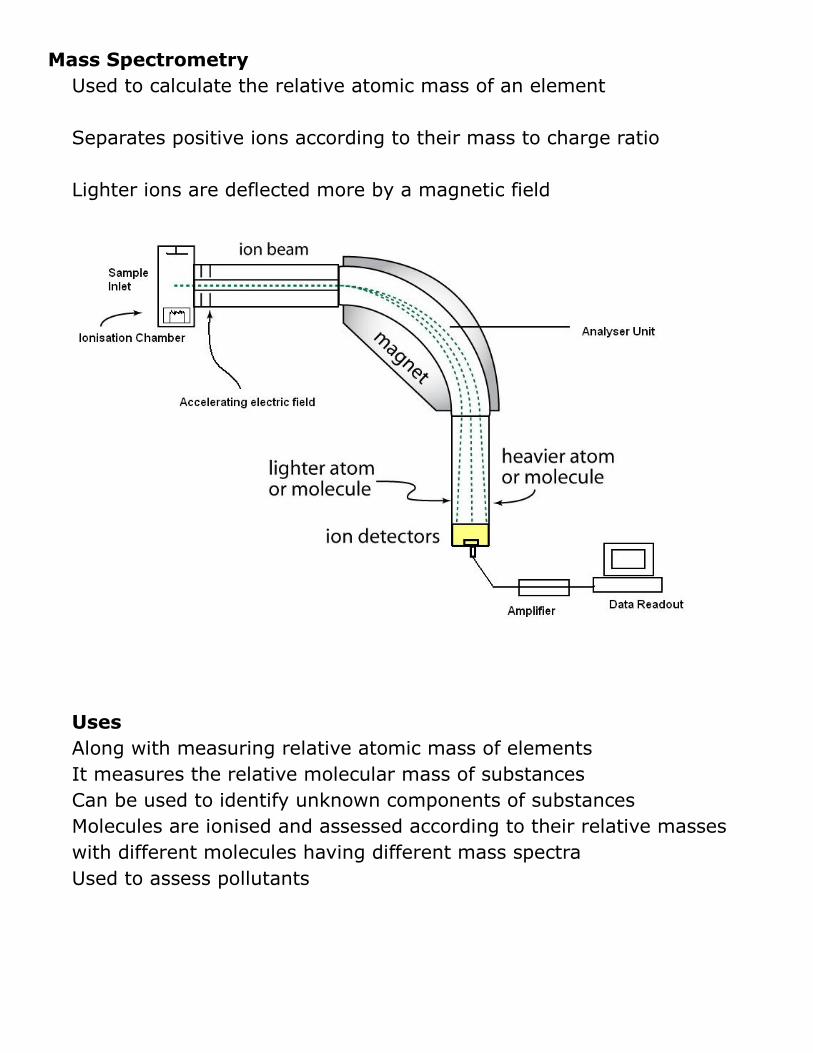
Mass Spectrometry
Used to calculate the relative atomic mass of an element
Separates positive ions according to their mass to charge ratio
Lighter ions are deflected more by a magnetic field
Uses
Along with measuring relative atomic mass of elements
It measures the relative molecular mass of substances
Can be used to identify unknown components of substances
Molecules are ionised and assessed according to their relative masses
with different molecules having different mass spectra
Used to assess pollutants
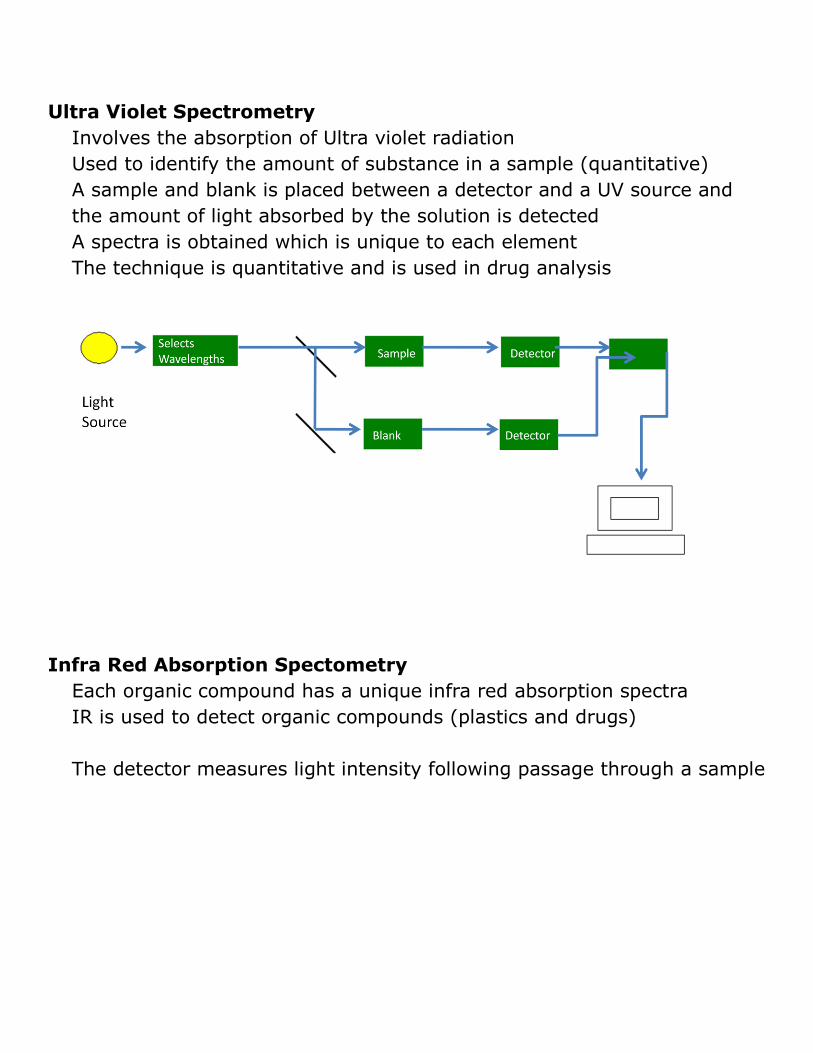
Ultra Violet Spectrometry
Involves the absorption of Ultra violet radiation
Used to identify the amount of substance in a sample (quantitative)
A sample and blank is placed between a detector and a UV source and
the amount of light absorbed by the solution is detected
A spectra is obtained which is unique to each element
The technique is quantitative and is used in drug analysis
Infra Red Absorption Spectometry
Each organic compound has a unique infra red absorption spectra
IR is used to detect organic compounds (plastics and drugs)
The detector measures light intensity following passage through a sample
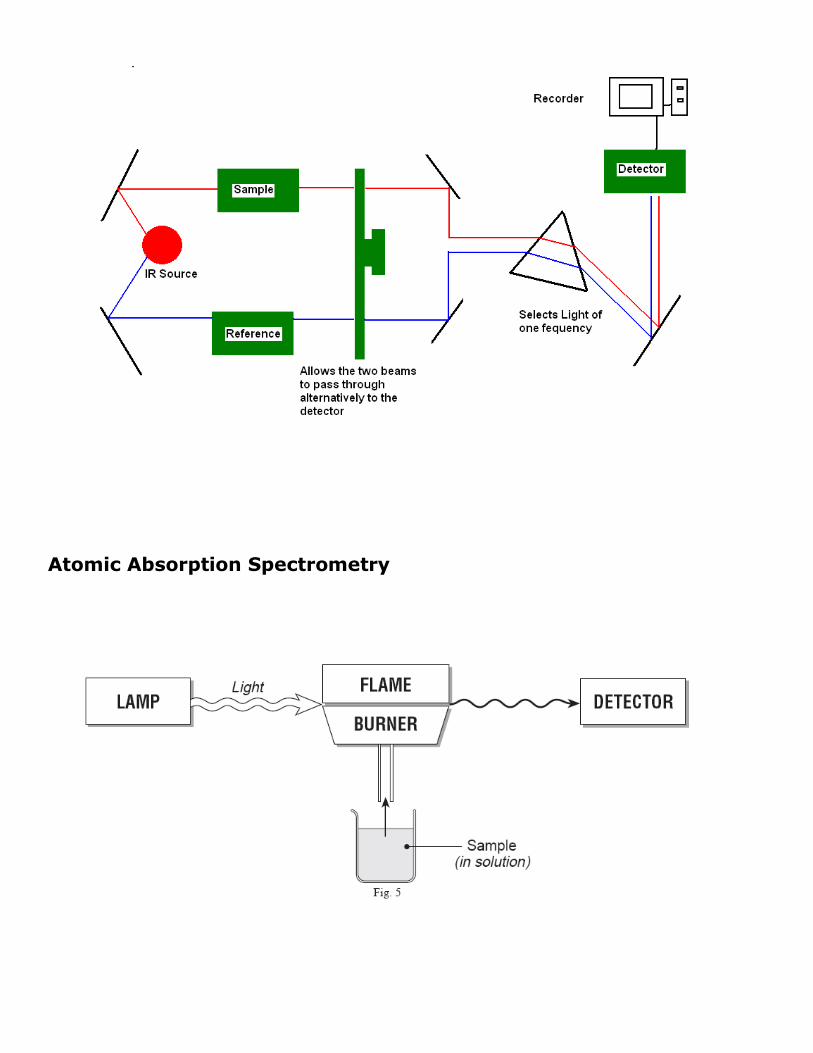
Atomic Absorption Spectrometry
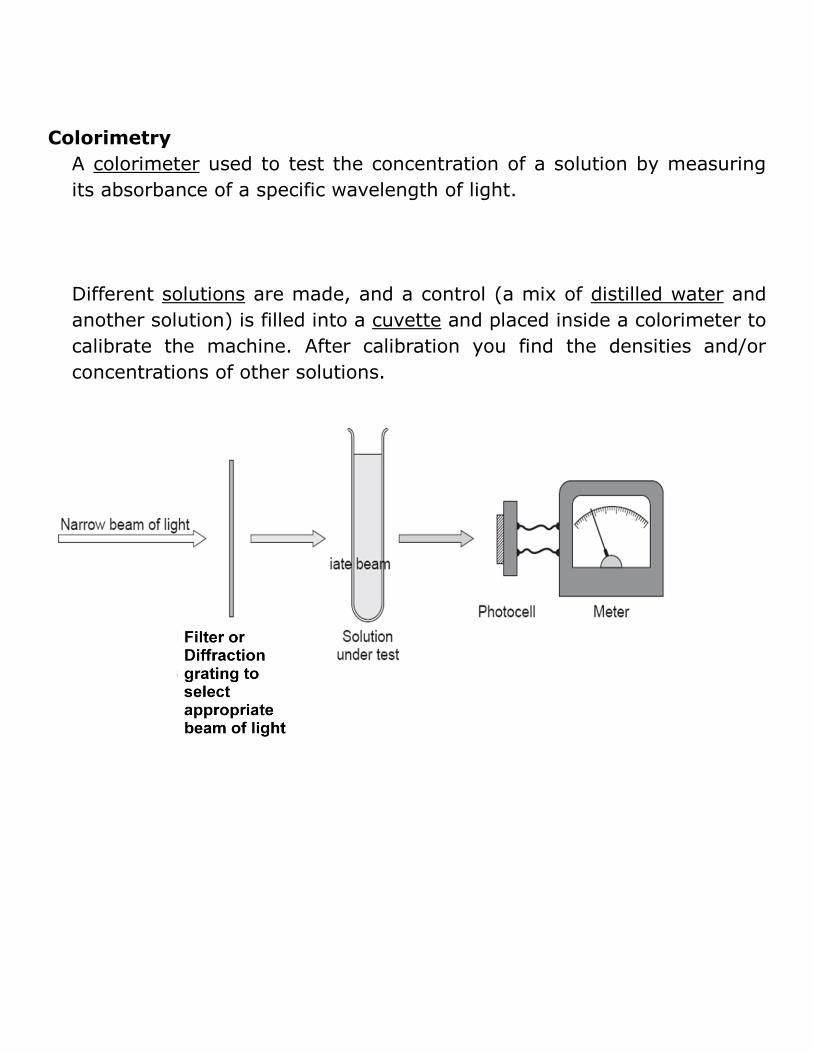
Colorimetry
A colorimeter used to test the concentration of a solution by measuring
its absorbance of a specific wavelength of light.
Different solutions are made, and a control (a mix of distilled water and
another solution) is filled into a cuvette and placed inside a colorimeter to
calibrate the machine. After calibration you find the densities and/or
concentrations of other solutions.


![Paper and Thin Layer Chromatography (TLC) Experiment 6 BCH 333 [practical]](https://img.pdfslide.us/doc/110x75/56649f345503460f94c515db/paper-and-thin-layer-chromatography-tlc-experiment-6-bch-333-practical.jpg)