Embed Size (px)
Citation preview
CHROMATOGRAPHIC METHOD OF DETERMINING ACETONE
IN VAPOUR-AIR AND WATER-ACETONE MIXTURES
V. P . Z a l i n y a n , M. V. K i r a k o s y a n , N. B. Z n a m e n s k a y a , P . A. C h a k h o y a n , V. N. G r i g o r y a n , A. N. A i r a p e t y a n , a n d K. A. O v s e p y a n
UDC 677.494.744.72
ANALYSIS OF VAPOUR-AIR MIXTURE
The mixture of acetone and air, extracted by means of ventilators from the plant, is directed to the r ecovery department, where the acetone is separated and re turned to the process . If the concentration of acetone in the v a p o u r - a i r mixture (yam) reaching the r ecovery depar tment is known, one can assess wheth- er all the acetone has been recovered and take t imely steps to eliminate i r regular i t i es in the process ing conditions leading to losses of acetone. Previously the yam was analysed during production by a chemical method (reaction of acetone with hydroxylamine) which is laborious, lengthy and does not give reproducible resul ts . At present, a chromatographic method of analysing complex liquid and gaseous mixtures is widely used in controll ing technological processes . Its advantages are speed, high sensitivity, good reproducibi l i ty of results , ease of setting up the chromatographic column and others.
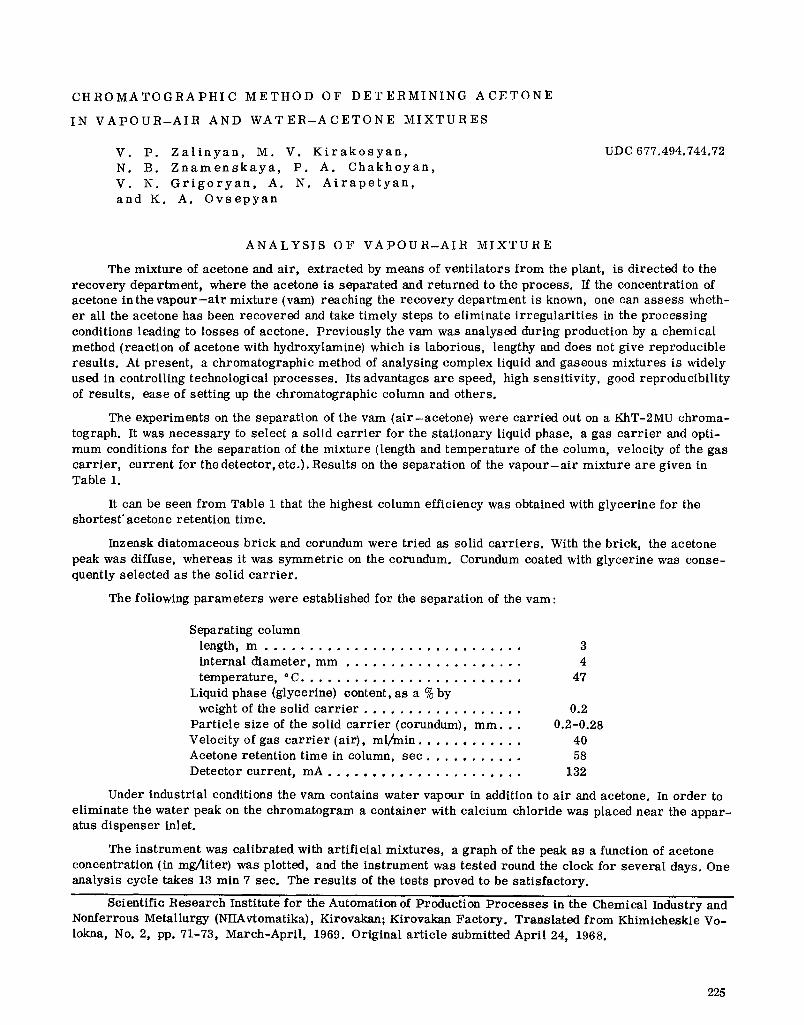
The experiments on the separat ion of the vam (a i r - ace tone ) were car r ied out on a KhT-2MU chroma- tograph. It was neces sa ry to select a solid c a r r i e r for the s tat ionary liquid phase, a gas c a r r i e r and opti- mum conditions for the separat ion of the mixture (length and tempera ture of the column, velocity of the gas ca r r i e r , cur rent for the deteetor, etc.). Results on the separat ion of the v a p o u r - a i r mixture a re given in Table 1.
It can be seen f rom Table 1 that the highest column efficiency was obtained with g lycer ine for the shortest" acetone retention time.
Inzensk diatomaceous br ick and corundum were tried as solid ca r r i e r s . With the brick, the acetone peak was diffuse, whereas it was symmet r i c on the corundum. Corundum coated with glycer ine was conse- quently selected as the solid ca r r i e r .
The following pa rame te r s were established for the separat ion of the vam:
Separating column length, m . . . . . . . . . . . . . . . . . . . . . . . . . . . . . 3 internal d iameter , mm . . . . . . . . . . . . . . . . . . . . 4 temperature , ° C . . . . . . . . . . . . . . . . . . . . . . . . . 47
Liquid phase (glycerine) content, as a % by weight of the solid c a r r i e r . . . . . . . . . . . . . . . . . . 0.2
Par t ic le size of the solid c a r r i e r (corundum), m m . . . 0.2-0.28 Velocity of gas c a r r i e r (air), ml/min . . . . . . . . . . . . 40 Acetone retention t ime in column, sec . . . . . . . . . . . 58 Detector current , mA . . . . . . . . . . . . . . . . . . . . . . 132
Under industrial conditions the vam contains water vapour in addition to a i r and acetone. In order to eliminate the water peak on the chromatogram a container with calcium chloride was placed near the appar- atus dispenser inlet.
The inst rument was cal ibrated with art i f icial mixtures, a graph of the peak as a function of acetone concentration (in mg/liter) was plotted, and the instrument was tested round the clock for severa l days. One analysis cycle takes 13 rain 7 sec. The resul ts of the tests proved to be sat isfactory.
Scientific Research Institute for the Automation of Production P r o c e s s e s in the Chemical Industry and Nonferrous Metallurgy (NIIAvtomatika), Kirovakan; Kirovakan Factory . Transla ted f rom Khimicheskie Vo- lokna, No. 2, pp. 71-73, March-Apri l , 1969. Original ar t ic le submitted April 24, 1968.
225
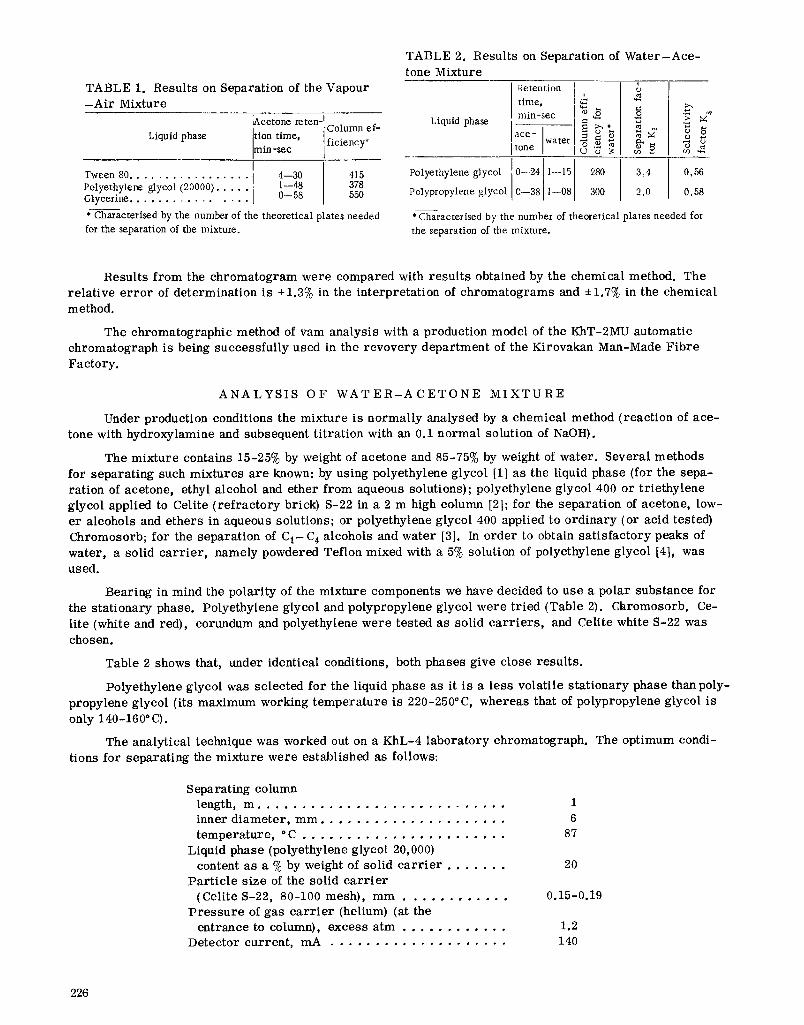
TABLE 1. Results on Separation of the Vapour - A i r Mixture
Liquid phase ~Acetone reten-I , :Column et- Ition time, ] • ~in - s e c ficiency
I Tween 80 . . . . . . . . . . . . . . . . . i 4--30 415 Polyethylene glycol (20000) . . . . . I 1--48 378 Glycerine . . . . . . . . . . . . . . . . I 0--58 550
* Characterised by the number of the theoretical plates needed for the separation of the mixture.
TABLE 2. Results on Separation of W a t e r - A c e - tone Mixture
Liqu~ phase
Polyethylene glycol
Polypropylene glycol
Retention ] , time,
i min-sec . ~o
a c e tone water ~ .N~ ~
0--24 1---15 280
C--38 1--08 300
I t9
3,4
2,0
0,56
0,58
* Characterised by the number of theoretical plates needed for the separation of the mixture.
Results f rom the chromatogram were compared with resul ts obtained by the chemical method. The relat ive e r r o r of determination is :~1.3% in the interpretat ion of chromatograms and + 1.7% in the chemical method.
The chromatographic method of yam analysis with a production model of the KhT-2MU automatic chromatograph is being successful ly used in the revovery department of the Kirovakan Man-Made Fibre Factory.
A N A L Y S I S O F W A T E R - A C E T O N E M I X T U R E
Under production conditions the mixture is normaLly analysed by a chemicaL method (reaction of ace- tone with hydroxylamine and subsequent t i tration with an 0.1 normal solution of NaOH).
The mixture contains 15-25% by weight of acetone and 85-75% by weight of water. Several methods for separat ing such mixtures are known: by using polyethylene glycol [1] as the liquid phase (for the sepa- ration of acetone, ethyl alcohol and ether f rom aqueous solutions); polyethylene glycol 400 or tr iethylene glycol applied to Celite ( re f rac to ry brick) S-22 in a 2 m high column [2]; for the separat ion of acetone, low- er alcohols and ethers in aqueous solutions; or polyethylene glycol 400 applied to ord inary (or acid tested) Chromosorb; for the separat ion of C 1- C 4 alcohols and water [3]. In order to obtain sa t i s fac tory peaks of water, a solid ca r r i e r , namely powdered Teflon mixed with a 5% solution of polyethylene glycol [4], was used.
Bearing in mind the polari ty of the mixture components we have decided to use a polar substance for the s tat ionary phase. Polyethylene glycol and polypropylene glycol were tr ied (Table 2). Chromosorb, Ce- lite (white and red), corundum and polyethylene were tested as solid c a r r i e r s , and Celite white S-22 was chosen.
Table 2 shows that, under identical conditions, both phases give close resul ts .
Polyethylene glycol was selected for the liquid phase as it is a less volatile s tat ionary phase than poly- propylene glycol (its maximum working tempera ture is 220-250°C, whereas that of polypropylene glycol is
only 140-160" C).
The analytical technique was worked out on a KhL-4 labora tory chromatograph. The optimum condi- tions for separat ing the mixture were established as follows:
Separating coLumn length, m . . . . . . . . . . . . . . . . . . . . . . . . . . . . 1 inner diameter, mm . . . . . . . . . . . . . . . . . . . . . 6 temperature, o C . . . . . . . . . . . . . . . . . . . . . . . 87
Liquid phase (polyethylene glycol 20,000) content as a % by weight of solid carr ier . . . . . . . 20
Par t i c le size of the soLid c a r r i e r (Celite S-22, 80-100 mesh), mm . . . . . . . . . . . . 0.15-0.19
P r e s s u r e of gas c a r r i e r (helium) (at the entrance to column), excess arm . . . . . . . . . . . . 1.2
Detector current , mA . . . . . . . . . . . . . . . . . . . . 140
226
As cal ibrat ion by normal i sa t ion is not poss ible , it was ca r r i ed out by a s tandard isa t ion method. Eth- yl alcohol was chosen as an in ternal s tandard and was used in quanti t ies equal to 20% of the volume of the mix tu re to be analysed. The cal ibra t ion was done with ar t i f ic ia l m ix tu re s s im i l a r to product ion mix tu re s in composit ion. In o rde r to save t ime cal ibrat ion and calculat ion of the ana lyses was c a r r i e d out only for acetone. The cal ibra t ion fac tor K for acetone was 2.14 (2.08-2.17). Using this mean coefficient K the vo l - ume % composi t ion of production mix tu r e s was calculated:
hac 25 Vac = _ ~aet.--- ~ ,
where hac is the height of acetone peak in mm; her is the height of ethyl alcohol peak in m m .
The re la t ive e r r o r in the de te rmina t ion of acetone in water is :e2%.
The above method of analyt ical control fo r t h e w a t e r - a e e t o n e mix tu re uti l ising the KhL-4 l abo ra to ry chromatograph is success fu l ly used in the a c e t o n e - r e c o v e r y depar tment of the Kirovakan Man-Made F ib re Fac tory .
L I T E R A T U R E C I T E D
i . J . E . Fox, Proc . Soc. Exper im. Biol. Meal., 97, 263 (1958). 2. S . D . Bondar and S. Dzh. Male, G a s - L i q u i d Chromatography, Collection of a r t i c l e s [in Russian],
NIITI~KhIM (1961), p. 147. 3. P. UrSne and R. L. Pecsok, Anal. Chem. , 35, No. 7, 837 (1963). 4. D . F . Bennett, Anal. Chem., 36, No. 7, 837 (1963).
227