Embed Size (px)
Citation preview

1
1
Chromatin Profiling Reveals Regulatory Network Shifts and a 2
Protective Role for HNF4A during Colitis 3
4 5
Sanjay Chahar1, Vishal Gandhi1, Shiyan Yu2, Kinjal Desai5, Richard Cowper-Sal·lari6, 6 Yona Kim1, Ansu O. Perekatt1, Namit Kumar1, Joshua K. Thackray1, Anthony Musolf1, 7 Nikhil Kumar1, A. Hoffman1, Douglas Londono1, Berta N. Vazquez1, Lourdes Serrano1, 8 Hyunjin Shin4, Mathieu Lupien6,7,8, Nan Gao2,3, Michael P. Verzi1,3,# 9
10 11
1Human Genetics Institute of New Jersey and the Department of Genetics, Rutgers, the State 12 University of New Jersey, Piscataway, NJ; 2Department of Biological Sciences, Rutgers, the State 13 University of New Jersey, Newark, NJ; 3Rutgers Cancer Institute of New Jersey - Member 14 4Department of Translational Medicine, Takeda Pharmaceuticals International, Inc. Cambridge, 15 MA; 5Department of Genetics, Norris Cotton Cancer Center, Dartmouth Medical School, 16 Lebanon, NH, USA; 6The Princess Margaret Cancer Centre – University Health Network, 17 Toronto, ON, Canada; 7Department of Medical Biophysics, University of Toronto, Toronto, ON, 18 Canada; 8Ontario Institute for Cancer Research, Toronto, ON, Canada 19 20 21 22 23 Short title: HNF4A protects against active inflammation 24 25 26 27 28 29 30 31 Abstract, introduction, Results, Discussion, and figure legends = 29,842 characters; 4,948 words 32 Materials and Methods = 14,507 characters; 2,626 words 33 34 35 36 #Correspondence to: 37 Dr. Michael P. Verzi 38 145 Bevier Rd. 39 LSB 127 40 Piscataway, NJ 41 08854 42 732-445-1027 x40030 43 [email protected] 44 45 46 47
48
MCB Accepts, published online ahead of print on 30 June 2014Mol. Cell. Biol. doi:10.1128/MCB.00349-14Copyright © 2014, American Society for Microbiology. All Rights Reserved.
on February 10, 2018 by guest
http://mcb.asm
.org/D
ownloaded from

2
Chromatin Profiling Reveals Regulatory Network Shifts and a 49
Protective Role for HNF4A during Colitis 50 51 ABSTRACT 52 53 Transcriptional regulatory mechanisms likely contribute to the etiology of Inflammatory 54
Bowel Disease (IBD), as genetic variants associated with the disease are 55
disproportionately found at regulatory elements. However, the transcription factors 56
regulating colonic inflammation are unclear. To identify these transcription factors, we 57
mapped epigenomic changes in the colonic epithelium upon inflammation. Epigenetic 58
marks at transcriptional regulatory elements responded dynamically to inflammation and 59
indicated a shift in epithelial transcriptional factor networks. Active enhancer chromatin 60
structure at regulatory regions bound by the transcription factor HNF4A was reduced 61
during colitis. In agreement, upon an inflammatory stimulus HNF4A was down-regulated 62
and showed a reduced ability to bind chromatin. Genetic variants that confer a 63
predisposition to IBD map to HNF4A binding sites in the human colon cell line, CaCo2, 64
suggesting impaired HNF4A binding could underlie genetic susceptibility to IBD. 65
Despite reduced HNF4A binding during inflammation, a temporal knockout model 66
revealed HNF4A still actively protects against inflammatory phenotypes and promotes 67
immune regulatory gene expression in the inflamed colonic epithelium. These findings 68
highlight the potential for HNF4A agonists as IBD therapeutics. 69
70 Keywords: Colitis; Epithelium; Transcriptional Regulation, epigenetic, HNF4A, histone, 71 H3K27ac, genetic variant, SNP, IBD. 72 73
74
on February 10, 2018 by guest
http://mcb.asm
.org/D
ownloaded from

3
INTRODUCTION 75 76
The colonic epithelium is an integral component in IBD pathology; compromised 77
epithelial integrity permits increased interaction between the gut immune system and 78
luminal antigens. However, the colonic epithelium is not merely a passive barrier against 79
luminal microbes; active epithelial roles include antigen presentation, adaptive and innate 80
immune regulation, and anti-microbial peptide production, among others (1-3). A 81
detailed molecular understanding of the epithelium’s role in IBD and how the epithelium 82
responds to an inflammatory insult could offer therapeutic alternatives or innovations to 83
current treatments. 84
Transcriptional regulatory networks serve as the interface between the 85
extracellular environment and genome regulation. Defining how the regulatory networks 86
of the epithelium respond to inflammation could provide important insights into the role 87
of the epithelium in IBD. Transcriptional regulatory networks can be inferred from a 88
cell’s epigenome, which is a collection of epigenomic marks, typically a histone post-89
translational modification that is associated with a particular genome function. 90
Transcriptional enhancer epigenomic marks are strong predictors of cellular identity and 91
gene expression (4, 5). Nucleosomes containing histone 3, lysine 27 acetylation 92
(H3K27ac) can be used to identify regions with distal regulatory activity (transcriptional 93
enhancers), flank chromatin-accessible transcription factor binding regions, and are 94
predictive of active transcription in a condition-specific manner (4, 6, 7). Changes in 95
H3K27ac levels and DNA-accessibility predict changes in transcription factor occupancy 96
(8, 9); dynamic enhancer chromatin structures can thus serve as a discovery tool to 97
identify shifts in transcription factor regulatory networks induced by disease. 98
To identify the transcriptional networks impacted during a mouse model of colitis, 99
we profiled the genome-wide H3K27ac levels before or during colonic inflammation. 100
Epigenomic profiling of the colonic epithelium revealed a redistribution of enhancer 101
activity upon inflammation. Notably, the genomic regions losing enhancer chromatin 102
conformation were enriched in DNA-motifs recognized by the Hepatocyte nuclear factor 103
4α (HNF4A) transcription factor, suggesting HNF4A chromatin-binding activity may be 104
compromised in the inflamed epithelium, and prompted a detailed investigation into 105
on February 10, 2018 by guest
http://mcb.asm
.org/D
ownloaded from

4
HNF4A gene regulation and function during colitis. Genome-scale analysis of HNF4A 106
binding revealed diminished interaction between HNF4A and chromatin in the inflamed 107
condition. Direct transcriptional targets of HNF4A were identified in the inflamed colon 108
and included immune regulatory target genes, which were reduced in the absence of 109
HNF4A. HNF4A binding events were over represented at human genetic variants 110
associated with increased IBD risk. Finally, we provide evidence that HNF4A plays an 111
active role suppressing colitis during an inflammatory bout. Together, our study resolves 112
the temporal window in which HNF4A suppresses colonic inflammation and for the first 113
time provides direct regulatory targets of HNF4A in this tissue and in the inflamed state. 114
These insights into the molecular mechanisms of HNF4A during colonic inflammation 115
should bolster efforts to restore HNF4A activity as a therapeutic approach for acute 116
colitis. 117
118
MATERIALS AND METHODS 119 120 Mice 121
C57BL/6J mice, 12-14 weeks, were housed in specific pathogen free conditions 122
according to protocol #11-017, approved by Institutional Animal care and Use committee 123
of Rutgers University. All tissues were collected between 12:00 and 14:00 to avoid 124
circadian variability. 125
126
Experimental colitis and isolation of colon epithelial cells 127
Mixed genders of mice were used to study the effect of DSS induced inflammation on 128
weight loss, colon length, and histopathology of distal colon in control and HNF4A KO 129
“before” and “concurrent with” DSS treatment (Fig. 6). DSS Colitis was induced with 130
3% DSS (m.w. = 36,000-50,000; MP Biomedicals, Solon, OH, U.S.A.) solution in 131
drinking water for up to 7 days. Daily changes in body weight were assessed. Water 132
consumption was monitored daily to ensure the amounts of DSS consumed as reported 133
previously (10). Control mice were littermates given normal water, housed and 134
processed identically. Tamoxifen-induced HNF4A knockout was induced by 135
intraperitoneal injection, 2 mg/day for 3 days; HNF4A KO “Before” DSS treatment was 136
achieved by 3 days consecutive tamoxifen injection followed by a 2 day rest before 5 137
on February 10, 2018 by guest
http://mcb.asm
.org/D
ownloaded from

5
days of DSS treatment; HNF4A KO “concurrent with” genetic ablation was achieved by 138
3 days consecutive tamoxifen injection concurrent with the onset of 5 days treatment with 139
DSS. All control animals received vehicle-only treatments in parallel with tamoxifen 140
injections using sunflower oil and/or using normal water instead of DSS-containing water 141
(Figure 6A). 142
143
Histolopathology scores in Figure 6D were calculated using the metrics defined 144
previously (11) in distal colon after 5 days of DSS treatment following three criteria for 145
scoring: severity of inflammation, crypt damage, and ulceration. Severity of 146
inflammation was scored ranging from 0 (rare inflammatory cells in lamina propria), 1 147
(increased number of inflammatory cells in lamina propria), 2 (confluent inflammatory 148
cells extended to sub-mucosa) to maximum of 3 (transmural extension of inflammatory 149
infiltrate). Crypt damage was scored ranging from 0 (intact crypt), 1 (loss of basal one 150
third crypt), 2 (loss of basal two third crypt), 3 (entire crypt loss), 4 (change in epithelial 151
surface with erosion) to maximum of 5 (confluent erosion). Ulceration was scored from 0 152
(absence of ulcer), 1 (1 or 2 foci of ulceration), 2 (3 or 4 foci of ulceration), to maximum 153
of 3 (extensive erosion). Histopathological examination was performed on 8 control mice 154
(5 male, 3 female), 8 HNF4A KO “concurrent with” DSS (4 male, 4 female), and 8 155
HNF4A KO “before DSS” (3 male, 5 female) post 5 days of DSS treatment. Mice used 156
for weight loss analysis (Fig. 6B) in each set are as follows: control (29 mice; 12 males 157
and 17 females), control DSS (24 mice; 9 males, 15 females), HNF4A KO (22 mice; 16 158
males and 6 females), HNF4A KO “concurrent with” DSS (22 mice; 12 males, 10 159
females), HNF4A KO “before” DSS (19 mice; 9 males, and 10 females). Mice used for 160
colon length data (entire colon, Figure 6C) are as follows: control (7 mice; 4 male, 3 161
female), HNF4A KO (2 male mice), control DSS (18 mice; 5 male and 13 females), 162
HNF4A KO “before” DSS (14 mice; 5 male, 9 female), HNF4A KO “concurrent with” 163
DSS (15 mice; 6 male and 9 female). 164
165
For ChIP-Seq analysis; Colon epithelial cells were isolated following a scraping method 166
with little modification (12). Briefly, distal colon segments were opened in ice-cold PBS 167
and scraped using a glass slide; the mucosal scrapings were re-suspended in ice-cold PBS 168
on February 10, 2018 by guest
http://mcb.asm
.org/D
ownloaded from

6
and remaining tissue submucosa, muscular, and serosa were analyzed histologically, to 169
ensure the differentiated nature of colon epithelial cells in mucosal scrapings. Two 170
washes and low-speed centrifugation runs (150 x g) were used to reduce blood cell 171
contamination from the epithelial preparation. Mixed genders of mice were used for 172
ChIP-Seq analysis; 3 mice (2 males, 1 female) per experimental set (HNF4A and 173
H3K27ac ChIP-Seq) were pooled for control colon and 8 DSS treated mice (5 females, 3 174
males) per experimental set (HNF4A and H3K27ac) were pooled for ChIP-Seq from 175
inflamed colon. Equal amounts of total chromatin input (measured using Picogreen, Life 176
Technologies) were used for control and DSS-treated colon; 80ug chromatin for each 177
HNF4A ChIP, and 60ug chromatin per H3K27ac ChIP. 178
179
Quantitative RT-PCR, immunoblotting, immunofluorescence, and 180
immunohistochemistry 181
Total RNA was extracted from respective samples (Colon scrapings) using 182
TRIzol (Ambion). 5µg total RNA from control and DSS inflamed Colon was used to 183
purify ploy(A) mRNA using NEBNext Poly(A) mRNA Magnetic Isolation Module 184
(NEB#E7490S/L). cDNA was synthesized from purified Poly(A) mRNA using oligo dT 185
primers (SuperScript III First-Strand Synthesis kit, Invitrogen). Quantitative RT-PCR 186
(qRT-PCR) was performed using ABI Prism 7900HT machine (Applied Biosystems, 187
Foster City, CA). Results were normalized to HPRT expression and wild-type, untreated 188
control animals. Primers sequences are available upon request. The antibodies for 189
Western blot and immunohistochemistry are as follows: rabbit anti-HNF4A (1:1000, sc-190
6556), mouse anti-β-Actin (1:2000, sc-47778), rabbit anti-RelB (1:1000 for Western blot, 191
1:500 for immunohistochemistry, Cell Signaling, #4922), Donkey anti-rabbit IgG-HRP 192
(1:2000, Catalog: #NA934V) and Sheep anti-mouse IgG-HRP (1:2000, Catalog: 193
#NXA931) were from GE Healthcare, biotinylated anti-rabbit IgG (1:200, Catalog: #BA-194
1000) was from Vector Labs. For immunoblot, colonic epithelial scrapings were 195
collected as detailed above and sonicated in cold tissue lysis buffer (50mM Tris-HCl 196
pH7.5, 150mM NaCl, 10mM EDTA, 1mM NaVO4, 1mM PMSF, 0.5% Triton-X100, plus 197
1 × Roche complete protease inhibitors cocktail, 1 × Roche phosphatase inhibitors 198
cocktail) and then left on ice for 20 minutes. The supernatants were collected after 199
on February 10, 2018 by guest
http://mcb.asm
.org/D
ownloaded from

7
centrifugation at 12, 000g for 10 minutes at 4°C and stored at -80 °C for further use. For 200
Western blot, 50ug of whole cell lysates were heat-denatured in 5×SDS sample buffer, 201
separated by 10% SDS-PAGE, and transferred onto PVDF membrane (Millipore, 202
Catalog:# ISEQ00010). The membrane was blocked by 5% skim milk in PBS containing 203
0.1% Tween-20 for one hour, and then detected by antibodies. To detect the HNF4A 204
expression level upon DSS induced inflammation by immunohistochemistry, mice given 205
3% DSS in drinking water for 2, 4, 6 days were euthanized, dissected and the entire colon 206
fixed at 4°C overnight in 4% paraformaldehyde. Fixed tissues were gradually dehydrated 207
in ethanol, embedded in paraffin and cut into 5µm sections. 10mM sodium citrate (pH 208
6.0) was used to retrieve antigens, and endogenous peroxidase activity was inhibited in 209
methanol containing 3% H2O2. Tissue sections were blocked with 5% fetal bovine serum 210
(FBS; Gibco) for 4 hours at ambient temperature, and incubated overnight at 4C with 211
anti-HNF4A ab (1:1000, Santa Cruz, sc-6556). Sections were washed in PBS containing 212
0.1% Tween-20 (AMRESCO, O.H., U.S.A.) for 2h and treated with biotinylated anti-213
goat secondary antibody IgG (1:300; Vector Laboratories) for 1 h. Color reactions were 214
developed using diamiobenzidine substrate (DAB; Sigma-Aldrich) and Vectastain avidin-215
biotin complex (ABC kit; Vector Laboratories). For quantitative immunofluorescence 216
measurement of HNF4A levels during the DSS time course, mice and tissue sections 217
were treated as described above, but secondary antibody was replaced with Cy3-218
conjugated mouse anti-goat (Jackson Immuno Research #115-166-003). Images were 219
acquired using a Zeiss LSM510 META confocal microscope. Three-dimensional 220
reconstructions of the Z-stacks were analyzed using Imaris software (Bitplane AG, 221
Zurich, Switzerland). Mean fluorescence intensity of HNF4A (Cy3) was measured in 222
individual nuclei segmented by DAPI staining (N ≥100 nuclei per condition; P value < 223
0.005 calculated by ANOVA single factor). 224
225
Chromatin immunoprecipitation (ChIP), ChIP-Seq and Data Analysis 226
Colon epithelial cells were prepared from WT control mice and DSS (3% w/v, 6 227
days in drinking water) treated mice, as described above. Chromatin 228
immunoprecipitation was performed as described previously with little modification (13). 229
For HNF4A ChIP, colon epithelial cells were isolated as described above, then cross-230
on February 10, 2018 by guest
http://mcb.asm
.org/D
ownloaded from

8
linked in 1% formaldehyde for 10min at 4°C, and then for 30min at ambient temperature. 231
Cells were washed 2 times with ice cold PBS, and collected by brief centrifugation 232
(1min, 300 x g 4°C). Cells was resuspended in 1ml of Buffer-1 (10mM Tris Ph8.0, 0.25% 233
Triton X-100, 100mM EDTA) for 10min on ice and collected by brief centrifugation 234
(3000rpm, 1min, 4C). Cells were further treated 2 times, each with 1ml of Buffer-2 235
(10mM Tris Ph8.0, 200mM Nacl, 10mM EDTA, and containing 1 x protease inhibitor 236
cocktail mix) for 5min on ice and nuclei were collected by brief centrifugation. Collected 237
nuclei were quickly (5 seconds) rinsed with 1ml of Buffer-3 (10mM Tris-HCl Ph8.0, 238
100mM Nacl, 1mM EDTA, 1% SDS, containing 1x protease inhibitor cocktail mix), 239
centrifuged, dissolved in Buffer-3 and sonicated using a Diagenode Bioruptor to 240
generate 200-to 1000bp fragments, as determined by agarose gel electrophoresis. Cell 241
lysates were diluted 8.4 fold in binding buffer (1% Triton X-100, 2mM EDTA, 150mM 242
NaCl, 20mM Tris-HCl Ph8.0), incubated with 7µl of HNF4A antibody (ab41898, 243
Abcam, lot # GR4841-13)-coupled magnetic beads for 16 h at 4°C. The 244
immunoprecipitates were washed 5 times with RIPA buffer (50mM HEPES, pH 7.6, 245
1mM EDTA, 0.7% Na deoxycholate, 1% NP-40, 0.5M LiCl), and 2 times with TE buffer 246
(10mM Tris-HCl Ph8.0, 0.1mM EDTA). The DNA was recovered by reversing the cross 247
links in 1% SDS, 0.1M NaHCO3, for 6h at 65°C, purified, and quantified by Picogreen 248
(Life Technologies, USA). 7µl of Ab was used per column; three columns were 249
combined to get the desired amount of DNA for library preparation (30ng). 250
H3K27ac histone ChIPs were done as described previously (9, 14); isolated colon 251
epithelial cells were first permeablized with digestion buffer (50mM Tris-HCl, Ph7.6, 252
1mM CaCl2, 0.2% Triton X-100, 5mM NaButyrate, protease inhibitor cocktail (1x), 253
0.5mM PMSF) for 5 minutes on ice, incubated with 0.2-0.4 units micrococcal nuclease 254
(MNase, SIGMA) until most of the genome was reduced to mononucleosome length 255
(~146bp). MNase activity was stopped using an equal volume of buffer (10mM Tris, 256
Ph7.6, 5mM EDTA). Samples were dialyzed in 1000 volumes of RIPA buffer (10mM 257
Tris, Ph7.6, 1mM EDTA, 0.1% SDS, 0.1% Na-Deoxycholate, 1% Triton X-100) for 2 h 258
at 4ºC. 1ml of mononucleosomal chromatin was supplemented with 10µl of 10% SDS, 259
incubated with H3K27ac Ab (Ab4729; Lot # GR28147-1)-coupled magnetic beads for 16 260
h at 4ºC. The immunoprecipitates were washed 5 times with RIPA buffer (50mM 261
on February 10, 2018 by guest
http://mcb.asm
.org/D
ownloaded from
9
HEPES, pH 7.6, 1mM EDTA, 0.7% Na deoxycholate, 1% NP-40, 0.5M LiCl), and 2 262
times with TE buffer (10mM Tris-HCl Ph8.0, 0.1mM EDTA). The DNA was recovered 263
by re-suspending the beads in 100ul of TE (10mM Tris-HCl Ph8.0, 0.1mM EDTA), 264
supplemented with 3µl of 10% SDS and 5µl of 20mg/ml of proteinase K, incubated for 6 265
h at 55ºC, purified and quantified by Picogreen (Life Technologies, USA). 266
Immunoprecipated DNA was either used for qPCR or amplified to generate libraries 267
using the TruSeq DNA sample prep kit (Illumina) and sequenced using Illumina Hi-seq 268
2000. Though NaButyrate was used in H3K27ac ChIP assays, a comparison ChIP-qPCR 269
of 9 target regions with and without NaButyrate found no significant difference in the 270
ChIP fold enrichment between samples with Butyrate versus without Butyrate (1.17 fold 271
+/- 0.25 standard deviation; not significantly different from a ratio of 1, paired t-test). 272
Prior to sequencing, qPCR was used to verify that positive and negative control ChIP 273
regions amplified in the linear range. Sequences were mapped to the Mus musculus 274
reference genome mm9 with ELAND. Sequencing depth was near saturation as 275
determined by binding peak recovery and tag sampling using MACS(15): HNF4A-276
control, 17886946 unique tags, 92.08% saturation of binding peak recovery; HNF4A-277
DSS 15034270 unique tags, 90.42% recovery; H3K27ac-control 12995761 tags, 95.68% 278
recovery; H3K27ac-DSS 15479369 tags, 94.73% recovery. 279
Binding peaks for HNF4A in WT and DSS inflamed colon were identified using Model-280
Based Analysis of ChIP-Seq (15) (MACSV2) with a P value cut off of 10-4 and default 281
values for other parameters. Nucleosomes containing H3K27ac were called using 282
nucleosome positioning from sequencing software (16) and NSD scores were calculated 283
using the BINOCh software package (17) and scoring scheme, as previously outlined (8). 284
The NSD score assigned to a genomic region is calculated by measuring the differential 285
ChIP-seq signal strength between nucleosome pairs and how this differential signal 286
changes upon DSS treatment. Regions with large NSD scores represent regions gaining 287
open, active enhancer chromatin upon DSS treatment; regions with little change score 288
close to 0; regions losing active, open chromatin have negative scores. The most dynamic 289
chromatin regions falling outside 2 kb from the nearest TSS of RefSeq genes were used 290
for subsequent analysis, to allow for focus on putative enhancers, rather than promoters. 291
292
on February 10, 2018 by guest
http://mcb.asm
.org/D
ownloaded from

10
GREAT analysis (version 2.0.2 was used to bin binding sites (MACS2 p-val 293
<104) by distance to nearest TSS (mm9) with a maximum allowable distance of 1Mb 294
(18). GSEA analysis (19) was performed using public gene expression data from DSS 295
treated mice (GEO series GSE22307 expression data were reported on 6 days of 3% DSS 296
treated C57BL/6J male mice, 12-14 weeks old, and controls, with whole colon tissue 297
RNA measured with Affymetrix 430_2.0 arrays,(20)). This GSE22307 expression data 298
was compared to genes within 10 kb of the 1000 most positive or 1000 most negative 299
NSD-scoring chromatin regions. GSEAV2.0 analysis settings were set to default, except to 300
use 5000 permutations of the gene set and the weighted_p2 scoring scheme with a signal 301
to noise metric. 302
To compare changes in gene transcript levels in HNF4A knockout mice with 303
HNF4A ChIP-seq binding frequency nearby these genes, heatmaps were created with a 304
“bound gene” defined as those containing an HNF4A ChIP-seq site within 10kb of the 305
transcriptional start site of the dysregulated gene. Yellow heat corresponds to number of 306
genes with at least 1 HNF4A binding site in a sliding 10 gene window along the 307
expression data rankings. The corresponding gene expression heatmap and color scale 308
were generated using dChip (21) analysis of publically available HNF4A knockout colon 309
gene expression data (GEO series GSE11759 includes Affymetrix 430_2.0 expression 310
array data from control and Hnf4a; Villin-Cre knockout mice at 1 year of age from 311
ref(22) and genes with significant changes in transcript levels (>1.25 fold change, P < 312
0.05, t-test) were arranged from most decreasing to most increasing upon HNF4A 313
knockout. Supplemental Data includes the results of this gene expression analysis and 314
indicates which regulated genes harbor an HNF4A ChIP-seq site within 20kb of their 315
transcriptional start site. 316
Composite plots of ChIP-seq signal traces, evolutionary conservation scores, and DNA 317
motif finding (SeqPos) were generated and analyzed using cistrome tools (23). For motif 318
finding, the SeqPos Motif tool (version 1.0.0) and Cistrome motif database were used to 319
identify factor motifs in top 5000 regions in HNF4A ChIP-Seq (MACS2 p-val <104) or 320
the 1000 regions with highest and lowest NSD scores in H3K27ac ChIP-Seq. 321
The integrated genome viewer (IGV) was used to visualize representative ChIP-322
seq data traces of normalized WIG files (24). WIG files were produced using MACSV1.4 323
on February 10, 2018 by guest
http://mcb.asm
.org/D
ownloaded from

11
(15) and WIG files were normalized to promoter signal at all TSSs (UCSC, mm9) for 324
H3K27ac or to relative number of sequence tags for HNF4A. Variant Set Enrichment 325
(VSE) Analysis was done using HNF4A binding sites defined in CaCo2 cells (GEO 326
dataset GSM575229) at a MACS P value > 10-10 (9) and using VSE as reported 327
previously (25, 26) with GWAS loci for IBD, Ulcerative Colitis, and Crohn’s Disease 328
downloaded on December 10, 2013 from the GWAS catalog at www.genome.gov. 329
Briefly, this analysis calculates a score and p-value for enrichment of a set of disease-330
associated variants (variants are defined as SNPs identified in GWAS studies associated 331
with disease risk, along with SNPs within linkage disequilibrium with the risk-associated 332
SNP) and whether these variants are enriched within a genomic annotation (in this case at 333
HNF4A binding sites defined by ChIP-seq). The intersectBed program from the 334
BEDTools suite is used to compute the overlap between chromosomal coordinates of the 335
SNPs and the HNF4A binding sites. A null distribution for the mapping tally is based 336
upon randomly permuting the variant sets. Analysis was not done to determine whether 337
disease SNPs were enriched specifically within HNF4A binding motifs at the HNF4A 338
binding loci. 339
340
Statistics 341
R was used for statistical analysis for ANOVA. Statistics calculations are 342
embedded in MACS, DAVID, GSEA, NPS, VSE, and Cistrome tools, as described. 343
344
All genome-scale data have been deposited in GEO, GSE52426. 345
346
on February 10, 2018 by guest
http://mcb.asm
.org/D
ownloaded from

12
RESULTS 347
Inflammation-induced epigenomic changes in the intestinal epithelium reveal a shift 348
in transcription factor regulatory networks 349
The intestinal epithelium is an integral component of inflammatory bowel disease, 350
but the impact of acute inflammation on the transcriptional regulatory networks of the 351
colonic epithelium is uncharacterized. The Nucleosome Stability-Destability (NSD) 352
methodology score was developed and has been applied to detect changes in enhancer 353
chromatin structure and discover new transcriptional regulatory networks (8, 9, 14). The 354
NSD scoring algorithm identifies changes in regulatory chromatin by accounting for two 355
properties of transcriptional enhancers: DNA accessibility where transcription factors 356
bind, and flanking nucleosomes with elevated levels of post-translational modifications 357
associated with active transcriptional enhancers (H3K27ac, H3K4me2, H3K4me1) (8, 9, 358
17). Transcription factors occupying dynamic chromatin regions can be discovered using 359
DNA sequence motif enrichment analysis centered on these DNA-accessible regions 360
flanked by modified nucleosomes. To discover transcription factor regulatory networks 361
operating in the normal and inflamed colon, we first identified chromatin regulatory 362
regions that respond dynamically during acute inflammation in mice. The inflammatory 363
state was induced by dextran sodium sulfate treatment (DSS) of adult mice (27). DSS 364
was chosen to induce inflammation because the acute and reproducible nature of the 365
inflammatory response is best suited to detect short-term epigenomic changes. Colonic 366
epithelial cells were scraped from the distal colon of control or DSS-treated mice (3% 367
DSS in drinking water, 6 days), and purified from non-epithelial cells to ensure that 368
measurements of enhancer chromatin changes were specific to the colonic epithelium 369
(epithelial purity was verified by qRT-PCR, data not shown). To determine genomic 370
locations and levels of each H3K27ac-containing nucleosome in the genome, we 371
generated nucleosome maps with H3K27ac ChIP-seq on MNase-treated chromatin from 372
each condition. Similar ChIP-seq levels and distributions of H3K27ac-containing 373
nucleosomes were observed in the inflamed and control colon (209,118 and 195,024 374
nucleosomes containing H3K27ac were identified, respectively at P value < 10-5). To 375
identify dynamic chromatin regions we applied NSD methodology. While the majority of 376
genomic regions are refractory to inflammation (indicated by NSD scores clustering 377
on February 10, 2018 by guest
http://mcb.asm
.org/D
ownloaded from

13
around 0, Fig 1A), thousands of H3K27ac-containing genomic regions exhibit 378
inflammation-induced changes (1639 activated and 2565 reduced genomic regions fall 379
outside 2 standard deviations of the distribution of all NSD scores). Demonstration of 380
H3K27ac modification dynamics are evident in individual ChIP-seq traces, (Figure 1B), 381
and composite ChIP-seq data from the 1000 regions with highest (Fig. 1C, right) and 382
1000 regions with lowest NSD scores (Fig. 1C, left). These genomic regions thus provide 383
a window to view the impact of inflammation on the epigenome of the colonic 384
epithelium. 385
Consistent with a functional regulatory role, genomic regions that exhibit the most 386
dynamic decrease in enhancer chromatin structure were located nearby genes with 387
reduced transcript levels upon inflammation (20). Conversely, regions that gained 388
enhancer chromatin signal were nearby genes with increased expression levels upon 389
inflammation (Fig. 1D, Gene Set Enrichment Analysis (19). The strength of the 390
correlations between dynamic enhancer chromatin and dynamic gene expression was 391
especially strong considering that gene expression analysis (20) was performed on whole 392
colon tissues, while ChIP-seq was epithelial-specific and data were generated in distinct 393
laboratories. 394
Of potentially greater interest, NSD analysis enables discovery of transcription 395
factors operating at regions of the genome undergoing inflammation-induced changes to 396
enhancer chromatin structure. DNA sequence analysis of dynamic chromatin regions 397
revealed stark differences in transcription factor-binding motifs present at regions active 398
in normal versus inflamed tissue (Fig. 1E, Suppl. Data). At chromatin regions selectively 399
activated upon DSS treatment, motifs recognized by members of the AP-1 and ETS 400
transcription factor families were the top three most enriched (Fig. 1E, right). This is 401
consistent with AP-1 and ETS roles in mediating the inflammatory response, as both 402
families have been implicated in responding to TNFα signaling and have been reported to 403
induce cytokine expression in endothelial and epidermal tissues (28-32). At genomic 404
regions that lose enhancer chromatin structure upon inflammation, colonic developmental 405
transcription factor motifs predominated (KLF, HNF4, HNF1), suggesting that these 406
regions lose their transcription factor occupancy during colitis (33-37). Indeed, previous 407
studies have demonstrated KLF5 and HNF4A can protect against DSS treatment (36, 38, 408
on February 10, 2018 by guest
http://mcb.asm
.org/D
ownloaded from

14
39). In total, we identified a subset of nucleosomes comprising approximately 2% of all 409
of the H3K27ac epigenome in the colonic epithelium that responds dynamically to DSS-410
induced inflammation (defined as regions with NSD scores greater than 2 standard 411
deviations), and find that the genomic regions harboring these dynamic chromatin 412
structures correlate with the changing transcriptome. Motif analysis suggests a shift in the 413
transcriptional regulatory network away from a stabilizing colon-specific transcription 414
factor network of HNF4A, KLF, and HNF1A/B, to an inflammatory-specific network 415
involving ETS and AP-1 factors. 416
417
Expression level and chromatin binding activity of HNF4A are compromised 418
during inflammation 419
Previous implications of HNF4A in inflammatory pathology prompted further 420
investigation of the transcriptional regulatory mechanisms of HNF4A in the normal and 421
inflamed colon. Hepatic nuclear factor 4, alpha (HNF4A) belongs to the nuclear receptor 422
family of transcription factors and is one of the more prominent epithelial genes 423
implicated in IBD. Genome wide association studies have identified HNF4A as 424
susceptibility locus for Ulcerative Colitis (UC) (40-43) and knockout mouse models have 425
corroborated these genetic implications of HNF4A in IBD by demonstrating a role for 426
Hnf4a in differentiation of gut epithelial cells (44), in the modulation of gut homeostasis 427
(33, 45), and in a protective role against colitis (38). 428
Importantly, the temporal window of HNF4A function during the inflammatory 429
process is not known; it is not clear from these models whether HNF4A plays a 430
protective role prior to the inflammatory state, and/or an active role during an 431
inflammatory bout. Previous reports indicate that whole-colon HNF4A levels decrease 432
during inflammation (22, 38). However, epithelial-specific expression has not been 433
examined, and reduced HNF4A levels could be a secondary effect of the loss of epithelial 434
cells that occurs during an inflammatory episode. 435
To determine if HNF4A is regulated at an epithelial cell-autonomous level, we 436
monitored HNF4A mRNA and protein levels in isolated colonic epithelium during a time 437
course of inflammation (Fig. 2). RNA transcripts from purified epithelium confirmed an 438
inflammatory phenotype, with elevated inflammatory cytokine levels in mice treated with 439
on February 10, 2018 by guest
http://mcb.asm
.org/D
ownloaded from

15
DSS for 6 consecutive days (Fig. 2A). Hnf4a transcripts were significantly depleted by 4 440
days of DSS treatment (Fig. 2B), whereas markers specific to the epithelium (Krt18 and 441
Vil1) were not affected (data not shown). Immunoblotting also demonstrated reduced 442
HNF4A protein levels in isolated epithelial cells (Fig. 2C), and nuclear HNF4A protein 443
levels were also reduced in the DSS-treated mouse epithelium in situ, as revealed by 444
immunohistochemistry and quantitative immunofluorescence (Fig. 2D-F). Thus based 445
upon expression levels, protective mechanisms of HNF4A function may be diminished, 446
but not necessarily eliminated during inflammation, as HNF4A is downregulated in the 447
colonic epithelium, but still readily detectible during colitis. 448
The direct regulatory targets of HNF4A in the colonic epithelium have not been 449
determined in vivo or under inflammatory stress. To discern between possible HNF4A 450
functions before and during the inflammatory state, we measured HNF4A binding to the 451
genome of the colonic epithelium in each condition using ChIP-seq. ChIP in the healthy 452
colonic epithelium revealed 17,886 HNF4A binding sites (MACS2 P value < 10-4) 453
scattered across the genome (Fig. 3A, left), with the majority of binding sites between 5-454
50 kb up or downstream from the nearest TSS (Fig. 3B, left). As expected for functional 455
HNF4A binding sites, HNF4A-bound regions exhibited increased evolutionary 456
conservation compared to genomic background levels (Fig. 3C, left). Moreover, the most 457
prominent de novo DNA-motif found enriched at HNF4A-binding regions corresponded 458
to previously defined HNF4A recognition sequences (Fig. 3D, left). Together, these data 459
indicate robust identification of physical interactions between HNF4A and the colonic 460
epithelial genome. 461
We next determined whether the chromatin-binding profile of HNF4A was 462
changed upon inflammation. HNF4A ChIP-seq in the inflamed colonic epithelium 463
showed a binding profile similar to that observed in the healthy epithelium, with a similar 464
distribution of genomic-binding regions (Fig. 3, right), distance from transcriptional start 465
sites (Fig. 3B, right), evolutionary conservation (Fig. 3C, right), and preferred DNA-466
binding motif (Fig. 3D, right). However the binding events observed in the inflamed 467
colon were fewer in number (10,688 regions). Reduced magnitude of HNF4A ChIP-seq 468
events was evident in reduced average signal at all HNF4A binding sites (Fig. 4A), or in 469
direct comparison on a site-by-site basis (Fig. 4B-D). As HNF4A binding is reduced 470
on February 10, 2018 by guest
http://mcb.asm
.org/D
ownloaded from

16
during inflammation, we predicted genes nearby HNF4A binding sites would be 471
compromised upon inflammation. Indeed, integration of ChIP-seq data and gene 472
expression analysis demonstrated that transcripts decreasing in the inflamed colonic 473
epithelium are more likely to harbor HNF4A binding sites within 10 kb of their 474
transcriptional start sites (Fig 4D). Taken together, HNF4A binding to chromatin is 475
compromised in the inflamed colon, and reduced binding appears to have a direct 476
consequence on colonic gene expression. Notably, multiple HNF4A binding sites were 477
observed at the HNF4A locus (Fig. 4E), suggesting loss of an auto-regulatory loop could 478
destabilize HNF4A expression in the inflammatory condition and contribute to reduced 479
HNF4A protein levels (Fig. 2C-F). 480
481
HNF4A binding regions are enriched in IBD risk-associated genetic variants 482
Upon finding reduced HNF4A binding in the inflammatory condition, we wondered if 483
HNF4A binding sites could also be targets of genetic predisposition to IBD. This was 484
addressed by determining the relative enrichment of risk-loci associated with IBD, 485
Crohn’s Disease, or Ulcerative Colitis (GWAS catalog, December 10, 2013) at HNF4A 486
genomic binding regions previously reported in the human colorectal cell line, CaCo2 487
(46). The Variant Set Enrichment (VSE) analysis (25, 26) revealed that IBD-associated 488
risk-loci map to HNF4A binding sites more than expected by chance (p value = 4.5e-8) 489
(Fig. 4F). Similar observations were shown between risk-loci associated with Crohn’s 490
disease (p value = 8.3e-9) and ulcerative colitis (p value = 3.9e-6) (Fig. 4F). By contrast, 491
HNF4A binding sites in CaCo2 cells are not overrepresented in SNPs associated with 492
type 2 diabetes risk (Fig. 4F), even though HNF4A has a prominent role in this disease. 493
Thus colon-specific binding patterns of HNF4A are significantly and specifically 494
associated with the genetic predispositions of human colon inflammatory pathologies. 495
496
Direct targets of HNF4A include immune regulatory genes 497
Despite being powerfully implicated in IBD, the direct transcriptional targets of HNF4A 498
in the colon have not been identified. Microarray expression in HNF4A knockouts reveal 499
gene transcripts that increase and decrease upon HNF4A loss and are implicated in roles 500
such as preventing oxidative stress and regulating lipid metabolism (22, 47). To define 501
on February 10, 2018 by guest
http://mcb.asm
.org/D
ownloaded from

17
which transcripts are likely direct versus indirect regulatory targets of HNF4A, we 502
integrated our ChIP-seq data with gene expression analysis. We defined direct targets of 503
HNF4A as genes with both an HNF4A binding site within its locus and dysregulated 504
upon HNF4A knockout by microarray analysis (22). HNF4A binding was far more 505
prevalent at genes downregulated upon Hnf4a knockout than genes upregulated upon 506
Hnf4a loss, implicating HNF4A primarily as a transcriptional activator (Fig. 5A). No 507
significant association was observed between HNF4A binding at genes increased upon 508
Hnf4a knockout compared to non-regulated genes, indicating that HNF4A does not have 509
a prominent role in gene repression. 510
Of 380 transcripts significantly reduced in Hnf4a KO colon, 194 were bound by 511
HNF4A within 20kb of their transcriptional start sites (defined as direct HNF4A targets), 512
whereas 186 were not bound (indirect HNF4A targets; Fig. 5B). Identification of putative 513
direct and indirect HNF4A regulatory targets in the colon will provide a useful resource 514
for dissecting the downstream mechanisms of the protective function of HNF4A and are 515
organized in Supplemental Data. For example, we were intrigued to find immune 516
regulatory genes amongst direct targets of HNF4A, as this is an underappreciated role of 517
HNF4A function (48). Immune regulatory targets were tested for HNF4A-dependent 518
regulation in the inflamed condition and exhibited reduced transcript levels in HNF4A-519
KO mice (Fig. 5C). The corresponding loci of these genes also showed reduced HNF4A 520
ChIP-seq binding levels during colitis (Fig. 5D, and data not shown). Identification of 521
HNF4A regulatory targets in the inflamed colon open new avenues to explore HNF4A 522
function. For example, RelB was of interest, as members of the NF-κB signaling pathway 523
function in the epithelium to protect against inflammation and DSS-colitis (49-53). 524
Consistent with our epigenomic analysis (Fig. 5D), HNF4A was confirmed to bind 3 525
genomic regions at the RelB locus by replicate ChIP-qPCR, and binding was reduced, but 526
detectable, in the inflammatory condition (Fig. 5F). RelB protein levels were also 527
reduced in isolated colonic epithelia from DSS-treated, HNF4A knockout versus DSS-528
treated control animals (Fig. 5E). Taken together, genomic profiling of HNF4A binding 529
regions in the normal and inflamed colon suggests mechanisms underlying the protective 530
role of HNF4A against colonic inflammation and includes a capacity to control immune 531
regulatory genes both before and during an inflammatory episode. 532
on February 10, 2018 by guest
http://mcb.asm
.org/D
ownloaded from

18
533
HNF4A is protective during an active inflammatory bout 534
When HNF4A is ablated from the fetal colonic epithelium, knockout animals are clearly 535
more susceptible to DSS-induced colitis as adults (38), but it is unclear whether HNF4A 536
is required to prevent the onset of colitis or actively suppress an ongoing inflammatory 537
episode. As epithelial cells retain detectable levels of HNF4A protein and chromatin 538
binding during inflammation (Figs. 2&4), we tested whether the protective effects of 539
HNF4A could include suppression of an active inflammatory bout. To refine the temporal 540
window in which HNF4A protects against experimental colitis, we took advantage of the 541
tamoxifen-inducible Villin-CreERT2 driver (54) and conditionally deleted a floxed Hnf4a 542
(55) in the epithelium either before or during acute inflammation in the colonic 543
epithelium (Fig. 6A). HNF4A knockout by tamoxifen injection requires approximately 2 544
days to eliminate HNF4A protein expression and was initiated either 5 days before or 545
concurrent with DSS-induced inflammation (Fig. 6A). We refer to these experimental 546
conditions as HNF4A KO “before” and “concurrent with” HNF4A KO in DSS induced 547
colitis. Each group was treated with DSS for 5 days and the degree of inflammation was 548
inferred by changes in body weight, colon length, and histopathology of the distal colon. 549
As reported previously (38), we observed that knockout of HNF4A before the 550
inflammatory stimulus leads to a severe and rapid onset of experimental colitis (Fig. 6B-551
E). However, despite reduced protein levels upon inflammation (Fig. 2C-F), HNF4A still 552
performs a protective role in the colonic epithelium during inflammation, as loss of 553
HNF4A after the onset of the inflammatory stimulus results in a more severe 554
inflammatory phenotype than in control-treated mice. Representative histopathology was 555
consistent with these phenotypes (Fig. 6E). Taken together, these results indicate that 556
HNF4A not only prevents the onset of inflammation, but plays an active role in the 557
suppression of an inflammatory state, and thus expands the temporal window within 558
which HNF4A functions to suppress colitis. 559
560
DISCUSSION 561
Disease-associated genetic variants are increasingly found to overlap with 562
regulatory regions (26, 56-59), including in IBD (60), highlighting the importance of 563
on February 10, 2018 by guest
http://mcb.asm
.org/D
ownloaded from

19
regulatory elements in human disease and necessitating their functional characterization. 564
To identify inflammation-sensitive regulatory elements in the colon epithelium, we 565
employed an epigenomic approach. Analysis of these regions revealed that transcription 566
factor regulatory networks change in the inflamed state, with HNF4A DNA-binding 567
motifs among the top transcription factor motifs found at genomic regions that lose 568
enhancer chromatin modifications upon colonic inflammation. By integrating mouse 569
genetic models with ChIP-seq mapping of HNF4A binding sites during an inflammatory 570
bout, we show that gene regulatory activity of HNF4A is reduced, but still essential to 571
mollify inflammatory symptoms. 572
Genome-scale HNF4A binding studies in other tissues and species provide 573
interesting insights on tissue-specific binding patterns, evolution of regulatory elements, 574
and gene regulation in the liver, pancreas, and cancer (61-65). To our knowledge, no 575
study has investigated HNF4A binding changes in altered or non-cancer disease 576
conditions. It will be interesting to see whether compromised HNF4A binding may 577
represent a common mechanism in inflammatory diseases of other HNF4A-expressing 578
tissues. While many interesting single-gene studies have identified regulatory roles for 579
HNF4A in barrier-protection and lipid metabolism, these have been reported in Hnf4a 580
mutant mice under normal conditions (22, 33, 38, 45, 47, 66). Our analysis of HNF4A 581
binding in the inflamed colonic epithelium yielded primary HNF4A regulatory targets 582
that will be useful in dissecting the protective mechanisms of HNF4A during colitis, 583
including immune regulatory genes, a role not frequently attributed to direct HNF4A 584
regulation, though recently observed in the liver (48, 67). Thus, HNF4A appears to 585
support pleiotropic protective roles in the colonic epithelium and our study opens new 586
avenues for exploration and regulation of HNF4A in other inflamed tissues. While we 587
observed exacerbated colonic phenotypes in DSS-treated mice upon HNF4A loss we did 588
not observe a significant increase in inflammatory cytokines compared to DSS-treated 589
control mice (data not shown), suggesting the phenotypic severity caused by HNF4A loss 590
in these models may function independently of these cytokines (Fig. 2A). Functional 591
characterization of HNF4A direct target genes should help elucidate the modalities by 592
which HNF4A protects the colon. 593
on February 10, 2018 by guest
http://mcb.asm
.org/D
ownloaded from

20
In this work, we reveal a protective, but compromised role for HNF4A in the 594
inflamed colon, and observe the co-occurrence of HNF4A binding and IBD-risk 595
associated genetic variants. Together, these findings justify exploring HNF4A as a 596
therapeutic target in IBD, as restoration of HNF4A expression or binding activity would 597
be predicted to ameliorate inflammation-induced changes in the epithelium. Along these 598
lines, identifying the initial trigger that decreases HNF4A levels will also be important, 599
and KLF factors, which have been implicated in inflammatory bowel models (36) and 600
whose motifs are enriched at HNF4A binding sites are good candidates to mediate 601
HNF4A regulation. It is also important to consider the duration of HNF4A inactivation in 602
both genetic and inflammatory models, as our experiments do not discern how the 603
difference in the duration of HNF4A loss affects gene regulation. Such differences could 604
also impact epithelial regeneration following the inflammatory bout. 605
As HNF4A is a nuclear receptor, the development of an activating agonist makes 606
this an exciting and plausible option (68, 69). Indeed, HNF4A reversibly binds linoleic 607
acid in endogenous contexts (70) and linoleic-acid derivatives have recently been 608
identified as candidate therapeutics in a drug repositioning screen for IBD (71). Our work 609
provides a context (active inflammation) and a mechanism (reduced HNF4A chromatin 610
binding) with which to explore the function of these and other potential HNF4A ligands. 611
612
Acknowledgements: We thank Sylvie Robine for sharing Vill-CreERT2 mice, Jay 613
Tishfield for support in quantitative image analysis, and Kiron Das for helpful 614
discussions. 615
The study was supported by grants from the Human Genetics Institute of New 616
Jersey (MPV), the National Institutes of Health, K01DK088868 (MPV) and 617
R01CA155004 (M.L.), and the Princess Margaret Cancer Foundation (M.L.). M.L. holds 618
a young investigator award from the Ontario Institute for Cancer Research and a new 619
investigator salary award from the Canadian Institute of Health Research (CIHR). The 620
authors declare no conflicts of interest. 621
622
623
on February 10, 2018 by guest
http://mcb.asm
.org/D
ownloaded from
21
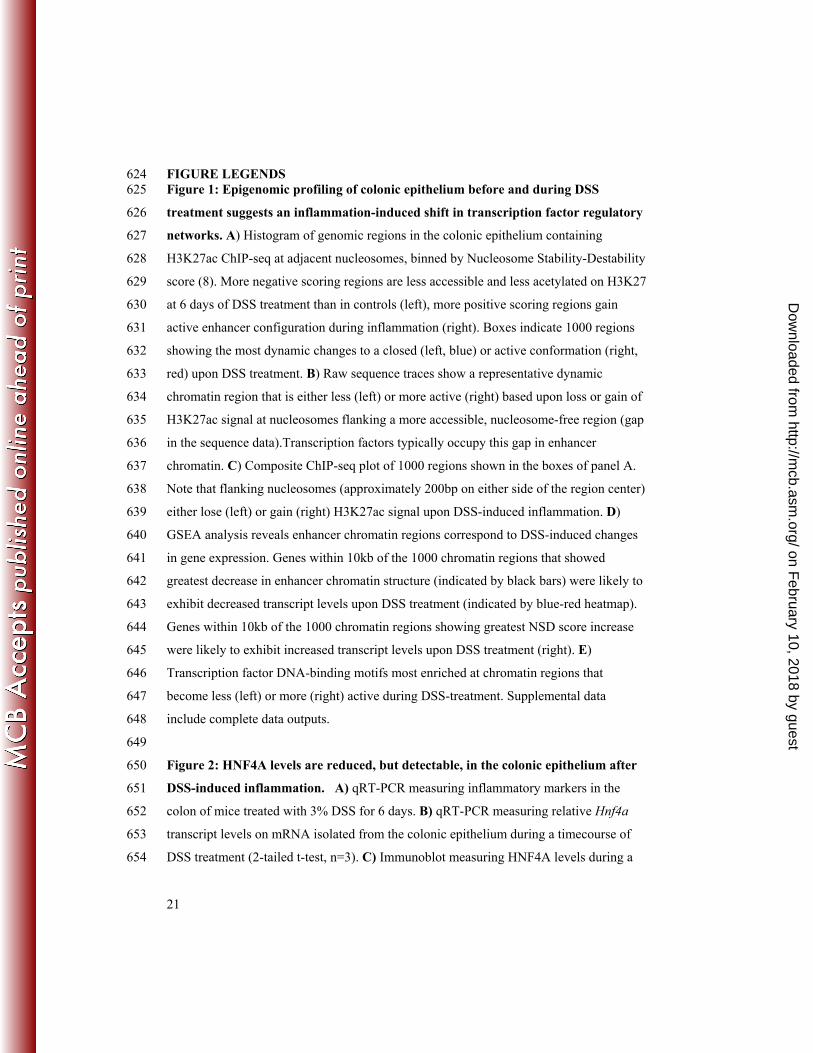
FIGURE LEGENDS 624 Figure 1: Epigenomic profiling of colonic epithelium before and during DSS 625
treatment suggests an inflammation-induced shift in transcription factor regulatory 626
networks. A) Histogram of genomic regions in the colonic epithelium containing 627
H3K27ac ChIP-seq at adjacent nucleosomes, binned by Nucleosome Stability-Destability 628
score (8). More negative scoring regions are less accessible and less acetylated on H3K27 629
at 6 days of DSS treatment than in controls (left), more positive scoring regions gain 630
active enhancer configuration during inflammation (right). Boxes indicate 1000 regions 631
showing the most dynamic changes to a closed (left, blue) or active conformation (right, 632
red) upon DSS treatment. B) Raw sequence traces show a representative dynamic 633
chromatin region that is either less (left) or more active (right) based upon loss or gain of 634
H3K27ac signal at nucleosomes flanking a more accessible, nucleosome-free region (gap 635
in the sequence data).Transcription factors typically occupy this gap in enhancer 636
chromatin. C) Composite ChIP-seq plot of 1000 regions shown in the boxes of panel A. 637
Note that flanking nucleosomes (approximately 200bp on either side of the region center) 638
either lose (left) or gain (right) H3K27ac signal upon DSS-induced inflammation. D) 639
GSEA analysis reveals enhancer chromatin regions correspond to DSS-induced changes 640
in gene expression. Genes within 10kb of the 1000 chromatin regions that showed 641
greatest decrease in enhancer chromatin structure (indicated by black bars) were likely to 642
exhibit decreased transcript levels upon DSS treatment (indicated by blue-red heatmap). 643
Genes within 10kb of the 1000 chromatin regions showing greatest NSD score increase 644
were likely to exhibit increased transcript levels upon DSS treatment (right). E) 645
Transcription factor DNA-binding motifs most enriched at chromatin regions that 646
become less (left) or more (right) active during DSS-treatment. Supplemental data 647
include complete data outputs. 648
649
Figure 2: HNF4A levels are reduced, but detectable, in the colonic epithelium after 650
DSS-induced inflammation. A) qRT-PCR measuring inflammatory markers in the 651
colon of mice treated with 3% DSS for 6 days. B) qRT-PCR measuring relative Hnf4a 652
transcript levels on mRNA isolated from the colonic epithelium during a timecourse of 653
DSS treatment (2-tailed t-test, n=3). C) Immunoblot measuring HNF4A levels during a 654
on February 10, 2018 by guest
http://mcb.asm
.org/D
ownloaded from

22
DSS treatment course. The immunoblot was underdeveloped to allow evaluation of the 655
relative levels of HNF4A over time. Protein levels are detectable, though reduced at 6 656
days of DSS treatment. D) HNF4A immunoreactivity diminishes, but is still present, over 657
the DSS treatment course. HNF4A was not detected in HNF4A KO epithelium. The 658
colonic regions selected for this analysis were based upon the presence of an intact 659
epithelium and do not fully represent the inflammatory pathology. E) Quantitative 660
immunofluorescence was also applied to measure HNF4A protein levels specifically 661
within the nucleus. Mean fluorescence intensity of HNF4A (Cy3) was measured in 662
individual nuclei segmented by DAPI staining (N ≥100 nuclei per condition; ** indicates 663
P value < 0.005 calculated by ANOVA single factor). F) Representative confocal images 664
used in the quantitative analysis (E) are shown for control and DSS6 samples. Scale bar = 665
3µm. Graphs bars represent SEM. 666
667
Figure 3: Relative genomic binding distribution and target sequence preference of 668
HNF4A do not change in the inflammatory state. A) Genomic distribution of HNF4A 669
in control (left) and DSS inflamed colon (right, 6 days of 3% DSS treatment) indicates 670
HNF4A predominantly binds far from classical promoters, B) with the majority of sites 671
occurring 5 to 50 kb from the nearest transcriptional start site (TSS). C) As expected for 672
functional regulatory elements, HNF4A binding sites are enriched in conserved 673
nucleotides across multi-vertebrate species, and D) the most frequently occurring DNA 674
sequence motif enriched at HNF4A ChIP-seq sites matches the expected HNF4A binding 675
sequence (14). 676
677
Figure 4: The number and magnitude of HNF4A binding sites are compromised 678
during inflammation. Average, normalized ChIP-seq signal at HNF4A binding sites is 679
diminished upon DSS-treatment, as shown in a composite plot (A) or on a site-by-site 680
basis (B). Heatmap scale indicates normalized ChIP-seq tag counts. The heatmap depicts 681
each genomic region called as an HNF4A binding site in the control condition across a 682
1kb genomic window centered at the binding peak summit. C) Representative example of 683
reduced HNF4A binding upon DSS-treatment at the Hnf4a locus. D) GSEA analysis 684
comparing genes with HNF4A binding sites (MACS2 p < 10-10) with gene expression 685
on February 10, 2018 by guest
http://mcb.asm
.org/D
ownloaded from

23
changes that occur upon DSS-induced inflammation. Genes that decrease upon DSS-686
treatment are enriched in HNF4A binding sites, suggesting reduced HNF4A binding 687
during inflammation may lead to their decreased levels of target gene expression. E) 688
Representative example of reduced HNF4A binding upon DSS-treatment at the Hnf4a 689
locus, suggesting the possibility of HNF4A auto-regulation. Asterisks denote HNF4A 690
ChIP-Seq peaks downstream of Hnf4a; horizontal carets indicate the direction of 691
transcription at the Hnf4a locus. F) Variant Set Enrichment analysis shows that HNF4A 692
binding regions in the human colon cell line Caco2 (GSM575229) are enriched with 693
IBD-associated risk loci. Box plots show the null distributions based on 1,000 matched 694
random variant sets for each disease against HNF4A binding sites. Diamonds show 695
mapping tallies for the disease-associated clusters at HNF4A binding sites. Red diamonds 696
highlight mapping tallies for genomic annotations that fall outside of the null distribution 697
(P < 0.001). The overlap between HNF4A binding and disease-associated genetic 698
variants suggest altered HNF4A function at these loci may contribute to the genetic 699
component of IBD. The enrichment analysis does not specifically test whether HNF4A 700
binding motifs are disrupted by the genetic variants, only that the variants are enriched at 701
HNF4A binding regions. 702
703
Figure 5: HNF4A predominantly activates colon epithelial genes, and its direct 704
targets include genes involved in the immune response. A) Corresponding heatmaps 705
depict HNF4A binding frequency (top, yellow) at genes with significant expression 706
changes upon HNF4A KO (GSE11759, bottom, blue-red). Genes that significantly 707
decrease upon HNF4A knockout are more likely to harbor an HNF4A site within 10kb of 708
their TSS than all other genes. B) Pie chart depicting downregulated genes upon HNF4A 709
knockout from (A) that include HNF4A binding sites within 20 kb of their transcriptional 710
start sites (direct targets) and downregulated genes lacking HNF4A binding sites (indirect 711
targets). The entire list of target genes appears in supplemental data. C) qRT-PCR 712
confirms that HNF4A is required in the inflamed condition to activate presumed immune 713
regulatory genes. D) The RelB locus harbors three HNF4A binding sites (arrow indicates 714
the transcriptional direction from the promoter), as detected by ChIP-seq, and 715
independently confirmed by ChIP-qPCR; ChIP enrichment was reduced in the 716
on February 10, 2018 by guest
http://mcb.asm
.org/D
ownloaded from

24
inflammatory condition (F). E) RelB protein levels are reduced in isolated colonic 717
epithelia from DSS-treated animals lacking HNF4A compared to DSS-only controls. 718
Graphs show the mean +/- SE. 719
720
Figure 6: HNF4A plays a protective role both before and concurrent with DSS-721
induced colitis. A) Strategy to inactivate HNF4A before introducing the inflammatory 722
stimulus (HNF4A KO Before DSS), or concurrent with the inflammatory stimulus 723
(HNF4A KO Concurrent with DSS). After 5 days of DSS treatment, mice were measured 724
for (B) body weight loss (n ≥ 17 mice per genotype), (C) colon length shortening (n = 2-725
15 mice per genotype), and (D) histolopathology scores (n = 8 mice per genotype). E) 726
Representative histology from each treatment, upon which the scores in panel D were 727
derived. Increased inflammation in the lamina propria (solid arrow), basal crypt damage 728
(white star), and increased submucosal space (dotted arrow) were observed in control-729
treated mice. Mice with HNF4A KO induced after DSS showed more patent, vacuolar 730
crypts (black star), and some compromise of the surface epithelium and crypt 731
architecture. Complete erosion of the surface epithelium and entire crypt loss was evident 732
in mice with the HNF4A KO before DSS-treatment. Histopathology score criteria are 733
detailed in the methods section. ANOVA and Tukey’s HSD were performed to calculate 734
significance. Scale bar = 100µm. 735
736
on February 10, 2018 by guest
http://mcb.asm
.org/D
ownloaded from

25
REFERENCES 737
738
1. Henderson P, van Limbergen JE, Schwarze J, Wilson DC. 2011. Function of 739 the intestinal epithelium and its dysregulation in inflammatory bowel disease. 740 Inflamm Bowel Dis 17:382-395. 741
2. Pastorelli L, De Salvo C, Mercado JR, Vecchi M, Pizarro TT. 2013. Central 742 Role of the Gut Epithelial Barrier in the Pathogenesis of Chronic Intestinal 743 Inflammation: Lessons Learned from Animal Models and Human Genetics. 744 Frontiers in immunology 4:280. 745
3. Zimmerman NP, Vongsa RA, Wendt MK, Dwinell MB. 2008. Chemokines 746 and chemokine receptors in mucosal homeostasis at the intestinal epithelial barrier 747 in inflammatory bowel disease. Inflamm Bowel Dis 14:1000-1011. 748
4. Heintzman ND, Hon GC, Hawkins RD, Kheradpour P, Stark A, Harp LF, 749 Ye Z, Lee LK, Stuart RK, Ching CW, Ching KA, Antosiewicz-Bourget JE, 750 Liu H, Zhang X, Green RD, Lobanenkov VV, Stewart R, Thomson JA, 751 Crawford GE, Kellis M, Ren B. 2009. Histone modifications at human 752 enhancers reflect global cell-type-specific gene expression. Nature 459:108-112. 753
5. Rada-Iglesias A, Bajpai R, Swigut T, Brugmann SA, Flynn RA, Wysocka J. 754 2010. A unique chromatin signature uncovers early developmental enhancers in 755 humans. Nature 470:279-283. 756
6. Creyghton MP, Cheng AW, Welstead GG, Kooistra T, Carey BW, Steine EJ, 757 Hanna J, Lodato MA, Frampton GM, Sharp PA, Boyer LA, Young RA, 758 Jaenisch R. 2010. Histone H3K27ac separates active from poised enhancers and 759 predicts developmental state. Proc Natl Acad Sci USA 107:21931-21936. 760
7. Zentner GE, Tesar PJ, Scacheri PC. 2011. Epigenetic signatures distinguish 761 multiple classes of enhancers with distinct cellular functions. Genome Res 762 21:1273-1283. 763
8. He HH, Meyer CA, Shin H, Bailey ST, Wei G, Wang Q, Zhang Y, Xu K, Ni 764 M, Lupien M, Mieczkowski P, Lieb JD, Zhao K, Brown M, Liu XS. 2010. 765 Nucleosome dynamics define transcriptional enhancers. Nat Genet 42:343-347. 766
9. Verzi MP, Shin H, He HH, Sulahian R, Meyer CA, Montgomery RK, Fleet 767 JC, Brown M, Liu XS, Shivdasani RA. 2010. Differentiation-specific histone 768 modifications reveal dynamic chromatin interactions and partners for the 769 intestinal transcription factor CDX2. Dev Cell 19:713-726. 770
10. Abdelbaqi M, Chidlow JH, Matthews KM, Pavlick KP, Barlow SC, Linscott 771 AJ, Grisham MB, Fowler MR, Kevil CG. 2006. Regulation of dextran sodium 772 sulfate induced colitis by leukocyte beta 2 integrins. Lab Invest 86:380-390. 773
11. Laroui H, Ingersoll SA, Liu HC, Baker MT, Ayyadurai S, Charania MA, 774 Laroui F, Yan Y, Sitaraman SV, Merlin D. 2012. Dextran sodium sulfate 775 (DSS) induces colitis in mice by forming nano-lipocomplexes with medium-776 chain-length fatty acids in the colon. PLoS One 7:e32084. 777
12. Ortega-Cava CF, Ishihara S, Rumi MA, Kawashima K, Ishimura N, 778 Kazumori H, Udagawa J, Kadowaki Y, Kinoshita Y. 2003. Strategic 779 compartmentalization of Toll-like receptor 4 in the mouse gut. J Immunol 780 170:3977-3985. 781
on February 10, 2018 by guest
http://mcb.asm
.org/D
ownloaded from

26
13. Verzi MP, Shin H, Ho LL, Liu XS, Shivdasani RA. 2011. Essential and 782 redundant functions of caudal family proteins in activating adult intestinal genes. 783 Mol Cell Biol 31:2026-2039. 784
14. Verzi MP, Shin H, San Roman AK, Liu XS, Shivdasani RA. 2013. Intestinal 785 master transcription factor CDX2 controls chromatin access for partner 786 transcription factor binding. Mol Cell Biol 33:281-292. 787
15. Zhang Y, Liu T, Meyer CA, Eeckhoute J, Johnson DS, Bernstein BE, 788 Nussbaum C, Myers RM, Brown M, Li W, Liu XS. 2008. Model-based 789 analysis of ChIP-Seq (MACS). Genome Biol 9:R137. 790
16. Zhang Y, Shin H, Song JS, Lei Y, Liu XS. 2008. Identifying positioned 791 nucleosomes with epigenetic marks in human from ChIP-Seq. BMC Genomics 792 9:537. 793
17. Meyer CA, He HH, Brown M, Liu XS. 2011. BINOCh: binding inference from 794 nucleosome occupancy changes. Bioinformatics 27:1867-1868. 795
18. McLean CY, Bristor D, Hiller M, Clarke SL, Schaar BT, Lowe CB, Wenger 796 AM, Bejerano G. 2010. GREAT improves functional interpretation of cis-797 regulatory regions. Nat Biotechnol 28:495-501. 798
19. Subramanian A, Tamayo P, Mootha VK, Mukherjee S, Ebert BL, Gillette 799 MA, Paulovich A, Pomeroy SL, Golub TR, Lander ES, Mesirov JP. 2005. 800 Gene set enrichment analysis: a knowledge-based approach for interpreting 801 genome-wide expression profiles. Proc Natl Acad Sci U S A 102:15545-15550. 802
20. Fang K, Bruce M, Pattillo CB, Zhang S, Stone R, 2nd, Clifford J, Kevil CG. 803 2011. Temporal genomewide expression profiling of DSS colitis reveals novel 804 inflammatory and angiogenesis genes similar to ulcerative colitis. Physiol 805 Genomics 43:43-56. 806
21. Li C, Wong WH. 2001. Model-based analysis of oligonucleotide arrays: 807 expression index computation and outlier detection. Proc Natl Acad Sci USA 808 98:31-36. 809
22. Darsigny M, Babeu JP, Dupuis AA, Furth EE, Seidman EG, Levy E, Verdu 810 EF, Gendron FP, Boudreau F. 2009. Loss of hepatocyte-nuclear-factor-4alpha 811 affects colonic ion transport and causes chronic inflammation resembling 812 inflammatory bowel disease in mice. PLoS One 4:e7609. 813
23. Liu T, Ortiz JA, Taing L, Meyer CA, Lee B, Zhang Y, Shin H, Wong SS, Ma 814 J, Lei Y, Pape UJ, Poidinger M, Chen Y, Yeung K, Brown M, Turpaz Y, Liu 815 XS. 2011. Cistrome: an integrative platform for transcriptional regulation studies. 816 Genome Biol 12:R83. 817
24. Robinson JT, Thorvaldsdottir H, Winckler W, Guttman M, Lander ES, Getz 818 G, Mesirov JP. 2011. Integrative genomics viewer. Nat Biotechnol 29:24-26. 819
25. Akhtar-Zaidi B, Cowper-Sal-lari R, Corradin O, Saiakhova A, Bartels CF, 820 Balasubramanian D, Myeroff L, Lutterbaugh J, Jarrar A, Kalady MF, Willis 821 J, Moore JH, Tesar PJ, Laframboise T, Markowitz S, Lupien M, Scacheri 822 PC. 2012. Epigenomic enhancer profiling defines a signature of colon cancer. 823 Science 336:736-739. 824
26. Cowper-Sal lari R, Zhang X, Wright JB, Bailey SD, Cole MD, Eeckhoute J, 825 Moore JH, Lupien M. 2012. Breast cancer risk-associated SNPs modulate the 826
on February 10, 2018 by guest
http://mcb.asm
.org/D
ownloaded from

27
affinity of chromatin for FOXA1 and alter gene expression. Nat Genet 44:1191-827 1198. 828
27. Okayasu I, Hatakeyama S, Yamada M, Ohkusa T, Inagaki Y, Nakaya R. 829 1990. A novel method in the induction of reliable experimental acute and chronic 830 ulcerative colitis in mice. Gastroenterology 98:694-702. 831
28. Oettgen P. 2006. Regulation of vascular inflammation and remodeling by ETS 832 factors. Circ Res 99:1159-1166. 833
29. Oliver JR, Kushwah R, Hu J. 2012. Multiple roles of the epithelium-specific 834 ETS transcription factor, ESE-1, in development and disease. Lab Invest 92:320-835 330. 836
30. Schonthaler HB, Guinea-Viniegra J, Wagner EF. 2011. Targeting 837 inflammation by modulating the Jun/AP-1 pathway. Annals of the rheumatic 838 diseases 70 Suppl 1:i109-112. 839
31. Wang A, Al-Kuhlani M, Johnston SC, Ojcius DM, Chou J, Dean D. 2013. 840 Transcription factor complex AP-1 mediates inflammation initiated by Chlamydia 841 pneumoniae infection. Cellular microbiology 15:779-794. 842
32. Zingarelli B, Hake PW, Burroughs TJ, Piraino G, O'Connor M, Denenberg 843 A. 2004. Activator protein-1 signalling pathway and apoptosis are modulated by 844 poly(ADP-ribose) polymerase-1 in experimental colitis. Immunology 113:509-845 517. 846
33. Babeu JP, Darsigny M, Lussier CR, Boudreau F. 2009. Hepatocyte nuclear 847 factor 4alpha contributes to an intestinal epithelial phenotype in vitro and plays a 848 partial role in mouse intestinal epithelium differentiation. Am J Physiol 849 Gastrointest Liver Physiol 297:G124-134. 850
34. D'Angelo A, Bluteau O, Garcia-Gonzalez MA, Gresh L, Doyen A, Garbay S, 851 Robine S, Pontoglio M. 2010. Hepatocyte nuclear factor 1alpha and beta control 852 terminal differentiation and cell fate commitment in the gut epithelium. 853 Development 137:1573-1582. 854
35. Katz JP, Perreault N, Goldstein BG, Actman L, McNally SR, Silberg DG, 855 Furth EE, Kaestner KH. 2005. Loss of Klf4 in mice causes altered proliferation 856 and differentiation and precancerous changes in the adult stomach. 857 Gastroenterology 128:935-945. 858
36. McConnell BB, Kim SS, Bialkowska AB, Yu K, Sitaraman SV, Yang VW. 859 2011. Kruppel-like factor 5 protects against dextran sulfate sodium-induced 860 colonic injury in mice by promoting epithelial repair. Gastroenterology 140:540-861 549 e542. 862
37. Yu T, Chen X, Zhang W, Li J, Xu R, Wang TC, Ai W, Liu C. 2012. Kruppel-863 like factor 4 regulates intestinal epithelial cell morphology and polarity. PLoS 864 One 7:e32492. 865
38. Ahn SH, Shah YM, Inoue J, Morimura K, Kim I, Yim S, Lambert G, 866 Kurotani R, Nagashima K, Gonzalez FJ, Inoue Y. 2008. Hepatocyte nuclear 867 factor 4alpha in the intestinal epithelial cells protects against inflammatory bowel 868 disease. Inflamm Bowel Dis 14:908-920. 869
39. Tetreault MP, Alrabaa R, McGeehan M, Katz JP. 2012. Kruppel-like factor 5 870 protects against murine colitis and activates JAK-STAT signaling in vivo. PLoS 871 One 7:e38338. 872
on February 10, 2018 by guest
http://mcb.asm
.org/D
ownloaded from

28
40. Barrett JC, Lee JC, Lees CW, Prescott NJ, Anderson CA, Phillips A, Wesley 873 E, Parnell K, Zhang H, Drummond H, Nimmo ER, Massey D, Blaszczyk K, 874 Elliott T, Cotterill L, Dallal H, Lobo AJ, Mowat C, Sanderson JD, Jewell DP, 875 Newman WG, Edwards C, Ahmad T, Mansfield JC, Satsangi J, Parkes M, 876 Mathew CG, Donnelly P, Peltonen L, Blackwell JM, Bramon E, Brown MA, 877 Casas JP, Corvin A, Craddock N, Deloukas P, Duncanson A, Jankowski J, 878 Markus HS, McCarthy MI, Palmer CN, Plomin R, Rautanen A, Sawcer SJ, 879 Samani N, Trembath RC, Viswanathan AC, Wood N, Spencer CC, 880 Bellenguez C, Davison D, Freeman C, Strange A, Langford C, Hunt SE, 881 Edkins S, Gwilliam R, Blackburn H, Bumpstead SJ, Dronov S, Gillman M, 882 Gray E, Hammond N, Jayakumar A, McCann OT, Liddle J, Perez ML, 883 Potter SC, Ravindrarajah R, Ricketts M, Waller M, Weston P, Widaa S, 884 Whittaker P, Attwood AP, Stephens J, Sambrook J, Ouwehand WH, 885 McArdle WL, Ring SM, Strachan DP. 2009. Genome-wide association study of 886 ulcerative colitis identifies three new susceptibility loci, including the HNF4A 887 region. Nat Genet 41:1330-1334. 888
41. Jostins L, Ripke S, Weersma RK, Duerr RH, McGovern DP, Hui KY, Lee 889 JC, Schumm LP, Sharma Y, Anderson CA, Essers J, Mitrovic M, Ning K, 890 Cleynen I, Theatre E, Spain SL, Raychaudhuri S, Goyette P, Wei Z, 891 Abraham C, Achkar JP, Ahmad T, Amininejad L, Ananthakrishnan AN, 892 Andersen V, Andrews JM, Baidoo L, Balschun T, Bampton PA, Bitton A, 893 Boucher G, Brand S, Buning C, Cohain A, Cichon S, D'Amato M, De Jong D, 894 Devaney KL, Dubinsky M, Edwards C, Ellinghaus D, Ferguson LR, 895 Franchimont D, Fransen K, Gearry R, Georges M, Gieger C, Glas J, 896 Haritunians T, Hart A, Hawkey C, Hedl M, Hu X, Karlsen TH, Kupcinskas 897 L, Kugathasan S, Latiano A, Laukens D, Lawrance IC, Lees CW, Louis E, 898 Mahy G, Mansfield J, Morgan AR, Mowat C, Newman W, Palmieri O, 899 Ponsioen CY, Potocnik U, Prescott NJ, Regueiro M, Rotter JI, Russell RK, 900 Sanderson JD, Sans M, Satsangi J, Schreiber S, Simms LA, Sventoraityte J, 901 Targan SR, Taylor KD, Tremelling M, Verspaget HW, De Vos M, Wijmenga 902 C, Wilson DC, Winkelmann J, Xavier RJ, Zeissig S, Zhang B, Zhang CK, 903 Zhao H, Silverberg MS, Annese V, Hakonarson H, Brant SR, Radford-Smith 904 G, Mathew CG, Rioux JD, Schadt EE, Daly MJ, Franke A, Parkes M, 905 Vermeire S, Barrett JC, Cho JH. 2012. Host-microbe interactions have shaped 906 the genetic architecture of inflammatory bowel disease. Nature 491:119-124. 907
42. van Sommeren S, Visschedijk MC, Festen EA, de Jong DJ, Ponsioen CY, 908 Wijmenga C, Weersma RK. 2011. HNF4alpha and CDH1 are associated with 909 ulcerative colitis in a Dutch cohort. Inflamm Bowel Dis 17:1714-1718. 910
43. Yang SK, Jung Y, Kim H, Hong M, Ye BD, Song K. 2011. Association of 911 FCGR2A, JAK2 or HNF4A variants with ulcerative colitis in Koreans. Digestive 912 and liver disease : official journal of the Italian Society of Gastroenterology and 913 the Italian Association for the Study of the Liver 43:856-861. 914
44. Garrison WD, Battle MA, Yang C, Kaestner KH, Sladek FM, Duncan SA. 915 2006. Hepatocyte nuclear factor 4alpha is essential for embryonic development of 916 the mouse colon. Gastroenterology 130:1207-1220. 917
on February 10, 2018 by guest
http://mcb.asm
.org/D
ownloaded from

29
45. Cattin AL, Le Beyec J, Barreau F, Saint-Just S, Houllier A, Gonzalez FJ, 918 Robine S, Pincon-Raymond M, Cardot P, Lacasa M, Ribeiro A. 2009. 919 Hepatocyte nuclear factor 4alpha, a key factor for homeostasis, cell architecture, 920 and barrier function of the adult intestinal epithelium. Mol Cell Biol 29:6294-921 6308. 922
46. Verzi MP, Hatzis P, Sulahian R, Philips J, Schuijers J, Shin H, Freed E, 923 Lynch JP, Dang DT, Brown M, Clevers H, Liu XS, Shivdasani RA. 2010. 924 TCF4 and CDX2, major transcription factors for intestinal function, converge on 925 the same cis-regulatory regions. Proc Natl Acad Sci U S A 107:15157-15162. 926
47. Marcil V, Seidman E, Sinnett D, Boudreau F, Gendron FP, Beaulieu JF, 927 Menard D, Precourt LP, Amre D, Levy E. 2010. Modification in oxidative 928 stress, inflammation, and lipoprotein assembly in response to hepatocyte nuclear 929 factor 4alpha knockdown in intestinal epithelial cells. J Biol Chem 285:40448-930 40460. 931
48. Bolotin E, Liao H, Ta TC, Yang C, Hwang-Verslues W, Evans JR, Jiang T, 932 Sladek FM. 2010. Integrated approach for the identification of human hepatocyte 933 nuclear factor 4alpha target genes using protein binding microarrays. Hepatology 934 51:642-653. 935
49. Eckmann L, Nebelsiek T, Fingerle AA, Dann SM, Mages J, Lang R, Robine 936 S, Kagnoff MF, Schmid RM, Karin M, Arkan MC, Greten FR. 2008. 937 Opposing functions of IKKbeta during acute and chronic intestinal inflammation. 938 Proc Natl Acad Sci U S A 105:15058-15063. 939
50. Greten FR, Eckmann L, Greten TF, Park JM, Li ZW, Egan LJ, Kagnoff MF, 940 Karin M. 2004. IKKbeta links inflammation and tumorigenesis in a mouse model 941 of colitis-associated cancer. Cell 118:285-296. 942
51. Kajino-Sakamoto R, Inagaki M, Lippert E, Akira S, Robine S, Matsumoto 943 K, Jobin C, Ninomiya-Tsuji J. 2008. Enterocyte-derived TAK1 signaling 944 prevents epithelium apoptosis and the development of ileitis and colitis. J 945 Immunol 181:1143-1152. 946
52. Nenci A, Becker C, Wullaert A, Gareus R, van Loo G, Danese S, Huth M, 947 Nikolaev A, Neufert C, Madison B, Gumucio D, Neurath MF, Pasparakis M. 948 2007. Epithelial NEMO links innate immunity to chronic intestinal inflammation. 949 Nature 446:557-561. 950
53. Steinbrecher KA, Harmel-Laws E, Sitcheran R, Baldwin AS. 2008. Loss of 951 epithelial RelA results in deregulated intestinal proliferative/apoptotic 952 homeostasis and susceptibility to inflammation. J Immunol 180:2588-2599. 953
54. el Marjou F, Janssen KP, Chang BH, Li M, Hindie V, Chan L, Louvard D, 954 Chambon P, Metzger D, Robine S. 2004. Tissue-specific and inducible Cre-955 mediated recombination in the gut epithelium. Genesis 39:186-193. 956
55. Hayhurst GP, Lee YH, Lambert G, Ward JM, Gonzalez FJ. 2001. Hepatocyte 957 nuclear factor 4alpha (nuclear receptor 2A1) is essential for maintenance of 958 hepatic gene expression and lipid homeostasis. Mol Cell Biol 21:1393-1403. 959
56. Ernst J, Kheradpour P, Mikkelsen TS, Shoresh N, Ward LD, Epstein CB, 960 Zhang X, Wang L, Issner R, Coyne M, Ku M, Durham T, Kellis M, 961 Bernstein BE. 2011. Mapping and analysis of chromatin state dynamics in nine 962 human cell types. Nature 473:43-49. 963
on February 10, 2018 by guest
http://mcb.asm
.org/D
ownloaded from

30
57. Karczewski KJ, Dudley JT, Kukurba KR, Chen R, Butte AJ, Montgomery 964 SB, Snyder M. 2013. Systematic functional regulatory assessment of disease-965 associated variants. Proc Natl Acad Sci U S A 110:9607-9612. 966
58. Pomerantz MM, Ahmadiyeh N, Jia L, Herman P, Verzi MP, Doddapaneni H, 967 Beckwith CA, Chan JA, Hills A, Davis M, Yao K, Kehoe SM, Lenz HJ, 968 Haiman CA, Yan C, Henderson BE, Frenkel B, Barretina J, Bass A, 969 Tabernero J, Baselga J, Regan MM, Manak JR, Shivdasani R, Coetzee GA, 970 Freedman ML. 2009. The 8q24 cancer risk variant rs6983267 shows long-range 971 interaction with MYC in colorectal cancer. Nat Genet 41:882-884. 972
59. Schaub MA, Boyle AP, Kundaje A, Batzoglou S, Snyder M. 2012. Linking 973 disease associations with regulatory information in the human genome. Genome 974 Res 22:1748-1759. 975
60. Mokry M, Middendorp S, Wiegerinck CL, Witte M, Teunissen H, Meddens 976 CA, Cuppen E, Clevers H, Nieuwenhuis EE. 2013. Many Inflammatory Bowel 977 Disease Risk Loci Include Regions That Regulate Gene Expression in Immune 978 Cells and the Intestinal Epithelium. Gastroenterology. 979
61. Mizutani A, Koinuma D, Tsutsumi S, Kamimura N, Morikawa M, Suzuki 980 HI, Imamura T, Miyazono K, Aburatani H. 2011. Cell type-specific target 981 selection by combinatorial binding of Smad2/3 proteins and hepatocyte nuclear 982 factor 4alpha in HepG2 cells. J Biol Chem 286:29848-29860. 983
62. Odom DT, Zizlsperger N, Gordon DB, Bell GW, Rinaldi NJ, Murray HL, 984 Volkert TL, Schreiber J, Rolfe PA, Gifford DK, Fraenkel E, Bell GI, Young 985 RA. 2004. Control of pancreas and liver gene expression by HNF transcription 986 factors. Science 303:1378-1381. 987
63. Schmidt D, Wilson MD, Ballester B, Schwalie PC, Brown GD, Marshall A, 988 Kutter C, Watt S, Martinez-Jimenez CP, Mackay S, Talianidis I, Flicek P, 989 Odom DT. 2010. Five-vertebrate ChIP-seq reveals the evolutionary dynamics of 990 transcription factor binding. Science 328:1036-1040. 991
64. Snyder EL, Watanabe H, Magendantz M, Hoersch S, Chen TA, Wang DG, 992 Crowley D, Whittaker CA, Meyerson M, Kimura S, Jacks T. 2013. Nkx2-1 993 represses a latent gastric differentiation program in lung adenocarcinoma. Mol 994 Cell 50:185-199. 995
65. Wallerman O, Motallebipour M, Enroth S, Patra K, Bysani MS, 996 Komorowski J, Wadelius C. 2009. Molecular interactions between HNF4a, 997 FOXA2 and GABP identified at regulatory DNA elements through ChIP-998 sequencing. Nucleic Acids Res 37:7498-7508. 999
66. Lussier CR, Babeu JP, Auclair BA, Perreault N, Boudreau F. 2008. 1000 Hepatocyte nuclear factor-4alpha promotes differentiation of intestinal epithelial 1001 cells in a coculture system. Am J Physiol Gastrointest Liver Physiol 294:G418-1002 428. 1003
67. Hatziapostolou M, Polytarchou C, Aggelidou E, Drakaki A, Poultsides GA, 1004 Jaeger SA, Ogata H, Karin M, Struhl K, Hadzopoulou-Cladaras M, 1005 Iliopoulos D. 2011. An HNF4alpha-miRNA inflammatory feedback circuit 1006 regulates hepatocellular oncogenesis. Cell 147:1233-1247. 1007
68. Azmi AS, Bao GW, Gao J, Mohammad RM, Sarkar FH. 2013. Network 1008 insights into the genes regulated by hepatocyte nuclear factor 4 in response to 1009
on February 10, 2018 by guest
http://mcb.asm
.org/D
ownloaded from

31
drug induced perturbations: a review. Current drug discovery technologies 1010 10:147-154. 1011
69. Hwang-Verslues WW, Sladek FM. 2010. HNF4alpha--role in drug metabolism 1012 and potential drug target? Curr Opin Pharmacol 10:698-705. 1013
70. Yuan X, Ta TC, Lin M, Evans JR, Dong Y, Bolotin E, Sherman MA, Forman 1014 BM, Sladek FM. 2009. Identification of an endogenous ligand bound to a native 1015 orphan nuclear receptor. PLoS One 4:e5609. 1016
71. Dudley JT, Sirota M, Shenoy M, Pai RK, Roedder S, Chiang AP, Morgan 1017 AA, Sarwal MM, Pasricha PJ, Butte AJ. 2011. Computational repositioning of 1018 the anticonvulsant topiramate for inflammatory bowel disease. Science 1019 translational medicine 3:96ra76. 1020
1021 1022
on February 10, 2018 by guest
http://mcb.asm
.org/D
ownloaded from

10000
Unchanged enhancer chromatin
K27
ac
gion
s
AFigure 1
0
2000
6000
0-4 4Chromatin Accessibility Change (NSD×1000)
-2 2
Num
ber
of H
3KC
hIP
-Seq
Reg
Inflammation Suppressed Enhancer Chromatin I fl ti I d d E h Ch tiInflammation-Suppressed Enhancer Chromatin Inflammation-Induced Enhancer ChromatinB
H3K
27ac
ChI
P-S
eq
Tag
s
70
Control Colon
DSS Inflamed Colon
1kb70
055
55
0
Control Colon
DSS Inflamed Colon
1kb
H3K
27ac
ChI
P-S
eq
Tag
sC Control
DSS 6
50
30
40
rage
H3K
27ac
hI
P-S
eq T
ags 25
20
15rage
H3K
27ac
hI
P-S
eq T
ags
Control
DSS 6
H
0 0H
D
ent
scor
e Normalized ES = 1.198FDR = 0.105
0 10.20.30.40.5
nt s
core Normalized ES = -2.08
FDR = 0.0
-0.3-0.2-0.10.0
-400 -200 2000 400Distance from Chromatin Region Center (bp)
20
Ave C
h
-400 -200 2000 40010
Distance from Chromatin Region Center (bp)
Ave C
hG
SE
A e
nric
hme
Enhancer Chromatin Regions
Gene expression change upon DSSIncreasing Decreasing
-0.20.0
-0.1
0.1
Enhancer Chromatin Regions
GS
EA
enr
ichm
e
Gene expression change upon DSSIncreasing Decreasing
-0.7-0.6-0.5-0.4
HNF42
1
0
HNF1 p=1×10-140
p=1×10-302
1
FOS/JUNp=1×10-232
1
0
ELF/ETS2
1
0
KLF p=1×10-30E p=1×10-30
2 p=1×10-16TBX210
2
1
0
1
0
on February 10, 2018 by guest
http://mcb.asm
.org/D
ownloaded from
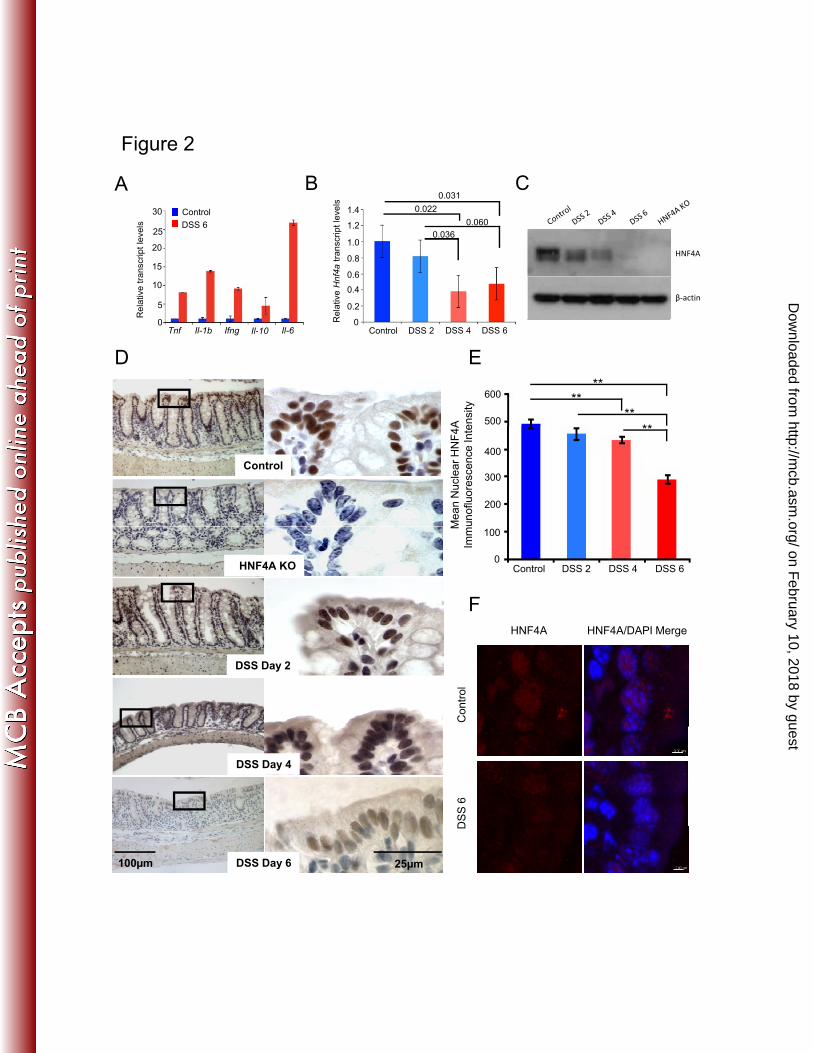
1.4
1 2 0.0600.022
0.031
t lev
els
Figure 2
A30
s
ControlDSS 6
B C
1.2
1.0
0.8
0.6
0.4
0.2
0
0.036
Rel
ativ
e Hnf4a
trans
crip
t
5
0
10
15
20
25
Rel
ativ
e tra
nscr
ipt l
evel DSS 6
HNF4A
β-actin
Control DSS 2 DSS 4 DSS 6Tnf Il-1b Il-6Il-10Ifng
D E
600
500A ensi
ty
****
****
Control400
300
200
Mea
n N
ucle
ar H
NF4
Aun
oflu
ores
cenc
e In
te **
HNF4A KO
HNF4A/DAPI MHNF4A
Control DSS 2 DSS 4 DSS 6
100
0
MIm
m
F
DSS Day 2
Con
trol
HNF4A/DAPI MergeHNF4A
DSS Day 4
DSS
6
DSS Day 6100µm 25µm
D
on February 10, 2018 by guest
http://mcb.asm
.org/D
ownloaded from

41.9%
39.9
%
18.2
%
A
D
Genomic Distribution of HNF4A
in DSS Inflamed Colon
Promoter, UTR, and
Exonic Region
Intergenic Region
Intronic Region
19.2%
39.1%
41.7%
Genomic Distribution of HNF4A
in Control Colon
0.17
0.16
0.15
0.14
0.13
0.12
Random Regions
DSS Day 6 HNF4A Bound Regions
-1500 -1000 -500 0 500 1000 1500
C
Distance from HNF4A binding Peak (bp)
Avera
ge C
onserv
ation S
core
0.16
0.15
0.14
0.12
0.17
0.13
1500 1000 500 0 -500 -1000 -1500
Control HNF4A Bound Regions
Random Regions
B
Distance from HNF4A binding Peak (bp)
Avera
ge C
onserv
ation S
core
0%
5%
10%
15%
20%
25%
30%
35%
40% TSS
Distance to TSS (kb)
0%
5%
10%
15%
20%
25%
30%
35%
40% TSS
Distance to TSS (kb)
% o
f H
NF
4A
bin
din
g s
ites
% o
f H
NF
4A
bin
din
g s
ites
Bits
0
0.5
1
1.5
2
1 2 3 4 5 6 7 8 9 10 11 12 13 14 15 16
Position
p < 10-691 de novo Motif Analysis
1
Bits
0.5
1.5
2
0
Position 1 2 3 4 5 6 7 8 9 10 11 12 13
de novo Motif Analysis p < 10-691
Promoter, UTR, and
Exonic Region
Intergenic Region
Intronic Region
Figure 3
on February 10, 2018 by guest
http://mcb.asm
.org/D
ownloaded from
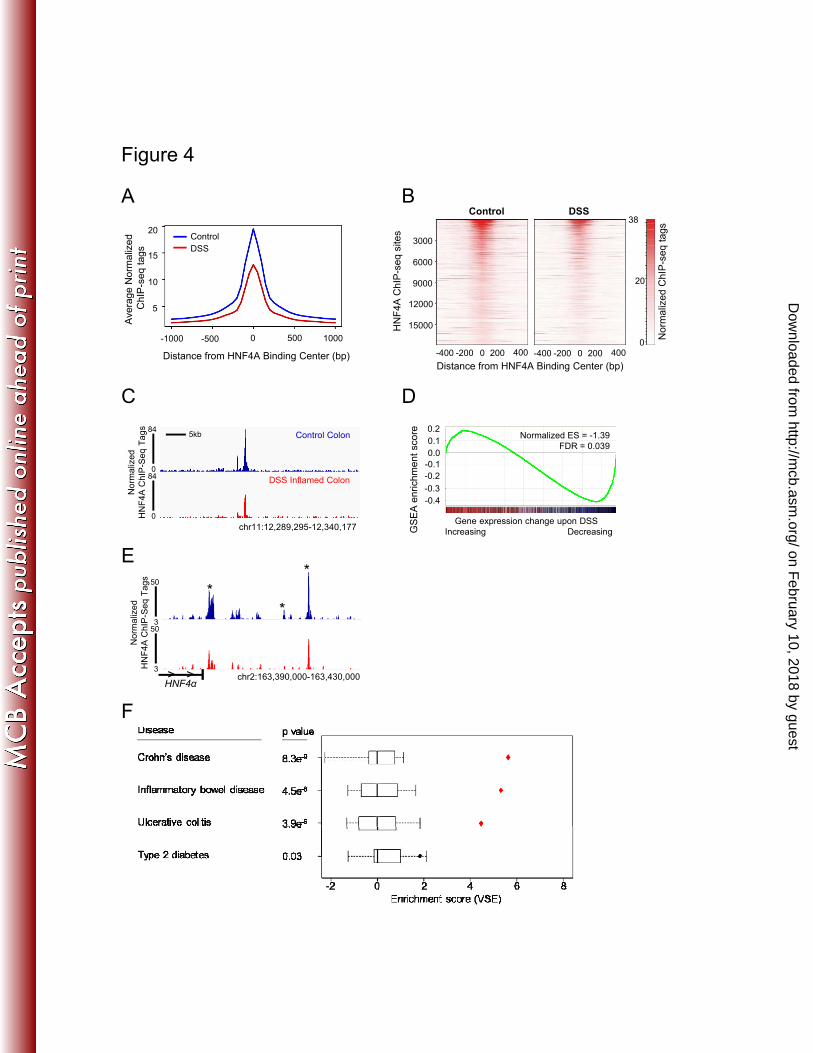
38
A B
Figure 4
Control DSS
s
3000
6000
9000
12000
15000
20
ControlDSS
5
10
15
20
Ave
rage
Nor
mal
ized
C
hIP
-seq
tags
HN
F4A
ChI
P-s
eq s
ites
rmal
ized
ChI
P-s
eq t
ags
-400 -200 0 200 400
15000
0
D
-400 -200 0 200 400
Distance from HNF4A Binding Center (bp)
0 2
Distance from HNF4A Binding Center (bp)
-1000 -500 0 500 1000
CH
Nor
GS
EA
enr
ichm
ent
scor
e
Gene expression change upon DSS
Normalized ES = -1.39FDR = 0.039
-0.10.0
-0.4-0.3
-0.2
0.10.2
84
0
Control Colon
DSS Inflamed Colon
5kb
chr11:12 289 295 12 340 177
84
0
Nor
mal
ized
HN
F4A
ChI
P-S
eq T
ags
G Increasing Decreasingchr11:12,289,295-12,340,177
*
**
mal
ized
IP-S
eq T
ags
50
50
3
E
HNF4αchr2:163,390,000-163,430,000
Nor
mH
NF
4A C
h 50
3> >
F
on February 10, 2018 by guest
http://mcb.asm
.org/D
ownloaded from

BA
Figure 5
9 0HNF4A Binding Frequency
<-3.01 >2.15
Gene expression change in HNF4KO
+/-1.25
Decreasing transcripts Increasing transcripts
Direct Targets: 194
Indirect Targets: 186
CControl
DSS only
HNF4A KO
0.4
0.6
0.8
1.0
1.2
No
rmal
ized
nsc
rip
t L
evel
s
D
A C
hIP
-Seq
Tag
s Control Colon
Inflamed Colon350
35 5kb
CX3Cl1RelB H2-AA FOXP1 HPRT
0.2NT
ran
0
HNF4A KOHNF4A KO P F
old
n
t 1 01.2
C l
EH
NF
4A
RelB
0
F
RelB
ß-Actin
DSS-onlyHNF4A KO Before DSS
HNF4A KOAfter DSS
No
rmal
ized
Ch
IPE
nri
chm
en
0
0.2
0.4
0.6
0.8
1.0
RelB (1) RelB (2) RelB (3) Intergenic Control
Control
DSS70kDa
50kDa
on February 10, 2018 by guest
http://mcb.asm
.org/D
ownloaded from

Figure 6
ATamoxifen
Day 1 2 3 4 5 6 7 8 9 10
Tamoxifen
HNF4A KO Before DSS HNF4A KO Concurrent with DSS
DSS Water
100
110 ControlHNF4a KOControl DSSHNF4A KO Concurrent with DSSHNF4A KO Before DSS
od
y w
eig
ht
B<0.00001
*** ***
80
90
% o
rig
inal
bo
og
y S
core
s
8
10
12
Control DSS
HNF4A KO Before DSSHNF4A KO Concurrent with DSSD
8
10
C ControlHNF4a KOControl DSSHNF4A KO Concurrent with DSSHNF4A KO Before DSS
0.016<0.002
0.07
<0.002
ng
th (
cm
)
His
top
ath
olo
0
2
4
6
E4
6
Co
lon
len
Control ColonControl Colon HNF4a KO
HNF4a Prior KO DSS Day5HNF4A KO Before DSSHNF4a Simultaneous KO DSS Day5Control DSS
* *HNF4A KO concurrent with DSS
*
on February 10, 2018 by guest
http://mcb.asm
.org/D
ownloaded from
![Long Noncoding RNAs, Chromatin, and Developmentdownloads.hindawi.com/journals/tswj/2010/180798.pdf · active chromatin modifications and a more open chromatin conformation[26,39,40,41,42]](https://img.pdfslide.us/doc/110x75/5f8885d811957319d07a36bf/long-noncoding-rnas-chromatin-and-active-chromatin-modifications-and-a-more-open.jpg)