Embed Size (px)
Citation preview
O N G , S N E L L , A N D F A S M A N
Chromatin Models. The Ionic Strength Dependence of Model Histone-DNA Interactions: Circular Dichroism Studies of Lysine-Leucine Polypeptide-DNA Complexes?
Edith C. Ong,* Christopher Snell,§ and Gerald D. Fasman*
ABSTRACT: The ionic strength dependence of the com- plexes between DNA and both random, (Lysx, Led) , , and block copolymers, (LysX),(LeuJ),, of lysine and leucine, with different amino acid compositions, was studied using circular dichroism (CD) as the probe to detect conforma- tional differences in these complexes relative to native DNA. It was found that the C D spectra of complexes of both the random ( L y ~ ~ ~ , L e u ' ~ ) , and block (Lys85),(Leu'S),, copolymers with D N A show a very sharp ionic strength dependence. The maximum altered CD spec- trum for the complexes with the block copolymer was found to occur a t the same ionic strength as that for poly(L-lysine)- DlVA complexes, while the maximum C D change for the random copolymer complex occurred a t a slightly lower ionic strength. This sharp dependence of the C D change on the ionic strength was found to be independent of the poly- mer/DNA ratio, r , for each individual copolymer. The CD spectra for these complexes a t optimum NaCl concentra- tion resemble those of the \k spectra of DNA [Jordan, C. F., Lerman, L. S., and Venable, J . H . (1972), Nature (Lon-
E u c a r y o t i c chromosomes contain nuclear DKA, RNA, histones, and non-histone proteins. The histones are basic in nature and form a complex with DNA which is believed to assist in maintaining the structural integrity of DNA in chromatin. The DNA in such a nucleohistone complex is thought to exist in a compact state, and may assume a fold- ed or a supercoiled structure (Henson and Walker, 1971; Rill and Van Holde, 1973; Pardon and Wilkins, 1972; Bram and Ris, 1971). Recently, a model consisting of a histone core with D N A wrapped around it has evolved to explain the compact structure of the nucleohistone complex (see Van Holde et al., 1974, and references therein). The biolog- ical function associated with such a compact nucleohistone structure is as yet unknown, although it has been suggested that it could be involved in gene suppression through a structure-function correlation, in that such a structure could not be recognized for gene expression (Bradbury et al., 1973).
This is publication No. 1046 from the Graduate Department of Biochemistry, Brandeis University, Waltham, Massachusetts 021 54. Received May 27, 1975. This research was generously supported in part by grants from the U S . Public Health Service (GM 17533), Na- tional Science Foundation (GB 29204)0, and the American Cancer Society (P-577).
1 Present address: Gillette Companq. Personal Care Division, Gil- lette Park, Boston, Mass. 02106.
5 Present address: National Institute for Medical Research, The Ridgeway, Mill Hill, London, N W 71AA.
* Author to whom inquiries should be addressed. John Guggenheim Fellow, 1974-1975.
don), New Biol. 236, 671. The complexes of the random co- polymer, (Lys@,Leu3*),, with D N A ( r = 0.25) a t 0.15 M NaCl and below have C D spectra that resemble the A-form DNA spectra. The ionic strength dependence of the C D spectra of this complex is not as sharp as observed with the above polymers and has a broad positive plateau. It is sug- gested that both the CD spectra of these complexes reflect the phenomena of DNA condensation into a higher order asymmetric structure (folded and compact). The block co- polymer, ( L y ~ ~ ~ ) , ( L e u ~ ~ ) , , , complexes with DNA show very slight alterations in the C D spectra, with respect to na- tive DNA. It appears that the long Leu sequence a t one end' of such copolymers may be unpropitious for causing the polypeptide-DNA complex to condense into a higher order asymmetric structure. Thus the importance of the distribu- tion of hydrophobic residues, in the copolypeptides of Lys, is shown for causing condensation of complexes with DNA. The relevance of these findings to histone-DNA complexes in chromatin is discussed.
Circular dichroism (CD) is known to be a very sensitive probe for monitoring structural changes in optically active macromolecules. Although detailed geometric parameters of molecular structure cannot as yet be extracted from C D spectra, as can be obtained from x-ray diffraction studies, the ease of working with solutions for C D studies makes it an attractive tool for studying the conformation of biologi- cal molecules.
Tunis-Schneider and Maestre (1970) measured the C D spectra of DNA films under conditions that yield the x-ray diffraction patterns of the A, B, and C forms of DNA fibres (Fuller et al., 1965; Langridge et al., 1960; Marvin et al., 1961). Subsequently DNA in various solvents, salts, and other complexing agents have been identified, by numerous authors, to be in the A, B, or C form simply based on the re- semblance of their C D spectra to those obtained by Tunis- Schneider and Maestre (1970).
More recently, a new DNA C D spectrum, termed \k type, has been identified as representing a condensed state D N A structure (Jordan et al., 1972, Lerman, 1973a,b; Evdokimov et al., 1972). The interaction of D N A with the lysine-rich histone H-1' (Fasman et al., 1970) and with PO- lylysine (Shapiro et al.. 1969; Carroll, 1972) gave C D spec- tra which were very similar to that of the \k spectra. On the
' Abbreviations used are: the abbreviations for amino acids and polymers conform to the tentative rules of the IUPAC-IUB Commis- sion on Biochemical Nomenclature as published in Biochemistry I I , 942 (1972). All amino acids are L. Histone nomenclature: H1 (F- I ) : H2A (F2A2,IIbl); H2B (FZB,IIbZ); H 3 (F-3, 111); H4 (F2A1, I V ) .
468 B I O C H E M I S T R Y , V O L . 1 5 , N O . 3 , 1 9 7 6
( L Y S , L E U ) P O L Y P E P T I D E - D N A I N T E R A C T I O N S
Table I: Polymers and Copolymers of L-Lysine and L-Leucine.
Mol wt 1 M NaCl Lys:Leu Polymer Sample No. Anhydride Ratio A/Ib [ V I p H 4.0
(LYS), GF-19-39-27 a 1.82 133 000 (LysS8,Leu "), GF-15-35 6-1 60 a 1.04 71 000 (Lysa4,Leu ' 6 ) n GF-18-123-330 a 1.20 84 000 (LysaS),(Leu' 5) )m GF-2 1-7 2- 1 3 85:15 25 0.88 ( L y ~ ~ ' ) , ( L e u ~ ~ ) , , , GF-23-7 2-20 80:20 25
0 From Snell and Fasrnan (19721. b Hexvlamine used as initiator: A/I, anhydride to initiator ratio.
other hand, complexes of DNA with histones H-4 (Shih and Fasman, 1971; Adler et al., 1975a), H2A (Adler et al., 1975b), and with H2B (Adler et al., 1974), a t optimum conditions, gave a C D spectra similar to A-form DNA. The differences between these spectra and that of \k spectra will be discussed in light of the results from this study for DNA complexes with random (Lysx, Leuy), and block (LysX),(LeuY), copolymers.
There are five classes of histones and the different his- tones are known to contain a large number of basic residues as well as hydrophobic residues. The specific association of these histones to DNA is as yet unknown. A wide variety of model systems have been employed to investigate the speci- ficity of protein-DNA interactions. The most extensive area of investigation has been the interaction of D N A with basic homo poly(a-amino acids) as histone models (e.g., POIY(L-LYS) Olins et al., 1967). Random copolypeptides containing Lys have also been studied, e.g., (Lys, Tyr) (Santella and Li, 1974). More sophisticated studies have in- cluded ordered repeating dimers [poly (L-Lys,L-Ala), Pri- vat et al., 19721 and ordered sequence trimers, tetramers, and pentamers [(Ala-Lys-Pro),, (Ala-Pro-Lys),, (Lys-Ala- Gly),, (Ala-Lys-Pro-Lys),, and (Ala-Lys-Lys-Pro-Lys),, Sponar et al., 1973, 19741.
In order to elucidate the role that basic and hydrophobic residues play in their association with DNA, polypeptides containing both lysine (basic) and leucine (hydrophobic) residues of different composition and sequence were synthe- sized to study their interactions with DNA. The studies un- dertaken herein were aimed a t probing the nature of the nonionic interactions (hydrophobic, etc.) between DNA and proteins which must play a role in determining the high de- gree of specificity between these biological macromolecules.
Materials and Methods
DNA Preparations. Calf thymus D N A was prepared ac- cording to the procedures given by Adler et al. (1971), with a median molecular weight of 10 X IO6, as determined by sedimentation velocity. The concentration of the stock solu- tion was determined by uv absorption using e258 (per mole of nucleotide residue) = 6.8 X lo3 cm2 mol-' (Adler et al., 1971). Aliquots were measured with a 1-ml Manostat buret (Manostat Corp.).
Synthesis of Polymers. Poly(L-lysine) was synthesized as previously described (Fasman et al., 1961).
POIY(L-LYS", L-Leu.!'). The random polymers used were those previously described (Snell and Fasman, 1972).
PoIY(L-LYs*), (L-LeuY)m. The block copolymers were prepared as follows. A typical polymerization for a 80:20 polymer, poly(L-Lys80),(L-Leu20)m, is as follows. t-Benzyl- carbonyl-L-lysine-N-carboxyanhydride (0.5 16 g) was dis- solved in 52 ml of freshly distilled dioxane and to the clear
solution was added, with stirring, 0.302 M hexylamine in benzene (0.223 ml; A / I = 25) and the solution was allowed to stand 48 h. An aliquot was then removed and a titration was performed to check for unreacted anhydride; none was observed. A solution of L-leucine-N-carboxyanhydride, 0.0666 g (Fasman et al., 1964), in dioxane (7 ml) was added to the polymerization solution with stirring and the solution allowed to stand 3 days. The viscous opalescent so- lution was diluted with chloroform, A.C.S. (100 ml), dry hydrogen chloride gas was bubbled through the solution for 30 min, followed by hydrogen bromide gas for 30 min, caus- ing a white precipitate to form. The solution was stirred for 35 h and then nitrogen gas was bubbled vigorously through the solution for 45 min. After allowing the precipitate to settle, the supernatant was removed by suction. The re- maining solvent was evaporated on a rotary evaporator, the precipitate was dissolved in water (100 ml), the pH of the aqueous solution was adjusted to 7 with 1 M sodium hy- droxide, the solution was extracted four times with ether, the solution was dialyzed against HzO for 24 h (two changes of H20), then dialyzed vs. 0.01 N HCI for 48 h, fi- nally dialyzed vs. H20 for 12 h, filtered through a sintered glass funnel (medium porosity), and lyophilized, and the solid material was dried in vacuo for 20 h a t 50'; yield, 0.250 g.
Table I contains data for all the polypeptides used. Polypeptide-DNA Complexes. The complexes were
made up in 1.5-2.0 M NaCI, 2.0 X M Tris, or M EDTA a t p H 7.0 f 0.1 and dialyzed down to 0.15 M NaCl using linear gradient dialysis (Carroll, 1971) in order to an- neal the complexes. After dialysis the concentration of DNA was determined by perchlorate digestion with 5% per- chloric acid, and the uv absorbance of the mixture was mea- sured, using €260 (per mole nucleotide) = 9900 cm2 mol-' for calf thymus DNA which contains 42% G + C (Adler et al., 1971). The dialysis was carried out under a maximum flow rate of 500 ml/h a t 4'. Dialysis bags were taken out a t different NaCl concentrations, as determined by a calibra- tion curve of flow volume vs. ionic strength for the linear gradient dialysis. Accurate measurements of the ionic strengths were performed with a Bausch and Lomb refrac- tometer with the proper calibration curve. The DNA con- centration used in the complex preparations was 1.5-2.0 X
M phosphate residue. Different ratios, r = Lys/DNA indicate input ratio of polypeptides to D N A in terms of moles of lysine residues/POa. The dialysis bags were boiled in a solution of 5% N a H C 0 3 for 30 min, washed thoroughly with double distilled water, boiled again in H20 twice for 30 min, and then finally rinsed with double distilled water. Disposable gloves were used throughout this treatment to avoid any contamination from outside sources.
Optical Properties. The uv absorption spectra of the samples were obtained on a Cary 14 spectrophotometer
B I O C H E M I S T R Y , V O L . 1 5 , N O . 3 , 1 9 7 6 469

O N G , S N E L L , A N D F A S M A N
I , Table II:Q Circular Dichroism Values, [ e ] , of DNAb at Different NaCl Concentrations.
M NaClC
1.50 i 0.05 1.25 i 0.05 1.00 2 0.05 0.75 i 0.03 0.50 i 0.03 0.25 i 0.02 0.15 i 0.02
[ e l z m d Acrossover (nm)
6000 i 300 6500 i 300 6850 I 350 7450 i 350 7800 i 400 8200 i 400 8200 i 400
260.0 ? 0.5 259.0 i 0.5 258.5 I 0.5 258.0 I 0.5 258.0 i 0.5 257.5 i 0.5 257.5 I 0.5
- 11 000 i 700 - 10 800 i 700
-10 700 i 700
-1 0 400 c 600 -10 400 t 600
-10 800 I 700
-10 400 t 600
~~~ ~
a Average of seven runs: results vary i8%. b DNA concentration is 1 1 . 5 x 10- M PO,: determined by the perchloric acid digestion method, using ez6,, = 9900 (Adler et al.. 1971). CIn 2 X Tris. d 1-cm path length.
M
Table 111: Circular Dichroism of Copolymers at Various Ionic Strength.
Copolymers hf NaCl [ e 1 2 2 1 Q [ e 1 I 9 7
(LyP,Leu3'), 1.4 -7700 i 700 b 1.0 -4700 I 500 h 0.8 -3600 i 400 b 0.6 -2900 i 300 h 0.4 -1900 I 500 b 0 0 i 700 -34 000 i 3000
(Lysa4,LeuI6), 1.5 -1300 f 300 1.0 0 i 300 0 + 1 5 0 0 t 5 0 0 -40000:4000
(Lys*5),(Leu1S), 1.5 -2900 2 400 0.15 -1020 * 300
(Lys") , (Le~~~) , 1.5 -5800 i 600 0.15 -5800 i 600 0 -3000 i 500 -15 000 i 2000
0 0 = 800 ~ 36 000 z 4000
QConcentration of copolymers used is 1 2 - 3 X hf peptide; 51 Tris (pH 7); cell path buffer,
length = 0.5 or 2 mm. b Too high a noise level for accurate readings. hi EDTA (pH 7) or 2 x
using 1-cm cells with the proper buffer in the reference compartment.
The circular dichroism spectra of the complexes were ob- tained on a Cary 60 spectropolarimeter with a Model 6001 C D attachment as previously reported (Adler et al., 1971). In addition the Cary 6003 modification was employed, which modulates the Pockels a t 327 H z for a better signal to noise ratio. All the measurements were obtained using a 1-cm cell path and the mean residue ellipticity values [ e ] are given in terms of deg cm2/dmol of nucleotide residues of the complex (Adler et al., 1971).
Results Effect of Ionic Strength on the CD Spectra of DNA. As
a control for the DNA complex studies, the effect of ionic strength on the C D spectra of calf thymus D N A (1.5 X
M PO4) from 1.5 M NaCl to 0.15 M NaCI, in 2 X lo-' M Tris buffer is given in Table 11. These results are in general agreement with those previously published by oth- ers (Ramm et al., 1972; Ivanov et al., 1973; Zama, 1974; Bram et al., 1974). Absorbance measurements in the vari- ous salt concentrations showed no dependence of extinction coefficient with NaCl concentration. The decrease in the el- lipticity of the positive C D band, [ B ] 2 s 0 , with increasing ionic strength is accompanied by a shift in the crossover point from 257 nrn, a t M NaCI, to 260 nm a t 1.5 M
- 5 -
-6 -
-7 -
200 220 240 260 280 300 320 340 360 Wavelength (nm)
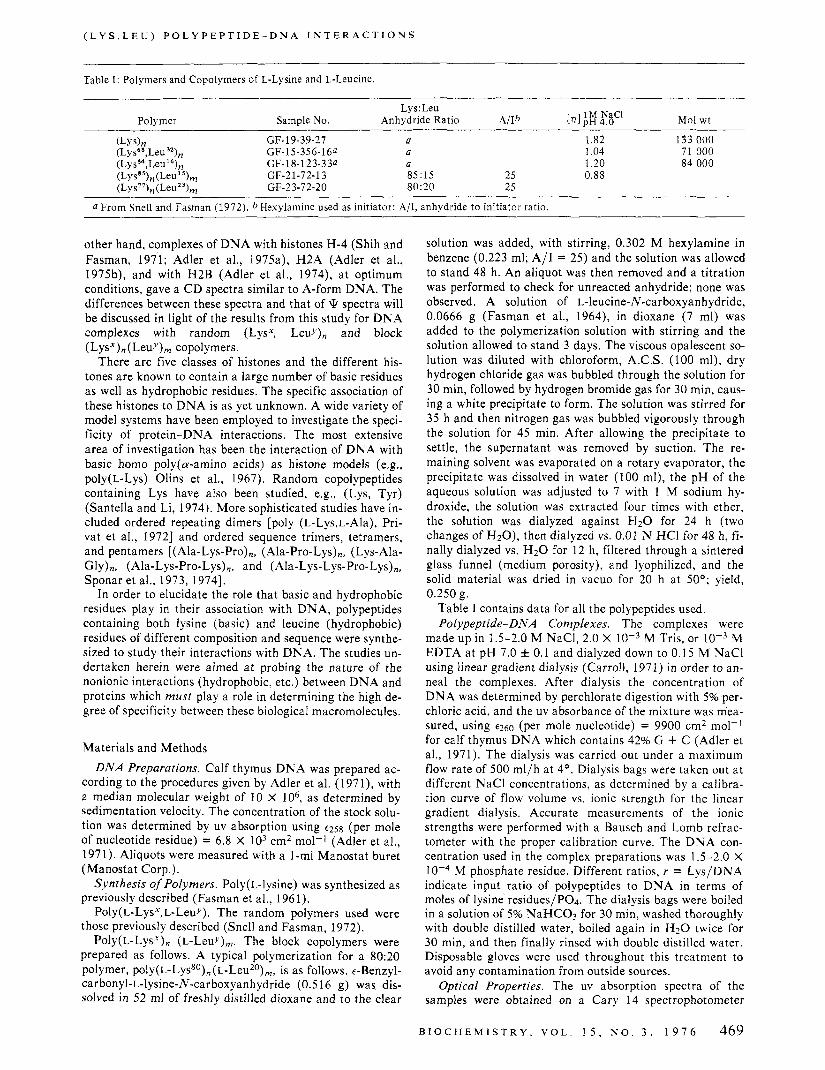
FIGURE 1 : Circular dichroism spectra of ( L ~ s * ~ , L ~ u ' ~ ) , - D N A Com- plexes at r = 0.5 at various NaCl concentrations (A-A) 1.5 M NaCI; ( B - - B) 0.83 M NaC1: ( - a -) 0.70 M NaC1; (C . C) 0.5 M NaCI. Error bars indicate average deviation of ellipticity values in duplicate experiments. DNA concentration is 2.0 X low4 M phosphate. Buffer used is 2 mM Tris (pH 7). The ratio, r , is expressed in terms of moles of Lys residue per mole of nucleotide residues.
NaCI. The negative C D band a t 247 nm shows very little or no dependence on ionic strength. To check for aggregation of DNA under high ionic strength, the C D spectra of the various samples were also measured using a fluorescat cell (Dorman et al., 1973), and identical results were obtained indicating no aggregation. It appears that the slight de- crease in the magnitude of the positive band is not a result of light scattering.
Effect of Ionic Strength on the Conformation of the Co- polymers. The effect of ionic strength on the conformation of the different random (Lys",LeuV)), and block (Lys'),(Leub), copolymers was investigated as an addi- tional control. With increasing salt concentrations the heli- city of the copolymers increases slightly (Table 111). This is especially true for the random copolymer ( L y ~ ~ ~ , L e u ~ ~ ) ) , which has a higher leucine content.
It was found that at high ionic strength (1.5 M NaC1) the helix content of the copolymers, although small, is a function of the percent leucine incorporated in the copoly- mers. However, for random and block copolymers with ap- proximately the same leucine content, e.g., (L-LYS'~,L- Leu'"), and ( ~ - L y s ~ ~ ) , ( ~ - L e u ' ~ ) , , the block copolymer is comparatively more helical than the corresponding random copolymer a t the same ionic strength. This is anticipated since Leu has a higher helix potential than does Lys (Chou and Fasman, 1974), and thus sequences of Leu residues will have a higher probability of generating helical segments in the block copolymer. It has been previously shown that for random (Lys",LeuJ), copolymers that as the pH is raised, inducing helicity, the higher Leu content causes greater hel- icity (Snell and Fasman, 1972).
Complexes of the Random Copolymer (LysS4,Leul6)), with DNA. The C D spectra of the ( L ~ S ~ ~ , L ~ U ' ~ ) , - D N A complexes, at r = 0.5 (Lys/DNA), a t various salt concen-
470 B I O C H E M I S T R Y , V O L . 1 5 , N O . 3 . 1 9 7 6
( L Y S , L E U ) P O L Y P E P T I D E - D N A I N T E R A C T I O N S
-35 I I 1 , b r l I I 0.1 0.3 0 5 0.7 0 9 1.1 1.3 1.5
Malar NaCl
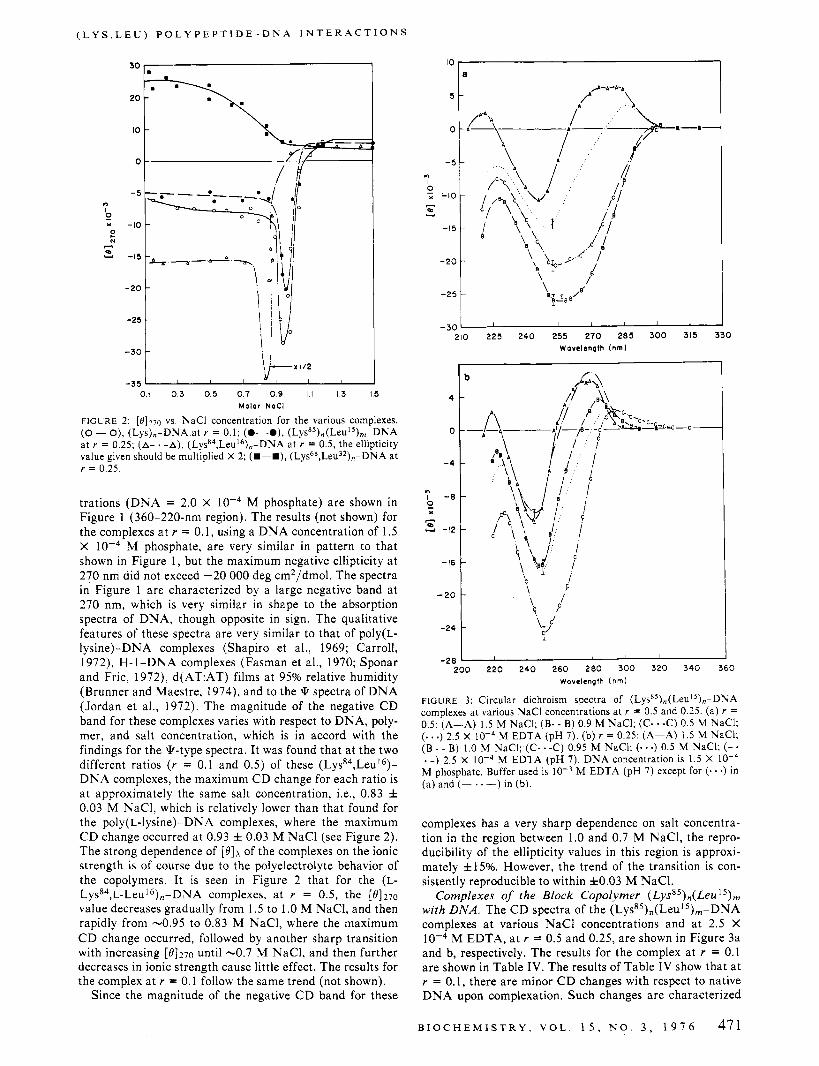
FIGURE 2: [8]270 vs. NaCl concentration for the various complexes. (0 - O), (Lys),-DNA at r = 0.1; (0- -0). (Lysa5),(Leu15),-DNA at r = 0.25; (A- . -A), ( L ~ S ~ ~ , L ~ U ' ~ ) , , - D N A at r = 0.5, the ellipticity value given should be multiplied X 2; (U-U), ( L ~ S ~ ~ , L ~ U ~ ~ ) , - D N A at r = 0.25.
trations (DNA = 2.0 X M phosphate) are shown in Figure 1 (360-220-nm region). The results (not shown) for the complexes at r = 0.1, using a DNA concentration of 1.5 X M phosphate, are very similar in pattern to that shown in Figure 1, but the maximum negative ellipticity a t 270 nm did not exceed -20 000 deg cm2/dmol. The spectra in Figure 1 are characterized by a large negative band at 270 nm, which is very similar in shape to the absorption spectra of DNA, though opposite in sign. The qualitative features of these spectra are very similar to that of poly(L- lysine)-DNA complexes (Shapiro et al., 1969; Carroll, 1972), H-1-DNA complexes (Fasman et al., 1970; Sponar and Fric, 1972), d(AT:AT) films at 95% relative humidity (Brunner and Maestre, 1974), and to the * spectra of DNA (Jordan et al., 1972). The magnitude of the negative CD band for these complexes varies with respect to DNA, poly- mer, and salt concentration, which is in accord with the findings for the *-type spectra. It was found that a t the two different ratios ( r = 0.1 and 0.5) of these ( L y ~ ~ ~ , L e u ' ~ ) - DNA complexes, the maximum C D change for each ratio is a t approximately the same salt concentration, Le., 0.83 f 0.03 M NaCl, which is relatively lower than that found for the poly(L-lysine)-DNA complexes, where the maximum C D change occurred at 0.93 f 0.03 M NaCl (see Figure 2). The strong dependence of [ e l k of the complexes on the ionic strength is of course due to the polyelectrolyte behavior of the copolymers. I t is seen in Figure 2 that for the (L- Lyss4,~-Leu16),-DNA complexes, a t r = 0.5, the [e1270
value decreases gradually from 1.5 to 1 .O M NaCl, and then rapidly from -0.95 to 0.83 M NaC1, where the maximum C D change occurred, followed by another sharp transition with increasing [8]270 until -0.7 M NaC1, and then further decreases in ionic strength cause little effect. The results for the complex at r = 0.1 follow the same trend (not shown).
Since the magnitude of the negative C D band for these
IO a
-24 I -28 I 1 , 1 I I
2 0 0 2 2 0 2 4 0 2 6 0 2 8 0 300 320 3 4 0 360 Wavelength (nm)
FIGURE 3: Circular dichroism spectra of ( L ~ S ~ ~ ) , ( L ~ U ' ~ ) , - D N A complexes at various NaCl concentrations at r = 0.5 and 0.25. (a) r = 0.5: (A-A) 1.5 M NaCI: (B- - B) 0.9 M NaC1; (C- -C) 0.5 M NaCI; (. . .) 2.5 X M EDTA (pH 7 ) . (b) r = 0.25: (A-A) 1.5 M NaCI; (B - - B) 1.0 M NaCI; (C- -C) 0.95 M NaCI; (e e a ) 0.5 M NaCI; (- . -) 2.5 X M EDTA (pH 7 ) . DNA concentration is 1.5 X M phosphate. Buffer used is (a) and (- . . -) in (b).
M EDTA (pH 7 ) except for ( e - .) in
complexes has a very sharp dependence on salt concentra- tion in the region between 1.0 and 0.7 M NaC1, the repro- ducibility of the ellipticity values in this region is approxi- mately f15%. However, the trend of the transition is con- sistently reproducible to within f 0 . 0 3 M NaC1.
Complexes of the Block Copolymer ( L y ~ ~ ~ ) , , ( L e u ' ~ ) , with DNA. The C D spectra of the (Lys85),(Leu1S),-DNA complexes a t various NaCl concentrations and at 2.5 X lod4 M EDTA, at r = 0.5 and 0.25, are shown in Figure 3a and b, respectively. The results for the complex at r = 0.1 are shown in Table IV. The results of Table IV show that a t r = 0.1, there are minor C D changes with respect to native DNA upon complexation. Such changes are characterized
B I O C H E M I S T R Y , V O L . 1 5 , N O . 3 , 1 9 7 6 471

O N G , S N E L L , A N D F A S M A N
Table IV: Circular Dichroism [ e ] Values of ( L ~ S ~ ~ ) , ( L ~ U ’ ~ ) , - D N A Complexes at Different NaCl Concentrations at Y = 0.1.0
1.45 i 0.05 1.00 ?; 0.05 0.90 i 0.03 0.85 i 0.03 0.70 i 0.03 0.60 I 0.03 0.50 t 0.03 0.40 c 0.03 0.30 i 0.03
~
281 i 1 282 i 1 284 i 1 283 i 1 282 i- 1 282 i 1 282 c_ 1 282 i 1 283 i 1
6000 i 300 6300 i 300 4900 i 1000 5600 * 500 5600 t 500 6200 i 600 5200 i 500 6800 i 650 5900 i 600
4100 z 800 3500 +_ 700
1500 * 800 2700 t 500 3000 i 500 3500 i 500 4000 i 600 4000 i 600
200 i 1000
260 i 1 261 i 1 269 * 1 266 f 1 263 i 1 262 i 1 2 6 1 i 1 260 t 1 262 i 1
-11 800 i 1000 -12 000 i 1000 -12 900 i 1000 -13 500 i 1000 -12 500 i 1000 -12 500 i 1000 -12 500 i 1000 -11 600 i 1000 - 1 2 o o o i 1000
a r = Lys/PO, ratio.
Table V: Circular Dichroism [ e ] Values of (L~s”),(L~u~~),-DNA Complexes, Y = 0.5,a as a Function of NaCl Concentration,
Acrossover )I NaCl [e l z*o (nm) [ e 1 2 4 5
1.50 i 0.05 6 1 5 0 r 300 260 -10 500 i 700 0.90 i 0.03 6500 i 600 262 i 1 -12 000 t 1000 0.20 i 0.02 8 0 0 0 t 8 0 0 2592 1 -11 0001 1000
M citrate 7500 t 300 258 i 1 -9 600 r 600 2.5 x l o 4 hl Na,- 7000 i 500 258 i 1 -7 000 i 500
(EDTA) a r = Lyr/PO, ratio.
by a slight decrease in the positive peak a t 280 nm accom- panied by a red shift in the crossover point, and with almost no alteration in the negative trough a t 247 nm. At the high- er ratios, r = 0.25 and r = 0.5, the altered C D spectra ap- proach that of the ( L Y S * ~ , L ~ U ’ ~ ) , - D N A complexes, and the \k spectra of DNA. However, with these two copolymers a t the same Lys/DNA ratio, the block copolymer does not give as large a change as does the random copolymer. It should be noted that the maximum change in the C D spec- tra of the ( L ~ S ~ ~ ) , ( L ~ U ’ ~ ) , , - D N A complexes, at r = 0.5, occurs a t a NaCl concentration very close to that of the poly(L-lysine)-DNA complex and such critical dependence on ionic strength is independent of the ratio, r , used.
Comparing the results of Figure 3a and b and Table IV, it can be seen that for the ( L ~ S ~ ~ ) , ( L ~ U I ~ ) , - D N A com- plexes at r = 0.5, 0.25, and 0.1, the [ e l 2 7 0 value of the com- plexes slowly decreases with decreasing ionic strength from 1.5 to ~ 1 . 0 5 M NaCI, and then drastically decreases on further lowering of the ionic strength to 0.93 f 0.03 M NaCI, where the maximum altered C D spectra for each ratio are observed. A further decrease in salt concentration causes an increase in [0]270. This trend is seen in Figure 2 for this complex a t r = 0.25, and the results a t r = 0.5 and 0.1 also follow the same trend. The result of the complexes in 2.5 X M EDTA, a t r = 0.5 and 0.25, follows the trend of increasing [ 8 ] 2 7 0 values with decreasing salt con- centration below 0.93 f 0.03 M NaC1.
Complexes of the Block Copolymer ( L ~ s ~ ~ ) , ( L e u ~ ~ ) , , , with DIVA. A study of the ( L ~ s ~ ~ ) , ( L ~ u * ~ ) , - D N A com- plexes at r = 0.5, with respect to ionic strength, shows very little CD change from that of the native D N A spectra (Table V). Such complexes in M citrate and 2.5 X
M EDTA also give the same results. An attempt to check whether the copolymer might be aggregating was made by making the complex in 2 M guanidine hydrochlo- ride, dialyzing down to 0.15 M guanidine hydrochloride,
and then exchanging it with 0.15 M NaC1. This procedure failed to produce any significant changes in the C D spectra of these complexes.
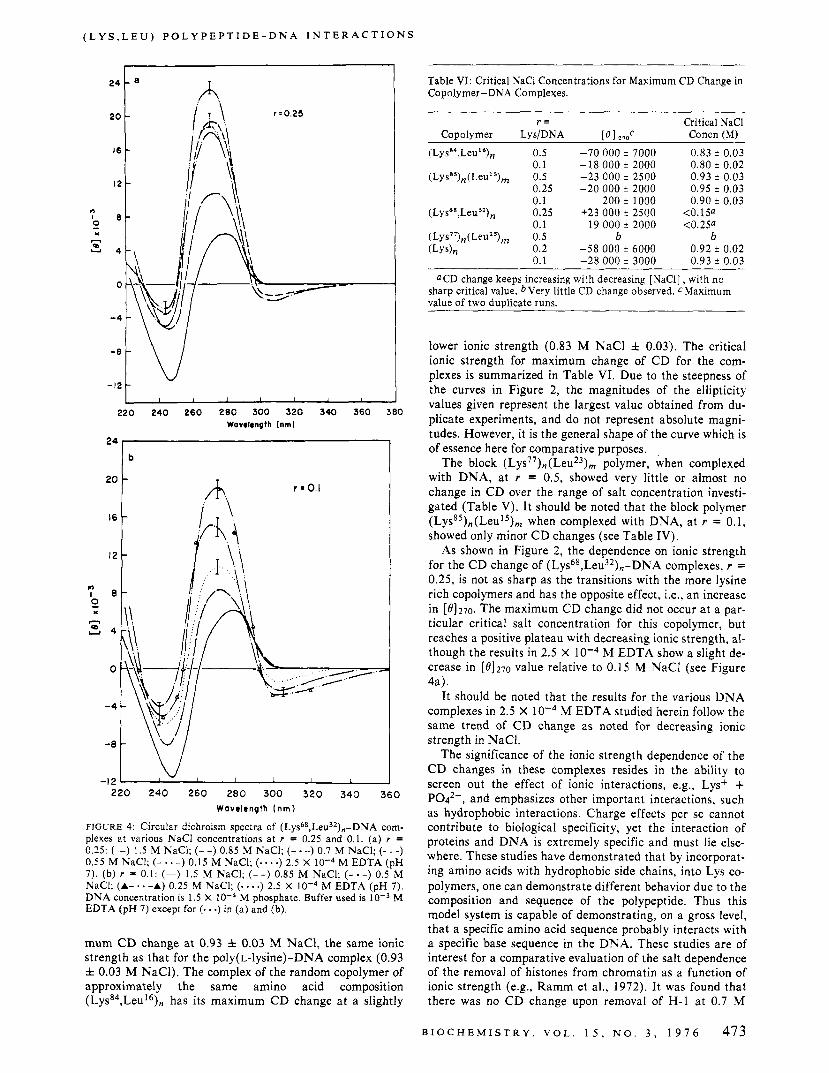
Complexes of the Random Copolymer ( L y ~ ~ ~ , L e u ~ ~ ) , with DNA. The CD spectral results of the ( L y ~ ~ * , L e u ~ ~ ) , - D N A complexes with respect to NaCl concentration, and a t 2.5 X A4 EDTA, a t r = 0.1 and 0.25, are shown in Figure 4. The C D spectra for this set of complexes look sim- ilar to that of histone complexes, H4-DNA (Shih and Fas- man, 1971; Adler et al., 1975a), H2A (Adler et al., 1975b), and H2B-DNA (Adler et al., 1974) complexes. The in- crease in Leu content of the copolymer appears to inhibit the formation of \k spectra, and induces a spectra similar to A-DNA (Tunis-Schneider and Maestre, 1970). Such C D spectra are characterized by a large increase in the positive peak a t 270 nm, accompanied by a blue shift in the cross- over point, and with a decreased negative trough a t 245 nm. The ionic strength dependence of the [8]270 value for this complex at r = 0.25 is shown in Figure 2. The same trend is also observed for this complex a t r = 0.1 (see Figure 4). It should be noted that the increase in [ e l 2 7 0 value of this com- plex with decreasing ionic strength occurs over a wider range of NaCl concentration, and reaches a broad positive plateau. However, the complex shows a slight decrease of the [ 8 ] 2 7 0 value in 2.5 X loT4 M EDTA for the complexes a t r = 0.25 and 0.1 from their respective maximum value obtained in 0.15 M and 0.25 M NaC1, respectively (Figure
Ultrac.iolet Absorption Studies of D N A Complexes. The ultraviolet absorption spectra of these complexes are all very similar to that of native DNA with the exception of a scattering tail a t 320 nm. This scattering increases with de- creasing ionic strength and with increasing r . These spectra are characterized by an absorption maximum a t 258 nm with molar absorptivity of 7000 f 500 cm2/mol of nucleo- tide residue.
Discussion The effect of varying the ionic strength on the C D spec-
tra of various polypeptide-DNA complexes is summarized in Figure 2. It was found that the ionic strength dependence of the change in the C D of complexes with the highly lysine rich copolymers, (Lyss4,Leu16), and ( L y ~ ~ ~ ) , ( L e u ~ ~ ) , , , is quite sharp and is very similar in nature to that found for poly(L-lysine)-DNA complexes herein, as well as in previ- ous studies (Carroll, 1972; Zama, 1974). For different ra- tios of the same copolymer in the complex, the maximum change in C D occurs a t the same ionic strength, to within f 5 % (Table VI). The complex of the block copolymer, ( L ~ S ~ ~ ) , ( L ~ U ~ ~ ) , , - D N A , a t different ratios, has its maxi-
4).
472 B I O C H E M I S T R Y , V O L . 1 5 , N O . 3 , 1 9 7 6
( L Y S , L E U ) P O L Y P E P T I D E - D N A I N T E R A C T I O N S
I
2 4 t a A
220 240 260 280 300 320 340 360 380 Wavelength (nml
24 I
I b 2ot r =0.1
2 2 0 2 4 0 260 200 300 3 2 0 340 360 Wavelength ( n m )
FIGURE 4: Circular dichroism spectra of ( L Y S ~ ~ , L ~ U ~ ~ ) , - D N A com- plexes at various NaCl concentrations at r = 0.25 and 0.1. (a) r = 0.25: (-) 1.5 M NaC1; (- -) 0.85 M NaCI; (- -) 0.7 M NaC1; (- - -) 0.55 M NaCl; (- -) 0.15 M NaCI; (a .) 2.5 X M EDTA (pH 7 ) . (b) r = 0.1: (-) 1.5 M NaC1; (- -) 0.85 M NaCI; (- -) 0.5 M NaCI; (A- . * -A) 0.25 M NaCI; ( e - - a) 2.5 X lop4 M EDTA (pH 7). DNA concentration is 1.5 X M EDTA (pH 7 ) except for ( e . a ) in (a) and (b).
M phosphate. Buffer used is
mum C D change at 0.93 f 0.03 M NaC1, the same ionic strength as that for the poly(L-lysine)-DNA complex (0.93 f 0.03 M NaCI). The complex of the random copolymer of approximately the same amino acid composition (LysS4,Leul6), has its maximum CD change at a slightly
Table VI: Critical NaCl Concentrations for Maximum CD Change in Copolymer-DNA Complexes.
r = Copolymer Lys/DNA [ e 1270c
(Lys84,Leu’6), 0.5 -70 000 i 7000 0.1 -18 000 i 2000
(Lysa5), (Leu’ 5)m 0.5 -23 000 i 2500 0.25 -20 000 i 2000 0.1 200 i 1000
( L y ~ ~ * , L e u ~ ~ ) , 0.25 +23 000 i 2500 0.1 1 9 o o o t 2000
(Lys”),(LeuZ3), 0.5 b (LYS), 0.2 -58000i6000
0.1 -28 000 i 3000
Critical NaCl Concn (M)
0.83 i 0.03 0.80 i 0.02 0.93 i 0.03 0.95 f 0.03 0.90 f 0.03
<O.ISa <0.250
b 0.92 r 0.02 0.93 f 0.03
nCD change keeps increasing with decreasing [NaCl] , with no sharp critical value. bVery little CD change observed. CMaximum value of two duplicate runs.
lower ionic strength (0.83 M NaCl f 0.03). The critical ionic strength for maximum change of CD for the com- plexes is summarized in Table VI. Due to the steepness of the curves in Figure 2, the magnitudes of the ellipticity values given represent the largest value obtained from du- plicate experiments, and do not represent absolute magni- tudes. However, it is the general shape of the curve which is of essence here for comparative purposes.
The block ( L y ~ ~ ’ ) , ( L e u ~ ~ ) , polymer, when complexed with DNA, at r = 0.5, showed very little or almost no change in CD over the range of salt concentration investi- gated (Table V). It should be noted that the block polymer ( L y ~ * ~ ) , ( L e u ~ ~ ) , when complexed with DNA, at r = 0.1, showed only minor CD changes (see Table IV).
As shown in Figure 2 , the dependence on ionic strength for the CD change of ( L ~ S ~ ~ , L ~ U ~ ~ ) , - D N A complexes, r = 0.25, is not as sharp as the transitions with the more lysine rich copolymers and has the opposite effect, Le., an increase in [0]270. The maximum CD change did not occur a t a par- ticular critical salt concentration for this copolymer, but reaches a positive plateau with decreasing ionic strength, al- though the results in 2.5 X M EDTA show a slight de- crease in [8]270 value relative to 0.15 M NaCl (see Figure 4a).
It should be noted that the results for the various DNA complexes in 2.5 X M EDTA studied herein follow the same trend of CD change as noted for decreasing ionic strength in NaCI.
The significance of the ionic strength dependence of the CD changes in these complexes resides in the ability to screen out the effect of ionic interactions, e.g., Lys+ + P042-, and emphasizes other important interactions, such as hydrophobic interactions. Charge effects per se cannot contribute to biological specificity, yet the interaction of proteins and DNA is extremely specific and must lie else- where. These studies have demonstrated that by incorporat- ing amino acids with hydrophobic side chains, into Lys co- polymers, one can demonstrate different behavior due to the composition and sequence of the polypeptide. Thus this model system is capable of demonstrating, on a gross level, that a specific amino acid sequence probably interacts with a specific base sequence in the DNA. These studies are of interest for a comparative evaluation of the salt dependence of the removal of histones from chromatin as a function of ionic strength (e.g., Ramm et al., 1972). It was found that there was no CD change upon removal of H-1 at 0.7 M
B I O C H E M I S T R Y , V O L . 1 5 , N O . 3 , 1 9 7 6 473
O N G , S N E L L . A N D F A S M A N
NaC1, while changes in C D of the nucleoprotein were ob- served upon increasing the NaCl concentration between 0.7 and 1 M where H2A, H2B, and H-3 were partially disso- ciated, while H-4 remained bound. Sponar et al. (1974) found that the ordered tetramer polymer (L-Ala-L-Lys-L- Lys-L-Pro),-DNA complex showed the maximum [ 8 ] 2 6 5 value at a critical ionic strength of -0.65-0.70 M NaCl while a much lower critical ionic strength -0.2 M NaCl was found for the ordered trimer polymer (L-Ala-L-Lys- L- Pro)-DNA complex. This demonstrates the role of se- quence and distribution of charge on binding to DNA.
There are remarkable qualitative differences in the C D spectra between these different sets of random (L.ys’, - LeuJ’), and block (LysX),(LeuJ), copolymers when com- plexed with DNA. Several of these spectra (Figures 1 and 3a) are similar to the *-type spectra found for DiVA (Jord- an et al., 1972; Lerman, 1973a,b; Maniatis et al., 1974; Cheng and Mohr, 1974, 1975) produced by adding neutral polymers, polyethylene oxide, polyvinylpyrrolidinone, and polyacrylate. Similar type spectra were reported for DNA complexes with p o l y ( ~ - L y ~ ) (Shapiro et al., 1969; Carroll, 1972), H-1 (Fasman et al., 1970; Sponar and Fric, 1972), and d(AT-AT) films a t 95% relative humidity (Brunner and Maestre, 1974). These results may be analyzed as fol- lows. There is considerable evidence in the literature that the *-DNA spectrum (polymer-salt-induced) is a result of DNA condensation. Similar DNA C D spectra have been obtained by addition of other polymers such as poly(ethy1- ene glycol) (Evdokimov et al., 1972; Varshavsky et al., 1973) and have also been shown by hydrodynamic studies to indicate a collapsed structure (Akimenko et al., 1973: Evdokimov et al., 1972; Frisman et al., 1974). The C D spectra of poly(L-lysine)-DNA, ( L y ~ ~ ~ , L e u l ~ ) ~ - D x A (Figure l ) , and ( L ~ S ~ ~ ) , ( L ~ U ’ ~ ) , - D N A (Figure 3) com- plexes a t the critical ionic strength and polymer concentra- tions ( r value) resemble those of the \k spectra. The cooper- ative nature of the changes in the properties of these com- plexes, as reflected by the changes in with decreasing ionic strengths and increasing polymer concentrations, r . is analogous to the phenomena of crystallization. where a nu- cleation center is required before rapid growth proceeds (Flory, 1961). Such cooperativity in complex behavior is also in agreement with the studies of poly(L-lysine)-DNA complexes by various authors (Shapiro et al., 1969: Carroll, 1972; Haynes et al., 1970; Li et al., 1974), for HI-DNA complexes (Fasman et al., 1970; Haynes et al., 1970) and poly(L-lysine)-poly(A) complexes (Davidson and Fasman, 1969). In view of the evidence for the structure of *-DNA. it is reasonable to regard these spectra, as well as the other complexes listed above, as being due to the condensation of DNA induced by the copolymers and salt to form a highly ordered asymmetric structure. The differences in magni- tude between these spectra probably reflect the degree of packing of the DNA helices to form much higher order structures.
The binding of the random copolymer ( L y ~ ~ ~ . L e u ~ * ) , to DNA at the critical ionic conditions gives C D spectra (Fig- ure 4) that resemble the spectra of A-form DNA (Tunis- Schneider and Maestre, 1970). Such spectra are character- ized by a large positive peak a t 270 nm with the negative trough a t 245 nm being considerably diminished and shifted toward shorter wavelength. A similar type of C D spectrum is also obtained for DNA in solutions containing more than 70% ethanol (Brahms and Mommaerts, 1964; Girod et al., 1973: Johnson and Girod, 1974; Ivanov et al., 1973), in
complexes of DNA with H-4 (Shih and Fasman, 1971; Haynes et al., 1970). with H2B (Adler et al., 1974), with H2A (Adler et al.. 1975a), and with random copolymers (Lys”,Ala6’), and ( L y ~ ~ ~ , A l a ~ ~ ) , a t r > 0.1 (Sponar et al., 1973). A poly(L-lysine)-poly(1 + C) (2:l) complex also gives similar C D spectra (Haynes et al., 1970).
If one examines the A-like C D spectrum obtained for the above DNA complexes in the region between 300 and 240 nm, one finds that this type of spectrum is very similar in shape to the \k spectra, but of opposite sign, both having their maxima at 270 nm. These spectra are also similar in shape to their corresponding absorption spectra, and the nu- cleotides of calf thymus DNA have an average absorption maximum at 270 nm. It is proposed that these A-like spec- tra may also reflect a condensed form of DNA with a high- er order asymmetric structure based on the following exper- imental and theoretical findings.
The condensation of DNA in ethanol has been estab- lished by various workers through sedimentation, viscosity, and light-scattering measurements (Coates and Jordan, 1960; Herskovits et al.. 1961). A collapsed form of DNA in dilute ethanol solution, with regular superstructure, has been observed by Lang (1 973) in the electron microscope. The fact that DNA in methanol and ethanol (below 65%) yields a CD spectra that mimics the characteristic spectra of C-form DNA, while at concentrations above 70% it gave anomalous spectra, which resemble the A-type spectra, led Girod et al. (1973) to suggest that these spectra might re- sult from condensation of DNA into a compact tertiary structure. Giannoni et al. (1969) have observed hexagonal platelets of DNA crystals, obtained by precipitation of DNA by the addition of ethanol to DNA solutions, in the electron microscope, and the x-ray patterns of these crystals reflect a translational distance of 3.3-3.4 8, between the DNA bases, and a chain folding distance of 23.9 8, between the DNA helices. The observation of such a base distance unequivocably excludes the possibility of the A-form struc- ture of DKA precipitated by ethanol. These patterns suggest the B-form DNA.
The ( L y ~ ~ ~ . L e u ~ ~ ) , , copolymer has 32% leucine (hydro- phobic) residues interspersed between the lysine-charged residues. The increase in a-helix content of this copolymer with increasing ionic strength (Table 111) indicates that this polypeptide has the potential to become helical and might do so when the charges are neutralized by the phosphates of the DNA. These helices may be capable of self-interaction, upon association of this copolymer with DNA, and might be responsible for the condensation of DNA into an anisotrop- ic arrangement of the molecules within the complex, similar to cholesteric liquid crystals, which could generate the huge optical activity, observed in such systems (Robinson, 1961). Robinson et al. (Robinson et al.. 1968; Robinson, 1961) have found cholesteric liquid crystals in poly(y-benzy1-L- glutamate) and in DNA; Spencer et al. (1962) have re- ported similar phenomena in gels of helical RNA. Theoreti- cal considerations by Holzwarth and Holzwarth (1973) showed that cholesteric liquid crystals can produce intense C D in the region of the chromophore and the calculated sign of the Cotton effect can depend upon the relationship between the pitch of the crystalline helix and the frequency of the absorption. However, an opposite sense of chirality of the anisotropic liquid crystals could also give a different sign in CD. Considering the above facts, it is suggested that the A-like C D spectra obtained for the DNA-polypeptide complexes may be due to the condensation of DNA into a
474 B I O C H E M I S T R Y , V O L . 1 5 , N O . 3 , 1 9 1 6
( L Y S , L E U ) P O L Y P E P T I D E - D N A I N T E R A C T I O N S
higher order asymmetric structure, which may be analogous to the phenomena of liquid-crystalline formation. The underlying secondary structure ‘of DNA in such higher order structures need not be altered and the x-ray patterns for the condensed phase of DNA in ethanol (Giannoni et al., 1969) seem to argue against the A-form structure, while the condensed form of poly(L-lysine)-DNA gave x-ray dif- fraction patterns with B-form spacing (Haynes et al., 1970). A similar interpretation of poly(~-Lys)-DNA com- plexes studied by polarized infrared spectra has recently been made (Liquier et al., 1975).
The results (Table V) for the complexes of ( L ~ s ~ ~ ) , ( L ~ u * ~ ) , - D N A are difficult to interpret. It may be that the very long sequences of leucine residues at the tail of the copolymer (probably cy helical) may not be as ef- fective in causing condensation of DNA into a well-ordered asymmetric structure as when they were interspersed throughout the polymer, thereby causing no dramatic changes in the CD with respect to native DNA in solution. Similarly, it was seen that for the (Lys8s),(Leu1S),-DNA complexes at r = 0.1, the observed changes in C D spectra from that of native DNA spectra are relatively small com- pared to the *-type spectra obtained for the same copoly- mer at higher ratios. Also, it is to be noted that histone H2B has a middle apolar region while the apolar region of his- tone H4 is located a t one end of the molecule (Bradbury and Rattle, 1972), and the A-like CD spectrum for H2B- DNA complex is obtained a t r = 0.5 (Adler et al., 1974) while the same type of CD spectrum is not obtained for H4-DNA complex until r reaches 1.5 (Shih and Fasman, 1971; Adler et al., 1975a).
The effect of the secondary structure of the polypeptides upon interaction with DNA and the subsequent effect on the structure of DNA after complexation need to be care- fully investigated. However, it appears from these prelimi- nary studies that the increase in helical content of the co- polymers, due to an increase in the amount of leucine (hy- drophobic) residues, seems to disfavor the *-like C D spec- tra on binding to DNA, and favors the A-like spectra.
The ordered polymer (L-Lys-L-Ala), has been found (Privat et al., 1972) to bind preferentially to AT rich re- gions in DNA, similar to (Lys), and therefore it was con- cluded that sequences of Lys were not required for this specificity. Sponar et al. (1973, 1974) have studied the in- teraction of DNA with several random and sequential ly- sine containing polypeptides using CD measurements. They found that the random copolymers ( L y ~ ~ ~ , A l a ~ ~ ) , and ( L ~ s ~ ~ , A l a ~ ’ ) , assumed a considerable percent of cy helix, and the helicity is more pronounced in 2 M NaCl than in 0.15 M NaCI. The interaction of these copolymers with DNA at 0.15 M NaCl gives an A-like CD which is similar to the spectra herein. On the other hand, the sequential co- polymers (Ala-Lys-Pro),, (Lys-Ala-Gly),, and (Ala-Lys- Lys-Pro-Lys), appear to be mainly in the random coil con- formation, and on interaction with DNA, give CD spectra of the \k form. These studies led them to conclude that the native B-form DNA, existing in aqueous solution, can selec- tively undergo conformational transitions to the A form on interaction with basic polypeptides which are helical, and to C and 9 forms when interacting with nonhelical basic poly- peptides. It was also found that G + C rich DNA produced larger \k spectra upon interaction with (Ala-Lys-Pro),.
The results in this paper on the interaction of DNA with random and block copolymers containing different composi- tions of lysine and leucine residues, as discussed above, are
in general agreement with the findings of Sponar et al. (1973). However, the possibility has been demonstrated that the and A-like CD spectra could reflect a difference in the asymmetric packing organization of the condensed state DNA, and need not result from a conformational change of the B - A or C type. The latter explanation seems the more plausible in light of the x-ray and infrared studies cited above.
In chromatin it is evident that the DNA is condensed (DuPraw, 1968) and the CD spectrum of chromatin is al- tered, compared to that of native B-form DNA (Shih and Fasman, 1970). A plausible model for the packaging of the DNA in the chromosome comes from the studies of Lerman and co-workers (see above). However, the collapsed DNA (*-DNA) induced by phase separation by the addition of polymers and salt can be reproduced by the addition of his- tones or the polypeptides studied herein. This highly folded conformation could result from subunit interactions (Bal- dwin et al., 1975) in chromatin, or as in the model studies, by polypeptide-polypeptide interaction. Studies by Boublik et al. (1970) and Pekary et al. (1975) found that the apolar half of H-4 could be involved in self-aggregation, as could be the middle apolar region of H2B (Bradbury and Rattle, 1972). CD studies (Shih and Fasman, 1971; Adler et al., 1974, 1975a) showed that H-4, H2A, and H2B yield A-like spectra. The basic N fragment of H4 will bind to DNA, but not change the B-type spectra while the apolar C fragment shows little binding. Thus the complete molecule is neces- sary, involving both the basic and nonpolar segments, for interaction with DNA to cause the C D change.
The altered CD spectrum in chromatin is probably not due to a change in secondary structure of the DNA double- helix (B form) as has been frequently proposed. Alterations in the secondary structure of DNA can produce significant C D spectral changes, as shown by theoretical studies (John- son and Tinoco, 1969; Moore and Wagner, 1973; Studdert and Davis, 1974) and experimental measurements (Tunis- Schneider and Maestre, 1970). However, the C D spectra of DNA complexes perhaps should not be completely inter- preted in these terms, when it is now known that higher order structures exist. In all probability the B-form secon- dary structure of DNA is maintained and a superfold, or condensation, occurs which gives the complex a new added highly asymmetric structure, a tertiary structure, producing the new C D spectra. The interaction of the histones with DNA and the concomitant histone-histone subunit interac- tions may be responsible for the new condensed state.
Several years ago Rich (Rich, 1962; North and Rich, 1961) had proposed that a condensed state of DNA in cer- tain bacterial viruses in the interior of intact T2 bacterio- phage and in chromosomes, might consist of chain folded crystalline domains. The specificity of the association of the tetramers with DNA, and the factors dictating the subunit- subunit interaction may lie at the heart of chromosome structure and control of cell regulation.
References Adler, A. J., Fulmer, A. W., and Fasman, G. D. (1975a),
Biochemistry 14, 1445. Adler, A. J., Moran, E., and Fasman, G. D. (1975b), Bio-
chemistry 14. 4179. Adler, A. J., Ross, D. G., Chen, K., Stafford, P. A.,
Woiszwillo, M. J., and Fasman, G. D. (1974), Biochem- istry 13, 616.
Adler, A. J . , Schaffhausen, B., Langan, T. A., and Fasman,
B I O C H E M I S T R Y , V O L . 1 5 , N O . 3 , 1 9 7 6 475

O N G , S N E L L , A N D F A S M A N
G. D. (1971), Biochemistry 10, 909. Akimenko, N. M., Dijakowa, E. B., Evdokimov, Yu. M.,
Frisman, E. V., and Varshavsky, Ya. M. (1973), FEBS Lett. 38, 6 1 .
Baldwin, J . P., Boseley, P. G., Bradbury, E. R., and Ibel, K. ( 1 9 7 9 , Nature (London) 253, 245.
Boublik, M., Bradbury, E. M., and Crane-Robinson, C. (1970), Eur. J . Biochem. 14, 497.
Bradbury, E. M., Cary, P. D., Crane-Robinson, C., and Rattle, H. W. E. (1973), Ann. N.Y. Acad. Sci. 222, 266.
Bradbury, E. M., and Rattle, H. W. E. (1972), Eur. J . Bio- chem. 27, 270.
Brahms, J., and Mommaerts, W. F. H . M. (1964), J . Mol. Biol. 10, 73.
Bram, S. , Butler-Browne, G., Bradbury, E. M., Baldwin, J., Reiss, C., and Ibel, K. (1974), Biochemie, 56, 987.
Bram, S. , and Ris, H. (1971), J . Mol. Biol. 55, 325. Brunner, W. C., and Maestre, M. F. (1974), Biopolymers
Carroll, D. (1 97 l ) , Anal. Biochem. 44, 496. Carroll, D. (1972), Biochemistry 1 1 , 421. Chang, C., Weiskopf, M., and Li, H. J. (1973), Biochemis-
Cheng, S. M., and Mohr, S. C . (1974), FEBS Lett. 49, 37. Cheng, S. M., and Mohr, S. C. (1975), Biopolymers 14,
Chou, P. Y., and Fasman, G. D. (1974), Biochemistry 13,
Coates, J . H., and Jordan, D. 0. (1960), Biochim. Biophys.
Davidson, B., and Fasman, G. D. (1969), Biochemistry 8,
Dorman, B. P., Hearst, J. E., and Maestre, M. F. (1973),
DuPraw, E. J . (1968), Cell and Molecular Biology, New
Evdokimov, Yu. M., Platonov, A. L., Tikhonenko, A. S.,
Fasman, G. D., Idelson, M., and Blout, E. R . (1961), J .
Fasman, G. D., Lindblow, C., and Bodenheimer, E. (1 964),
Fasman, G. D., Schaffhausen, B., Goldsmith, L., and Adler,
Flory, P. J. (1961), J . Polym.Sci. 49, 105. Frisman, E. V., Veselkov, A . N., Slonitsky, S. V., Karavaev,
L. S., and Vorob’ev, V. I. (1974), Biopolymers 13, 2169. Fuller, W., Wilkins, M. H. F., Wilson, H. R., and Hamil-
ton, L. D. (1965), J . Mol. Biol. 12, 60. Giannoni, G., Padden, F. J., Jr., and Keith, H. D. (1969),
Proc. Natl. Acad. Sci. U.S.A. 62, 964. Girod, J . C., Johnson, W. C., Jr., Huntington, S. K., and
Maestre, M . F. (1 973), Biochemistry 12, 5092. Haynes, M., Garrett, R. A., and Gratzer, W. B. (1970),
Biochemistry 9, 4410. Henson, P., and Walker, I. 0. (1971), Eur. J . Biochem. 22,
1 . Herskovits, T. T., Singer, S. J., and Geiduschek, E. P.
(1961), Arch. Biochem. Biophys. 94, 99. Holzwarth, G., and Holzwarth, N. A. W. (1973), J . Opt.
Soc. A m . 63, 324. Ivanov, V. I . , Michenkova, L. E., Schyolkina, A. K., and
Poletayev, A. I. (1973), Biopolymers 12, 89. Johnson, W. C. , Jr . , and Girod, J . C . (1974), Biochim. Bio-
phys. Acta 353, 193.
13, 345.
try 12. 3028.
663.
21 1 .
Acta 43, 214.
41 16.
Methods Enzymol. 27, 767.
York, N.Y., Academic Press.
and Varshavsky, Ya. M. (1972), FEBS Lett. 23, 180.
Am. Chem. SOC. 83, 709.
Biochemistry 3, 155.
A. (1970), Biochemistry 9, 2814.
Johnson, W. C., Jr., and Tinoco, I., Jr. (1969), Biopolymers
Jordan, C. F., Lerman, L. S., and Venable, J. H . (1972),
Lang, D. (1973), J . Mol. Biol. 78, 247. Langridge, R., Wilson, H. R., Hooper, C . W., Wilkins, M.
H. F., and Hamilton, L. D. (1960), J . Mol. Biol. 2, 19. Lerman, L. S. (1973a), Physico-Chemical Properties of
Nucleic Acids, Vol. 3, Duchesne, J., Ed., New York, N.Y., Academic Press, p 59.
Lerman, L. S.. (1973b), Cold Spring Harbor Symp. Quant. Biol. 38, 59.
Li, H. J., Epstein, P., Yu, S. S., and Brand, B. (1974), Nu- cleic Acids Res. l , 137 l .
Liquier, J., Pinot-Lafaix, M., Taillandier, E., and Brahms, J. (1975), Biochemistry 14, 4191.
Maestre, M. F., and Wang, J. C. (1971), Biopolymers 10, 1021.
Maniatis, T., Venable, J . H. , Jr., and Lerman, L. S. (1974), J . Mol. Biol. 84, 37.
Marvin, D. A., Spencer, M., Wilkins, M. H. F., and Hamil- ton, L. D. (1961), J . Mol. Biol. 3, 547.
Moore, D. S., and Wagner, T. E. (1973), Biopolymers 12, 201.
North, A. C. T., and Rich, A. (1961), Nature (London) 191, 1242.
Olins, D. E., O h , A. L., and von Hippel, P. H . (1967), J . Mol. Biol. 24, 157.
Pardon, J . F., and Wilkins, M. H . F. (1972), J . Mol. Biol. 68, 115.
Pekary, A. E., Li, H.-J., Chan, S. I., Hsu, C. J., and Wag- ner, T. E. (1975), Biochemistry 14, 1177.
Privat, J . P., Spach, G., and Leng, M. (1972), Eur J . Bio- chem. 26, 90.
Ramm, E. J . , Vorob’ev, V. I., Birnshtein, T. M., Bolotina, I. A,, and Volkenshtein, M. V. (1972), Eur. J . Biochem. 25, 245.
7, 727.
Nature (London), New Biol. 236, 67.
Rich, A. ( 1 962), Proc. Pontifical Acad. Sci. 22, 27 1 . Rill, R., and Van Holde, K. E. (1973), J . Biol. Chem. 248,
Robinson, C. (1961), Tetrahedron 13, 219. Robinson, C., Ward, J . C., and Beevers, R . B. (1968), Dis-
Santella, R . M., and Li, H. J. (1974), Biopolymers 13,
Shapiro, J . T., Leng, M., and Felsenfeld, G. (1969), Bio-
Shih, T. Y., and Fasman, G. D. (1970), J . Mol. Biol. 52,
Shih, ’r. Y., and Fasman, G. D. (1971), Biochemistry 10,
Smerdon, M. J., and Isenberg, I. (1974), Biochemistry 13,
Snell, C. R., and Fasman, G. D. (1972), Biopolymers 1 1 ,
Spencer, M., Fuller, W., Wilkins, M. H. F., and Brown, G.
Sponar, J., Blaha, K., and Stokrova, S. (1973), Stud. Bio-
Sponar, J., and Fric, I. (1972), Biopolymers 11, 23 17. Sponar, J., Stokrova, S., Koruna, I . , and Blaha, K.
(1974), Collect. Czech. Chem. Commun. 39, 1625. Studdert, D. S., and Davis, R. C. (1974), Biopolymers 13,
1377. Tunis-Schneider, M. J., and Maestre, M . F. (1970), J . Mol.
1080.
cuss. Faraday Soc. No. 25, 29.
1909.
chemistry 8, 3219.
125.
1675.
4046.
1723.
L. (1962), Nature (London) 194, 1014.
phys. 40, 125.
476 B I O C H E M I S T R Y . V O L . 1 5 . N O . 3 , 1 9 7 6

( L Y S , L E U ) P O L Y P E P T I D E - D N A I N T E R A C T I O N S
Biol. 52, 521.
( 1 974), Nucleic Acids Res. 1, 1579.
(1973), Stud. Biopkys. 40, 41.
Yu, S. S . , Epstein, P., and Li, H. J. (1974), Biochemistry
Zama, M. (1974), Biochim. Biophys. Acta 366, 124. Zimmer, Ch., Burckhardt, G., and Luck, G. (1973), Stud.
Van Holde, K. E., Sahasrabuddhe, C. G., and Shaw, B. R.
Varshavsky, Va. M., Evdokimov, Yu. M., and Akimenko
13, 3713.
Biophys. 40, 57.
Chromatin Models. Thermal Denaturation Studies of ( Lysx, LeuY),- and (Lys),( Leu),-DNA Complexes?
Edith C. Ongt and Gerald D. Fasman*
ABSTRACT: The structural transitions of (LysX,LeuY),- DNA and (Lys"),(Leuy),-DNA complexes have been studied by thermal denaturation utilizing simultaneous ab- sorption and circular dichroism (CD) measurements [R. Mandel and G. D. Fasman (1974), Biochem. Biophys. Res. Commun. 59, 6721. These complexes are used as models for nucleohistones. At amino acid/nucleotide ratios r < 1, the copolymers bind to DNA in a ratio of one amino acid resi- due per nucleotide, and such binding stabilizes the DNA double helix against thermal denaturation relative to the unbound regions. The leucine residues in the copolymers stabilize the bound portion of the complex against thermal denaturation but to a lesser degree than does poly(L1ysine). This study confirms the hypothesis that absorption melting profiles reflect only the change in secondary structure
T h e helix-coil transition of the DNA double helix can be induced by acid, base, or temperature (Bloomfield et al., 1974). Thermal denaturation has been used to study the stability of the DNA helix, and the forces which govern this stability. As such it has been used to determine the base composition of the DNA helix (Marmur and Doty, 1962), the conformational properties, and other thermodynamic parameters (Lazurkin et al., 1970).
In an effort to understand the structure of chromatin, thermal denaturation has been widely used to investigate the structure of nucleohistones (Henson and Walker, 1970; Subirana, 1973; Li, 1973; Li et al., 1973; Chang and Li, 1974; Wilhelm et al., 1974a,b; Bram et al., 1974; Adler et al., 1975). Complexes of DNA with synthetic polypeptides, which are assumed to be models for nucleohistones, have been similarly studied (Olins et al., 1967; Privat et al., 1972; Mandel and Fasman, 1974; Li et al., 1974a,b; Santel- la and Li, 1974; Pinkston and Li, 1974; Sponar et al., 1974, R. Mandel and G. D. Fasman, to be published). The rela-
+This is publication No. 1047 from the Graduate Department of Biochemistry, Brandeis University, Waltham, Massachusetts 02154. Received May 27, 1975. This research was supported in part by grants from the U S . Public Health Service (GM 17533). National Science Foundation (GB 29204X). and the American Cancer Society (P-577). * Present address: Gillette Company, Gillette Park, Boston, Massa- chusetts 02106.
* Author to whom inquiries should be made. John Simon Guggen- heim Fellow, 1974-1975.
(helix-coil transition) of DNA. It was found that, in the ab- sence of a higher ordered structure (condensed), the CD melting profile also reflects this same conformational tran- sition, and the melting temperatures, T,, in CD are equal to those in absorption. However, when a higher ordered structure (tertiary) exists in the complex, then the CD melt- ing profile will be dominated by the structural transitions related to the melting of the higher ordered asymmetric structure in the condensed state, followed by the melting of the secondary structure. Under such circumstances, the T , obtained from absorption may be slightly different from that of the CD, since only the secondary structural changes are being reflected in absorption. The relevance of these studies to the structure of chromatin is discussed.
tive strength of binding of proteins or polypeptides to DNA, the nature and extent of such binding, and the effect of such binding on the stability of the DNA double helix can be ob- tained in this manner.
The thermal denaturation technique with simultaneous absorption and circular dichroism (CD) measurements de- veloped by Mandel and Fasman (1 974) is utilized herein to investigate the binding properties of block and random co- polymers with different lysine and leucine compositions to DNA, and to study their effect on the structure and the sta- bility of the DNA double helix.
Materials and Methods Sample Preparation. Calf thymus DNA was prepared
according to the procedure of Adler et al. (1971). The vari- ous block and random copolymers with different lysine and leucine compositions were previously reported (Snell and Fasman, 1972; Ong et al., 1976). The complexes of DNA with the polypeptides used were made up according to the procedures given in the preceding paper (Ong et al., 1976). The annealed complexes, at the end of a linear gradient di- alysis from 1.5 M NaCl X M EDTA at pH 7.0 f 0.1 to 0.15 M NaCl X M EDTA (pH 7.0 f O . l ) , are then exponentially dialyzed twice against 2 1. of 2.5 X M EDTA solution (pH 7.0 f 0.1) over a period of 7-8 h. The dialyses of the complexes were performed at 4'. Concentra- tions of DNA, after dialysis, were determined by perchlo- rate digestion (Adler et al., 1971).
B I O C H E M I S T R Y , V O L . 1 5 , N O . 3 , 1 9 7 6 477


![Dynamic tuning of enhanced intrinsic circular dichroism in ......power [73], and (DNA) origami templates [74–83], which pave the way for realizing chiroptically active devices. Recently,](https://img.pdfslide.us/doc/110x75/60ec4b8266522c25f9409276/dynamic-tuning-of-enhanced-intrinsic-circular-dichroism-in-power-73-and.jpg)