Embed Size (px)
Citation preview
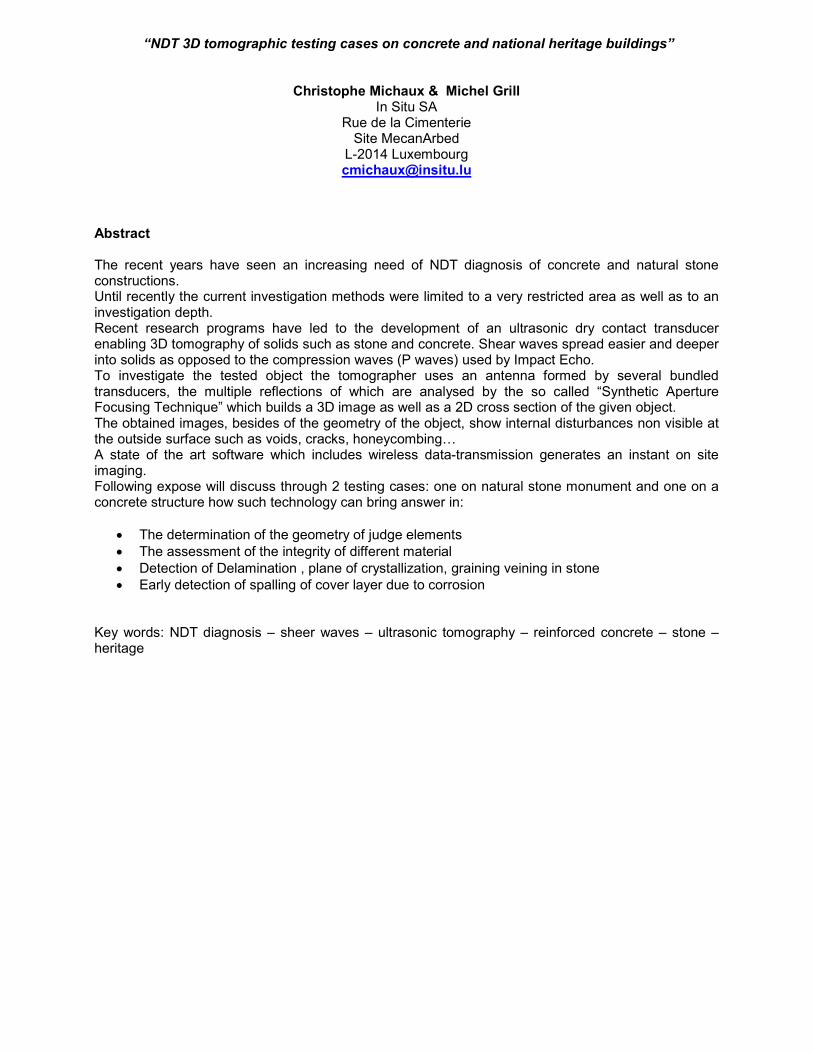
“NDT 3D tomographic testing cases on concrete and national heritage buildings”
Christophe Michaux & Michel Grill In Situ SA
Rue de la Cimenterie Site MecanArbed
L-2014 Luxembourg [email protected]
Abstract The recent years have seen an increasing need of NDT diagnosis of concrete and natural stone constructions. Until recently the current investigation methods were limited to a very restricted area as well as to an investigation depth. Recent research programs have led to the development of an ultrasonic dry contact transducer enabling 3D tomography of solids such as stone and concrete. Shear waves spread easier and deeper into solids as opposed to the compression waves (P waves) used by Impact Echo. To investigate the tested object the tomographer uses an antenna formed by several bundled transducers, the multiple reflections of which are analysed by the so called “Synthetic Aperture Focusing Technique” which builds a 3D image as well as a 2D cross section of the given object. The obtained images, besides of the geometry of the object, show internal disturbances non visible at the outside surface such as voids, cracks, honeycombing… A state of the art software which includes wireless data-transmission generates an instant on site imaging. Following expose will discuss through 2 testing cases: one on natural stone monument and one on a concrete structure how such technology can bring answer in:
• The determination of the geometry of judge elements
• The assessment of the integrity of different material
• Detection of Delamination , plane of crystallization, graining veining in stone
• Early detection of spalling of cover layer due to corrosion Key words: NDT diagnosis – sheer waves – ultrasonic tomography – reinforced concrete – stone – heritage
1 MIRA TECHNOLOGY 1.1 BACKGROUND
The MIRA equipment is not based on any new test concept, rather a merging of well-known stress wave
propagation principles and the advent and application of advanced hardware and analysis software
packages.
Two major developments gave birth to the MIRA technology:
• Low frequency Dry Point Contact (DPC) ultrasonic transducers
• Synthetic Aperture Focused Technique (SAFT)
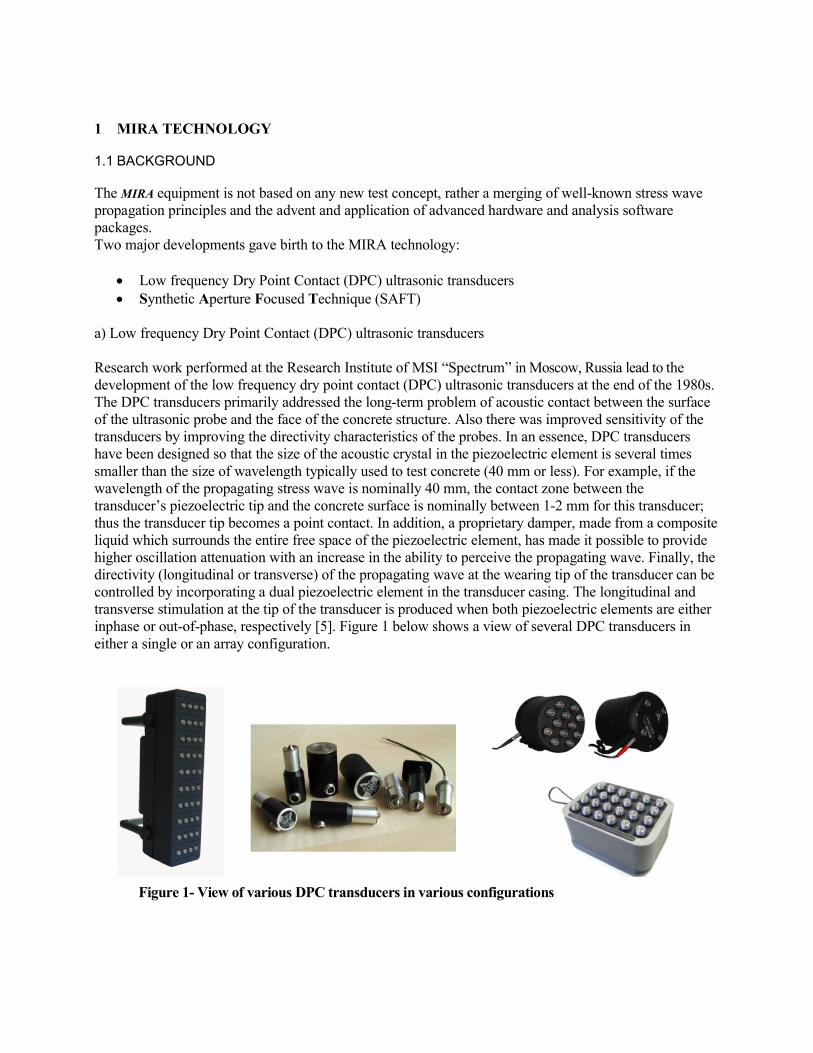
a) Low frequency Dry Point Contact (DPC) ultrasonic transducers
Research work performed at the Research Institute of MSI “Spectrum” in Moscow, Russia lead to the
development of the low frequency dry point contact (DPC) ultrasonic transducers at the end of the 1980s.
The DPC transducers primarily addressed the long-term problem of acoustic contact between the surface
of the ultrasonic probe and the face of the concrete structure. Also there was improved sensitivity of the
transducers by improving the directivity characteristics of the probes. In an essence, DPC transducers
have been designed so that the size of the acoustic crystal in the piezoelectric element is several times
smaller than the size of wavelength typically used to test concrete (40 mm or less). For example, if the
wavelength of the propagating stress wave is nominally 40 mm, the contact zone between the
transducer’s piezoelectric tip and the concrete surface is nominally between 1-2 mm for this transducer;
thus the transducer tip becomes a point contact. In addition, a proprietary damper, made from a composite
liquid which surrounds the entire free space of the piezoelectric element, has made it possible to provide
higher oscillation attenuation with an increase in the ability to perceive the propagating wave. Finally, the
directivity (longitudinal or transverse) of the propagating wave at the wearing tip of the transducer can be
controlled by incorporating a dual piezoelectric element in the transducer casing. The longitudinal and
transverse stimulation at the tip of the transducer is produced when both piezoelectric elements are either
inphase or out-of-phase, respectively [5]. Figure 1 below shows a view of several DPC transducers in
either a single or an array configuration.
Figure 1- View of various DPC transducers in various configurations
b) Synthetic Aperture Focused Technique (SAFT)
Assessment of internal flaws in concrete structures has been traditionally performed using point by point
stress wave propagation methods; for example, test methods of UPV (using two transducers) or pulse-
echo methods (using one transducer) are placed at a point to evaluate that point. In both cases,
longitudinal waves are typically employed and analyzed to assess the condition of the test concrete at that
point. With the constant improvement in computing power (faster computers), the ability to acquire fast
data is most useful. More recently, however, data obtained from traditional ultrasonic stress wave
propagation methods, combined with imaging reconstruction techniques have led to development of
analysis software capable of imaging concrete in a manner similar to the medical radiology profession
using magnetic resonance imaging (MRI) techniques. The MRI technique is, almost in real time.
Because of the heterogeneity nature of concrete, many combinations of data points are required to map
out and accurately reconstruct an image depicts the internal condition. To overcome this obstacle, spatial
averaging of a large number of single measurements per unit area under testing is typically performed
using an array of low frequency, short pulse, dry point contact (DPC) transducers and a mathematical
algorithm that uses a 3D synthetic aperture focusing technique (SAFT). SAFT is a signal processing tool
used to improve the resolution of an ultrasonic image with focusing distortion. 1.2 TEST METHOD AND SYSTEM
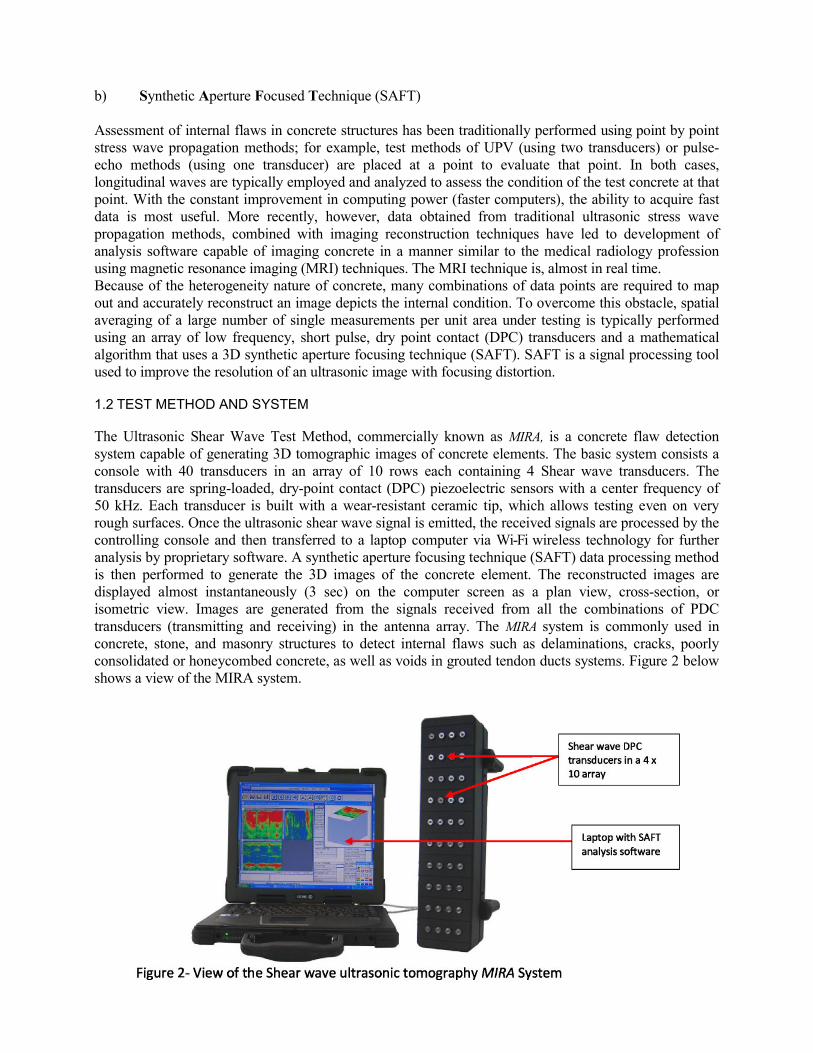
The Ultrasonic Shear Wave Test Method, commercially known as MIRA, is a concrete flaw detection
system capable of generating 3D tomographic images of concrete elements. The basic system consists a
console with 40 transducers in an array of 10 rows each containing 4 Shear wave transducers. The
transducers are spring-loaded, dry-point contact (DPC) piezoelectric sensors with a center frequency of
50 kHz. Each transducer is built with a wear-resistant ceramic tip, which allows testing even on very
rough surfaces. Once the ultrasonic shear wave signal is emitted, the received signals are processed by the
controlling console and then transferred to a laptop computer via Wi-Fi wireless technology for further
analysis by proprietary software. A synthetic aperture focusing technique (SAFT) data processing method
is then performed to generate the 3D images of the concrete element. The reconstructed images are
displayed almost instantaneously (3 sec) on the computer screen as a plan view, cross-section, or
isometric view. Images are generated from the signals received from all the combinations of PDC
transducers (transmitting and receiving) in the antenna array. The MIRA system is commonly used in
concrete, stone, and masonry structures to detect internal flaws such as delaminations, cracks, poorly
consolidated or honeycombed concrete, as well as voids in grouted tendon ducts systems. Figure 2 below
shows a view of the MIRA system.
2 TESTING CASE 1: Heritage / Palace of justice of Brussels
This huge historic stone monument was erected in 1866. It is constituted of masonry, structural natural
stones and esthetics stones.
2.1 Geometry of huge stones
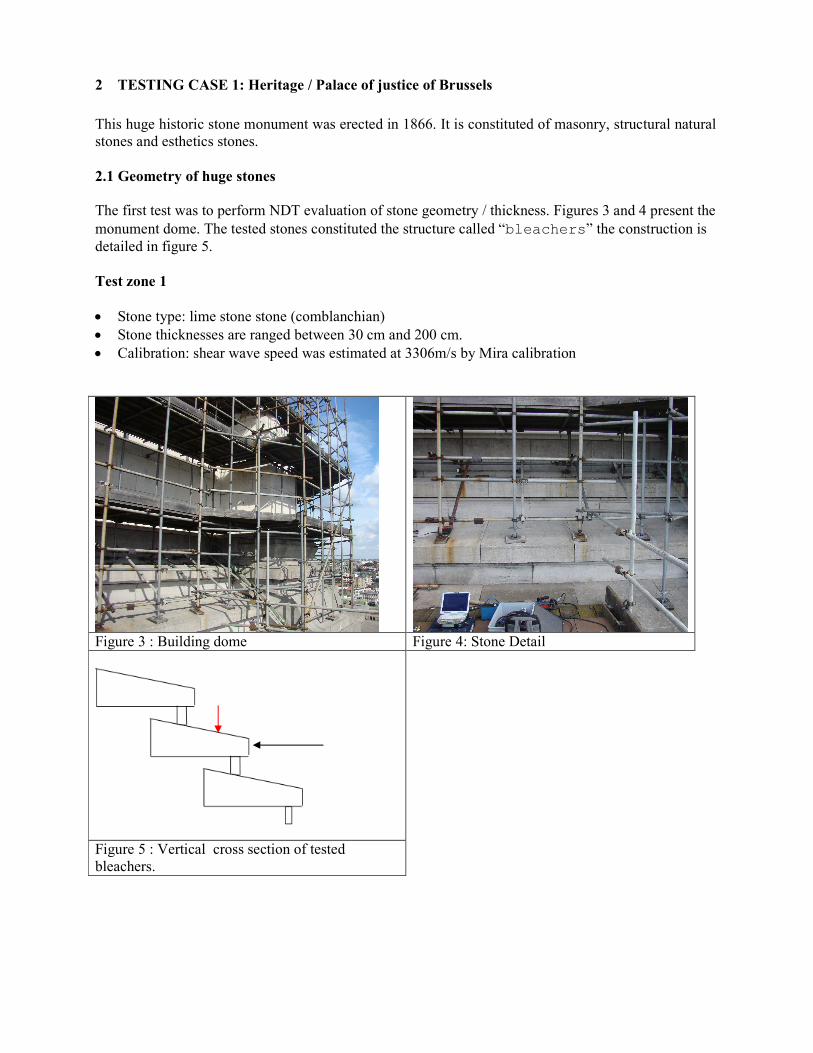
The first test was to perform NDT evaluation of stone geometry / thickness. Figures 3 and 4 present the
monument dome. The tested stones constituted the structure called “bleachers” the construction is
detailed in figure 5.
Test zone 1
• Stone type: lime stone stone (comblanchian)
• Stone thicknesses are ranged between 30 cm and 200 cm.
• Calibration: shear wave speed was estimated at 3306m/s by Mira calibration
Figure 3 : Building dome Figure 4: Stone Detail
Figure 5 : Vertical cross section of tested
bleachers.
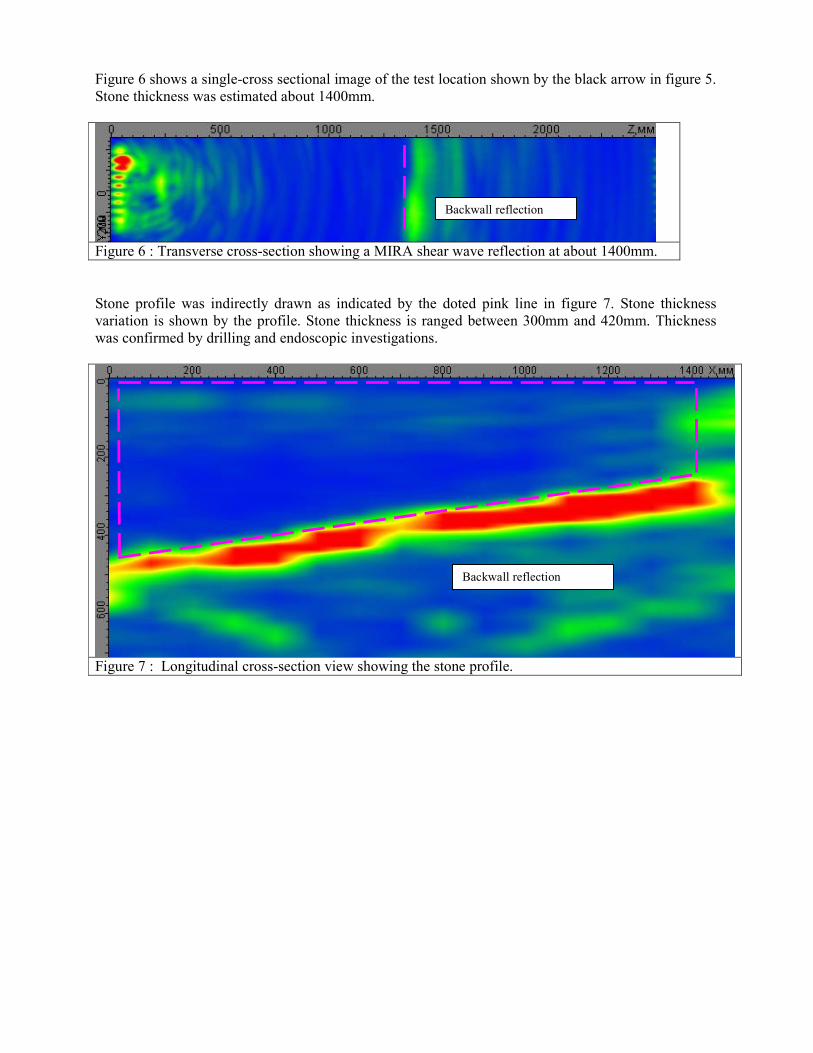
Figure 6 shows a single-cross sectional image of the test location shown by the black arrow in figure 5.
Stone thickness was estimated about 1400mm.
Figure 6 : Transverse cross-section showing a MIRA shear wave reflection at about 1400mm.
Stone profile was indirectly drawn as indicated by the doted pink line in figure 7. Stone thickness
variation is shown by the profile. Stone thickness is ranged between 300mm and 420mm. Thickness
was confirmed by drilling and endoscopic investigations.
Figure 7 : Longitudinal cross-section view showing the stone profile.
Backwall reflection
Backwall reflection
Test zone 2
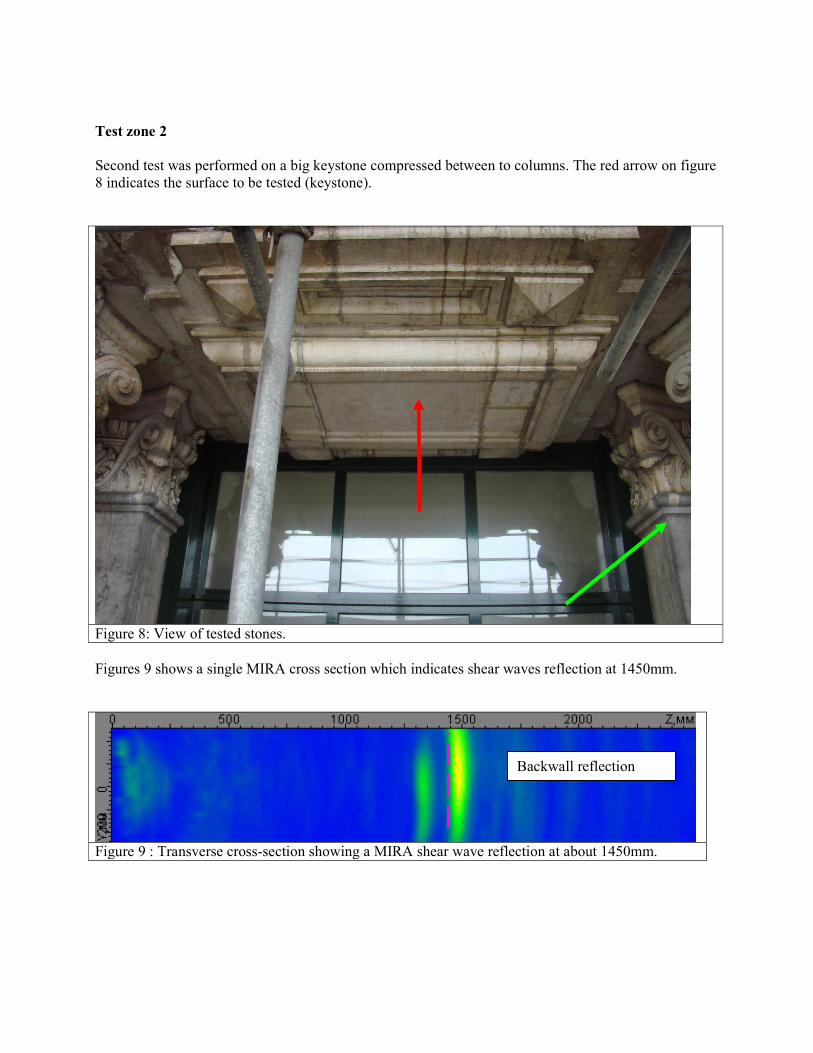
Second test was performed on a big keystone compressed between to columns. The red arrow on figure
8 indicates the surface to be tested (keystone).
Figure 8: View of tested stones.
Figures 9 shows a single MIRA cross section which indicates shear waves reflection at 1450mm.
Figure 9 : Transverse cross-section showing a MIRA shear wave reflection at about 1450mm.
Backwall reflection
2.2 Integrity of stones
Mira was used on different stones to evaluate their integrity:
� Homogeneity of the tested material � Detection of delamination, plane of crystallization, graining veining, stylolite
a) Homogeneity
Figures 6, 7, 9 indicate no or very few reflections between the tested surface and the back wall, even at
a high contrast level in 3D imaging. So we can conclude that the tested material is rather homogenous.
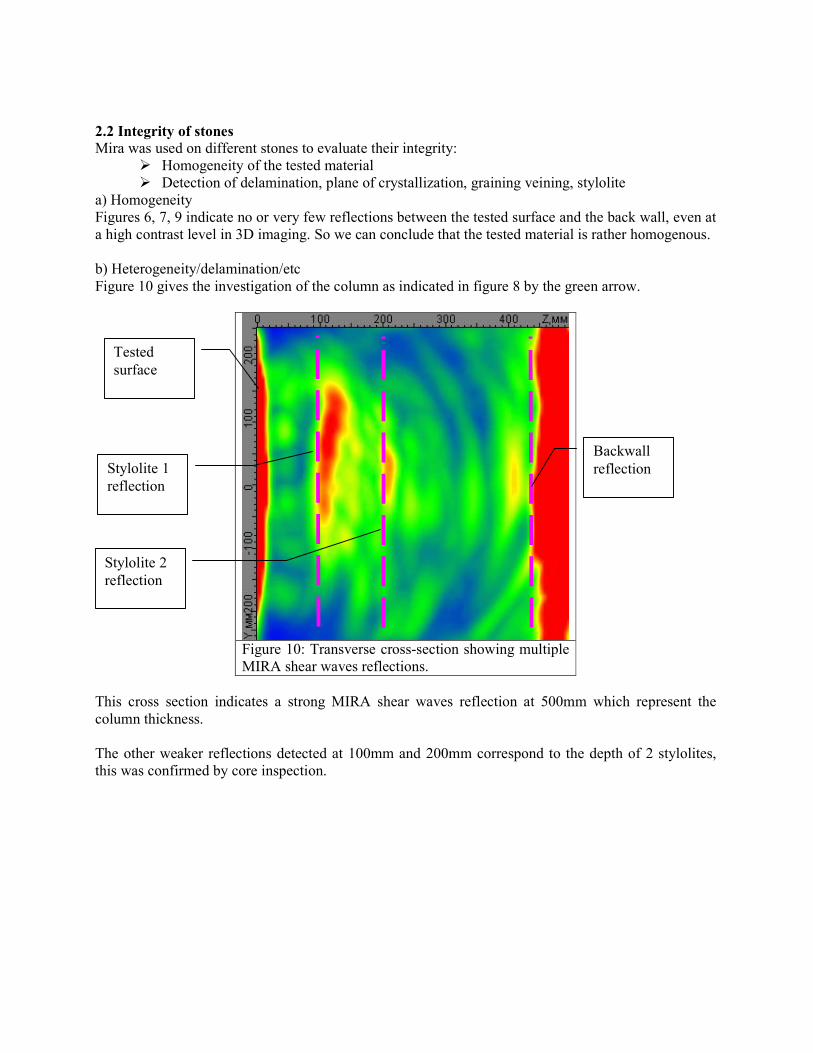
b) Heterogeneity/delamination/etc
Figure 10 gives the investigation of the column as indicated in figure 8 by the green arrow.
Figure 10: Transverse cross-section showing multiple
MIRA shear waves reflections.
This cross section indicates a strong MIRA shear waves reflection at 500mm which represent the
column thickness.
The other weaker reflections detected at 100mm and 200mm correspond to the depth of 2 stylolites,
this was confirmed by core inspection.
Backwall
reflection
Tested
surface
Stylolite 1
reflection
Stylolite 2
reflection
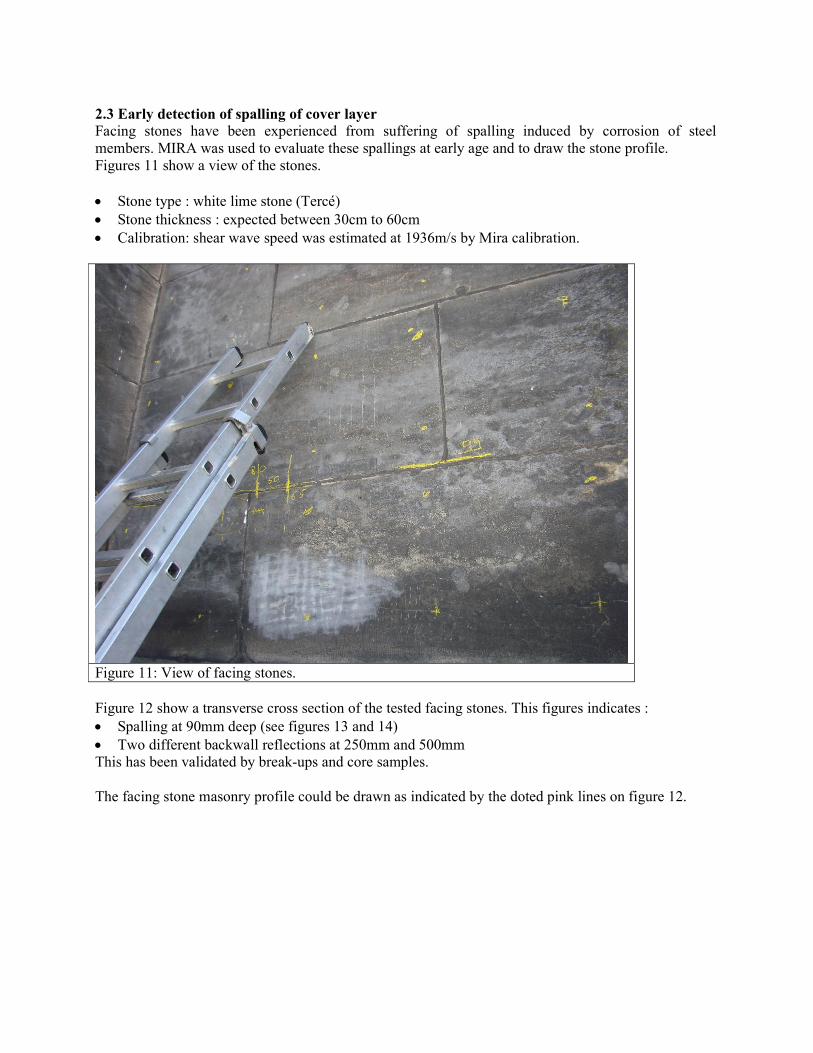
2.3 Early detection of spalling of cover layer
Facing stones have been experienced from suffering of spalling induced by corrosion of steel
members. MIRA was used to evaluate these spallings at early age and to draw the stone profile.
Figures 11 show a view of the stones.
• Stone type : white lime stone (Tercé)
• Stone thickness : expected between 30cm to 60cm
• Calibration: shear wave speed was estimated at 1936m/s by Mira calibration.
Figure 11: View of facing stones.
Figure 12 show a transverse cross section of the tested facing stones. This figures indicates :
• Spalling at 90mm deep (see figures 13 and 14)
• Two different backwall reflections at 250mm and 500mm
This has been validated by break-ups and core samples.
The facing stone masonry profile could be drawn as indicated by the doted pink lines on figure 12.
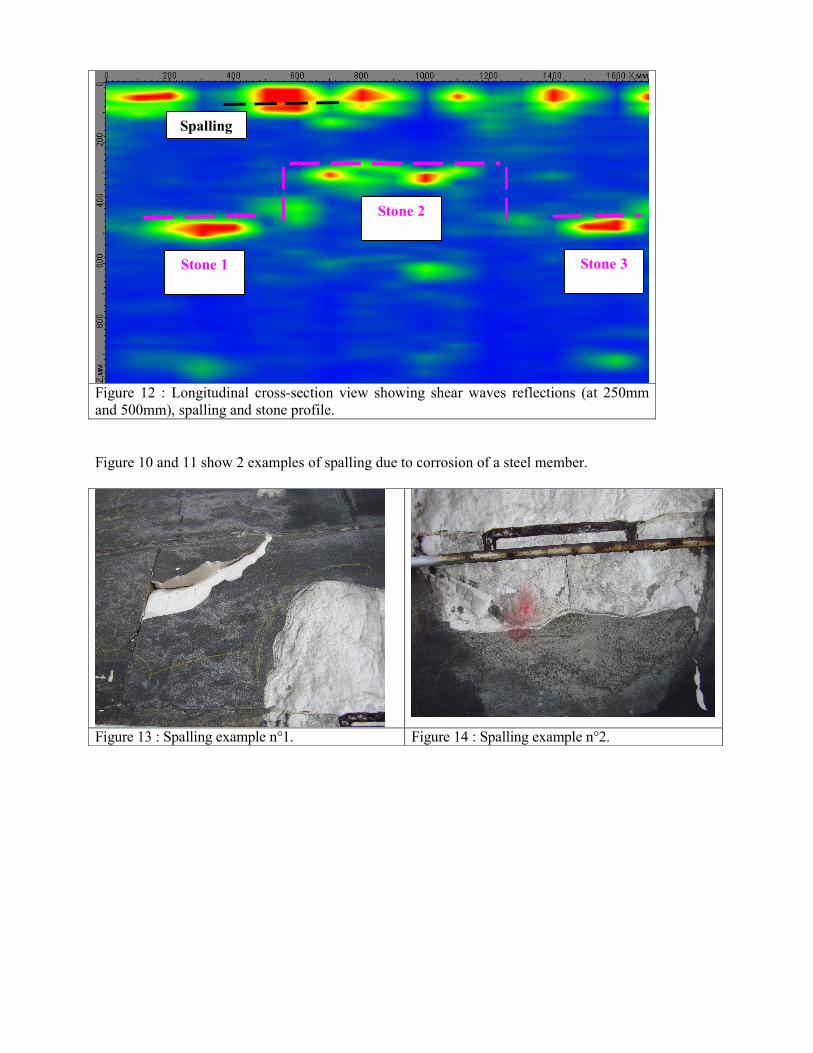
Figure 12 : Longitudinal cross-section view showing shear waves reflections (at 250mm
and 500mm), spalling and stone profile.
Figure 10 and 11 show 2 examples of spalling due to corrosion of a steel member.
Figure 13 : Spalling example n°1. Figure 14 : Spalling example n°2.
Stone 1 Stone 3
Stone 2
Spalling
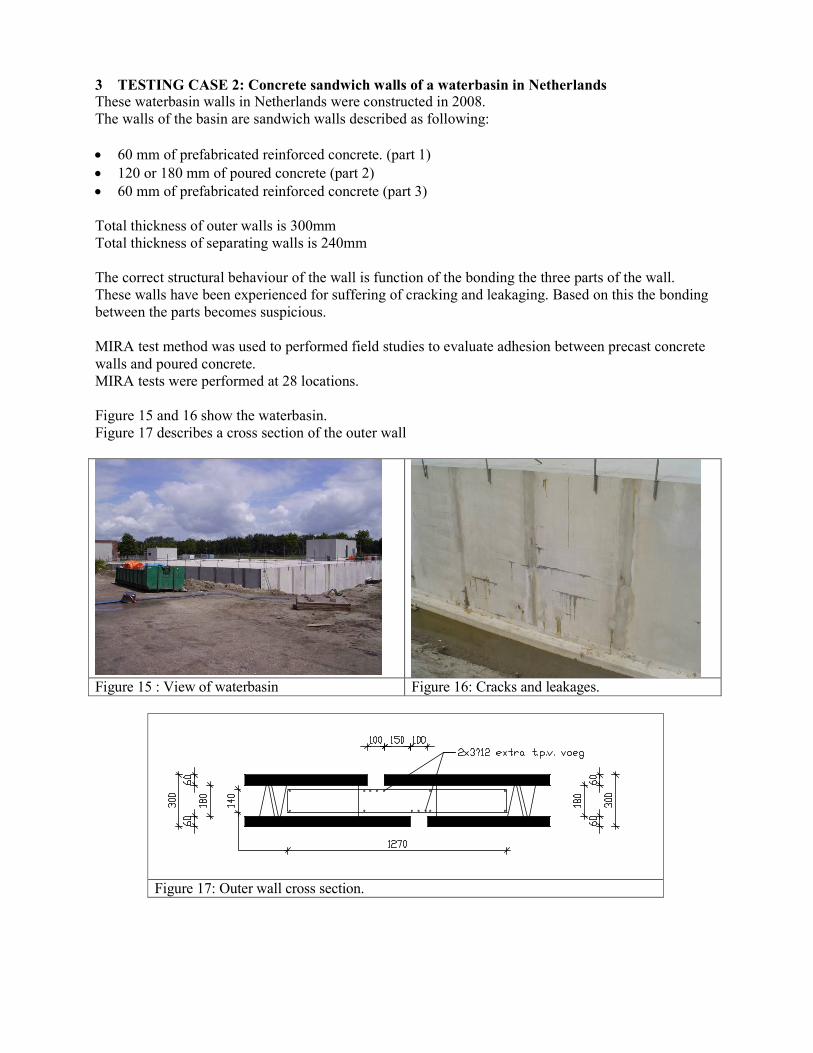
3 TESTING CASE 2: Concrete sandwich walls of a waterbasin in Netherlands These waterbasin walls in Netherlands were constructed in 2008.
The walls of the basin are sandwich walls described as following:
• 60 mm of prefabricated reinforced concrete. (part 1)
• 120 or 180 mm of poured concrete (part 2)
• 60 mm of prefabricated reinforced concrete (part 3)
Total thickness of outer walls is 300mm
Total thickness of separating walls is 240mm
The correct structural behaviour of the wall is function of the bonding the three parts of the wall.
These walls have been experienced for suffering of cracking and leakaging. Based on this the bonding
between the parts becomes suspicious.
MIRA test method was used to performed field studies to evaluate adhesion between precast concrete
walls and poured concrete.
MIRA tests were performed at 28 locations.
Figure 15 and 16 show the waterbasin.
Figure 17 describes a cross section of the outer wall
Figure 15 : View of waterbasin Figure 16: Cracks and leakages.
Figure 17: Outer wall cross section.
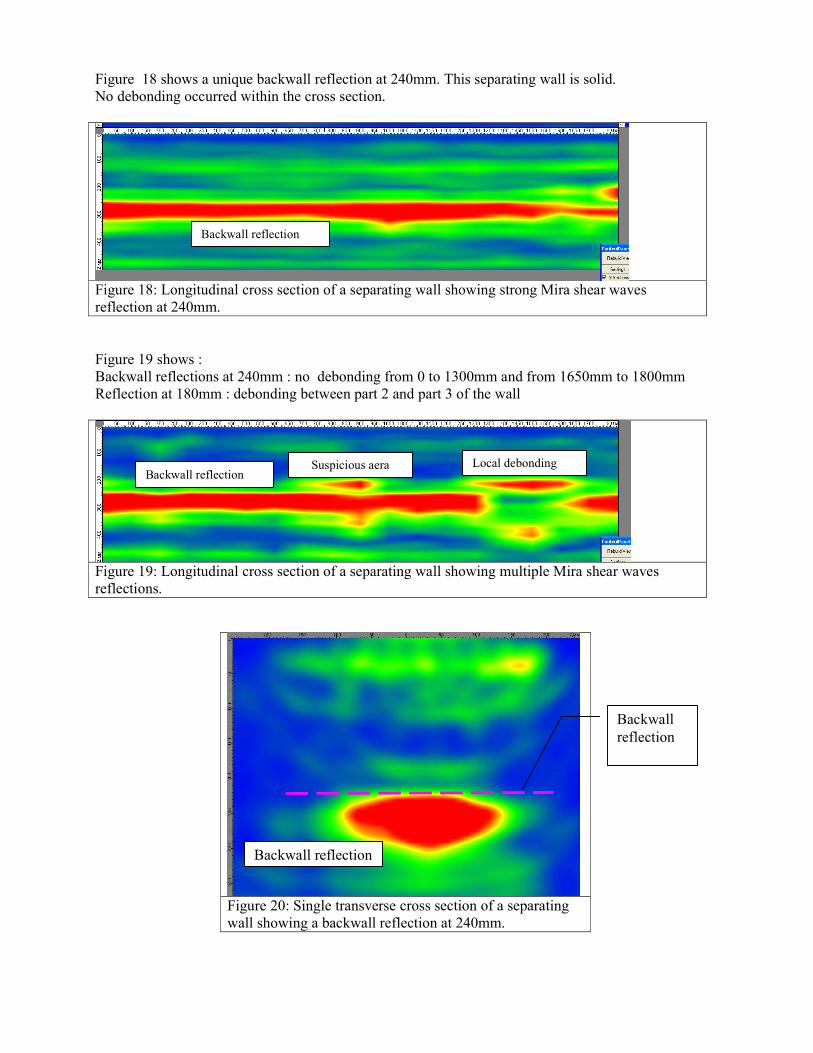
Figure 18 shows a unique backwall reflection at 240mm. This separating wall is solid.
No debonding occurred within the cross section.
Figure 18: Longitudinal cross section of a separating wall showing strong Mira shear waves
reflection at 240mm.
Figure 19 shows :
Backwall reflections at 240mm : no debonding from 0 to 1300mm and from 1650mm to 1800mm
Reflection at 180mm : debonding between part 2 and part 3 of the wall
Figure 19: Longitudinal cross section of a separating wall showing multiple Mira shear waves
reflections.
Figure 20: Single transverse cross section of a separating
wall showing a backwall reflection at 240mm.
Backwall reflection Local debonding
Backwall reflection
Suspicious aera
Backwall
reflection
Backwall reflection
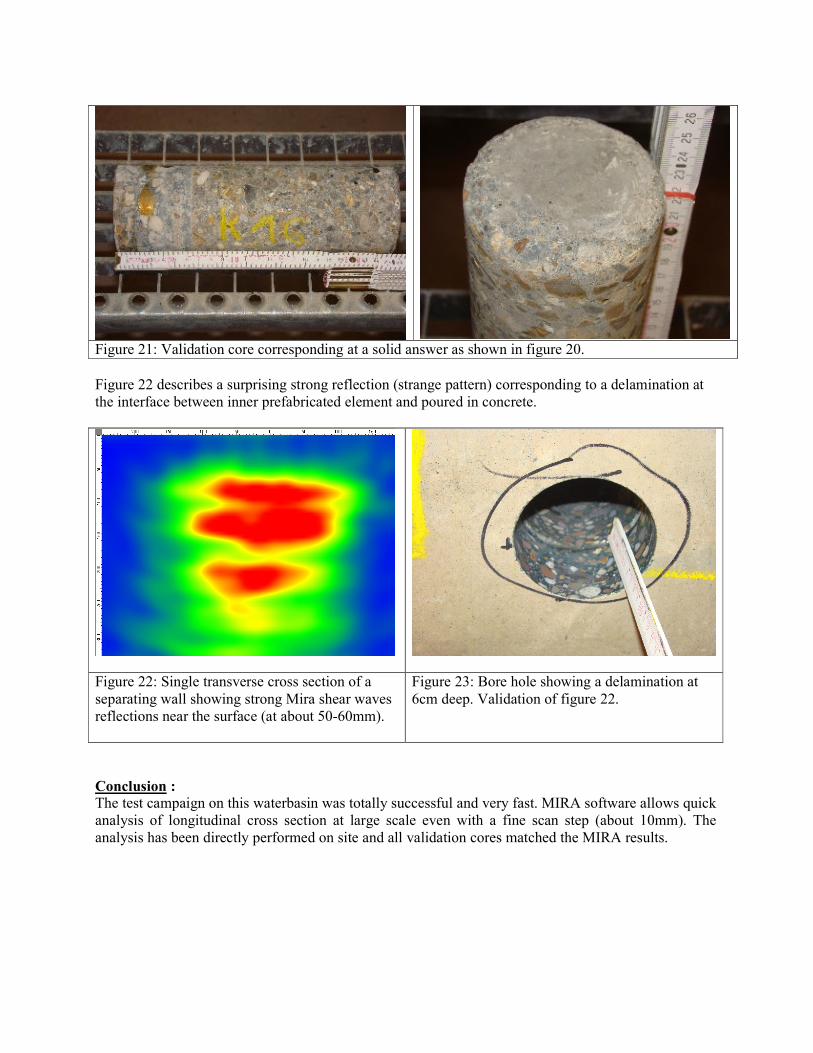
Figure 21: Validation core corresponding at a solid answer as shown in figure 20.
Figure 22 describes a surprising strong reflection (strange pattern) corresponding to a delamination at
the interface between inner prefabricated element and poured in concrete.
Figure 22: Single transverse cross section of a
separating wall showing strong Mira shear waves
reflections near the surface (at about 50-60mm).
Figure 23: Bore hole showing a delamination at
6cm deep. Validation of figure 22.
Conclusion :
The test campaign on this waterbasin was totally successful and very fast. MIRA software allows quick
analysis of longitudinal cross section at large scale even with a fine scan step (about 10mm). The
analysis has been directly performed on site and all validation cores matched the MIRA results.
4 GENERAL CONCLUSIONS
MIRA technology is a new technique still in development and very promising. It allows on site quick
assessment on material integrity. 3D image technique makes the results outmost convenient to analyze.
As already experienced on concrete reinforced structures for voids location, delamination, poorly
consolidated zones, MIRA system is also efficient to analyze natural stones structures. Our last
experiences demonstrate that this user-friendly technology could be used to analyze larger depths, more
than 1,50m, maybe 2,00m. Furthermore, it allows multiple defects at different depths.
This technique has been successfully experienced for cable duct detection and their grouting defect
evaluation. This subject need still further evaluation and in particular for deep multiple cables.
As every new technique, MIRA needs improvement and is suffering from a lack of experiences return.
The capability and the limitation of the system are still not defined yet. New improvements in software
interface and waves analysis are expected in the future. As end-users and developers are working on
the same basis, all these expectations could be met relatively quickly and the test standardization could
start.
REFERENCES
[1] V.M. Malhotra and N.J. Carino, Handbook on NondetructiveTesting of Concrete, CRC Press Second
Edition
[2] Leslie, J.R. and Cheesman, W.J., An Ultrasonic Method of Studying Deterioration and Cracking in
Concrete Structures, ACI J. Proc., 46 (1), 17, 1949
[3] Jones, R., The Application of Ultrasonic to the Testing of Concrete, Research, London, 1948,383.
[4] A.A. Samokrutov, V.N.Kozlov, V.G.Shevaldykin, Ultrasonic Examination of Concrete Structures,
[5]V.G.Shevaldykin, A.A.Samokrutov, V.N. Kozlov, Ultrasonic Low Frequency Short-Pulse
Transducers with Dry Point Contact. Development and Application
[6]A. De La Haza, C. G. Petersen, A. Samokrutov, Three dimensional imaging of concrete structures
using ultrasonic shear waves


![Michaux, Henri - [ES] Miserable Milagro. La Mescalina Copia](https://img.pdfslide.us/doc/110x75/55cf9bad550346d033a6f720/michaux-henri-es-miserable-milagro-la-mescalina-copia.jpg)