Embed Size (px)
Citation preview

Christian Arnault Émini
The University of Yaoundé II - Cameroon
Workshop on Economic Partnership Agreements (EPAs)
For Southern Africa
Maputo (Mozambique) 4 – 5 April 2005
The Poverty Impacts of the Doha The Poverty Impacts of the Doha Round and the Role of Tax Policy:Round and the Role of Tax Policy:
A Case Study for CameroonA Case Study for Cameroon
The Poverty Impacts of the Doha The Poverty Impacts of the Doha Round and the Role of Tax Policy:Round and the Role of Tax Policy:
A Case Study for CameroonA Case Study for Cameroon
John CockburnUniversité Laval – Quebec, Canada
Bernard DecaluwéUniversité Laval – Quebec, Canada

Background on economy and poverty in Cameroon
Current patterns of trade and protection in Cameroon
Synopsis of the Doha impacts on Cameroon
Digression on the issue of tax replacement
Conclusions
SUMMARYSUMMARYSUMMARYSUMMARY

4
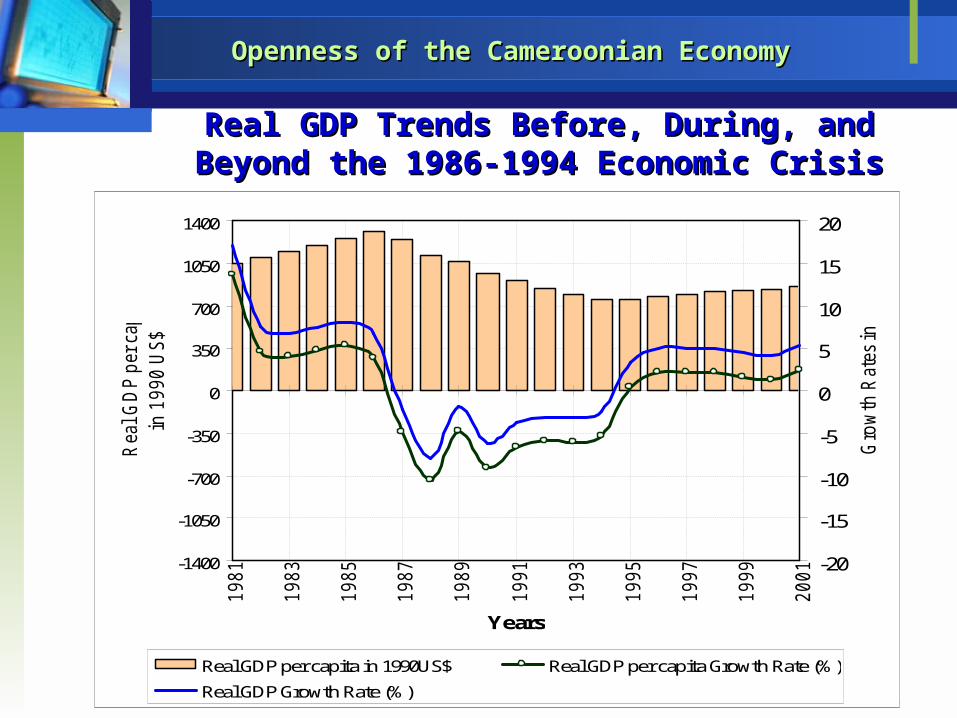
Openness of the Cameroonian EconomyOpenness of the Cameroonian Economy
Real GDP Trends Before, During, and Beyond Real GDP Trends Before, During, and Beyond the 1986-1994 Economic Crisisthe 1986-1994 Economic Crisis
-1400
-1050
-700
-350
0
350
700
1050
14001
98
1
19
83
19
85
19
87
19
89
19
91
19
93
19
95
19
97
19
99
20
01
Years
Real
GD
P p
er
cap
ita .
in 1
99
0 U
S$
.
-20
-15
-10
-5
0
5
10
15
20
Gro
wth
Rate
s in
% .
Real GDP per capita in 1990US$ Real GDP per capita Growth Rate (%)
Real GDP Growth Rate (%)

5
Trend in povertyTrend in poverty
53.3
40.2
19.113.8
9 6.4
0
10
20
30
40
50
60
Per
cen
tag
es .
Poverty headcount Poverty gap Poverty severity
Poverty indices
1996 2001
Trend in poverty indices between 1996 and 2001Trend in poverty indices between 1996 and 2001

6
Trend in povertyTrend in poverty
18.2
27.8
6.8
12
3.2
6.6
0
5
10
15
20
25
30
Perc
en
tag
e p
oin
ts .
Poverty headcount Poverty gap Poverty severity
Poverty indices
1996 2001
Difference between the value of a poverty index among Difference between the value of a poverty index among rural households and the value of that index among rural households and the value of that index among
urban householdsurban households
7
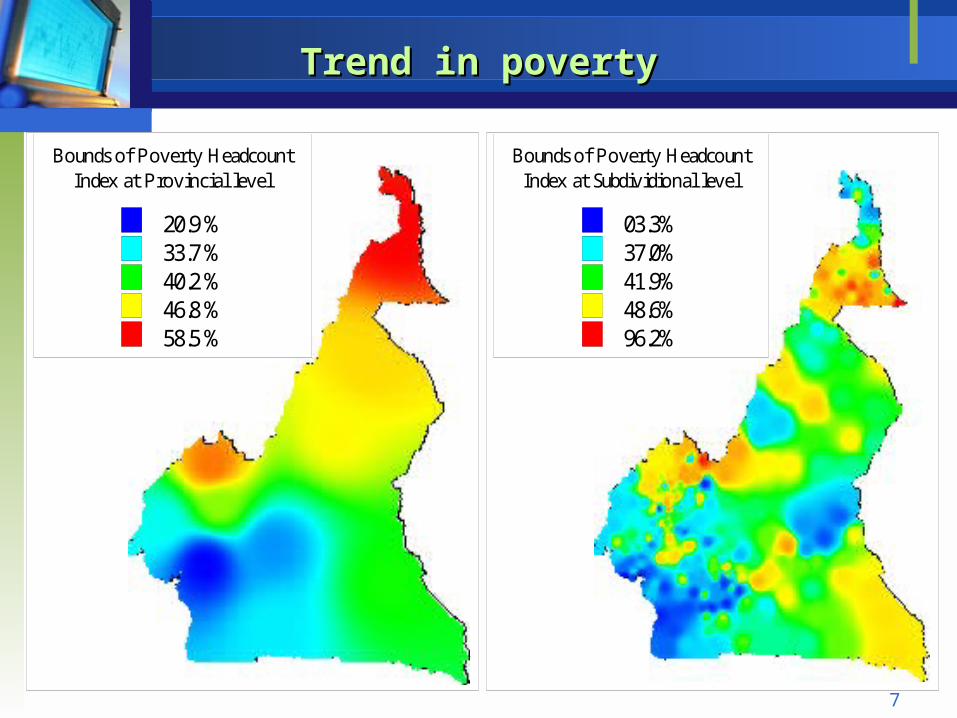
Trend in povertyTrend in poverty
Bounds of Poverty HeadcountIndex at Provincial level
20.9 %33.7 %40.2 %46.8 %58.5 %
Bounds of Poverty HeadcountIndex at Subdividional level
03.3%37.0%41.9%48.6%96.2%
8
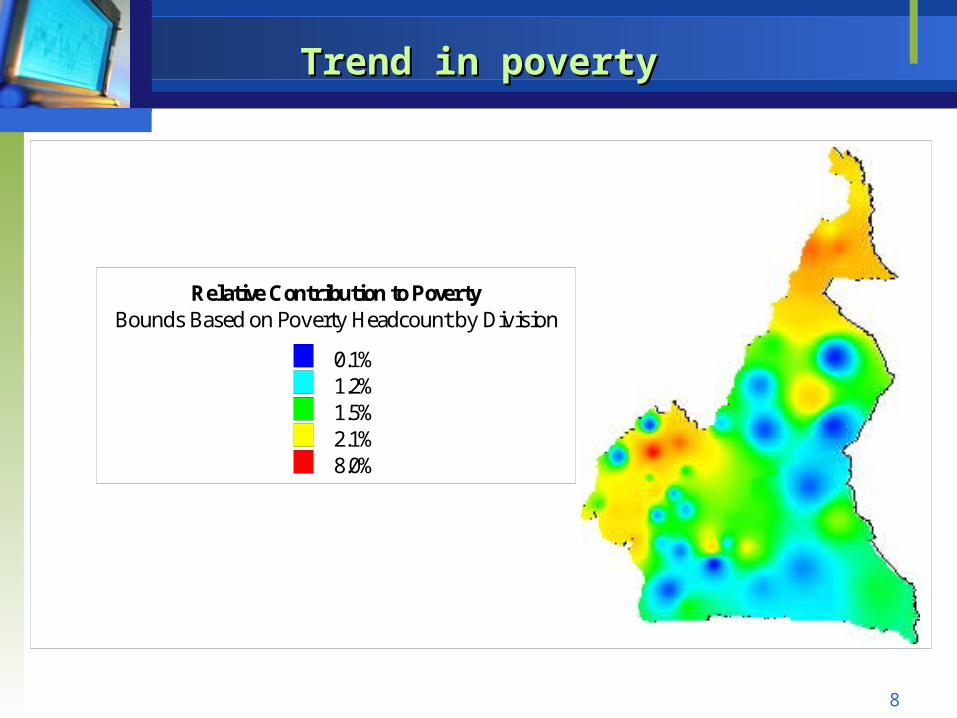
Trend in povertyTrend in poverty
Relative Contribution to PovertyBounds Based on Poverty Headcount by Division
0.1%1.2%1.5%2.1%8.0%

9
The Cameroon Social Accounting Matrix for 2001 The Cameroon Social Accounting Matrix for 2001
Sets Sets Description of elementsDescription of elements
Activities(10)
Agriculture (2) Foodstuffs agriculture, Cash crops agriculture
Industries (6)Forestry, Crude oil, Processed food, Processed wood, Refined petroleum, Miscellaneous industries
Services (2) Tradable services, Public services
Institutions (10995)
Households (10992)As processed from the results of the 2001 household survey in Cameroon (ECAM II)
Others (3) Firms, Government, Rest of the World
Production Factors
Agricultural Labor Skilled Labor, Unskilled Labor
Nonagricultural Labor Skilled Labor, Unskilled Labor
Capital Sector-specific
Land Used by agricultural activities

10
Households’ Income CompositionHouseholds’ Income Composition
Income sources
Household groups
Urban Rural Male-led Female-led PoorNon poor
Skilled agricultural labor 1.5 13.4 7.2 4.6 11.1 5.1
Unskilled agricultural labor 1.0 33.9 15.9 14.7 33.7 8.2
Skilled nonagricultural labor 58.4 19.6 40.9 41.5 18.1 50.6
Unskilled nonagricultural labor 11.8 11.4 11.7 10.6 13.4 10.8
Agricultural capital 1.2 12.1 6.4 4.0 14.7 2.5
Nonagricultural capital 26.0 7.8 16.9 23.7 7.4 22.2
Land 0.1 1.8 0.9 0.8 1.7 0.5
Total factor income 100.0 100.0 100.0 100.0 100.0 100.0

12
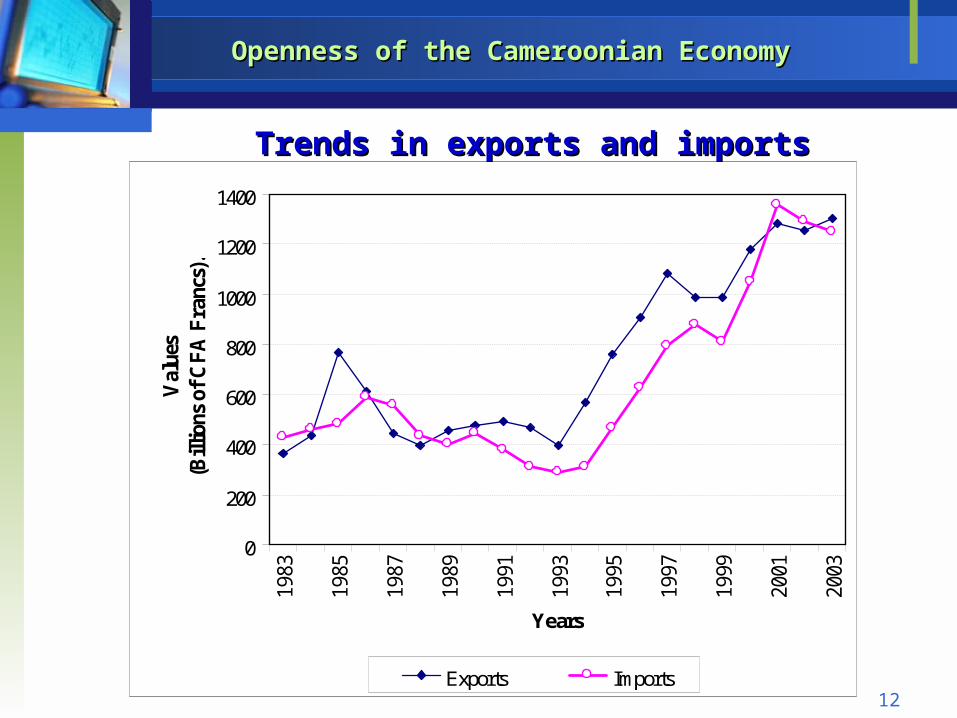
Openness of the Cameroonian EconomyOpenness of the Cameroonian Economy
Trends in exports and importsTrends in exports and imports
0
200
400
600
800
1000
1200
1400
1983
1985
1987
1989
1991
1993
1995
1997
1999
2001
2003
Years
Val
ues
(Bill
ions
of
CF
A F
ranc
s)...
Exports Imports

13
Openness of the Cameroonian EconomyOpenness of the Cameroonian Economy
Trends in Trade BalanceTrends in Trade Balance
104%97%95%
112%122%
112%
144%
164%
137%
67%59%60%
72%
87% 92%97%
107%100%
25%
50%
75%
100%
125%
150%
175%
1995 1996 1997 1998 1999 2000 2001 2002 2003
Cov
erag
e R
ate
of Im
port
s by
Exp
orts
.
.
-600
-400
-200
0
200
400
600
Tra
de B
alan
ce in
.B
illi
ons
of C
FA F
ranc
s .
Overall Trade Balance Net of Oil Trade Balance
Overall Coverage Rate of Imports by Exports Net of Oil Coverage Rate
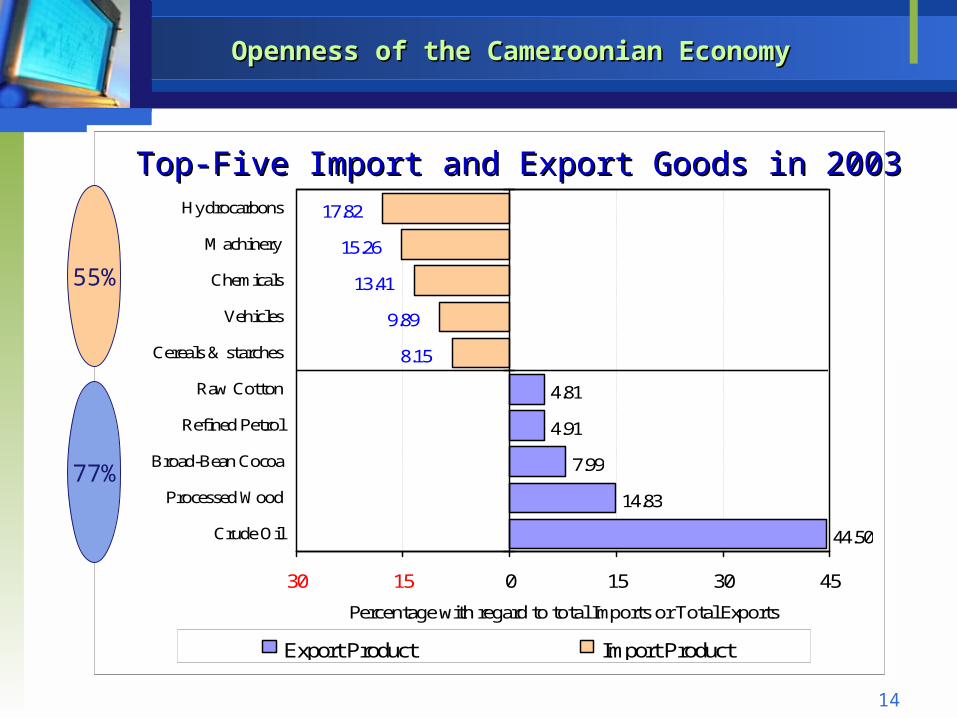
14
Openness of the Cameroonian EconomyOpenness of the Cameroonian Economy
44.50
14.83
7.99
4.91
4.81
9.89
13.41
15.26
17.82
8.15
30 15 0 15 30 45
Crude Oil
Processed Wood
Broad-Bean Cocoa
Refined Petrol
Raw Cotton
Cereals & starches
Vehicles
Chemicals
Machinery
Hydrocarbons
Percentage with regard to total Imports or Total Exports
Export Product Import Product
55%
77%
Top-Five Import and Export Goods in 2003Top-Five Import and Export Goods in 2003
15
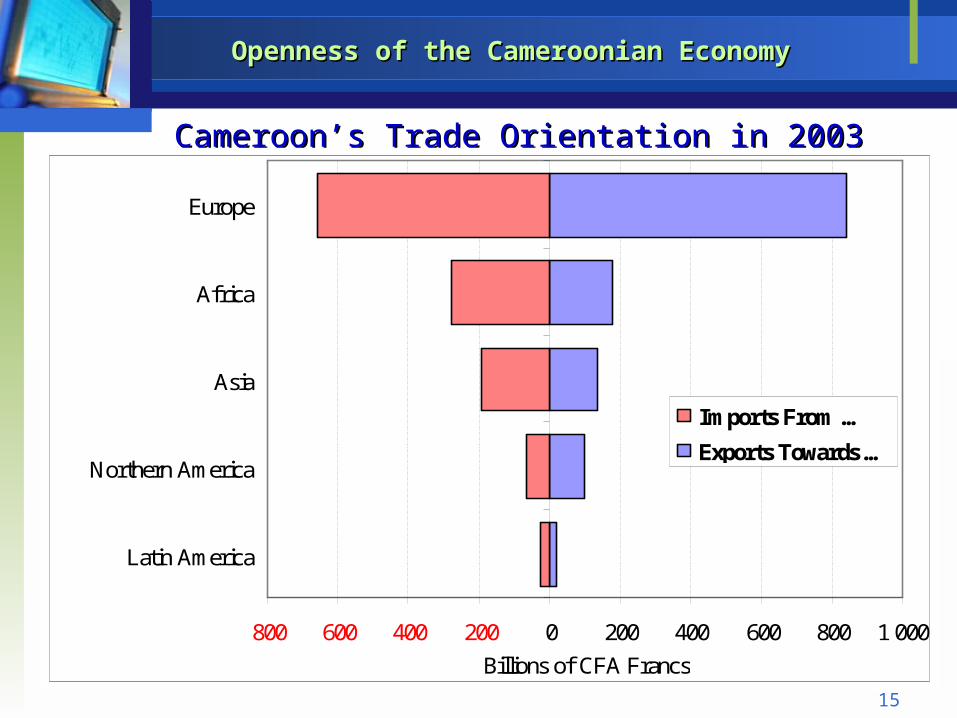
Openness of the Cameroonian EconomyOpenness of the Cameroonian Economy
Cameroon’s Trade Orientation in 2003Cameroon’s Trade Orientation in 2003
800 600 400 200 0 200 400 600 800 1 000
Latin America
Northern America
Asia
Africa
Europe
Billions of CFA Francs
Imports From …
Exports Towards …
16
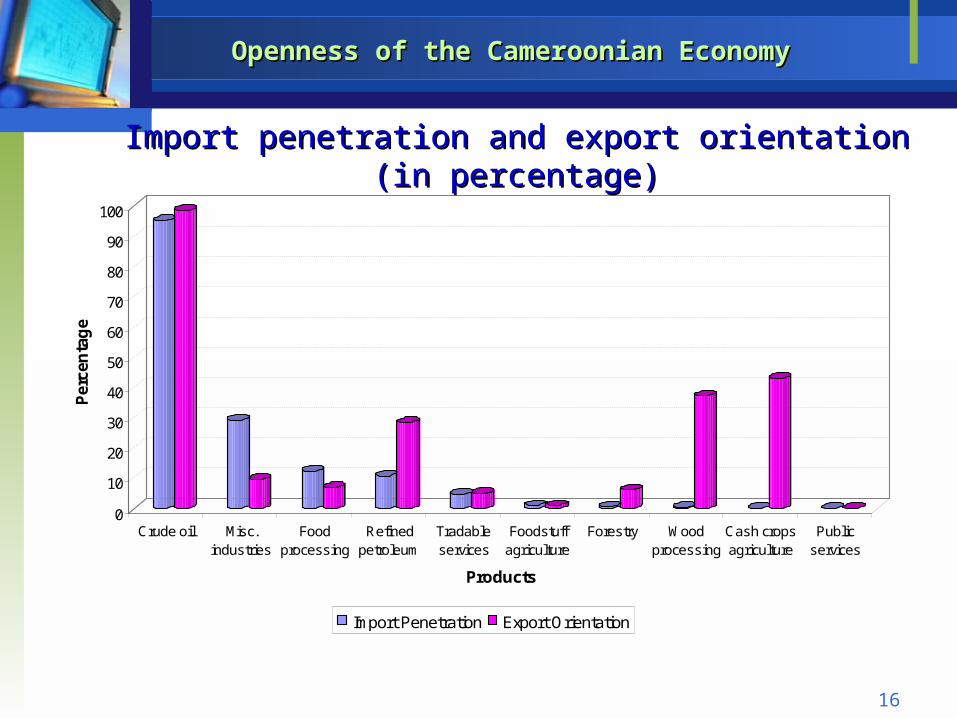
Openness of the Cameroonian EconomyOpenness of the Cameroonian Economy
0
10
20
30
40
50
60
70
80
90
100
Per
cen
tag
e
Crude oil Misc.industries
Foodprocessing
Refinedpetroleum
Tradableservices
Foodstuffagriculture
Forestry Woodprocessing
Cash cropsagriculture
Publicservices
Products
Import Penetration Export Orientation
Import penetration and export orientation (in percentage)Import penetration and export orientation (in percentage)
17
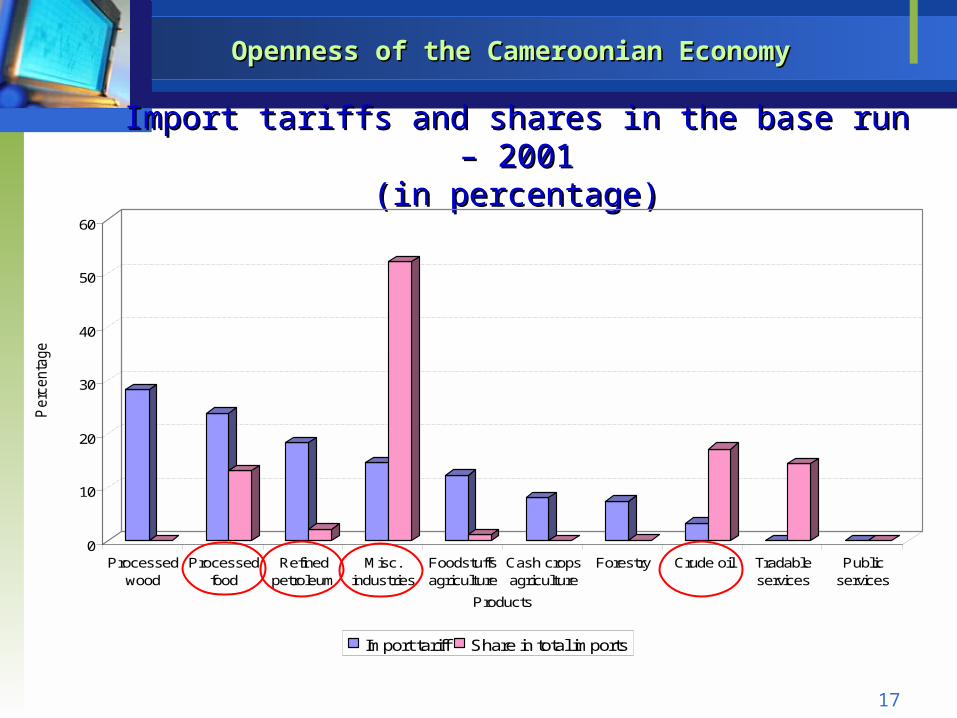
Openness of the Cameroonian EconomyOpenness of the Cameroonian Economy
Import tariffs and shares in the base run – 2001Import tariffs and shares in the base run – 2001(in percentage)(in percentage)
0
10
20
30
40
50
60
Perc
enta
ge .
Processedwood
Processedfood
Refinedpetroleum
Misc.industries
Foodstuffsagriculture
Cash cropsagriculture
Forestry Crude oil Tradableservices
Publicservices
Products
Import tariff Share in total imports

19
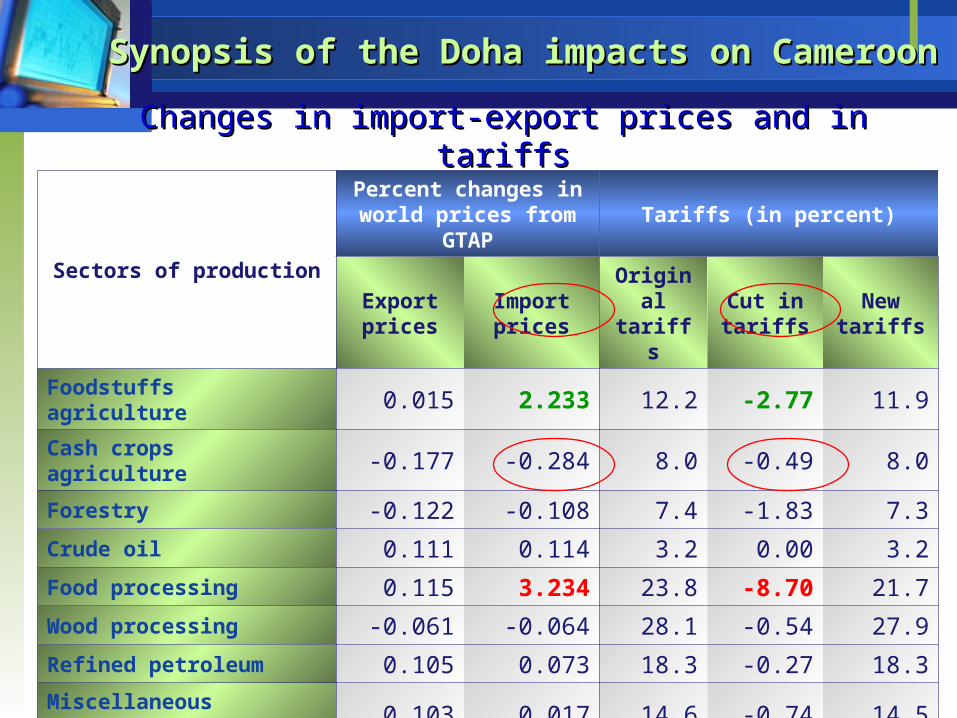
Synopsis of the Doha impacts on CameroonSynopsis of the Doha impacts on Cameroon
Sectors of production
Percent changes in world prices from GTAP
Tariffs (in percent)
Export prices
Import prices
Original tariffs
Cut in tariffs
New tariffs
Foodstuffs agriculture 0.015 2.233 12.2 -2.77 11.9
Cash crops agriculture -0.177 -0.284 8.0 -0.49 8.0
Forestry -0.122 -0.108 7.4 -1.83 7.3
Crude oil 0.111 0.114 3.2 0.00 3.2
Food processing 0.115 3.234 23.8 -8.70 21.7
Wood processing -0.061 -0.064 28.1 -0.54 27.9
Refined petroleum 0.105 0.073 18.3 -0.27 18.3
Miscellaneous industries 0.103 0.017 14.6 -0.74 14.5
Tradable services -0.064 -0.024 0.0 -0.00 0.0
Public services 0.000 0.000 0.0 -0.00 0.0
All sectors 0.044 0.471 11.79 -1.10 11.66
Changes in import-export prices and in tariffsChanges in import-export prices and in tariffs
20
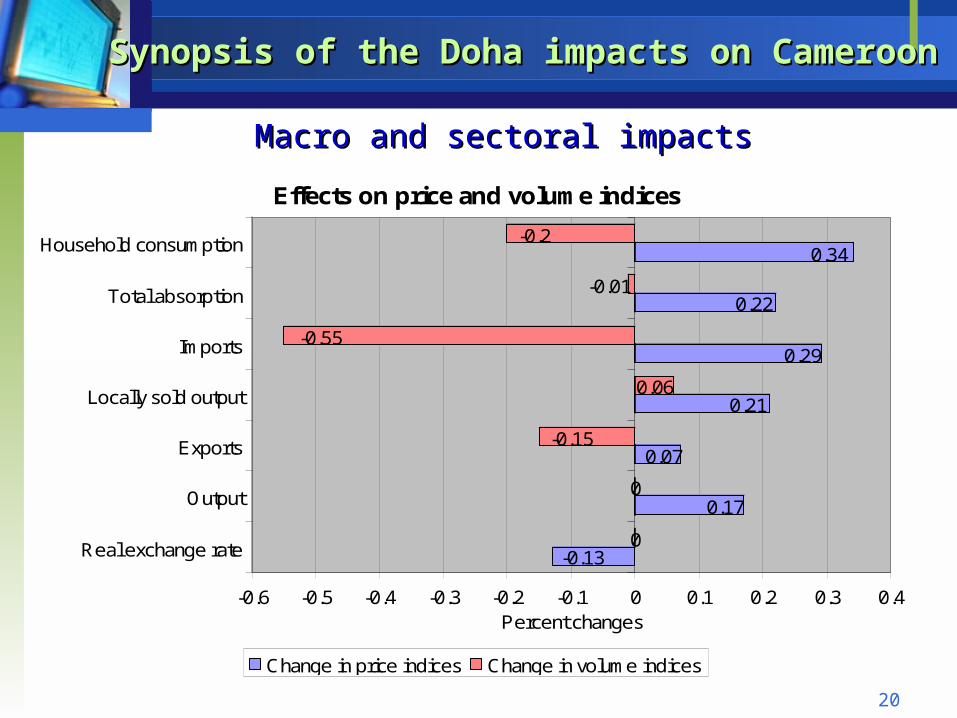
Synopsis of the Doha impacts on CameroonSynopsis of the Doha impacts on Cameroon
Macro and sectoral impactsMacro and sectoral impacts
-0.130
0.170
0.07-0.15
0.210.06
0.29-0.55
0.22-0.01
0.34-0.2
-0.6 -0.5 -0.4 -0.3 -0.2 -0.1 0 0.1 0.2 0.3 0.4Percent changes
Real exchange rate
Output
Exports
Locally sold output
Imports
Total absorption
Household consumption
Effects on price and volume indices
Change in price indices Change in volume indices
21
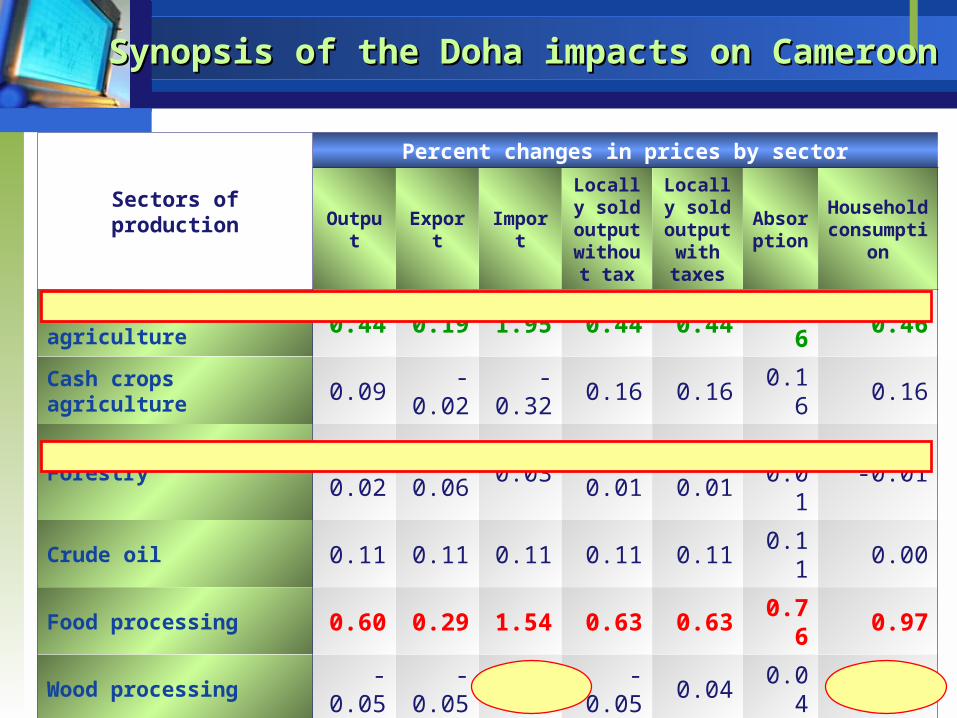
Synopsis of the Doha impacts on CameroonSynopsis of the Doha impacts on Cameroon
Sectors of production
Percent changes in prices by sector
Output Export Import
Locally sold
output without
tax
Locally sold
output with
taxes
Absorption
Household consumpti
on
Foodstuffs agriculture 0.44 0.19 1.95 0.44 0.44 0.46 0.46
Cash crops agriculture 0.09 -0.02 -0.32 0.16 0.16 0.16 0.16
Forestry -0.02 -0.06 0.03 -0.01 -0.01 -0.01 -0.01
Crude oil 0.11 0.11 0.11 0.11 0.11 0.11 0.00
Food processing 0.60 0.29 1.54 0.63 0.63 0.76 0.97
Wood processing -0.05 -0.05 0.05 -0.05 0.04 0.04 0.21
Refined petroleum 0.04 0.08 0.12 0.02 0.08 0.09 0.13
Miscellaneous industries 0.07 0.08 0.12 0.07 0.11 0.11 0.24
Tradable services 0.02 -0.02 -0.02 0.03 0.06 0.05 0.07
Public services 0.38 0.00 0.00 0.38 0.38 0.38 0.00
All sectors 0.17 0.07 0.29 0.19 0.21 0.22 0.34

22
Synopsis of the Doha impacts on CameroonSynopsis of the Doha impacts on Cameroon
Sectors of production
Percent changes in volumes by sector
Output Export ImportLocally
sold output
AbsorptionHousehold
consumption
Foodstuffs agriculture 0.04 -1.03 -6.15 0.06 0.00 -0.1
Cash crops agriculture -0.30 -0.95 3.45 0.23 0.23 0.0
Forestry -0.14 -0.36 -0.32 -0.11 -0.11 0.0
Crude oil 0.00 0.00 -0.04 0.00 -0.03 0.0
Food processing 0.47 -1.07 -3.87 0.60 0.05 -0.4
Wood processing -0.06 -0.05 -0.06 -0.03 -0.03 -0.2
Refined petroleum -0.04 0.14 -0.26 -0.12 -0.13 -0.2
Miscellaneous industries 0.05 0.13 -0.02 0.05 0.03 -0.2
Tradable services -0.09 -0.25 0.24 -0.07 -0.05 -0.2
Public services 0.00 0.00 0.00 0.00 0.00 0.0
All sectors 0.00 -0.15 -0.55 0.06 -0.01 -0.2
23
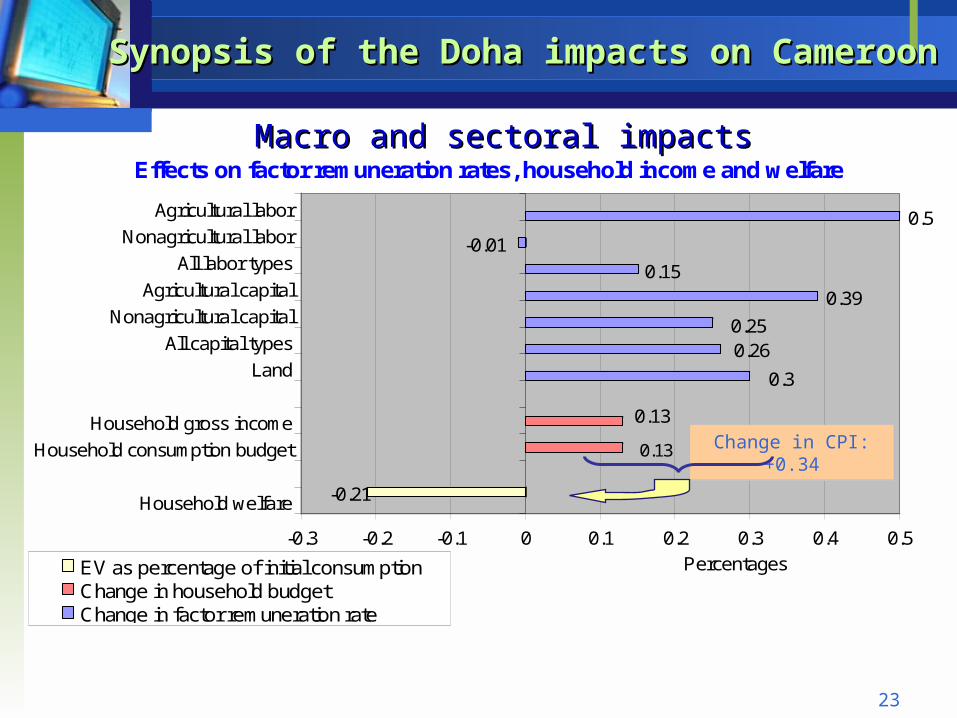
Synopsis of the Doha impacts on CameroonSynopsis of the Doha impacts on Cameroon
Macro and sectoral impactsMacro and sectoral impacts
-0.21
0.13
0.13
0.3
0.260.25
0.39
0.15
-0.01
0.5
-0.3 -0.2 -0.1 0 0.1 0.2 0.3 0.4 0.5Percentages
Household welfare
Household consumption budget
Household gross income
Land
All capital types
Nonagricultural capital
Agricultural capital
All labor types
Nonagricultural labor
Agricultural labor
Effects on factor remuneration rates, household income and welfare
EV as percentage of initial consumptionChange in household budgetChange in factor remuneration rate
Change in CPI: +0.34Change in CPI: +0.34

24
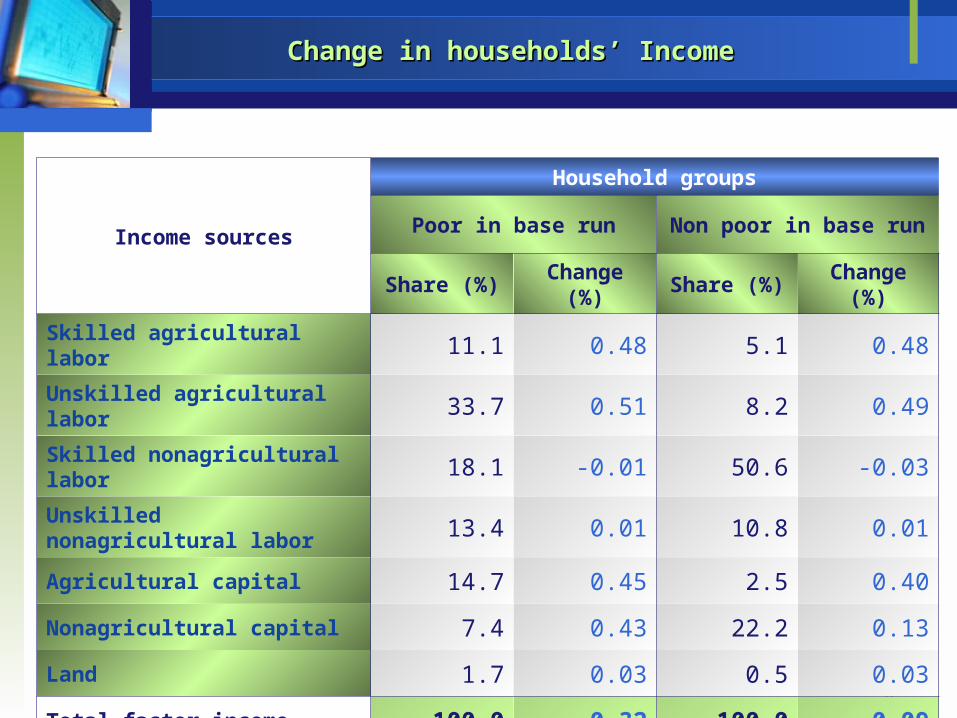
Change in households’ IncomeChange in households’ Income
Income sources
Household groups
Urban Rural
Share (%) Change (%) Share (%) Change (%)
Skilled agricultural labor 1.5 0.47 13.4 0.48
Unskilled agricultural labor 1.0 0.40 33.9 0.51
Skilled nonagricultural labor 58.4 -0.04 19.6 0.00
Unskilled nonagricultural labor 11.8 0.02 11.4 0.00
Agricultural capital 1.2 0.49 12.1 0.43
Nonagricultural capital 26.0 0.03 7.8 0.70
Land 0.1 0.00 1.8 0.03
Total factor income 100.0 0.00 100.0 0.34

25
Change in households’ IncomeChange in households’ Income
Income sources
Household groups
Male-led Female-led
Share (%) Change (%) Share (%) Change (%)
Skilled agricultural labor 7.2 0.49 4.6 0.43
Unskilled agricultural labor 15.9 0.51 14.7 0.44
Skilled nonagricultural labor 40.9 -0.03 41.5 -0.03
Unskilled nonagricultural labor 11.7 0.01 10.6 -0.01
Agricultural capital 6.4 0.45 4.0 0.31
Nonagricultural capital 16.9 0.18 23.7 0.09
Land 0.9 0.03 0.8 0.00
Total factor income 100.0 0.17 100.0 0.10
26
Change in households’ IncomeChange in households’ Income
Income sources
Household groups
Poor in base run Non poor in base run
Share (%) Change (%) Share (%) Change (%)
Skilled agricultural labor 11.1 0.48 5.1 0.48
Unskilled agricultural labor 33.7 0.51 8.2 0.49
Skilled nonagricultural labor 18.1 -0.01 50.6 -0.03
Unskilled nonagricultural labor 13.4 0.01 10.8 0.01
Agricultural capital 14.7 0.45 2.5 0.40
Nonagricultural capital 7.4 0.43 22.2 0.13
Land 1.7 0.03 0.5 0.03
Total factor income 100.0 0.32 100.0 0.09

27
Poverty impactsPoverty impacts
-3.0
-2.5
-2.0
-1.5
-1.0
-0.5
0.0
0.5
1.0
Perc
en
t .
Cameroon Urbanhouseholds
Ruralhouseholds
Male-ledhouseholds
Female-ledhouseholds
Percentage changes in poverty and inequality indices
Poverty headcount Poverty gap Poverty severity Gini index
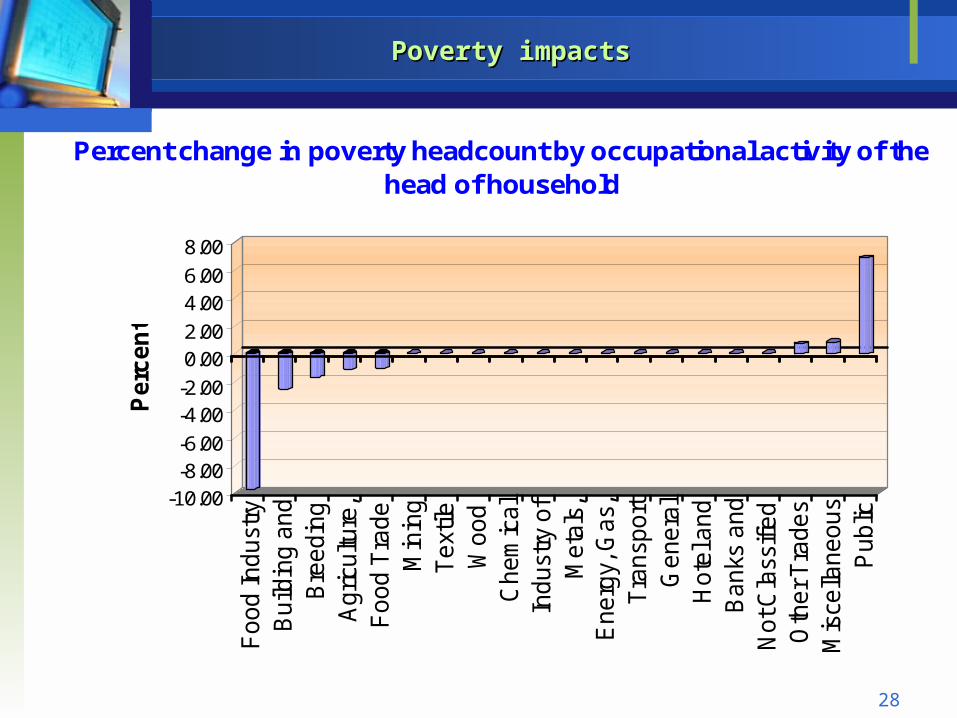
28
Poverty impactsPoverty impacts
-10.00-8.00-6.00
-4.00-2.00
0.002.00
4.006.00
8.00
Perc
en
t
Food In
dust
ryB
uild
ing a
nd
Bre
edin
gA
gric
ultu
re,
Food T
rade
Min
ing
Text
ileW
ood
Chem
ical
Indust
ry o
fM
eta
ls,
Energ
y, G
as,
Tra
nsp
ort
Genera
lH
ote
l and
Banks
and
Not C
lass
ified
Oth
er T
rades
Mis
cella
neous
Public
Percent change in poverty headcount by occupational activity of the head of household
29
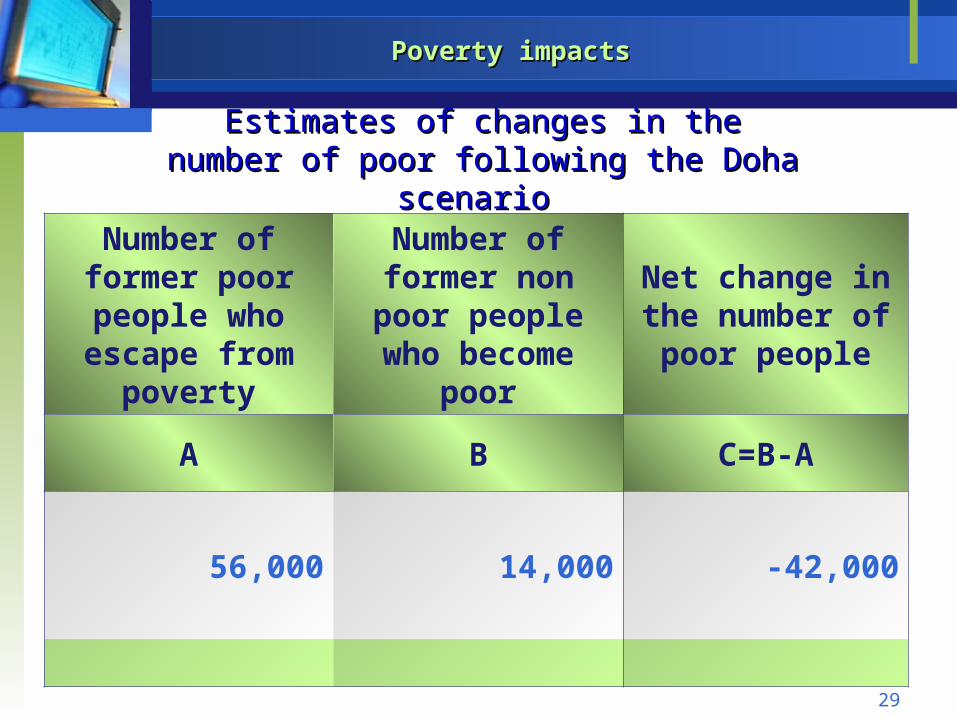
Poverty impactsPoverty impacts
Number of former poor people who
escape from poverty
Number of former non poor people
who become poor
Net change in the number of poor
people
A B C=B-A
56,000 14,000 -42,000
Estimates of changes in the number of poor Estimates of changes in the number of poor following the Doha scenariofollowing the Doha scenario

31
Digression on the issue of Tax ReplacementDigression on the issue of Tax Replacement
To capture the possible bias induced by the choice of the replacement tax, we compare the effects of combined ROW and Cameroon liberalization using alternatively two taxation systems as replacement tax: A Value Added Tax A proportional household consumption tax.
VAT versus neutral consumption tax as VAT versus neutral consumption tax as replacement taxreplacement tax
32
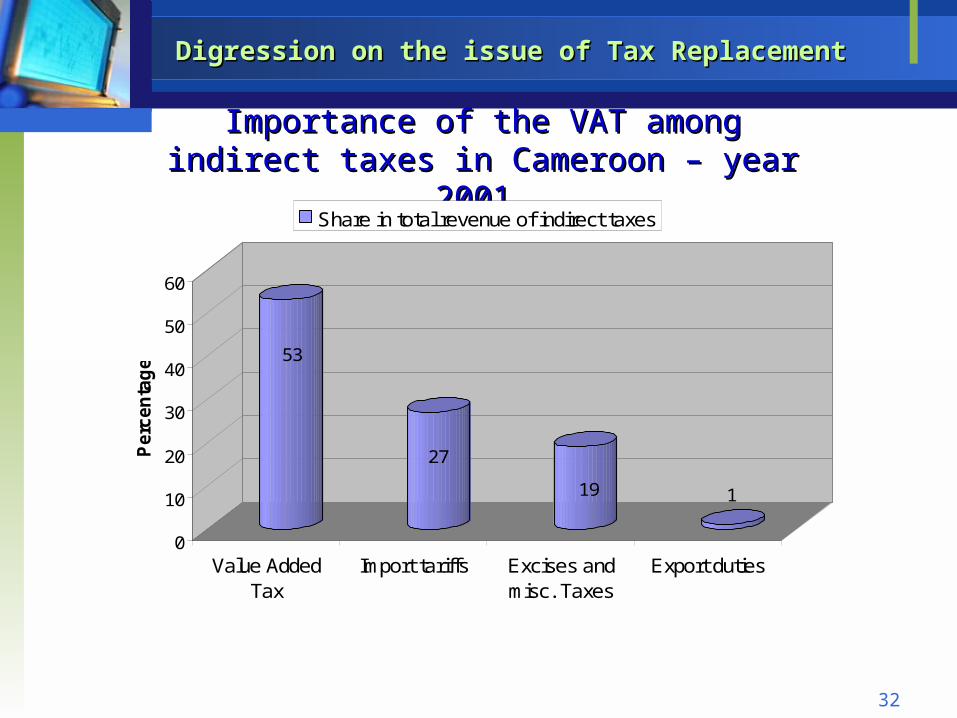
Digression on the issue of Tax ReplacementDigression on the issue of Tax Replacement
Importance of the VAT among indirect taxes Importance of the VAT among indirect taxes in Cameroon – year 2001in Cameroon – year 2001
53
27
19 1
0
10
20
30
40
50
60
Perc
en
tag
e
Value AddedTax
Import tariffs Excises andmisc. Taxes
Export duties
Share in total revenue of indirect taxes

33
Digression on the issue of Tax ReplacementDigression on the issue of Tax Replacement
The VAT applied in Cameroon is progressiveThe VAT applied in Cameroon is progressive
0.0
0.5
1.0
1.5
2.0
2.5
3.0
3.5
4.0
Perc
en
t
1 2 3 4 5 6 7 8 9 10
Household groups by deciles .
Effective rate of VAT paid by household deciles
Average VAT
effective rate

34
Digression on the issue of Tax ReplacementDigression on the issue of Tax Replacement
Comparative effectsComparative effects on price indices on price indices
9.02
5.98
-7.57
-4.92
-1.5 -0.79
-8.69
-4.59
-10.85
-5.71
-9.01
-4.72
-7.72
-2.4
-12
-10
-8
-6
-4
-2
0
2
4
6
8
10
Per
cent
cha
nges
Realexchange
rate
Output Exports Locally soldoutput
Imports Totalabsorption
Householdconsumption
Scenario with neutral consumption replacement tax
Scenario with VAT as replacement tax
35
Digression on the issue of Tax ReplacementDigression on the issue of Tax Replacement
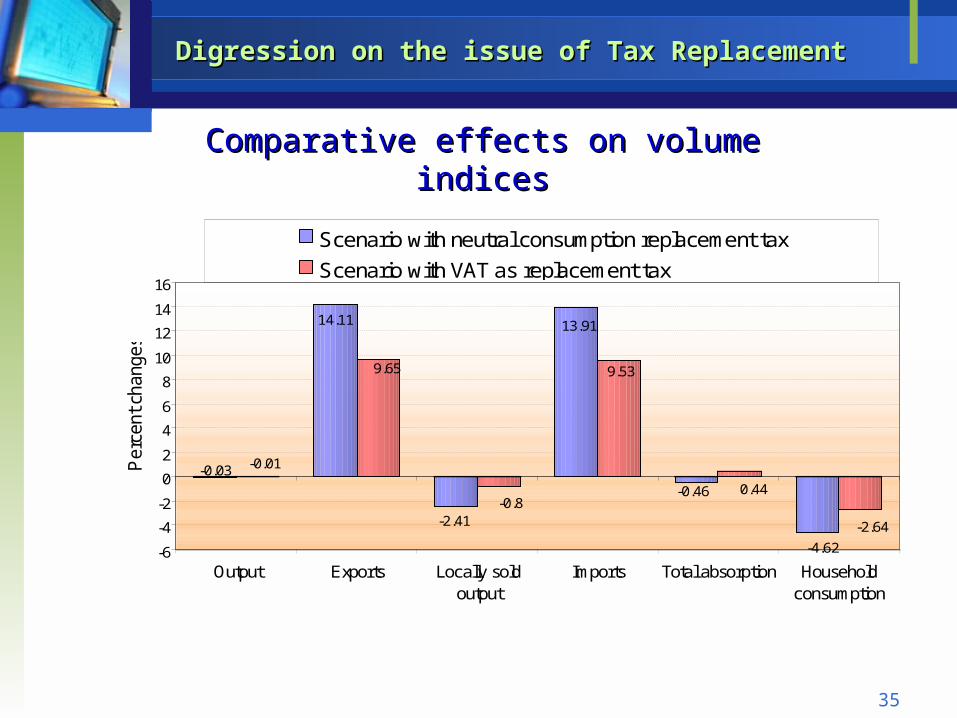
Comparative effectsComparative effects on volume indices on volume indices
-0.03 -0.01
14.11
9.65
-2.41-0.8
13.91
9.53
-0.46 0.44
-4.62
-2.64
-6
-4
-2
0
2
4
6
8
10
12
14
16
Per
cent
cha
nges
Output Exports Locally soldoutput
Imports Total absorption Householdconsumption
Scenario with neutral consumption replacement tax
Scenario with VAT as replacement tax
36
Digression on the issue of Tax ReplacementDigression on the issue of Tax Replacement
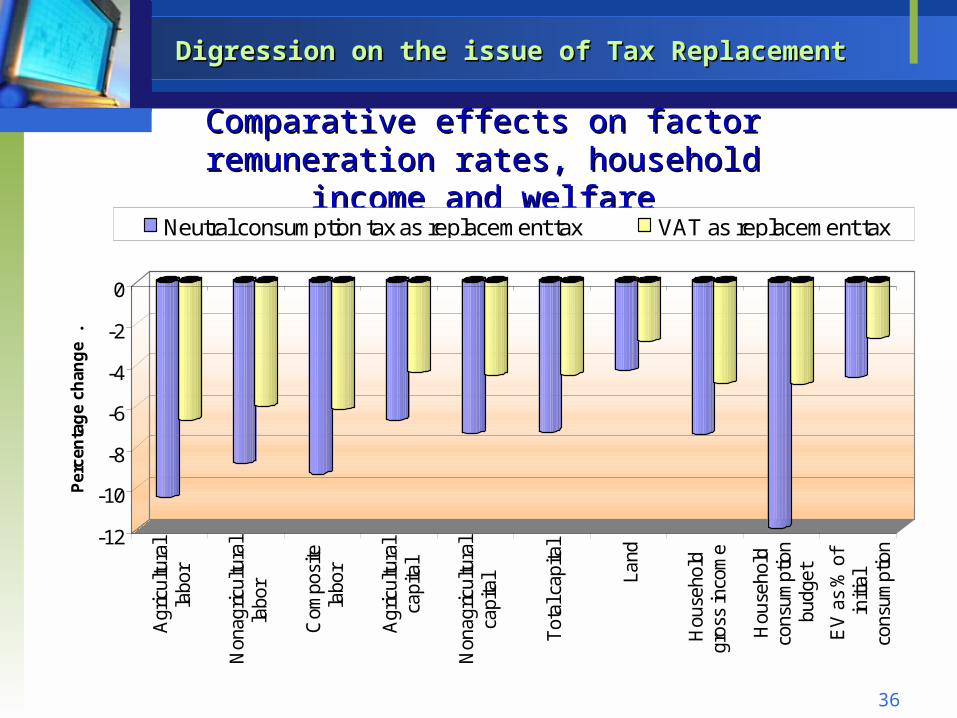
Comparative effectsComparative effects on factor remuneration on factor remuneration rates, household income and welfarerates, household income and welfare
-12
-10
-8
-6
-4
-2
0
Per
cen
tag
e ch
ang
e .
Agr
icul
tura
lla
bor
Non
agric
ultu
ral
labo
r
Com
posi
tela
bor
Agr
icul
tura
lca
pita
l
Non
agric
ultu
ral
capi
tal
Tot
al c
apita
l
Land
Hou
seho
ldgr
oss
inco
me
Hou
seho
ldco
nsum
ptio
nbu
dget
EV
as
% o
fin
itial
cons
umpt
ion
Neutral consumption tax as replacement tax VAT as replacement tax

37
Digression on the issue of Tax ReplacementDigression on the issue of Tax Replacement
Comparative effectsComparative effects on household income on household income
-10
-9
-8
-7
-6
-5
-4
-3
-2
-1
0
Perc
en
t ch
an
ge
Urbanhouseholds
Ruralhouseholds
Male-ledhouseholds
Female-ledhouseholds
Poor people inbase run
Non poorpeople in base
run
Neutral consumption tax as replacement tax VAT as replacement tax
38
Digression on the issue of Tax ReplacementDigression on the issue of Tax Replacement
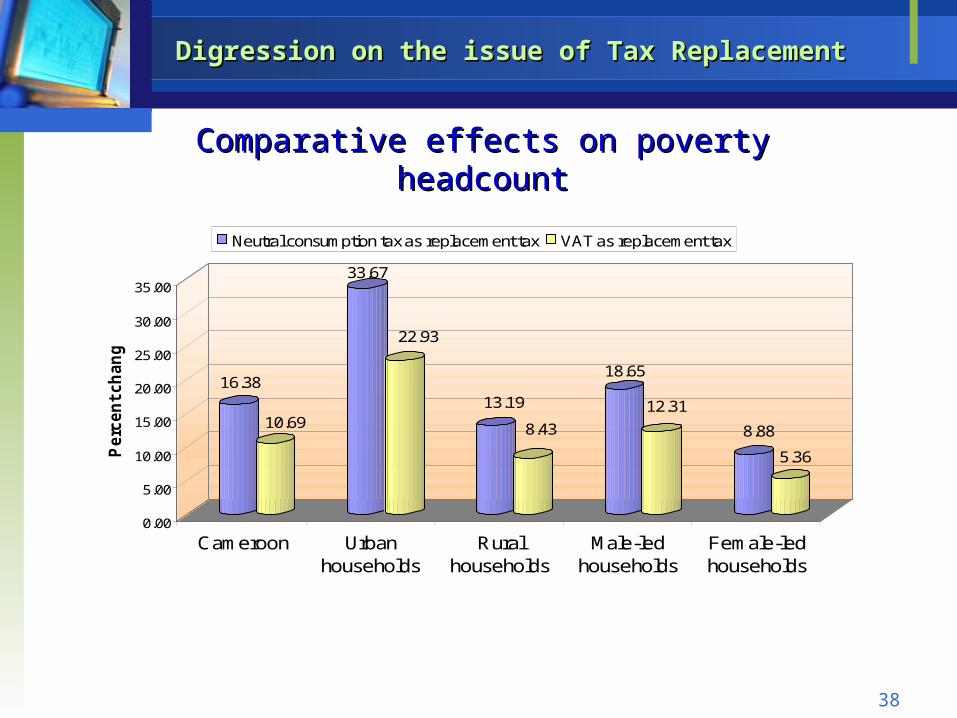
Comparative effectsComparative effects on poverty headcount on poverty headcount
16.38
10.69
33.67
22.93
13.19
8.43
18.65
12.31
8.88
5.36
0.00
5.00
10.00
15.00
20.00
25.00
30.00
35.00
Perc
en
t ch
an
ge
Cameroon Urbanhouseholds
Ruralhouseholds
Male-ledhouseholds
Female-ledhouseholds
Neutral consumption tax as replacement tax VAT as replacement tax
39
Digression on the issue of Tax ReplacementDigression on the issue of Tax Replacement
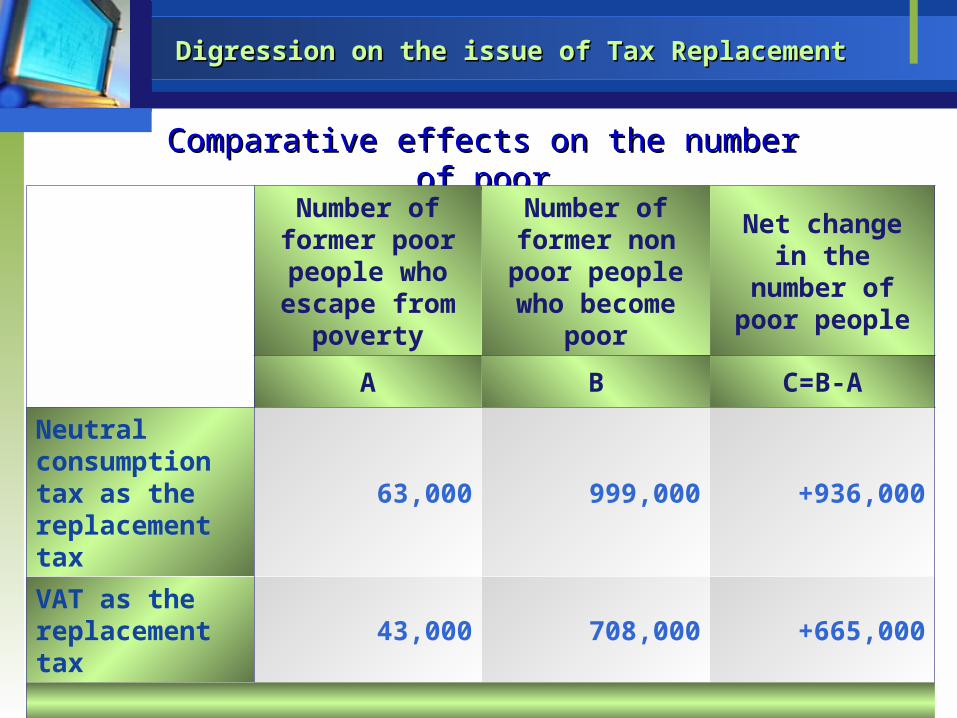
Comparative effects on the number of poorComparative effects on the number of poor
Number of former poor people who escape from
poverty
Number of former non poor
people who become poor
Net change in the number of poor people
A B C=B-A
Neutral consumption tax as the replacement tax
63,000 999,000 +936,000
VAT as the replacement tax
43,000 708,000 +665,000

41
ConclusionsConclusions
Doha development round might contribute to poverty alleviation in Cameroon
However, policymakers should be aware of:
The importance of choosing appropriate replacement taxes
The negative poverty impacts of the elimination of domestic tariffs
The evidence that some households will lose out and possibly fall into poverty, even if national poverty rates fall.

42
ConclusionsConclusions
Free-trade in ROW strongly alleviates poverty, at least at
the national level
Whereas Cameroon’s own liberalization worsens the
poverty and inequality situations
In case of combined ROW and own liberalization, the
adverse impacts of own liberalization proves to strongly
outweigh the favorable outcomes of the ROW
liberalization.