Embed Size (px)
Citation preview
Chris Libreri General Manager
2016 Census Data October Release
Bindi Kindermann Census Branch, Program Manager
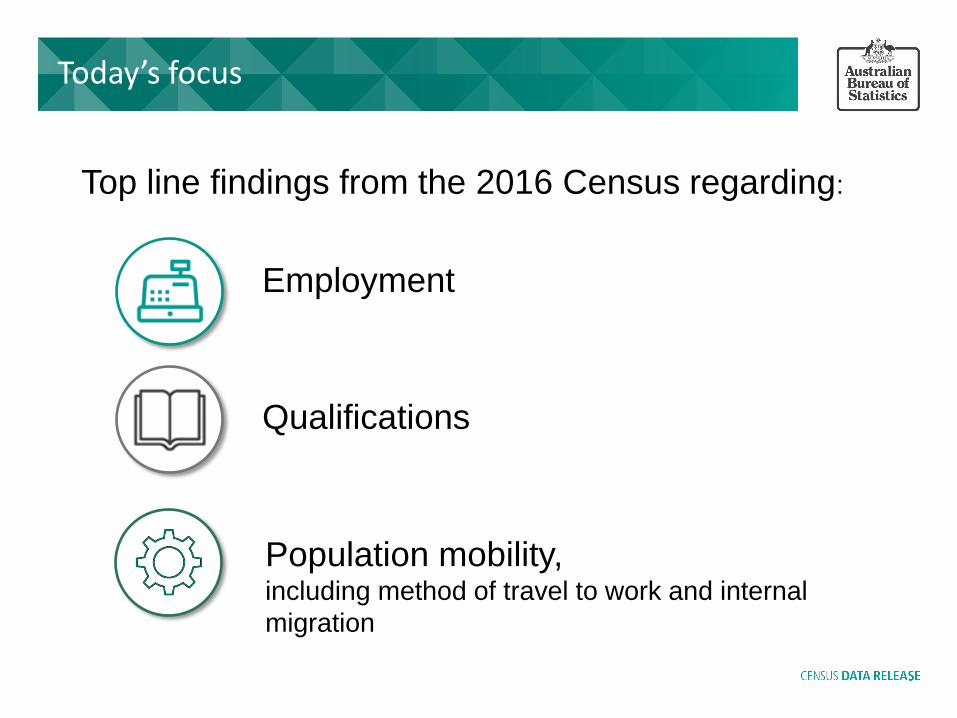
Today’s focus
Top line findings from the 2016 Census regarding:
Employment
Qualifications
Population mobility, including method of travel to work and internal
migration

Value of the Census
Allocation of government funds and support for elections
Use in other ABS statistics
Government planning, administration and policy
development
Use by communities, businesses and researchers
The most comprehensive and detailed picture of Australia’s population and housing, and how Australia is changing.
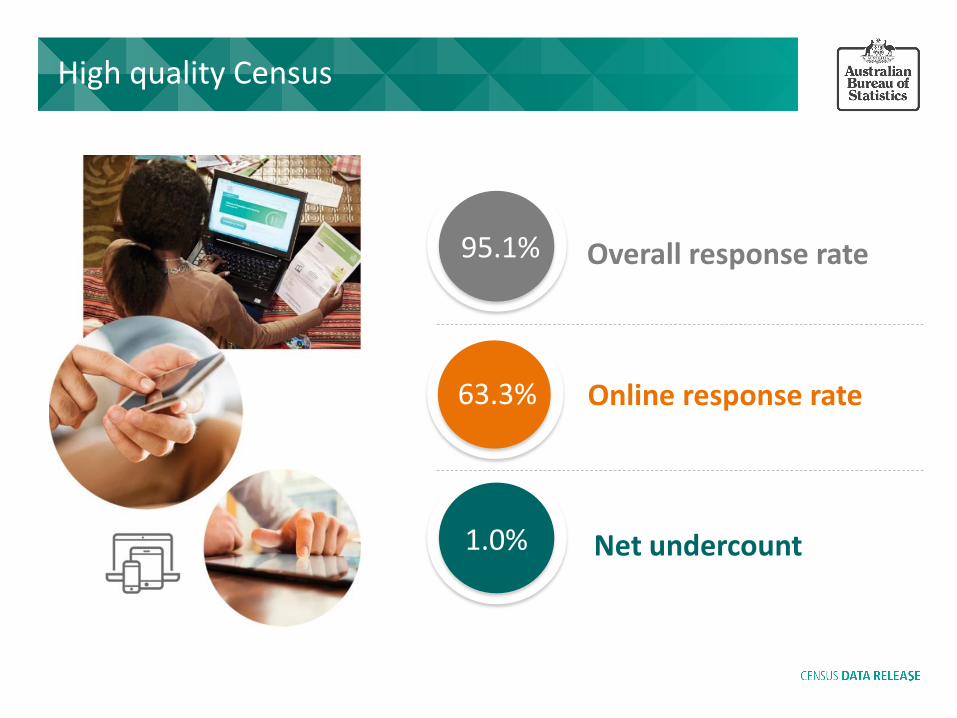
Overall response rate 95.1%
Online response rate 63.3%
Net undercount 1.0%
High quality Census
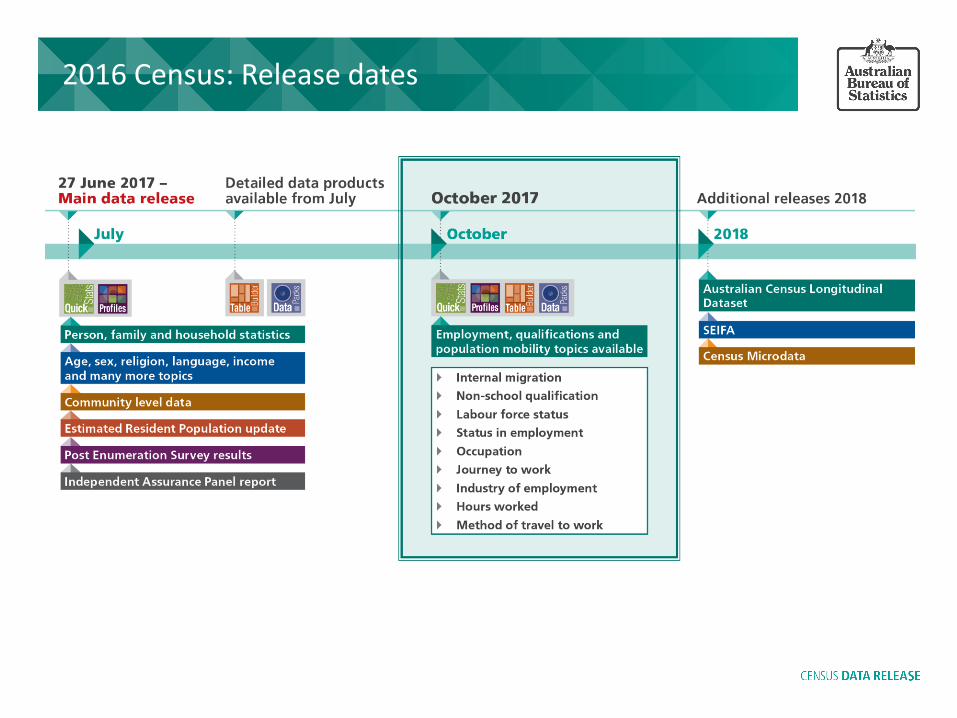
2016 Census: Release dates
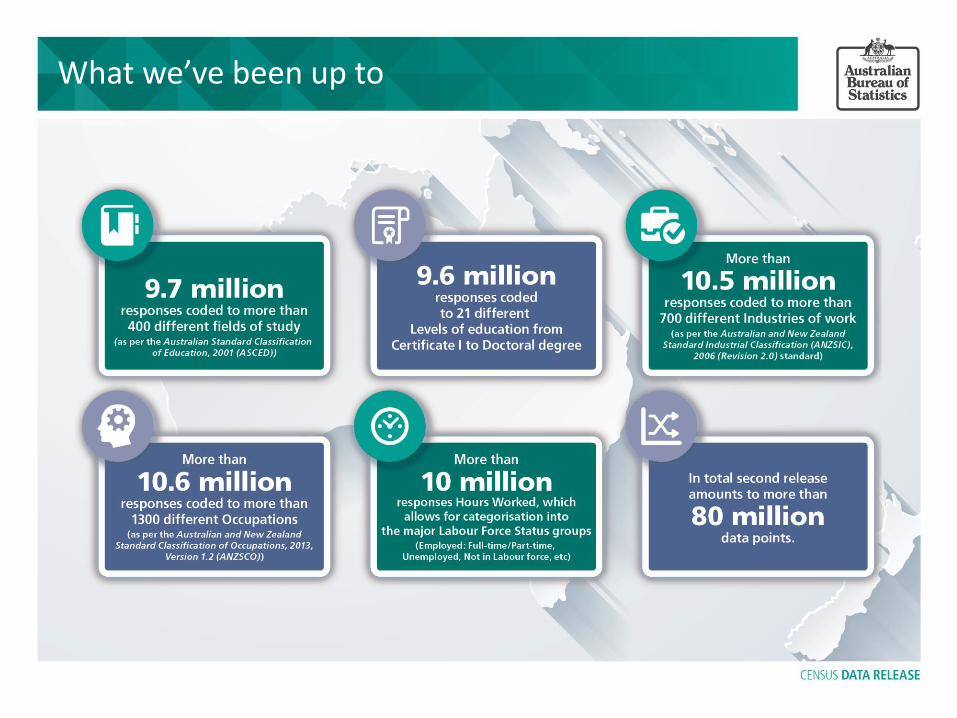
What we’ve been up to
Employment Bjorn Jarvis Labour and Income Branch, Program Manager

Employment: What we collected
Employed people Self employed people Not employed people
• Occupation and job description
• Name of Business
• Industry of Business
• Goods/Services provided by business
• Hours worked
• Whether a respondent is an employee or self employed
• Number of employees
• Whether the business is Incorporated or Unincorporated
• Whether a respondent was actively looking for work, and
• Whether a respondent
was available to start work

Employment by age: Census
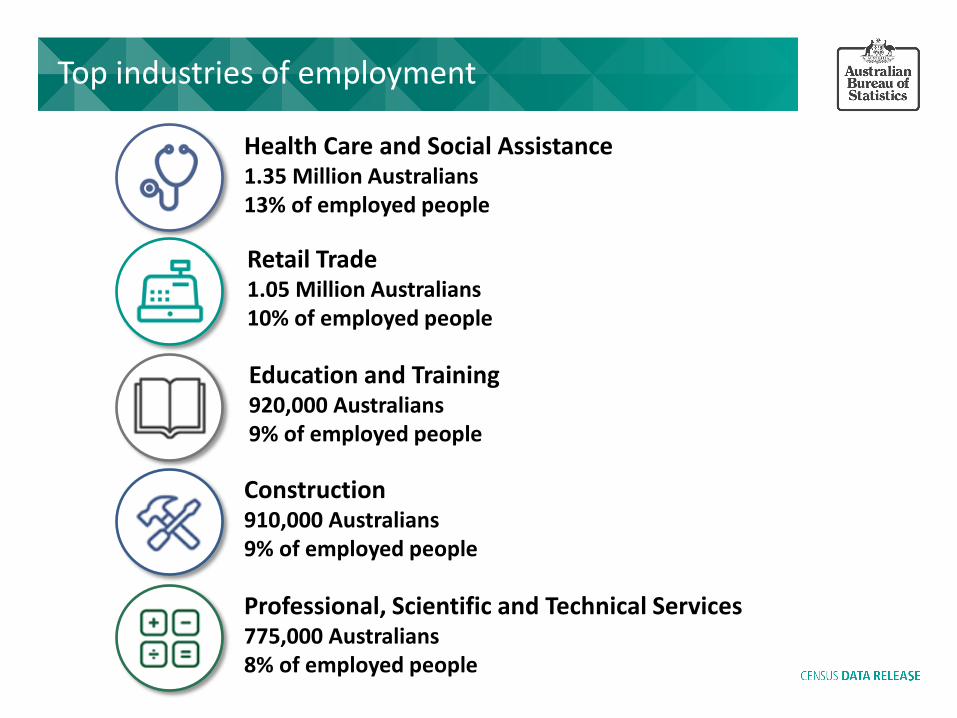
Top industries of employment
Health Care and Social Assistance 1.35 Million Australians 13% of employed people
Retail Trade 1.05 Million Australians 10% of employed people
Education and Training 920,000 Australians 9% of employed people
Construction 910,000 Australians 9% of employed people
Professional, Scientific and Technical Services 775,000 Australians 8% of employed people

Distribution of full-time employment by industry
0%
20%
40%
60%
80%
100%
Employed,worked full-time
Employed,worked part-time
Employed,away from work
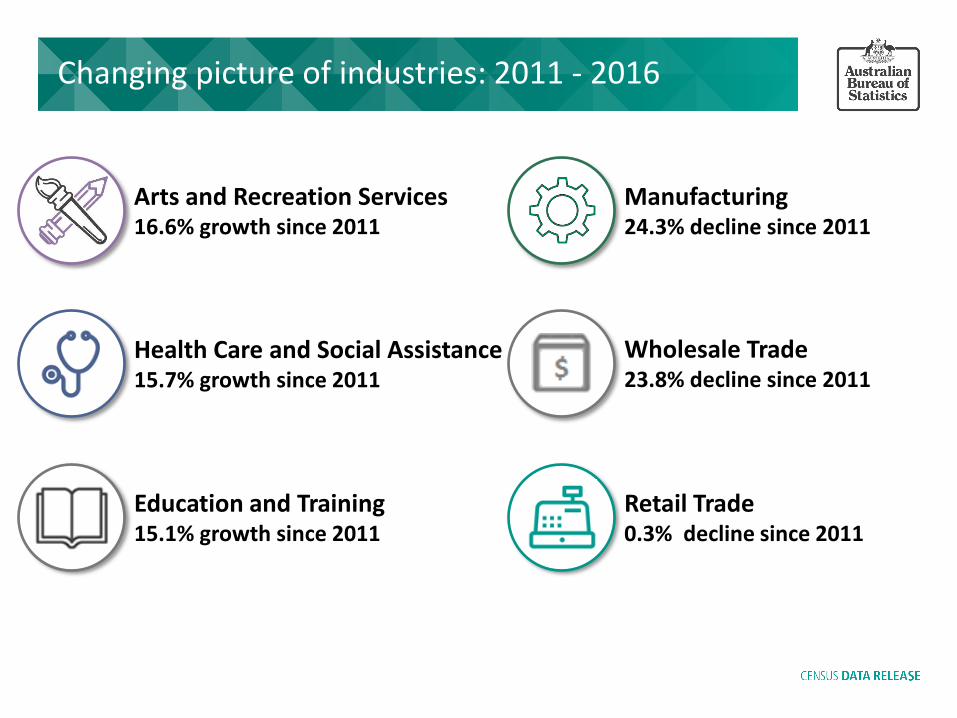
Changing picture of industries: 2011 - 2016
Arts and Recreation Services 16.6% growth since 2011
Health Care and Social Assistance 15.7% growth since 2011
Education and Training 15.1% growth since 2011
Manufacturing 24.3% decline since 2011
Wholesale Trade 23.8% decline since 2011
Retail Trade 0.3% decline since 2011
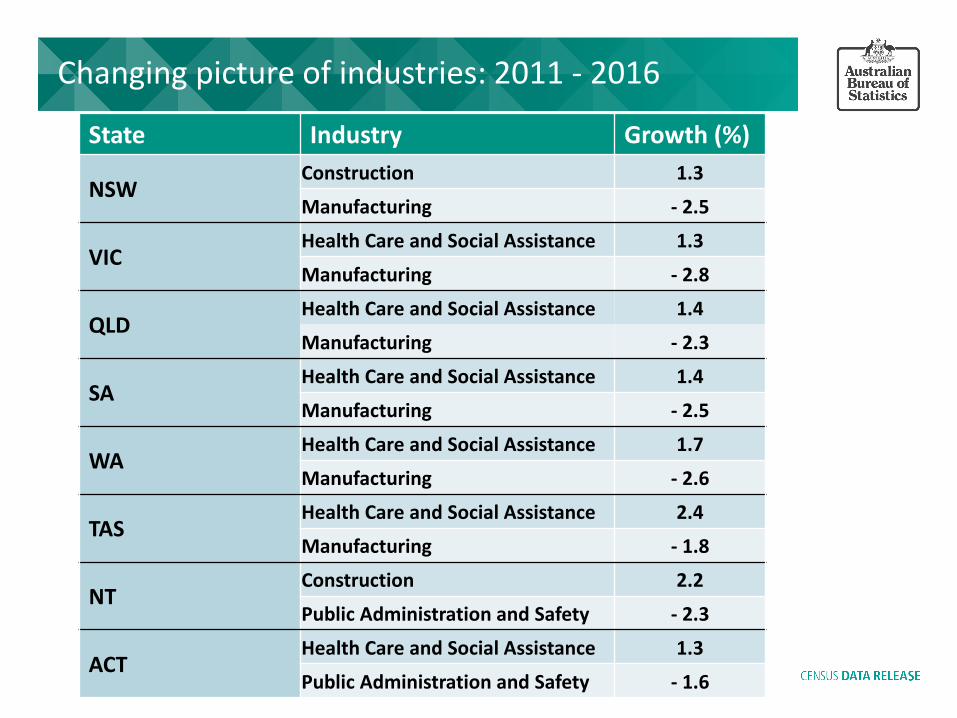
Changing picture of industries: 2011 - 2016
State Industry Growth (%)
NSW Construction 1.3
Manufacturing - 2.5
VIC Health Care and Social Assistance 1.3
Manufacturing - 2.8
QLD Health Care and Social Assistance 1.4
Manufacturing - 2.3
SA Health Care and Social Assistance 1.4
Manufacturing - 2.5
WA Health Care and Social Assistance 1.7
Manufacturing - 2.6
TAS Health Care and Social Assistance 2.4
Manufacturing - 1.8
NT Construction 2.2
Public Administration and Safety - 2.3
ACT Health Care and Social Assistance 1.3
Public Administration and Safety - 1.6

Hours worked (full-time): 1966 – 2016
40%
50%
60%
70%
80%
90%
100%
1961 1966 1971 1976 1981 1986 1991 1996 2001 2006 2011 2016
Male 35Hours+
Female35Hours+
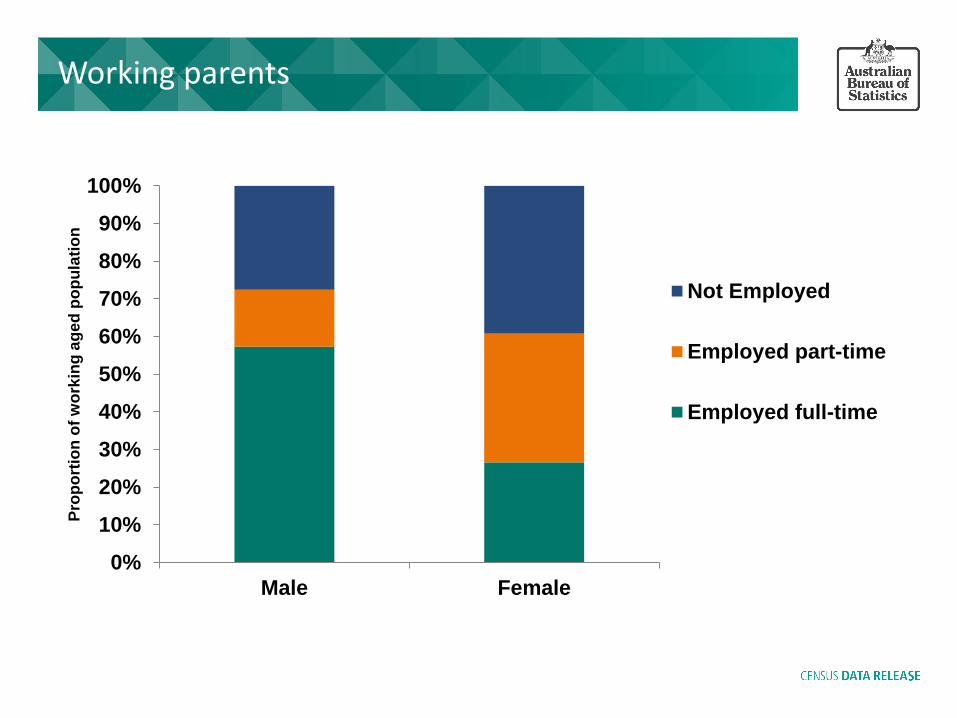
Working parents
0%
10%
20%
30%
40%
50%
60%
70%
80%
90%
100%
Male Female
Pro
po
rtio
n o
f w
ork
ing
ag
ed
po
pu
lati
on
Not Employed
Employed part-time
Employed full-time

Working hours as we get older

Domestic work
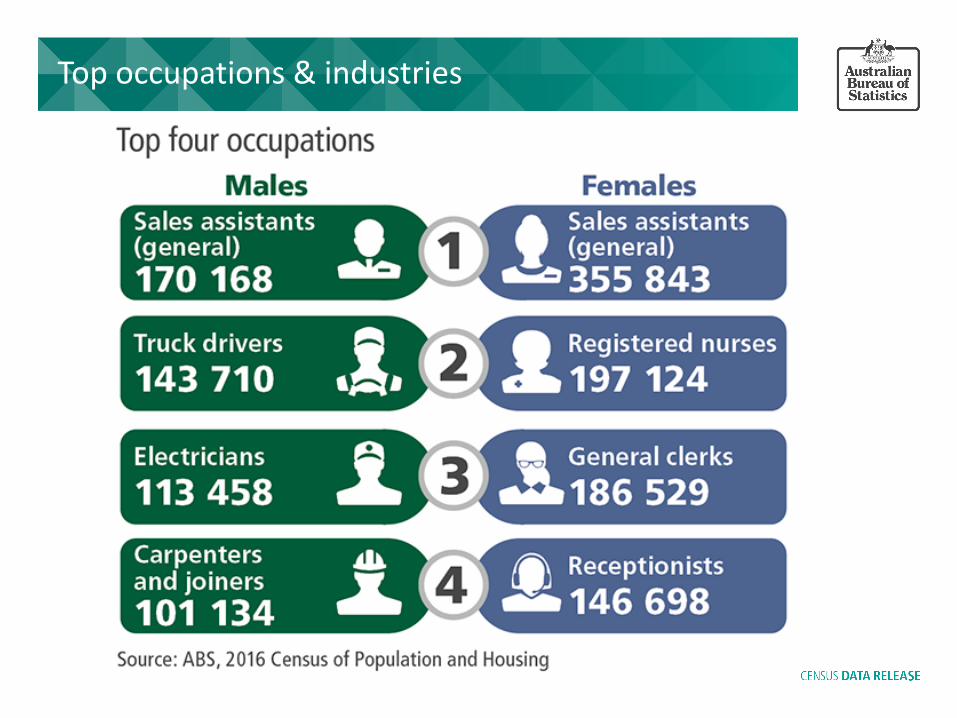
Top occupations & industries
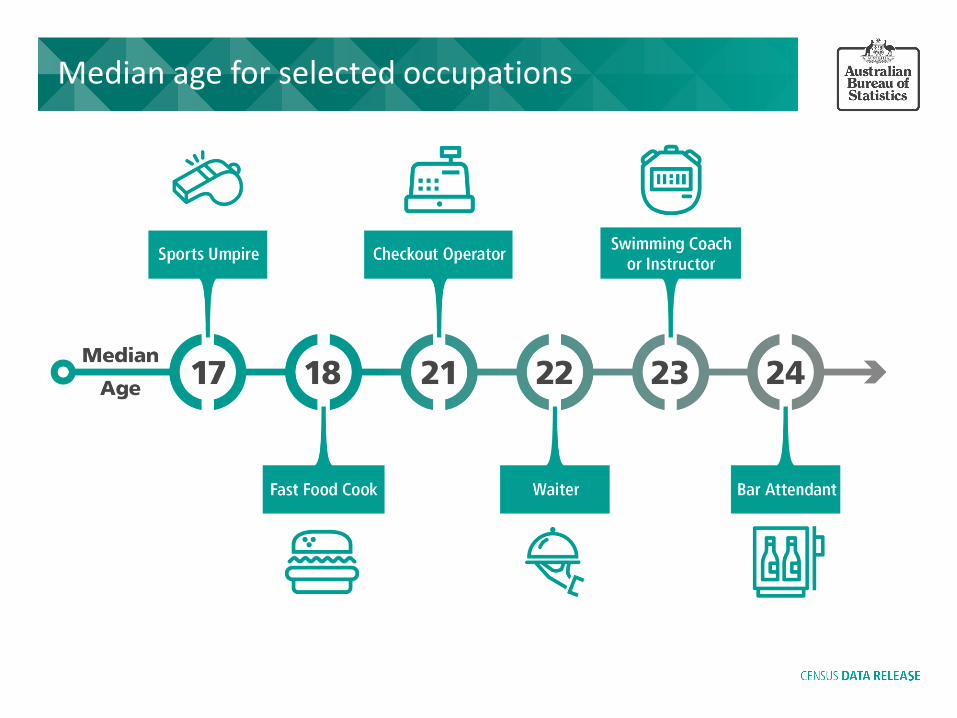
Median age for selected occupations

Median age for selected occupations
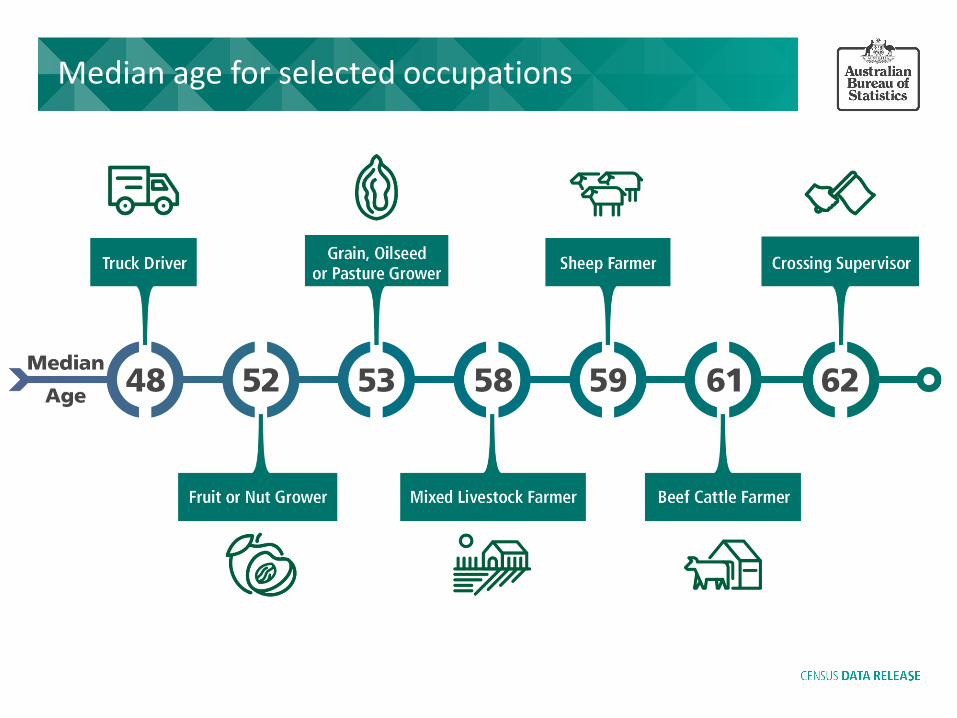
Median age for selected occupations
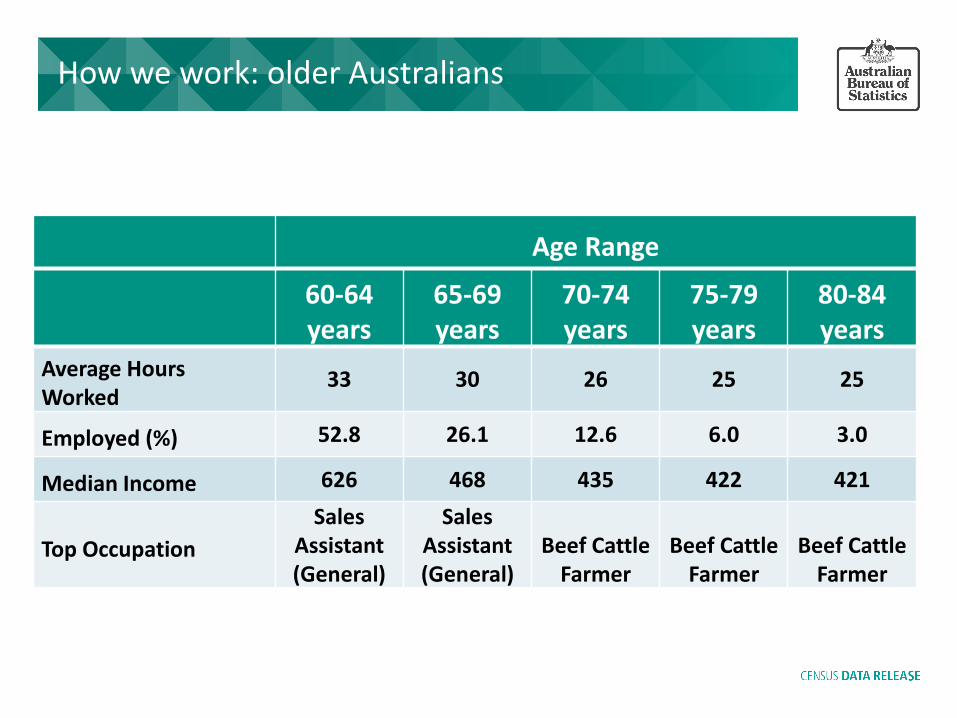
60-64 years
65-69 years
70-74 years
75-79 years
80-84 years
Average Hours Worked
33 30 26 25 25
Employed (%) 52.8 26.1 12.6 6.0 3.0
Median Income 626 468 435 422 421
Top Occupation
Sales Assistant (General)
Sales Assistant (General)
Beef Cattle Farmer
Beef Cattle Farmer
Beef Cattle Farmer
How we work: older Australians
Age Range
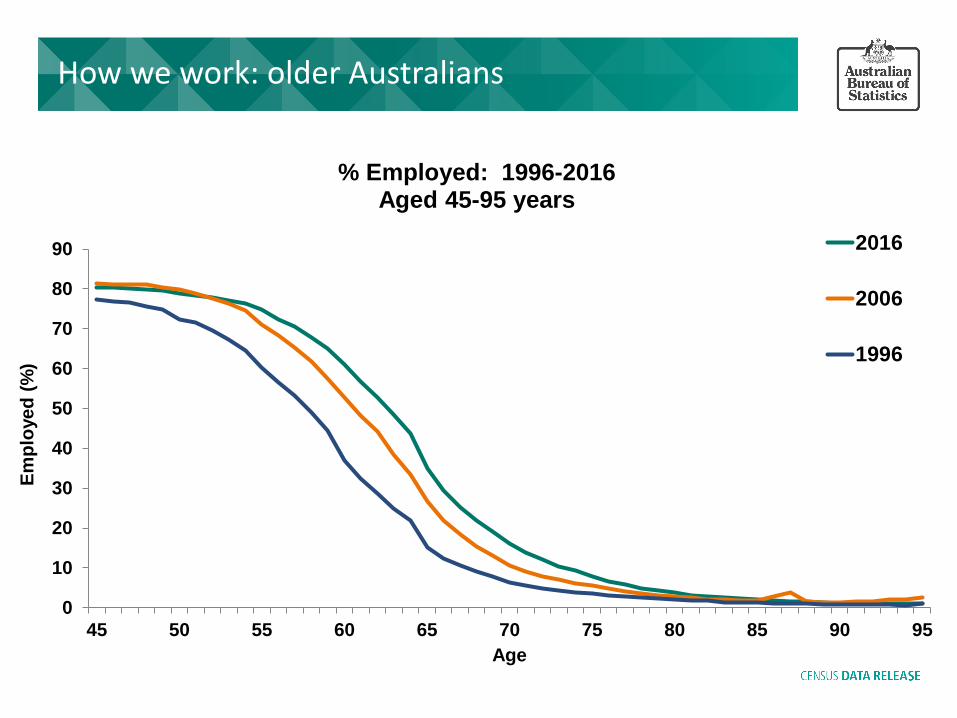
How we work: older Australians
0
10
20
30
40
50
60
70
80
90
45 50 55 60 65 70 75 80 85 90 95
Em
plo
ye
d (
%)
Age
% Employed: 1996-2016 Aged 45-95 years
2016
2006
1996
Qualifications Phillip Wise Director (A/g), Census Dissemination
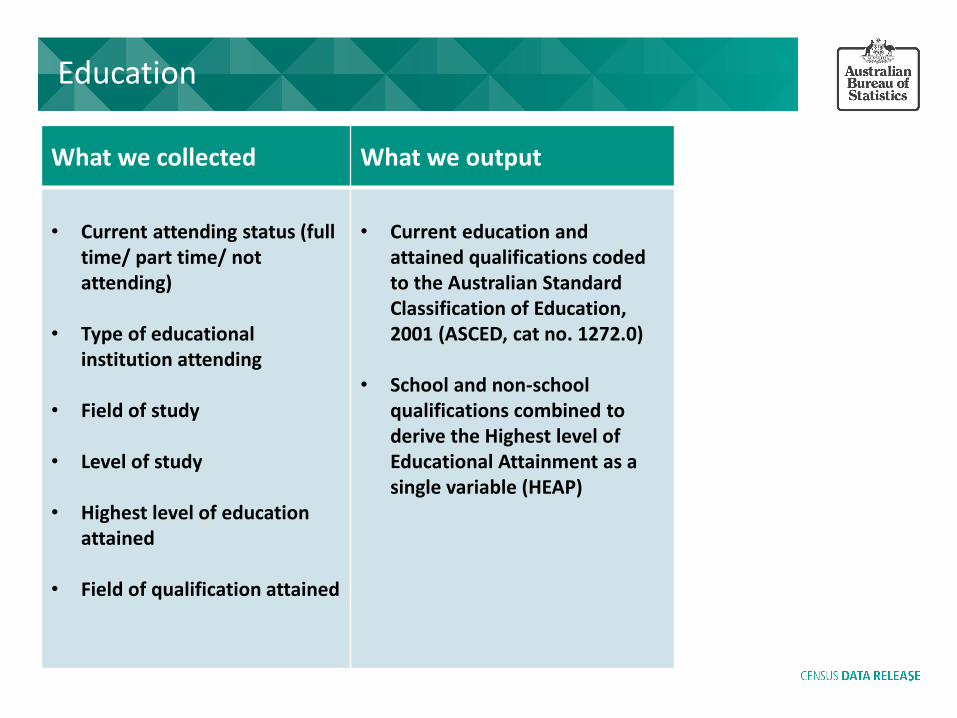
Education
What we collected What we output
• Current attending status (full
time/ part time/ not attending)
• Type of educational institution attending
• Field of study
• Level of study
• Highest level of education attained
• Field of qualification attained
• Current education and
attained qualifications coded to the Australian Standard Classification of Education, 2001 (ASCED, cat no. 1272.0)
• School and non-school qualifications combined to derive the Highest level of Educational Attainment as a single variable (HEAP)

Qualifications across Australia
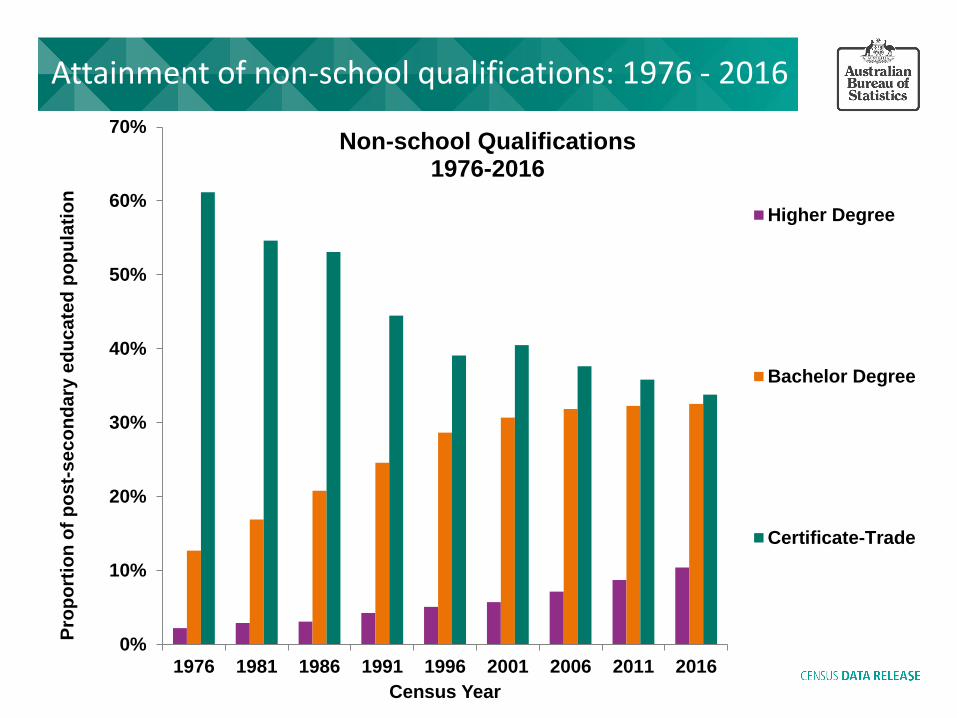
Attainment of non-school qualifications: 1976 - 2016
0%
10%
20%
30%
40%
50%
60%
70%
1976 1981 1986 1991 1996 2001 2006 2011 2016
Pro
po
rtio
n o
f p
os
t-s
ec
on
da
ry e
du
ca
ted
po
pu
lati
on
Census Year
Non-school Qualifications 1976-2016
Higher Degree
Bachelor Degree
Certificate-Trade

Qualifications by sex by age
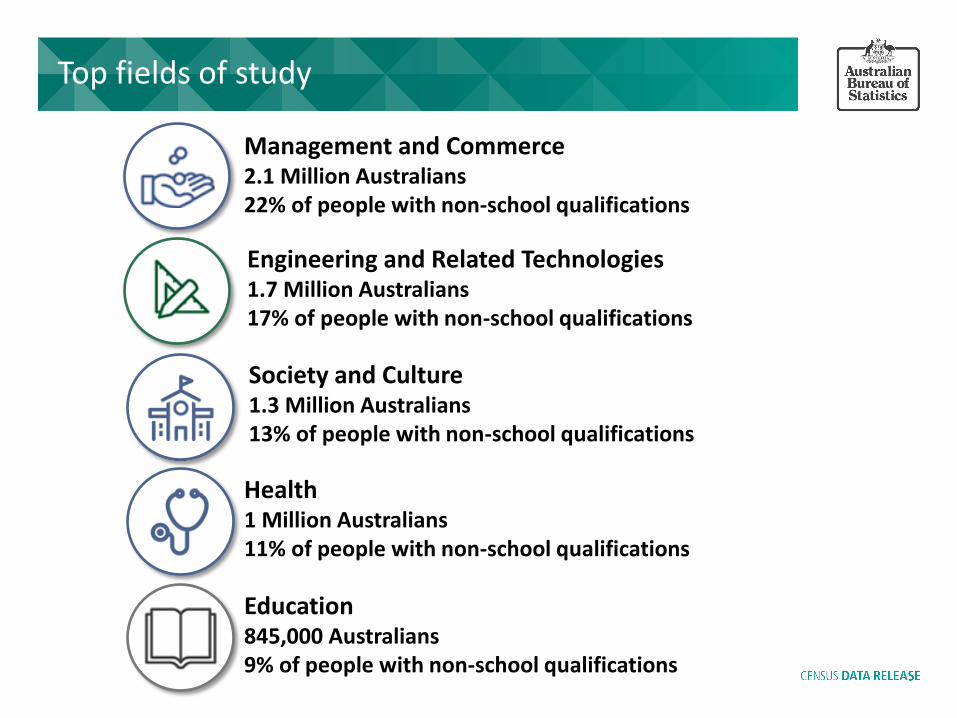
Top fields of study
Management and Commerce 2.1 Million Australians 22% of people with non-school qualifications
Engineering and Related Technologies 1.7 Million Australians 17% of people with non-school qualifications
Society and Culture 1.3 Million Australians 13% of people with non-school qualifications
Health 1 Million Australians 11% of people with non-school qualifications
Education 845,000 Australians 9% of people with non-school qualifications
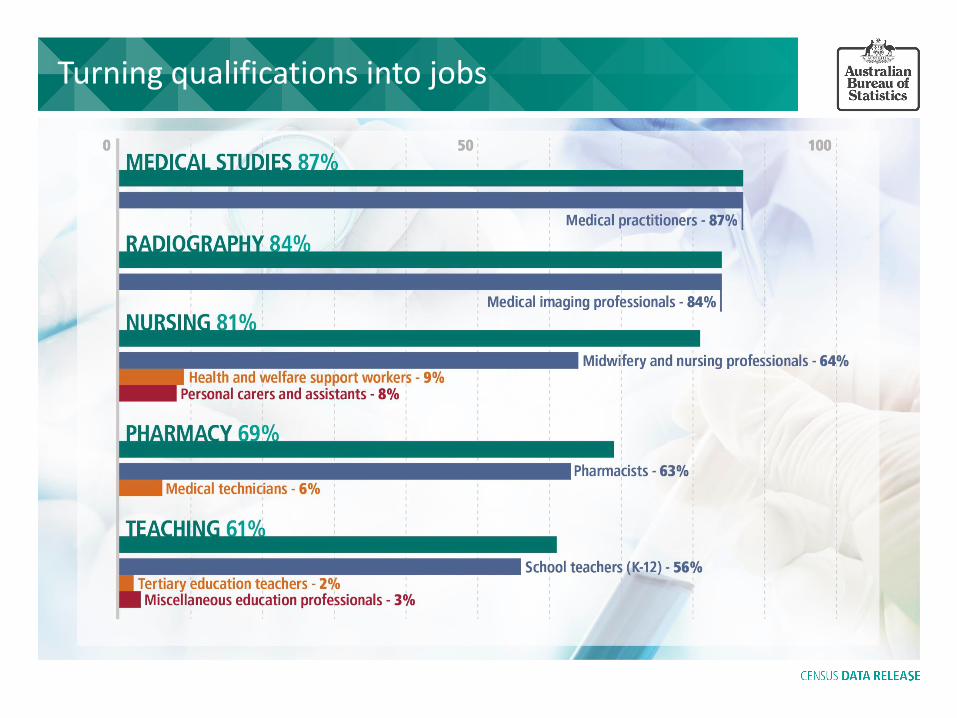
Turning qualifications into jobs

Qualifications with a diverse jobs outlook
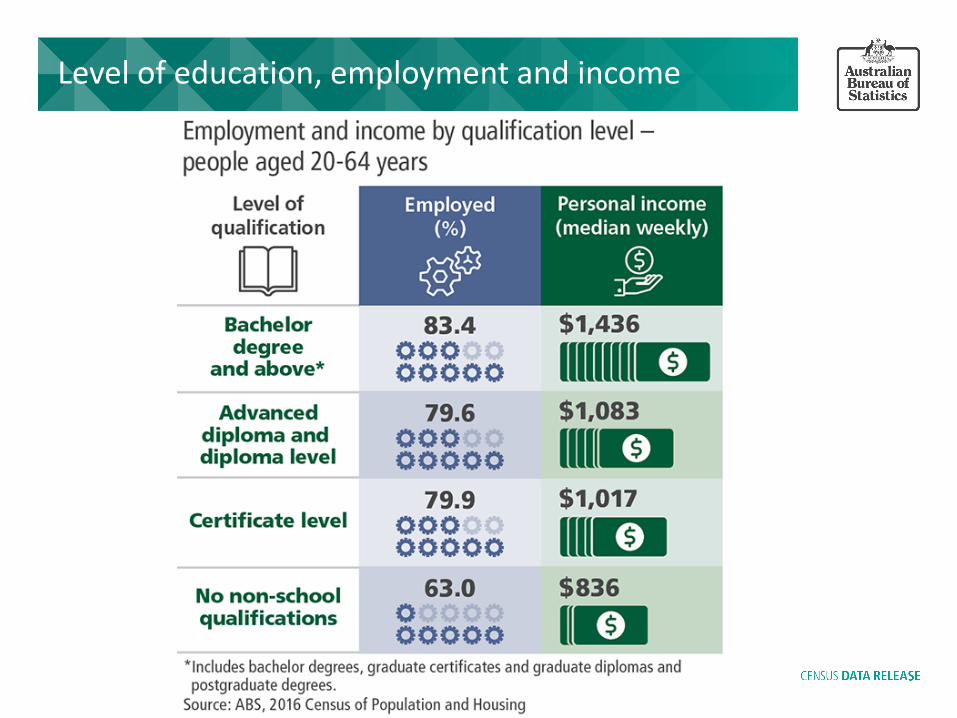
Level of education, employment and income

Top occupations by level of qualification

What should you study if you want to earn BIG $$?
Highest earning fields of study* Earning >$3,000/wk
% Employed
%
Anaesthesiology 60 76
Surgery 58 74
General Practice 56 89
Obstetrics and Gynaecology 51 69
Psychiatry 52 83
Highest earning industries*
Median Weekly Income
Oil and Gas Extraction 2,929
Petroleum Exploration 2,875
Iron Ore Mining 2,454
Petroleum Refining and Petroleum Fuel Manufacturing 2,277
Copper Ore Mining 2,268
* with >500 respondents
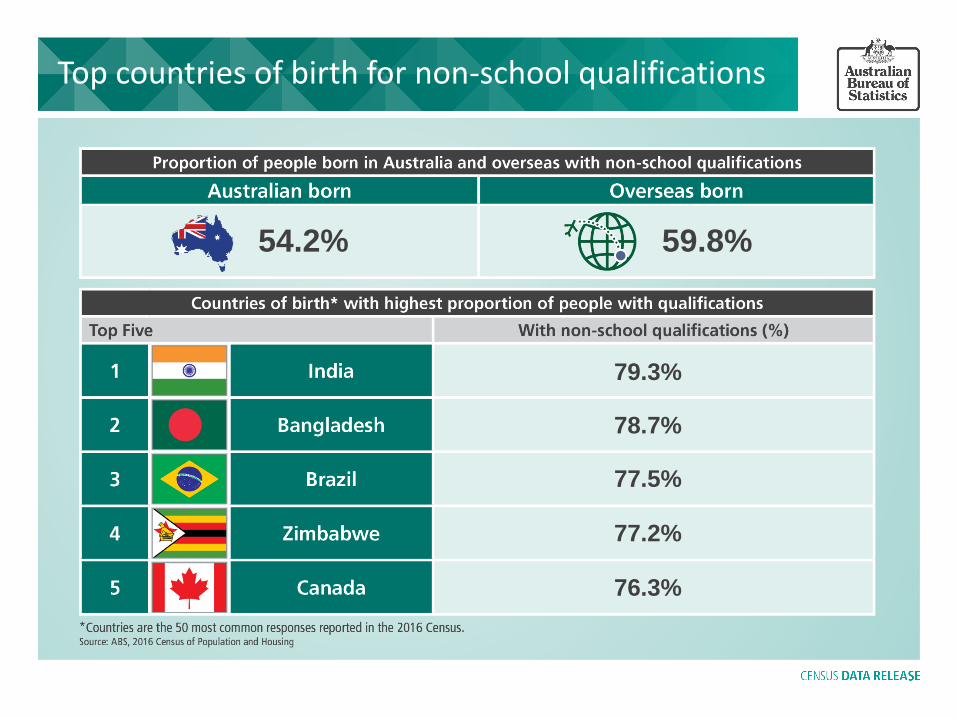
Top countries of birth for non-school qualifications
79.3%
54.2%
78.7%
77.5%
77.2%
76.3%
59.8%

Top fields of study for migrants 1996-2016
Population mobility
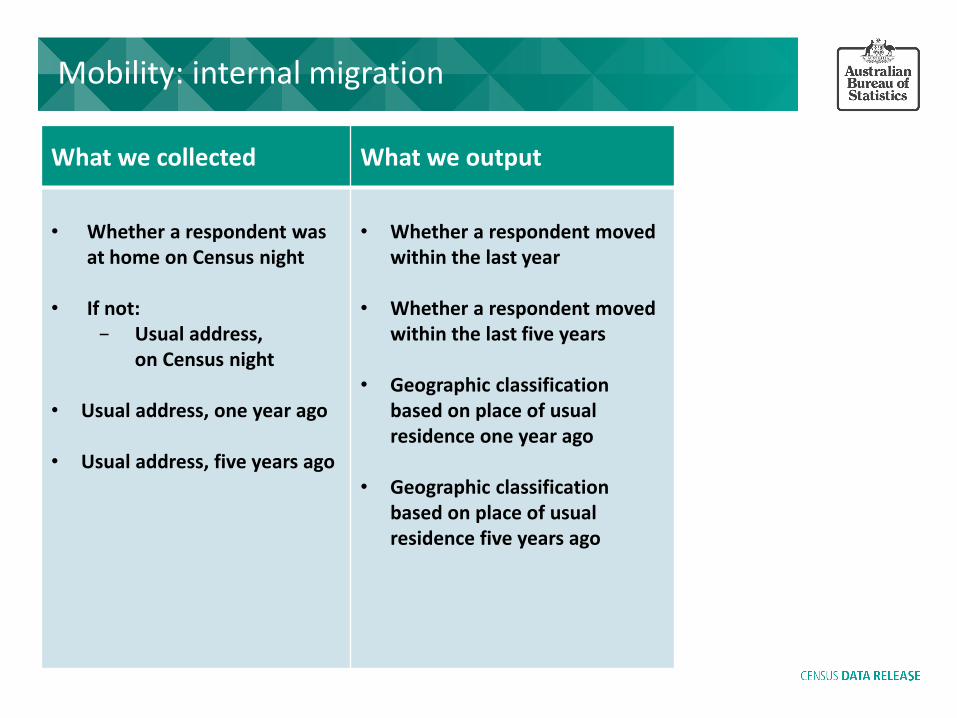
Mobility: internal migration
What we collected What we output
• Whether a respondent was
at home on Census night
• If not: − Usual address,
on Census night
• Usual address, one year ago
• Usual address, five years ago
• Whether a respondent moved
within the last year
• Whether a respondent moved within the last five years
• Geographic classification based on place of usual residence one year ago
• Geographic classification based on place of usual residence five years ago

Mobility: who’s moving?
0 5 10 15 20
15-19 years
20-24 years
25-29 years
30-34 years
35-39 years
40-44 years
45-49 years
50-54 years
55-59 years
60-64 years
65-69 years
70-74 years
75-79 years
80-84 years
85+
People that moved since 2011 %
Ag
e
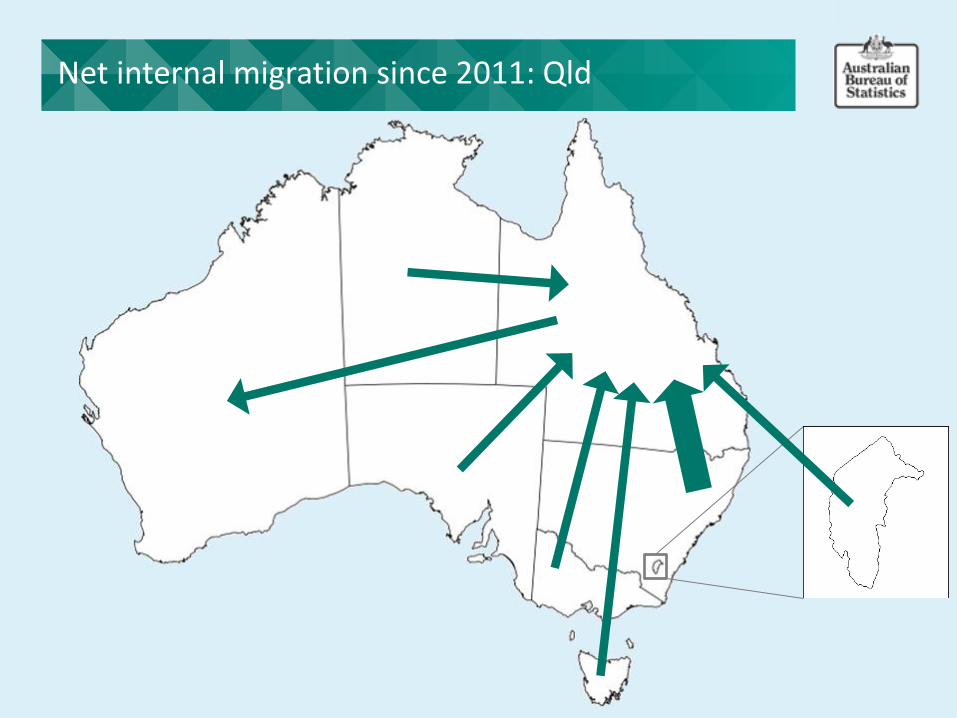
Net internal migration since 2011: Qld
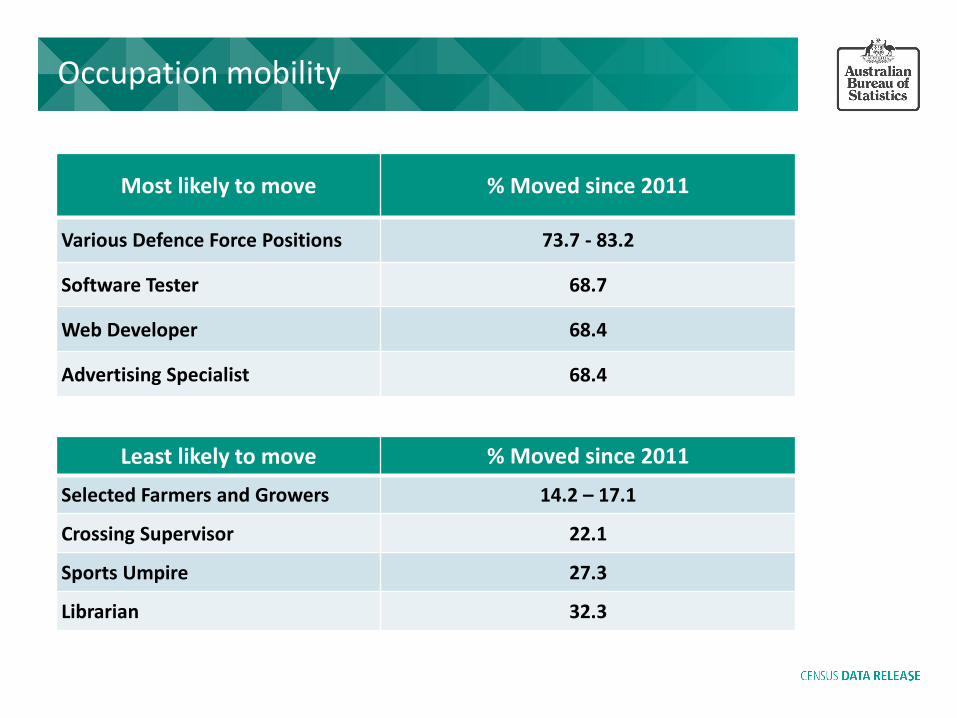
Most likely to move % Moved since 2011
Various Defence Force Positions 73.7 - 83.2
Software Tester 68.7
Web Developer 68.4
Advertising Specialist 68.4
Occupation mobility
Least likely to move % Moved since 2011
Selected Farmers and Growers 14.2 – 17.1
Crossing Supervisor 22.1
Sports Umpire 27.3
Librarian 32.3
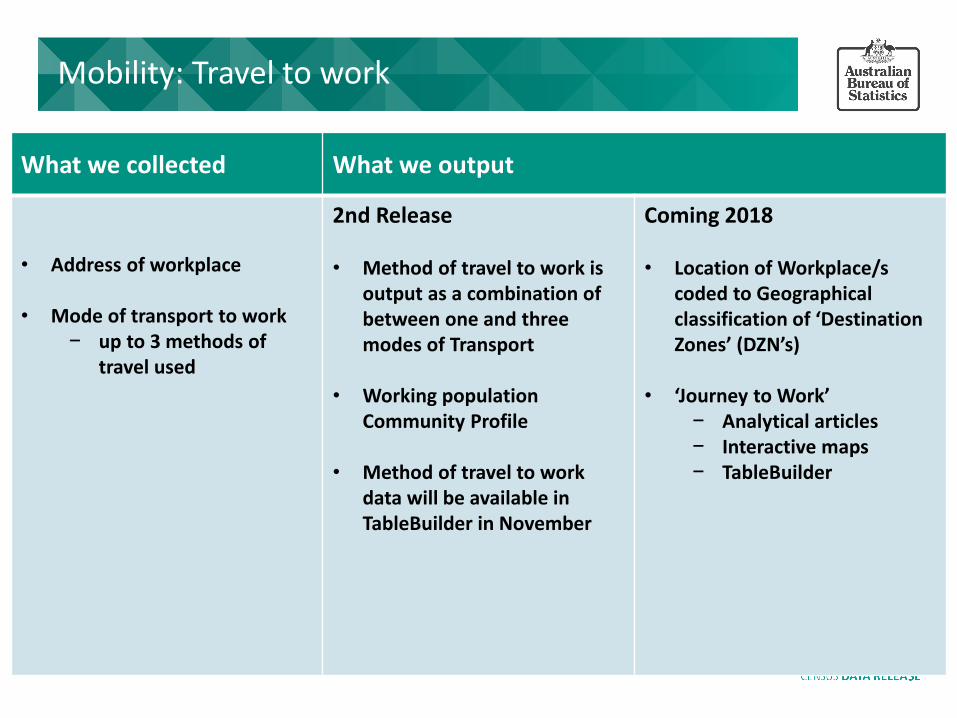
Mobility: Travel to work
What we collected What we output
• Address of workplace
• Mode of transport to work − up to 3 methods of
travel used
2nd Release • Method of travel to work is
output as a combination of between one and three modes of Transport
• Working population Community Profile
• Method of travel to work data will be available in TableBuilder in November
Coming 2018 • Location of Workplace/s
coded to Geographical classification of ‘Destination Zones’ (DZN’s)
• ‘Journey to Work’ − Analytical articles − Interactive maps − TableBuilder
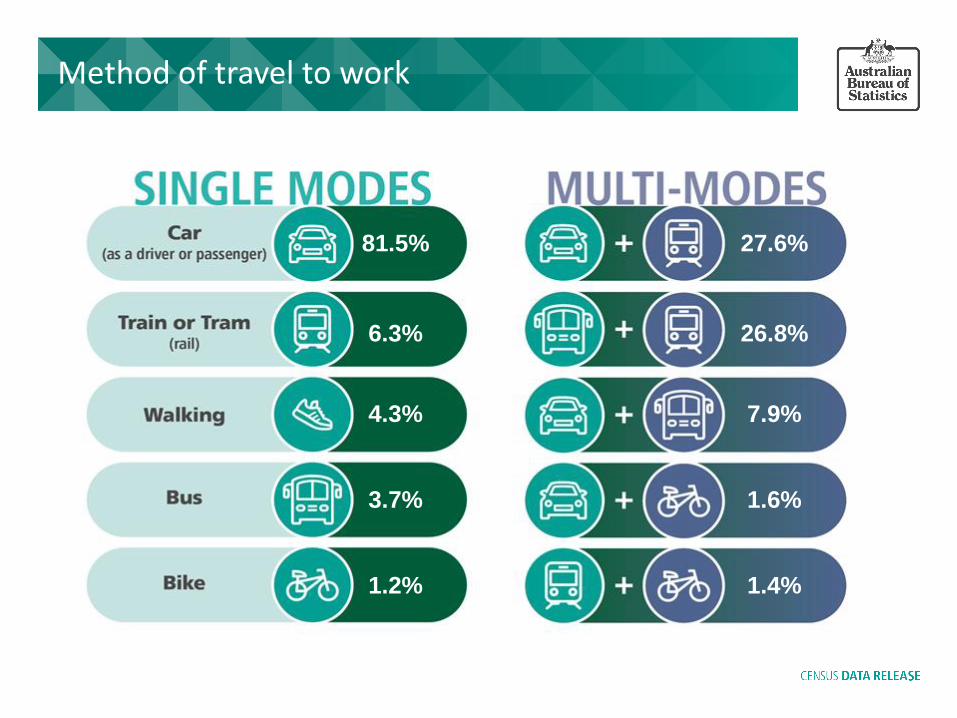
Method of travel to work
81.5%
6.3%
4.3%
3.7%
1.2%
27.6%
26.8%
7.9%
1.6%
1.4%
Accessing Census Data
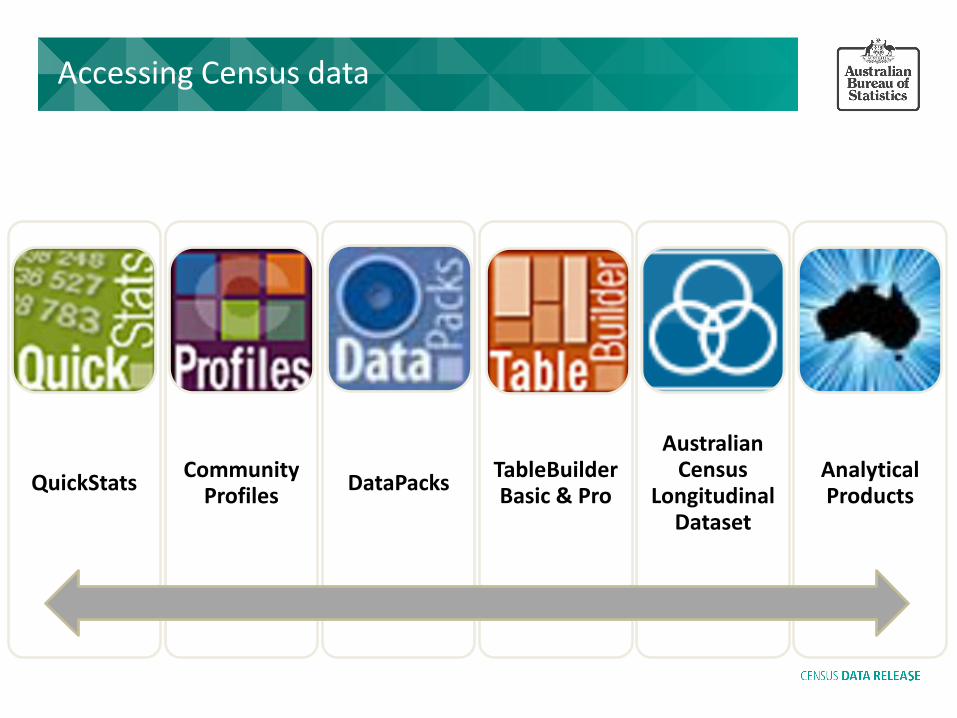
QuickStats Community
Profiles DataPacks
TableBuilder Basic & Pro
Australian Census
Longitudinal Dataset
Analytical Products
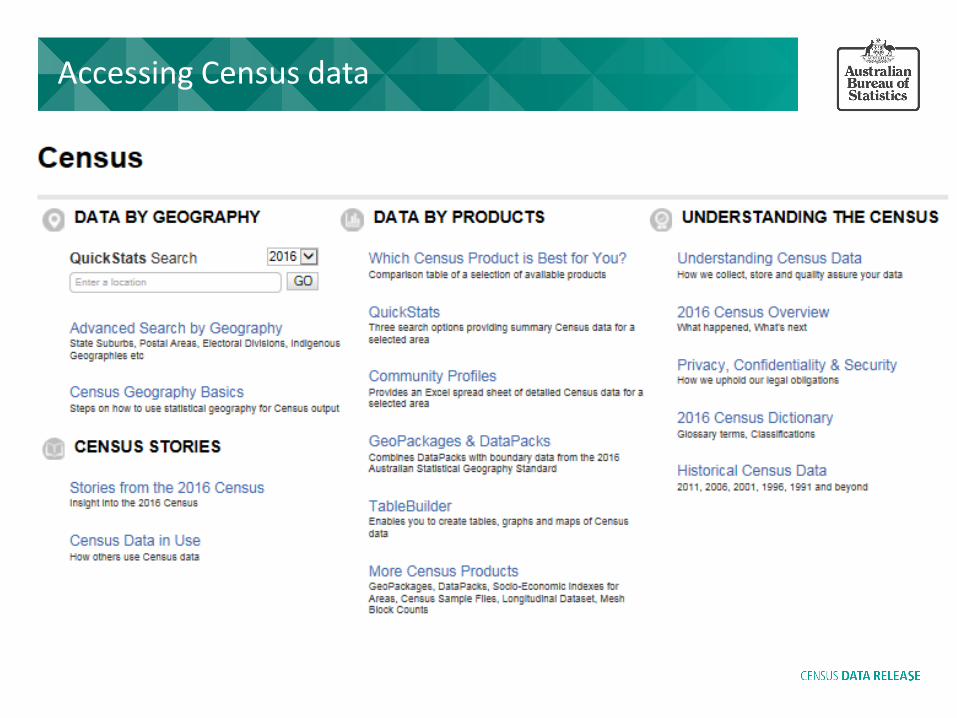
Accessing Census data

ABS website
Accessing Census data

Analytical products
Questions?
@ABSCensus
Census Australia
ABSstatistics
1300 135 070
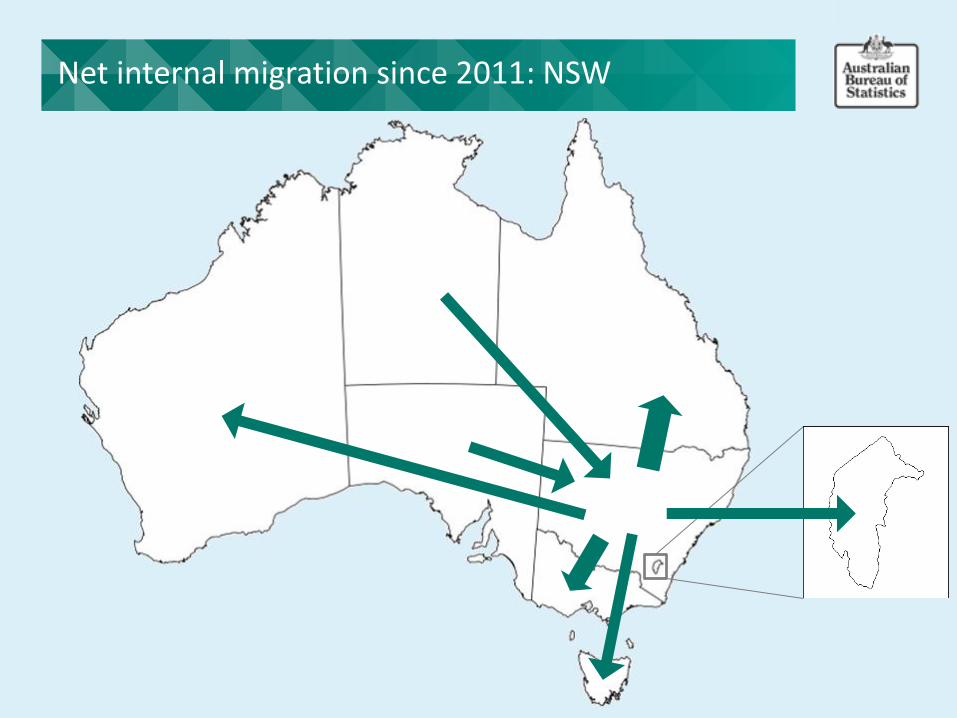
Net internal migration since 2011: NSW
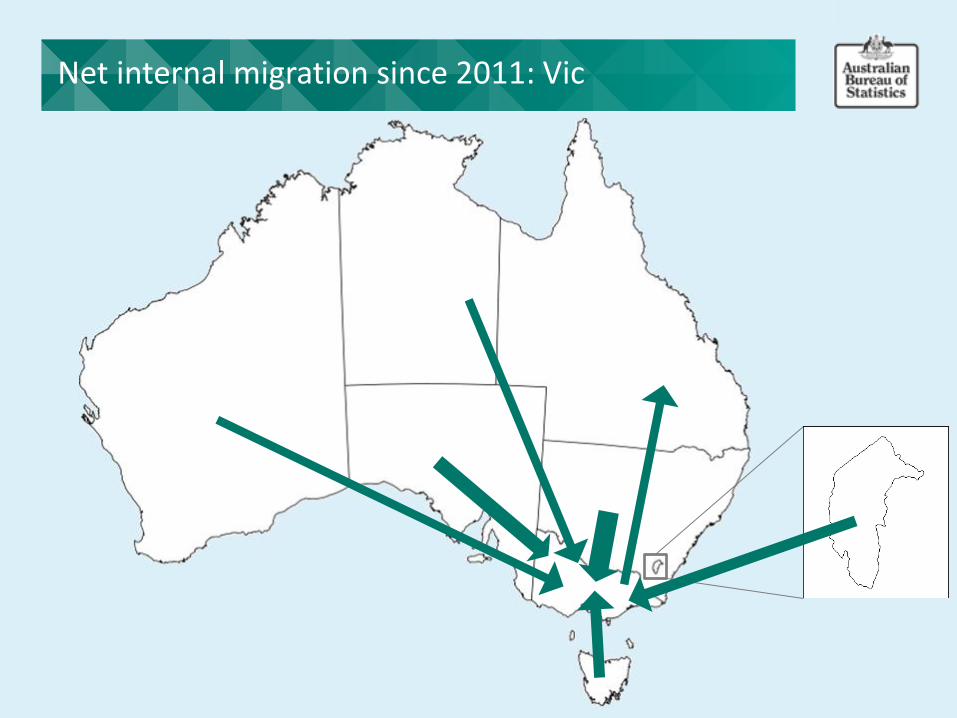
Net internal migration since 2011: Vic
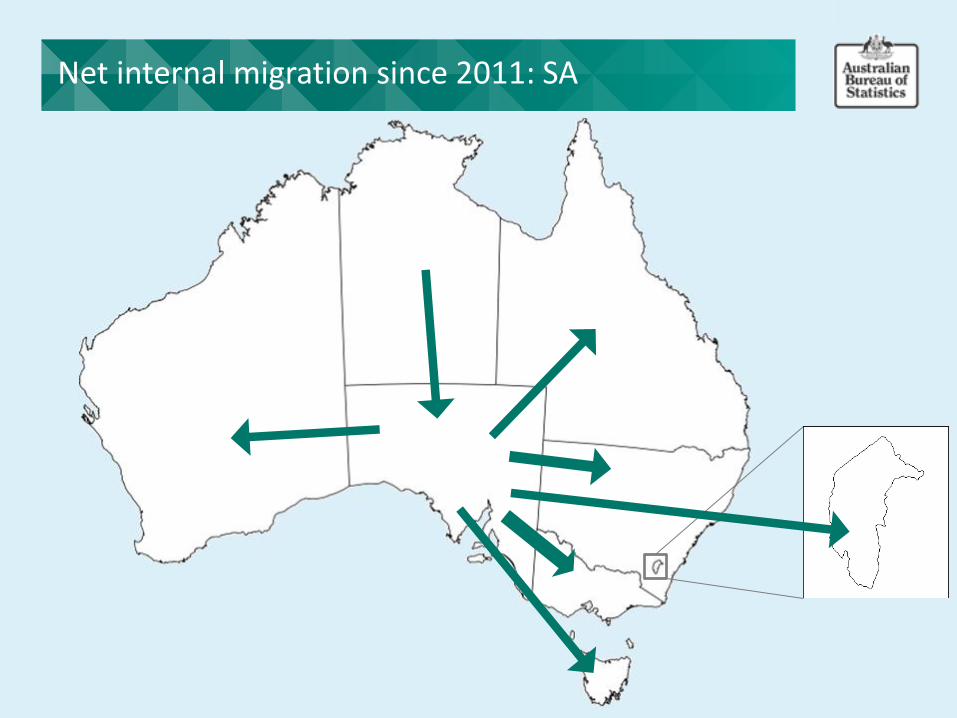
Net internal migration since 2011: SA
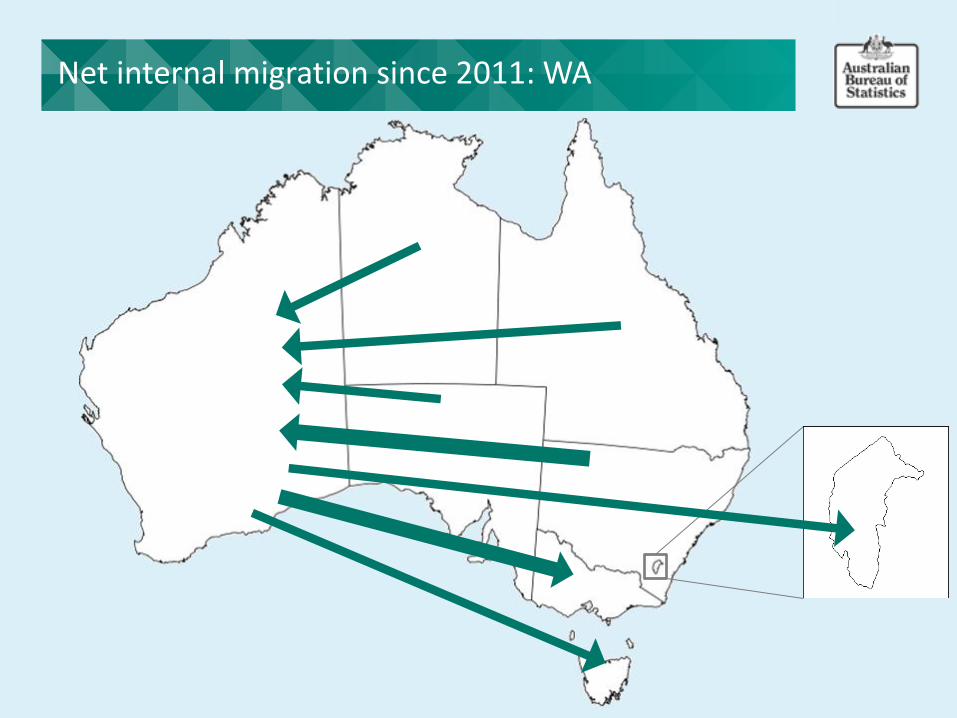
Net internal migration since 2011: WA

Net internal migration since 2011: Tas

Net internal migration since 2011: NT

Net internal migration since 2011: ACT

Appendix (a): Question changes 2016 vs 2011 Census
59

60
Appendix (b): Question changes 2016 vs 2011 Census
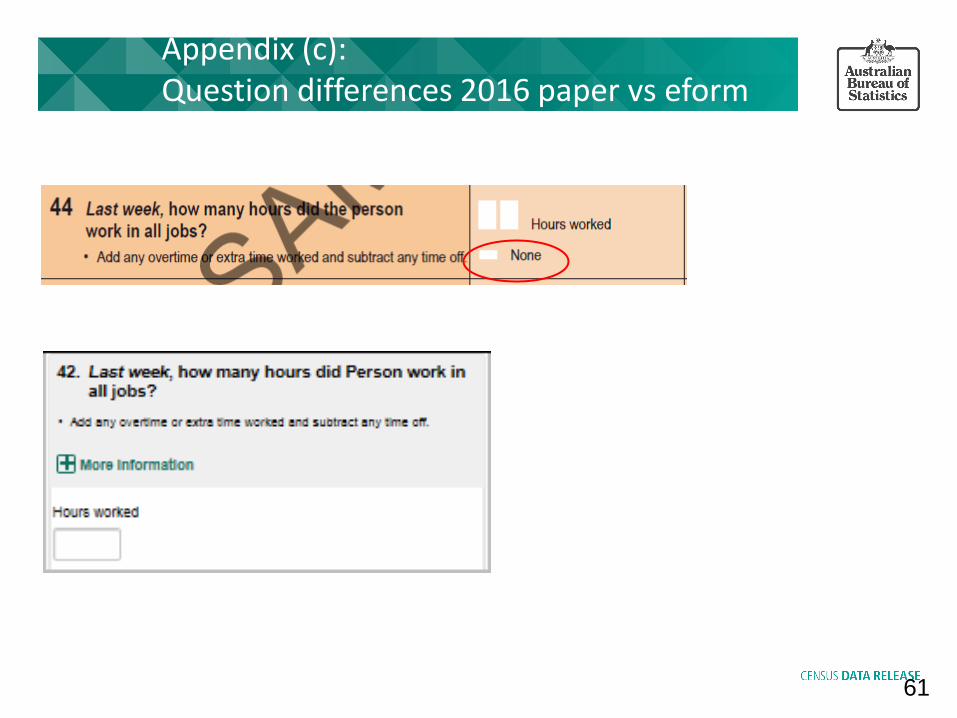
Appendix (c): Question differences 2016 paper vs eform
61
![SCANNER SPC MAX VERSION MX10 ABS MARCA … · abs marca vehiculos descripcion - abs averias mediciones otros audi tt ... teves abs/esp mk60 ec [can ... [94-02] 4.2 [v8] teves abs/asr](https://img.pdfslide.us/doc/110x75/5bbe3ab109d3f240228bfd55/scanner-spc-max-version-mx10-abs-marca-abs-marca-vehiculos-descripcion-abs.jpg)