Embed Size (px)
Citation preview
BY ACTIVE TRADER STAFF
46 www.activetradermag.com•March2012•ACTIVE TRADER
Chris Foster of Blackheath Fund Management
Moneymanagertapsinto“behavioralfinancespace”
withmulti-levelsentimentanalysis.
ACTIVE TRADER Interview
S entiment is one of those concepts that tends to occupy the margins of market analysis. It can take a variety of forms, contains many nuances, and can be a challenge to
interpret and apply in a quantifiable trading model. As a result, while many traders express the value of sentiment in their research, they are also likely to reference it as an adjunct or confirming component rather than use it as the main engine of a trading strategy.
Not so for Chris Foster, CEO and portfolio manager of Blackheath Fund Management, Inc., the Toronto-based commodity trading advisory (CTA) he launched in 2009. His longest-running trading program (which dates back to 2003), the Sentiment Strategy, conspicuously uses market sentiment as its primary input, carving out a unique space in a market awash in trend followers and systematic quant traders. (The firm has a second program, the Volatility Arbitrage Fund, which is an options
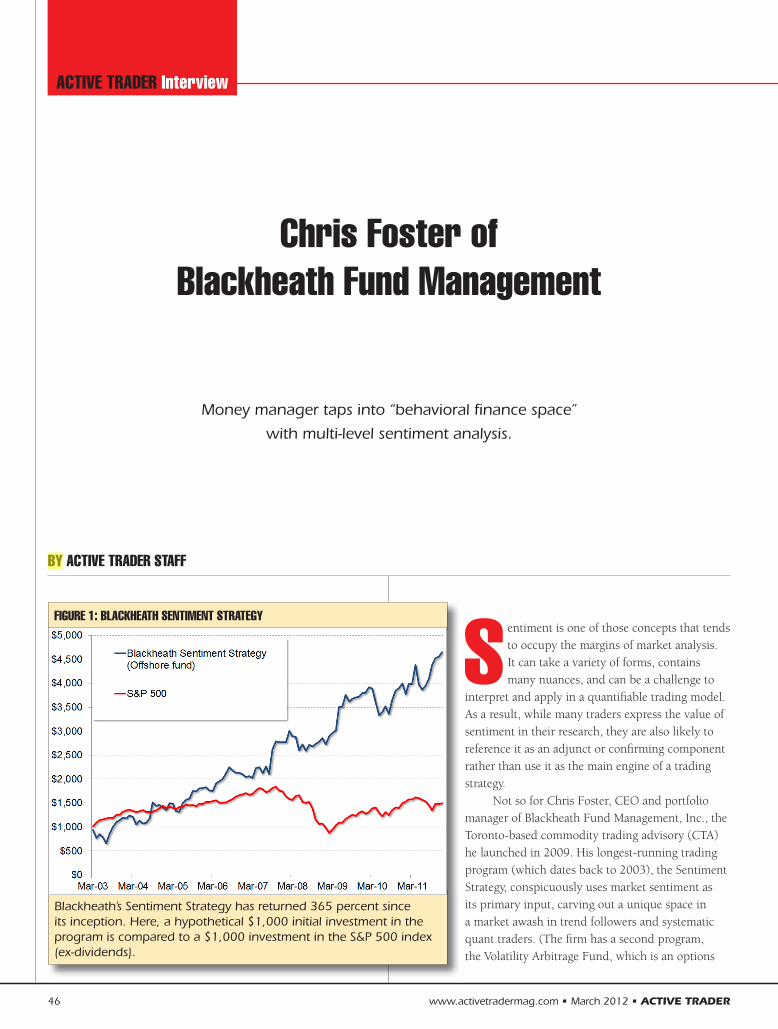
FIGURE 1: BLACKHEATH SENTIMENT STRATEGY
Blackheath’sSentimentStrategyhasreturned365percentsinceitsinception.Here,ahypothetical$1,000initialinvestmentintheprogramiscomparedtoa$1,000investmentintheS&P500index(ex-dividends).

ACTIVE TRADER •March2012•www.activetradermag.com 47
continuedonp.48
trading strategy based on exploiting the relationship between implied volatility and realized volatility.)
So far, Foster has had a great deal of success translating the sometimes imprecise nature of sentiment data into concrete returns. The Sentiment Strategy, which has approximately $31 million under management, recently completed its ninth con-secutive year of positive returns — and sixth year of double-digit gains — posting a 16.8-percent return for 2011 and bringing its cumulative return since March 2003 to 365 per-cent. Figure 1 compares the growth of a hypothetical $1,000 initial investment in the program to the growth in the S&P 500 index (ex-dividends). Figure 2 (p. 50) shows the program’s an-nual returns through 2011.
Foster, 49, says he became interested in the futures markets when he was a student at the University of Toronto, where he majored in philosophy and English. For someone who wanted to pursue a career trading futures, however, opportunities were relatively limited in Canada. His father, an investment advisor and portfolio manager, informed him there was really only one derivatives shop in Canada — the Friedberg Mercantile Group, headed by Albert Friedberg, a legendary Toronto-based CTA and hedge-fund manager. So that’s where Foster set his sights.
“I basically called him every day until he gave me a job,” he says.
Foster describes Friedberg as a classic global macro manager who drew on every conceivable source of information when put-ting on a position. “He uses everything,” Foster notes. “He’ll look at some technicals, supply and demand fundamentals, monetary policy, geopolitics, sentiment — anything.”
Foster worked at Friedberg from 1989 until 2000, and it was there he says he first became interested in sentiment surveys. In his later years at the firm, Foster got onto Friedberg’s investment committee and became an associate portfolio manager.
“One of my little responsibilities was to track some of the sentiment surveys [Friedberg] used,” he says. “I knew in the 1990s global macro managers were becoming slightly out of fashion — people were becoming more sensitive to volatility and drawdowns — and I knew if I was going to make it on my own,
I would have to become a bit more sensitive to position sizes, drawdowns, and risk.”
Foster’s initial forays into developing a sentiment-based trading approach weren’t particularly successful, however.
“During those years I was trying to turn my studies of senti-ment indicators into a purely mechanical trading system,” he says. “That ultimately failed. I could never really make it entirely mechanical — it just didn’t work.”
Foster left Friedberg in 2000 and went to work at Scotia Capi-tal. By 2002 or so, he thought he had finally developed “some-thing robust, something that could work fairly consistently.” So, he pitched this sentiment-based investment strategy to Chris Harrop, his current business partner and compliance officer, who was working at Sprott Securities at the time.
“He was really taken by the idea, simply because it was such a novel investment strategy — nobody was doing it,” Foster says. “Nobody is doing it now, for that matter.”
Foster says while his goal was to pitch Harrop on becoming a client and following this investment strategy, Harrop said he would do Foster one better.
“He actually launched an offshore fund for me,” Foster says.
Photocredit:MatthewPlexmanPhotography

48 www.activetradermag.com•March2012•ACTIVE TRADER
Active Trader Interview
“He put a few hundred thousand dollars in a fund based in the British Virgin Islands and said, ‘You just trade it, and let’s see if we can get a track record going. In four or five years if we can demonstrate we have something that can make money, we’ll take our show on the road.’”
By the middle of the new millennium, Foster was trading the offshore fund, and his strategy was also attracting a great deal of attention among Scotia clients. When he ultimately left the firm in 2009 to formally launch Blackheath, those clients became the initial clients of his Canadian fund. “They were basically my seed capital,” Foster says.
Foster talked to Active Trader in late December and early Janu-ary about his fund’s approach to analyzing and trading market sentiment data.
AT: “Sentiment”sometimesseemstomeandifferentthingstodifferentpeople.Whatspecificdataareyouusingandhowareyouusingit?
CF: We measure sentiment several ways, and essentially put the data in three major “buckets.” The first bucket consists of pure, quantitative sentiment surveys. There are a number of survey companies out there — Investors Intelligence, Bloomberg, Mar-ket Vane, and so on — that poll traders, investment managers, and newsletter writers to ascertain the percentage of those people who are bullish.
The way we look at these surveys is unique, I think. Many peo-ple just look at them as knee-jerk contrarians: “Oh, the survey is 90 percent, that means the market is overbought. Or, “the survey
is at 14, that means it’s oversold.” That’s sort of the way Albert Friedberg would use them — to get a notion of whether a market was very overbought or very oversold. That’s useful, perhaps, but that’s not how we use the data.
What we look for are divergences between price action and sentiment. For example, if a survey is 85 one week, which is a very high number for most sentiment surveys, and then goes to 90, that’s not necessarily a negative thing — as long as the market went up a fair bit during the same period. On the other hand, if the sentiment survey went from 85 to 90 while the market was flat to down, that’s a negative divergence in our investment strategy. We’re looking for divergences between the direction and magnitude of the sentiment change and the direction and magni-tude of the price change.
AT: Hasthesentimenttradingprogramchangedsinceyoustartedtradingitin2003?
CF: No. Many of the sentiment inputs we use have changed in terms of their frequency — how quickly they come to us — so there’s been some glacial change in the data we put into the sys-tem. But the system is essentially 100 percent intact.
AT: Areyouanalyzingdataonamarket-by-marketbasis,orusingsometypeofcompositenumberorindexforsectors,forexample?
CF: Some surveys cover all the markets, some surveys cover only some of the markets.
The next bucket is CFTC data, which we rely heavily on. The CFTC publishes a great deal of information on positioning, and the nature and frequency of that data has changed a great deal over the years. (The Commodity Futures Trading Commission publishes its Commitments of Traders report on a weekly basis; see p. 20 for details about the report.) The CFTC is under pressure to provide more transparency in the futures markets, so it’s been publishing more and more data about who owns what, and it’s been slicing and dicing that data into more discrete categories.
“Somepeoplesaytome,‘Oh,soyou’re
acontrarian—youshortmarketswith
sentimentof95andbuymarketswith
sentimentof15.’That’snotwhatIdo—
Ithinkthat’sacrazyinvestmentstrategy.”

ACTIVE TRADER •March2012•www.activetradermag.com 49
For example, while the designation for one category of traders used to be simply “non-commercial,” it’s now broken down into swap dealers, managed futures, and general hedge funds.
We look at this data very much the same way we look at the sentiment survey data. For example, we’ve found the small speculator component in a market like silver is very indicative of small, retail trader positioning. We will use that the same way we would use a sentiment survey: If we notice, say, a particular period during which the small speculators get increasingly long when the price is down, it’s a measure of increased bullishness on the part of small speculators. That’s a bearish input.
But you have to understand this data to know when a category is relevant and when it’s not. For example, in corn, the small speculator or “non-reportable” component is actually mostly hedgers — guys farming a few acres or feed-lot operators, for example.
AT: Whichmeansit’saverydifferenttypeofnon-report-abletraderthaninsilver.
CF: Exactly. You need some experience with the data to be able to appreciate whether or not it’s a proper reflection of specula-tive sentiment. We’ve been doing this for many years, so we’ve gotten to know the data. Sometimes we use the small speculator component, sometimes we use the managed futures component, sometimes the general hedge fund component. And we’ll prob-ably have to make more adjustments down the road because the CFTC continues to change the way it reports the data.
The third bucket of data is one we use very infrequently — it’s basically the “farm team” for our regular sentiment inputs. It consists of several things, some of which aren’t necessarily ready for prime time. It’s sort of a general “anecdotal” bucket. But we still consult these indicators.
For example, we look at option skews — not systematically,
just to identify dramatic instances of gross overvaluation of calls vs. puts in a market. We’ve seen this in the gold market a lot over the past couple of years: Puts will become much more expensive than calls, and then calls will become much more expensive than puts. We’ve also seen it in crude oil. Although we don’t use this systematically yet, we think there’s something there. But it needs more study.
AT: Areyoutalkingaboutpricemisalignmentsbetweencallandputsthatareequallyinthemoneyandoutofthemoney?
CF: Correct.
AT: Doyouinterpretthisdatainapurelycontrarianfash-ion—forexample,withtherelativeovervaluationofcallsvs.putsreflectingahighlevelofbearishnessandthusa
continuedonp.50
FIGURE 2: ANNUAL RETURNS
TheSentimentStrategyreturned16.8percentin2011,itsninthyearinarowofpositivereturns,andsixthdouble-digityear.

potentialsellorshortindication?
CF: Yes, or at a minimum a reflection of the fact that sentiment has changed. Many of our inputs are slow moving, so a big spike in volatilities, skew, or both can provide some “color” between data points.
AT: Inaway,thissoundssimilartousingput-callratios,exceptthatitisbasedonoptionvalueratherthanoptionvolume.Doyoufindanyvalueinput-callratioanalysis?
CF: I’ll add that to my list of research projects. That’s one of the things about this area of inquiry: Now that we have a structured way of approaching sentiment, there are many inputs we can consider. The challenge is finding the time and human capital to properly investigate them.
Other things we look at anecdotally are newspaper headlines and analyst forecasts. One of my favorite indicators, which we
unfortunately don’t get to use very often, is leapfrogging analyst targets.
AT: Whatdoesthatmean?
CF: You know how analysts are: Copper goes from $3 to $4, and suddenly analyst forecasts go from $3 to $4. And sometimes, when a market really starts to heat up — say, when copper goes from $4 to $4.50 — analysts say, “OK, $5.50 is my new target.” They stop following a market and start anticipating it. That, I believe, could signal negative divergences if we followed it more closely, but again, it’s something we don’t get much data on, and there are very few instances of it.
So, those are our three general types of inputs. To generate a trade signal, what we’re looking for are those divergences I mentioned earlier — when a market is going in one direction and sentiment is going in another.
AT: Howdoyoucombinetheinputs?Isitpurelydiscretionary,orisitasys-tematicprocess?
CF: The way we combine the inputs is mechanical in the sense that we don’t do anything unless we have divergences. For example, yesterday (Dec. 28) I went short soybeans (Figure 3). Over the past few months there have been a number of negative divergences in soybeans — soy-beans have gone down and sentiment has actually become more bullish in a number of instances. That suggests this downtrend is sustainable, because people are not get-ting more bearish as the price is coming down.
It’s sort of the opposite of a “wall of worry”: The market’s coming down, but no one’s worried. The Street’s not aggres-sively short, there’s still a fairly large long position out there, and sentiment is still
50 www.activetradermag.com•March2012•ACTIVE TRADER
Active Trader Interview
FIGURE 3: SOYBEANS
FostershortedthesoybeanmarketinlateDecemberbecauseofnegativesentimentdivergences—thatis,sentimentbecamemorebullishdespitethemarket’spricedecline.Source:BlackheathFundManagement

ACTIVE TRADER •March2012•www.activetradermag.com 51
fairly high — people are remaining bullish even though price is still trending lower. That’s given us enough evidence to put soy-beans on watch for a sale. The market has actually rallied a little over the past couple of weeks — we saw a lot of short covering. But for better or worse, we shorted soybeans.
Without these quantifiable divergences, we just won’t take a trade. Whether or not we have enough evidence to say we can go short soybeans now — that’s where discretion comes in, and that’s really my job as a portfolio manager.
The soybean trade I just described is a classic type of trade for us. Other people who use sentiment indicators typically say to me, “Oh, so you’re a contrarian — you short markets with senti-ment of 95 and buy markets with sentiment of 15.” That’s not actually what I do — I think that’s a crazy investment strategy. I’ve back-tested it, I’ve tried it, and [I’ve] lost lots of money. The much better way to use sentiment is to find markets trending in one direction when sentiment is not becoming overbought or oversold.
Here’s the classic wall-of-worry scenario: A market is going higher, but no one’s bullish, no one gets longer. I don’t know why the market is going higher — quite frankly, I have no clue why the market is going higher — but those are signs to us there’s a sustainable bull move. It isn’t being buoyed by hot-money flows, speculative money flows, or retail buying, it’s just going up — probably for some very good fundamental reason. As a result, we typically find ourselves long or short in “denial” markets — mar-kets that are going down but no one’s getting really bearish, or markets that are going up and no one’s getting really bullish.
AT: Howoftendoyourunintofalsesignals?
CF: It can be a difficult situation when you get, say, a rampaging bull market like gold roaring higher above $1,900 an ounce, and it signals a negative divergence for perhaps one week. That’s not enough to stand in front of a [powerful] uptrend.
We actually have a fairly high threshold for standing in front of uptrends or buying serious downtrends. For example, we bought natural gas a couple of times, much to our chagrin, and it’s given us a multi-week series of divergences — one, two, three, four positive divergences. Then we bought it, and of course it dropped
another 50 cents and took us out. But we need more than one week’s input to take a trade.
That’s another thing about the program — it’s very slow mov-ing. We do 350 round turn trades per million (dollars). Com-pared to the majority of the Street these days, that’s very, very low.
AT:Whatmarketsdoyoutrade?
CF: We only trade instruments with good CFTC data, which ba-sically restricts us to U.S. markets. We don’t trade stock indices. We could, and would probably be profitable, but very early on we chose not to in order to avoid any unintended correlation to stocks. Also, we don’t trade fixed income much because we have trouble with some of the data.
We don’t trade based on fundamentals and we don’t trade on technicals, so I think that gives us a low correlation to the rest of the CTA universe; we have a 40-percent correlation to the Barclay CTA index, for example. And the fact that we don’t trade much fixed income, which I think is largely what CTAs, particularly the very large ones, are trading these days, also contributes to our low correlation.
AT: Itlookslikecurrenciesaccountforasignificantportionofyourportfolio.
CF: Yes, which surprises some people. They tend to think the CFTC data isn’t good in terms of currencies, because if you look at the Australian dollar currency futures, for example, it’s very small compared to the [spot] market. But we’ve actually had a fair
continuedonp.52
“Youhavetounderstandthisdatato
knowwhenaCOTcategoryisrelevant
andwhenit’snot.Incornfutures,
forexample,thesmallspeculator
componentmostlyconsistsofhedgers.”

bit of success trading currencies. It’s our belief the speculative po-sitioning data we get for currencies is very representative of what these players are doing across the whole FX market.
AT: Howlongdoesatypicaltradelast?
CF: Around 25 days.
AT: Thatactuallysoundsrelativelybriefgiventhelonger-termand“slow-moving”natureofthesentimentdatayou’reusing.Isthistradelengthbasicallyreflectingthefactthatlosersareclosedoutquickly?Istheaveragewinnersignificantlylongerthantheaverageloser?
CF: Yes, definitely. We hold our winners about 30 days longer than losers, so there’s some truth to that. But we’re also capable of having some very long-term trades. For example, in 2009 we were long copper for about half the year.
AT: Giventhebroadnatureofmostsentimentindicators,doyouincorporateothertoolstotimeentries?Also,areyouusinganythingotherthanyoursentimentindicatorstoexittrades?
CF: To answer the second question first, it’s sort of a closed loop in that negative divergences will get us out of long trades and positive divergences will get us out of short trades. However, on a short-term timing basis, we look fairly closely at volume and open interest to see if there’s any evidence of positioning or senti-ment having changed dramatically since our last [regular senti-ment data] input, because the data we use arrives infrequently — weekly.
Let’s say we’re looking to buy gold and it’s in an uptrend, and we’re noticing no one’s really getting long and sentiment is very moderate. Then we see a lot of positive divergences [setting up a long entry], but we notice just before we’re going to buy there’s a
huge volume spike and open interest has increased dramatically. That’s probably a sign fresh longs are coming into the market that we haven’t seen reported yet. We use that information a bit for timing.
AT: Ireadsomethingonyourwebsitetotheeffectthatoneoftheprogram’sgoalsistoidentifyspeculativeortrendingmarkets“thatarebeingignored.”Whatdoesthatmean?
CF: That’s the wall-of-worry scenario I was describing. We’ve seen that particular situation in the platinum market — and plati-num is one of the few trades we have on right now. We’ve been short for months and, for whatever reason, platinum has been trending lower — it’s been coming down since early summer 2011, and people aren’t getting out, people aren’t shorting. I don’t really understand why, but this is a market that is trending lower that has been totally ignored: The speculative community is not short platinum — on the contrary, they’re quite long, they’re getting killed, and they’re not getting out. That’s what I’m talking about in terms of a market that is being ignored.
If this was the copper market — people like to be short copper — instead of being long 15,000 or 20,000 contracts, the specula-tive community would be short 20,000.
AT: Howwouldyouadviseretailtraderswhowanttoincorporatesentimentdataintheirtrading?
CF: You know, I hear a lot of talk in the press to the effect of, “No one’s long” or “No one’s short” or “This is being ignored” or “This is overbought or this is oversold.” And I’ve found the phrases along these lines that commentators and analysts utter are almost 100 percent subjective; they’re used primarily to buttress a certain point of view the analyst or commentator has. They are not quantitative and they are not quantifiable — they’re largely “impressionistic.”
I would strongly encourage people to actually find some data that will either substantiate or negate what a commentator says. I’m just shocked sometimes, because I’ll be watching CNBC or some other show and someone will say, “Funds are loaded to the gills long the Australian dollar.” And I’m sitting there thinking, “No they’re not. What are you talking about?” I know they’re not because I’ve actually seen the data — I’ve seen the sentiment
52 www.activetradermag.com•March2012•ACTIVE TRADER
Active Trader Interview
continuedonp.54
“We’relookingfordivergencesbetween
thedirectionandmagnitudeof
sentimentchangeandthedirection
andmagnitudeofpricechange.”

Active Trader Interview
Online resources
54 www.activetradermag.com•March2012•ACTIVE TRADER
“Weback-testedmechanicaltrading
basedonoursentimentinputs,andit
simplydidnotwork.Werealizedwe
neededadiscretionaryoverlay.”
surveys, and people are not choking on long Australian dollar positions. But because these guys don’t believe this information can actually be quantified, they can say whatever they want.
AT: What’stheroughestpatchyou’vegonethroughsinceyoulaunchedtheSentimentStrategyprogram?
CF: I think one of the roughest stretches we had was actually in 2003. We had a huge drawdown — I think it was around 33 percent. At the time I didn’t really appreciate how important it was to consider overall portfolio volatility. In our program, if I get a bearish input in coffee, I’m probably getting bearish inputs in other soft commodities — sugar, cocoa, and so on. And in the early days, if I got bullish inputs in all three soft commodities, I would buy all three, and if I got bearish inputs in the precious metals, I’d be short silver, gold, and platinum. And because of the correlation between those positions, the overall portfolio volatil-ity was really, really high.
Since that time we’ve put in an overall VAR (value at risk) maxi-mum of 6 percent in our portfolio, which stops us from getting “too hot.” Each day we do a 500-day look-back of our portfolio to determine whether it would have swung more than 6 percent in a day had we held it at any time over that period. And if it did, that would trigger our “VAR alarm,” which would tell us the port-folio might look fine today, but it’s actually potentially very hot. That was one of the early mistakes I made as a portfolio manager — allowing my portfolio to get too hot.
AT: Whatkindofformaltesting,ifany,didyoudowithyourprogram?Itsoundslikeitmightbeverydifficult,giventhesentimentinputsyouuse.
CF: We did historical back-testing of mechanical trading based on our sentiment inputs, and it simply did not work. We realized we needed a discretionary overlay, because as I mentioned, some of the data can be “dirty,” and you need to understand it well enough to know whether to exclude it or take it seriously. Unfor-tunately, with a discretionary element, you can’t do back-testing, because you can’t ask, “What would I have done in that circum-stance at that time?” So, it’s impossible.
One of the things I’m excited about, personally and profes-sionally, is that there doesn’t seem to be a lot of people occupying the “behavioral finance” space. It’s strange, really. George Soros discusses an idea called “reflexivity” in his books. He’s a really great writer, but I don’t think he necessarily explains the idea particularly well; it took me a long time to figure out what he was talking about. His idea is that there is no equilibrium level [in markets], because there’s a reflexive relationship between people and price: If the price goes higher people can actually get more bullish, not less bullish; instead of inspiring them to sell, rising prices can actually inspire them to buy. So what the hell is that? That’s totally the opposite of what we’re taught in economics — that prices are supposed to come down to an equilibrium level. Instead, rising prices can actually create more demand — in effect, they can pull demand from the future, because people think, “I know I need to buy the market in six months, but it’s going up so I better buy it now.”
There’s a symbiotic relationship between price and people’s appetite to buy. George Soros says understanding this — the psychology of investing — is extremely relevant to demand, and real demand is what has allowed him to be successful. He’s been talking about this for 20 years, but no one’s incorporated it into a stand-alone strategy yet. ◆
Blackheath Fund Management, Inc. blackheathfundmanagement.com
CFTC Commitments of Traders Report www.cftc.gov>MarketReports>CommitmentsofTraders
Market Vane www.marketvane.net
Investors Intelligence www.investorsintelligence.com