Embed Size (px)
Citation preview
CHOU ASSOCIATES FUND
CHOU ASIA FUND CHOU EUROPE FUND CHOU BOND FUND CHOU RRSP FUND
ANNUAL REPORT 2007
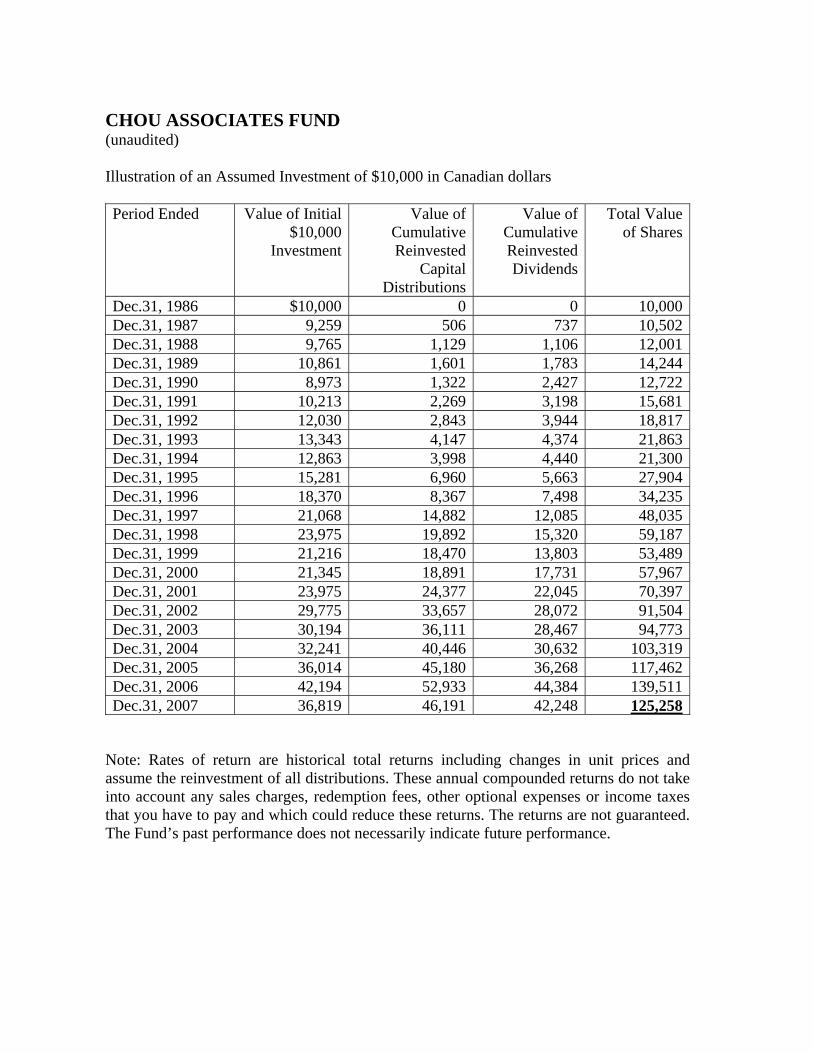
CHOU ASSOCIATES FUND (unaudited) Illustration of an Assumed Investment of $10,000 in Canadian dollars Period Ended Value of Initial
$10,000 Investment
Value of Cumulative Reinvested
Capital Distributions
Value of Cumulative Reinvested Dividends
Total Value of Shares
Dec.31, 1986 $10,000 0 0 10,000Dec.31, 1987 9,259 506 737 10,502Dec.31, 1988 9,765 1,129 1,106 12,001Dec.31, 1989 10,861 1,601 1,783 14,244Dec.31, 1990 8,973 1,322 2,427 12,722Dec.31, 1991 10,213 2,269 3,198 15,681Dec.31, 1992 12,030 2,843 3,944 18,817Dec.31, 1993 13,343 4,147 4,374 21,863Dec.31, 1994 12,863 3,998 4,440 21,300Dec.31, 1995 15,281 6,960 5,663 27,904Dec.31, 1996 18,370 8,367 7,498 34,235Dec.31, 1997 21,068 14,882 12,085 48,035Dec.31, 1998 23,975 19,892 15,320 59,187Dec.31, 1999 21,216 18,470 13,803 53,489Dec.31, 2000 21,345 18,891 17,731 57,967Dec.31, 2001 23,975 24,377 22,045 70,397Dec.31, 2002 29,775 33,657 28,072 91,504Dec.31, 2003 30,194 36,111 28,467 94,773Dec.31, 2004 32,241 40,446 30,632 103,319Dec.31, 2005 36,014 45,180 36,268 117,462Dec.31, 2006 42,194 52,933 44,384 139,511Dec.31, 2007 36,819 46,191 42,248 125,258
Note: Rates of return are historical total returns including changes in unit prices and assume the reinvestment of all distributions. These annual compounded returns do not take into account any sales charges, redemption fees, other optional expenses or income taxes that you have to pay and which could reduce these returns. The returns are not guaranteed. The Fund’s past performance does not necessarily indicate future performance.
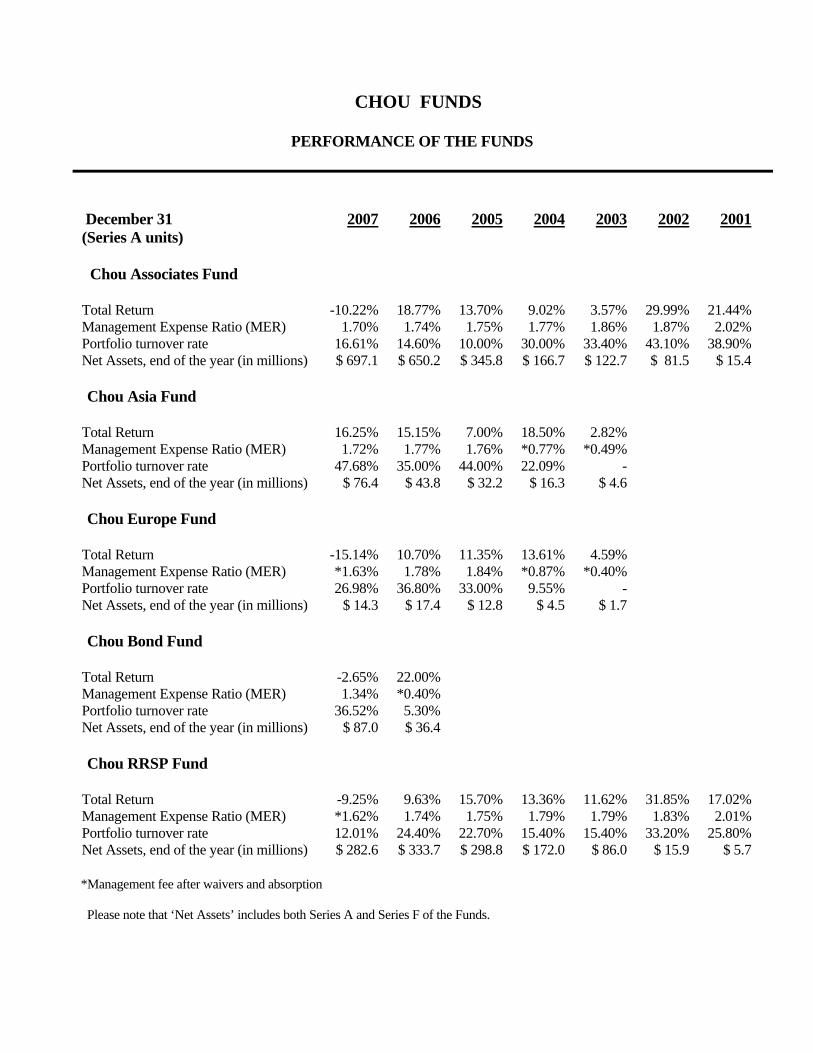
CHOU FUNDS PERFORMANCE OF THE FUNDS
December 31 2007 2006 2005 2004 2003 2002 2001(Series A units)
Chou Associates Fund
Total Return -10.22% 18.77% 13.70% 9.02% 3.57% 29.99% 21.44% Management Expense Ratio (MER) 1.70% 1.74% 1.75% 1.77% 1.86% 1.87% 2.02% Portfolio turnover rate 16.61% 14.60% 10.00% 30.00% 33.40% 43.10% 38.90% Net Assets, end of the year (in millions) $ 697.1 $ 650.2 $ 345.8 $ 166.7 $ 122.7 $ 81.5 $ 15.4
Chou Asia Fund
Total Return 16.25% 15.15% 7.00% 18.50% 2.82% Management Expense Ratio (MER) 1.72% 1.77% 1.76% *0.77% *0.49% Portfolio turnover rate 47.68% 35.00% 44.00% 22.09% - Net Assets, end of the year (in millions) $ 76.4 $ 43.8 $ 32.2 $ 16.3 $ 4.6
Chou Europe Fund
Total Return -15.14% 10.70% 11.35% 13.61% 4.59% Management Expense Ratio (MER) *1.63% 1.78% 1.84% *0.87% *0.40% Portfolio turnover rate 26.98% 36.80% 33.00% 9.55% - Net Assets, end of the year (in millions) $ 14.3 $ 17.4 $ 12.8 $ 4.5 $ 1.7
Chou Bond Fund
Total Return -2.65% 22.00% Management Expense Ratio (MER) 1.34% *0.40% Portfolio turnover rate 36.52% 5.30% Net Assets, end of the year (in millions) $ 87.0 $ 36.4 Chou RRSP Fund
Total Return -9.25% 9.63% 15.70% 13.36% 11.62% 31.85% 17.02% Management Expense Ratio (MER) *1.62% 1.74% 1.75% 1.79% 1.79% 1.83% 2.01% Portfolio turnover rate 12.01% 24.40% 22.70% 15.40% 15.40% 33.20% 25.80% Net Assets, end of the year (in millions) $ 282.6 $ 333.7 $ 298.8 $ 172.0 $ 86.0 $ 15.9 $ 5.7
*Management fee after waivers and absorption
Please note that ‘Net Assets’ includes both Series A and Series F of the Funds.
TABLE OF CONTENTS Chou Associates Fund Manager’s Letter 1-8 Chou Funds Auditors’ Report 9 Chou Associates Fund Statement of Net Assets 10
Statement of Operations 11 Statement of Changes in Net Assets 12 Statement of Investments 13 Schedule of Derivatives 14
Chou Asia Fund Fund Manager’s Letter 15-16
Statement of Net Assets 17 Statement of Operations 18 Statement of Changes in Net Assets 19 Statement of Investments 20 Schedule of Derivatives 20
Chou Europe Fund Fund Manager’s Letter 21-22
Statement of Net Assets 23 Statement of Operations 24 Statement of Changes in Net Assets 25 Statement of Investments 26
Chou Bond Fund Fund Manager’s Letter 27-28
Statement of Net Assets 29 Statement of Operations 30 Statement of Changes in Net Assets 31 Statement of Investments 32
Chou RRSP Fund Fund Manager’s Letter 33-39
Statement of Net Assets 40 Statement of Operations 41 Statement of Changes in Net Assets 42 Statement of Investments 43 Schedule of Derivatives 44
Notes to Financial Statements 45-53
1
CHOU ASSOCIATES FUND
March 12, 2008
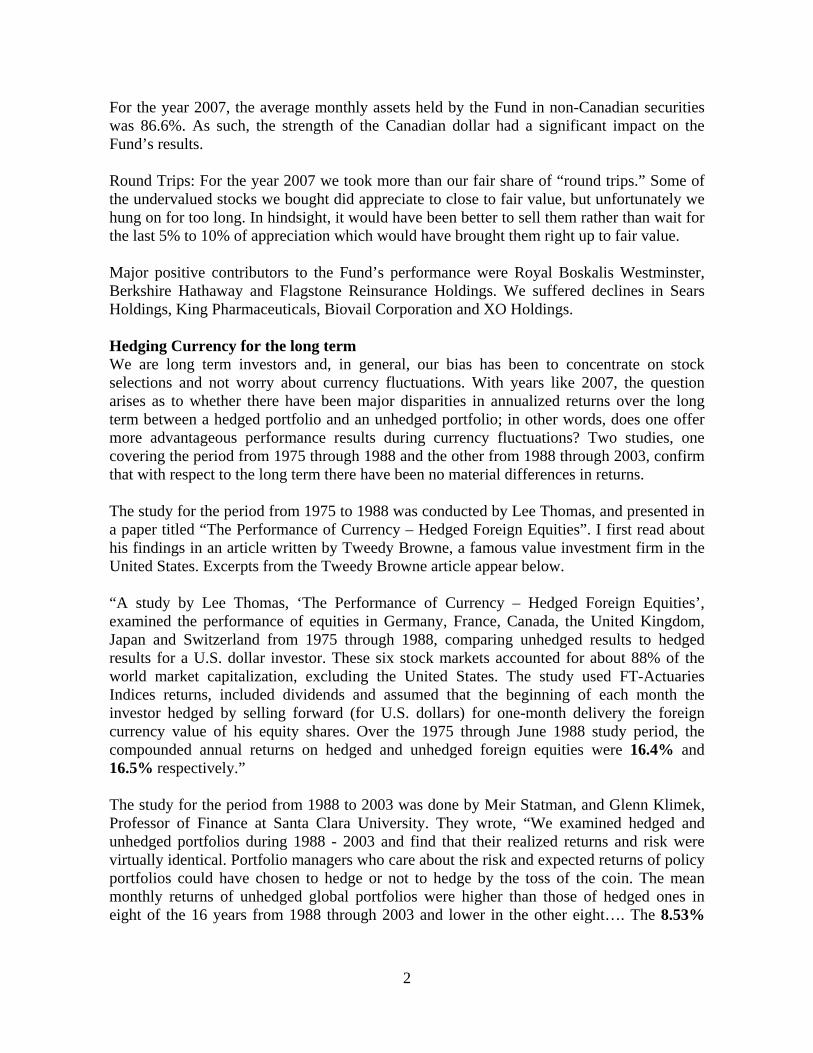
Dear Unitholders of Chou Associates Fund, After the distribution of $2.31, the net asset value (“NAVPU” or “NAV”) of a Series A unit of Chou Associates Fund at December 31, 2007 was $79.97 compared to $91.65 at December 31, 2006, a decrease of 10.2%, while the S&P 500 Total Return Index decreased 10.3% in Canadian dollars. In $US, a Series A unit of Chou Associates Fund returned 5.8% while the S&P 500 Total Return Index returned 5.5%. The table below shows our 1 year, 3 year, 5 year, 10 year and 15 year annual compound rates of return. December 31, 2007 (Series A unit)
Past Year Past 3 Years
Past 5 Years
Past 10 Years
Past 15 Years
Chou Associates($Cdn) -10.2% 6.6% 6.5% 10.1% 13.5%S&P500 ($Cdn) -10.3% 1.8% 2.8% 2.1% 8.6%
Chou Associates($US)1 5.8% 13.8% 16.8% 14.1% 15.4%S&P500 ($US) 5.5% 8.6% 12.8% 5.9% 10.5%
Rates of return are historical total returns including changes in unit prices and assume the reinvestment of all distributions. These annual compounded returns do not take into account any sales charges, redemption fees, other optional expenses or income taxes that you have to pay and which could reduce these returns. The returns are not guaranteed. The Fund’s past performance does not necessarily indicate future performance.
Factors influencing the 2007 results Canadian Dollar: The strength of the Canadian dollar against the U.S. dollar, the pound sterling, and the Euro had the biggest negative impact on the results of the Fund. The dramatic difference in performance results between the net asset value per unit (NAVPU) priced in Canadian dollars, versus U.S. dollars, is attributable to the fact that on December 31, 2006, one U.S. dollar was worth approximately $1.17 Canadian, whereas one year later, on December 31, 2007, one U.S. dollar was worth approximately $0.99 Cdn. Even if the price of an American security remained the same in 2007, it would have nonetheless shown a depreciation of roughly 15.1% at year end when priced in Canadian dollars. Similarly, a security denominated in the pound sterling and the Euro would have depreciated by roughly 13.5% and 6.1% respectively.
1The alternative method of purchasing Chou Associates Fund in $US has been offered since September 2005. Performance for years prior to September 2005 is based on the $US equivalent conversion of the results of the Chou Associates Fund($Cdn). The investments in the Chou Associates Fund ($Cdn) are the same as the investments in Chou Associates Fund($US) except for the currency applied.
2
For the year 2007, the average monthly assets held by the Fund in non-Canadian securities was 86.6%. As such, the strength of the Canadian dollar had a significant impact on the Fund’s results. Round Trips: For the year 2007 we took more than our fair share of “round trips.” Some of the undervalued stocks we bought did appreciate to close to fair value, but unfortunately we hung on for too long. In hindsight, it would have been better to sell them rather than wait for the last 5% to 10% of appreciation which would have brought them right up to fair value. Major positive contributors to the Fund’s performance were Royal Boskalis Westminster, Berkshire Hathaway and Flagstone Reinsurance Holdings. We suffered declines in Sears Holdings, King Pharmaceuticals, Biovail Corporation and XO Holdings. Hedging Currency for the long term We are long term investors and, in general, our bias has been to concentrate on stock selections and not worry about currency fluctuations. With years like 2007, the question arises as to whether there have been major disparities in annualized returns over the long term between a hedged portfolio and an unhedged portfolio; in other words, does one offer more advantageous performance results during currency fluctuations? Two studies, one covering the period from 1975 through 1988 and the other from 1988 through 2003, confirm that with respect to the long term there have been no material differences in returns. The study for the period from 1975 to 1988 was conducted by Lee Thomas, and presented in a paper titled “The Performance of Currency – Hedged Foreign Equities”. I first read about his findings in an article written by Tweedy Browne, a famous value investment firm in the United States. Excerpts from the Tweedy Browne article appear below. “A study by Lee Thomas, ‘The Performance of Currency – Hedged Foreign Equities’, examined the performance of equities in Germany, France, Canada, the United Kingdom, Japan and Switzerland from 1975 through 1988, comparing unhedged results to hedged results for a U.S. dollar investor. These six stock markets accounted for about 88% of the world market capitalization, excluding the United States. The study used FT-Actuaries Indices returns, included dividends and assumed that the beginning of each month the investor hedged by selling forward (for U.S. dollars) for one-month delivery the foreign currency value of his equity shares. Over the 1975 through June 1988 study period, the compounded annual returns on hedged and unhedged foreign equities were 16.4% and 16.5% respectively.” The study for the period from 1988 to 2003 was done by Meir Statman, and Glenn Klimek, Professor of Finance at Santa Clara University. They wrote, “We examined hedged and unhedged portfolios during 1988 - 2003 and find that their realized returns and risk were virtually identical. Portfolio managers who care about the risk and expected returns of policy portfolios could have chosen to hedge or not to hedge by the toss of the coin. The mean monthly returns of unhedged global portfolios were higher than those of hedged ones in eight of the 16 years from 1988 through 2003 and lower in the other eight…. The 8.53%
3
mean annualized return of the unhedged global portfolio was slightly lower than the 8.60% mean annualized return of the hedged portfolio during the overall 1988-2003 period.” While the effect on long term results may be statistically insignificant, on a year-to-year basis, currency swings can truly distort results. These swings can be heart stopping, particularly for our unitholders, and especially when the currency goes against them. This was evident with the Fund in 2007. But in this situation the reactions were mixed. We received a number of calls regarding the results. Investors from Niagara Falls on the U.S. side of the border were quite pleased with the 2007 performance (+5.8%), whereas investors just half a mile away, in Niagara Falls, Canada, expressed concerns about the Fund’s performance (-10.2%). We don’t know what the true value of the Canadian dollar is vis-à-vis the U.S. dollar but we would hazard a guess that it is somewhere between 80 cents and $1.20. Therefore, we believe that the Canadian dollar is trading in the range of fair value. However, on a short term basis, it is subject to many variables such as the current price of energy, monetary and fiscal policies of both countries, carry trades by currency speculators (they can swing it either way by 30%) and so on. When deciding to hedge vs. not hedge, it is only in hindsight that there can ever be certainty that the right decision was made. It is virtually impossible to sustain any reliable degree of success in predicting which way to go. When measured on a year to year basis we have been wrong in the past and it is likely that we will be wrong again in the future. But there is little need for concern. The ramifications of such hedging decisions should only affect short term performance results for the Fund. We are long term investors and therefore, over the long term, whether we ‘got it right’ or not should be immaterial. Our bias at this time is ‘not’ to hedge because we believe that the Canadian dollar is trading in the range of fair value. In the long run, it will be influenced significantly by energy prices. Based on the latest trade figures, Canada’s trade with the world is at a deficit net of energy. With the dollar at parity with the U.S. dollar, all the numbers from exports, tourism, manufacturing and retail sales look appalling when compared to last year. The only time where we may be inclined to hedge the currency is during a period of extreme undervaluation. So for now, be prepared for a bit of a bumpy ride, and some extra volatility, but take into account the results of the aforementioned studies which indicate that (at least in the past) it all evens out in the long run. And remember, hedging currencies comes with a cost…about 1% a year. One final thing to consider: As the Fund’s perspective is long term, the fluctuations in performance should also be put into perspective. An 85 year old woman approached me recently and asked, “How would you define long term to me? Based on your definition, I will be dead anyway.” I was flummoxed, obviously, and sheepishly replied, with great optimism, that perhaps she might live to be 115 and set the record for the longest living person on earth.
4
We do offer an alternative to investors who believe strongly that the Canadian dollar is going to strengthen considerably against the U.S. dollar. We offer units of the Fund in U.S. dollars, and investors can switch the units denominated in Canadian dollars to U.S. dollars without any penalty, charges, or incurring a capital gain or loss in so doing. General comments on the market Despite a decline of about 10% from its high, the market is not cheap, however it is not expensive either. For years we have been lamenting the fact that we cannot find any decent bargains, but lately four sectors have been hit hard and we can find plenty of companies in those sectors that are selling significantly below what they are worth. The four sectors are: retail, media, telecommunications and cable, and pharmaceuticals. Repricing of risk At the time of writing last year, preservation of capital was given almost zero consideration. However, this year there has been a huge repricing of risk. The following are some examples:
1) The spread between U.S. corporate high yield debt and 5 year U.S. treasuries was 270 basis points a year ago. Currently, it is 778. At its widest, in November 2002, it was 1,094 basis points (source: Citigroup).
2) The spread between U.S. corporate high yield debt and U.S. investment grade bonds was 187 basis points a year ago. Currently, it is 549. At its widest, in November 2002, it was 845 basis points (source: Citigroup).
Last year, we wrote that some of the greatest excesses of easy credit were committed by subprime lenders. Credit standards were so lax and liberal that homeowners didn’t even need to produce verification of income to be able to borrow up to 100% or more of the appraised value of their houses. The chickens are coming home to roost for companies that were in any way associated with housing and housing related issues, and those companies include commercial and investment banks, mortgage lenders, monoline bond insurers, hedge funds, you name it. So far, they have announced $255 billion (source: Deutsche Bank) in losses. While the numbers may look awful, the reality is far worse. The problem started with subprime borrowers and it is spreading to Alternate A borrowers (between subprime and prime) and ultimately, although to a lesser degree, it will affect prime borrowers. The reason for the spreading is that credit standards were equally lax with Alternate A borrowers and prime borrowers. On top of that we have yet to factor in the impact of liquidity squeeze from financial deleveraging, and that of loans in leveraged buyouts, commercial real estate, automobiles, margin loans, structured products, and the like. Institutions were so driven by incentives to securitize assets into asset backed securities and CDOs (Collateralized Debt Obligation) that they were willing to overlook the true riskiness of the securities involved. Those securities were then morphed into derivatives or any number of exotic instruments that barely resemble the original loans. Credit standards did not matter but volume and liquidity did, and ‘mortgages’ was one product that easily satisfied that criteria.
5
In general, we find that executives who sugarcoat business realities and embellish results, downplay issues and disguise potential problems to investors may be trying to fool their audience, but eventually they end up fooling themselves. They start believing in their own world of make-believe. We would be careful about buying any financial stock. It is virtually impossible to find out what toxic brew the financial companies may hold in their balance sheets (either because they may not want you to know the truth or because even they don’t know the truth themselves). Financial companies use ‘best estimates’ for many line items on the balance sheet and when companies are in trouble, they frequently have a chance to downplay the seriousness of the problems. Most of them are honourable but there are a few who use, what I’ve coined, “the ‘DROP’ principle” on unsuspecting investors. (D is for dribbling out the bad news slowly, R is for raising money, and OP is for dishing out the most optimistic projections.) Once the money has been raised from investors, these companies will announce a few months later ‘the big drop’ – that is, to take a big writedown. Yet still, having said that, we are looking for companies that are not involved directly with financials but, instead, have been somewhat tainted by association. Our historical returns and what we can learn from them As we have stated in our past letters, the cardinal principle underlying the investments in the Fund is to pay far less than what the company is worth, measured by sustainable earning power and/or hard assets that are not depreciating in value. In other words, we want an adequate ‘Margin of Safety’ and this concept, while unappreciated and ignored by most, is what distinguishes investment from speculation. It is different from volatility, where stocks can go up or down in a given year. Fortunately, we have over 20 years of performance to show what can be accomplished for investors while employing the “Margin of Safety” concept. If you look at the following table, in 1999, 1994 and 1990 we had negative years but each time we bounced back. Even if you invested at the high, let’s say in 1998, 1993 or 1989, you would still do reasonably well long term. When you are a value investor, you have no control on short term volatility. While the future is never certain, we have no reason to believe the statement “If you buy stocks that are undervalued, good things happen to you eventually”, will not be as valid in the future as it has been in the past. The current environment reminds us of 1999 – stocks that were expensive became more expensive and stocks that were cheap became cheaper but eventually ‘value will out’ – as the expression goes. As the subprime (mortgage) meltdown and the bursting of the credit bubble play themselves out, they directly and indirectly affect the prices of almost all debt and equity securities, and the market will be highly volatile for a while. Therefore, the unit value of our Fund will also be volatile. So, this is not the time to get too anxious. Volatility is playing into our hands. We wouldn’t be finding stocks or fixed income debts as cheap as they are now if it wasn’t for this fear in the market. Market participants that invested in the toxic brew securities are dumping debt and equity securities indiscriminately as they are forced to raise cash to meet margin calls and redemptions. We would encourage our unitholders to
6
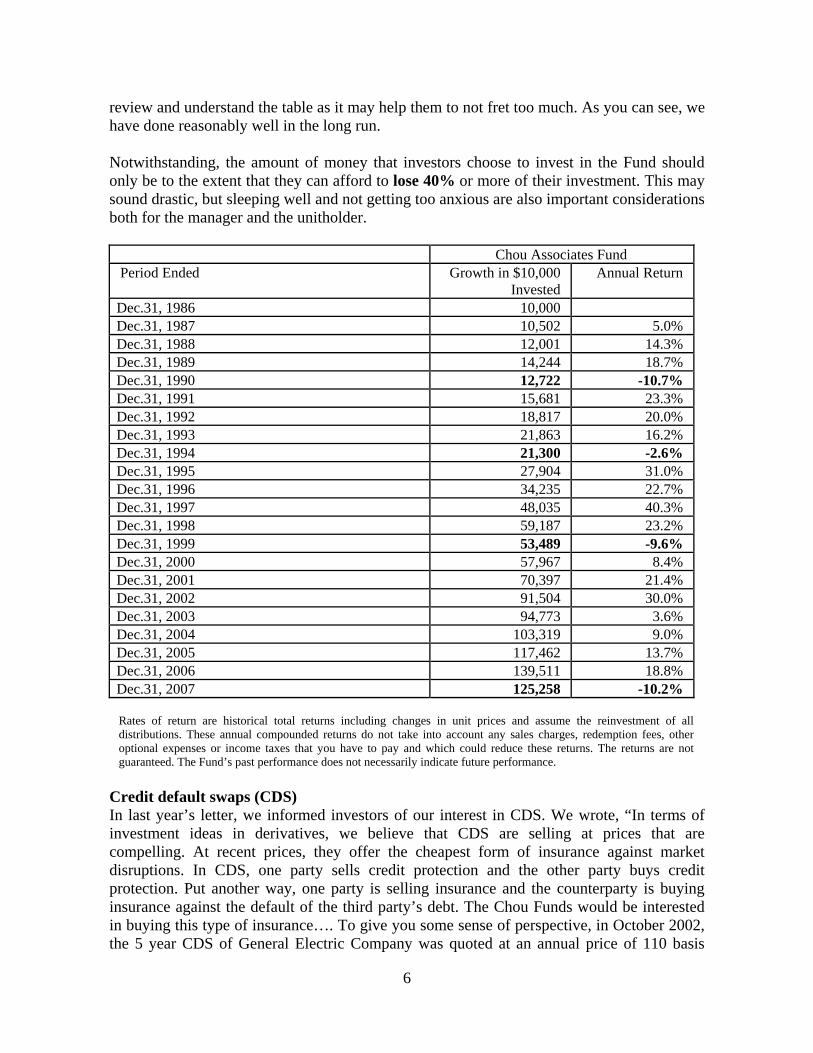
review and understand the table as it may help them to not fret too much. As you can see, we have done reasonably well in the long run.
Notwithstanding, the amount of money that investors choose to invest in the Fund should only be to the extent that they can afford to lose 40% or more of their investment. This may sound drastic, but sleeping well and not getting too anxious are also important considerations both for the manager and the unitholder. Chou Associates Fund Period Ended Growth in $10,000
Invested Annual Return
Dec.31, 1986 10,000 Dec.31, 1987 10,502 5.0% Dec.31, 1988 12,001 14.3% Dec.31, 1989 14,244 18.7% Dec.31, 1990 12,722 -10.7% Dec.31, 1991 15,681 23.3% Dec.31, 1992 18,817 20.0% Dec.31, 1993 21,863 16.2% Dec.31, 1994 21,300 -2.6% Dec.31, 1995 27,904 31.0% Dec.31, 1996 34,235 22.7% Dec.31, 1997 48,035 40.3% Dec.31, 1998 59,187 23.2% Dec.31, 1999 53,489 -9.6% Dec.31, 2000 57,967 8.4% Dec.31, 2001 70,397 21.4% Dec.31, 2002 91,504 30.0% Dec.31, 2003 94,773 3.6% Dec.31, 2004 103,319 9.0% Dec.31, 2005 117,462 13.7% Dec.31, 2006 139,511 18.8% Dec.31, 2007 125,258 -10.2%
Rates of return are historical total returns including changes in unit prices and assume the reinvestment of all distributions. These annual compounded returns do not take into account any sales charges, redemption fees, other optional expenses or income taxes that you have to pay and which could reduce these returns. The returns are not guaranteed. The Fund’s past performance does not necessarily indicate future performance.
Credit default swaps (CDS) In last year’s letter, we informed investors of our interest in CDS. We wrote, “In terms of investment ideas in derivatives, we believe that CDS are selling at prices that are compelling. At recent prices, they offer the cheapest form of insurance against market disruptions. In CDS, one party sells credit protection and the other party buys credit protection. Put another way, one party is selling insurance and the counterparty is buying insurance against the default of the third party’s debt. The Chou Funds would be interested in buying this type of insurance…. To give you some sense of perspective, in October 2002, the 5 year CDS of General Electric Company was quoted at an annual price of 110 basis
7
points. Recently, it was quoted at an annual price of 8 basis points. To make money in CDS, you don’t need a default of the third party’s debt. If there is any hiccup in the economy, the CDS price will rise from these low levels. The negative aspect is that, like insurance, the premium paid for the protection erodes over time and may expire worthless.” Subsequent to that letter it took until mid September 2007 for all of our compliance and regulatory approvals to be put into place and by then the prices of CDSs had moved appreciably. In accordance with our prospectus we could invest no more than 5% of the net assets of the Fund, at the time of purchase, in CDSs. We missed the low hanging fruit, but the good thing is we now have these approvals in place and can exploit the situation next time. The current price of General Electric’s 5 year CDS is at 168 basis points, and shows the potential for gain. Other matters Foreign Currency Hedging: None existed in 2006 and 2007. U.S. dollar Valuation: Any investor who wishes to purchase the Chou Funds in $US is now able to do so. Independent Review Committee: Under the provisions of National Instrument 81-107 Independent Review Committee for Investment Funds ("NI 81-107"), which came into force on November 1, 2006, it is now required that all publicly offered investment funds, such as the family of Chou Funds, establish an independent review committee ("IRC") to whom the Manager is to refer all conflict of interest matters for review. This instrument further mandates that the IRC be composed of at least three independent members and requires that they report, at least annually, to the Manager and shareholders in respect of the IRC's duties. The Manager has established an IRC as required by NI 81-107. The members of the IRC are Sandford Borins, Bruce Kerr and Joe Tortolano. The IRC report is posted on our website www.choufunds.com. Hardcopies are available, upon request, by contacting Chou Associates. Management Fees Waived: We waived a portion of the management fees for the Chou RRSP Fund. The MER should have been 1.70% but instead it was 1.62%. We also waived the management fees for the months of November and December for the Chou Europe Fund. The MER should have been 1.87%, but instead it was 1.63%.
8
New Location: Effective Thursday, November 1, 2007, we have moved our corporate office to the following location: 110 Sheppard Avenue East Suite 301, Box 18 Toronto, Ontario M2N 6Y8 Redemption Fee: We have a redemption fee of 2% if unitholders redeem their units in less than 2 years. None of this fee goes to the Fund Manager. It is put back into the Fund for the benefit of the remaining unitholders. We hope this fee is enough to dissuade short term investors from jumping in and out of the Fund to chase possible short term performance. As of March 7, 2008, the NAV of a Series A unit of the Fund was $73.90 and the cash position was 32.3% of net assets. The Fund is down 7.6% from the beginning of the year. Except for the performance numbers of the Chou Associates Fund, this letter contains estimates and opinions of the Fund Manager and is not intended to be a forecast of future events, a guarantee of future returns or investment advice. Any recommendations contained or implied herein may not be suitable for all investors.
Yours truly,
Francis Chou Fund Manager
9
2800 – 14th Avenue, Suite 406 Markham ON L3R 0E4 (905) 479-1300 Toronto Line: (416) 495-1755 Fax: (416) 495-1838 E-mail: [email protected]
AUDITORS’ REPORT To the Trustee and the Unitholders of
Chou Associates Fund Chou Asia Fund Chou Europe Fund Chou Bond Fund Chou RRSP Fund (collectively referred to as the “Chou Funds”)
We have audited the statements of net assets of the Chou Funds as at December 31, 2007 and 2006, the statements of operations and changes in net assets for the years then ended and the statements of investments at December 31, 2007. These financial statements are the responsibility of the Chou Funds’ management. Our responsibility is to express an opinion on these financial statements based on our audit. We conducted our audit in accordance with Canadian generally accepted auditing standards. Those standards require that we plan and perform an audit to obtain reasonable assurance whether the financial statements are free of material misstatement. An audit includes examining, on a test basis, evidence supporting the amounts and disclosures in the financial statements. An audit also includes assessing the accounting principles used and significant estimates made by management, as well as evaluating the overall financial statement presentation. In our opinion, these financial statements present fairly, in all material respects, the financial position of the Chou Funds as at December 31, 2007 and 2006, their results of operations and changes in net assets for the years then ended and their statements of investments as at December 31, 2007, in accordance with Canadian generally accepted accounting principles.
Markham, Ontario Chartered Accountants February 29, 2008 Licensed Public Accountants
10
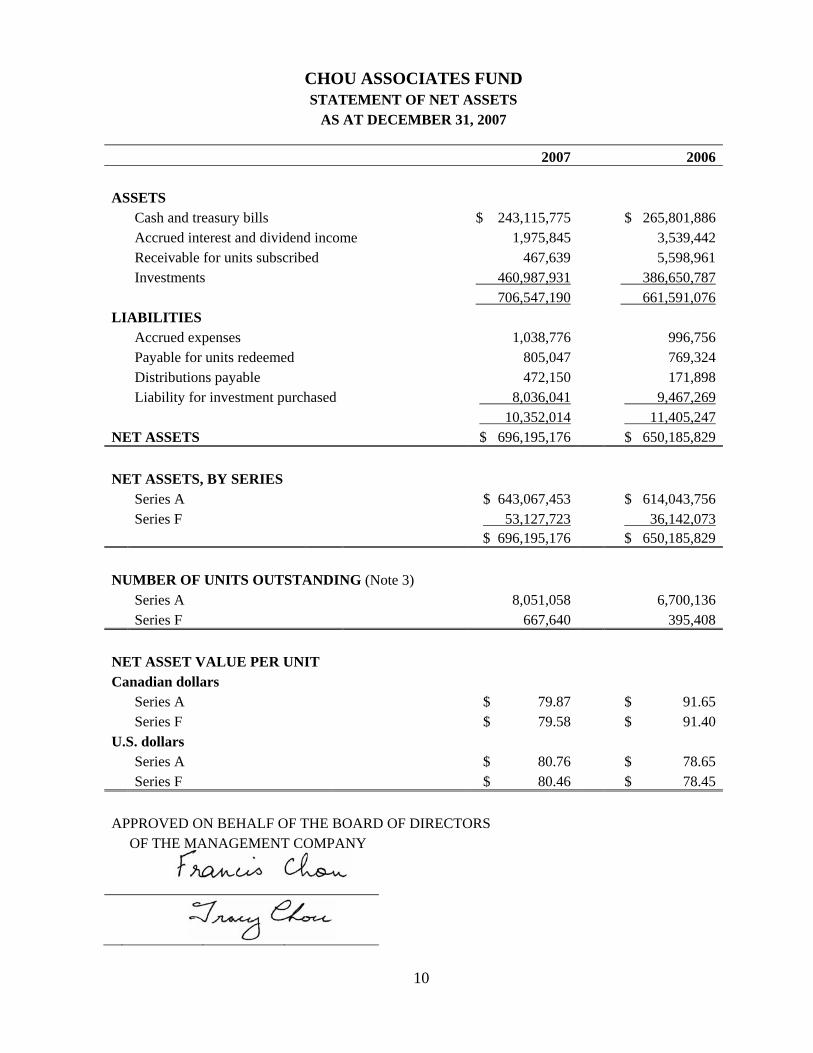
CHOU ASSOCIATES FUND STATEMENT OF NET ASSETS
AS AT DECEMBER 31, 2007 2007 2006 ASSETS Cash and treasury bills $ 243,115,775 $ 265,801,886 Accrued interest and dividend income 1,975,845 3,539,442 Receivable for units subscribed 467,639 5,598,961 Investments 460,987,931 386,650,787 706,547,190 661,591,076 LIABILITIES Accrued expenses 1,038,776 996,756 Payable for units redeemed 805,047 769,324 Distributions payable 472,150 171,898 Liability for investment purchased 8,036,041 9,467,269 10,352,014 11,405,247 NET ASSETS $ 696,195,176 $ 650,185,829 NET ASSETS, BY SERIES Series A $ 643,067,453 $ 614,043,756 Series F 53,127,723 36,142,073 $ 696,195,176 $ 650,185,829 NUMBER OF UNITS OUTSTANDING (Note 3) Series A 8,051,058 6,700,136 Series F 667,640 395,408 NET ASSET VALUE PER UNIT Canadian dollars Series A $ 79.87 $ 91.65 Series F $ 79.58 $ 91.40 U.S. dollars Series A $ 80.76 $ 78.65 Series F $ 80.46 $ 78.45 APPROVED ON BEHALF OF THE BOARD OF DIRECTORS OF THE MANAGEMENT COMPANY
11
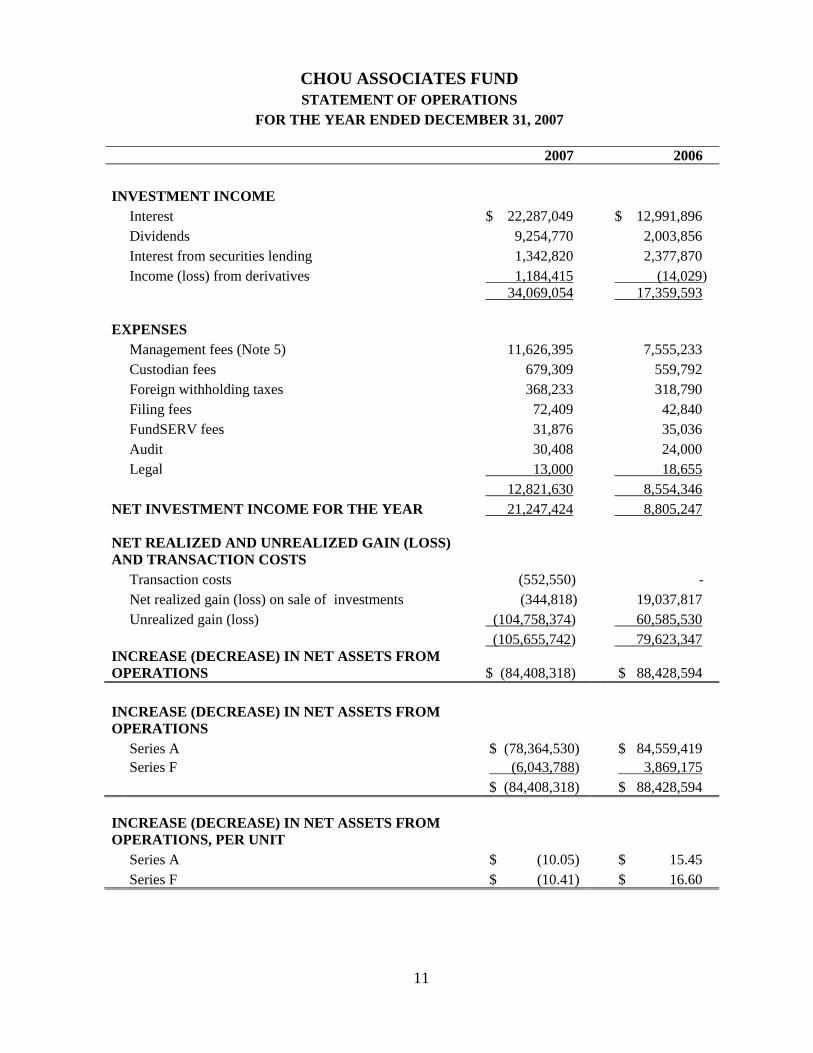
CHOU ASSOCIATES FUND STATEMENT OF OPERATIONS
FOR THE YEAR ENDED DECEMBER 31, 2007
2007 2006 INVESTMENT INCOME Interest $ 22,287,049 $ 12,991,896 Dividends 9,254,770 2,003,856 Interest from securities lending 1,342,820 2,377,870 Income (loss) from derivatives 1,184,415 (14,029) 34,069,054 17,359,593 EXPENSES Management fees (Note 5) 11,626,395 7,555,233 Custodian fees 679,309 559,792 Foreign withholding taxes 368,233 318,790 Filing fees 72,409 42,840 FundSERV fees 31,876 35,036 Audit 30,408 24,000 Legal 13,000 18,655 12,821,630 8,554,346 NET INVESTMENT INCOME FOR THE YEAR 21,247,424 8,805,247 NET REALIZED AND UNREALIZED GAIN (LOSS) AND TRANSACTION COSTS Transaction costs (552,550) - Net realized gain (loss) on sale of investments (344,818) 19,037,817 Unrealized gain (loss) (104,758,374) 60,585,530 (105,655,742) 79,623,347 INCREASE (DECREASE) IN NET ASSETS FROM OPERATIONS $ (84,408,318) $ 88,428,594 INCREASE (DECREASE) IN NET ASSETS FROM OPERATIONS Series A $ (78,364,530) $ 84,559,419 Series F (6,043,788) 3,869,175 $ (84,408,318) $ 88,428,594 INCREASE (DECREASE) IN NET ASSETS FROM OPERATIONS, PER UNIT Series A $ (10.05) $ 15.45 Series F $ (10.41) $ 16.60
12
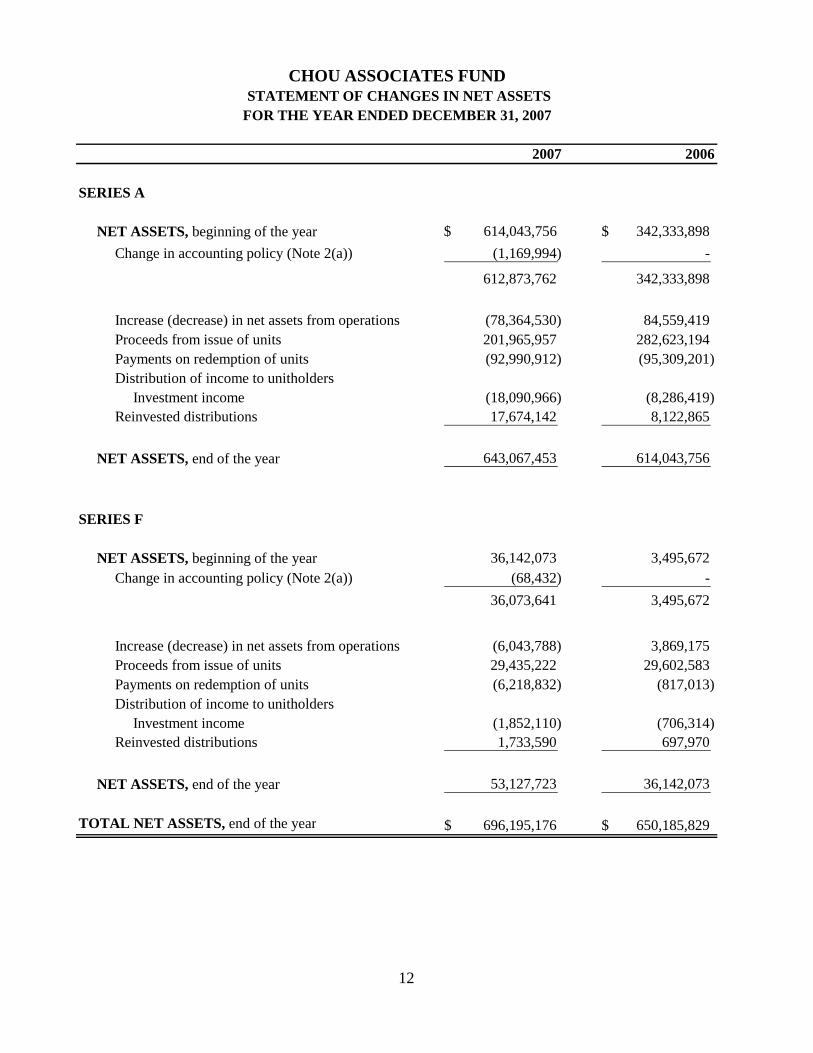
2007 2006
SERIES A
NET ASSETS, beginning of the year 614,043,756$ 342,333,898$ Change in accounting policy (Note 2(a)) (1,169,994) -
612,873,762 342,333,898
Increase (decrease) in net assets from operations (78,364,530) 84,559,419 Proceeds from issue of units 201,965,957 282,623,194 Payments on redemption of units (92,990,912) (95,309,201) Distribution of income to unitholders
Investment income (18,090,966) (8,286,419) Reinvested distributions 17,674,142 8,122,865
NET ASSETS, end of the year 643,067,453 614,043,756
SERIES F
NET ASSETS, beginning of the year 36,142,073 3,495,672 Change in accounting policy (Note 2(a)) (68,432) -
36,073,641 3,495,672
Increase (decrease) in net assets from operations (6,043,788) 3,869,175 Proceeds from issue of units 29,435,222 29,602,583 Payments on redemption of units (6,218,832) (817,013) Distribution of income to unitholders
Investment income (1,852,110) (706,314) Reinvested distributions 1,733,590 697,970
NET ASSETS, end of the year 53,127,723 36,142,073
TOTAL NET ASSETS, end of the year 696,195,176$ 650,185,829$
CHOU ASSOCIATES FUND STATEMENT OF CHANGES IN NET ASSETSFOR THE YEAR ENDED DECEMBER 31, 2007
13
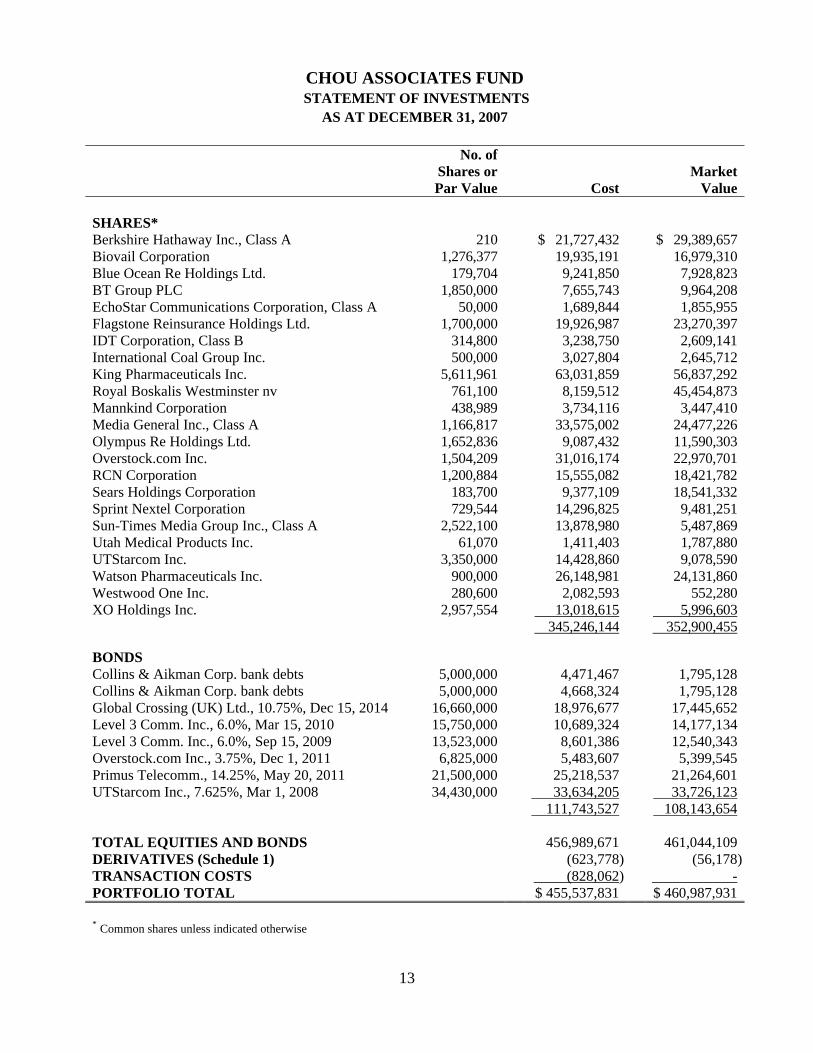
CHOU ASSOCIATES FUND
STATEMENT OF INVESTMENTS AS AT DECEMBER 31, 2007
No. of Shares or
Par Value Cost Market
Value SHARES* Berkshire Hathaway Inc., Class A 210 $ 21,727,432 $ 29,389,657 Biovail Corporation 1,276,377 19,935,191 16,979,310 Blue Ocean Re Holdings Ltd. 179,704 9,241,850 7,928,823 BT Group PLC 1,850,000 7,655,743 9,964,208 EchoStar Communications Corporation, Class A 50,000 1,689,844 1,855,955 Flagstone Reinsurance Holdings Ltd. 1,700,000 19,926,987 23,270,397 IDT Corporation, Class B 314,800 3,238,750 2,609,141 International Coal Group Inc. 500,000 3,027,804 2,645,712 King Pharmaceuticals Inc. 5,611,961 63,031,859 56,837,292 Royal Boskalis Westminster nv 761,100 8,159,512 45,454,873 Mannkind Corporation 438,989 3,734,116 3,447,410 Media General Inc., Class A 1,166,817 33,575,002 24,477,226 Olympus Re Holdings Ltd. 1,652,836 9,087,432 11,590,303 Overstock.com Inc. 1,504,209 31,016,174 22,970,701 RCN Corporation 1,200,884 15,555,082 18,421,782 Sears Holdings Corporation 183,700 9,377,109 18,541,332 Sprint Nextel Corporation 729,544 14,296,825 9,481,251 Sun-Times Media Group Inc., Class A 2,522,100 13,878,980 5,487,869 Utah Medical Products Inc. 61,070 1,411,403 1,787,880 UTStarcom Inc. 3,350,000 14,428,860 9,078,590 Watson Pharmaceuticals Inc. 900,000 26,148,981 24,131,860 Westwood One Inc. 280,600 2,082,593 552,280 XO Holdings Inc. 2,957,554 13,018,615 5,996,603 345,246,144 352,900,455 BONDS Collins & Aikman Corp. bank debts 5,000,000 4,471,467 1,795,128 Collins & Aikman Corp. bank debts 5,000,000 4,668,324 1,795,128 Global Crossing (UK) Ltd., 10.75%, Dec 15, 2014 16,660,000 18,976,677 17,445,652 Level 3 Comm. Inc., 6.0%, Mar 15, 2010 15,750,000 10,689,324 14,177,134 Level 3 Comm. Inc., 6.0%, Sep 15, 2009 13,523,000 8,601,386 12,540,343 Overstock.com Inc., 3.75%, Dec 1, 2011 6,825,000 5,483,607 5,399,545 Primus Telecomm., 14.25%, May 20, 2011 21,500,000 25,218,537 21,264,601 UTStarcom Inc., 7.625%, Mar 1, 2008 34,430,000 33,634,205 33,726,123 111,743,527 108,143,654 TOTAL EQUITIES AND BONDS 456,989,671 461,044,109 DERIVATIVES (Schedule 1) (623,778) (56,178)TRANSACTION COSTS (828,062) - PORTFOLIO TOTAL $ 455,537,831 $ 460,987,931 * Common shares unless indicated otherwise
14
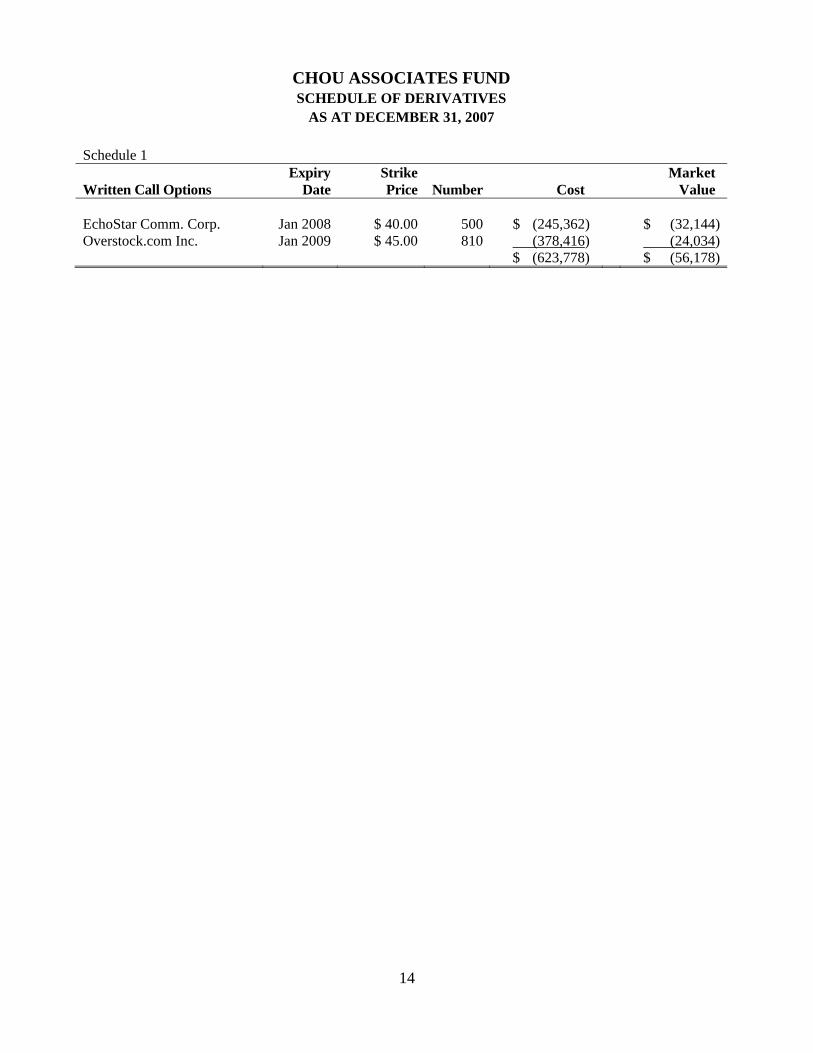
CHOU ASSOCIATES FUND SCHEDULE OF DERIVATIVES
AS AT DECEMBER 31, 2007 Schedule 1 Expiry Strike Market Written Call Options Date Price Number Cost Value EchoStar Comm. Corp. Jan 2008 $ 40.00 500 $ (245,362) $ (32,144) Overstock.com Inc. Jan 2009 $ 45.00 810 (378,416) (24,034) $ (623,778) $ (56,178)
15
CHOU ASIA FUND
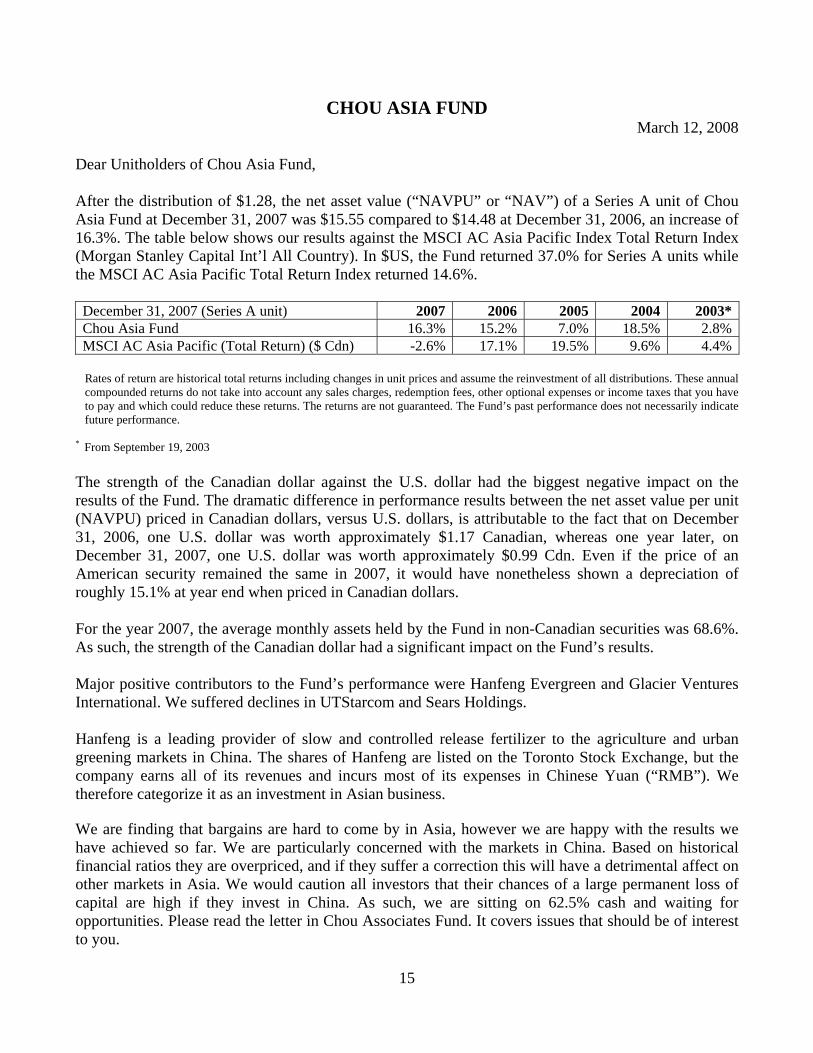
March 12, 2008 Dear Unitholders of Chou Asia Fund, After the distribution of $1.28, the net asset value (“NAVPU” or “NAV”) of a Series A unit of Chou Asia Fund at December 31, 2007 was $15.55 compared to $14.48 at December 31, 2006, an increase of 16.3%. The table below shows our results against the MSCI AC Asia Pacific Index Total Return Index (Morgan Stanley Capital Int’l All Country). In $US, the Fund returned 37.0% for Series A units while the MSCI AC Asia Pacific Total Return Index returned 14.6%. December 31, 2007 (Series A unit) 2007 2006 2005 2004 2003*Chou Asia Fund 16.3% 15.2% 7.0% 18.5% 2.8%MSCI AC Asia Pacific (Total Return) ($ Cdn) -2.6% 17.1% 19.5% 9.6% 4.4%
Rates of return are historical total returns including changes in unit prices and assume the reinvestment of all distributions. These annual compounded returns do not take into account any sales charges, redemption fees, other optional expenses or income taxes that you have to pay and which could reduce these returns. The returns are not guaranteed. The Fund’s past performance does not necessarily indicate future performance.
* From September 19, 2003 The strength of the Canadian dollar against the U.S. dollar had the biggest negative impact on the results of the Fund. The dramatic difference in performance results between the net asset value per unit (NAVPU) priced in Canadian dollars, versus U.S. dollars, is attributable to the fact that on December 31, 2006, one U.S. dollar was worth approximately $1.17 Canadian, whereas one year later, on December 31, 2007, one U.S. dollar was worth approximately $0.99 Cdn. Even if the price of an American security remained the same in 2007, it would have nonetheless shown a depreciation of roughly 15.1% at year end when priced in Canadian dollars. For the year 2007, the average monthly assets held by the Fund in non-Canadian securities was 68.6%. As such, the strength of the Canadian dollar had a significant impact on the Fund’s results. Major positive contributors to the Fund’s performance were Hanfeng Evergreen and Glacier Ventures International. We suffered declines in UTStarcom and Sears Holdings. Hanfeng is a leading provider of slow and controlled release fertilizer to the agriculture and urban greening markets in China. The shares of Hanfeng are listed on the Toronto Stock Exchange, but the company earns all of its revenues and incurs most of its expenses in Chinese Yuan (“RMB”). We therefore categorize it as an investment in Asian business. We are finding that bargains are hard to come by in Asia, however we are happy with the results we have achieved so far. We are particularly concerned with the markets in China. Based on historical financial ratios they are overpriced, and if they suffer a correction this will have a detrimental affect on other markets in Asia. We would caution all investors that their chances of a large permanent loss of capital are high if they invest in China. As such, we are sitting on 62.5% cash and waiting for opportunities. Please read the letter in Chou Associates Fund. It covers issues that should be of interest to you.
16
We have a redemption fee of 2% if unitholders redeem their units in less than 2 years. None of this fee goes to the Fund Manager. It is put back into the Fund for the benefit of the remaining unitholders. We hope this fee is enough to dissuade short term investors from jumping in and out of the Fund to chase possible short term performance. The minimum initial amount to invest in the Fund is $10,000 and the minimum subsequent investment is $1,000. As of March 7, 2008, the NAV of a Series A unit of the Fund was $15.52 and the cash position was 62.5% of net assets. The Fund is down 0.2% from the beginning of the year. Except for the performance numbers of the Chou Asia Fund, this letter contains estimates and opinions of the Fund Manager and is not intended to be a forecast of future events, a guarantee of future returns or investment advice. Any recommendations contained or implied herein may not be suitable for all investors.
Yours truly,
Francis Chou Fund Manager
17
CHOU ASIA FUND
STATEMENT OF NET ASSETS AS AT DECEMBER 31, 2007
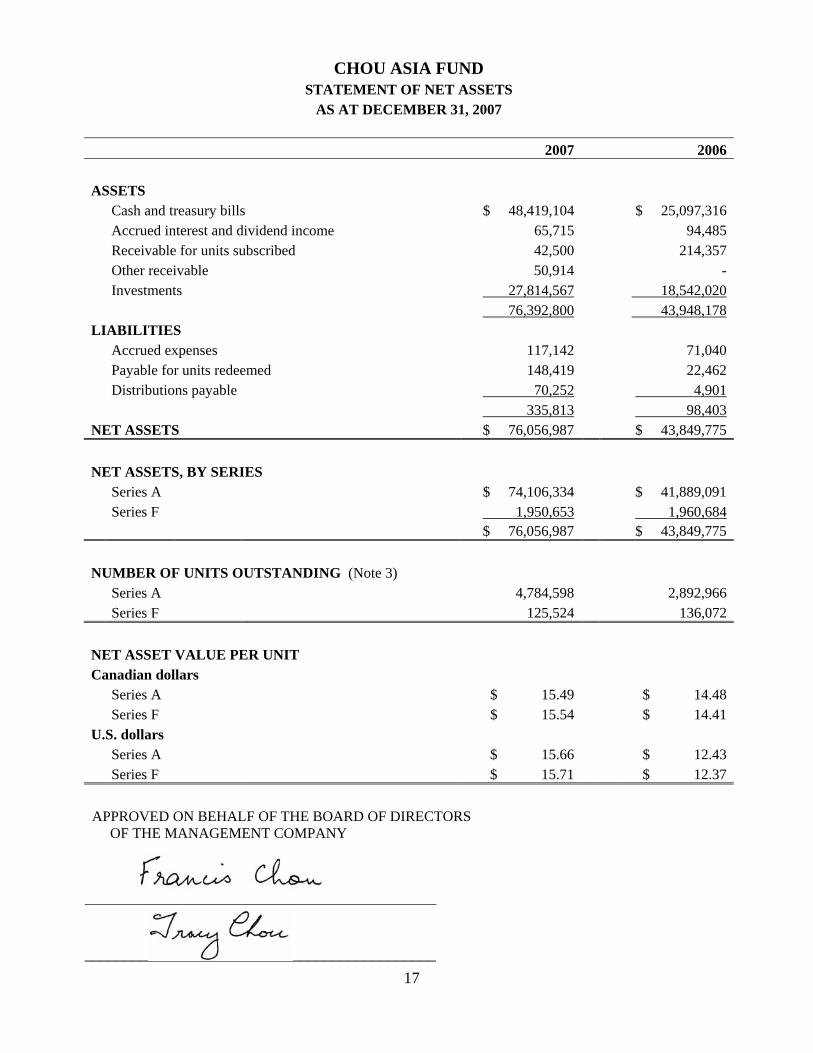
2007 2006 ASSETS Cash and treasury bills $ 48,419,104 $ 25,097,316 Accrued interest and dividend income 65,715 94,485 Receivable for units subscribed 42,500 214,357 Other receivable 50,914 - Investments 27,814,567 18,542,020 76,392,800 43,948,178 LIABILITIES Accrued expenses 117,142 71,040 Payable for units redeemed 148,419 22,462 Distributions payable 70,252 4,901 335,813 98,403 NET ASSETS $ 76,056,987 $ 43,849,775 NET ASSETS, BY SERIES Series A $ 74,106,334 $ 41,889,091 Series F 1,950,653 1,960,684 $ 76,056,987 $ 43,849,775 NUMBER OF UNITS OUTSTANDING (Note 3) Series A 4,784,598 2,892,966 Series F 125,524 136,072 NET ASSET VALUE PER UNIT Canadian dollars Series A $ 15.49 $ 14.48 Series F $ 15.54 $ 14.41 U.S. dollars Series A $ 15.66 $ 12.43 Series F $ 15.71 $ 12.37 APPROVED ON BEHALF OF THE BOARD OF DIRECTORS OF THE MANAGEMENT COMPANY
____________________________________________
18
CHOU ASIA FUND
STATEMENT OF OPERATIONS FOR THE YEAR ENDED DECEMBER 31, 2007
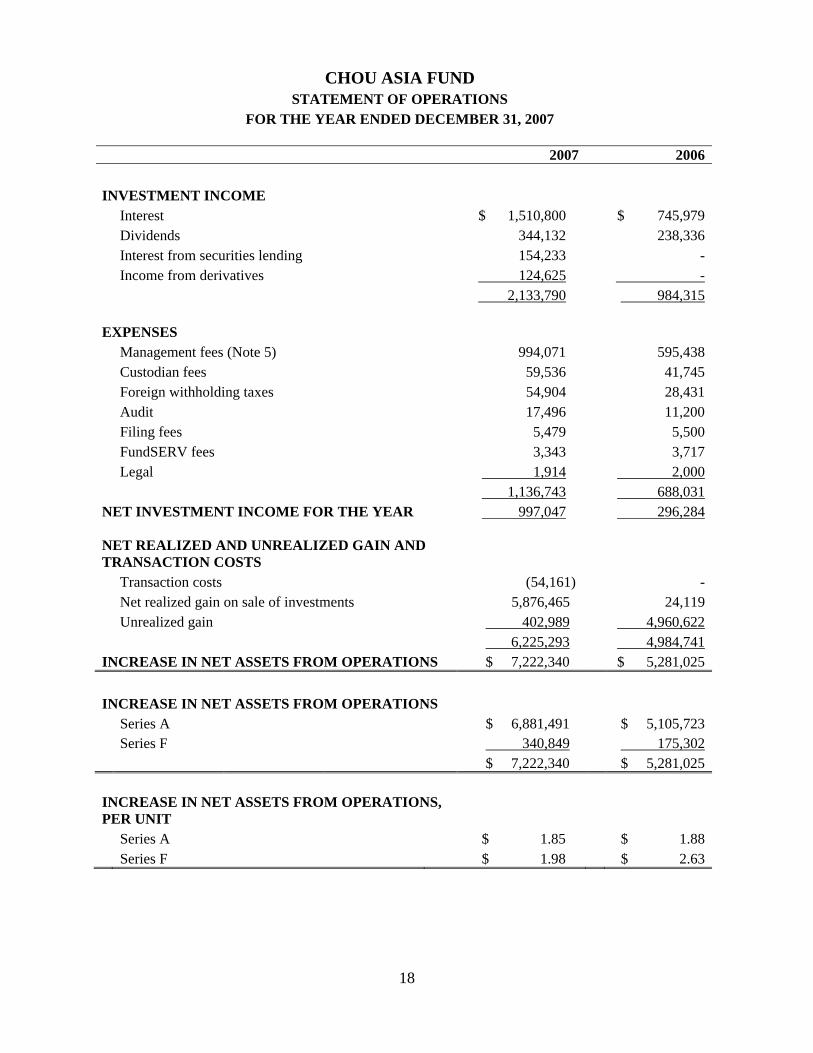
2007 2006 INVESTMENT INCOME Interest $ 1,510,800 $ 745,979 Dividends 344,132 238,336 Interest from securities lending 154,233 - Income from derivatives 124,625 - 2,133,790 984,315 EXPENSES Management fees (Note 5) 994,071 595,438 Custodian fees 59,536 41,745 Foreign withholding taxes 54,904 28,431 Audit 17,496 11,200 Filing fees 5,479 5,500 FundSERV fees 3,343 3,717 Legal 1,914 2,000 1,136,743 688,031 NET INVESTMENT INCOME FOR THE YEAR 997,047 296,284 NET REALIZED AND UNREALIZED GAIN AND TRANSACTION COSTS Transaction costs (54,161) - Net realized gain on sale of investments 5,876,465 24,119 Unrealized gain 402,989 4,960,622 6,225,293 4,984,741 INCREASE IN NET ASSETS FROM OPERATIONS $ 7,222,340 $ 5,281,025 INCREASE IN NET ASSETS FROM OPERATIONS Series A $ 6,881,491 $ 5,105,723 Series F 340,849 175,302 $ 7,222,340 $ 5,281,025 INCREASE IN NET ASSETS FROM OPERATIONS, PER UNIT Series A $ 1.85 $ 1.88 Series F $ 1.98 $ 2.63
19
2007 2006
SERIES A
NET ASSETS, beginning of the year 41,889,091$ 32,042,452$ Change in accounting policy (Note 2(a)) (39,439) -
41,849,652 32,042,452
Increase in net assets from operations 6,881,491 5,105,723 Proceeds from issue of units 32,772,773 9,199,690 Payments on redemption of units (7,327,778) (4,453,871) Distribution of income to unitholders
Investment income (851,170) (317,699) Realized gains (4,829,480) -
Reinvested distributions 5,610,846 312,796
NET ASSETS, end of the year 74,106,334 41,889,091
SERIES F
NET ASSETS, beginning of the year 1,960,684 140,098 Change in accounting policy (Note 2(a)) (1,832) -
1,958,852 140,098
Increase in net assets from operations 340,849 175,302 Proceeds from issue of units 1,711,741 1,679,997 Payments on redemption of units (2,060,353) (34,713) Distribution of income to unitholders
Investment income (17,719) (32,320) Realized gains (127,340) -
Reinvested distributions 144,623 32,320
NET ASSETS, end of the year 1,950,653 1,960,684
TOTAL NET ASSETS, end of the year 76,056,987$ 43,849,775$
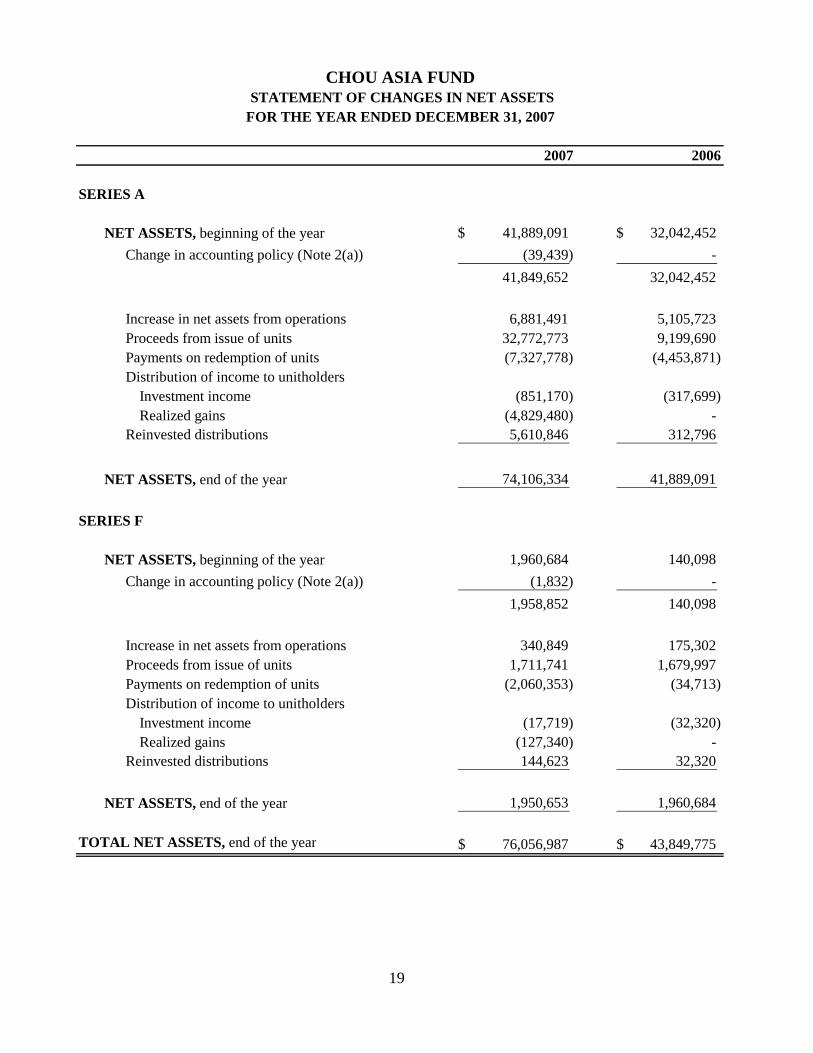
CHOU ASIA FUND STATEMENT OF CHANGES IN NET ASSETSFOR THE YEAR ENDED DECEMBER 31, 2007
20
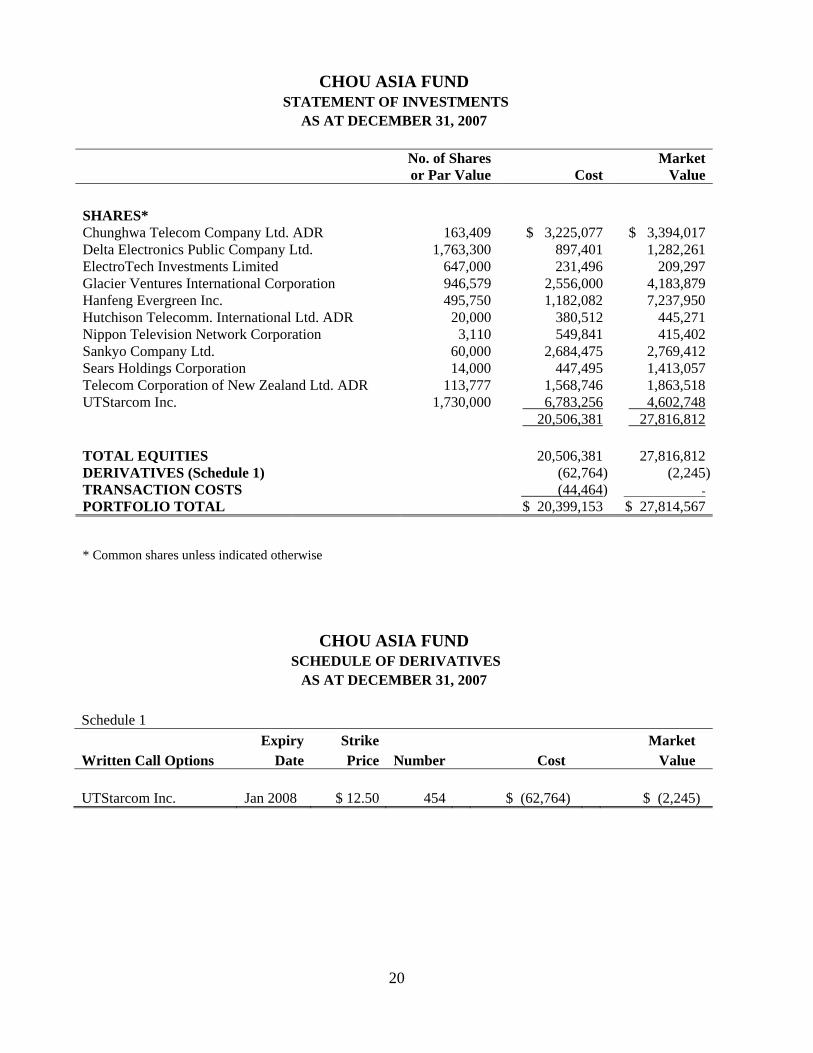
CHOU ASIA FUND
STATEMENT OF INVESTMENTS AS AT DECEMBER 31, 2007
No. of Shares
or Par Value Cost Market
Value SHARES* Chunghwa Telecom Company Ltd. ADR 163,409 $ 3,225,077 $ 3,394,017 Delta Electronics Public Company Ltd. 1,763,300 897,401 1,282,261 ElectroTech Investments Limited 647,000 231,496 209,297 Glacier Ventures International Corporation 946,579 2,556,000 4,183,879 Hanfeng Evergreen Inc. 495,750 1,182,082 7,237,950 Hutchison Telecomm. International Ltd. ADR 20,000 380,512 445,271 Nippon Television Network Corporation 3,110 549,841 415,402 Sankyo Company Ltd. 60,000 2,684,475 2,769,412 Sears Holdings Corporation 14,000 447,495 1,413,057 Telecom Corporation of New Zealand Ltd. ADR 113,777 1,568,746 1,863,518 UTStarcom Inc. 1,730,000 6,783,256 4,602,748 20,506,381 27,816,812 TOTAL EQUITIES 20,506,381 27,816,812 DERIVATIVES (Schedule 1) (62,764) (2,245)TRANSACTION COSTS (44,464) - PORTFOLIO TOTAL $ 20,399,153 $ 27,814,567 * Common shares unless indicated otherwise
CHOU ASIA FUND SCHEDULE OF DERIVATIVES
AS AT DECEMBER 31, 2007 Schedule 1 Expiry Strike Market Written Call Options Date Price Number Cost Value UTStarcom Inc. Jan 2008 $ 12.50 454 $ (62,764) $ (2,245)
21
CHOU EUROPE FUND
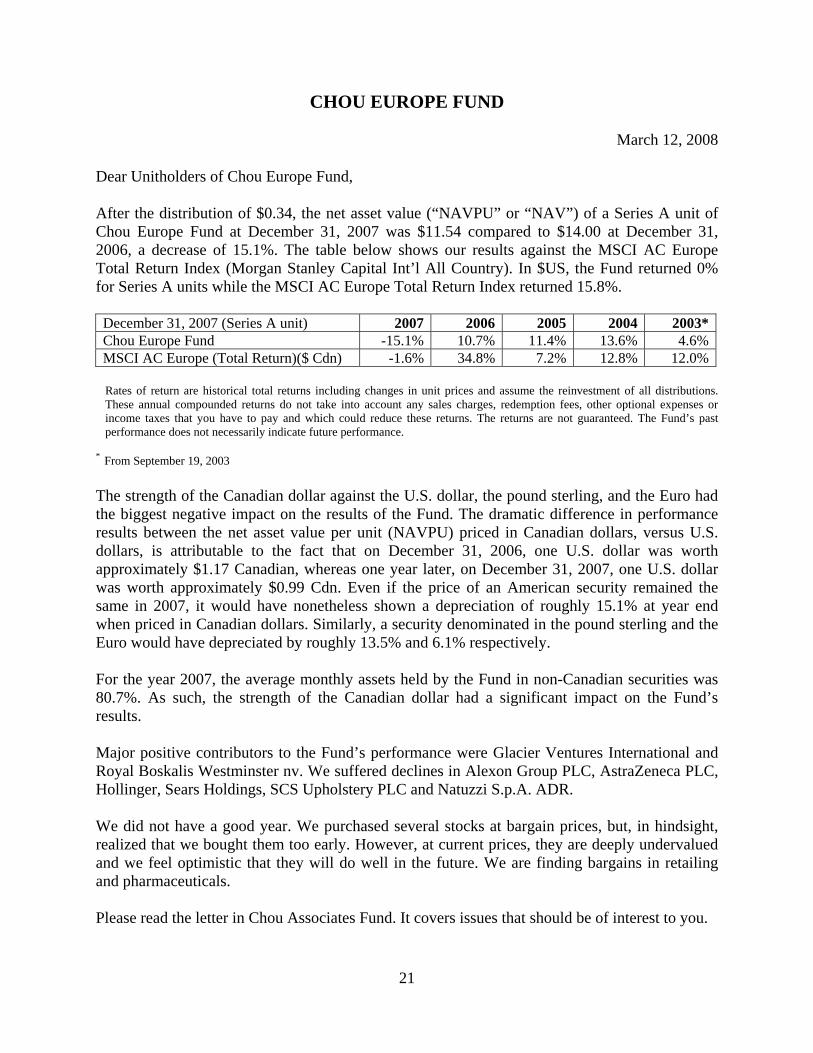
March 12, 2008 Dear Unitholders of Chou Europe Fund, After the distribution of $0.34, the net asset value (“NAVPU” or “NAV”) of a Series A unit of Chou Europe Fund at December 31, 2007 was $11.54 compared to $14.00 at December 31, 2006, a decrease of 15.1%. The table below shows our results against the MSCI AC Europe Total Return Index (Morgan Stanley Capital Int’l All Country). In $US, the Fund returned 0% for Series A units while the MSCI AC Europe Total Return Index returned 15.8%. December 31, 2007 (Series A unit) 2007 2006 2005 2004 2003*Chou Europe Fund -15.1% 10.7% 11.4% 13.6% 4.6%MSCI AC Europe (Total Return)($ Cdn) -1.6% 34.8% 7.2% 12.8% 12.0%
Rates of return are historical total returns including changes in unit prices and assume the reinvestment of all distributions. These annual compounded returns do not take into account any sales charges, redemption fees, other optional expenses or income taxes that you have to pay and which could reduce these returns. The returns are not guaranteed. The Fund’s past performance does not necessarily indicate future performance.
* From September 19, 2003 The strength of the Canadian dollar against the U.S. dollar, the pound sterling, and the Euro had the biggest negative impact on the results of the Fund. The dramatic difference in performance results between the net asset value per unit (NAVPU) priced in Canadian dollars, versus U.S. dollars, is attributable to the fact that on December 31, 2006, one U.S. dollar was worth approximately $1.17 Canadian, whereas one year later, on December 31, 2007, one U.S. dollar was worth approximately $0.99 Cdn. Even if the price of an American security remained the same in 2007, it would have nonetheless shown a depreciation of roughly 15.1% at year end when priced in Canadian dollars. Similarly, a security denominated in the pound sterling and the Euro would have depreciated by roughly 13.5% and 6.1% respectively. For the year 2007, the average monthly assets held by the Fund in non-Canadian securities was 80.7%. As such, the strength of the Canadian dollar had a significant impact on the Fund’s results. Major positive contributors to the Fund’s performance were Glacier Ventures International and Royal Boskalis Westminster nv. We suffered declines in Alexon Group PLC, AstraZeneca PLC, Hollinger, Sears Holdings, SCS Upholstery PLC and Natuzzi S.p.A. ADR. We did not have a good year. We purchased several stocks at bargain prices, but, in hindsight, realized that we bought them too early. However, at current prices, they are deeply undervalued and we feel optimistic that they will do well in the future. We are finding bargains in retailing and pharmaceuticals. Please read the letter in Chou Associates Fund. It covers issues that should be of interest to you.
22
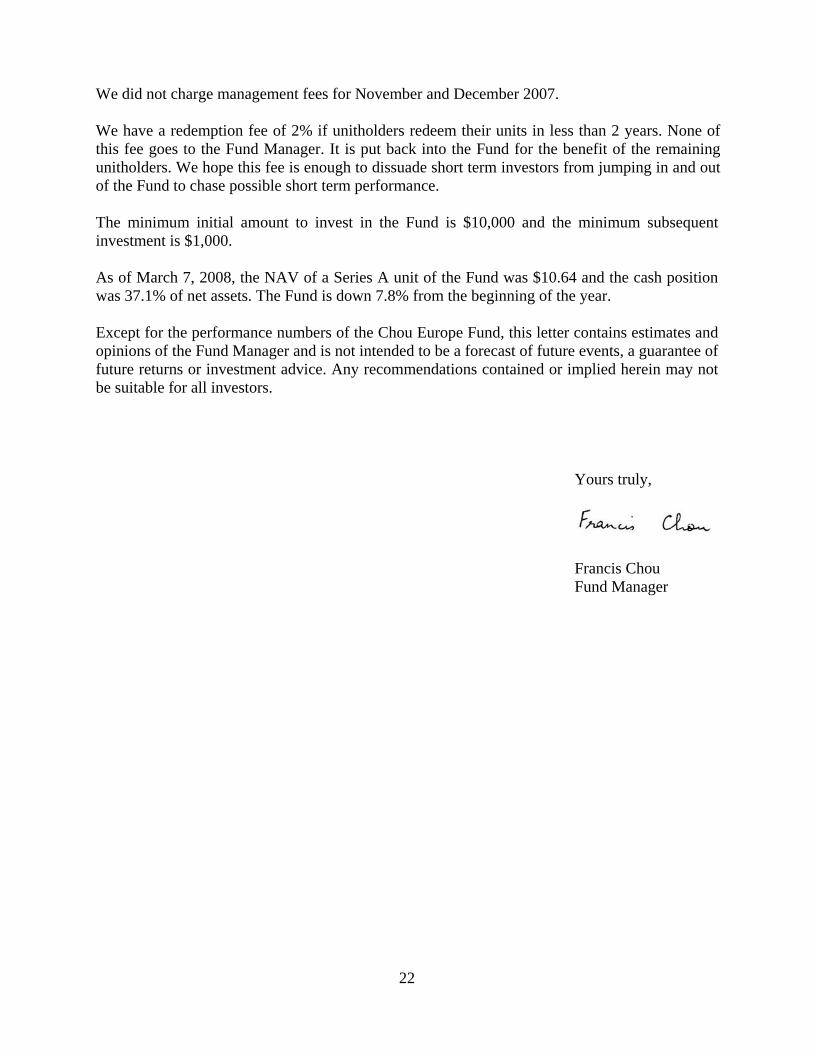
We did not charge management fees for November and December 2007. We have a redemption fee of 2% if unitholders redeem their units in less than 2 years. None of this fee goes to the Fund Manager. It is put back into the Fund for the benefit of the remaining unitholders. We hope this fee is enough to dissuade short term investors from jumping in and out of the Fund to chase possible short term performance. The minimum initial amount to invest in the Fund is $10,000 and the minimum subsequent investment is $1,000. As of March 7, 2008, the NAV of a Series A unit of the Fund was $10.64 and the cash position was 37.1% of net assets. The Fund is down 7.8% from the beginning of the year. Except for the performance numbers of the Chou Europe Fund, this letter contains estimates and opinions of the Fund Manager and is not intended to be a forecast of future events, a guarantee of future returns or investment advice. Any recommendations contained or implied herein may not be suitable for all investors.
Yours truly,
Francis Chou Fund Manager
23
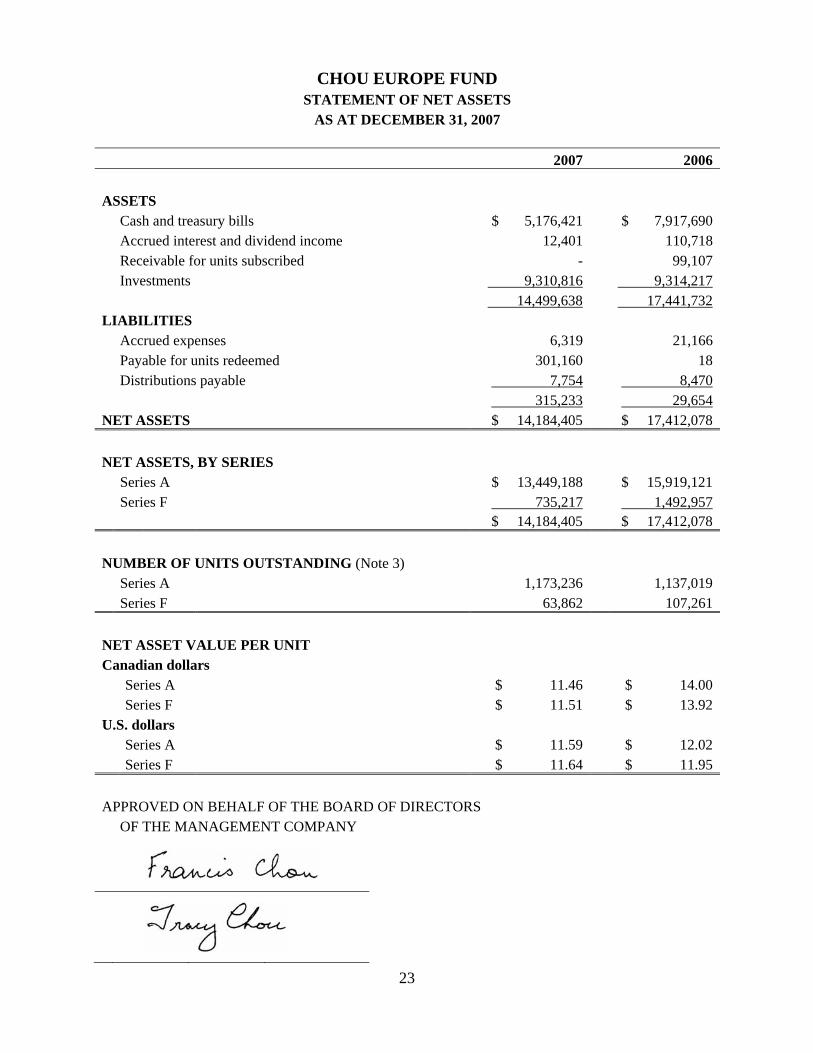
CHOU EUROPE FUND
STATEMENT OF NET ASSETS AS AT DECEMBER 31, 2007
2007 2006 ASSETS Cash and treasury bills $ 5,176,421 $ 7,917,690 Accrued interest and dividend income 12,401 110,718 Receivable for units subscribed - 99,107 Investments 9,310,816 9,314,217 14,499,638 17,441,732 LIABILITIES Accrued expenses 6,319 21,166 Payable for units redeemed 301,160 18 Distributions payable 7,754 8,470 315,233 29,654 NET ASSETS $ 14,184,405 $ 17,412,078 NET ASSETS, BY SERIES Series A $ 13,449,188 $ 15,919,121 Series F 735,217 1,492,957 $ 14,184,405 $ 17,412,078 NUMBER OF UNITS OUTSTANDING (Note 3) Series A 1,173,236 1,137,019 Series F 63,862 107,261 NET ASSET VALUE PER UNIT Canadian dollars Series A $ 11.46 $ 14.00 Series F $ 11.51 $ 13.92 U.S. dollars Series A $ 11.59 $ 12.02 Series F $ 11.64 $ 11.95 APPROVED ON BEHALF OF THE BOARD OF DIRECTORS OF THE MANAGEMENT COMPANY
CHOU EUROPE FUND
STATEMENT OF OPERATIONS FOR THE YEAR ENDED DECEMBER 31, 2007
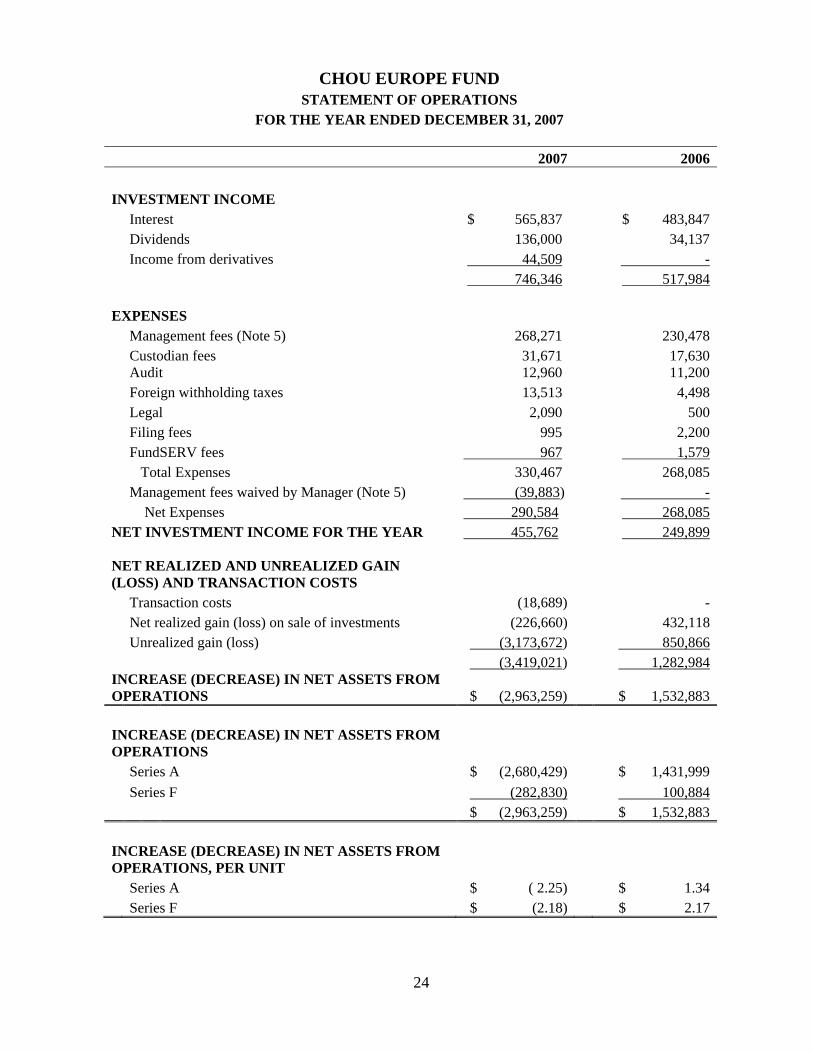
2007 2006 INVESTMENT INCOME Interest $ 565,837 $ 483,847 Dividends 136,000 34,137 Income from derivatives 44,509 - 746,346 517,984 EXPENSES Management fees (Note 5) 268,271 230,478 Custodian fees 31,671 17,630 Audit 12,960 11,200 Foreign withholding taxes 13,513 4,498 Legal 2,090 500 Filing fees 995 2,200 FundSERV fees 967 1,579 Total Expenses 330,467 268,085 Management fees waived by Manager (Note 5) (39,883) - Net Expenses 290,584 268,085 NET INVESTMENT INCOME FOR THE YEAR 455,762 249,899 NET REALIZED AND UNREALIZED GAIN (LOSS) AND TRANSACTION COSTS Transaction costs (18,689) - Net realized gain (loss) on sale of investments (226,660) 432,118 Unrealized gain (loss) (3,173,672) 850,866 (3,419,021) 1,282,984 INCREASE (DECREASE) IN NET ASSETS FROM OPERATIONS $ (2,963,259) $ 1,532,883 INCREASE (DECREASE) IN NET ASSETS FROM OPERATIONS Series A $ (2,680,429) $ 1,431,999 Series F (282,830) 100,884 $ (2,963,259) $ 1,532,883 INCREASE (DECREASE) IN NET ASSETS FROM OPERATIONS, PER UNIT Series A $ ( 2.25) $ 1.34 Series F $ (2.18) $ 2.17
24
25
2007 2006
SERIES A
NET ASSETS, beginning of the year 15,919,121$ 12,702,271$ Change in accounting policy (Note 2(a)) (7,866) -
15,911,255 12,702,271
Increase (decrease) in net assets from operations (2,680,429) 1,431,999 Proceeds from issue of units 4,656,787 4,793,681 Payments on redemption of units (4,430,744) (3,000,282) Distribution of income to unitholders
Investment income (388,803) (216,112) Realized gains - (156,042)
Reinvested distributions 381,122 363,606
NET ASSETS, end of the year 13,449,188 15,919,121
SERIES F
NET ASSETS, beginning of the year 1,492,957 62,605 Change in accounting policy (Note 2(a)) (737) -
1,492,220 62,605
Increase (decrease) in net assets from operations (282,830) 100,884 Proceeds from issue of units 752,601 1,349,374 Payments on redemption of units (1,226,696) (19,906) Distribution of income to unitholders
Investment income (17,268) (34,617) Realized gains - (14,533)
Reinvested distributions 17,190 49,150
NET ASSETS, end of the year 735,217 1,492,957
TOTAL NET ASSETS, end of the year 14,184,405$ 17,412,078$
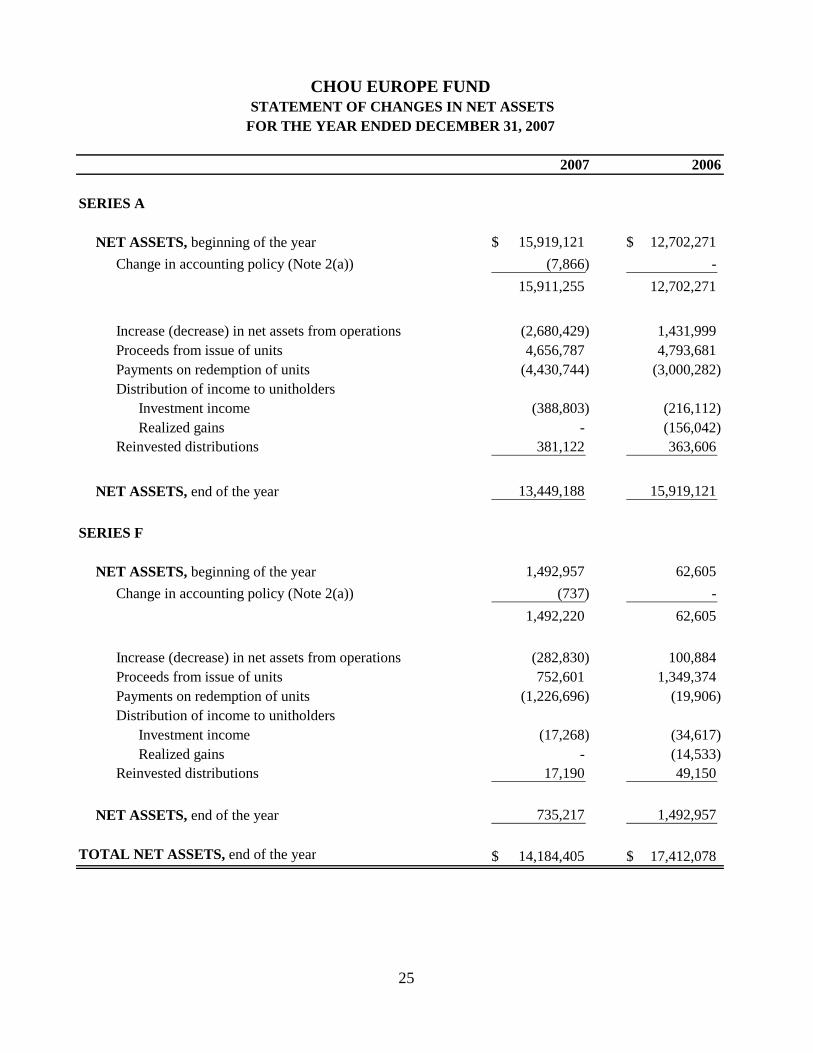
CHOU EUROPE FUND STATEMENT OF CHANGES IN NET ASSETSFOR THE YEAR ENDED DECEMBER 31, 2007
26
CHOU EUROPE FUND
STATEMENT OF INVESTMENTS AS AT DECEMBER 31, 2007
No. of Shares or Par Value Cost
Market Value
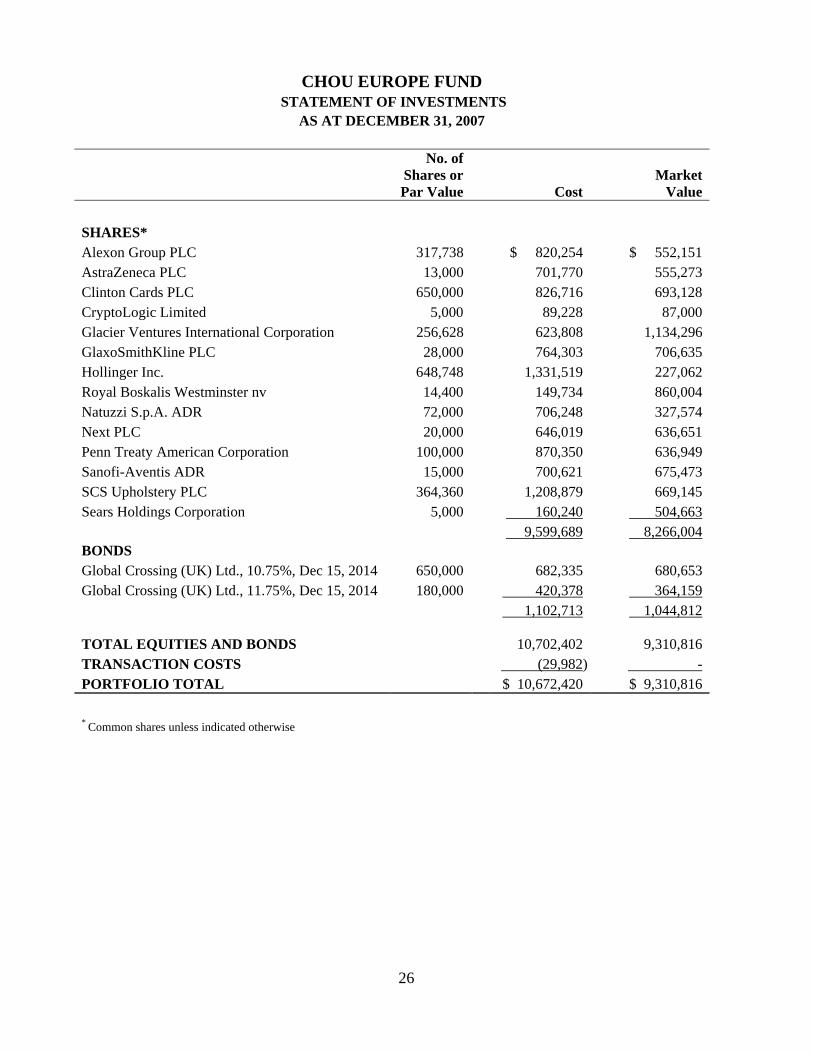
SHARES* Alexon Group PLC 317,738 $ 820,254 $ 552,151 AstraZeneca PLC 13,000 701,770 555,273 Clinton Cards PLC 650,000 826,716 693,128 CryptoLogic Limited 5,000 89,228 87,000 Glacier Ventures International Corporation 256,628 623,808 1,134,296 GlaxoSmithKline PLC 28,000 764,303 706,635 Hollinger Inc. 648,748 1,331,519 227,062 Royal Boskalis Westminster nv 14,400 149,734 860,004 Natuzzi S.p.A. ADR 72,000 706,248 327,574 Next PLC 20,000 646,019 636,651 Penn Treaty American Corporation 100,000 870,350 636,949 Sanofi-Aventis ADR 15,000 700,621 675,473 SCS Upholstery PLC 364,360 1,208,879 669,145 Sears Holdings Corporation 5,000 160,240 504,663 9,599,689 8,266,004 BONDS Global Crossing (UK) Ltd., 10.75%, Dec 15, 2014 650,000 682,335 680,653 Global Crossing (UK) Ltd., 11.75%, Dec 15, 2014 180,000 420,378 364,159 1,102,713 1,044,812 TOTAL EQUITIES AND BONDS 10,702,402 9,310,816 TRANSACTION COSTS (29,982) - PORTFOLIO TOTAL $ 10,672,420 $ 9,310,816 * Common shares unless indicated otherwise
27
CHOU BOND FUND
March 12, 2008
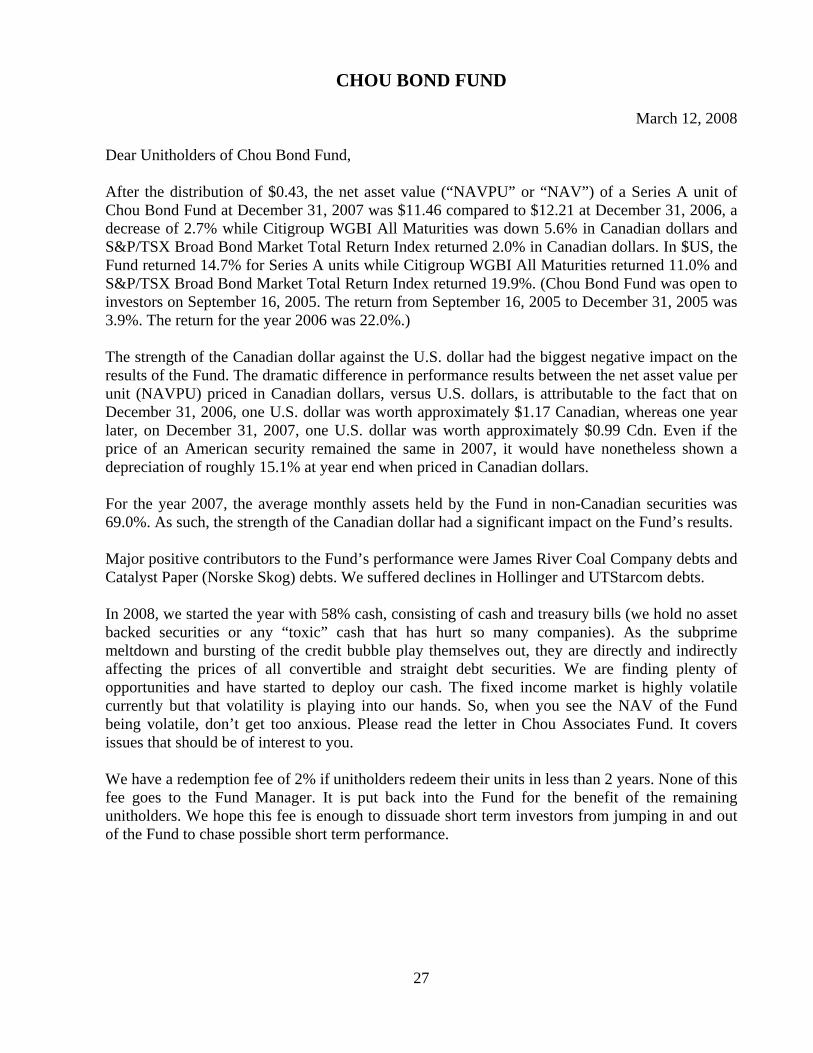
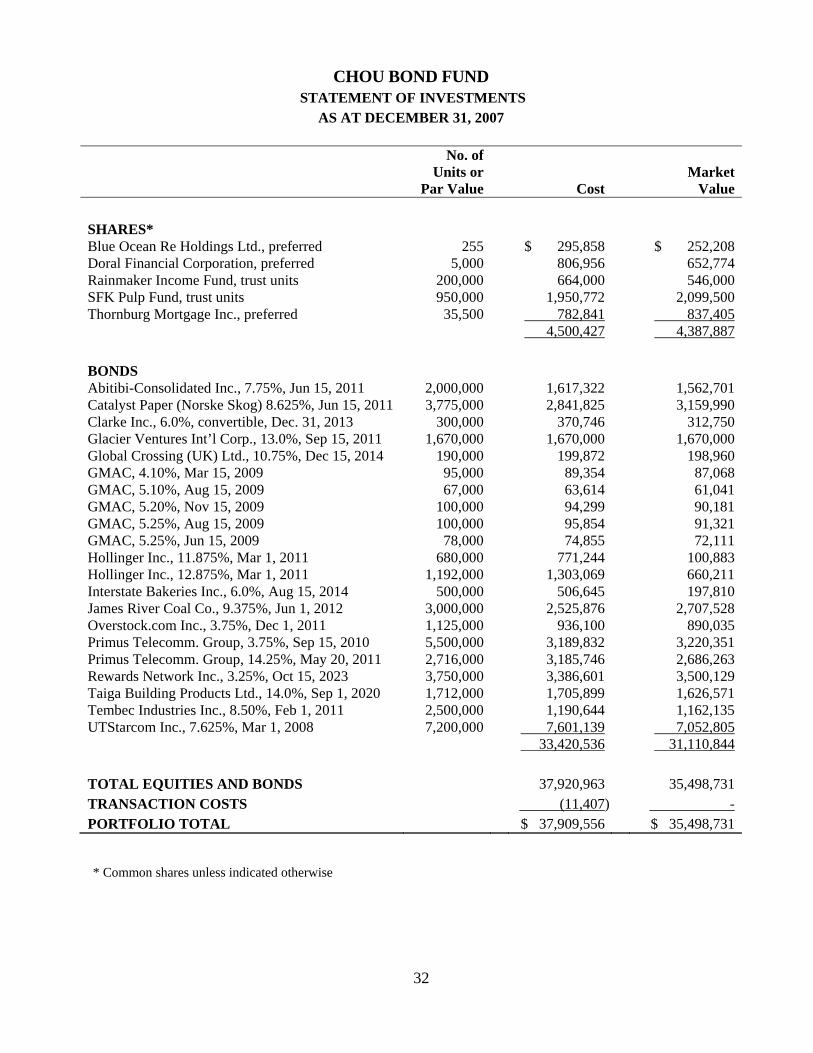
Dear Unitholders of Chou Bond Fund, After the distribution of $0.43, the net asset value (“NAVPU” or “NAV”) of a Series A unit of Chou Bond Fund at December 31, 2007 was $11.46 compared to $12.21 at December 31, 2006, a decrease of 2.7% while Citigroup WGBI All Maturities was down 5.6% in Canadian dollars and S&P/TSX Broad Bond Market Total Return Index returned 2.0% in Canadian dollars. In $US, the Fund returned 14.7% for Series A units while Citigroup WGBI All Maturities returned 11.0% and S&P/TSX Broad Bond Market Total Return Index returned 19.9%. (Chou Bond Fund was open to investors on September 16, 2005. The return from September 16, 2005 to December 31, 2005 was 3.9%. The return for the year 2006 was 22.0%.) The strength of the Canadian dollar against the U.S. dollar had the biggest negative impact on the results of the Fund. The dramatic difference in performance results between the net asset value per unit (NAVPU) priced in Canadian dollars, versus U.S. dollars, is attributable to the fact that on December 31, 2006, one U.S. dollar was worth approximately $1.17 Canadian, whereas one year later, on December 31, 2007, one U.S. dollar was worth approximately $0.99 Cdn. Even if the price of an American security remained the same in 2007, it would have nonetheless shown a depreciation of roughly 15.1% at year end when priced in Canadian dollars. For the year 2007, the average monthly assets held by the Fund in non-Canadian securities was 69.0%. As such, the strength of the Canadian dollar had a significant impact on the Fund’s results. Major positive contributors to the Fund’s performance were James River Coal Company debts and Catalyst Paper (Norske Skog) debts. We suffered declines in Hollinger and UTStarcom debts. In 2008, we started the year with 58% cash, consisting of cash and treasury bills (we hold no asset backed securities or any “toxic” cash that has hurt so many companies). As the subprime meltdown and bursting of the credit bubble play themselves out, they are directly and indirectly affecting the prices of all convertible and straight debt securities. We are finding plenty of opportunities and have started to deploy our cash. The fixed income market is highly volatile currently but that volatility is playing into our hands. So, when you see the NAV of the Fund being volatile, don’t get too anxious. Please read the letter in Chou Associates Fund. It covers issues that should be of interest to you. We have a redemption fee of 2% if unitholders redeem their units in less than 2 years. None of this fee goes to the Fund Manager. It is put back into the Fund for the benefit of the remaining unitholders. We hope this fee is enough to dissuade short term investors from jumping in and out of the Fund to chase possible short term performance.
28
The minimum initial amount to invest in the Fund is $10,000 and the minimum subsequent investment is $1,000. As of March 7, 2008, the NAV of a Series A unit of the Fund was $11.17 and the cash position was 49.7% of net assets. The Fund is down 2.5% from the beginning of the year. Except for the performance numbers of the Chou Bond Fund, this letter contains estimates and opinions of the Fund Manager and is not intended to be a forecast of future events, a guarantee of future returns or investment advice. Any recommendations contained or implied herein may not be suitable for all investors.
Yours truly,
Francis Chou Fund Manager
29
CHOU BOND FUND
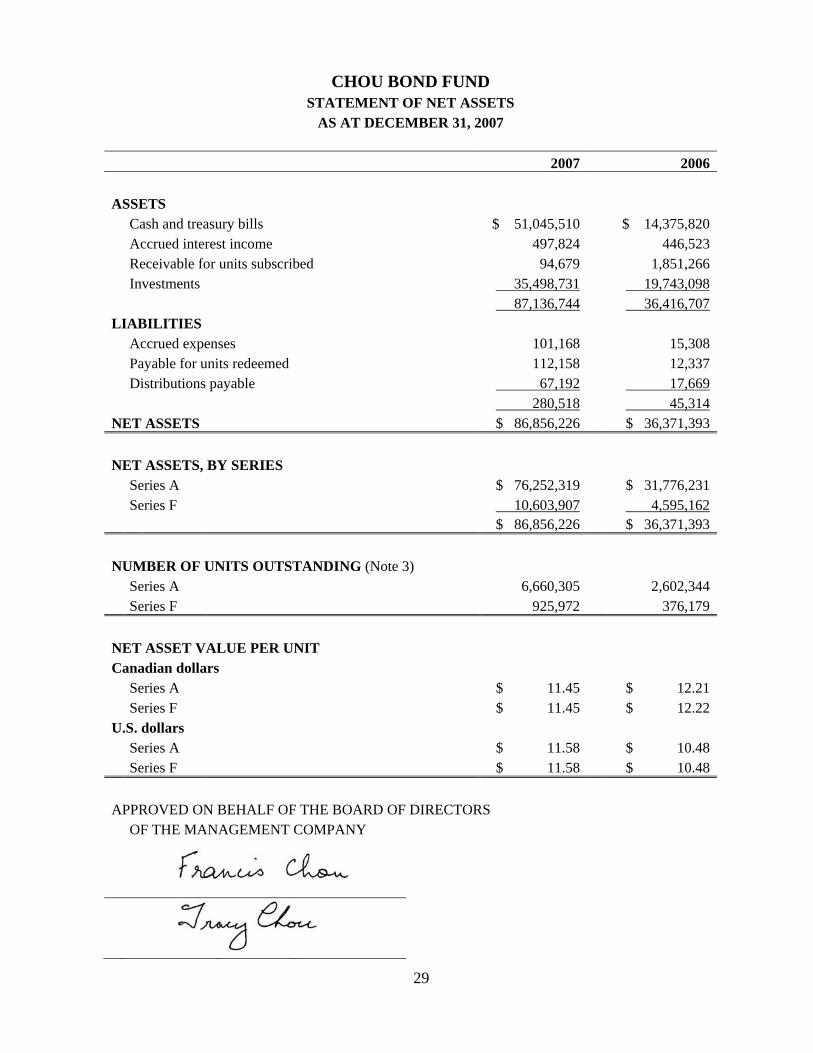
STATEMENT OF NET ASSETS AS AT DECEMBER 31, 2007
2007 2006 ASSETS Cash and treasury bills $ 51,045,510 $ 14,375,820 Accrued interest income 497,824 446,523 Receivable for units subscribed 94,679 1,851,266 Investments 35,498,731 19,743,098 87,136,744 36,416,707 LIABILITIES Accrued expenses 101,168 15,308 Payable for units redeemed 112,158 12,337 Distributions payable 67,192 17,669 280,518 45,314 NET ASSETS $ 86,856,226 $ 36,371,393 NET ASSETS, BY SERIES Series A $ 76,252,319 $ 31,776,231 Series F 10,603,907 4,595,162 $ 86,856,226 $ 36,371,393 NUMBER OF UNITS OUTSTANDING (Note 3) Series A 6,660,305 2,602,344 Series F 925,972 376,179 NET ASSET VALUE PER UNIT Canadian dollars Series A $ 11.45 $ 12.21 Series F $ 11.45 $ 12.22 U.S. dollars Series A $ 11.58 $ 10.48 Series F $ 11.58 $ 10.48 APPROVED ON BEHALF OF THE BOARD OF DIRECTORS OF THE MANAGEMENT COMPANY
30
CHOU BOND FUND
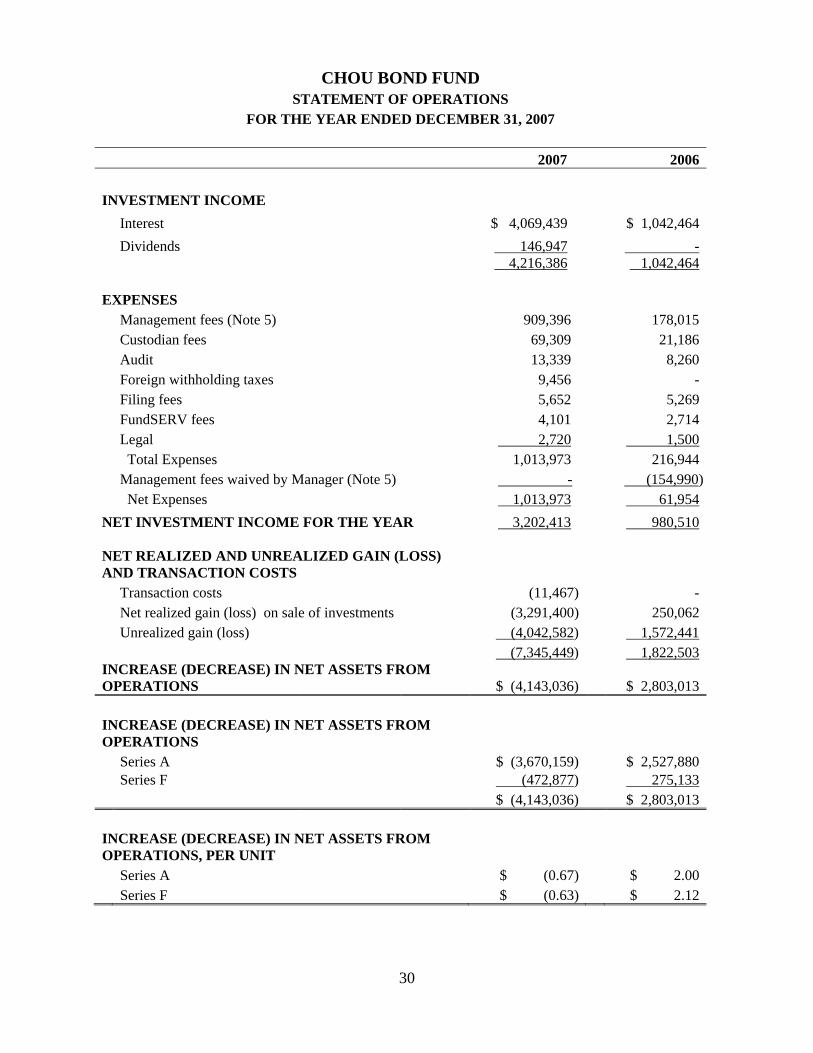
STATEMENT OF OPERATIONS FOR THE YEAR ENDED DECEMBER 31, 2007
2007 2006 INVESTMENT INCOME Interest $ 4,069,439 $ 1,042,464 Dividends 146,947 - 4,216,386 1,042,464 EXPENSES Management fees (Note 5) 909,396 178,015 Custodian fees 69,309 21,186 Audit 13,339 8,260 Foreign withholding taxes 9,456 - Filing fees 5,652 5,269 FundSERV fees 4,101 2,714 Legal 2,720 1,500 Total Expenses 1,013,973 216,944 Management fees waived by Manager (Note 5) - (154,990) Net Expenses 1,013,973 61,954 NET INVESTMENT INCOME FOR THE YEAR 3,202,413 980,510 NET REALIZED AND UNREALIZED GAIN (LOSS) AND TRANSACTION COSTS Transaction costs (11,467) - Net realized gain (loss) on sale of investments (3,291,400) 250,062 Unrealized gain (loss) (4,042,582) 1,572,441 (7,345,449) 1,822,503 INCREASE (DECREASE) IN NET ASSETS FROM OPERATIONS $ (4,143,036) $ 2,803,013 INCREASE (DECREASE) IN NET ASSETS FROM OPERATIONS Series A $ (3,670,159) $ 2,527,880 Series F (472,877) 275,133 $ (4,143,036) $ 2,803,013 INCREASE (DECREASE) IN NET ASSETS FROM OPERATIONS, PER UNIT Series A $ (0.67) $ 2.00 Series F $ (0.63) $ 2.12
31
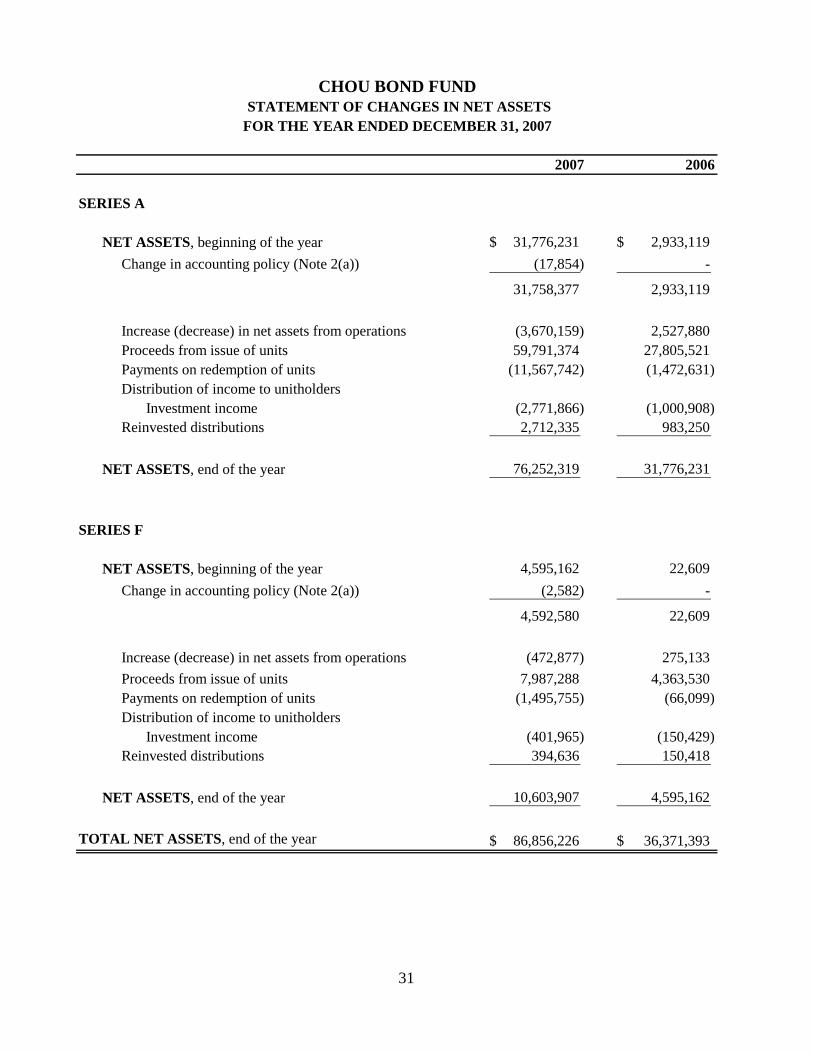
2007 2006
SERIES A
NET ASSETS, beginning of the year 31,776,231$ 2,933,119$ Change in accounting policy (Note 2(a)) (17,854) -
31,758,377 2,933,119
Increase (decrease) in net assets from operations (3,670,159) 2,527,880 Proceeds from issue of units 59,791,374 27,805,521 Payments on redemption of units (11,567,742) (1,472,631) Distribution of income to unitholders
Investment income (2,771,866) (1,000,908) Reinvested distributions 2,712,335 983,250
NET ASSETS, end of the year 76,252,319 31,776,231
SERIES F
NET ASSETS, beginning of the year 4,595,162 22,609 Change in accounting policy (Note 2(a)) (2,582) -
4,592,580 22,609
Increase (decrease) in net assets from operations (472,877) 275,133 Proceeds from issue of units 7,987,288 4,363,530 Payments on redemption of units (1,495,755) (66,099) Distribution of income to unitholders
Investment income (401,965) (150,429) Reinvested distributions 394,636 150,418
NET ASSETS, end of the year 10,603,907 4,595,162
TOTAL NET ASSETS, end of the year 86,856,226$ 36,371,393$
CHOU BOND FUND STATEMENT OF CHANGES IN NET ASSETSFOR THE YEAR ENDED DECEMBER 31, 2007
32
CHOU BOND FUND
STATEMENT OF INVESTMENTS AS AT DECEMBER 31, 2007
No. of Units or
Par Value Cost Market
Value SHARES* Blue Ocean Re Holdings Ltd., preferred 255 $ 295,858 $ 252,208 Doral Financial Corporation, preferred 5,000 806,956 652,774 Rainmaker Income Fund, trust units 200,000 664,000 546,000 SFK Pulp Fund, trust units 950,000 1,950,772 2,099,500 Thornburg Mortgage Inc., preferred 35,500 782,841 837,405 4,500,427 4,387,887 BONDS Abitibi-Consolidated Inc., 7.75%, Jun 15, 2011 2,000,000 1,617,322 1,562,701 Catalyst Paper (Norske Skog) 8.625%, Jun 15, 2011 3,775,000 2,841,825 3,159,990 Clarke Inc., 6.0%, convertible, Dec. 31, 2013 300,000 370,746 312,750 Glacier Ventures Int’l Corp., 13.0%, Sep 15, 2011 1,670,000 1,670,000 1,670,000 Global Crossing (UK) Ltd., 10.75%, Dec 15, 2014 190,000 199,872 198,960 GMAC, 4.10%, Mar 15, 2009 95,000 89,354 87,068 GMAC, 5.10%, Aug 15, 2009 67,000 63,614 61,041 GMAC, 5.20%, Nov 15, 2009 100,000 94,299 90,181 GMAC, 5.25%, Aug 15, 2009 100,000 95,854 91,321 GMAC, 5.25%, Jun 15, 2009 78,000 74,855 72,111 Hollinger Inc., 11.875%, Mar 1, 2011 680,000 771,244 100,883 Hollinger Inc., 12.875%, Mar 1, 2011 1,192,000 1,303,069 660,211 Interstate Bakeries Inc., 6.0%, Aug 15, 2014 500,000 506,645 197,810 James River Coal Co., 9.375%, Jun 1, 2012 3,000,000 2,525,876 2,707,528 Overstock.com Inc., 3.75%, Dec 1, 2011 1,125,000 936,100 890,035 Primus Telecomm. Group, 3.75%, Sep 15, 2010 5,500,000 3,189,832 3,220,351 Primus Telecomm. Group, 14.25%, May 20, 2011 2,716,000 3,185,746 2,686,263 Rewards Network Inc., 3.25%, Oct 15, 2023 3,750,000 3,386,601 3,500,129 Taiga Building Products Ltd., 14.0%, Sep 1, 2020 1,712,000 1,705,899 1,626,571 Tembec Industries Inc., 8.50%, Feb 1, 2011 2,500,000 1,190,644 1,162,135 UTStarcom Inc., 7.625%, Mar 1, 2008 7,200,000 7,601,139 7,052,805 33,420,536 31,110,844 TOTAL EQUITIES AND BONDS 37,920,963 35,498,731 TRANSACTION COSTS (11,407) - PORTFOLIO TOTAL $ 37,909,556 $ 35,498,731
* Common shares unless indicated otherwise
33
CHOU RRSP FUND
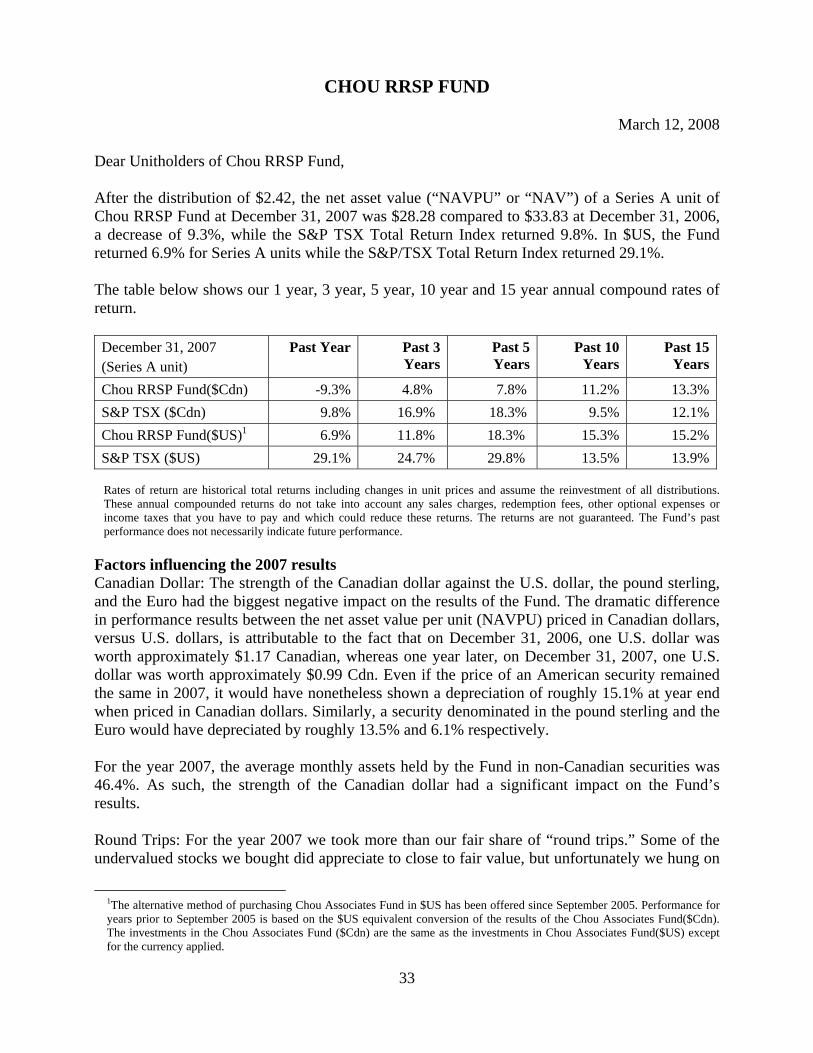
March 12, 2008 Dear Unitholders of Chou RRSP Fund, After the distribution of $2.42, the net asset value (“NAVPU” or “NAV”) of a Series A unit of Chou RRSP Fund at December 31, 2007 was $28.28 compared to $33.83 at December 31, 2006, a decrease of 9.3%, while the S&P TSX Total Return Index returned 9.8%. In $US, the Fund returned 6.9% for Series A units while the S&P/TSX Total Return Index returned 29.1%. The table below shows our 1 year, 3 year, 5 year, 10 year and 15 year annual compound rates of return. December 31, 2007 (Series A unit)
Past Year Past 3 Years
Past 5 Years
Past 10 Years
Past 15 Years
Chou RRSP Fund($Cdn) -9.3% 4.8% 7.8% 11.2% 13.3%S&P TSX ($Cdn) 9.8% 16.9% 18.3% 9.5% 12.1%Chou RRSP Fund($US)1 6.9% 11.8% 18.3% 15.3% 15.2%S&P TSX ($US) 29.1% 24.7% 29.8% 13.5% 13.9% Rates of return are historical total returns including changes in unit prices and assume the reinvestment of all distributions. These annual compounded returns do not take into account any sales charges, redemption fees, other optional expenses or income taxes that you have to pay and which could reduce these returns. The returns are not guaranteed. The Fund’s past performance does not necessarily indicate future performance.
Factors influencing the 2007 results Canadian Dollar: The strength of the Canadian dollar against the U.S. dollar, the pound sterling, and the Euro had the biggest negative impact on the results of the Fund. The dramatic difference in performance results between the net asset value per unit (NAVPU) priced in Canadian dollars, versus U.S. dollars, is attributable to the fact that on December 31, 2006, one U.S. dollar was worth approximately $1.17 Canadian, whereas one year later, on December 31, 2007, one U.S. dollar was worth approximately $0.99 Cdn. Even if the price of an American security remained the same in 2007, it would have nonetheless shown a depreciation of roughly 15.1% at year end when priced in Canadian dollars. Similarly, a security denominated in the pound sterling and the Euro would have depreciated by roughly 13.5% and 6.1% respectively. For the year 2007, the average monthly assets held by the Fund in non-Canadian securities was 46.4%. As such, the strength of the Canadian dollar had a significant impact on the Fund’s results. Round Trips: For the year 2007 we took more than our fair share of “round trips.” Some of the undervalued stocks we bought did appreciate to close to fair value, but unfortunately we hung on
1The alternative method of purchasing Chou Associates Fund in $US has been offered since September 2005. Performance for years prior to September 2005 is based on the $US equivalent conversion of the results of the Chou Associates Fund($Cdn). The investments in the Chou Associates Fund ($Cdn) are the same as the investments in Chou Associates Fund($US) except for the currency applied.
34
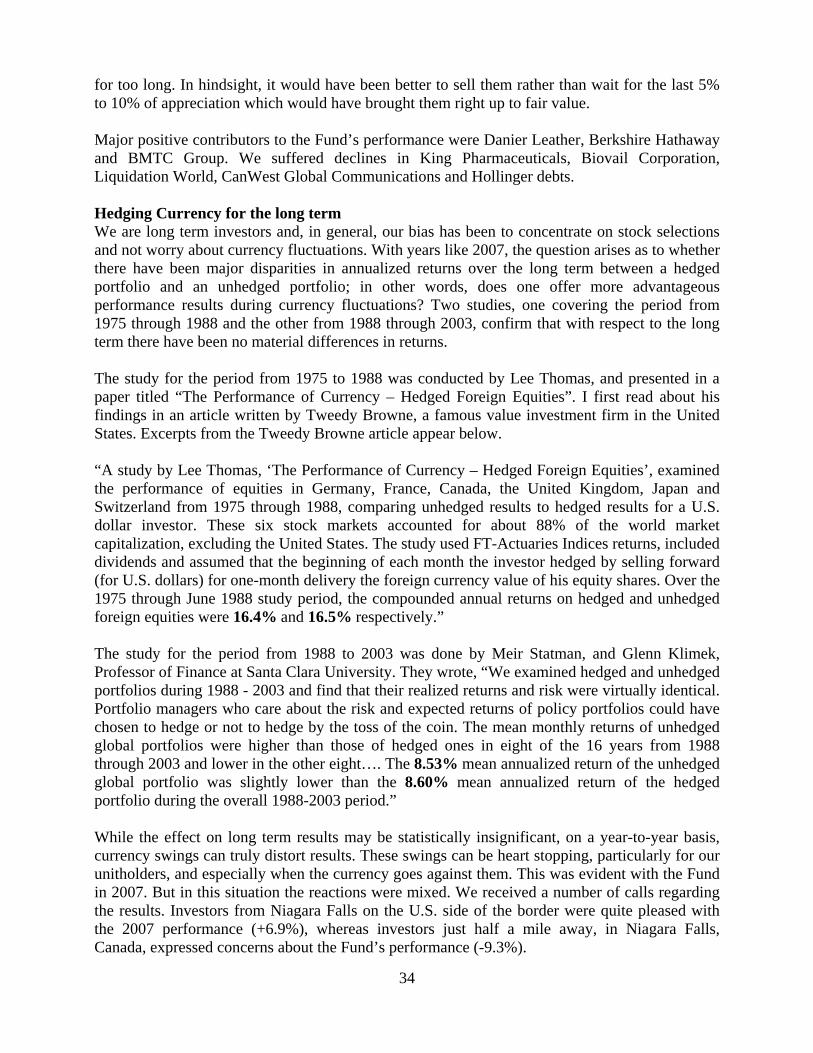
for too long. In hindsight, it would have been better to sell them rather than wait for the last 5% to 10% of appreciation which would have brought them right up to fair value. Major positive contributors to the Fund’s performance were Danier Leather, Berkshire Hathaway and BMTC Group. We suffered declines in King Pharmaceuticals, Biovail Corporation, Liquidation World, CanWest Global Communications and Hollinger debts. Hedging Currency for the long term We are long term investors and, in general, our bias has been to concentrate on stock selections and not worry about currency fluctuations. With years like 2007, the question arises as to whether there have been major disparities in annualized returns over the long term between a hedged portfolio and an unhedged portfolio; in other words, does one offer more advantageous performance results during currency fluctuations? Two studies, one covering the period from 1975 through 1988 and the other from 1988 through 2003, confirm that with respect to the long term there have been no material differences in returns. The study for the period from 1975 to 1988 was conducted by Lee Thomas, and presented in a paper titled “The Performance of Currency – Hedged Foreign Equities”. I first read about his findings in an article written by Tweedy Browne, a famous value investment firm in the United States. Excerpts from the Tweedy Browne article appear below. “A study by Lee Thomas, ‘The Performance of Currency – Hedged Foreign Equities’, examined the performance of equities in Germany, France, Canada, the United Kingdom, Japan and Switzerland from 1975 through 1988, comparing unhedged results to hedged results for a U.S. dollar investor. These six stock markets accounted for about 88% of the world market capitalization, excluding the United States. The study used FT-Actuaries Indices returns, included dividends and assumed that the beginning of each month the investor hedged by selling forward (for U.S. dollars) for one-month delivery the foreign currency value of his equity shares. Over the 1975 through June 1988 study period, the compounded annual returns on hedged and unhedged foreign equities were 16.4% and 16.5% respectively.” The study for the period from 1988 to 2003 was done by Meir Statman, and Glenn Klimek, Professor of Finance at Santa Clara University. They wrote, “We examined hedged and unhedged portfolios during 1988 - 2003 and find that their realized returns and risk were virtually identical. Portfolio managers who care about the risk and expected returns of policy portfolios could have chosen to hedge or not to hedge by the toss of the coin. The mean monthly returns of unhedged global portfolios were higher than those of hedged ones in eight of the 16 years from 1988 through 2003 and lower in the other eight…. The 8.53% mean annualized return of the unhedged global portfolio was slightly lower than the 8.60% mean annualized return of the hedged portfolio during the overall 1988-2003 period.” While the effect on long term results may be statistically insignificant, on a year-to-year basis, currency swings can truly distort results. These swings can be heart stopping, particularly for our unitholders, and especially when the currency goes against them. This was evident with the Fund in 2007. But in this situation the reactions were mixed. We received a number of calls regarding the results. Investors from Niagara Falls on the U.S. side of the border were quite pleased with the 2007 performance (+6.9%), whereas investors just half a mile away, in Niagara Falls, Canada, expressed concerns about the Fund’s performance (-9.3%).
35
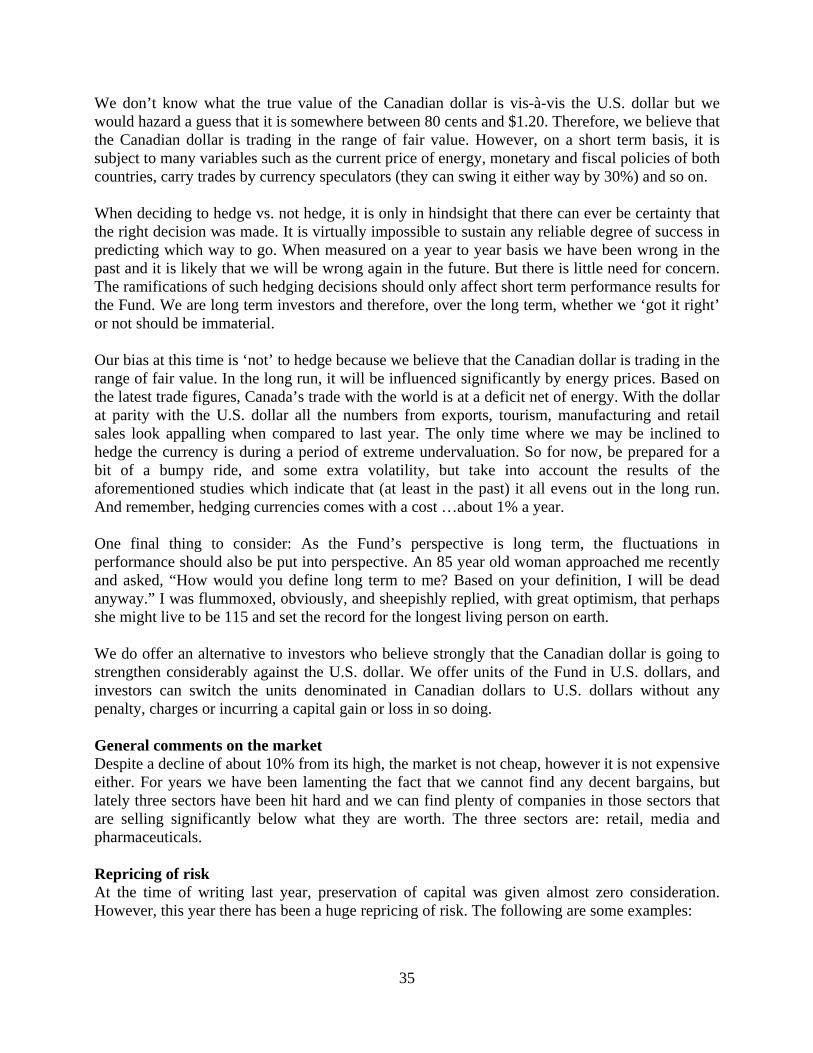
We don’t know what the true value of the Canadian dollar is vis-à-vis the U.S. dollar but we would hazard a guess that it is somewhere between 80 cents and $1.20. Therefore, we believe that the Canadian dollar is trading in the range of fair value. However, on a short term basis, it is subject to many variables such as the current price of energy, monetary and fiscal policies of both countries, carry trades by currency speculators (they can swing it either way by 30%) and so on. When deciding to hedge vs. not hedge, it is only in hindsight that there can ever be certainty that the right decision was made. It is virtually impossible to sustain any reliable degree of success in predicting which way to go. When measured on a year to year basis we have been wrong in the past and it is likely that we will be wrong again in the future. But there is little need for concern. The ramifications of such hedging decisions should only affect short term performance results for the Fund. We are long term investors and therefore, over the long term, whether we ‘got it right’ or not should be immaterial. Our bias at this time is ‘not’ to hedge because we believe that the Canadian dollar is trading in the range of fair value. In the long run, it will be influenced significantly by energy prices. Based on the latest trade figures, Canada’s trade with the world is at a deficit net of energy. With the dollar at parity with the U.S. dollar all the numbers from exports, tourism, manufacturing and retail sales look appalling when compared to last year. The only time where we may be inclined to hedge the currency is during a period of extreme undervaluation. So for now, be prepared for a bit of a bumpy ride, and some extra volatility, but take into account the results of the aforementioned studies which indicate that (at least in the past) it all evens out in the long run. And remember, hedging currencies comes with a cost …about 1% a year. One final thing to consider: As the Fund’s perspective is long term, the fluctuations in performance should also be put into perspective. An 85 year old woman approached me recently and asked, “How would you define long term to me? Based on your definition, I will be dead anyway.” I was flummoxed, obviously, and sheepishly replied, with great optimism, that perhaps she might live to be 115 and set the record for the longest living person on earth. We do offer an alternative to investors who believe strongly that the Canadian dollar is going to strengthen considerably against the U.S. dollar. We offer units of the Fund in U.S. dollars, and investors can switch the units denominated in Canadian dollars to U.S. dollars without any penalty, charges or incurring a capital gain or loss in so doing. General comments on the market Despite a decline of about 10% from its high, the market is not cheap, however it is not expensive either. For years we have been lamenting the fact that we cannot find any decent bargains, but lately three sectors have been hit hard and we can find plenty of companies in those sectors that are selling significantly below what they are worth. The three sectors are: retail, media and pharmaceuticals. Repricing of risk At the time of writing last year, preservation of capital was given almost zero consideration. However, this year there has been a huge repricing of risk. The following are some examples:
36
1) The spread between U.S. corporate high yield debt and 5 year U.S. treasuries was 270 basis points a year ago. Currently, it is 778. At its widest, in November 2002, it was 1,094 basis points (source: Citigroup).
2) The spread between U.S. corporate high yield debt and U.S. investment grade bonds was 187 basis points a year ago. Currently, it is 549. At its widest, in November 2002, it was 845 basis points (source: Citigroup).
Last year, we wrote that some of the greatest excesses of easy credit were committed by subprime lenders. Credit standards were so lax and liberal that homeowners didn’t even need to produce verification of income to be able to borrow up to 100% or more of the appraised value of their houses. The chickens are coming home to roost for companies that were in any way associated with housing and housing related issues, and those companies include banks, mortgage lenders, monoline bond insurers, hedge funds, you name it. So far, they have announced $255 billion (source: Deutsche Bank) in losses. While the numbers may look awful, the reality is far worse. The problem started with subprime borrowers and it is spreading to Alternate A borrowers (between subprime and prime) and ultimately, although to a lesser degree, it will affect prime borrowers. The reason for the spreading is that credit standards were equally lax with Alternate A borrowers and prime borrowers. On top of that we have yet to factor in the impact of liquidity squeeze from financial deleveraging, and that of loans in leveraged buyouts, commercial real estate, automobiles, margin loans, structured products, and the like. Institutions were so driven by incentives to securitize assets into asset backed securities and CDOs (Collateralized Debt Obligation) that they were willing to overlook the true riskiness of the securities involved. Those securities were then morphed into derivatives or any number of exotic instruments that barely resemble the original loans. Credit standards did not matter but volume and liquidity did, and ‘mortgages’ was one product that easily satisfied that criteria. In general, we find that executives who sugarcoat business realities and embellish results, downplay issues and disguise potential problems to investors may be trying to fool their audience, but eventually they end up fooling themselves. They start believing in their own world of make-believe. We would be careful about buying any financial stock. It is virtually impossible to find out what toxic brew the financial companies may hold in their balance sheets (either because they may not want you to know the truth or because even they don’t know the truth themselves). Financial companies use ‘best estimates’ for many line items on the balance sheet and when companies are in trouble, they frequently have a chance to downplay the seriousness of the problems. Most of them are honourable but there are a few who use, what I’ve coined, “the ‘DROP’ principle” on unsuspecting investors. (D is for dribbling out the bad news slowly, R is for raising money, and OP is for dishing out the most optimistic projections.) Once the money has been raised from investors, these companies will announce a few months later ‘the big drop’ – that is, to take a big writedown. Yet still, having said that, we are looking for companies that are not involved directly with financials but, instead, have been somewhat tainted by association. Our historical returns and what we can learn from them As we have stated in our past letters, the cardinal principle underlying the investments in the Fund is to pay far less than what the company is worth, measured by sustainable earning power
37
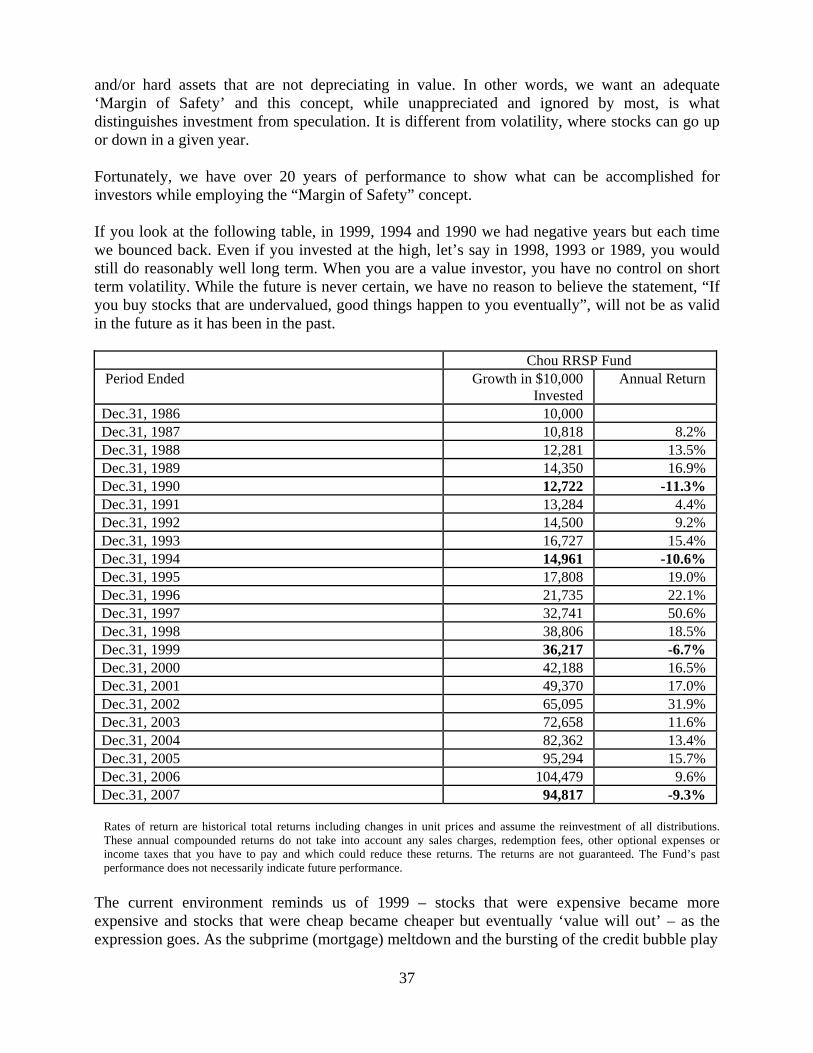
and/or hard assets that are not depreciating in value. In other words, we want an adequate ‘Margin of Safety’ and this concept, while unappreciated and ignored by most, is what distinguishes investment from speculation. It is different from volatility, where stocks can go up or down in a given year. Fortunately, we have over 20 years of performance to show what can be accomplished for investors while employing the “Margin of Safety” concept. If you look at the following table, in 1999, 1994 and 1990 we had negative years but each time we bounced back. Even if you invested at the high, let’s say in 1998, 1993 or 1989, you would still do reasonably well long term. When you are a value investor, you have no control on short term volatility. While the future is never certain, we have no reason to believe the statement, “If you buy stocks that are undervalued, good things happen to you eventually”, will not be as valid in the future as it has been in the past. Chou RRSP Fund Period Ended Growth in $10,000
Invested Annual Return
Dec.31, 1986 10,000 Dec.31, 1987 10,818 8.2% Dec.31, 1988 12,281 13.5% Dec.31, 1989 14,350 16.9% Dec.31, 1990 12,722 -11.3% Dec.31, 1991 13,284 4.4% Dec.31, 1992 14,500 9.2% Dec.31, 1993 16,727 15.4% Dec.31, 1994 14,961 -10.6% Dec.31, 1995 17,808 19.0% Dec.31, 1996 21,735 22.1% Dec.31, 1997 32,741 50.6% Dec.31, 1998 38,806 18.5% Dec.31, 1999 36,217 -6.7% Dec.31, 2000 42,188 16.5% Dec.31, 2001 49,370 17.0% Dec.31, 2002 65,095 31.9% Dec.31, 2003 72,658 11.6% Dec.31, 2004 82,362 13.4% Dec.31, 2005 95,294 15.7% Dec.31, 2006 104,479 9.6% Dec.31, 2007 94,817 -9.3%
Rates of return are historical total returns including changes in unit prices and assume the reinvestment of all distributions. These annual compounded returns do not take into account any sales charges, redemption fees, other optional expenses or income taxes that you have to pay and which could reduce these returns. The returns are not guaranteed. The Fund’s past performance does not necessarily indicate future performance.
The current environment reminds us of 1999 – stocks that were expensive became more expensive and stocks that were cheap became cheaper but eventually ‘value will out’ – as the expression goes. As the subprime (mortgage) meltdown and the bursting of the credit bubble play
38
themselves out, they directly and indirectly affect the prices of almost all debt and equity securities, and the market will be highly volatile for a while. Therefore, the unit value of our Fund will also be volatile. So, this is not the time to get too anxious. Volatility is playing into our hands. We wouldn’t be finding stocks or fixed income debts as cheap as they are now if it wasn’t for this fear in the market. Market participants that invested in the toxic brew securities are dumping debt and equity securities indiscriminately as they are forced to raise cash to meet margin calls and redemptions. We would encourage our unitholders to review and understand the table as it may help them to not fret too much. As you can see, we have done reasonably well in the long run. Notwithstanding, the amount of money that investors choose to invest in the Fund should only be to the extent that they can afford to lose 40% or more of their investment. This may sound drastic, but sleeping well and not getting too anxious are also important considerations both for the manager and the unitholder. Credit default swaps (CDS) In last year’s letter, we informed investors of our interest in CDS. We wrote, “In terms of investment ideas in derivatives, we believe that CDS are selling at prices that are compelling. At recent prices, they offer the cheapest form of insurance against market disruptions. In CDS, one party sells credit protection and the other party buys credit protection. Put another way, one party is selling insurance and the counterparty is buying insurance against the default of the third party’s debt. The Chou Funds would be interested in buying this type of insurance…. To give you some sense of perspective, in October 2002, the 5 year CDS of General Electric Company was quoted at an annual price of 110 basis points. Recently, it was quoted at an annual price of 8 basis points. To make money in CDS, you don’t need a default of the third party’s debt. If there is any hiccup in the economy, the CDS price will rise from these low levels. The negative aspect is that, like insurance, the premium paid for the protection erodes over time and may expire worthless.” Subsequent to that letter it took until mid September 2007 for all of our compliance and regulatory approvals to be put into place and by then the prices of CDSs had moved appreciably. In accordance with our prospectus we could invest no more than 5% of the net assets of the Fund, at the time of purchase, in CDSs. We missed the low hanging fruit, but the good thing is we now have these approvals in place and can exploit the situation next time. The current price of General Electric’s 5 year CDS is at 168 basis points, and shows the potential for gain. Other matters Foreign Currency Hedging: None existed in 2006 and 2007. U.S. dollar Valuation: Any investor who wishes to purchase the Chou Funds in $US is now able to do so. Independent Review Committee: Under the provisions of National Instrument 81-107 Independent Review Committee for Investment Funds ("NI 81-107"), which came into force on November 1, 2006, it is now required that all publicly offered investment funds, such as the
39
family of Chou Funds, establish an independent review committee ("IRC") to whom the Manager is to refer all conflict of interest matters for review. This instrument further mandates that the IRC be composed of at least three independent members and requires that they report, at least annually, to the Manager and shareholders in respect of the IRC's duties. The Manager has established an IRC as required by NI 81-107. The members of the IRC are Sandford Borins, Bruce Kerr and Joe Tortolano. The IRC report is posted on our website www.choufunds.com. Hardcopies are available, upon request, by contacting Chou Associates. Management Fees Waived: We waived a portion of the management fees for the Chou RRSP Fund. The MER should have been 1.70% but instead it was 1.62%. New Location: Effective Thursday, November 1, 2007, we have moved our corporate office to the following location: 110 Sheppard Avenue East Suite 301, Box 18 Toronto, Ontario M2N 6Y8 Redemption Fee: We have a redemption fee of 2% if unitholders redeem their units in less than 2 years. None of this fee goes to the Fund Manager. It is put back into the Fund for the benefit of the remaining unitholders. We hope this fee is enough to dissuade short term investors from jumping in and out of the Fund to chase possible short term performance. As of March 7, 2008, the NAV of a Series A unit of the Fund was $24.64 and the cash position was 2.1% of net assets. The Fund is down 12.9% from the beginning of the year. Except for the performance numbers of the Chou RRSP Fund, this letter contains estimates and opinions of the Fund Manager and is not intended to be a forecast of future events, a guarantee of future returns or investment advice. Any recommendations contained or implied herein may not be suitable for all investors.
Yours truly,
Francis Chou
Fund Manager
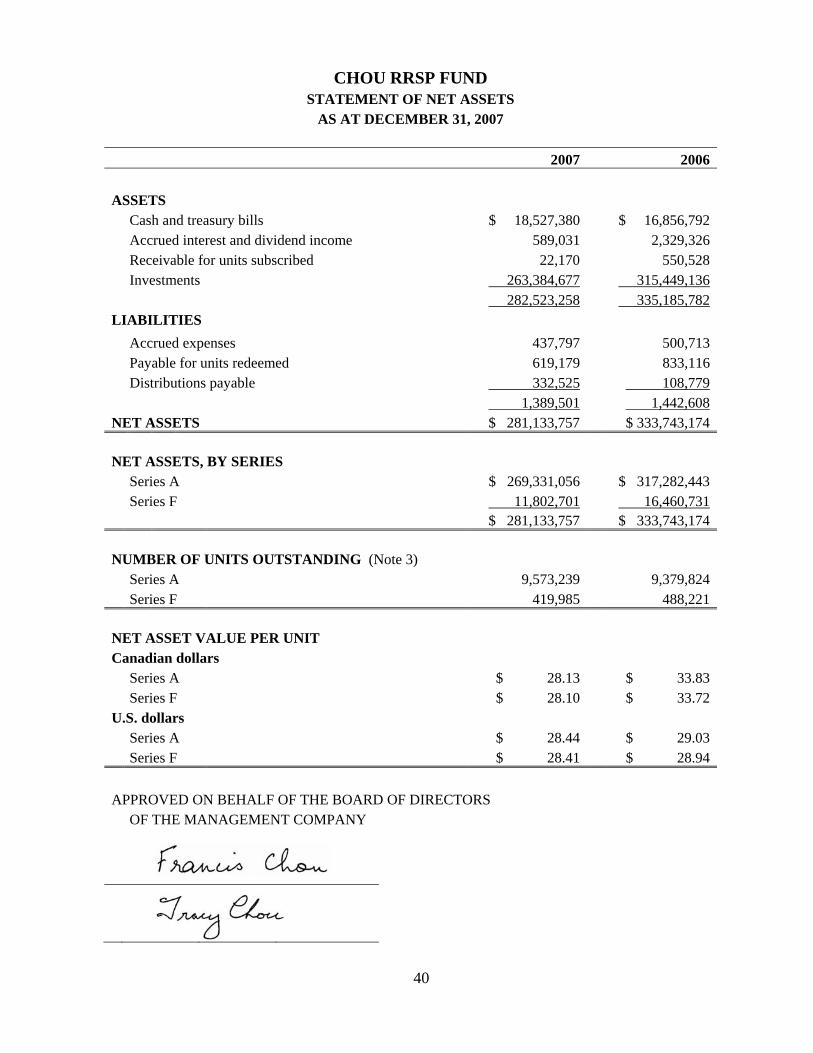
40
CHOU RRSP FUND
STATEMENT OF NET ASSETS AS AT DECEMBER 31, 2007
2007 2006 ASSETS Cash and treasury bills $ 18,527,380 $ 16,856,792 Accrued interest and dividend income 589,031 2,329,326 Receivable for units subscribed 22,170 550,528 Investments 263,384,677 315,449,136 282,523,258 335,185,782 LIABILITIES Accrued expenses 437,797 500,713 Payable for units redeemed 619,179 833,116 Distributions payable 332,525 108,779 1,389,501 1,442,608 NET ASSETS $ 281,133,757 $ 333,743,174 NET ASSETS, BY SERIES Series A $ 269,331,056 $ 317,282,443 Series F 11,802,701 16,460,731 $ 281,133,757 $ 333,743,174 NUMBER OF UNITS OUTSTANDING (Note 3) Series A 9,573,239 9,379,824 Series F 419,985 488,221 NET ASSET VALUE PER UNIT Canadian dollars Series A $ 28.13 $ 33.83 Series F $ 28.10 $ 33.72 U.S. dollars Series A $ 28.44 $ 29.03 Series F $ 28.41 $ 28.94 APPROVED ON BEHALF OF THE BOARD OF DIRECTORS OF THE MANAGEMENT COMPANY
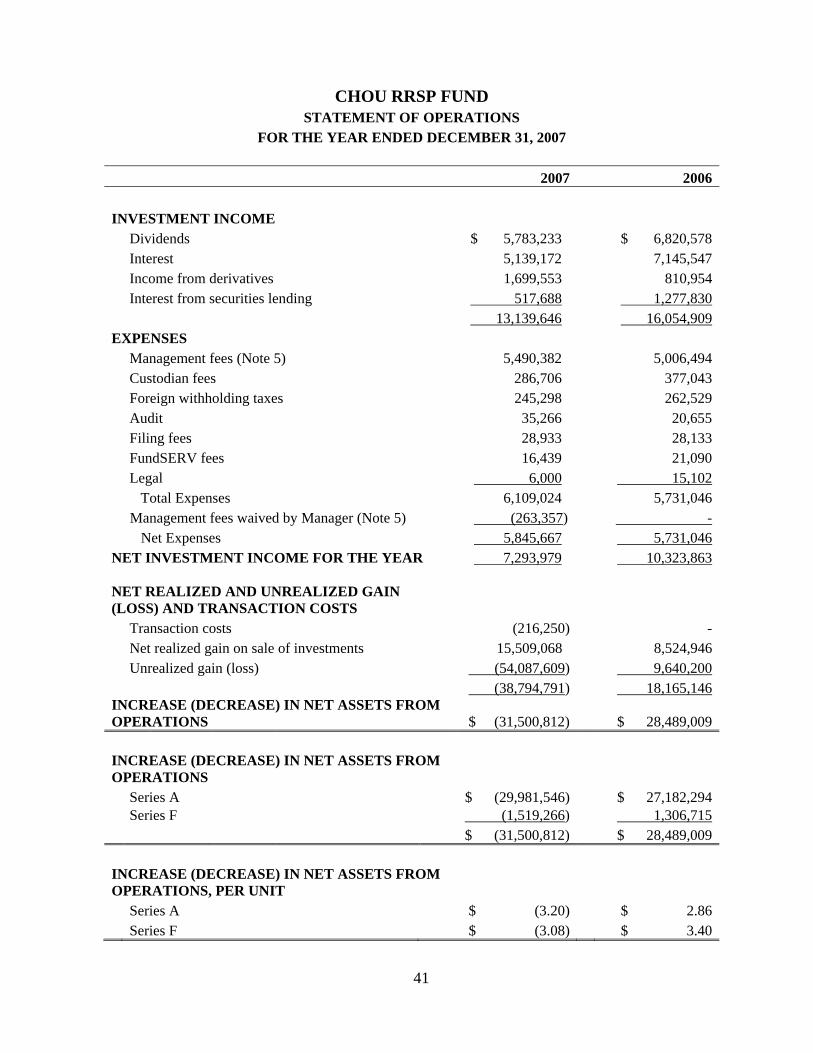
41
CHOU RRSP FUND STATEMENT OF OPERATIONS
FOR THE YEAR ENDED DECEMBER 31, 2007 2007 2006 INVESTMENT INCOME Dividends $ 5,783,233 $ 6,820,578 Interest 5,139,172 7,145,547 Income from derivatives 1,699,553 810,954 Interest from securities lending 517,688 1,277,830 13,139,646 16,054,909 EXPENSES Management fees (Note 5) 5,490,382 5,006,494 Custodian fees 286,706 377,043 Foreign withholding taxes 245,298 262,529 Audit 35,266 20,655 Filing fees 28,933 28,133 FundSERV fees 16,439 21,090 Legal 6,000 15,102 Total Expenses 6,109,024 5,731,046 Management fees waived by Manager (Note 5) (263,357) - Net Expenses 5,845,667 5,731,046 NET INVESTMENT INCOME FOR THE YEAR 7,293,979 10,323,863 NET REALIZED AND UNREALIZED GAIN (LOSS) AND TRANSACTION COSTS Transaction costs (216,250) - Net realized gain on sale of investments 15,509,068 8,524,946 Unrealized gain (loss) (54,087,609) 9,640,200 (38,794,791) 18,165,146 INCREASE (DECREASE) IN NET ASSETS FROM OPERATIONS $ (31,500,812) $ 28,489,009 INCREASE (DECREASE) IN NET ASSETS FROM OPERATIONS Series A $ (29,981,546) $ 27,182,294 Series F (1,519,266) 1,306,715 $ (31,500,812) $ 28,489,009 INCREASE (DECREASE) IN NET ASSETS FROM OPERATIONS, PER UNIT Series A $ (3.20) $ 2.86 Series F $ (3.08) $ 3.40
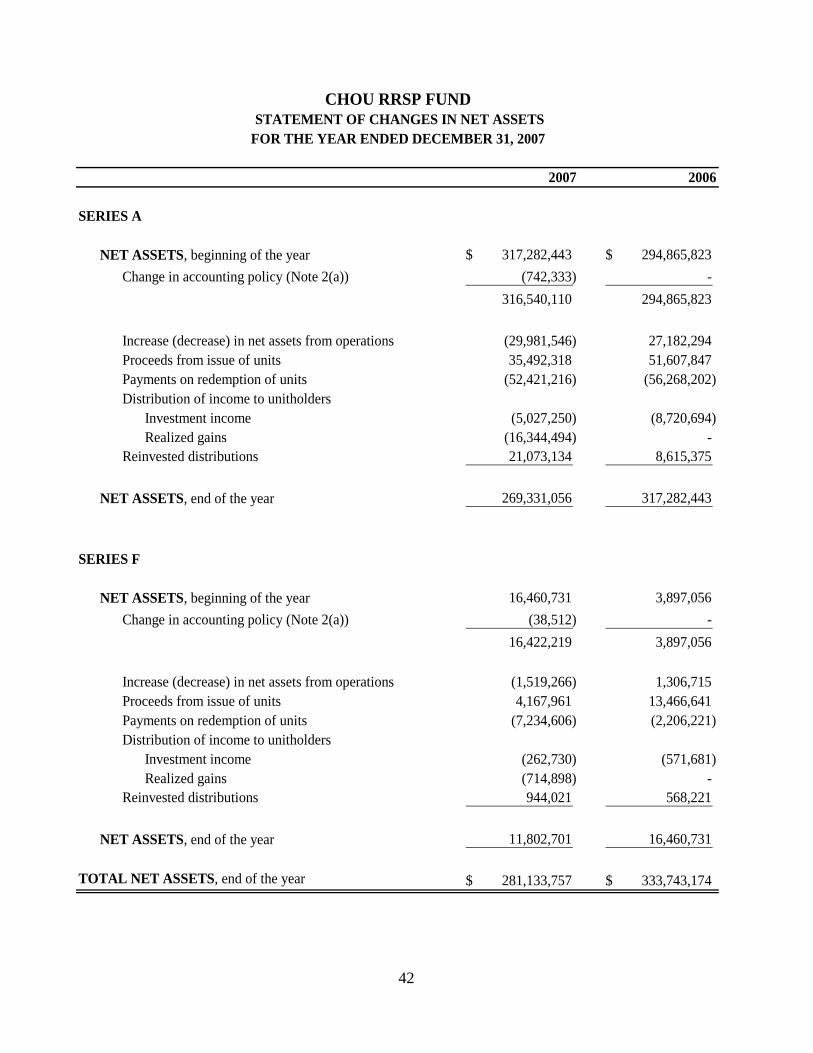
42
2007 2006
SERIES A
NET ASSETS, beginning of the year 317,282,443$ 294,865,823$ Change in accounting policy (Note 2(a)) (742,333) -
316,540,110 294,865,823
Increase (decrease) in net assets from operations (29,981,546) 27,182,294 Proceeds from issue of units 35,492,318 51,607,847 Payments on redemption of units (52,421,216) (56,268,202) Distribution of income to unitholders
Investment income (5,027,250) (8,720,694) Realized gains (16,344,494) -
Reinvested distributions 21,073,134 8,615,375
NET ASSETS, end of the year 269,331,056 317,282,443
SERIES F
NET ASSETS, beginning of the year 16,460,731 3,897,056 Change in accounting policy (Note 2(a)) (38,512) -
16,422,219 3,897,056
Increase (decrease) in net assets from operations (1,519,266) 1,306,715 Proceeds from issue of units 4,167,961 13,466,641 Payments on redemption of units (7,234,606) (2,206,221) Distribution of income to unitholders
Investment income (262,730) (571,681) Realized gains (714,898) -
Reinvested distributions 944,021 568,221
NET ASSETS, end of the year 11,802,701 16,460,731
TOTAL NET ASSETS, end of the year 281,133,757$ 333,743,174$
CHOU RRSP FUND STATEMENT OF CHANGES IN NET ASSETSFOR THE YEAR ENDED DECEMBER 31, 2007
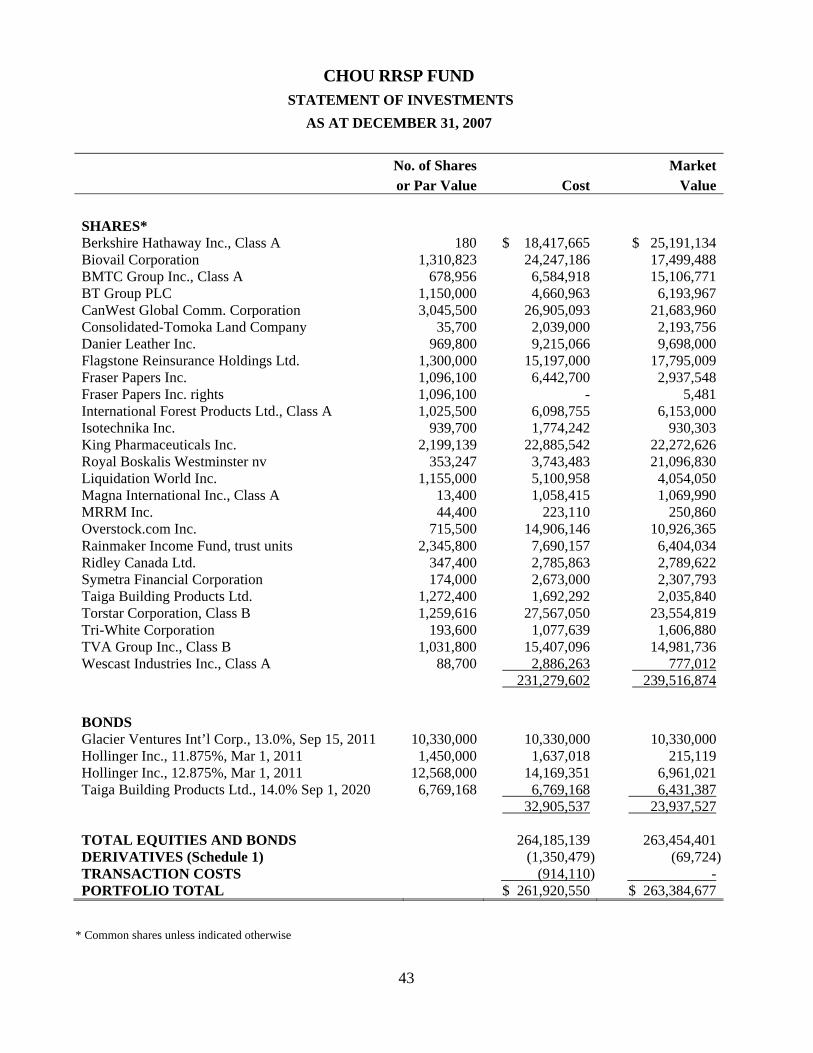
43
CHOU RRSP FUND
STATEMENT OF INVESTMENTS AS AT DECEMBER 31, 2007
No. of Shares Market or Par Value Cost Value SHARES* Berkshire Hathaway Inc., Class A 180 $ 18,417,665 $ 25,191,134 Biovail Corporation 1,310,823 24,247,186 17,499,488 BMTC Group Inc., Class A 678,956 6,584,918 15,106,771 BT Group PLC 1,150,000 4,660,963 6,193,967 CanWest Global Comm. Corporation 3,045,500 26,905,093 21,683,960 Consolidated-Tomoka Land Company 35,700 2,039,000 2,193,756 Danier Leather Inc. 969,800 9,215,066 9,698,000 Flagstone Reinsurance Holdings Ltd. 1,300,000 15,197,000 17,795,009 Fraser Papers Inc. 1,096,100 6,442,700 2,937,548 Fraser Papers Inc. rights 1,096,100 - 5,481 International Forest Products Ltd., Class A 1,025,500 6,098,755 6,153,000 Isotechnika Inc. 939,700 1,774,242 930,303 King Pharmaceuticals Inc. 2,199,139 22,885,542 22,272,626 Royal Boskalis Westminster nv 353,247 3,743,483 21,096,830 Liquidation World Inc. 1,155,000 5,100,958 4,054,050 Magna International Inc., Class A 13,400 1,058,415 1,069,990 MRRM Inc. 44,400 223,110 250,860 Overstock.com Inc. 715,500 14,906,146 10,926,365 Rainmaker Income Fund, trust units 2,345,800 7,690,157 6,404,034 Ridley Canada Ltd. 347,400 2,785,863 2,789,622 Symetra Financial Corporation 174,000 2,673,000 2,307,793 Taiga Building Products Ltd. 1,272,400 1,692,292 2,035,840 Torstar Corporation, Class B 1,259,616 27,567,050 23,554,819 Tri-White Corporation 193,600 1,077,639 1,606,880 TVA Group Inc., Class B 1,031,800 15,407,096 14,981,736 Wescast Industries Inc., Class A 88,700 2,886,263 777,012 231,279,602 239,516,874 BONDS Glacier Ventures Int’l Corp., 13.0%, Sep 15, 2011 10,330,000 10,330,000 10,330,000 Hollinger Inc., 11.875%, Mar 1, 2011 1,450,000 1,637,018 215,119 Hollinger Inc., 12.875%, Mar 1, 2011 12,568,000 14,169,351 6,961,021 Taiga Building Products Ltd., 14.0% Sep 1, 2020 6,769,168 6,769,168 6,431,387 32,905,537 23,937,527 TOTAL EQUITIES AND BONDS 264,185,139 263,454,401 DERIVATIVES (Schedule 1) (1,350,479) (69,724)TRANSACTION COSTS (914,110) - PORTFOLIO TOTAL $ 261,920,550 $ 263,384,677
* Common shares unless indicated otherwise
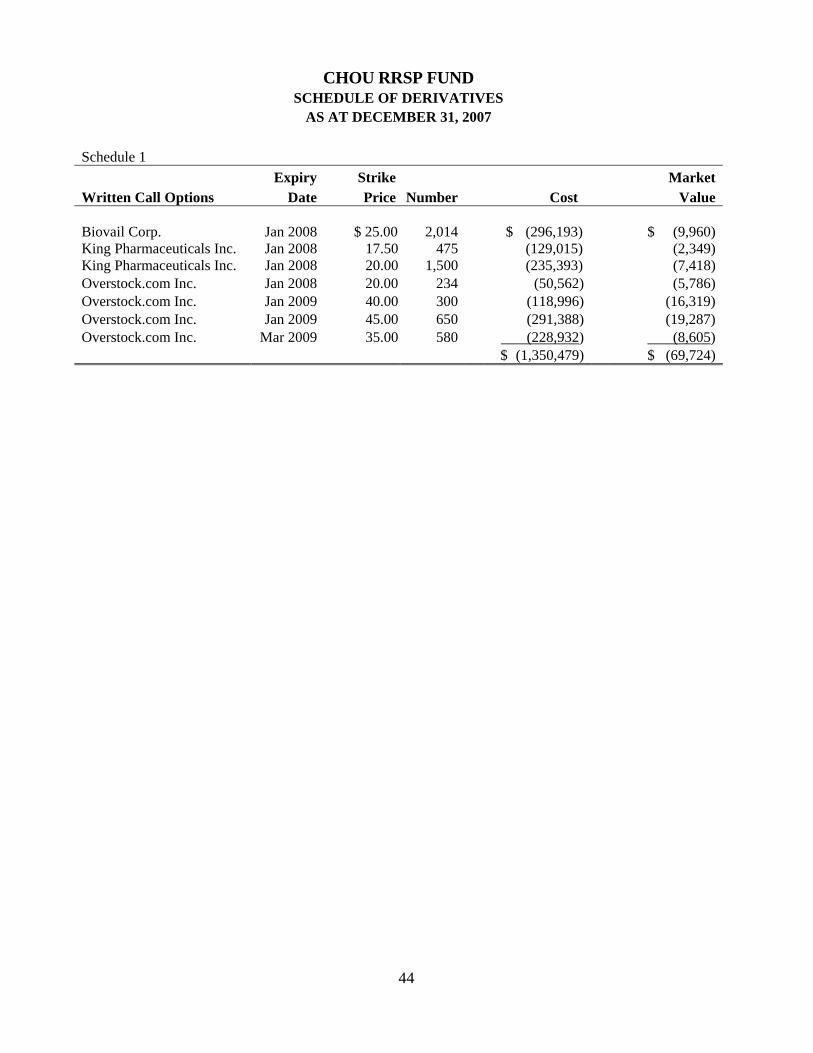
44
CHOU RRSP FUND
SCHEDULE OF DERIVATIVES AS AT DECEMBER 31, 2007
Schedule 1 Expiry Strike MarketWritten Call Options Date Price Number Cost Value Biovail Corp. Jan 2008 $ 25.00 2,014 $ (296,193) $ (9,960) King Pharmaceuticals Inc. Jan 2008 17.50 475 (129,015) (2,349) King Pharmaceuticals Inc. Jan 2008 20.00 1,500 (235,393) (7,418) Overstock.com Inc. Jan 2008 20.00 234 (50,562) (5,786) Overstock.com Inc. Jan 2009 40.00 300 (118,996) (16,319) Overstock.com Inc. Jan 2009 45.00 650 (291,388) (19,287) Overstock.com Inc. Mar 2009 35.00 580 (228,932) (8,605) $ (1,350,479) $ (69,724)
45
CHOU FUNDS
NOTES TO FINANCIAL STATEMENTS
DECEMBER 31, 2007
1. FORMATION OF CHOU FUNDS
The individual funds comprising the family of Chou Funds (the Chou Funds) are open-ended investment mutual fund trusts formed pursuant to Declarations of Trust under the laws of the Province of Ontario. Chou Associates Management Inc. is the Manager and Trustee of the Chou Funds.
The Funds were formed on the following dates:
Chou Associates Fund September 1, 1986 Chou Asia Fund August 26, 2003 Chou Europe Fund August 26, 2003 Chou Bond Fund August 10, 2005 Chou RRSP Fund September 1, 1986
2. SIGNIFICANT ACCOUNTING POLICIES
The financial statements, prepared in accordance with Canadian generally accepted accounting principles (GAAP), include estimates and assumptions by management that could affect the reported amount of assets, liabilities, income and expenses during the reported year. Actual results could differ from those estimated. The following is a summary of significant accounting policies followed by the Funds.
(a) Valuation of Investments
The Canadian Institute of Chartered Accountants (CICA) Handbook Section 3855, Financial Instruments – Recognition and Measurement, which applies to the interim periods and fiscal years beginning on or after October 1, 2006, requires that the fair value of financial instruments, which are actively traded, be measured based on the bid/ask price for the security. Prior to that, fair value for GAAP was based on the last traded price for the day, when available. For financial reporting purposes, starting from January 1, 2007, the Funds adopted the amended valuation policy for actively traded securities held by the Funds on a retroactive basis without restatement of prior periods. Accordingly, the opening net asset value in the Statements of Changes in Net Assets for the year ended December 31, 2007 has been adjusted. National Instrument 81-106 (“NI 81-106”), Investment Fund Continuous Disclosure, requires the daily net asset value of an investment fund to be calculated in accordance with GAAP. Notwithstanding the prescribed implementation date of Section 3855, the Canadian Securities Administrators granted interim relief to investment funds from complying with Section 3855 when calculating the daily net asset value for the purpose of processing unitholder transactions. The relief was granted to permit further
46
CHOU FUNDS
NOTES TO FINANCIAL STATEMENTS
DECEMBER 31, 2007
2. SIGNIFICANT ACCOUNTING POLICIES, continued
(a) Valuation of Investments (continued)
review of the impact of Section 3855 and is effective until the earlier of September 30, 2008 or the date on which proposed amendments to NI 81-106 come into effect. The net asset value calculated in accordance with Section 3855 is referred to as the Fund’s net asset value for financial reporting (“GAAP Net Asset Value”). A reconciliation between the Fund’s GAAP Net Asset Value and the Fund’s net asset value for purposes other than financial reporting (“Transactional Net Asset Value”) is given in Note 6. Section 3855 also requires that transaction costs, such as brokerage commissions, incurred in the purchase and sale of securities by the Fund be charged to net income in the year. Accordingly, these costs are expensed and are included in “Transaction costs” in the Statement of Operations. Until December 31, 2006, the Fund’s policy had been to add these expenses to the cost of the securities purchased or deduct from proceeds of sale. Effective January 1, 2007, the Fund adopted the new accounting policy retroactively, without restatement of prior periods. Securities listed upon a recognized public stock exchange are valued at their bid/ask prices on the valuation date. Securities with no bid/ask prices are valued at their closing sale prices. Securities not listed upon a recognized public stock exchange are valued using valuation techniques, on such basis and in such manner established by the Manager. Short-term investments are recorded at cost, which approximates market value.
(b) Security Transactions, Investment Income, Expenses and Distributions
Security transactions are recorded on the trade date. Realized gains and losses on security transactions are determined on an average cost basis. Interest income and expenses are recorded on an accrual basis. Dividend income and distributions to unitholders are recorded on the ex-dividend date and are gross of withholding taxes.
47
CHOU FUNDS
NOTES TO FINANCIAL STATEMENTS
DECEMBER 31, 2007
2. SIGNIFICANT ACCOUNTING POLICIES, continued
(c) Foreign Currency Translation
Foreign currency amounts have been expressed in Canadian dollars on the financial statements as follows: (i) investments held at the year end are converted at the Bank of Canada rate of
exchange on that date; and (ii) purchases and sales of investments as well as income and expenses throughout
the year are recorded at the Bank of Canada exchange rate prevailing on the respective dates of such transactions.
(iii) The Funds do not separately report the effect of changes in foreign exchange
rates from changes in market prices on securities held. Such changes are included in the unrealized gain in the statement of operations.
(d) Forward Contracts
Forward contracts are agreements to purchase or sell financial instruments at a specified future date. As forward contracts are not traded on the exchange, the agreements between counter parties are not standardized. Changes in value of forward contracts are settled only on termination of the contract. Open forward contracts are revalued to fair value in the statement of net assets, based on the difference between the contract rate and the applicable forward rate to close out the contract. Change in unrealized gains and losses associated with the revaluation of open forward contracts are recorded in the statement of operations as “unrealized gain (loss)”. Forward currency contracts manage exposure to foreign currency gains and losses arising from short and long-term investments denominated in foreign currencies.
(e) Income Taxes
The Chou Funds qualify as mutual fund trusts under the provisions of the Income Tax Act (Canada). General income tax rules apply to the Chou Funds; however, no income tax is payable by the Chou Funds on investment income and/or net realized capital gains which are distributed to unitholders. In addition, income taxes payable on undistributed net realized capital gains are refundable on a formula basis when units of the fund are redeemed. Sufficient net income and realized capital gains of the Chou Funds, have been, or will be distributed to the unitholders such that no tax is payable by the Chou Funds and accordingly no provision for taxes has been made in the financial statements.
48
CHOU FUNDS
NOTES TO FINANCIAL STATEMENTS
DECEMBER 31, 2007
2. SIGNIFICANT ACCOUNTING POLICIES, continued
(e) Income Taxes (continued)
Capital losses for income tax purposes may be carried forward indefinitely and applied against capital gains in future years.
(f) Multi-Series Funds
Where a Fund offers more than one series of units, the realized gains/losses from sale of investments, changes in unrealized gains on investments, income and expenses that are common to the Fund as a whole are allocated daily to each series based on the proportionate share of the net asset value of the series. The proportionate share of each series is determined by adding the current day’s net unitholder subscriptions of the series to the prior day’s net asset value of the series. Any income or expense amounts that are unique to a particular series (for example, management fees) are accounted for separately in that particular series so as to not affect the net asset value of the other series.
(g) Valuation of Fund Units
The net asset value per unit of each series of unit of each Fund is computed by dividing the net asset value of a series of units by the total number of units of the series outstanding at the time. The net asset value per unit is determined at the close of business each Friday.
(h) Securities Lending
The Funds lend portfolio securities from time to time in order to earn additional income. Income from securities lending is included in the Statement of Operations of the Funds and is recognized on an accrual basis.
49
CHOU FUNDS
NOTES TO FINANCIAL STATEMENTS
DECEMBER 31, 2007
3. UNITS OF THE FUND
The units of the Chou Funds are voting, without any par value and an unlimited number may be issued. All units must be fully paid for and fractional units may be issued.
2007 2006 2007 2006CHOU ASSOCIATES FUNDUnits outstanding, beginning of the year 6,700,136 4,376,444 395,408 44,689Add: Units issued during the year 2,190,743 3,346,335 332,118 352,722Deduct: Units redeemed during the year (1,060,748) (1,111,277) (71,630) (9,639)Units outstanding before income distribution 7,830,131 6,611,502 655,896 387,772Add: Units issued on reinvested income 220,927 88,634 21,744 7,636Units outstanding, end of the year 8,051,058 6,700,136 677,640 395,408
CHOU ASIA FUNDUnits outstanding, beginning of the year 2,892,966 2,528,888 136,072 11,057Add: Units issued during the year 1,975,863 680,666 103,452 125,352Deduct: Units redeemed during the year (444,990) (338,191) (123,269) (2,580)Units outstanding before income distribution 4,423,839 2,871,363 116,255 133,829Add: Units issued on reinvested income 360,759 21,603 9,269 2,243Units outstanding, end of the year 4,784,598 2,892,966 125,524 136,072
CHOU EUROPE FUNDUnits outstanding, beginning of the year 1,137,019 980,743 107,261 4,833Add: Units issued during the year 345,926 356,347 54,491 100,381Deduct: Units redeemed during the year (342,732) (226,041) (99,373) (1,490)Units outstanding before income distribution 1,140,213 1,111,049 62,379 103,724Add: Units issued on reinvested income 33,023 25,970 1,483 3,537Units outstanding, end of the year 1,173,236 1,137,019 63,862 107,261
Series A Series F
50
CHOU FUNDS
NOTES TO FINANCIAL STATEMENTS
DECEMBER 31, 2007 3. UNITS OF THE FUND, continued
2007 2006 2007 2006CHOU BOND FUNDUnits outstanding, beginning of the year 2,602,344 283,682 376,179 2,186Add: Units issued during the year 4,778,179 2,366,625 639,652 367,407Deduct: Units redeemed during the year (956,905) (128,487) (124,262) (5,728)Units outstanding before income distribution 6,423,618 2,521,820 891,569 363,865Add: Units issued on reinvested income 236,687 80,524 34,403 12,314Units outstanding, end of the year 6,660,305 2,602,344 925,972 376,179
CHOU RRSP FUNDUnits outstanding, beginning of the year 9,379,824 9,293,546 488,221 122,827Add: Units issued during the year 1,019,475 1,592,697 118,731 417,553Deduct: Units redeemed during the year (1,571,273) (1,761,115) (220,388) (69,012)Units outstanding before income distribution 8,828,026 9,125,128 386,564 471,368Add: Units issued on reinvested income 745,213 254,696 33,421 16,853Units outstanding, end of the year 9,573,239 9,379,824 419,985 488,221
Series A Series F
4. DUE TO RELATED PARTY
Included in accounts payable of each fund are the following amounts, due to Chou Associates Management Inc., for management fees payable:
2007 2006 Chou Associates Fund $ 945,284 $ 886,641 Chou Asia Fund 101,878 62,146 Chou Europe Fund - 17,101 Chou Bond Fund 88,759 4.217 Chou RRSP Fund 385,143 431,985
CHOU FUNDS
NOTES TO FINANCIAL STATEMENTS
DECEMBER 31, 2007 5. MANAGEMENT FEES AND EXPENSES
Chou Associates Management Inc. (“the Manager”) manages the Chou Funds under a management agreement dated August 10, 2005. The Manager is entitled to an annual investment management fee equal to 1.5% of the net asset value of Series A units and 1.0% of the net asset value of Series F units for all Funds other than the Chou Bond Fund on which the Manager is entitled to an annual investment management fee equal to 1.15% of the net asset value of Series A units and 1.0% of the net asset value of Series F units. All other expenses attributable to the Funds are also payable out of the assets of the Funds. The amount of the investment management fee is discretionary and is subject to the limits above. The investment management fee charged to Chou RRSP Fund and Chou Europe Fund by the Manager was less than the maximum amount permitted.
6. RECONCILIATION OF TRANSACTIONAL NAV TO GAAP NAV
Series Transactional NAV
Section 3855
Adjustment
GAAP NAV Transactional NAV
Section 3855
Adjustment
GAAP NAV
Chou Associates A 643,874,111 806,658 643,067,453 79.97 0.10 79.87 Fund F 53,194,024 66,301 53,127,723 79.67 0.09 79.58
Chou Asia A 74,393,855 287,521 74,106,334 15.55 0.06 15.49 Fund F 1,958,234 7,581 1,950,653 15.60 0.06 15.54
Chou Europe A 13,538,856 89,668 13,449,188 11.54 0.08 11.46 Fund F 740,144 4,927 735,217 11.59 0.08 11.51
Chou Bond A 76,295,167 42,848 76,252,319 11.46 0.01 11.45 Fund F 10,609,859 5,952 10,603,907 11.46 0.01 11.45
Chou RRSP A 270,703,660 1,372,604 269,331,056 28.28 0.15 28.13 Fund F 11,862,738 60,037 11,802,701 28.25 0.15 28.10
Net Asset Value ($) Net Asset Value per Unit ($)
51
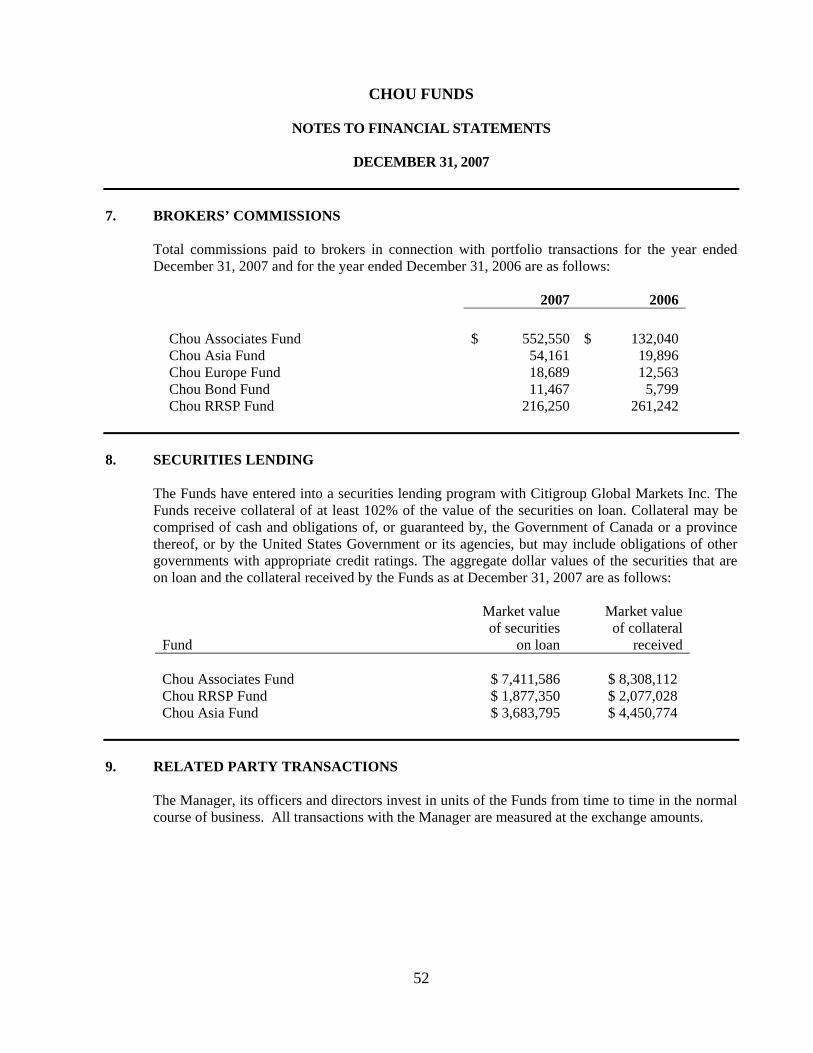
52
CHOU FUNDS
NOTES TO FINANCIAL STATEMENTS
DECEMBER 31, 2007 7. BROKERS’ COMMISSIONS
Total commissions paid to brokers in connection with portfolio transactions for the year ended December 31, 2007 and for the year ended December 31, 2006 are as follows:
2007 2006 Chou Associates Fund $ 552,550 $ 132,040 Chou Asia Fund 54,161 19,896 Chou Europe Fund 18,689 12,563 Chou Bond Fund 11,467 5,799 Chou RRSP Fund 216,250 261,242
8. SECURITIES LENDING
The Funds have entered into a securities lending program with Citigroup Global Markets Inc. The Funds receive collateral of at least 102% of the value of the securities on loan. Collateral may be comprised of cash and obligations of, or guaranteed by, the Government of Canada or a province thereof, or by the United States Government or its agencies, but may include obligations of other governments with appropriate credit ratings. The aggregate dollar values of the securities that are on loan and the collateral received by the Funds as at December 31, 2007 are as follows:
Market value Market value of securities of collateral Fund on loan received Chou Associates Fund $ 7,411,586 $ 8,308,112 Chou RRSP Fund $ 1,877,350 $ 2,077,028 Chou Asia Fund $ 3,683,795 $ 4,450,774
9. RELATED PARTY TRANSACTIONS
The Manager, its officers and directors invest in units of the Funds from time to time in the normal course of business. All transactions with the Manager are measured at the exchange amounts.
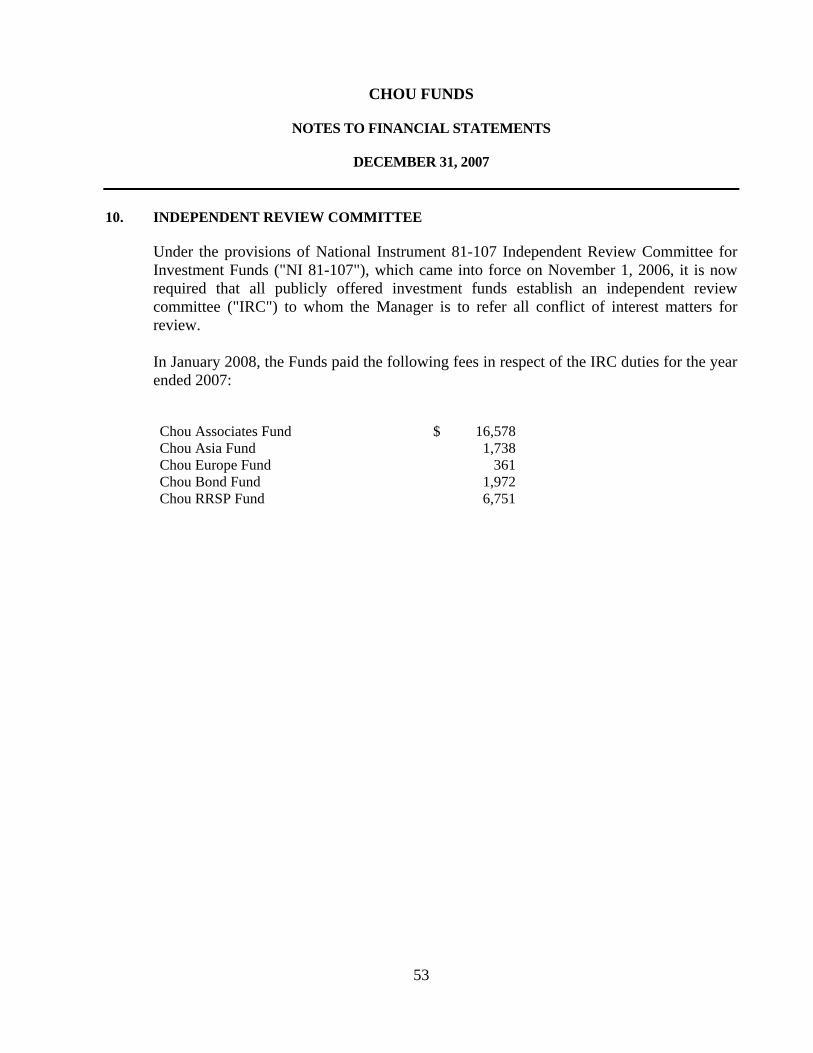
CHOU FUNDS
NOTES TO FINANCIAL STATEMENTS
DECEMBER 31, 2007
10. INDEPENDENT REVIEW COMMITTEE
Under the provisions of National Instrument 81-107 Independent Review Committee for Investment Funds ("NI 81-107"), which came into force on November 1, 2006, it is now required that all publicly offered investment funds establish an independent review committee ("IRC") to whom the Manager is to refer all conflict of interest matters for review. In January 2008, the Funds paid the following fees in respect of the IRC duties for the year ended 2007:
Chou Associates Fund $ 16,578 Chou Asia Fund 1,738 Chou Europe Fund 361 Chou Bond Fund 1,972 Chou RRSP Fund 6,751
53

54
NOTES
(Blank Page)
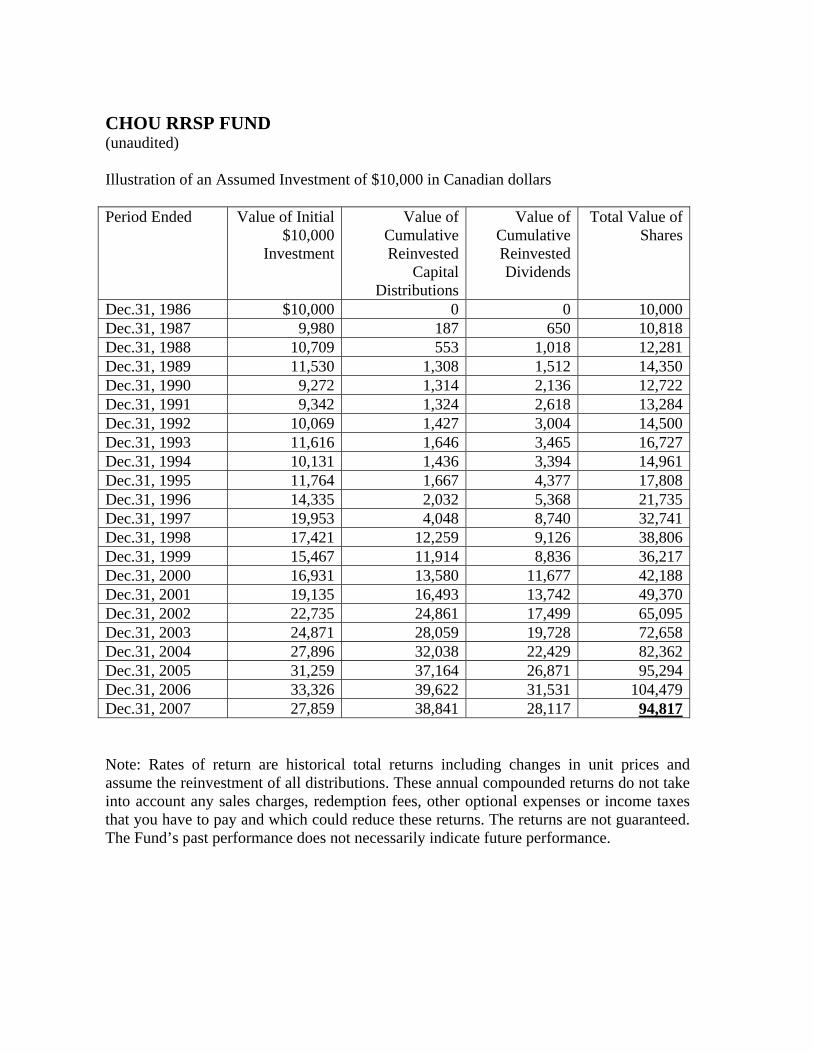
CHOU RRSP FUND (unaudited) Illustration of an Assumed Investment of $10,000 in Canadian dollars Period Ended Value of Initial
$10,000 Investment
Value of Cumulative Reinvested
Capital Distributions
Value of Cumulative Reinvested Dividends
Total Value of Shares
Dec.31, 1986 $10,000 0 0 10,000Dec.31, 1987 9,980 187 650 10,818Dec.31, 1988 10,709 553 1,018 12,281Dec.31, 1989 11,530 1,308 1,512 14,350Dec.31, 1990 9,272 1,314 2,136 12,722Dec.31, 1991 9,342 1,324 2,618 13,284Dec.31, 1992 10,069 1,427 3,004 14,500Dec.31, 1993 11,616 1,646 3,465 16,727Dec.31, 1994 10,131 1,436 3,394 14,961Dec.31, 1995 11,764 1,667 4,377 17,808Dec.31, 1996 14,335 2,032 5,368 21,735Dec.31, 1997 19,953 4,048 8,740 32,741Dec.31, 1998 17,421 12,259 9,126 38,806Dec.31, 1999 15,467 11,914 8,836 36,217Dec.31, 2000 16,931 13,580 11,677 42,188Dec.31, 2001 19,135 16,493 13,742 49,370Dec.31, 2002 22,735 24,861 17,499 65,095Dec.31, 2003 24,871 28,059 19,728 72,658Dec.31, 2004 27,896 32,038 22,429 82,362Dec.31, 2005 31,259 37,164 26,871 95,294Dec.31, 2006 33,326 39,622 31,531 104,479Dec.31, 2007 27,859 38,841 28,117 94,817 Note: Rates of return are historical total returns including changes in unit prices and assume the reinvestment of all distributions. These annual compounded returns do not take into account any sales charges, redemption fees, other optional expenses or income taxes that you have to pay and which could reduce these returns. The returns are not guaranteed. The Fund’s past performance does not necessarily indicate future performance.
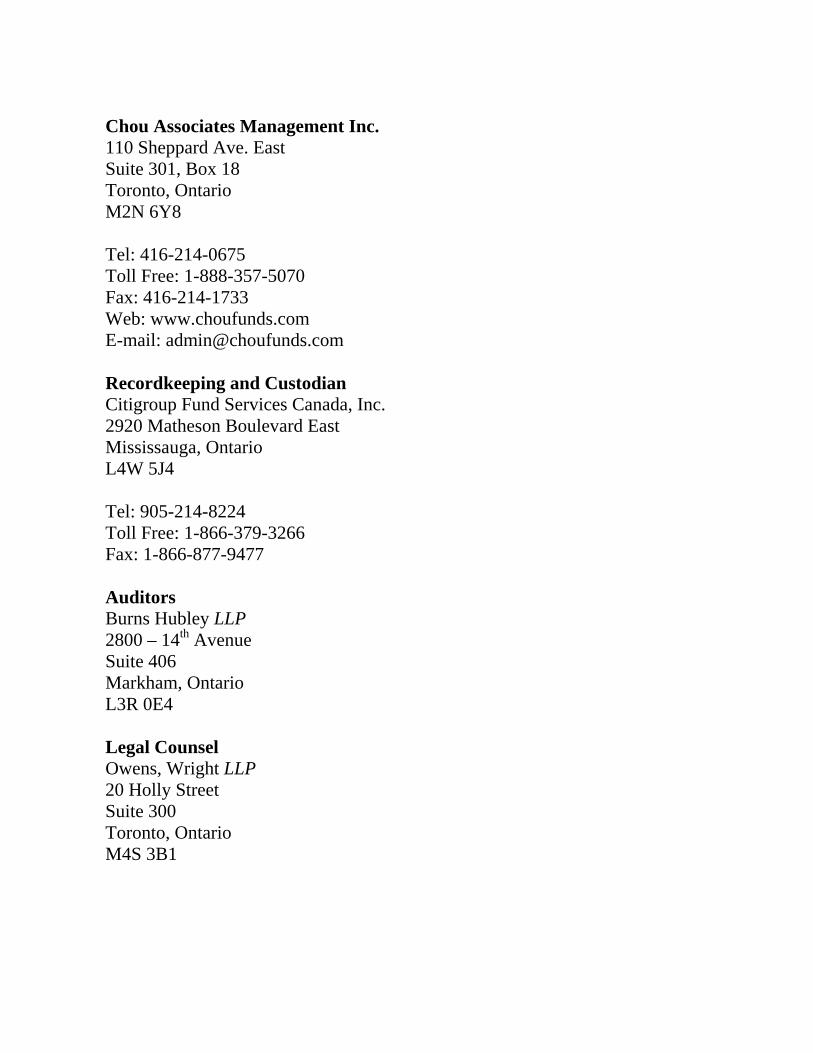
Chou Associates Management Inc. 110 Sheppard Ave. East Suite 301, Box 18 Toronto, Ontario M2N 6Y8 Tel: 416-214-0675 Toll Free: 1-888-357-5070 Fax: 416-214-1733 Web: www.choufunds.com E-mail: [email protected] Recordkeeping and Custodian Citigroup Fund Services Canada, Inc. 2920 Matheson Boulevard East Mississauga, Ontario L4W 5J4 Tel: 905-214-8224 Toll Free: 1-866-379-3266 Fax: 1-866-877-9477 Auditors Burns Hubley LLP 2800 – 14th Avenue Suite 406 Markham, Ontario L3R 0E4 Legal Counsel Owens, Wright LLP 20 Holly Street Suite 300 Toronto, Ontario M4S 3B1