Embed Size (px)
Citation preview
Choosing Stocks with The Motley Fool Lesson 1: The Wonderful World of Stocks Instructor: Selena Maranjian
Lesson Summary
• When evaluating companies as possible investments, it's all about quality and price. • Look for possible gems among companies and industries familiar to you. • Meet Wrigley, the confectionary and gum company that we'll be learning more about. • Market capitalization reflects a company's price tag.
Tell Me Welcome! We're delighted that you've decided to begin learning how to evaluate companies. The better you are at evaluating businesses, the better you're likely to be at picking companies in which to invest.In this seminar, we aim to get you comfortable with assessing how attractive various companies are as possible investments. We'll help you find industries and companies to focus on, and we'll introduce you to financial statements -- those intimidating documents parked at the end of annual reports. We'll also cover a few key numbers you should crunch when evaluating companies.As you probably know, stocks have historically been the best place for most of us to invest our long-term money. Still, not all stocks are created equal. If you're going to begin selecting individual stocks on your own, you'll need to learn to choose carefully. The first thing to do is to stop thinking of them as stocks and to think instead in terms of businesses. Every stock is tied to a company -- an actual enterprise run by some managers, employing many people, and offering customers various products or services. Focus on the business.So, let's jump right in!
Quality and PriceWhen evaluating the promise of a company as an investment, there are two main questions you need to answer:
1. Is this a high-quality company?
2. Is its stock priced attractively?
Most folks agree that it's best to invest in high-quality companies, but people think differently about the second question. To some, as long as you've got a tip-top company, the price isn't that important. They figure that as long as an overvalued company keeps growing, it'll eventually grow into and surpass its price. To others, buying at a good price is vital to reduce risk and maximize gain. To just about all Foolish investors, though, it's paramount to understand a company's business and get a handle on its quality.
Conveniently, most company evaluation measures are related to either quality or price. Quality-related measures convey how efficiently and profitably the company is run, how sturdy its financial condition is, and how quickly it's growing. Price-related measures help you determine whether the stock is overpriced, underpriced, or priced just right.
• Quality-related measures: These include sales and earnings growth, margins and margin growth, return on equity (ROE), inventory turnover, return on assets (ROA), product and service offerings, market share, competitive positioning, proprietary technology or knowledge, brand strength, and management savvy.
• Price-related measures: Measures that address a company's valuation or stock price include market capitalization, enterprise value, price-to-earnings ratio, and price-to-sales ratio. We'll be tackling a bunch (but not all) of these measures in this seminar.
One key thing to understand is that there are several different ways that people use the words "valuation" and "price." You might think that "price" just refers to the price at which a stock is currently trading. It can also refer to a stock's fair price, which might be considerably higher or lower than the current price. Similarly, "valuation" is often used to reflect a company's true intrinsic value. But it might also refer to the market's current valuation of the company -- implied by the current stock price. Understand that there will always be, for every public company, a current stock price/market valuation, and also a fair price/intrinsic valuation -- and that the numbers are often different.
How to Find CompaniesOf course, you first need to have a company to study! There are thousands of publicly traded stocks out there, so it can be a bit confusing as you try to figure out which among them are worthy of a closer look.
One of the best approaches is to think about your life, your job, your home, your town, your interests, your pastimes, and your knowledge. What companies do you see around you in your daily life? What firms do you and your friends talk about or patronize? After all, in order to evaluate a company you'll need to understand its industry; if you've selected from within an industry you already understand, you'll have a head start. Also, once you buy a company, you'll need to keep up with its progress regularly. That can be a pain if it's not a company and industry that naturally interests you.
So if you're a nurse, look at health-related concerns. If you're a shopper, think about retailers you observe at the mall. If you work with computers, consider all the hardware and software and telecommunications companies you may be familiar with. Within industries, look for the leaders -- the big names that many people know. A riskier approach is to look for the newer upstarts and the companies taking market share from the leaders. Start by focusing on leaders, though, while you gain more experience and smarts. Remember that many new, small companies go out of business, while Wal-Mart has grown about 30% per year for 20 years on average. Big isn't necessarily bad.
You can also get some ideas from magazines, newspapers, and online sites.Show Me
Meet WrigleyThe company we've selected to use as a case study in this seminar is Wrigley (NYSE: WWY). We chose it because it's a name familiar to just about everyone, and it has fairly simple financial statements. It's also a solid, long-term performer. Over the past 20 years, its stock has advanced an average of about 22% per year. Topping it all off, it's in a fun industry (confectionaries). Read more about Wrigley basics as well as the history of the Wrigley company and some fun facts. Oh, and we'll be checking out some of the firm's financial statements in upcoming lessons.
We'll also be comparing Wrigley to some of its peers and competitors, just as you should do with any company you're evaluating. So prepare to learn a little more about Tootsie Roll and Hershey, too. (We'll also be checking out a handful of companies in a few other industries, just to get a sense of how they differ.)
Classifying CompaniesTo get you warmed up, let's cover one very basic measure of a company: market capitalization. (Call it "market cap" when you're hanging out with the cool kids.) It's a quick way of placing an approximate price tag on a company. Just multiply the stock price by the number of shares outstanding. ("Shares outstanding" refers to all the publicly traded shares of a company.)
For example, at the time of this writing, Wrigley was trading at around $50 per share. And it has about 225 million shares outstanding. -
Multiply $50 times 225,000,000 and you'll get a market cap of roughly $11 billion. So what does that mean? Well, if another company were to try and acquire Wrigley, it would probably have to fork over $11 billion -- or more, as buyouts generally occur above market prices.
At $11 billion, Wrigley is a "large-cap" company. Here's a rough take on capitalization classifications:
• Large-cap: $5 billion or more • Mid-cap: $1 billion to $5 billion • Small-cap: $250 million to $1 billion • Micro-cap: $250 million or less
We're just about out of room in this lesson, so let us invite you to click over to a separate page where we've parked some information on other kinds of company classifications.
Wrapping UpThat's it for Lesson 1. You've learned that in evaluating companies, you need to focus on quality and price. We addressed how to find companies and how to assess their size via market cap. Our next few lessons will cover how to evaluate quality, and then we'll move into price issues. Up next, we'll explore what to look for in an industry. Oh, and also, we know that a few of you will lose steam during the seminar. At the end of the course, we'll present you with a handy-dandy company evaluation checklist/worksheet that pulls together all the measures we cover in the seminar. So stick around until the end!
Now get out a pencil and a calculator, because it's time for homework! It's pretty important that you try to tackle the homework, as that's where much of the learning takes place. A bunch of insights are offered in the homework solutions, as well. The homework includes links to discussion boards, where we encourage you to work through problems, offer or absorb insights, and ask questions of fellow seminar participants and our seminar Team Leaders.
Team Leaders serve as teaching assistants, facilitating conversation and helping you work through the material and find answers to your questions. If you're new to the boards, you might want to check out this part of the Orientation before you start. We also know that the boards might seem a little overwhelming, especially at first or if you start late or fall behind. Still, we encourage you to give them a shot. Know that you won't be the only one who's new to the material, or feeling a little overwhelmed, or running behind a bit.
For those of you who have taken a seminar with us before, you'll notice that we're trying something a bit different this time. We've decided to offer only one lesson per week, to give you more time to complete the homework, get on the boards, participate in the discussions, and do all that other stuff -- like working, raising a family, and living! Sharing what you've learned will not only help reinforce it, but can also help you stay motivated because you develop a camaraderie with others on the boards. There's power in numbers!
Let Me Do it
Start by picking a team to work with during the seminar. Your team will "meet" on the discussion boards and help you find answers to your questions and the questions you didn't even know you had. You can use the boards in a few ways. Our Team Leaders have created a number of additional exercises to help facilitate your learning and get you questioning. So, you can pop in to participate in the team discussions, to see what people are saying, or just to ask a specific question.
Begin by getting acquainted with our seminar's discussion boards and let your fellow students get acquainted with you. Say hello to some fine fellow Fools. What you tell your team about yourself is entirely up to you. You could include your first name, your state (or country), how you spend your time (personally or professionally), whether or not you have taken a Fool seminar before, your investing experience to date, and anything else you would like to share. It's all up to you. Don't be embarrassed if you're just a beginner -- many folks are beginners. Don't underestimate the value of participating on the boards.
Don't Ignore Linked ResourcesWe will link to a number of different resources throughout the seminar. There are some that you'll find helpful and others you'll find invaluable. For example, I'll show you how I worked through every homework assignment at the end of the lesson.
Let's Start Evaluating CompaniesThe next homework assignments will get you started evaluating companies. This lesson presented one tool for your toolbox -- market capitalization. We'll be pointing you to online and offline resources throughout the seminar to help you learn how to conduct your own research. For starters, consider getting a free trial subscription to Investor's Business Daily and The Wall Street Journal, the two top newspapers for investors. Each is very readable and informative -- give them a try. Over the next bunch of lessons, you'll add more tools. First, though, let's spend a little time thinking about how to find companies to evaluate.
1. Think of industries and companies you're familiar with. Make a list of them. Share your list with classmates on our seminar discussion boards. It should be interesting to see what companies and industries your classmates are familiar with -- you might run into someone with a similar set.
2. Make sure that you understand the market cap concept. Below are several companies. For each, I've included a stock price and the number of shares outstanding. Calculate each one's market cap. (Remember, you'll just have to multiply one by the other.) Note that the numbers are not current -- they're from December. Using them means we can all work from the same numbers and check our answers. The list is a long one, and you might sigh and wipe your brow somewhere in the middle, but persevere. The end result will be a long list of values that the market has recently accorded a broad range of companies. It will be eye opening.
(A) (B) (C) (D)Company Stock Shares Market Cap Price Outstanding(in billions) (in millions)
Wrigley $50 225 $11 Hershey $66 136 _______ Tootsie Roll $39 51 _______ General Electric $40 9,927 _______ Microsoft $69 5,386 _______ Boeing $37 798 _______ AOL Time Warner $34 4,427 _______ Amazon.com $11 372 _______ Yahoo! $18 570 _______ Starbucks $19 381 _______ Home Depot $50 2,337 _______ Wal-Mart $56 4,467 _______ Kmart $5 498 _______ IBM $122 1,723 _______ Apple Computer $21 351 _______ Ford $15 1,811 _______ Coca-Cola $46 2,487 _______
PepsiCo $47 1,750 _______ McDonald's $27 1,285 _______ Pfizer $41 6,287 _______ Johnson & Johnson $57 3,067 _______ Philip Morris $47 2,167 _______
Also, be aware that when you're multiplying column B by column C, your answer will be in millions. If you get 10,848 as your answer, just add a decimal point three spaces from the right and you'll have converted the answer to billions. Voila -- $10,848 million is the same as $10.8 billion! (From there, let's round each number to the nearest billion, making $10.8 billion into $11 billion.)
See if you notice anything interesting in the list above. Hint: Compare companies in the same industry to see which one has the higher market cap. Are you surprised by how much bigger some companies are than others? For this exercise, base your thoughts on the numbers here, not on today's numbers. (We'll include some of our thoughts on the homework solutions page.)
3. Finally, pick a company not on the list above and calculate its market cap. Here are some ways of going about this:
• In AOL, use Keyword: Quotes to enter your company's ticker symbol. The little box of information you get that includes the latest stock price quote will also include the number of shares outstanding. (Note that the box even includes the market cap. Don't cheat and use that -- do the math yourself and then use that figure to check your answer.)
• On the Web, head to http://quote.fool.com (other financial websites also offer stock quotes and data -- feel free to find another alternative). Type in your company's ticker in the "Quotes and Data" section and then click the "Go" button next to the word "Snapshot." You'll get a recent stock price and the number of shares outstanding, as well as the market cap. Calculate the market cap on your own.
If you don't know the company's ticker symbol, you can usually look it up on most quotes and data pages.See the homework answers.
Lesson 2: What Characterizes a High-Quality Industry? Instructor: Selena Maranjian
Lesson Summary
In evaluating an industry, assess growth potential, competitive advantages, and business model economics.
• Take time to figure out a company's or an industry's business model -- how it makes its money.
• We'll briefly review the confectionary industry.
Tell Me Welcome back! In our last lesson, we introduced the two main questions you need to answer when you evaluate a company:1. Is this a high-quality company?2. Is its stock priced attractively?
We also covered some of the many kinds of companies that exist, reviewed how you might find companies and industries to evaluate, and introduced the concept of market capitalization. (Whew!)Today we begin to dig deeper, learning how to think about industries and what makes some more attractive than others.Analyzing IndustriesHere's a checklist of items you might examine as you mull over the attractiveness of an industry:
• Growth potential. Why invest in an industry that's growing very slowly? We like to see companies or industries growing more quickly than the overall economy, which has been growing by about 2% to 4% annually in recent years.
• Competitive advantages. Moats protect both a business and its investors.
• Good business economics. Think about the business model. Is it attractive?
Growth potential is pretty self-explanatory, so let's move on to the next items.
Competitive AdvantagesPermit me to wring a little use out of my business school education by bringing up a book that many MBA students read: Competitive Strategy, by Harvard Business School professor Michael Porter. In it, he lays out several competitive forces that affect an industry:
Threat of entry: Think of this as a moat around a business. This item requires assessing how much money it takes to enter the industry, the economies of scale, switching costs, and brand value. It's easier, for example, for competitors to enter the lawn service industry than the semiconductor equipment industry -- one requires some relatively inexpensive equipment, while the other requires factories and much specialized knowledge.
A company or industry is enjoying economies of scale if it costs less to produce additional units. As an example, eBay spent a lot of money designing and setting up its back-end infrastructure to serve its initial customers. Now, adding millions more customers isn't that costly. A good example of low economies of scale is a law firm. Each new customer or case means more work, requiring more attorney hours. Work completed on one case usually can't be used for many other cases.
To understand the power of switching costs, imagine that you have an online account with AOL (or some other provider), where you've received email for a year. You'll likely think twice about switching to another provider because of the headache it will present, as you'll have to alert too many people of your new email address.
Bargaining power of suppliers: If you're running an airline, there are very few airplane suppliers (such as Boeing and Airbus). It's more difficult in that situation to play one against the other to strike a bargain. If there were many suppliers, they'd likely be competing more for your business, which might result in lower costs for you.
Bargaining power of buyers: Think book retailing, where buyers have many choices and can easily compare prices online. This gives them bargaining power, which is affected by brand power, switching costs, the relative volume of purchases, standardization of the product, and elasticity of demand (where demand increases as prices fall, and vice versa).
Availability of substitutes: This concept relates to how many alternatives customers have available to them. Think of the restaurant industry, where your business will be affected by how easily people can buy take-out meals at supermarkets, how many people prepare meals at home, and the availability of other alternatives.
Competitive rivalry: The more competitive an industry is, the more likely you are to have price wars and reduced profitability. The airline industry is a good example here. Over the years it has not offered the best returns to investors.
Brand value: If a company has a well-known brand, it can be a profitable tool. New products introduced under the brand name will be much easier to market, as people will be dealing with something from a familiar and trusted name.Take these things into consideration and you may be able to zero in on the most attractive company in the industry easily. Alternatively, you might learn that the entire industry just isn't as attractive as you thought. You'll be able to gather the info you need to assess these points by thinking hard about the industry as well as reading articles and perhaps even reading or participating on online discussion boards.
Business EconomicsA key concept to appreciate when evaluating industries and companies is the "business model." A firm's business model, or its business economics, is simply the way it makes its money. Some examples:
• Tupperware's model is to produce products to be distributed through a network of representatives who sell to friends and neighbors, mostly in each other's homes.
• Coca-Cola's model involves using its secret formula to manufacture syrup that it supplies to bottlers. By distributing its beverages through stores, restaurants, vending machines, and more, its drinks are easily available to anyone.
• eBay's business model is to directly connect individual buyers and sellers through a website, and to profit by charging listing fees and taking a percentage of each sale, all without carrying any inventory.
• Amazon.com has a different model, requiring it to keep many products in stock so that they can be quickly shipped out to customers.
Imagine that you want to build a business around your cooking skills. You can set up your business model (i.e., make your money) in many ways. You might open a restaurant, start a cooking school, manufacture foodstuffs to sell to retailers, become a personal chef, or write and sell cookbooks. There are many possible business models.Certain industries have certain business models, while in other industries you'll find a variety of business models, some more attractive than others.Show Me
Our Focus Industry: ConfectionariesLet's apply the short checklist above to Wrigley's industry -- confectionaries:
Growth potential: Well, people won't suddenly chew twice as much gum or eat twice as much candy next year as they did this year. From fiscal 1999 to 2000, Wrigley's sales (also known as "revenues") grew just 4%. That's not too attractive. Earnings (i.e. profits) grew nearly 7%, though, suggesting that the company managed to wring more profit from each dollar, improving its efficiency. In addition, since 1990, the company increased its sales about 93%, nearly doubling them. That amounts to about 7% per year. Again, that's not a great top line, but it's not insurmountable. A company can improve its bottom line in other ways. (Are you curious about Wrigley's sales numbers for 2001? Good -- you should be! The company's annual report wasn't out at the time of this writing, but it should be out by early February -- look for it at Wrigley's website or in the Fool's research and data area.
Competitive advantages:Major candy and gum makers enjoy brand power. Wrigley's brand names include Doublemint, Juicy Fruit, Big Red, Winterfresh, Extra, and Freedent. Tootsie Roll's brands include Charms, Junior Mints, and Andes. Hershey's brands include Jolly Rancher, Reese's, Kisses, Heath Bar, Kit Kat, and more. When Hershey wanted to introduce Reese's baking chips and peanut butter, it was able to do so much more easily than a new entrant into the arena could because of the powerful associations and familiarity people already have with the Reese's name.
Good business economics: The leaders in the confectionary industry run relatively simple businesses. For the most part, they're mainly manufacturing and selling gums and other confections to retailers around the world. The products are not terribly complicated and they don't change all that much, so the companies needn't spend much money from year to year keeping up with new technologies and trends and equipment. Best of all, they enjoy great economies of scale. With factories and equipment already in place, it costs a major confectioner very little to make a stick of gum (or a piece of candy) -- less than a penny. When you think about how much you pay for a pack of gum that has just a few sticks in it (anywhere from a quarter to a dollar), you realize that these firms have attractive business economics.
Learn MoreIf you find yourself yearning to learn more about various industries, check out our Industry Focus 2001 research report -- you can download the electronic version as part of your seminar materials. To dig deeper, check out this list of online resources for researching various industriesAnd of course, continue on to the homework for this lesson. Onward!
Let Me Do It Looking for more? See what the Team Leaders have cooking on your discussion board!
1. Let's warm up with an easy assignment. Read through Wrigley's kids' questions and answers on its website and see if you learn anything interesting or surprising. Report back to your team on the discussion boards. (Don't take this assignment too seriously. It's mostly a fun warm-up exercise. If you have issues with fun, you can skip it and move on to the next assignment.)
2. Begin familiarizing yourself with Wrigley -- what it does and how its management presents the company. To do this, we were going to suggest that you read or at least flip through one of its recent annual reports, which can be found on its website. Normally, you would look at the most recent annual report, but unfortunately for those with slower online connections, the 2000 Annual Report is such a large download (15 MB) that you may not be able to download it. If that's the case, consider spending time exploring Wrigley's website instead. Alternatively, or additionally, you might peruse an earlier annual report. If the 2001 annual report is available and isn't enormous, then that would be the perfect report to read through. If you see any annual reports available in HTML format (meaning you can read its pages on your Web browser, without any painful downloads), try clicking on them -- that should be faster.Once you've explored the company a little, report to your team anything that made an impression on you. (Perhaps you'll be impressed by how management discusses something, or some topic they cover, or perhaps you'll learn about some intriguing development in the Wrigley story.)
3. Choose the company below that interests you most:
• Wal-Mart (NYSE: WMT) • Ford (NYSE: F) • eBay (Nasdaq: EBAY) • McDonald's (NYSE: MCD)
Evaluate it and its industry on the measures we've covered so far: growth potential, competitive advantages, and good business economics. When you're done, share your assessments on the boards.
In the solution, I'll cover McDonald's. If you want to compare your results with mine, you might choose McDonald's, too. Feel free to choose another company, though, as you'll be able to compare your results with those of other classmates.
If you're having fun with this assignment and want to learn more, consider evaluating one or more of the other companies on the above measures, as well. Or evaluate a company or industry you're familiar with that isn't among the four above.
4. Choose one of the 17 industries covered in your copy of Industry Focus 2001 and read about it. See what you learn about the industry. We've provided you with Industry Focus 2001 to to get a sense of how we look at industries. The report itself is two years old (we produce a new one of these each year), but we hope you can use it as a learning tool to glean some insights that carry over and apply to other industries. (Don't worry if any of it is over your head. When you begin learning about evaluating companies and investing, many things will fly over your head. But as you learn, that will happen less and less often. It just takes patience and perseverance -- some of which you're demonstrating just by taking this seminar!) Note that some of the industries, such as Athletic Footwear, are easier to understand than others, such as Optical Networking Equipment. (In the solution, I'll be tackling the Athletic Footwear and Home Furnishings Retailers industries. If you want to compare your thoughts with mine, choose one of these. There's no need to do that, though.) Post your findings on the boards.
See the homework answers.
Lesson 3: What Characterizes a High-Quality Company? Instructor: Brian Graney
Lesson Summary
When evaluating a company, assess its:
1. Business model 2. Past performance 3. Management integrity and honesty 4. Industry leadership and innovation
A review of Wrigley's quality
Tell Me Welcome back!In Lesson 2, Selena outlined some of the elements that make an industry attractive to an investor, using the confectionary industry as an example. Future growth prospects, competitive advantages, and good business economics were highlighted as the main things that should get any individual investor's heart pumping about a particular industry. Find an industry with all three of these elements, and you've likely found a good parking lot for your long-term investing moolah.
We also provided you with a copy of Industry Focus 2001, so you could see how Selena analyzed an industry. We've also provided you with a copy of Industry Focus 2002, so you can run through the exercises with more recent reports.
But just as a parking lot is made up of many spaces, some more desirable than others, the typical industry includes a number of different companies. And the bottom line is that you will be investing in the stocks of specific companies, not specific industries. With that in mind, you want to be able to identify the best companies an attractive industry has to offer. In other words, you want to head for the high-quality parking spots right in front of the mall entrance.
What to Look ForLet's run through a bunch of factors to consider as you assess whether you're looking at a high-quality company or a mediocre one. Note that some will seem familiar, as we used them to assess industries.
Business ModelRemember that a business model is just a sophisticated way of describing how a company makes its money. Understanding how and why a company makes its money can take some time and thought, but it's worth the effort. In fact, a good challenge before buying any stock is to try to sum up the company's business model on paper in about 100 words or to explain it in plain language to a non-investing friend over the course of a short elevator ride. Both exercises are harder than they sound.
Past PerformanceOnce you've identified what sounds like a good business model, it's time to find out if it actually works. This involves looking at the company's past results for indications of historical success. It's a simple way to weed out companies with money-losing business models so you can concentrate on money-making business models instead. Sounds like a good idea to us.In particular, you might look at a company's growth rates for sales and earnings, and you might also assess the trends in profit margins, return on equity, and the like. The company's dividend history is also worth a look. You can get rich investing in companies that don't pay dividends, but companies that pay significant dividends and that regularly increase their dividends can be especially compelling. (This article on the power of dividend growth and this one on the power of reinvesting dividends are really worth reading.)Considering past performance also helps prevent you from focusing on those risky pipe-dream companies whose stock prices are based more on hope than on anything else. These are the so-called "story stocks." That's an appropriate name for a number of reasons. The company's "story," or how it plans to make buckets of money with an unproven, newfangled technology or by building a better mousetrap, usually has plenty of twists and turns, and sometimes changes from month to month. Sadly, the final chapter tends to be the same for all story stocks -- the unfortunate folks who fall for the story and buy the stock get burned in the end.
Management Honesty and IntegrityEvaluating a firm's management can be tricky, so many investors skip this step entirely. That's a mistake. After all, you personally have nothing to do with the company outside of being a potential buyer or seller of its stock. It's the people at the company who will decide which direction it will ultimately go. And that in turn will play a large role in determining the return you receive from the company's stock.
Good long-term stocks have good long-term management. There shouldn't be a revolving door at the company, where the name of the head honcho changes every year. Also, the top managers should do what they say they are going to do. To check up on this, you could dig back into a few years of annual reports to see whether past goals have been met, while keeping tabs on management's progress toward achieving more recent goals. Investing is hard enough as it is. There's no sense in making it harder by investing with people who don't stick to their word or who are not on your side.
Industry Leadership and InnovationWhen all is said and done, it's a pretty good bet that the highest quality company in a particular industry will also turn out to be the industry leader. This makes sense, since the
cream tends to rise to the top over time in business. Microsoft, Wal-Mart, and Nike didn't get where they are today by being lower-quality businesses than their competitors.Still, you don't want to invest in an industry king that's on the verge of being booted off the throne by one of its competitors. Here, innovation plays a large role. Companies that continue to innovate can often maintain their industry leadership positions for many years. To be sure, the level of innovation required depends on the industry in question. Procter & Gamble doesn't need to innovate all that much to stay ahead of its rivals in laundry detergents and diapers. On the other hand, technology companies (like Atari in the 1980s) have lost their industry-leading perch in just a few short years due to a lack of innovation.
Show Me
Our Focus Company: WrigleyLet's see how well Wrigley fits into the high-quality company mold outlined above:
Business model: Wrigley has a business model that has stood the test of time. The company uses its competitive advantages of a well-established brand name, a low-cost production process, and a top-notch global distribution and merchandising system to make more money year after year. Part of the money that is generated by the business is used to develop new, innovative products and enter into new markets. What is left over is returned to shareholders in the form of stock dividend payments and stock repurchases.
Past performance: Wrigley's business model has kept the company in business for more than 100 years and has produced annual gains in revenues and earnings about as far back as the eye can see. In the past 15 years alone, year-end earnings have risen more than seven-fold, from $43.5 million in 1985 to nearly $329 million in 2000. Over that same period, Wrigley's share price has risen 25-fold, including dividends. This is not a short-lived "story stock" by any stretch of the imagination.
Management honesty and integrity: Four generations of Wrigleys have run the company throughout its entire existence, so management turnover has resembled a glacier rather than a revolving door. Management's goals in 1995 were to build additional factories and hire more people to provide the capacity needed to expand internationally, and that's exactly what has happened over the last five years.
Industry leadership and innovation: According to one estimate cited by the company, Wrigley accounts for about 50% of U.S. chewing gum sales, making it the industry leader by far. It is also an innovator in its field. The chairman's letter in the 2000 annual report mentions a number of innovations over the past year, including the launching of its Airwaves "vapor release" gum, the development of the Surpass antacid gum, and company-wide integrated technology initiatives.
In SumOnce you get used to poking under a company's hood enough to evaluate it on the above counts, you'll have developed some good habits that will serve you well as an investor. In our next lesson, we'll start delving deeper into companies, looking at their financial statements.In the meantime, though, we've got some homework for you!
Let Me Do It Pick the company below that interests you the most:
• Wal-Mart (NYSE: WMT) • Ford (NYSE: F) • eBay (Nasdaq: EBAY)
• McDonald's (NYSE: MCD)
Your assignment is to evaluate it on each of the following qualitative measures:
• Business model • Past performance • Management honesty and integrity • Industry leadership and innovation
We invite you to share your findings and discuss them on the team discussion boards. It doesn't matter if you haven't participated yet. Just jump right in -- everyone is welcome! Since we're limiting this exercise to these four companies, you'll likely run across some things that your classmates noticed and that you missed, and vice versa. Also, you can read their findings regarding the other three companies.
To get started, you might want to check out the following resources for the company you selected:
• The company's website: You can find this by doing a keyword search on www.google.com.
• The company's annual report: Look for this on the company's website. It's usually found by clicking on a link titled something like "Investor Relations," "About Us," or "Financial Information."
• Fool.com articles -- Do a search on the name of the company at Fool.com. (Our search function isn't functioning in optimal fashion right now, so another way you can search for Fool articles is to use Google's "advanced search." Once there, type in what you're looking for, and also type "Fool.com" in the "Domain" box. That way you'll search just Fool.com pages for the content you want.
See the homework answers.
Lesson 4: Financial Statement Basics Instructor: Selena Maranjian
Lesson Summary
• It's hard for investors to be successful if they don't know their way around financial statements.
• The big three financial statements are the balance sheet, income statement, and statement of cash flows.
• The balance sheet is a snapshot of a company's financial health at a fixed point in time, covering assets and liabilities.
• The income statement lists how much revenue a company took in over a given period and accounts for all expenses in the same period, reflecting the firm's profit margins.
• The statement of cash flows reports a company's cash inflows and outflows related to its operations, its financing, and its investing activities.
Tell Me You might gather information on a company via newspapers, business magazines, online news services, or its own website. But the best way to learn about a company is often to read its annual report. An annual report tells you what the firm has done over the previous year and offers clues about where it is headed in the future.
The centerpiece of an annual report isn't the words, though -- it's the numbers. Specifically, it's the figures that make up the three different but interconnected accounting jumbles that are included in any company's annual report. These are the balance sheet, the income statement, and the statement of cash flows. Collectively, these are commonly referred to as the firm's
financial statements. If you want to be a savvy evaluator of companies, these statements must become your friends.
I'll refer to Wrigley's financial statements in the following sections, so you might want to click over to the various statements as you read:
• Balance Sheet • Income Statement • Statement of Cash Flows
Show Me
The Balance Sheet: Where it all Begins You can tell a great deal about a company just from looking at its balance sheet. Note that, unlike the other statements, the balance sheet does not cover a period of time. Instead, it reflects a company's condition at one moment in time.The balance sheet is divided into three parts.
1. AssetsAssets are items that can provide a future economic benefit to the firm. In many cases, assets represent what is used to generate revenues, without which profits would not be possible.
Different types of assets are important for different kinds of companies. For a retailer such as Target, property and inventory are the largest assets, since they represent the stores themselves and the products on the shelves that will eventually be sold to customers. For an oil company such as ExxonMobil, oil and gas wells (and the reserves they are tapping) are the largest and most important assets.
2. LiabilitiesLiabilities are claims that different parties have on the assets of a firm. In other words, these are IOUs. The key thing to keep in mind is that the company has already received some kind of benefit, and the creation of a liability represents something that hasn't yet been fully paid for.
For instance, a company may still owe its suppliers for items purchased in the past. These IOUs are known as accounts payable. Likewise, it may owe its own employees for wages that haven't been paid yet. Or it may owe banks or other creditors who provided it with money in the past to buy assets and expand the business. This last type of liability is known as debt.
3. Shareholders' EquityShareholders' equity represents the owners' claims on the assets of the business. In the event of a sale of the company, what is left over after all of the creditors (whose claims are represented by liabilities, as we've seen) are paid off would go to the owners. Who are the owners of a business? The owners are the firm's shareholders, and they can include the company's executives, investors such as pension or mutual funds, and individual investors like you.
Wrigley's Balance SheetGlancing at Wrigley's balance sheet for fiscal 2001, found on its website, you'll see that as of December 31, 2001:
• Wrigley had a pile of cash valued at $308 million, up from $301 million in 2000. • It had $279 million worth of inventories. • It was owed about $240 million in accounts receivable. • Its total assets were $1.8 billion.
• Its total liabilities were fairly small compared to assets -- $332 million in "current" (or short-term) liabilities, plus about $157 million in other liabilities.
• Its shareholder equity totaled $1.3 billion.
The Income Statement: Revenues, Expenses, and Profit A company's income statement reflects sales and profits over a period of time, such as a year or a quarter. It's made up of two basic elements:
1. RevenuesRevenues (often called "sales") represent the recognition of assets that flow to a firm as it sells goods and services to its customers. For a manufacturing company such as Wrigley, this is mostly the money that is received from retailers and food distributors who buy the company's gum in order to resell it to consumers.
2. ExpensesJust as it sounds, a firm's expenses relate to its costs of doing business. Most companies incur costs related to making the products they sell, advertising and marketing, employee salaries, tax bills, and interest payments on any debt. For Wrigley, the main operating expenses are cost of sales, selling and general administrative expenses, "other" expenses, and income taxes.
On just about any company's income statement, you'll see total revenues listed at the top, followed by various expenses that nibble away at revenues as you move down the statement. What's left after all expenses are taken into account during a specific accounting period (such as a quarter or a fiscal year) is profit, otherwise known as net earnings or net income. Earnings are often expressed by how much is attributable to each share of common stock outstanding, resulting in an "earnings per share" (EPS) figure. You'll usually see "Basic" and "Diluted" EPS -- focus on the diluted numbers.
Wrigley's Income StatementGlancing at Wrigley's income statement for the fiscal year 2001, we see that:
• Wrigley sold $2.4 billion worth of gum and other confections in 2001. • It cost the company $997 million to produce what it sold. • The company's bottom line shows "net earnings" (or profit) of $363 million.
The Cash Flow Statement The final player in the financial statement trio is the cash flow statement. This statement tracks all of the money flowing in and out of a company over a specified length of time. It's like the bass player in a jazz trio -- many people ignore it, but it provides the underlying tempo that keeps the whole group running smoothly.
The cash flow statement is interesting to analyze, since it's where the income statement and balance sheet come together. The first part of the cash flow statement is called "operating activities." This section begins with net earnings from the income statement. It then lists non-cash charges and changes in certain balance sheet accounts. At the end of this section, there is a total called something like "cash from operating activities."
Note that cash from operating activities is different from the "net income" reported on the income statement. In many ways, it's a more useful figure, because net income can be more easily manipulated or distorted. As an extreme example, a company might have no sales at all but might sell some of its assets and generate cash that way. In that case, cash from operating activities would be zero, very different from net income. The cash flow statement lets us see just how productive the company's core operations are.
The second and third sections of the cash flow statement are "investing activities" and "financing activities." In Wrigley's case, these sections basically show what the company has been doing with its cash from operating activities. Wrigley typically uses its operating cash to
build new plants and buy equipment (investing activities) and to pay dividends to its shareholders and repurchase its shares in the stock market (both of which are considered financing activities).
Any cash left over at the end of the day is added to the firm's cash account, which is an asset and is recorded on the balance sheet. Again, this is another way that the cash flow statement is interconnected with the other two financial statements.
Wrigley's Statement of Cash FlowsGlancing at Wrigley's statement of cash flows for the fiscal year 2001, we see that:
• It generated less cash from its core operations in 2001 ($390 million) than it did in 2000 ($448 million).
• It spent more cash than it generated on property, plant, and equipment and short-term investments, with a net cash loss of $177 million.
• It used $202 million in financing activities, by paying out dividends and buying back some stock.
• Overall, its cash position increased by $7 million from 2000 to 2001. • Its cash total is $308 million. (Remember that number from the balance sheet? See
how these statements interrelate?)
Some Closing ThoughtsWell, that's enough accounting-speak for one day. Many folks find financial accounting pretty dense, considering all of the numbers and rules involved. In truth, it is pretty dense and can be confusing for a person looking at financial statements for the first (or fourth) time. But just as with anything else, the more you look at different companies' financial statements, the more financial accounting will make sense to you.One confusing thing you'll run across is the fact that different companies label the same things with different names. We've prepared a list of common alternative names for you.You don't need an MBA to understand this stuff, just a willingness to learn. Being versed in accounting is important to successful investing. To stress just how important, here is one of the only general investing admonitions we intend to make during this seminar:
If you don't have a decent understanding of a firm's financial statements, don't buy its stock. And if you don't have a decent understanding of financial accounting in general, don't buy ANY stock.
This seminar is designed to help you, the individual investor, clear these hurdles. In the next lesson, we will be looking at some of the key financial statement elements that you can use to determine the quality of a company, using numbers from Wrigley and its confectionary industry counterparts as examples.
Now, on to the fun stuff!
Let Me Do It
1. Let's do some digging. Your first assignment is to find the Hershey and Tootsie Roll annual reports on each company's website. Within each annual report, locate the financial statements. (They're usually in the back. They tend to follow a bunch of glossy self-congratulatory pages and precede some cryptic-looking footnotes.)
2. Make sure you know where to find a company's data. Not all companies put their financial statements on their website, so let's make sure that you can find a company's data some other way. Below are two (of many) places where you can look up a company's filings with the Securities and Exchange Commission (SEC).
• The Motley Fool Quotes & Data • FreeEdgar.com
If you use freeEdgar, you will get a pop-up window when you reach the site. Close that window and type in the ticker symbol or company name in the first blank spot on the search bar at the top of the page. Make sure that the drop down menu to the right matches your entry (ticker symbol or company name). Click on the second drop down menu and click on "FreeEDGAR" and hit the "Search button". On the next page, click on the link "View Filings" to see the listing of the company's filings.
In this case, you'll be looking up not the "annual report" but instead the "10-K" report. Companies file 10-K reports once a year with the SEC at annual report time. The 10-K is a long, colorless document that looks kind of intimidating (and boring), but it is chock full of valuable information, such as management's discussion of performance and risks. It also contains the three financial statements we're looking for. They're the same statements whether you look them up in an annual report or in the 10-K that's issued at the same time.
Pick one company you're interested in and see if you can dig up its most recent 10-K using one of the above sites. (In the solution, we'll use http://quote.fool.com to find Wal-Mart's 10-K.)
Note that companies' fiscal years don't all end at the same time, so one company's latest 10-K might have been filed just last month, while another company's latest 10-K might have been filed 11 months ago, with the new one around the corner. (As we go to press, Wrigley's 10-K for 2001 is around the corner.) If the latest 10-K of the company you're interested in is kind of stale, check out its most recent "10-Q" report. That's a smaller, simpler report, filed quarterly three times a year (in the fourth quarter, the 10-K is issued instead of the 10-Q). It should have the financial statements you're looking for.
3. Let's begin to make use of the financial statements.Let's use Wrigley as our example for this exercise.Here are Wrigley's financial statements. We're using versions from Fool.com because they're easy to access, but know that these statements also appear in Wrigley's annual report, feel free to refer to it instead.
• Balance Sheet • Income Statement • Statement of Cash Flows
Below are a few items that we're asking you to eyeball. Note that if you're ever looking at this kind of information in an annual report, most reports feature a table of "financial highlights" or "selected financial data" where they break out some key numbers and show them over many years. That can be very useful and informative. Look to see how sales (also called "revenues") have grown over the past few years.
• Look to see how net income (also called "net earnings") has grown over the past few years.
• Do the same for "cash from operations" (which Wrigley calls "net cash provided by operating activities"). You'll find this item on the statement of cash flows.
• Do the same for inventory (called "inventories"), listed on the balance sheet. • Do the same for accounts receivable, also on the balance sheet. • Do the same for debt, also on the balance sheet. (You'll probably need to scroll to the
right to see the half of the balance sheet that lists liabilities such as debt.) Note that some companies don't carry any debt.
Extra Credit Assignment Calculating Growth Rates:We don't want to wear you out on Lesson 4, as there are still many valuable lessons to come. But if you still have some energy left, there's a very basic thing that you'll want to master with regard to financial statements: calculating growth rates. On a separate page we've parked a
mini-lesson on how to calculate growth rates. If it's of interest to you, click on over to the extra credit assignment. If you still want more, test your theories and your findings by joining your Team Leaders on the boards.
Here's a little lesson on calculating growth rates. If you find yourself frustrated along the way, ask for help on the seminar discussion boards. You could even put off mastering this until a little later. It's worth trying to learn now, though. And it's actually not that hard! (At least once you practice it a little.)
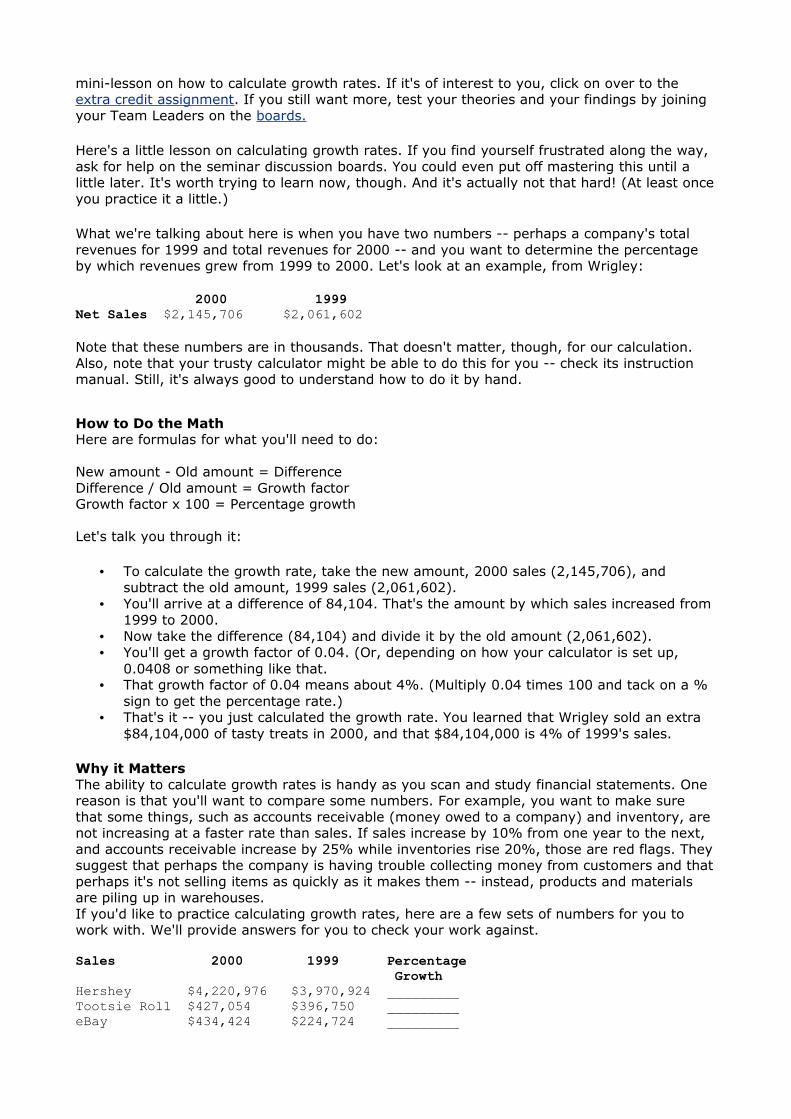
What we're talking about here is when you have two numbers -- perhaps a company's total revenues for 1999 and total revenues for 2000 -- and you want to determine the percentage by which revenues grew from 1999 to 2000. Let's look at an example, from Wrigley:
2000 1999 Net Sales $2,145,706 $2,061,602
Note that these numbers are in thousands. That doesn't matter, though, for our calculation. Also, note that your trusty calculator might be able to do this for you -- check its instruction manual. Still, it's always good to understand how to do it by hand.
How to Do the MathHere are formulas for what you'll need to do:
New amount - Old amount = DifferenceDifference / Old amount = Growth factorGrowth factor x 100 = Percentage growth
Let's talk you through it:
• To calculate the growth rate, take the new amount, 2000 sales (2,145,706), and subtract the old amount, 1999 sales (2,061,602).
• You'll arrive at a difference of 84,104. That's the amount by which sales increased from 1999 to 2000.
• Now take the difference (84,104) and divide it by the old amount (2,061,602). • You'll get a growth factor of 0.04. (Or, depending on how your calculator is set up,
0.0408 or something like that. • That growth factor of 0.04 means about 4%. (Multiply 0.04 times 100 and tack on a %
sign to get the percentage rate.) • That's it -- you just calculated the growth rate. You learned that Wrigley sold an extra
$84,104,000 of tasty treats in 2000, and that $84,104,000 is 4% of 1999's sales.
Why it MattersThe ability to calculate growth rates is handy as you scan and study financial statements. One reason is that you'll want to compare some numbers. For example, you want to make sure that some things, such as accounts receivable (money owed to a company) and inventory, are not increasing at a faster rate than sales. If sales increase by 10% from one year to the next, and accounts receivable increase by 25% while inventories rise 20%, those are red flags. They suggest that perhaps the company is having trouble collecting money from customers and that perhaps it's not selling items as quickly as it makes them -- instead, products and materials are piling up in warehouses.If you'd like to practice calculating growth rates, here are a few sets of numbers for you to work with. We'll provide answers for you to check your work against.
Sales 2000 1999 Percentage GrowthHershey $4,220,976 $3,970,924 _________Tootsie Roll $427,054 $396,750 _________eBay $434,424 $224,724 _________
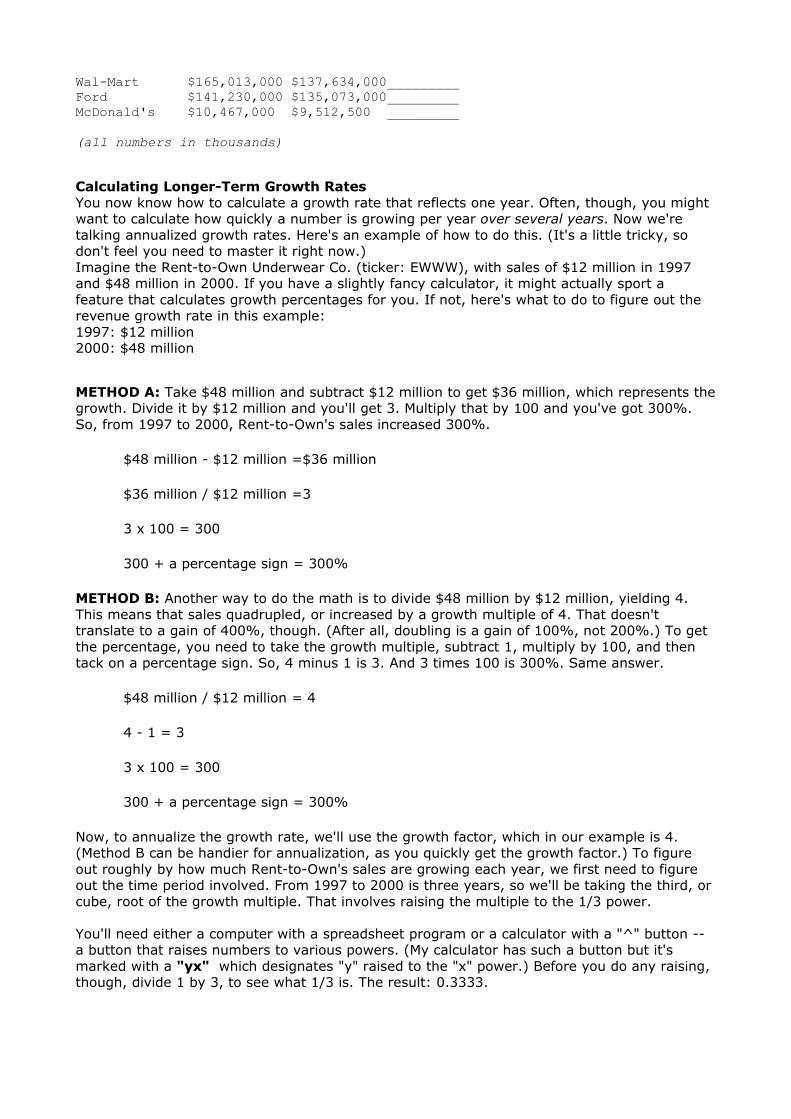
Wal-Mart $165,013,000 $137,634,000_________Ford $141,230,000 $135,073,000_________McDonald's $10,467,000 $9,512,500 _________
(all numbers in thousands)
Calculating Longer-Term Growth RatesYou now know how to calculate a growth rate that reflects one year. Often, though, you might want to calculate how quickly a number is growing per year over several years. Now we're talking annualized growth rates. Here's an example of how to do this. (It's a little tricky, so don't feel you need to master it right now.)Imagine the Rent-to-Own Underwear Co. (ticker: EWWW), with sales of $12 million in 1997 and $48 million in 2000. If you have a slightly fancy calculator, it might actually sport a feature that calculates growth percentages for you. If not, here's what to do to figure out the revenue growth rate in this example:1997: $12 million2000: $48 million
METHOD A: Take $48 million and subtract $12 million to get $36 million, which represents the growth. Divide it by $12 million and you'll get 3. Multiply that by 100 and you've got 300%. So, from 1997 to 2000, Rent-to-Own's sales increased 300%.
$48 million - $12 million =$36 million
$36 million / $12 million =3
3 x 100 = 300
300 + a percentage sign = 300%
METHOD B: Another way to do the math is to divide $48 million by $12 million, yielding 4. This means that sales quadrupled, or increased by a growth multiple of 4. That doesn't translate to a gain of 400%, though. (After all, doubling is a gain of 100%, not 200%.) To get the percentage, you need to take the growth multiple, subtract 1, multiply by 100, and then tack on a percentage sign. So, 4 minus 1 is 3. And 3 times 100 is 300%. Same answer.
$48 million / $12 million = 4
4 - 1 = 3
3 x 100 = 300
300 + a percentage sign = 300%
Now, to annualize the growth rate, we'll use the growth factor, which in our example is 4. (Method B can be handier for annualization, as you quickly get the growth factor.) To figure out roughly by how much Rent-to-Own's sales are growing each year, we first need to figure out the time period involved. From 1997 to 2000 is three years, so we'll be taking the third, or cube, root of the growth multiple. That involves raising the multiple to the 1/3 power.
You'll need either a computer with a spreadsheet program or a calculator with a "^" button -- a button that raises numbers to various powers. (My calculator has such a button but it's marked with a "yx" which designates "y" raised to the "x" power.) Before you do any raising, though, divide 1 by 3, to see what 1/3 is. The result: 0.3333.
Now, raise the growth multiple of 4 to the 1/3 power (on a calculator with a "^" button, you'll hit 4, then "^", then 0.3333, and then "enter" or "=". You should get 1.59. Now subtract 1, multiply by 100, and you've got 59% as the approximate average annual growth rate. Voila!
If the time period we were dealing with were five years, you'd raise the multiple to the 1/5 power, taking the fifth root. One divided by five is 0.20, so you'd be raising 4 to the 0.20 power, yielding 1.32 and meaning that the average annual growth over five years was 32%.
For 8.4 years, you'd be taking the growth factor to the 1/8.4 power. Two-year periods are easy -- you just take the square root, and most calculators these days have a square root button you simply push.
This is tricky stuff until you get used to it. Practice it a little and you'll be happy you did. Don't feel bad if you can't get the hang of it too quickly. It doesn't always come easily to everyone. Ask for help, too, if you need it.
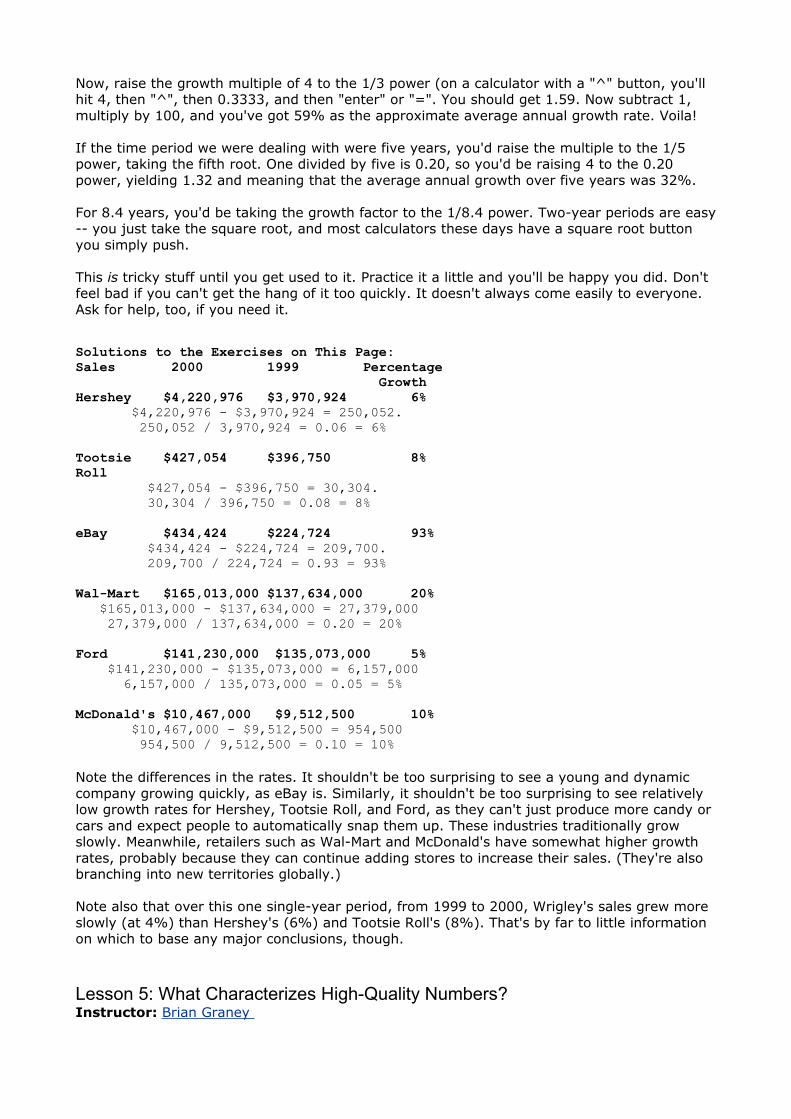
Solutions to the Exercises on This Page:Sales 2000 1999 Percentage GrowthHershey $4,220,976 $3,970,924 6% $4,220,976 - $3,970,924 = 250,052. 250,052 / 3,970,924 = 0.06 = 6%
Tootsie $427,054 $396,750 8% Roll $427,054 - $396,750 = 30,304. 30,304 / 396,750 = 0.08 = 8%
eBay $434,424 $224,724 93% $434,424 - $224,724 = 209,700. 209,700 / 224,724 = 0.93 = 93%
Wal-Mart $165,013,000 $137,634,000 20% $165,013,000 - $137,634,000 = 27,379,000 27,379,000 / 137,634,000 = 0.20 = 20%
Ford $141,230,000 $135,073,000 5% $141,230,000 - $135,073,000 = 6,157,000 6,157,000 / 135,073,000 = 0.05 = 5%
McDonald's $10,467,000 $9,512,500 10% $10,467,000 - $9,512,500 = 954,500 954,500 / 9,512,500 = 0.10 = 10%
Note the differences in the rates. It shouldn't be too surprising to see a young and dynamic company growing quickly, as eBay is. Similarly, it shouldn't be too surprising to see relatively low growth rates for Hershey, Tootsie Roll, and Ford, as they can't just produce more candy or cars and expect people to automatically snap them up. These industries traditionally grow slowly. Meanwhile, retailers such as Wal-Mart and McDonald's have somewhat higher growth rates, probably because they can continue adding stores to increase their sales. (They're also branching into new territories globally.)
Note also that over this one single-year period, from 1999 to 2000, Wrigley's sales grew more slowly (at 4%) than Hershey's (6%) and Tootsie Roll's (8%). That's by far to little information on which to base any major conclusions, though.
Lesson 5: What Characterizes High-Quality Numbers? Instructor: Brian Graney
Lesson Summary
• A little number-crunching can reveal a lot about a company's strengths and attractiveness. We'll cover return on equity, net profit margin, asset turns, and return on assets.
• A company's return on equity will show you how much money a company generates relative to the money put into it.
• Net profit margin reflects how much of each dollar of sales a company records as profit.
• The asset turns figure tells us how efficiently a company is using its assets.
• Return on assets reflects how much money a company is making off of each dollar of its assets.
Tell Me
In Lesson 4, we introduced the three major financial statements. Now let's dig deeper and make use of them, and learn how to crunch some of the numbers they contain.Show Me
Evaluating a Business's Returns: Return on Equity Over the years, investors have devised many ways of interpreting financial statement data. One of the most useful calculations is return on equity (referred to by those in the know as "ROE").
An important determinant of a business's financial health, its ability to grow in the future, and its overall monetary "worth" to an investor is the returns the business generates. A business's returns refers to how much money it produces relative to how much money is put into it. That relationship is typically expressed as a percentage of some sort.
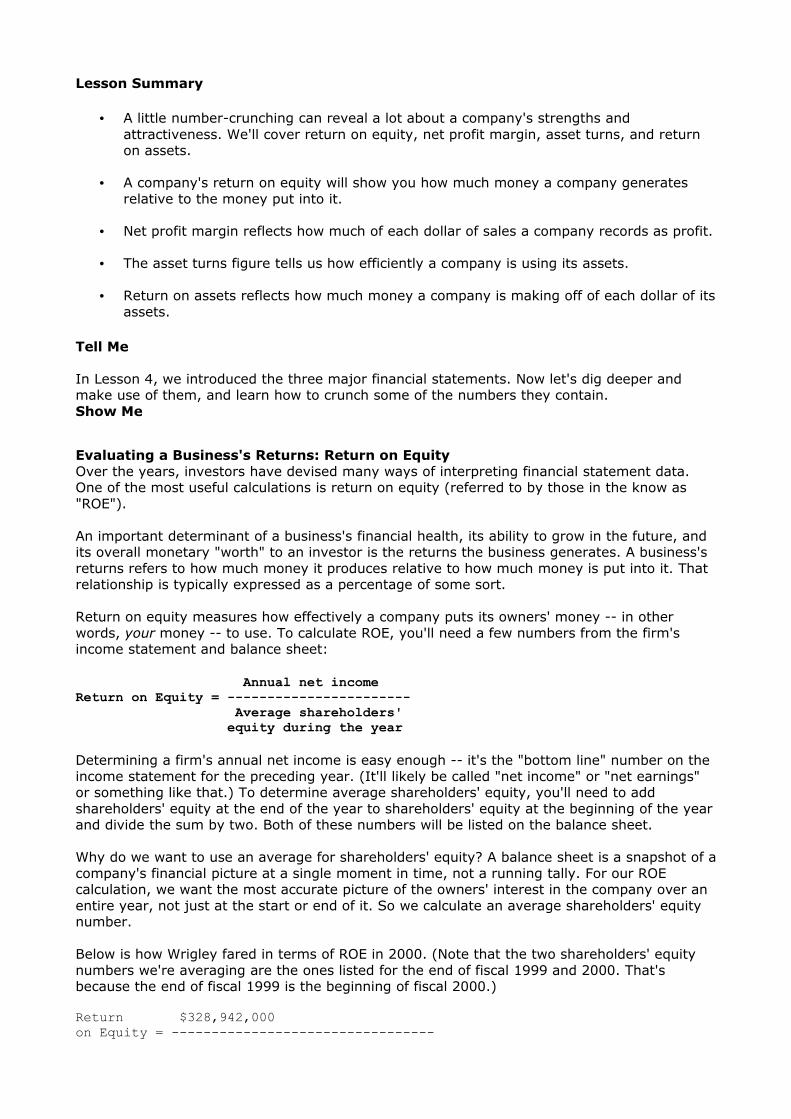
Return on equity measures how effectively a company puts its owners' money -- in other words, your money -- to use. To calculate ROE, you'll need a few numbers from the firm's income statement and balance sheet:
Annual net income Return on Equity = ----------------------- Average shareholders' equity during the year
Determining a firm's annual net income is easy enough -- it's the "bottom line" number on the income statement for the preceding year. (It'll likely be called "net income" or "net earnings" or something like that.) To determine average shareholders' equity, you'll need to add shareholders' equity at the end of the year to shareholders' equity at the beginning of the year and divide the sum by two. Both of these numbers will be listed on the balance sheet.
Why do we want to use an average for shareholders' equity? A balance sheet is a snapshot of a company's financial picture at a single moment in time, not a running tally. For our ROE calculation, we want the most accurate picture of the owners' interest in the company over an entire year, not just at the start or end of it. So we calculate an average shareholders' equity number.
Below is how Wrigley fared in terms of ROE in 2000. (Note that the two shareholders' equity numbers we're averaging are the ones listed for the end of fiscal 1999 and 2000. That's because the end of fiscal 1999 is the beginning of fiscal 2000.)
Return $328,942,000 on Equity = ---------------------------------
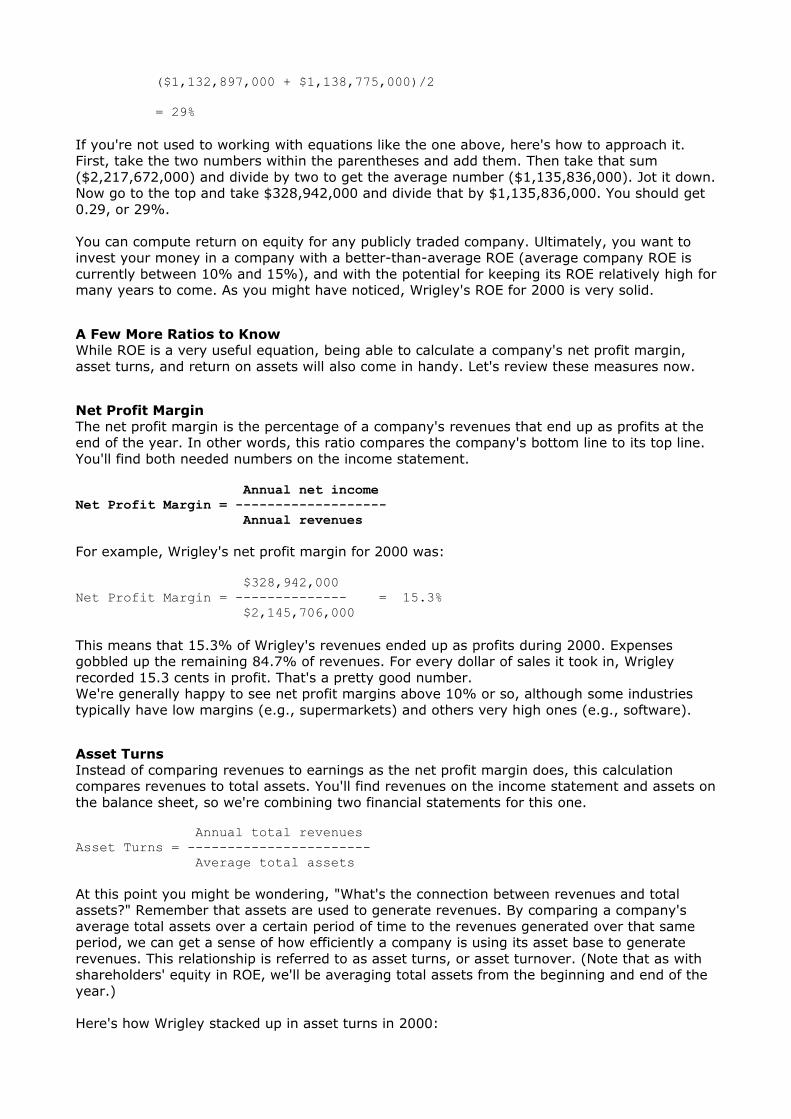
($1,132,897,000 + $1,138,775,000)/2
= 29%
If you're not used to working with equations like the one above, here's how to approach it. First, take the two numbers within the parentheses and add them. Then take that sum ($2,217,672,000) and divide by two to get the average number ($1,135,836,000). Jot it down. Now go to the top and take $328,942,000 and divide that by $1,135,836,000. You should get 0.29, or 29%.
You can compute return on equity for any publicly traded company. Ultimately, you want to invest your money in a company with a better-than-average ROE (average company ROE is currently between 10% and 15%), and with the potential for keeping its ROE relatively high for many years to come. As you might have noticed, Wrigley's ROE for 2000 is very solid.
A Few More Ratios to Know While ROE is a very useful equation, being able to calculate a company's net profit margin, asset turns, and return on assets will also come in handy. Let's review these measures now.
Net Profit MarginThe net profit margin is the percentage of a company's revenues that end up as profits at the end of the year. In other words, this ratio compares the company's bottom line to its top line. You'll find both needed numbers on the income statement.
Annual net incomeNet Profit Margin = ------------------- Annual revenues
For example, Wrigley's net profit margin for 2000 was:
$328,942,000Net Profit Margin = -------------- = 15.3% $2,145,706,000
This means that 15.3% of Wrigley's revenues ended up as profits during 2000. Expenses gobbled up the remaining 84.7% of revenues. For every dollar of sales it took in, Wrigley recorded 15.3 cents in profit. That's a pretty good number.We're generally happy to see net profit margins above 10% or so, although some industries typically have low margins (e.g., supermarkets) and others very high ones (e.g., software).
Asset Turns Instead of comparing revenues to earnings as the net profit margin does, this calculation compares revenues to total assets. You'll find revenues on the income statement and assets on the balance sheet, so we're combining two financial statements for this one.
Annual total revenuesAsset Turns = ----------------------- Average total assets
At this point you might be wondering, "What's the connection between revenues and total assets?" Remember that assets are used to generate revenues. By comparing a company's average total assets over a certain period of time to the revenues generated over that same period, we can get a sense of how efficiently a company is using its asset base to generate revenues. This relationship is referred to as asset turns, or asset turnover. (Note that as with shareholders' equity in ROE, we'll be averaging total assets from the beginning and end of the year.)
Here's how Wrigley stacked up in asset turns in 2000:
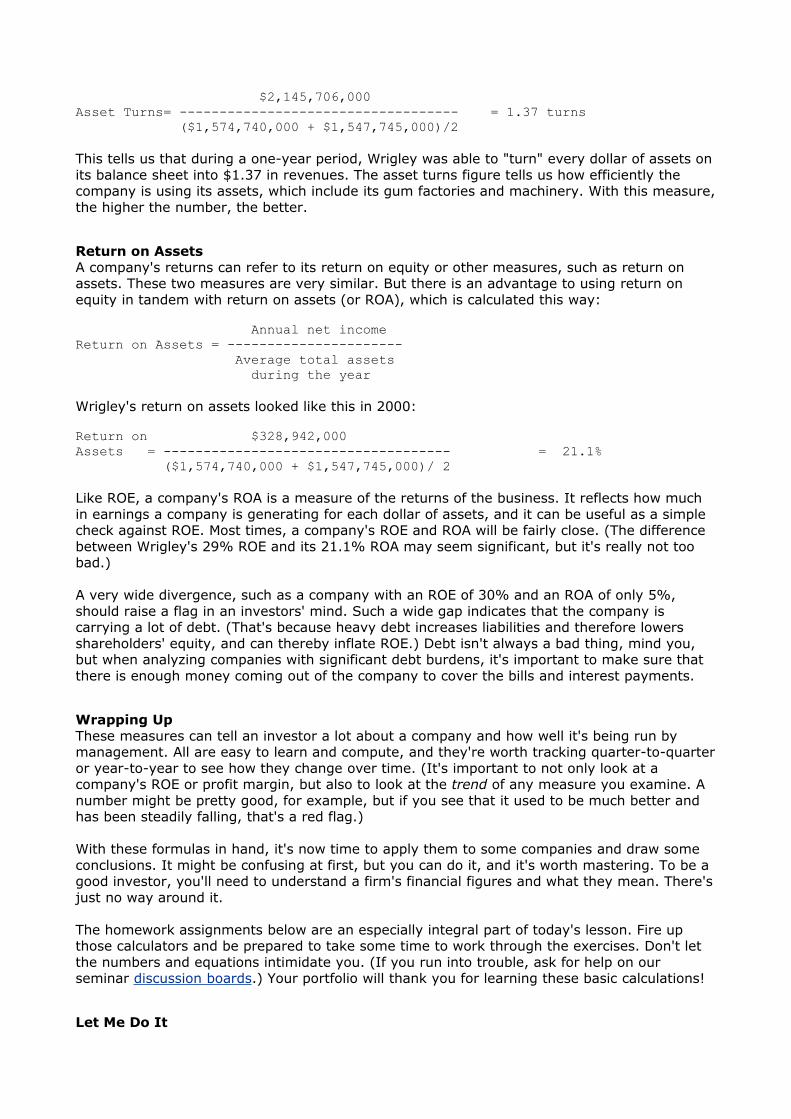
$2,145,706,000 Asset Turns= ----------------------------------- = 1.37 turns ($1,574,740,000 + $1,547,745,000)/2
This tells us that during a one-year period, Wrigley was able to "turn" every dollar of assets on its balance sheet into $1.37 in revenues. The asset turns figure tells us how efficiently the company is using its assets, which include its gum factories and machinery. With this measure, the higher the number, the better.
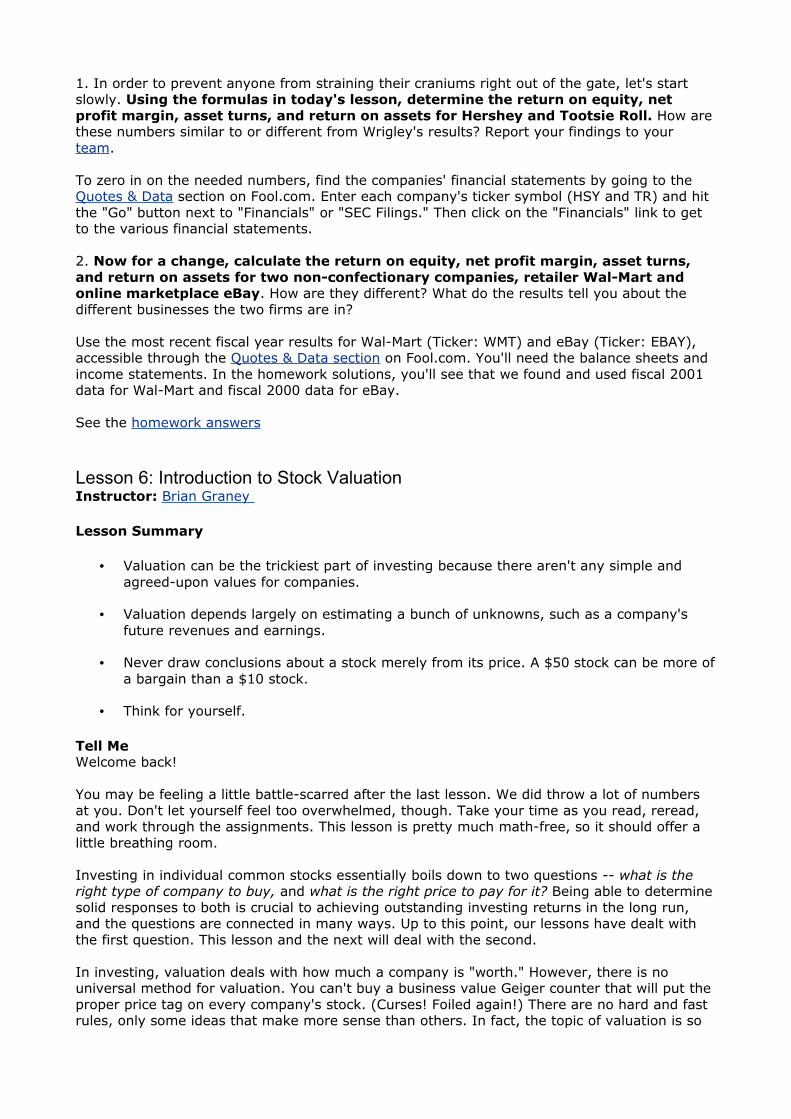
Return on Assets A company's returns can refer to its return on equity or other measures, such as return on assets. These two measures are very similar. But there is an advantage to using return on equity in tandem with return on assets (or ROA), which is calculated this way:
Annual net income Return on Assets = ---------------------- Average total assets during the year
Wrigley's return on assets looked like this in 2000:
Return on $328,942,000 Assets = ------------------------------------ = 21.1% ($1,574,740,000 + $1,547,745,000)/ 2
Like ROE, a company's ROA is a measure of the returns of the business. It reflects how much in earnings a company is generating for each dollar of assets, and it can be useful as a simple check against ROE. Most times, a company's ROE and ROA will be fairly close. (The difference between Wrigley's 29% ROE and its 21.1% ROA may seem significant, but it's really not too bad.)
A very wide divergence, such as a company with an ROE of 30% and an ROA of only 5%, should raise a flag in an investors' mind. Such a wide gap indicates that the company is carrying a lot of debt. (That's because heavy debt increases liabilities and therefore lowers shareholders' equity, and can thereby inflate ROE.) Debt isn't always a bad thing, mind you, but when analyzing companies with significant debt burdens, it's important to make sure that there is enough money coming out of the company to cover the bills and interest payments.
Wrapping UpThese measures can tell an investor a lot about a company and how well it's being run by management. All are easy to learn and compute, and they're worth tracking quarter-to-quarter or year-to-year to see how they change over time. (It's important to not only look at a company's ROE or profit margin, but also to look at the trend of any measure you examine. A number might be pretty good, for example, but if you see that it used to be much better and has been steadily falling, that's a red flag.)
With these formulas in hand, it's now time to apply them to some companies and draw some conclusions. It might be confusing at first, but you can do it, and it's worth mastering. To be a good investor, you'll need to understand a firm's financial figures and what they mean. There's just no way around it.
The homework assignments below are an especially integral part of today's lesson. Fire up those calculators and be prepared to take some time to work through the exercises. Don't let the numbers and equations intimidate you. (If you run into trouble, ask for help on our seminar discussion boards.) Your portfolio will thank you for learning these basic calculations!
Let Me Do It
1. In order to prevent anyone from straining their craniums right out of the gate, let's start slowly. Using the formulas in today's lesson, determine the return on equity, net profit margin, asset turns, and return on assets for Hershey and Tootsie Roll. How are these numbers similar to or different from Wrigley's results? Report your findings to your team.
To zero in on the needed numbers, find the companies' financial statements by going to the Quotes & Data section on Fool.com. Enter each company's ticker symbol (HSY and TR) and hit the "Go" button next to "Financials" or "SEC Filings." Then click on the "Financials" link to get to the various financial statements.
2. Now for a change, calculate the return on equity, net profit margin, asset turns, and return on assets for two non-confectionary companies, retailer Wal-Mart and online marketplace eBay. How are they different? What do the results tell you about the different businesses the two firms are in?
Use the most recent fiscal year results for Wal-Mart (Ticker: WMT) and eBay (Ticker: EBAY), accessible through the Quotes & Data section on Fool.com. You'll need the balance sheets and income statements. In the homework solutions, you'll see that we found and used fiscal 2001 data for Wal-Mart and fiscal 2000 data for eBay.
See the homework answers
Lesson 6: Introduction to Stock Valuation Instructor: Brian Graney
Lesson Summary
• Valuation can be the trickiest part of investing because there aren't any simple and agreed-upon values for companies.
• Valuation depends largely on estimating a bunch of unknowns, such as a company's future revenues and earnings.
• Never draw conclusions about a stock merely from its price. A $50 stock can be more of a bargain than a $10 stock.
• Think for yourself.
Tell Me Welcome back!
You may be feeling a little battle-scarred after the last lesson. We did throw a lot of numbers at you. Don't let yourself feel too overwhelmed, though. Take your time as you read, reread, and work through the assignments. This lesson is pretty much math-free, so it should offer a little breathing room.
Investing in individual common stocks essentially boils down to two questions -- what is the right type of company to buy, and what is the right price to pay for it? Being able to determine solid responses to both is crucial to achieving outstanding investing returns in the long run, and the questions are connected in many ways. Up to this point, our lessons have dealt with the first question. This lesson and the next will deal with the second.
In investing, valuation deals with how much a company is "worth." However, there is no universal method for valuation. You can't buy a business value Geiger counter that will put the proper price tag on every company's stock. (Curses! Foiled again!) There are no hard and fast rules, only some ideas that make more sense than others. In fact, the topic of valuation is so
rich that we'll just be introducing it in this seminar. Treat what follows as a rough guide to thinking about stock valuation, not as a set of specific rules.
Putting the Past in Proper Context Every company with shares of stock that can be bought and sold on a public market has one thing in common -- each has a stock price or quotation ("quote" for short) readily available online or in the business pages of your local newspaper.
New investors often look at a company's current stock price and then compare where the price was in the past to where it is today. What follows is often dangerous, faulty logic. ("Aha! This stock is selling for $50 per share, and it was at $80 a few months ago -- it must be a bargain!")
Imagine two generally similar companies in the same industry -- the fictitious milkshake machine manufacturers Joanie Inc. and Chachi Corp. When we pull up Joanie's current stock quote, we see that its price has doubled in the past 24 months. Meanwhile, Chachi's stock has barely budged over the same period.
Armed with only this information, many novice investors (and even some experienced ones) might draw the following conclusions: Chachi is most likely the better buy, since Joanie's stock has doubled recently. Chachi must be "cheaper" because its price hasn't changed for two years. Joanie might be a great buy if its stock price somehow slid back down to where it was two years ago. After doubling, the future gains to be had from Joanie may already be "priced into the stock."
Such logic just doesn't hold up in reality. There is nothing preventing a stock that has doubled recently from doubling, tripling, or quadrupling in subsequent years. There's also nothing preventing a stock that has gone nowhere in the past from continuing to go nowhere (or even falling) in the future. It all depends on the movement of the underlying business, not the movement of the stock price.
When you look at stock price quotes, remember to keep things in context. Maybe Joanie has been earning higher business returns than Chachi and has been increasing its market share at Chachi's expense. Maybe its products are selling better, or it has hit upon a superior production process. These things would point toward Joanie being "worth" more than Chachi, and might justify the past increase in Joanie's stock.
What Is Known vs. What Is Not While stock quote information is readily available, a listing of actual business values is not. Investors must determine a business's value on their own, using information on the firm's past combined with information about what the future may hold.
Resources such as financial magazines or analytical reports from brokerage firms usually do a great job of providing what is known -- how fast eBay's revenues have grown over the past three years, how much Wal-Mart's stock price has advanced this year, or the details of the new types of chewing gum Wrigley is developing. However, they do a poor job of aiding investors with what matters most -- the unknowns. How fast will eBay's revenues grow over the next three years? What will enable Wal-Mart's stock quote to keep advancing in the future? Will Wrigley's new products be big sellers or busts? These are the questions that need to be answered in order to pin down a firm's valuation.
Show Me
Thinking for Yourself So how does an investor go about determining these unknowns, and thereby a company's worth? Everybody can look at past stock quotes, read interviews with management, and scan financial statements. How do you gain an advantage?
To invest successfully in stocks, you must be able to take what is "known," keep past performance in its proper context, inject your own insights about the unknowns, and then come to a conclusion. The bottom line is that you must think for yourself the whole way through the valuation process.
The trick -- if there is one in stock valuation -- is to see things that others are ignoring, to recognize aspects of a changing business before the rest of the market does. Every situation is unique. Sometimes a new executive will put a company on a course for higher profits. Other times, a new product in development will provide an unforeseen boost, or a different way of doing business will set the firm apart from its competitors. For the novice investor, it's worthwhile to find and focus on an element of the business that is not being fully recognized by other investors and then hold on to the company's stock until it is appreciated. This is probably the simplest (and most effective) way to apply valuation to a stock investing strategy.
The Present Value of the FutureA company's true value is the sum of its future cash flows, "discounted" to a present value. Since this is much easier said than done, investors make do by estimating future numbers as well as they can and by looking for extra insights and epiphanies into a company's business. They also often apply proxies for full-blown "discounted cash flow" analysis by calculating ratios that compare a company's current stock price or market value to one of its performance measures (examples: price-to-earnings ratio, price-to-sales ratio, etc.)
Think of a young company that's not yet earning a profit. Few such firms are valued at zero. If they're publicly traded, they most likely have some value, and possibly a sizable value if they're growing very quickly and are well regarded. These market valuations are based on expectations of future performance. The same goes for a big, well-known company that's temporarily ailing. Xerox, for example, hasn't been profitable recently. Yet it's still valued at several billion dollars. That's based on a combination of its assets (tangible ones such as property and intangible ones such as brand value) and expectations of its future performance.
Wrapping Up
Thinking for yourself is a mindset. The sooner you adopt this mindset, the better an investor you will be. Now, let's do some stock valuation thinking with two short quizzes in lieu of the usual homework assignments. In our next lesson, we'll discuss how you might begin to assess whether a stock's price is attractive.
Now, on to the fun stuff!
Let Me Do It
This is a pretty undemanding homework session, so enjoy!
Pop Quiz!Answer True or False for each question below.
1. Stock valuation is more of an art than a science.
2. In investing, the price paid for a company's stock can be just as important as the type of company being purchased.
3. It's usually a better bet to buy a stock after a 50% price decline than after a 100% price rise.
4. The only surefire way to "beat the market" is to cheat and buy stocks based on material that other investors are not privy to, so-called "insider information."
5. Financial magazines are good sources of information for researching companies.
6. A stock trading for $25 per share is more attractive than a stock trading for $50.
7. Price does not equal value.
8. The woodchuck can run up to 30 kilometers per hour.
9. A stock that is trading near its 52-week high isn't as attractive as one trading near its 52-week low.
Pop Quiz #2!
1. It's the spring of 1999 and you're looking at two companies whose stocks are trading at the following prices:
Company A: $18 per shareCompany B: $48 per share
Which do you buy? (Imagine that each is a well-known retailer, if that helps you decide.)
2. It's January of 1987. The stocks of two well-known and much-admired companies, Walt Disney and General Electric, are each trading around $48 per share. If you were going to invest in one of them for the long haul, which one would you choose? (Don't spend too much time agonizing on this one. It's just here to demonstrate a simple lesson or two.)
Get the quiz answers here!
Lesson 7: Our Friend, the P/E Ratio Instructor: Brian Graney
Lesson Summary
• The P/E ratio is a handy tool, but it's just one of many. • Along with a company's P/E, assess its business returns and level of risk. • Typical P/E ranges vary for different kinds of companies. • We offer some thoughts on when to think about buying.
Tell Me Our last lesson introduced valuation, the process of thinking about and determining how much a company is worth. Valuation is the final step in the investment process -- even for world-class investor Warren Buffett. Here's his evaluation process, which consists of four simple questions:
1. Can I understand the company?2. Does it have sustainable competitive advantages?3. Is the management good?4. What's the price?
Buffett's framework is not far off from the way we've set up this seminar. We first got you thinking about industries and companies you understand more than others. Then we started
evaluating company quality, assessing factors such as competitive advantage, business model strength, past growth and growth potential, and management integrity. The last step is determining whether the stock is trading at an attractive price.
A Tool Called P/E The most frequently used yardstick for stock valuation is the price-to-earnings ratio, also known as the P/E ratio or the "earnings multiple." The P/E ratios of various stocks are batted around a lot by investors. It's common to hear an investor say that this company trades at a P/E of 15, or that another one has a "multiple" of 15 times earnings (which is a fancy way of saying the same thing).
The P/E ratio is only a single valuation tool, not a valuation do-it-all. Still, it has some definite benefits, such as being simple to calculate. All you need to do is take a company's current per-share price (the "P"), divide by the earnings per share (the "E") reported on the past year's income statement, and you've got the P/E. (You can also use estimates of next year's earnings per share instead of last year's results.)
Current stockprice P/E ratio = -------------------------------- Past year's earnings per share
For example, if Wrigley's current stock price is $50 per share and its earnings per share ("EPS") over the past 12 months were $1.56, then its P/E ratio is 32 ($50 divided by $1.56 equals 32). If analysts expect the company to report $1.72 per share in earnings in the coming year, then Wrigley's "forward" P/E is 29, or $50 divided by $1.72. That's all there is to it. Most P/Es listed in newspapers or online are based on the previous year's (or "trailing twelve months") EPS.
It can be worth the trouble to calculate forward P/Es. A fast-growing company, for example, might have a P/E of 100+ based on last year's earnings, but if earnings are growing quickly, today's shares might be priced at just 25 times the earnings a few years out. But we're getting ahead of ourselves....
Show Me
Using the P/E Calculating a stock's P/E is easy (as long as the company in question has earnings, that is). Applying the P/E and drawing conclusions from it is less easy. Some investors would rather eat glass than buy a stock with a P/E greater than an arbitrary number, such as 10, no matter what kind of company they're looking at. We prefer to be more flexible, since the P/E ratio does not paint the entire valuation picture for a company. There are some questions that investors need to ask in order to fill out the picture. Here are two biggies.
Question 1: What Are the Business's Returns?Understanding a business's current returns and being able to project its returns in the future is central not only to understanding a business, but also to determining its proper valuation. This isn't to say that for a company with an ROE of 15%, a reasonable P/E ratio for its stock is 15. There's no such one-to-one correlation.
As a general rule of thumb, though, the stocks most likely to experience an increase in their P/E ratios over time belong to companies that can either boost their ROE or maintain a higher-than-average ROE, all else being equal. In the long run, the earnings from a high-return business are simply worth more than the same level of earnings from a low-return business, since the prospect for sustained earnings and business growth is much greater for a high-return business than a low-return one.
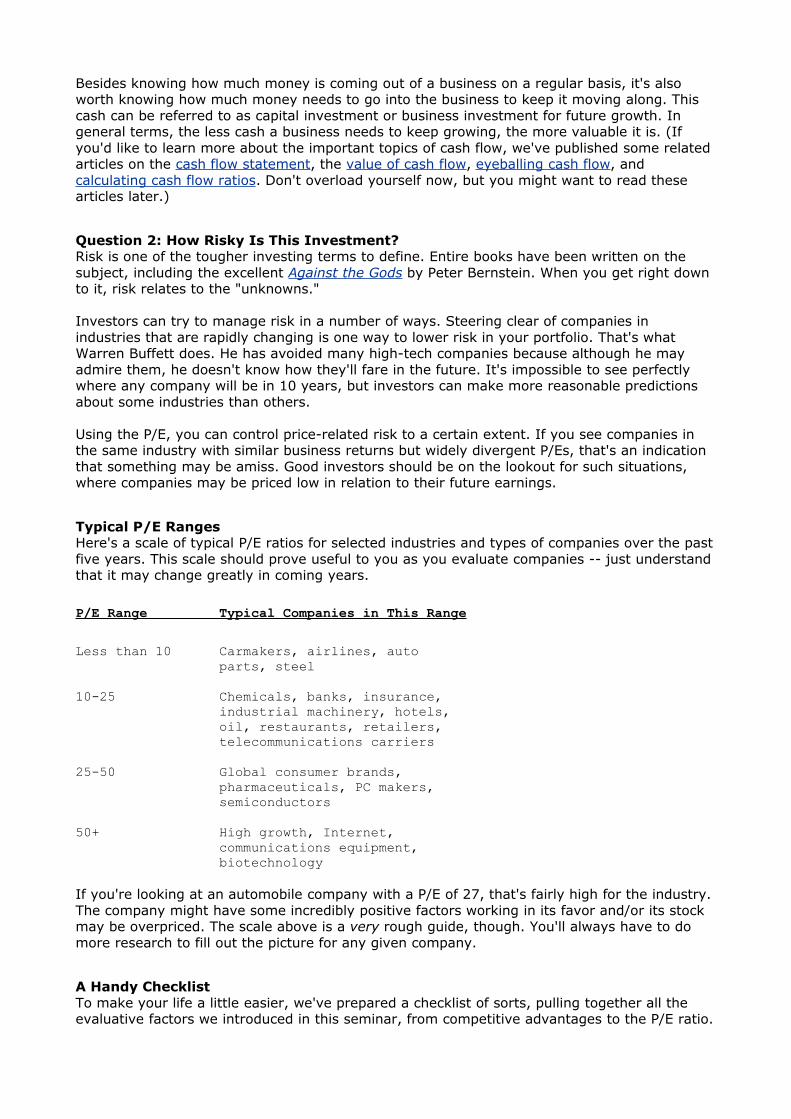
Besides knowing how much money is coming out of a business on a regular basis, it's also worth knowing how much money needs to go into the business to keep it moving along. This cash can be referred to as capital investment or business investment for future growth. In general terms, the less cash a business needs to keep growing, the more valuable it is. (If you'd like to learn more about the important topics of cash flow, we've published some related articles on the cash flow statement, the value of cash flow, eyeballing cash flow, and calculating cash flow ratios. Don't overload yourself now, but you might want to read these articles later.)
Question 2: How Risky Is This Investment?Risk is one of the tougher investing terms to define. Entire books have been written on the subject, including the excellent Against the Gods by Peter Bernstein. When you get right down to it, risk relates to the "unknowns."
Investors can try to manage risk in a number of ways. Steering clear of companies in industries that are rapidly changing is one way to lower risk in your portfolio. That's what Warren Buffett does. He has avoided many high-tech companies because although he may admire them, he doesn't know how they'll fare in the future. It's impossible to see perfectly where any company will be in 10 years, but investors can make more reasonable predictions about some industries than others.
Using the P/E, you can control price-related risk to a certain extent. If you see companies in the same industry with similar business returns but widely divergent P/Es, that's an indication that something may be amiss. Good investors should be on the lookout for such situations, where companies may be priced low in relation to their future earnings.
Typical P/E Ranges Here's a scale of typical P/E ratios for selected industries and types of companies over the past five years. This scale should prove useful to you as you evaluate companies -- just understand that it may change greatly in coming years.
P/E Range Typical Companies in This Range
Less than 10 Carmakers, airlines, auto parts, steel
10-25 Chemicals, banks, insurance, industrial machinery, hotels, oil, restaurants, retailers, telecommunications carriers
25-50 Global consumer brands, pharmaceuticals, PC makers, semiconductors
50+ High growth, Internet, communications equipment, biotechnology
If you're looking at an automobile company with a P/E of 27, that's fairly high for the industry. The company might have some incredibly positive factors working in its favor and/or its stock may be overpriced. The scale above is a very rough guide, though. You'll always have to do more research to fill out the picture for any given company.
A Handy ChecklistTo make your life a little easier, we've prepared a checklist of sorts, pulling together all the evaluative factors we introduced in this seminar, from competitive advantages to the P/E ratio.
You might want to use it when you're checking out an industry and/or a company. You can fill in your thoughts or findings in each section.Download the Company Evaluation Checklist.
Some Thoughts on When to BuyIt's beyond the scope of this seminar to go into detail on when to buy a stock. But to help you start thinking, below are some potential "triggers" to look for when considering buying a company's stock.
• Improving margins/business returns • New and improved management • Low P/E in relation to peers • Improving market share • Successful new products • Improved production techniques • Stronger competitive position • Surging sales/major new customers • Temporarily depressed stock price due to market overreaction to some company news • Temporarily depressed stock price due to most of the market crashing or "correcting"
As always, the more you learn about a company, the more confidence you should have in your investment decisions regarding it. This seminar is not teaching you all you need to know when evaluating companies -- instead, it's giving you a solid introduction and a preliminary toolbox. If you did very little homework in the past when choosing stocks, you've come a long way.
Wrapping UpThat's it for this lesson. It's time to apply what you've learned in some homework assignments.
Let me Do ItAs usual, if you run into any trouble with this homework or want to ask some of the harder questions, head over to the seminar boards.
1. For starters, let's get some practice calculating P/Es for our sample companies. We've already calculated Wrigley's P/E in today's lesson. (It was 32.) Try to calculate the following firms' P/Es using the earnings per share and stock prices given below.(Note: If you want more up-to-date data, you'll find it at quotes.fool.com. You can also find the forward, or estimated, earnings per share there, by typing in the company's ticker symbol and punching the "Go" button next to "Estimates." Once on the Estimates page, look for the "Mean Estimates" in the "Earnings Per Share" section.) For this exercise we've taken the data from December 19, 2001. (We just picked a out of the past so you can check your answers with ours.)
Earnings StockCompany Per Share Price Hershey(NYSE: HSY) $2.67 $67Tootsie Roll (NYSE: TR) $1.36 $39Wal-Mart (NYSE: WMT) $1.44 $56eBay (Nasdaq: EBAY) $0.31 $67Ford (NYSE: F) $0.36 $15McDonald's (NYSE: MCD) $1.38 $26
2. Using the results from question 1, what can you say generally about the value the market has placed on these firms' earnings? There's no absolutely right answer to this question, but using the P/E range chart in today's lesson and what we've discussed in previous lessons in this seminar, what do you think are some of the business traits that lead to different
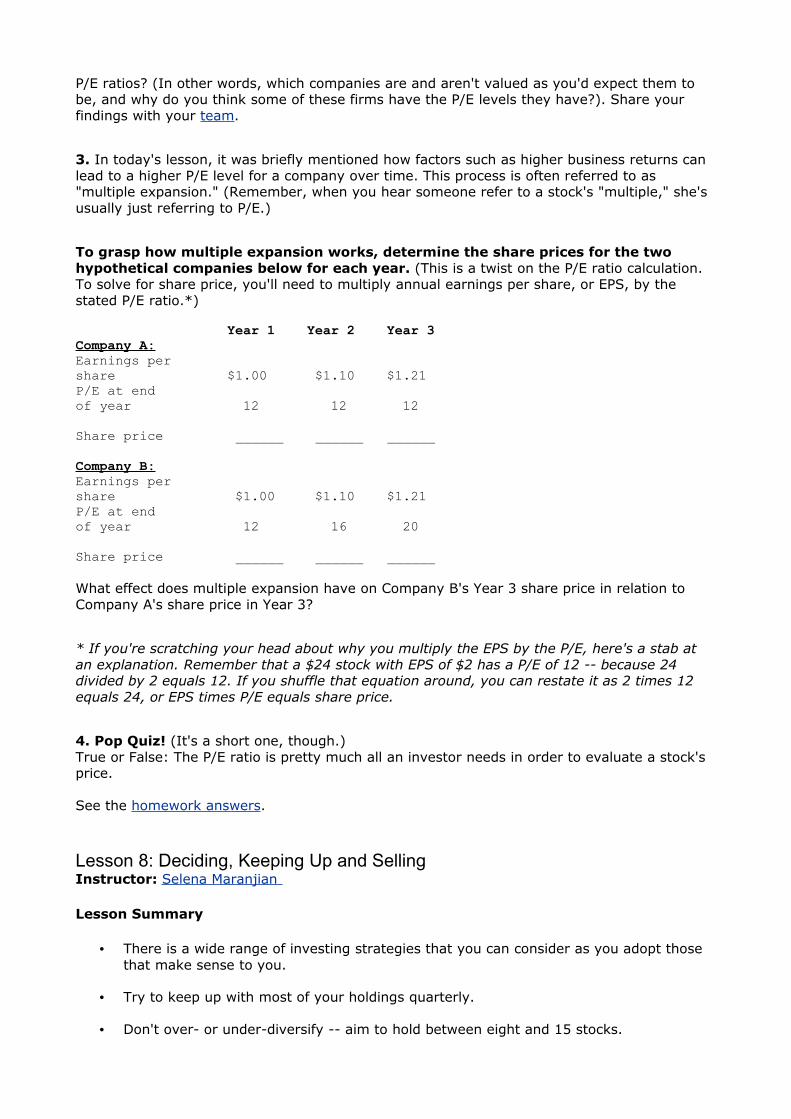
P/E ratios? (In other words, which companies are and aren't valued as you'd expect them to be, and why do you think some of these firms have the P/E levels they have?). Share your findings with your team.
3. In today's lesson, it was briefly mentioned how factors such as higher business returns can lead to a higher P/E level for a company over time. This process is often referred to as "multiple expansion." (Remember, when you hear someone refer to a stock's "multiple," she's usually just referring to P/E.)
To grasp how multiple expansion works, determine the share prices for the two hypothetical companies below for each year. (This is a twist on the P/E ratio calculation. To solve for share price, you'll need to multiply annual earnings per share, or EPS, by the stated P/E ratio.*)
Year 1 Year 2 Year 3Company A: Earnings per share $1.00 $1.10 $1.21P/E at end of year 12 12 12
Share price ______ ______ ______
Company B: Earnings per share $1.00 $1.10 $1.21P/E at end of year 12 16 20
Share price ______ ______ ______
What effect does multiple expansion have on Company B's Year 3 share price in relation to Company A's share price in Year 3?
* If you're scratching your head about why you multiply the EPS by the P/E, here's a stab at an explanation. Remember that a $24 stock with EPS of $2 has a P/E of 12 -- because 24 divided by 2 equals 12. If you shuffle that equation around, you can restate it as 2 times 12 equals 24, or EPS times P/E equals share price.
4. Pop Quiz! (It's a short one, though.)True or False: The P/E ratio is pretty much all an investor needs in order to evaluate a stock's price.
See the homework answers.
Lesson 8: Deciding, Keeping Up and Selling Instructor: Selena Maranjian
Lesson Summary
• There is a wide range of investing strategies that you can consider as you adopt those that make sense to you.
• Try to keep up with most of your holdings quarterly.
• Don't over- or under-diversify -- aim to hold between eight and 15 stocks.
• Have reasonable expectations.
• Consider selling at certain times.
Tell Me You've made it to the end -- congratulations! This is the last formal lesson in this seminar. If you find yourself choking up and filled with sadness, comfort yourself with the news that we'll be sending you an extra bonus lesson! Expect it on Thursday, November 14.
You've now learned how to study a company from a bunch of angles and draw conclusions about its quality and its price/valuation. Your next step is to begin applying what you've learned to some investment decisions -- even if it's just in a pretend portfolio that you track while you keep learning.
You may decide that it's still too early to actually jump in and begin investing in earnest. That's a reasonable conclusion. After all, never invest until you're comfortable with what you're doing. Still, it makes sense to at least begin dipping your toe in. Perhaps evaluate and choose just one or two companies and invest a little in them. This can keep you committed to the endeavor and hasten or deepen your learning. Perhaps as you continue to learn, you might add one or two companies to your fledgling portfolio each year. Just don't invest any money that you're not prepared to take a loss on, or any money that you'll need within five (or even 10) years.
Show Me
Investing StrategiesThere are a wide range of investing strategies and styles that people use. Each one dictates, to a degree, what to look for in a stock. You might feel most comfortable with and/or confident about one strategy. If so, use it. Alternatively, you might mix and match a little. Below are just a few approaches, many of which aren't mutually exclusive.
• Dollar-cost averaging, where you invest consistent sums into certain investments regularly.
• Value investing, where you look for undervalued stocks, essentially trying to buy a dollar for 50 cents.
• Growth stock investing, where you look for rapidly growing companies that may not be inexpensive, but that you think will quickly appreciate.
• "Drip" investing, where you invest directly in companies, bypassing brokers and their commissions.
• Buying and holding for years or decades.
• Moving in and out of stocks frequently.
• Investing in stocks that pay high dividends.
• Investing in large-cap, blue-chip stocks (the IBMs and Coca-Colas of the world).
• Investing in more dynamic and volatile small-cap stocks.
• Investing using some Motley Fool strategies, such as Rule Makers and Rule Breakers.
• Focused investing, where after considerable research, you put most or all of your eggs in just a few baskets.
• Being very diversified, possibly over-diversified, owning perhaps several dozen stocks. (Those invested in index funds are very diversified.)
When you know what you're looking for, and you have a handle on some companies' quality and valuations, you're ready to make some decisions. You might decide, for example, to dollar-cost average into one stock, not buy another one at all, and keep an eye on a third in case its price falls to a more attractive level. The Motley Fool way is really just to think for yourself -- and to invest in ways that make the most sense to you and that you're comfortable with.
Keeping Up With Your HoldingsWhatever strategies you employ, aim to keep up with your holdings regularly. Ideally, check in on them at least once a quarter, when they report earnings. With some bigger and more stable firms, such as Coca-Cola and Procter & Gamble, you can get away with checking in less often.
To keep up, read through all earnings reports and annual reports. Read the detailed "10-K" form, too, which is issued at the same time as the annual report. (You may need to dig it up online, perhaps at http://quote.fool.com.) Also, look for and read press releases, magazine articles, and online articles. What are you looking for? You want to be aware of, among other things:
• How the firm is doing with its current operations. (Are sales and earnings growing at a good clip? If not, why not?)
• New directions the company is heading in and any new plans it's announcing. (Mergers? Acquisitions? Joint ventures? New lines of business?)
• Any cautious words issued by management. (For example, if a CEO warns that orders are slowing, you need to think about whether this is a temporary thing or a red flag.)
• Trends evident in financial statements. (Are debt loads or accounts receivable growing faster than sales? Are ROE, ROA, asset turns, and profit margins growing or shrinking? Is the company's cash pile growing or shrinking?)
How Many Stocks? There's no one-size-fits-all perfect number of stocks to own. We generally suggest that most people aim to hold between 8 and 15 companies. You ideally want your money concentrated on your best ideas -- the companies you think hold the most promise. If you think a certain 10 companies are most poised for success, why spread your funds over an additional 10 or 20 (or more) less-auspicious firms? Another problem with spreading yourself too thin is that it becomes impossible to keep up with all your stocks. If you've got 25 companies in your portfolio, that means 100 quarterly reports over the year. Yikes.
Conversely, focusing your money on too few stocks can make your situation extra risky or volatile, as you stand to gain or lose a lot.
ExpectationsDon't have unrealistic expectations when you begin investing. Sure, you might see one or more holdings quickly double in value. That's not the norm, though. Overall, the stock market has grown about 11% per year, on average. Expecting more than 10%-15% per year from most of your holdings can be unrealistic. Some years will be down years. In fact, the market might even deliver considerably less than 11% on average over a decade or longer.
Expect short-term volatility -- stocks never go up in a straight line. Expect to lose money on some holdings. Expect to screw up now and then. Even the best investors have made regrettable moves. If you're paying attention and reflecting, expect to learn from your mistakes and to make fewer ones (or at least not the same ones) as time marches on.
When to Consider Selling This is one of the toughest issues for investors. There aren't many rules that apply to every investor and every stock in every situation.
Now that you've got a rudimentary company evaluation toolbox to work with, you should be able to write down exactly why you're buying any stock. One trigger for selling is if your reasons are no longer valid. For example, perhaps you bought shares of PepsiCo because of (among other things) the company's strong margins and commanding market share position. If PepsiCo suddenly announces it's launching a huge line of supermarkets, you might reconsider your ownership. Supermarkets have low margins. Pepsi would be a new entrant into an established field. The money Pepsi spends on building supermarkets might have been better spent elsewhere. Similarly, if you observe Pepsi's market share and/or margins slipping significantly over time, that's a red flag, too.
The more vigilant you are and the better you know your company, the more likely you'll be to catch problems before others do, and to get out of bad situations before they get worse. Remember, though, that many good companies encounter temporary troubles and recover from them. Waiting and watching can often be smarter than selling -- partly because selling can trigger capital gains taxes. Always consider tax implications when you think about selling, but don't let them be the only thing you consider.
Here are some other reasons to consider selling:
• If you can't remember why you bought in the first place.
• If you don't know what the company does and how it makes money.
• If you'll need the money within a few years. Any greenbacks you'll need in three to five (or more) years should be in a less volatile place than stocks -- perhaps money market funds, CDs, or bonds.
• If the stock has become significantly overvalued relative to your target price, if you have one.
• If you find a much more attractive place to invest your money.
• If you're only hanging on for emotional reasons.
• If you've lost confidence in the company.
Summing UpWe've come to the end of our time together. In this seminar, we've covered:
• Where to find companies and industries to investigate.
• How to begin assessing a company's quality level (via qualitative factors such as competitive advantages and management integrity and quantitative factors such as ROE and profit margins).
• How to begin assessing a company's price level, via the P/E ratio and to a lesser extent, market capitalization.
You're now much savvier than the average investor out there. (Really and truly. Trust us.) But there's still more to learn. Can you start investing now with what you know at this point? You certainly can. Perhaps hold back from jumping into the market whole-hog with all your life savings, though. Start small while you keep learning. In a sense, the more you learn, the less risk you'll be taking on. The more you know about a company, the less likely it will be to surprise you.
Let Me Do It
1. Here's a test for you to apply before buying. If you're thinking you might buy stock in a given company, see if you can do one of the following things (or even both).
(a) Explain in 60 seconds to someone what the company does and how it makes its money. Include the company's attractive points and why it appears to be a sound investment. If you can't fill 60 seconds, then you probably need to learn more.
(b) Write down in at least 250 words (about one page) what the company does and how it makes its money. Include in your summary the company's attractive points and why it appears to be a sound investment. If you can't write that much about the company, then you probably need to learn more.
2. Promise yourself that from now on, whenever you decide to buy stock in a company, you'll make a list of reasons why you're doing so. Plan to refer back to this list now and then, when you regularly check in on the firm. It can help you to consider selling at the right time.
3. Pat yourself on the back for having learned so much. Few people ever get this far. Most people don't know what to do with an annual report besides admire the lovely glossy photographs. Go share some of this new knowledge with at least one other person. (And next time someone offers you a hot stock tip, ask them to explain in 60 seconds why the company is such a good buy. We bet they can't.)
See the homework answers.