Embed Size (px)
Citation preview
School Accountabi l i ty Report Card Issued Spring 2016 for Academic Year 2014–15
San Diego Unified School District • Cindy Marten, Superintendent • 4100 Normal Street, San Diego, CA 92103 • www.sandiegounified.org
What Is a SARC?
All California public schools are re-quired by state law to publish a School Accountability Report Card (SARC) by February 1 of each year. The SARC contains specific information about the condition and performance of the school from the previous school year.
Furthermore, under the Local Con-trol Funding Formula (LCFF), San Die-go Unified is required to prepare a Lo-cal Control Accountability Plan (LCAP), which describes how it intends to meet annual school-specific goals for all students, with specific activities to ad-dress state and local priorities. Data reported in the SARC are to be con-sistent with data reported in the LCAP.
More information about the re-quirements for the SARC is available on the state’s SARC website:
www.cde.ca.gov/ta/ac/sa/
Additional copies of this SARC may be obtained from the school office or from the district’s SARC website:
www.sandiegounified.org/sarc
For more information about the LCFF or LCAP, see the state’s LCFF website:
www.cde.ca.gov/fg/aa/lc/
Finally, for more information about this school, contact the principal or the district office.
Contents Data and Access ................................... 2About This School ................................. 2Conditions of Learning ........................... 2Student Outcomes ................................ 5Engagement ......................................... 9Other Information ............................... 10
Adequate Yearly Progress ................. 10 Federal Intervention Program ............ 10 Average Class Size and Class Size Distribution .................................... 11 Academic Counselors and Other Support Staff Members .................... 11 Expenditures per Pupil and School- Site Teacher Salaries ....................... 11 Types of Services Funded .................. 12 Teacher and Administrative Salaries ... 12 Professional Development ................. 12
Appendix: Adopted Texts and Instructional Materials ......................... 12
Sherman Elementary School 301 22nd St., San Diego, CA 92102
Phone: (619) 615-7000 E-mail: [email protected]
Web: www.sandiegounified.org/schools/sherman CDS Code: 37-68338-6040158
Edward Caballero, Principal School Description and Mission Statement Located in the historic Sherman Heights neighborhood just east of downtown San Diego, the Sherman Elementary was recently rebuilt for the fourth time since 1870 and reopened its doors for the 2008–09 school year. The neighborhood is full of beautiful historic homes and landmarks, many of which are being re-stored to their original condition. Like its surroundings, the stu-dent population at Sherman is diverse and showcases a rich cul-tural heritage.
Our mission is to assure high academic achievement and to prepare students for success in our global society. Our compre-hensive instructional program focuses on twenty-first century skills, in which students are prepared for life in a global society by receiving a strong foundation in English and Spanish lan-guage arts (via a 50/50 dual-immersion program), mathematics, science, history and social science, cultural understanding, technological and media literacy, and visual and performing arts. The overall goal of the twenty-first century skills program is to assure high academic achievement and to prepare students for the future by teaching them core values and higher-order thinking skills, which they can apply in the “real world.”
Sherman (259) 2 Spring 2016 School Accountability Report Card
Data and Access
Most of the data in this SARC are from the 2014–15 school year or the two preceding years (2012–13 and 2013–14). Gradua-tion, dropout, and fiscal data are from 2013–14. Contact information and data on facilities, curriculum and instructional mate-rials, and certain teacher information are from the 2015–16 school year. When no year is specified, data are from the most recent year available.
Data included in this SARC are consistent with State Board of Education guidelines, available at the California Depart-ment of Education website: www.cde.ca.gov/ta/ac/sa/. DataQuest DataQuest is an on-line data tool (dq.cde.ca.gov/dataquest/) that contains additional information about this school and com-parisons of the school to the district, the county, and the state. DataQuest is a dynamic system that provides reports for ac-countability, test results, enrollment, graduates, dropouts, course enrollments, staffing, and data regarding English learners. Internet Access Internet access is available at public libraries and other locations that are publicly accessible (e.g., the California State Li-brary). Access to the Internet at libraries and public locations is generally provided on a first-come, first-served basis. Other use restrictions include the hours of operation, the length of time that a workstation may be used (depending on availability), the types of software programs available on a workstation, and the ability to print documents.
About This School
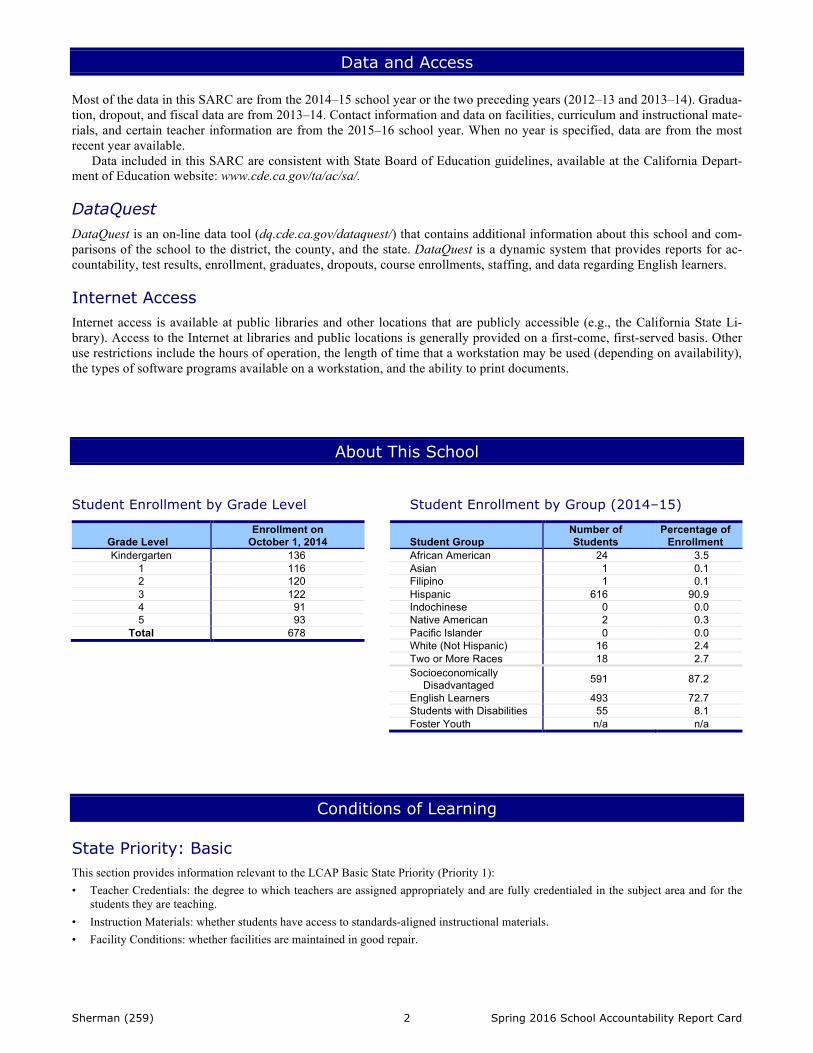
Student Enrollment by Grade Level
Grade Level Enrollment on
October 1, 2014 Kindergarten 136
1 116 2 120 3 122 4 91 5 93
Total 678
Student Enrollment by Group (2014–15)
Student Group Number of Students
Percentage of Enrollment
African American 24 3.5 Asian 1 0.1 Filipino 1 0.1 Hispanic 616 90.9 Indochinese 0 0.0 Native American 2 0.3 Pacific Islander 0 0.0 White (Not Hispanic) 16 2.4 Two or More Races 18 2.7 Socioeconomically
Disadvantaged 591 87.2
English Learners 493 72.7 Students with Disabilities 55 8.1 Foster Youth n/a n/a
Conditions of Learning
State Priority: Basic This section provides information relevant to the LCAP Basic State Priority (Priority 1): • Teacher Credentials: the degree to which teachers are assigned appropriately and are fully credentialed in the subject area and for the
students they are teaching. • Instruction Materials: whether students have access to standards-aligned instructional materials. • Facility Conditions: whether facilities are maintained in good repair.
Sherman (259) 3 Spring 2016 School Accountability Report Card
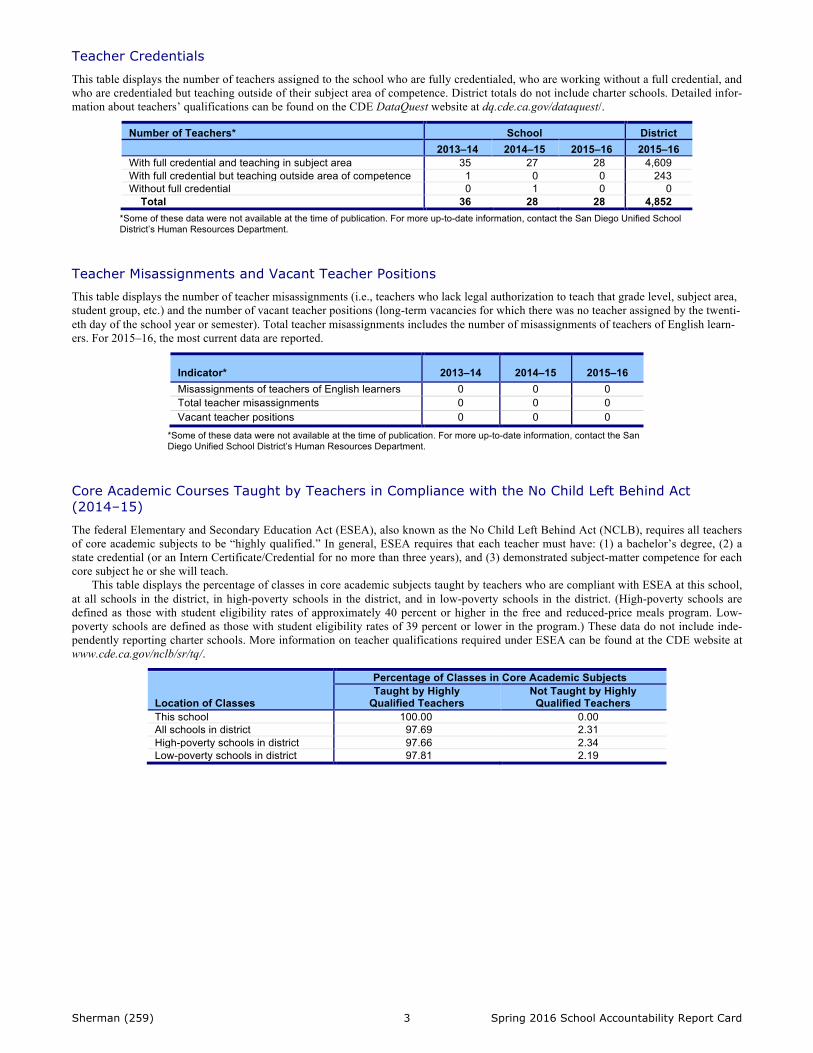
Teacher Credentials
This table displays the number of teachers assigned to the school who are fully credentialed, who are working without a full credential, and who are credentialed but teaching outside of their subject area of competence. District totals do not include charter schools. Detailed infor-mation about teachers’ qualifications can be found on the CDE DataQuest website at dq.cde.ca.gov/dataquest/.
Number of Teachers* School District 2013–14 2014–15 2015–16 2015–16
With full credential and teaching in subject area 35 27 28 4,609 With full credential but teaching outside area of competence 1 0 0 243 Without full credential 0 1 0 0 Total 36 28 28 4,852
*Some of these data were not available at the time of publication. For more up-to-date information, contact the San Diego Unified School District’s Human Resources Department.
Teacher Misassignments and Vacant Teacher Positions This table displays the number of teacher misassignments (i.e., teachers who lack legal authorization to teach that grade level, subject area, student group, etc.) and the number of vacant teacher positions (long-term vacancies for which there was no teacher assigned by the twenti-eth day of the school year or semester). Total teacher misassignments includes the number of misassignments of teachers of English learn-ers. For 2015–16, the most current data are reported.
Indicator* 2013–14 2014–15 2015–16 Misassignments of teachers of English learners 0 0 0 Total teacher misassignments 0 0 0 Vacant teacher positions 0 0 0
*Some of these data were not available at the time of publication. For more up-to-date information, contact the San Diego Unified School District’s Human Resources Department.
Core Academic Courses Taught by Teachers in Compliance with the No Child Left Behind Act (2014–15)
The federal Elementary and Secondary Education Act (ESEA), also known as the No Child Left Behind Act (NCLB), requires all teachers of core academic subjects to be “highly qualified.” In general, ESEA requires that each teacher must have: (1) a bachelor’s degree, (2) a state credential (or an Intern Certificate/Credential for no more than three years), and (3) demonstrated subject-matter competence for each core subject he or she will teach.
This table displays the percentage of classes in core academic subjects taught by teachers who are compliant with ESEA at this school, at all schools in the district, in high-poverty schools in the district, and in low-poverty schools in the district. (High-poverty schools are defined as those with student eligibility rates of approximately 40 percent or higher in the free and reduced-price meals program. Low-poverty schools are defined as those with student eligibility rates of 39 percent or lower in the program.) These data do not include inde-pendently reporting charter schools. More information on teacher qualifications required under ESEA can be found at the CDE website at www.cde.ca.gov/nclb/sr/tq/.
Location of Classes
Percentage of Classes in Core Academic Subjects Taught by Highly
Qualified Teachers Not Taught by Highly
Qualified Teachers This school 100.00 0.00 All schools in district 97.69 2.31 High-poverty schools in district 97.66 2.34 Low-poverty schools in district 97.81 2.19
Sherman (259) 4 Spring 2016 School Accountability Report Card
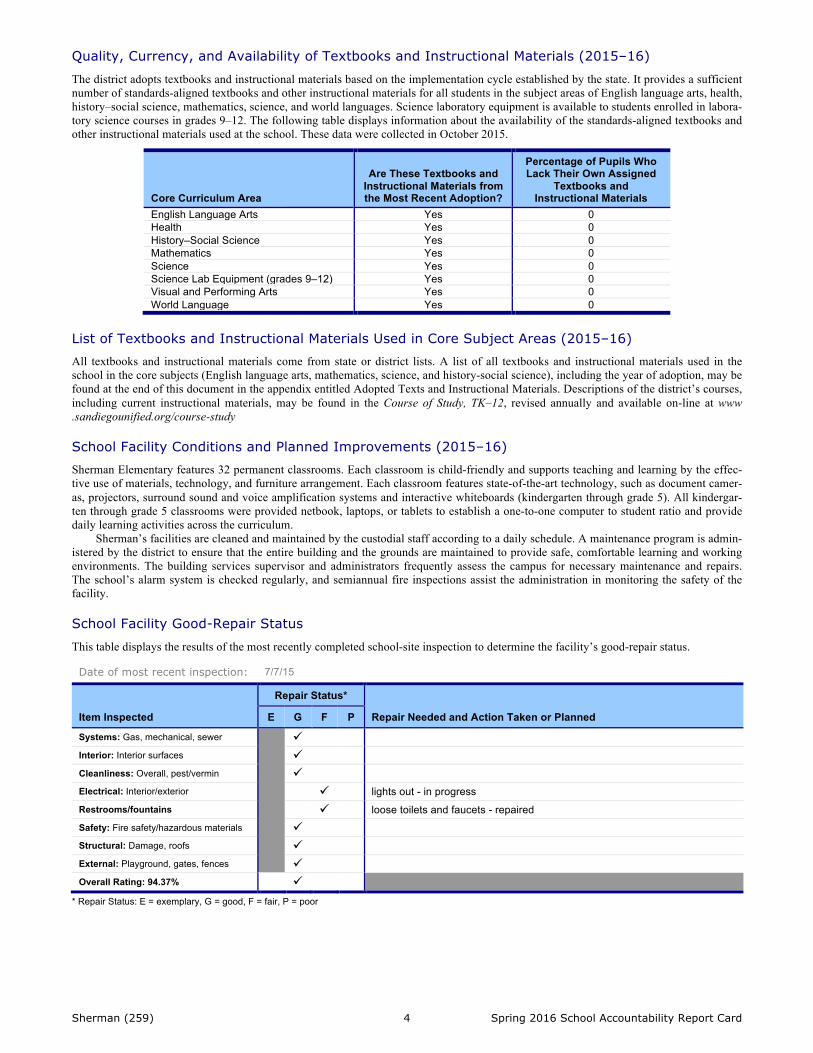
Quality, Currency, and Availability of Textbooks and Instructional Materials (2015–16)
The district adopts textbooks and instructional materials based on the implementation cycle established by the state. It provides a sufficient number of standards-aligned textbooks and other instructional materials for all students in the subject areas of English language arts, health, history–social science, mathematics, science, and world languages. Science laboratory equipment is available to students enrolled in labora-tory science courses in grades 9–12. The following table displays information about the availability of the standards-aligned textbooks and other instructional materials used at the school. These data were collected in October 2015.
Core Curriculum Area
Are These Textbooks and Instructional Materials from the Most Recent Adoption?
Percentage of Pupils Who Lack Their Own Assigned
Textbooks and Instructional Materials
English Language Arts Yes 0 Health Yes 0 History–Social Science Yes 0 Mathematics Yes 0 Science Yes 0 Science Lab Equipment (grades 9–12) Yes 0 Visual and Performing Arts Yes 0 World Language Yes 0
List of Textbooks and Instructional Materials Used in Core Subject Areas (2015–16) All textbooks and instructional materials come from state or district lists. A list of all textbooks and instructional materials used in the school in the core subjects (English language arts, mathematics, science, and history-social science), including the year of adoption, may be found at the end of this document in the appendix entitled Adopted Texts and Instructional Materials. Descriptions of the district’s courses, including current instructional materials, may be found in the Course of Study, TK–12, revised annually and available on-line at www .sandiegounified.org/course-study School Facility Conditions and Planned Improvements (2015–16) Sherman Elementary features 32 permanent classrooms. Each classroom is child-friendly and supports teaching and learning by the effec-tive use of materials, technology, and furniture arrangement. Each classroom features state-of-the-art technology, such as document camer-as, projectors, surround sound and voice amplification systems and interactive whiteboards (kindergarten through grade 5). All kindergar-ten through grade 5 classrooms were provided netbook, laptops, or tablets to establish a one-to-one computer to student ratio and provide daily learning activities across the curriculum.
Sherman’s facilities are cleaned and maintained by the custodial staff according to a daily schedule. A maintenance program is admin-istered by the district to ensure that the entire building and the grounds are maintained to provide safe, comfortable learning and working environments. The building services supervisor and administrators frequently assess the campus for necessary maintenance and repairs. The school’s alarm system is checked regularly, and semiannual fire inspections assist the administration in monitoring the safety of the facility. School Facility Good-Repair Status
This table displays the results of the most recently completed school-site inspection to determine the facility’s good-repair status.
Date of most recent inspection: 7/7/15
Item Inspected
Repair Status*
Repair Needed and Action Taken or Planned E G F P
Systems: Gas, mechanical, sewer
ü Interior: Interior surfaces ü Cleanliness: Overall, pest/vermin ü Electrical: Interior/exterior ü lights out - in progress Restrooms/fountains ü loose toilets and faucets - repaired Safety: Fire safety/hazardous materials ü Structural: Damage, roofs ü External: Playground, gates, fences ü Overall Rating: 94.37% ü
* Repair Status: E = exemplary, G = good, F = fair, P = poor
Sherman (259) 5 Spring 2016 School Accountability Report Card
Student Outcomes
State Priority: Pupil Achievement This section provides information relevant to the Pupil Achievement State Priority (Priority 4): • Statewide Assessments: results of the California Assessment of Student Performance and Progress (CAASPP) and the Science Califor-
nia Standards Tests. • Preparation for College or Career: successful completion of courses that satisfy requirements for entrance to the University of Califor-
nia or the California State University, or career technical education sequences or programs of study. Statewide Assessments CAASPP Assessment Results
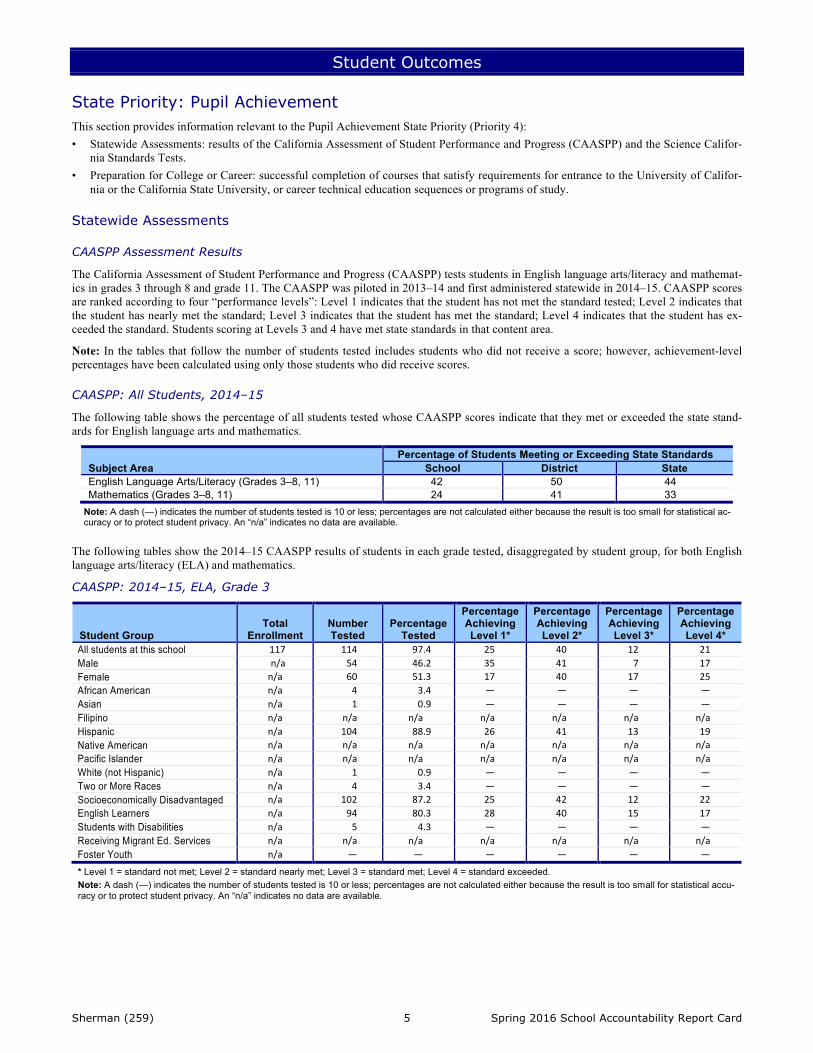
The California Assessment of Student Performance and Progress (CAASPP) tests students in English language arts/literacy and mathemat-ics in grades 3 through 8 and grade 11. The CAASPP was piloted in 2013–14 and first administered statewide in 2014–15. CAASPP scores are ranked according to four “performance levels”: Level 1 indicates that the student has not met the standard tested; Level 2 indicates that the student has nearly met the standard; Level 3 indicates that the student has met the standard; Level 4 indicates that the student has ex-ceeded the standard. Students scoring at Levels 3 and 4 have met state standards in that content area.
Note: In the tables that follow the number of students tested includes students who did not receive a score; however, achievement-level percentages have been calculated using only those students who did receive scores. CAASPP: All Students, 2014–15
The following table shows the percentage of all students tested whose CAASPP scores indicate that they met or exceeded the state stand-ards for English language arts and mathematics.
Subject Area Percentage of Students Meeting or Exceeding State Standards
School District State English Language Arts/Literacy (Grades 3–8, 11) 42 50 44 Mathematics (Grades 3–8, 11) 24 41 33
Note: A dash (—) indicates the number of students tested is 10 or less; percentages are not calculated either because the result is too small for statistical ac-curacy or to protect student privacy. An “n/a” indicates no data are available.
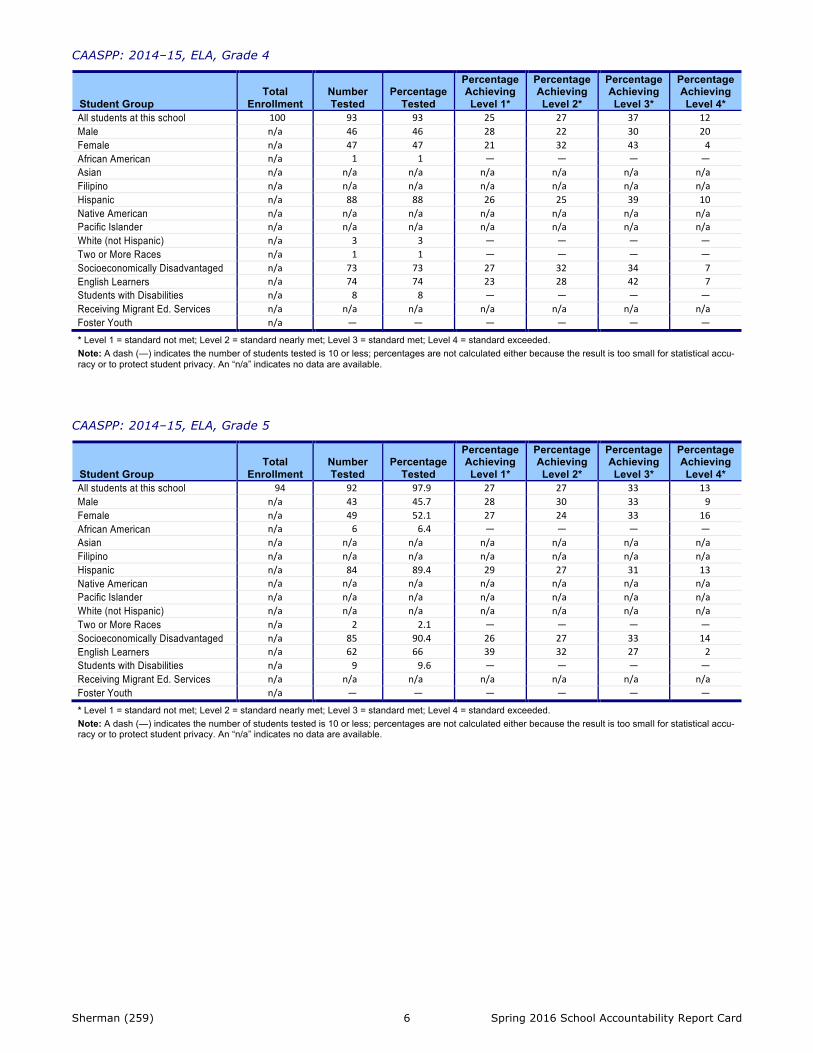
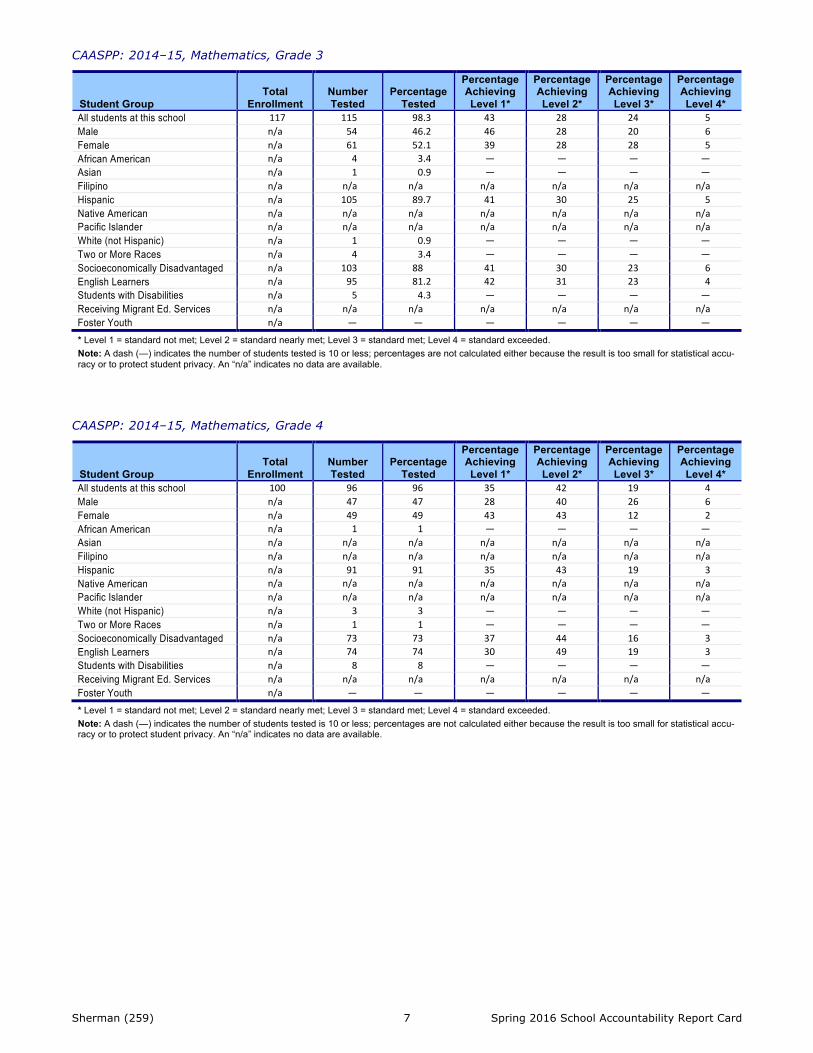
The following tables show the 2014–15 CAASPP results of students in each grade tested, disaggregated by student group, for both English language arts/literacy (ELA) and mathematics.
CAASPP: 2014–15, ELA, Grade 3
Student Group Total
Enrollment Number Tested
Percentage Tested
Percentage Achieving Level 1*
Percentage Achieving Level 2*
Percentage Achieving Level 3*
Percentage Achieving Level 4*
All students at this school 117 114 97.4 25 40 12 21Male n/a 54 46.2 35 41 7 17Female n/a 60 51.3 17 40 17 25African American n/a 4 3.4 — — — —Asian n/a 1 0.9 — — — —Filipino n/a n/a n/a n/a n/a n/a n/aHispanic n/a 104 88.9 26 41 13 19Native American n/a n/a n/a n/a n/a n/a n/aPacific Islander n/a n/a n/a n/a n/a n/a n/aWhite (not Hispanic) n/a 1 0.9 — — — —Two or More Races n/a 4 3.4 — — — —Socioeconomically Disadvantaged n/a 102 87.2 25 42 12 22English Learners n/a 94 80.3 28 40 15 17Students with Disabilities n/a 5 4.3 — — — —Receiving Migrant Ed. Services n/a n/a n/a n/a n/a n/a n/aFoster Youth n/a — — — — — —
* Level 1 = standard not met; Level 2 = standard nearly met; Level 3 = standard met; Level 4 = standard exceeded. Note: A dash (—) indicates the number of students tested is 10 or less; percentages are not calculated either because the result is too small for statistical accu-racy or to protect student privacy. An “n/a” indicates no data are available.
Sherman (259) 6 Spring 2016 School Accountability Report Card
CAASPP: 2014–15, ELA, Grade 4
Student Group Total
Enrollment Number Tested
Percentage Tested
Percentage Achieving Level 1*
Percentage Achieving Level 2*
Percentage Achieving Level 3*
Percentage Achieving Level 4*
All students at this school 100 93 93 25 27 37 12Male n/a 46 46 28 22 30 20Female n/a 47 47 21 32 43 4African American n/a 1 1 — — — —Asian n/a n/a n/a n/a n/a n/a n/aFilipino n/a n/a n/a n/a n/a n/a n/aHispanic n/a 88 88 26 25 39 10Native American n/a n/a n/a n/a n/a n/a n/aPacific Islander n/a n/a n/a n/a n/a n/a n/aWhite (not Hispanic) n/a 3 3 — — — —Two or More Races n/a 1 1 — — — —Socioeconomically Disadvantaged n/a 73 73 27 32 34 7English Learners n/a 74 74 23 28 42 7Students with Disabilities n/a 8 8 — — — —Receiving Migrant Ed. Services n/a n/a n/a n/a n/a n/a n/aFoster Youth n/a — — — — — —
* Level 1 = standard not met; Level 2 = standard nearly met; Level 3 = standard met; Level 4 = standard exceeded. Note: A dash (—) indicates the number of students tested is 10 or less; percentages are not calculated either because the result is too small for statistical accu-racy or to protect student privacy. An “n/a” indicates no data are available.
CAASPP: 2014–15, ELA, Grade 5
Student Group Total
Enrollment Number Tested
Percentage Tested
Percentage Achieving Level 1*
Percentage Achieving Level 2*
Percentage Achieving Level 3*
Percentage Achieving Level 4*
All students at this school 94 92 97.9 27 27 33 13Male n/a 43 45.7 28 30 33 9Female n/a 49 52.1 27 24 33 16African American n/a 6 6.4 — — — —Asian n/a n/a n/a n/a n/a n/a n/aFilipino n/a n/a n/a n/a n/a n/a n/aHispanic n/a 84 89.4 29 27 31 13Native American n/a n/a n/a n/a n/a n/a n/aPacific Islander n/a n/a n/a n/a n/a n/a n/aWhite (not Hispanic) n/a n/a n/a n/a n/a n/a n/aTwo or More Races n/a 2 2.1 — — — —Socioeconomically Disadvantaged n/a 85 90.4 26 27 33 14English Learners n/a 62 66 39 32 27 2Students with Disabilities n/a 9 9.6 — — — —Receiving Migrant Ed. Services n/a n/a n/a n/a n/a n/a n/aFoster Youth n/a — — — — — —
* Level 1 = standard not met; Level 2 = standard nearly met; Level 3 = standard met; Level 4 = standard exceeded. Note: A dash (—) indicates the number of students tested is 10 or less; percentages are not calculated either because the result is too small for statistical accu-racy or to protect student privacy. An “n/a” indicates no data are available.
Sherman (259) 7 Spring 2016 School Accountability Report Card
CAASPP: 2014–15, Mathematics, Grade 3
Student Group Total
Enrollment Number Tested
Percentage Tested
Percentage Achieving Level 1*
Percentage Achieving Level 2*
Percentage Achieving Level 3*
Percentage Achieving Level 4*
All students at this school 117 115 98.3 43 28 24 5Male n/a 54 46.2 46 28 20 6Female n/a 61 52.1 39 28 28 5African American n/a 4 3.4 — — — —Asian n/a 1 0.9 — — — —Filipino n/a n/a n/a n/a n/a n/a n/aHispanic n/a 105 89.7 41 30 25 5Native American n/a n/a n/a n/a n/a n/a n/aPacific Islander n/a n/a n/a n/a n/a n/a n/aWhite (not Hispanic) n/a 1 0.9 — — — —Two or More Races n/a 4 3.4 — — — —Socioeconomically Disadvantaged n/a 103 88 41 30 23 6English Learners n/a 95 81.2 42 31 23 4Students with Disabilities n/a 5 4.3 — — — —Receiving Migrant Ed. Services n/a n/a n/a n/a n/a n/a n/aFoster Youth n/a — — — — — —
* Level 1 = standard not met; Level 2 = standard nearly met; Level 3 = standard met; Level 4 = standard exceeded. Note: A dash (—) indicates the number of students tested is 10 or less; percentages are not calculated either because the result is too small for statistical accu-racy or to protect student privacy. An “n/a” indicates no data are available.
CAASPP: 2014–15, Mathematics, Grade 4
Student Group Total
Enrollment Number Tested
Percentage Tested
Percentage Achieving Level 1*
Percentage Achieving Level 2*
Percentage Achieving Level 3*
Percentage Achieving Level 4*
All students at this school 100 96 96 35 42 19 4Male n/a 47 47 28 40 26 6Female n/a 49 49 43 43 12 2African American n/a 1 1 — — — —Asian n/a n/a n/a n/a n/a n/a n/aFilipino n/a n/a n/a n/a n/a n/a n/aHispanic n/a 91 91 35 43 19 3Native American n/a n/a n/a n/a n/a n/a n/aPacific Islander n/a n/a n/a n/a n/a n/a n/aWhite (not Hispanic) n/a 3 3 — — — —Two or More Races n/a 1 1 — — — —Socioeconomically Disadvantaged n/a 73 73 37 44 16 3English Learners n/a 74 74 30 49 19 3Students with Disabilities n/a 8 8 — — — —Receiving Migrant Ed. Services n/a n/a n/a n/a n/a n/a n/aFoster Youth n/a — — — — — —
* Level 1 = standard not met; Level 2 = standard nearly met; Level 3 = standard met; Level 4 = standard exceeded. Note: A dash (—) indicates the number of students tested is 10 or less; percentages are not calculated either because the result is too small for statistical accu-racy or to protect student privacy. An “n/a” indicates no data are available.
Sherman (259) 8 Spring 2016 School Accountability Report Card
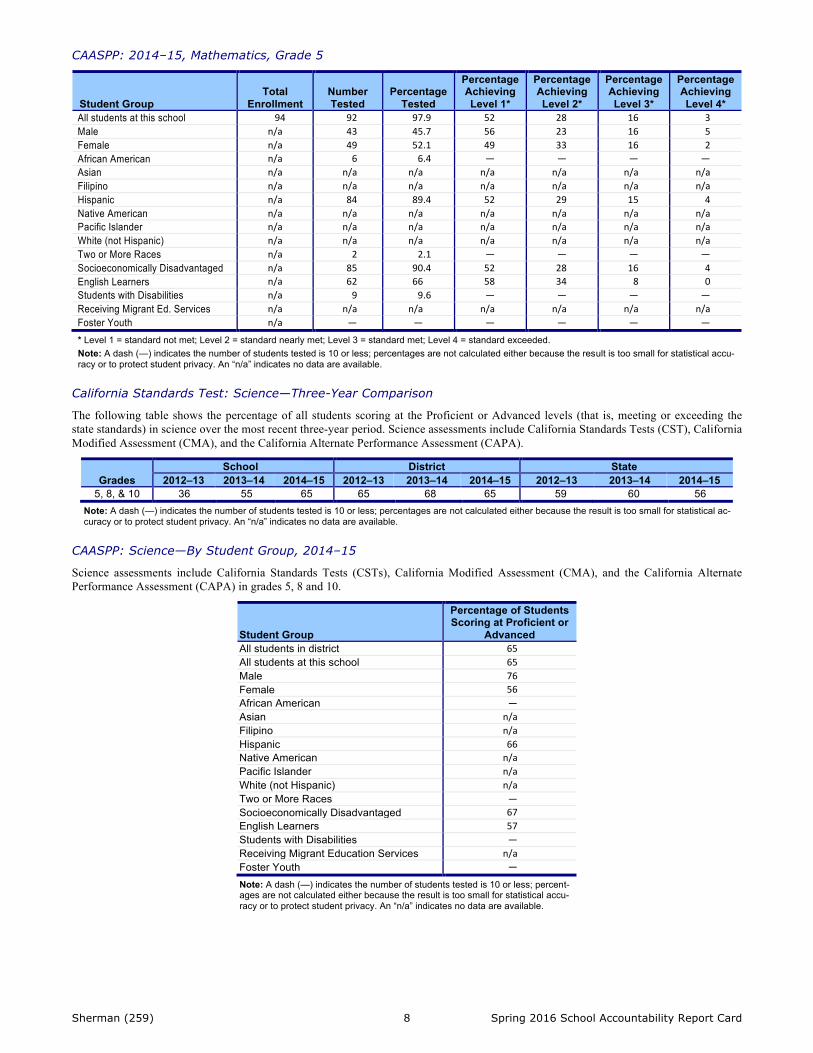
CAASPP: 2014–15, Mathematics, Grade 5
Student Group Total
Enrollment Number Tested
Percentage Tested
Percentage Achieving Level 1*
Percentage Achieving Level 2*
Percentage Achieving Level 3*
Percentage Achieving Level 4*
All students at this school 94 92 97.9 52 28 16 3Male n/a 43 45.7 56 23 16 5Female n/a 49 52.1 49 33 16 2African American n/a 6 6.4 — — — —Asian n/a n/a n/a n/a n/a n/a n/aFilipino n/a n/a n/a n/a n/a n/a n/aHispanic n/a 84 89.4 52 29 15 4Native American n/a n/a n/a n/a n/a n/a n/aPacific Islander n/a n/a n/a n/a n/a n/a n/aWhite (not Hispanic) n/a n/a n/a n/a n/a n/a n/aTwo or More Races n/a 2 2.1 — — — —Socioeconomically Disadvantaged n/a 85 90.4 52 28 16 4English Learners n/a 62 66 58 34 8 0Students with Disabilities n/a 9 9.6 — — — —Receiving Migrant Ed. Services n/a n/a n/a n/a n/a n/a n/aFoster Youth n/a — — — — — —
* Level 1 = standard not met; Level 2 = standard nearly met; Level 3 = standard met; Level 4 = standard exceeded. Note: A dash (—) indicates the number of students tested is 10 or less; percentages are not calculated either because the result is too small for statistical accu-racy or to protect student privacy. An “n/a” indicates no data are available.
California Standards Test: Science—Three-Year Comparison
The following table shows the percentage of all students scoring at the Proficient or Advanced levels (that is, meeting or exceeding the state standards) in science over the most recent three-year period. Science assessments include California Standards Tests (CST), California Modified Assessment (CMA), and the California Alternate Performance Assessment (CAPA).
Grades School District State
2012–13 2013–14 2014–15 2012–13 2013–14 2014–15 2012–13 2013–14 2014–15 5, 8, & 10 36 55 65 65 68 65 59 60 56
Note: A dash (—) indicates the number of students tested is 10 or less; percentages are not calculated either because the result is too small for statistical ac-curacy or to protect student privacy. An “n/a” indicates no data are available.
CAASPP: Science—By Student Group, 2014–15
Science assessments include California Standards Tests (CSTs), California Modified Assessment (CMA), and the California Alternate Performance Assessment (CAPA) in grades 5, 8 and 10.
Student Group
Percentage of Students Scoring at Proficient or
Advanced All students in district 65All students at this school 65Male 76Female 56African American —Asian n/aFilipino n/aHispanic 66Native American n/aPacific Islander n/aWhite (not Hispanic) n/aTwo or More Races —Socioeconomically Disadvantaged 67English Learners 57Students with Disabilities —Receiving Migrant Education Services n/aFoster Youth —
Note: A dash (—) indicates the number of students tested is 10 or less; percent-ages are not calculated either because the result is too small for statistical accu-racy or to protect student privacy. An “n/a” indicates no data are available.
Sherman (259) 9 Spring 2016 School Accountability Report Card
State Priority: Other Pupil Outcomes
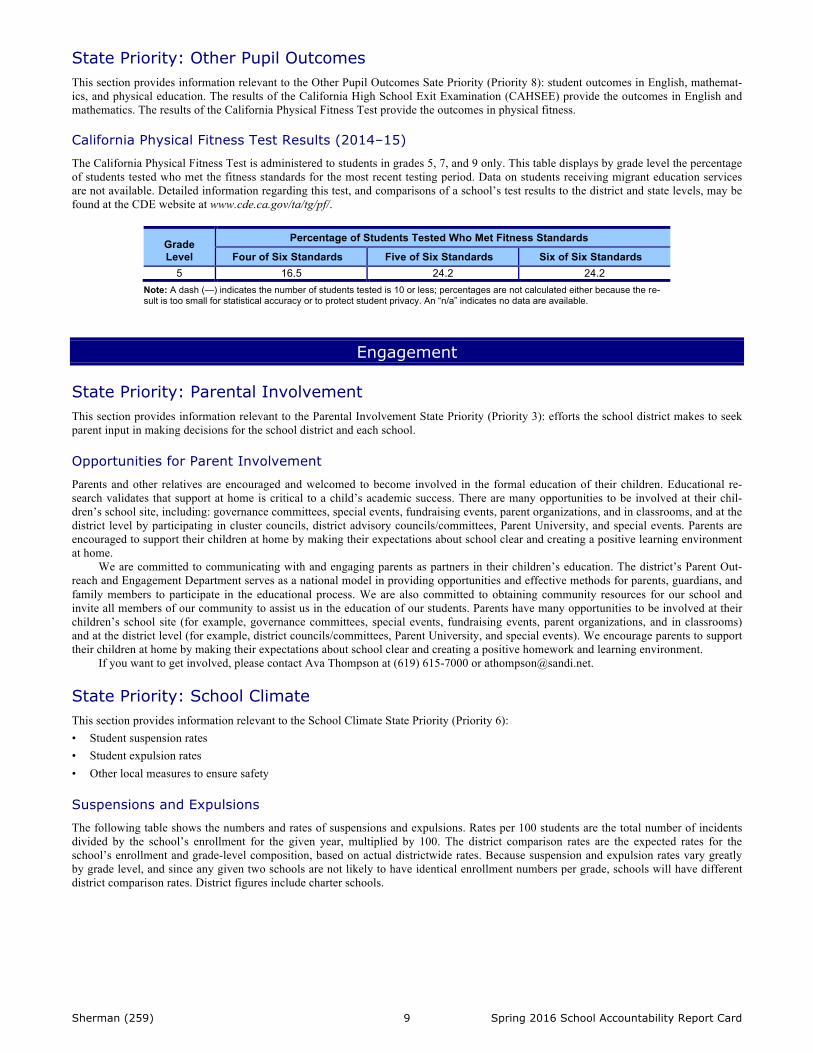
This section provides information relevant to the Other Pupil Outcomes Sate Priority (Priority 8): student outcomes in English, mathemat-ics, and physical education. The results of the California High School Exit Examination (CAHSEE) provide the outcomes in English and mathematics. The results of the California Physical Fitness Test provide the outcomes in physical fitness. California Physical Fitness Test Results (2014–15)
The California Physical Fitness Test is administered to students in grades 5, 7, and 9 only. This table displays by grade level the percentage of students tested who met the fitness standards for the most recent testing period. Data on students receiving migrant education services are not available. Detailed information regarding this test, and comparisons of a school’s test results to the district and state levels, may be found at the CDE website at www.cde.ca.gov/ta/tg/pf/.
Grade Level
Percentage of Students Tested Who Met Fitness Standards
Four of Six Standards Five of Six Standards Six of Six Standards 5 16.5 24.2 24.2
Note: A dash (—) indicates the number of students tested is 10 or less; percentages are not calculated either because the re-sult is too small for statistical accuracy or to protect student privacy. An “n/a” indicates no data are available.
Engagement
State Priority: Parental Involvement This section provides information relevant to the Parental Involvement State Priority (Priority 3): efforts the school district makes to seek parent input in making decisions for the school district and each school. Opportunities for Parent Involvement
Parents and other relatives are encouraged and welcomed to become involved in the formal education of their children. Educational re-search validates that support at home is critical to a child’s academic success. There are many opportunities to be involved at their chil-dren’s school site, including: governance committees, special events, fundraising events, parent organizations, and in classrooms, and at the district level by participating in cluster councils, district advisory councils/committees, Parent University, and special events. Parents are encouraged to support their children at home by making their expectations about school clear and creating a positive learning environment at home.
We are committed to communicating with and engaging parents as partners in their children’s education. The district’s Parent Out-reach and Engagement Department serves as a national model in providing opportunities and effective methods for parents, guardians, and family members to participate in the educational process. We are also committed to obtaining community resources for our school and invite all members of our community to assist us in the education of our students. Parents have many opportunities to be involved at their children’s school site (for example, governance committees, special events, fundraising events, parent organizations, and in classrooms) and at the district level (for example, district councils/committees, Parent University, and special events). We encourage parents to support their children at home by making their expectations about school clear and creating a positive homework and learning environment.
If you want to get involved, please contact Ava Thompson at (619) 615-7000 or [email protected]. State Priority: School Climate This section provides information relevant to the School Climate State Priority (Priority 6): • Student suspension rates • Student expulsion rates • Other local measures to ensure safety Suspensions and Expulsions
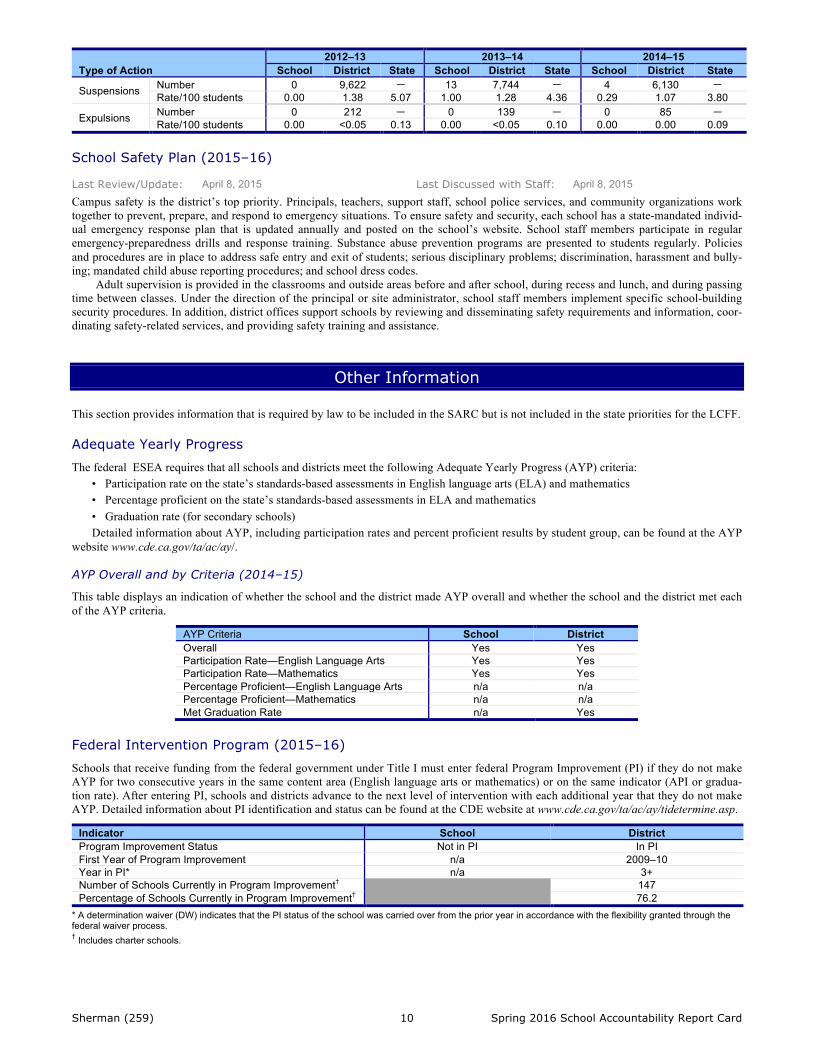
The following table shows the numbers and rates of suspensions and expulsions. Rates per 100 students are the total number of incidents divided by the school’s enrollment for the given year, multiplied by 100. The district comparison rates are the expected rates for the school’s enrollment and grade-level composition, based on actual districtwide rates. Because suspension and expulsion rates vary greatly by grade level, and since any given two schools are not likely to have identical enrollment numbers per grade, schools will have different district comparison rates. District figures include charter schools.
Sherman (259) 10 Spring 2016 School Accountability Report Card
Type of Action 2012–13 2013–14 2014–15
School District State School District State School District State
Suspensions Number 0 9,622 — 13 7,744 — 4 6,130 — Rate/100 students 0.00 1.38 5.07 1.00 1.28 4.36 0.29 1.07 3.80
Expulsions Number 0 212 — 0 139 — 0 85 — Rate/100 students 0.00 <0.05 0.13 0.00 <0.05 0.10 0.00 0.00 0.09
School Safety Plan (2015–16)
Last Review/Update: April 8, 2015 Last Discussed with Staff: April 8, 2015 Campus safety is the district’s top priority. Principals, teachers, support staff, school police services, and community organizations work together to prevent, prepare, and respond to emergency situations. To ensure safety and security, each school has a state-mandated individ-ual emergency response plan that is updated annually and posted on the school’s website. School staff members participate in regular emergency-preparedness drills and response training. Substance abuse prevention programs are presented to students regularly. Policies and procedures are in place to address safe entry and exit of students; serious disciplinary problems; discrimination, harassment and bully-ing; mandated child abuse reporting procedures; and school dress codes.
Adult supervision is provided in the classrooms and outside areas before and after school, during recess and lunch, and during passing time between classes. Under the direction of the principal or site administrator, school staff members implement specific school-building security procedures. In addition, district offices support schools by reviewing and disseminating safety requirements and information, coor-dinating safety-related services, and providing safety training and assistance.
Other Information
This section provides information that is required by law to be included in the SARC but is not included in the state priorities for the LCFF. Adequate Yearly Progress
The federal ESEA requires that all schools and districts meet the following Adequate Yearly Progress (AYP) criteria: • Participation rate on the state’s standards-based assessments in English language arts (ELA) and mathematics • Percentage proficient on the state’s standards-based assessments in ELA and mathematics • Graduation rate (for secondary schools) Detailed information about AYP, including participation rates and percent proficient results by student group, can be found at the AYP
website www.cde.ca.gov/ta/ac/ay/. AYP Overall and by Criteria (2014–15)
This table displays an indication of whether the school and the district made AYP overall and whether the school and the district met each of the AYP criteria.
AYP Criteria School District Overall Yes Yes Participation Rate—English Language Arts Yes Yes Participation Rate—Mathematics Yes Yes Percentage Proficient—English Language Arts n/a n/a Percentage Proficient—Mathematics n/a n/a Met Graduation Rate n/a Yes
Federal Intervention Program (2015–16)
Schools that receive funding from the federal government under Title I must enter federal Program Improvement (PI) if they do not make AYP for two consecutive years in the same content area (English language arts or mathematics) or on the same indicator (API or gradua-tion rate). After entering PI, schools and districts advance to the next level of intervention with each additional year that they do not make AYP. Detailed information about PI identification and status can be found at the CDE website at www.cde.ca.gov/ta/ac/ay/tidetermine.asp.
Indicator School District Program Improvement Status Not in PI In PI First Year of Program Improvement n/a 2009–10 Year in PI* n/a 3+ Number of Schools Currently in Program Improvement†
147
Percentage of Schools Currently in Program Improvement† 76.2 * A determination waiver (DW) indicates that the PI status of the school was carried over from the prior year in accordance with the flexibility granted through the federal waiver process. † Includes charter schools.
Sherman (259) 11 Spring 2016 School Accountability Report Card
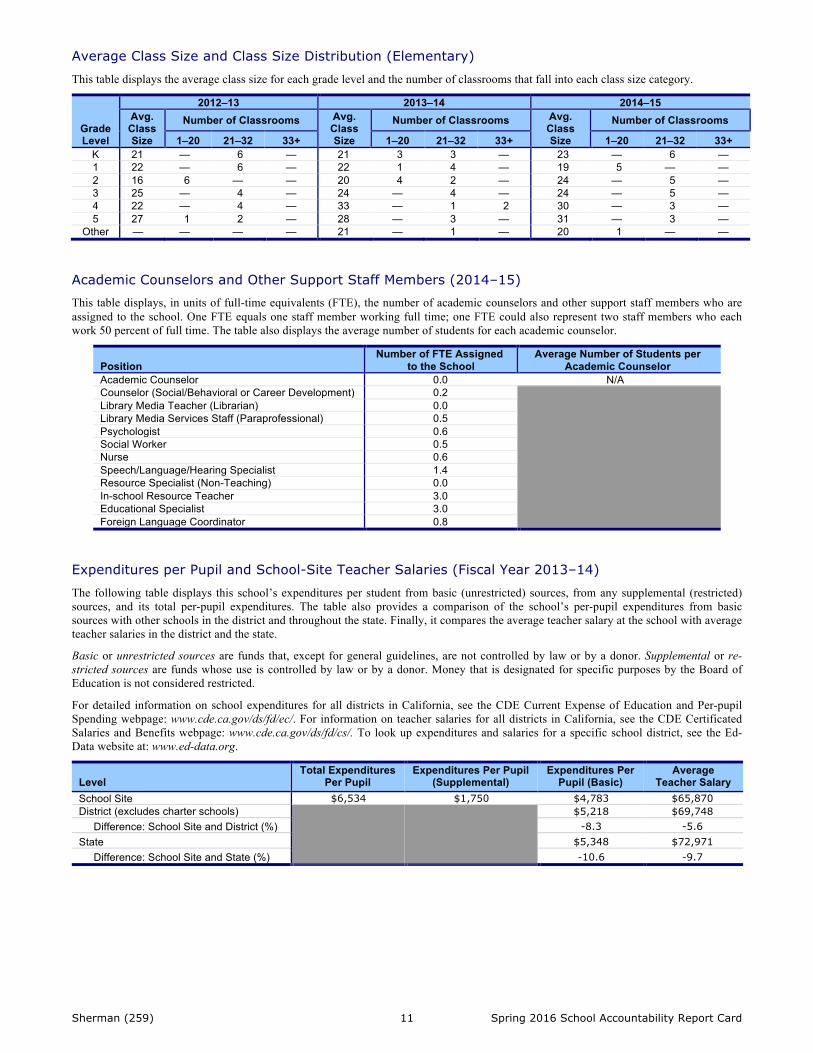
Average Class Size and Class Size Distribution (Elementary)
This table displays the average class size for each grade level and the number of classrooms that fall into each class size category.
Grade Level
2012–13 2013–14 2014–15 Avg. Class Size
Number of Classrooms Avg. Class Size
Number of Classrooms Avg. Class Size
Number of Classrooms
1–20 21–32 33+ 1–20 21–32 33+ 1–20 21–32 33+ K 21 — 6 — 21 3 3 — 23 — 6 — 1 22 — 6 — 22 1 4 — 19 5 — — 2 16 6 — — 20 4 2 — 24 — 5 — 3 25 — 4 — 24 — 4 — 24 — 5 — 4 22 — 4 — 33 — 1 2 30 — 3 — 5 27 1 2 — 28 — 3 — 31 — 3 —
Other — — — — 21 — 1 — 20 1 — — Academic Counselors and Other Support Staff Members (2014–15) This table displays, in units of full-time equivalents (FTE), the number of academic counselors and other support staff members who are assigned to the school. One FTE equals one staff member working full time; one FTE could also represent two staff members who each work 50 percent of full time. The table also displays the average number of students for each academic counselor.
Position Number of FTE Assigned
to the School Average Number of Students per
Academic Counselor Academic Counselor 0.0 N/A Counselor (Social/Behavioral or Career Development) 0.2
Library Media Teacher (Librarian) 0.0 Library Media Services Staff (Paraprofessional) 0.5 Psychologist 0.6 Social Worker 0.5 Nurse 0.6 Speech/Language/Hearing Specialist 1.4 Resource Specialist (Non-Teaching) 0.0 In-school Resource Teacher 3.0 Educational Specialist 3.0 Foreign Language Coordinator 0.8
Expenditures per Pupil and School-Site Teacher Salaries (Fiscal Year 2013–14)
The following table displays this school’s expenditures per student from basic (unrestricted) sources, from any supplemental (restricted) sources, and its total per-pupil expenditures. The table also provides a comparison of the school’s per-pupil expenditures from basic sources with other schools in the district and throughout the state. Finally, it compares the average teacher salary at the school with average teacher salaries in the district and the state.
Basic or unrestricted sources are funds that, except for general guidelines, are not controlled by law or by a donor. Supplemental or re-stricted sources are funds whose use is controlled by law or by a donor. Money that is designated for specific purposes by the Board of Education is not considered restricted.
For detailed information on school expenditures for all districts in California, see the CDE Current Expense of Education and Per-pupil Spending webpage: www.cde.ca.gov/ds/fd/ec/. For information on teacher salaries for all districts in California, see the CDE Certificated Salaries and Benefits webpage: www.cde.ca.gov/ds/fd/cs/. To look up expenditures and salaries for a specific school district, see the Ed-Data website at: www.ed-data.org.
Level Total Expenditures
Per Pupil Expenditures Per Pupil
(Supplemental) Expenditures Per
Pupil (Basic) Average
Teacher Salary School Site $6,534 $1,750 $4,783 $65,870 District (excludes charter schools)
$5,218 $69,748 Difference: School Site and District (%) -8.3 -5.6 State $5,348 $72,971 Difference: School Site and State (%) -10.6 -9.7
Sherman (259) 12 Spring 2016 School Accountability Report Card
Types of Services Funded (Fiscal Year 2014–15)
The district’s general fund includes monies for: • General operations—salaries, benefits, services, materials, and support to the general education • Special Education—programs offering appropriate, individualized instruction to students with special needs • Special projects—monies from agencies (federal or state) earmarked for specific programs/projects or services • Transportation • Maintenance and operations • District administration Each school in the district receives an instructional budget based on enrollment, programs, and formulas set by Board of Education pol-
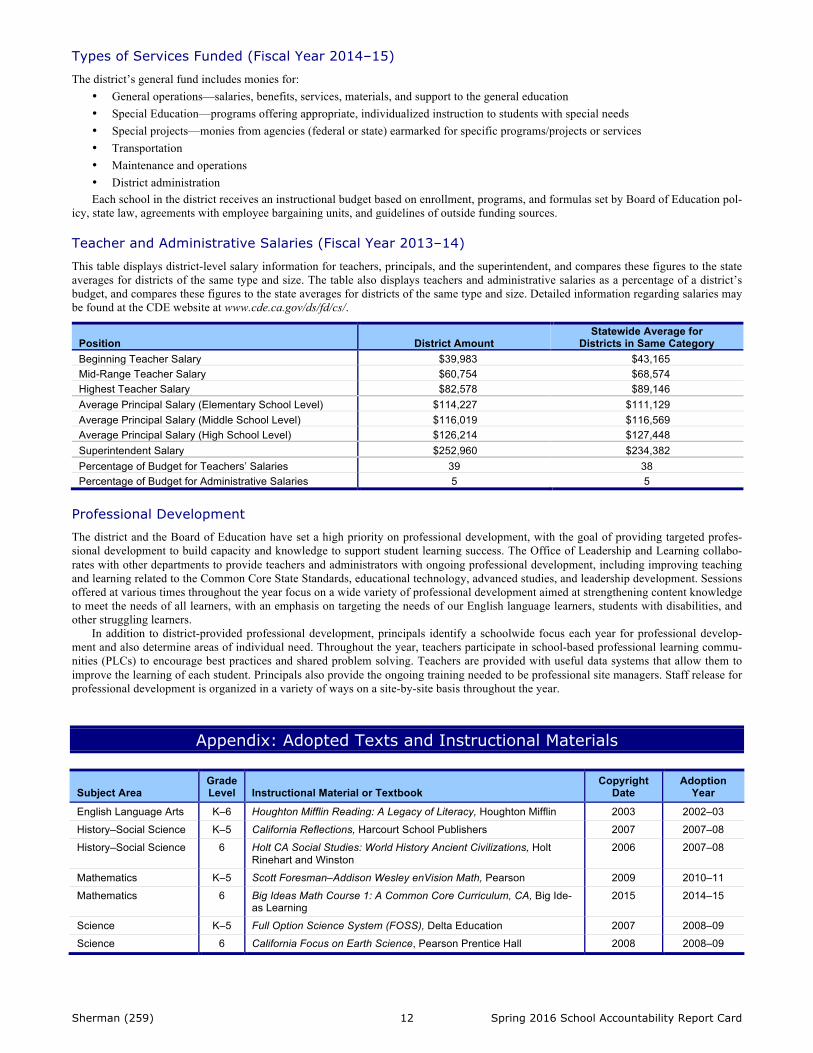
icy, state law, agreements with employee bargaining units, and guidelines of outside funding sources. Teacher and Administrative Salaries (Fiscal Year 2013–14)
This table displays district-level salary information for teachers, principals, and the superintendent, and compares these figures to the state averages for districts of the same type and size. The table also displays teachers and administrative salaries as a percentage of a district’s budget, and compares these figures to the state averages for districts of the same type and size. Detailed information regarding salaries may be found at the CDE website at www.cde.ca.gov/ds/fd/cs/.
Position District Amount Statewide Average for
Districts in Same Category Beginning Teacher Salary $39,983 $43,165 Mid-Range Teacher Salary $60,754 $68,574 Highest Teacher Salary $82,578 $89,146 Average Principal Salary (Elementary School Level) $114,227 $111,129 Average Principal Salary (Middle School Level) $116,019 $116,569 Average Principal Salary (High School Level) $126,214 $127,448 Superintendent Salary $252,960 $234,382 Percentage of Budget for Teachers’ Salaries 39 38 Percentage of Budget for Administrative Salaries 5 5
Professional Development The district and the Board of Education have set a high priority on professional development, with the goal of providing targeted profes-sional development to build capacity and knowledge to support student learning success. The Office of Leadership and Learning collabo-rates with other departments to provide teachers and administrators with ongoing professional development, including improving teaching and learning related to the Common Core State Standards, educational technology, advanced studies, and leadership development. Sessions offered at various times throughout the year focus on a wide variety of professional development aimed at strengthening content knowledge to meet the needs of all learners, with an emphasis on targeting the needs of our English language learners, students with disabilities, and other struggling learners.
In addition to district-provided professional development, principals identify a schoolwide focus each year for professional develop-ment and also determine areas of individual need. Throughout the year, teachers participate in school-based professional learning commu-nities (PLCs) to encourage best practices and shared problem solving. Teachers are provided with useful data systems that allow them to improve the learning of each student. Principals also provide the ongoing training needed to be professional site managers. Staff release for professional development is organized in a variety of ways on a site-by-site basis throughout the year.
Appendix: Adopted Texts and Instructional Materials
Subject Area Grade Level Instructional Material or Textbook
Copyright Date
Adoption Year
English Language Arts K–6 Houghton Mifflin Reading: A Legacy of Literacy, Houghton Mifflin 2003 2002–03 History–Social Science K–5 California Reflections, Harcourt School Publishers 2007 2007–08 History–Social Science 6 Holt CA Social Studies: World History Ancient Civilizations, Holt
Rinehart and Winston 2006 2007–08
Mathematics K–5 Scott Foresman–Addison Wesley enVision Math, Pearson 2009 2010–11 Mathematics 6 Big Ideas Math Course 1: A Common Core Curriculum, CA, Big Ide-
as Learning 2015 2014–15
Science K–5 Full Option Science System (FOSS), Delta Education 2007 2008–09 Science 6 California Focus on Earth Science, Pearson Prentice Hall 2008 2008–09