Embed Size (px)
Citation preview


2015 Annual CCR Impoundment and Landfill Inspection Report 5 January, 2016 APS Cholla Power Plant
2.0 SITE BACKGROUND AND INSPECTION CONDITIONS
The Cholla Power Plant is located nine miles west of Holbrook, Arizona. The plant is located in the north half of Section 23, Township 18 North, Range 19 East in Navajo County, adjacent to and north of the Little Colorado River. The plant site and off-site facilities comprise portions of Sections 22 through 27 in Township 18 North, Range 19 East and Section 30 in Township 18 North, Range 20 East. The plant began operation of Unit 1 at the site in 1961 and Units 2, 3 and 4 were constructed between 1976 and 1981. Three operational units (Units 1, 3, and 4) currently burn low sulfur coal to provide a total net generating capacity of 1,027 megawatts (MW). Unit 2 was removed from service on October 1, 2015.
The coal combustion process produces bottom ash (silty sand, SM) and fly ash (low plasticity silt, ML). The plant has three coal combustion waste impoundments: the Bottom Ash Pond and the Fly Ash Pond are used for ash disposal and the Sedimentation Pond collects water from drains located on the plant site and receives minimal amounts of coal combustion byproducts in storm water, process water, and plant washdown from the west side of the plant. The Bottom Ash Monofill is a coal combustion waste landfill used for long-term storage and disposal of dewatered bottom ash transferred from the Bottom Ash Pond. These coal combustion waste facilities are the subject of this inspection report.
The inspection was conducted on Thursday and Friday, October 15 and 16, 2015. Conditions were warm (60-80 degrees Fahrenheit) with clear skies. Winds were light in the morning before increasing mid-afternoon. Heavy rain started at approximately 3 pm on Friday afternoon. Approximately 11 inches of precipitation had fallen since the start of the year.
Instrumentation at the dams generally consists of open standpipe PVC piezometers, open well points, simulated weirs, flow meters with totalizers, and brass survey caps on a concrete base measured using a Global Positioning Survey System (GPS). Water levels in the piezometers are measured with an electronic water level indicator attached to a cable stamped with one-foot increments. Water levels at the Bottom Ash and Fly Ash Ponds are measured by an elevation indicator set at the edge of the water and are based on NAVD 29.
The benchmark for the elevations reported for GPS surveys of the settlement monuments at the Cholla Power Plant is based on the Randell 2 monument located on the north side of the Joseph City I-40 overpass. Detailed information of Randell 2 can be found on the National Geodetic Survey (NGS) website. The latitude and longitude of the monument are based on the NGVD29 datum. The NGS lists the elevation of the monument as 5085.5 feet (NGVD29).

2015 Annual CCR Impoundment and Landfill Inspection Report 6 January, 2016 APS Cholla Power Plant
3.0 IMPOUNDMENT DESCRIPTIONS
APS will complete a structural integrity assessment for each subject CCR unit in accordance with the requirements and timeframes contained in Environmental Protection Agency’s (EPA) Hazardous and Solid Waste Management System; Disposal of Coal Combustion Residuals From Electric Utilities; Final Rule (2015). AECOM has assembled original construction and permitting data, and subsequent geotechnical analyses and reports. These historic data have been reviewed as a part of this annual inspection and will be used to develop the structural integrity assessment. No findings of significance to this annual inspection have been identified as a part of this review of historic data. The relevant aspects of the historic data will be incorporated into the Structural Integrity Assessment Reports for each unit in accordance with the requirements of the Final Rule. 3.1 FLY ASH DAM The Fly Ash Dam is represented on Figure 1- Fly Ash Pond Site Map.
ADWR Dam #09.28 was constructed between 1976 and 1978, has a capacity of 18,000 acre-feet, is approximately 80 feet high with approximately 4,583 feet of clay core zoned earth embankment, and has a Federal Emergency Management Agency (FEMA) rating of intermediate size and high hazard. The maximum operating water level is 5,114 feet above mean sea level (MSL) and the water level was measured by survey in September 2015 to be at elevation (EL) 5099.4 feet.
3.2 BOTTOM ASH POND DAM The Bottom Ash Dam is represented on Figure 2- Bottom Ash Pond Site Map.
ADWR Dam #09.27 was constructed between 1976 and 1978, has a capacity of 2,300 acre-feet, is approximately 73 feet high with 4,040 feet of clay core zoned earth embankment, and has a FEMA rating of intermediate size and high hazard. The maximum operating water level is 5,117.8 feet above MSL and the water level was measured by APS be at approximate EL 5108.60 feet at the time of the 2015 inspection.
In 1993, the pond was re-permitted to a new operating level 5,118.6 feet above MSL (NAVD 29). In 1997, a reassessment of the flood pool allocation revealed the need to lower the operating level to 5,117.8 feet above MSL (NAVD 29). In April 1999, APS obtained a major modification of ADEQ APP permit, File No. 100568; the permit was to expand the bottom ash disposal operation to a landfill (the Bottom Ash Monofill) for dewatered bottom ash on 40 acres to the north and east sides of the Bottom Ash Pond.
3.3 SEDIMENTATION POND DAM The Sedimentation Pond Dam is represented on Figure 3 – Sedimentation Pond Site Map The Sedimentation Pond is a sub-grade holding pond that was placed into service in 1976. It has two cells with a maximum depth of 10 feet, a surface area of about 1.6 acres, a total capacity of

2015 Annual CCR Impoundment and Landfill Inspection Report 7 January, 2016 APS Cholla Power Plant
about 10.7 acre-feet. The east cell water level was observed to be at approximate EL 5016.0 feet during the inspection.
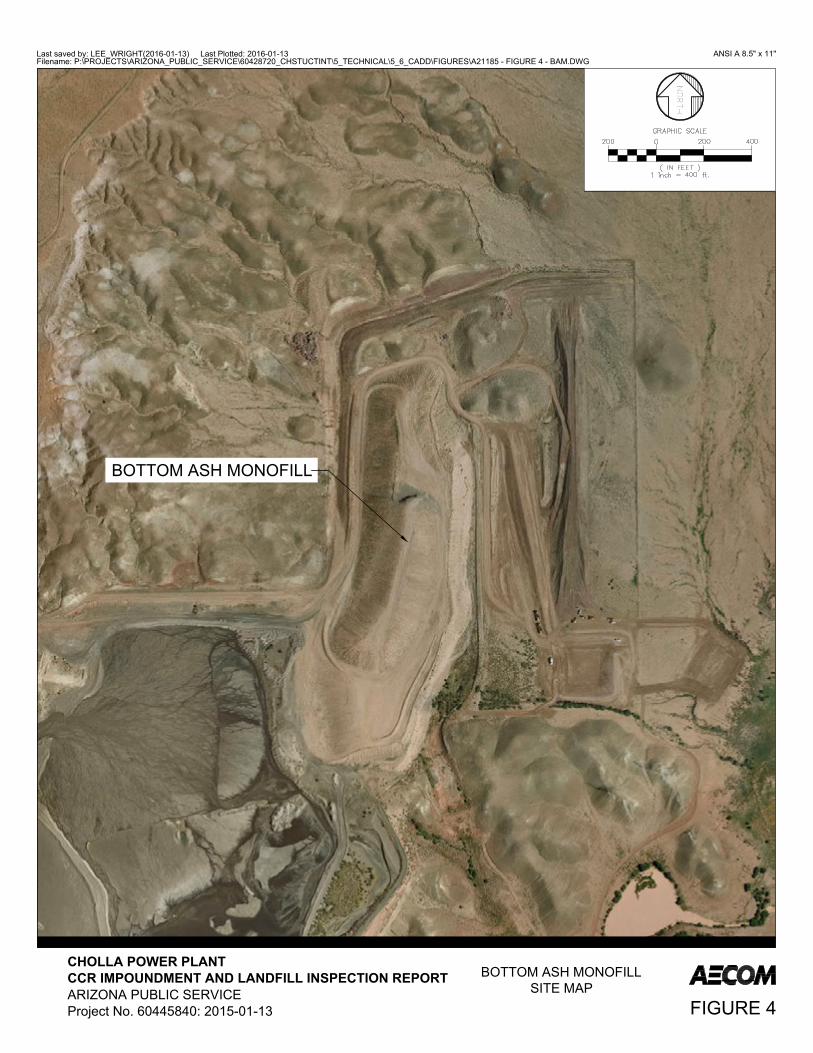
3.4 BOTTOM ASH MONOFILL The Bottom Ash Monofill is represented on Figure 4 – Bottom Ash Monofill Site Map The Bottom Ash Monofill is a coal combustion waste landfill that was constructed beginning in the late 1990s. In 2009, an amendment to Cholla Plant Aquifer Protection Permit No. P-100568 was executed by Arizona Department of Environmental Quality (ADEQ) for the currently-permitted 43-acre footprint and maximum storage elevation of 5,261 feet above mean sea level, with final slopes of 3H:1V. Storm water run on is diverted around the landfill by a diversion ditch sized to convey the peak 100-year flow. On-site storm water runoff is conveyed to a retention basin for eventual routing to the Bottom Ash Pond. The retention basin has a capacity of 8.2 acre-feet with an overall depth of 12 feet and 3H:1V side slopes.
In 2015, the Bottom Ash Monofill was expanded to the north and east to its maximum APP-permitted footprint to add capacity for continuing operations at the Plant.

2015 Annual CCR Impoundment and Landfill Inspection Report 8 January, 2016 APS Cholla Power Plant
4.0 FIELD INSPECTIONS
This section contains the 2015 annual field inspections conducted by a team consisting of APS and AECOM engineers at the Fly Ash Dam (Section 4.1), the Bottom Ash Dam (Section 4.2), the Sedimentation Pond Dam (Section 4.3), and the Bottom Ash Monofill (Section 4.4). The results are reprinted and formatted to fit this report.

2015 Annual CCR Impoundment and Landfill Inspection Report 9 January, 2016 APS Cholla Power Plant
4.1 APS FIELD INSPECTION – FLY ASH DAM/IMPOUNDMENT
Fly Ash Dam/Impoundment SID: 09.28
SID: 09.28 Dam Name: Cholla Fly Ash Dam/Impoundment
Type: Earth Purpose: Fly ash disposal
Not A
pplicable
No
Yes
Monitor
Repair
Investigate
Contact(s): Byron Conrad, P.E. (APS) Report Date: December 30, 2015
Inspected by: Alexander W. Gourlay, P.E. (AECOM) Byron Conrad, P.E. (APS) Inspection Date: October 16, 2015
Reviewed by: Byron Conrad, P.E. (APS) Date: January 4, 2016
Design Dam Crest Elevation (ft): 5,120 Design Spillway Crest Elevation: None
Design Total Freeboard (ft): 6 Measured Total Freeboard (ft): N/A
Statutory Dam Height (ft): 80 Structural Height (ft): 80
Dam Crest Length (ft): 4,583 Upstream Slope: 3:1 Downstream Slope: 3:1
Dam Crest Width (ft): 24
Lat: 34° 56' 10.0"
Water Rights: N/A
Long: 110° 16' 06.0"
Reservoir Area (acres): 420 Reservoir Storage (ac-ft): 18,000
Inflow Design Flood/Safe Flood-Passing Capacity: PMF – fully contained
Reservoir Level During Inspection (ft): 5099.4 (09-15 survey), compared to 5096.19 the year prior. Photos: Yes Page: 1 of 4

2015 Annual CCR Impoundment and Landfill Inspection Report 10 January, 2016 APS Cholla Power Plant
Fly Ash Dam/Impoundment SID: 09.28
N/A
No
Yes
Mon
Rep
Inv
COMPLIANCE CHECKLIST
1 CONDITION SUMMARY/LICENSE/EAP/NEXT INSPECTION
a Recorded downstream hazard: High Should hazard be revised? X
b If high hazard, estimate downstream persons-at-risk (PAR): 30-300 Is there a significant increase since the last inspection? X
c Recorded size: Intermediate Should size be revised? X d Any safety deficiencies? No Describe: X e Any statute or rule violations? No Describe and list required action: X f Safe storage level on License: 5,114 feet Should level be revised: X g Any License violations? No Describe and list required action: X h Date of current License: 10/21/1986 Should new License be issued? X i Date of last Emergency Action Plan revision: 12/1/2011 Should EAP be revised? X j Any Agency actions? No Describe and list required action: X k Normal inspection frequency: Annually Should inspection frequency be revised? X l Recommended date for next inspection: October 2016 for next annual inspection
MONITORING CHECKLIST
2 INSTRUMENTATION AND MONITORING
a Describe:
1) A review of the file indicates 37 piezometers and wells in and around the embankment.
2) Settlement monuments located along the crest.
3) Water level gauge in the reservoir (submerged by rising pond level in 2015, needs to be re-established) 4) Flow measurement devices at each downstream sump to estimate seepage rates and on the return lines to the reservoir.
b Any repair or replacement required? Yes. Describe: The PVC of piezometer F-35 is exposed (prior report, no photo). X X
Re-establish water level gauge to record higher pond levels. X X
c Date of last monitoring report: April 2015 (Annual Report to ADWR for 2014)
Should new readings be taken and new report provided? Annual reporting is required. X
DAM EMBANKMENT CHECKLIST
3 DAM CREST
a Settlements, slides, depressions? X b Misalignment? X c Longitudinal/Transverse cracking? X
d Animal burrows? Observed, but at low frequency. See Photos FAP 10, FAP 17, and IMG-2148. Continue to monitor and implement deterrent measures if frequency increases.
X X
e Adverse vegetation? X f Erosion? X 4 UPSTREAM SLOPE
a Erosion? X b Inadequate ground cover? X c Adverse vegetation? Shrubs and other vegetation observed. See Photo FAP 16 and FAP 22. X X d Longitudinal/Transverse cracking? X e Inadequate riprap? X f Stone deterioration? X g Settlements, slides, depressions, bulges? X
2015 Annual CCR Impoundment and Landfill Inspection Report 11 January, 2016 APS Cholla Power Plant
Fly Ash Dam/Impoundment SID: 09.28
N/A
No
Yes
Mon
Rep
Inv
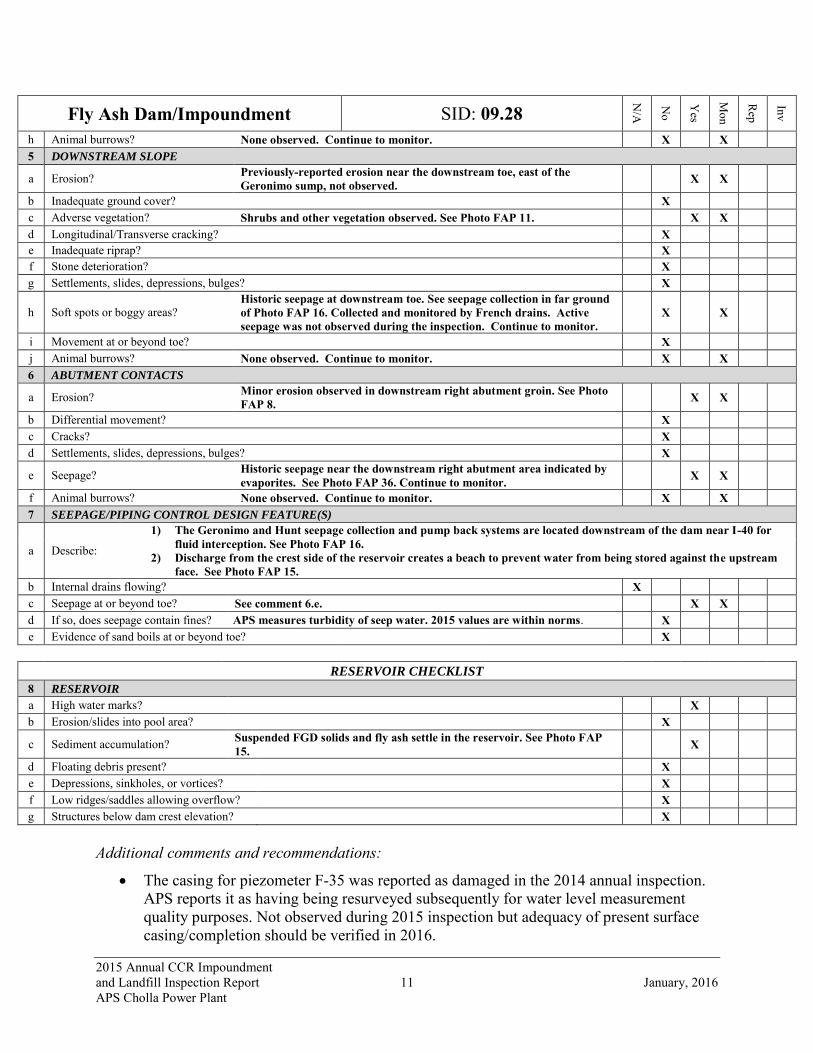
h Animal burrows? None observed. Continue to monitor. X X 5 DOWNSTREAM SLOPE
a Erosion? Previously-reported erosion near the downstream toe, east of the Geronimo sump, not observed. X X
b Inadequate ground cover? X c Adverse vegetation? Shrubs and other vegetation observed. See Photo FAP 11. X X d Longitudinal/Transverse cracking? X e Inadequate riprap? X f Stone deterioration? X g Settlements, slides, depressions, bulges? X
h Soft spots or boggy areas? Historic seepage at downstream toe. See seepage collection in far ground of Photo FAP 16. Collected and monitored by French drains. Active seepage was not observed during the inspection. Continue to monitor.
X X
i Movement at or beyond toe? X j Animal burrows? None observed. Continue to monitor. X X 6 ABUTMENT CONTACTS
a Erosion? Minor erosion observed in downstream right abutment groin. See Photo FAP 8. X X
b Differential movement? X c Cracks? X d Settlements, slides, depressions, bulges? X
e Seepage? Historic seepage near the downstream right abutment area indicated by evaporites. See Photo FAP 36. Continue to monitor. X X
f Animal burrows? None observed. Continue to monitor. X X 7 SEEPAGE/PIPING CONTROL DESIGN FEATURE(S)
a Describe:
1) The Geronimo and Hunt seepage collection and pump back systems are located downstream of the dam near I-40 for fluid interception. See Photo FAP 16.
2) Discharge from the crest side of the reservoir creates a beach to prevent water from being stored against the upstream face. See Photo FAP 15.
b Internal drains flowing? X c Seepage at or beyond toe? See comment 6.e. X X d If so, does seepage contain fines? APS measures turbidity of seep water. 2015 values are within norms. X e Evidence of sand boils at or beyond toe? X
RESERVOIR CHECKLIST
8 RESERVOIR
a High water marks? X b Erosion/slides into pool area? X
c Sediment accumulation? Suspended FGD solids and fly ash settle in the reservoir. See Photo FAP 15. X
d Floating debris present? X e Depressions, sinkholes, or vortices? X f Low ridges/saddles allowing overflow? X g Structures below dam crest elevation? X
Additional comments and recommendations:
The casing for piezometer F-35 was reported as damaged in the 2014 annual inspection. APS reports it as having being resurveyed subsequently for water level measurement quality purposes. Not observed during 2015 inspection but adequacy of present surface casing/completion should be verified in 2016.
2015 Annual CCR Impoundment and Landfill Inspection Report 12 January, 2016 APS Cholla Power Plant
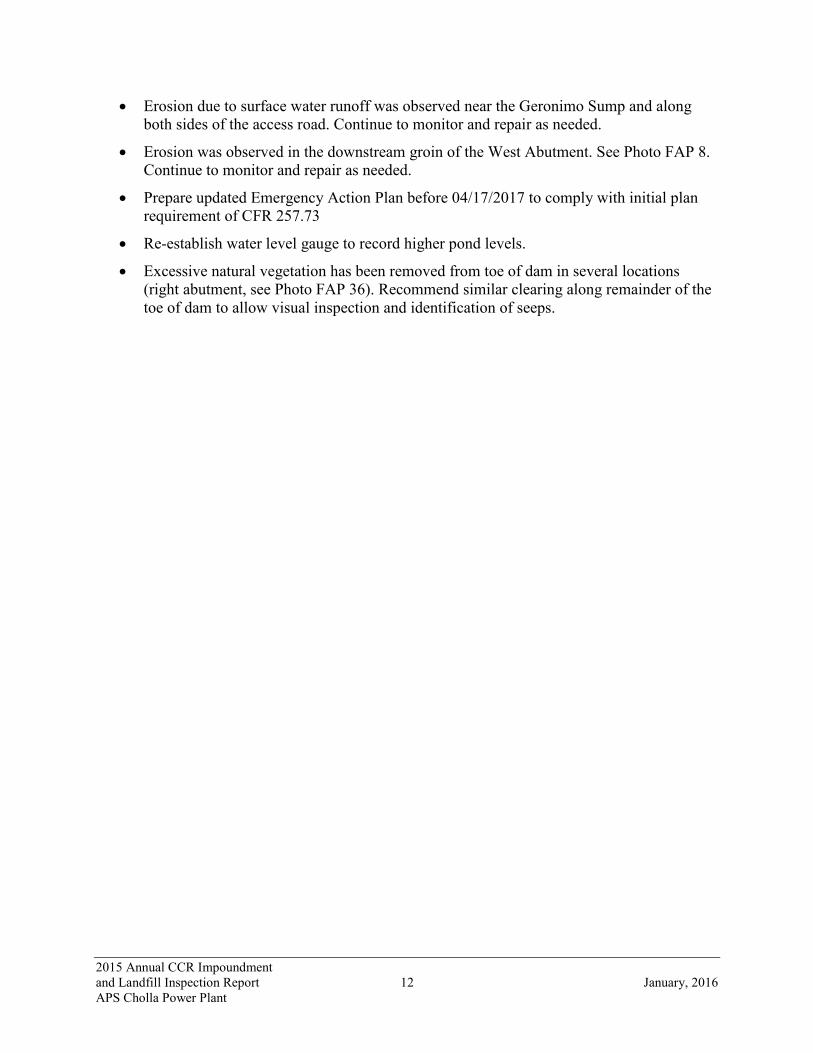
Erosion due to surface water runoff was observed near the Geronimo Sump and along both sides of the access road. Continue to monitor and repair as needed.
Erosion was observed in the downstream groin of the West Abutment. See Photo FAP 8. Continue to monitor and repair as needed.
Prepare updated Emergency Action Plan before 04/17/2017 to comply with initial plan requirement of CFR 257.73
Re-establish water level gauge to record higher pond levels.
Excessive natural vegetation has been removed from toe of dam in several locations (right abutment, see Photo FAP 36). Recommend similar clearing along remainder of the toe of dam to allow visual inspection and identification of seeps.

2015 Annual CCR Impoundment and Landfill Inspection Report 13 January, 2016 APS Cholla Power Plant
4.2 APS FIELD INSPECTION – BOTTOM ASH DAM
Bottom Ash Dam/Impoundment SID: 09.27
SID: 09.27 Dam Name: Cholla Bottom Ash Dam/Impoundment
Type: Earth Purpose: Bottom ash containment
Not A
pplicable
No
Yes
Monitor
Repair
Investigate
Contact(s): Byron Conrad, P.E. (APS) Report Date: December 30, 2015
Inspected by: Alexander W. Gourlay, P.E. (AECOM) Byron Conrad, P.E. (APS) Inspection Date: October 16, 2015
Reviewed by: Byron Conrad, P.E. (APS) Date: January 4, 2015
Design Dam Crest Elevation (ft): 5,123.3 Design Spillway Crest Elevation: None
Design Total Freeboard (ft): 5.5 Measured Total Freeboard (ft): N/A
Statutory Dam Height (ft): 73 Structural Height (ft): 73
Dam Crest Length (ft): 4,040 Upstream Slope: 3:1 Downstream Slope: 3:1
Dam Crest Width (ft): 12
Lat: 34° 57' 07.0"
Water Rights: N/A
Long: 110° 17' 22.7"
Reservoir Area (acres): 80 Reservoir Storage (ac-ft): 2,300
Inflow Design Flood/Safe Flood-Passing Capacity: PMF – fully contained.
Reservoir Level During Inspection (ft): 5108.60 Photos: Yes Page: 1 of 4

2015 Annual CCR Impoundment and Landfill Inspection Report 14 January, 2016 APS Cholla Power Plant
Bottom Ash Dam/Impoundment SID: 09.27
N/A
No
Yes
Mon
Rep
Inv
COMPLIANCE CHECKLIST
1 CONDITION SUMMARY/LICENSE/EAP/NEXT INSPECTION
a Recorded downstream hazard: High Should hazard be revised? X
b If high hazard, estimate downstream persons-at-risk (PAR): <30 Is there a significant increase since the last inspection? X
c Recorded size: Intermediate Should size be revisited? X d Any safety deficiencies? No Describe: X e Any statute or rule violations? No Describe and list required action: X f Safe storage level on License: 5,117.8 feet Should level be revised: X g Any License violations? No Describe and list required action: X h Date of current License: 12/11/1998 Should new License be issued? X i Date of last Emergency Action Plan revision: 1/4/2012 Should EAP be revised? X j Any Agency actions? No Describe and list required action: X k Normal inspection frequency: Annually Should inspection frequency be revised? X l Recommended date for next inspection: October 2016 for next annual inspection
MONITORING CHECKLIST
2 INSTRUMENTATION AND MONITORING
a Describe:
1) 19 piezometers and wells in and around the embankment. 2) 10 settlement monuments. 3) A V-notch weir and seepage monitoring systems. 4) Water level gauge in the reservoir.
b Any repair or replacement required? No. Describe: X
c Date of last monitoring report: April 2015 (Annual Report to ADWR for 2014)
Should new readings be taken and new report provided? Annual reporting is required. X
DAM EMBANKMENT CHECKLIST
3 DAM CREST
a Settlements, slides, depressions? X b Misalignment? X c Longitudinal/Transverse cracking? X
d Animal burrows? Animal burrows were observed on east leg of crest, primarily in the windrow along the downstream side. See Photos IMG_2132, 2135, and 2137.
X X
e Adverse vegetation? Yes, approximately 10 feet both sides of crest, see recommendation. See Photos BAP 35, BAP 40, BAP 42 and IMG_2132 X X
f Erosion? X 4 UPSTREAM SLOPE
a Erosion? X b Inadequate ground cover? X
c Adverse vegetation? Yes, see comment for adverse vegetation both sides of crest. See Photos BAP 35, BAP 40, BAP 42, and IMG_2132. X X
d Longitudinal/Transverse cracking? X e Inadequate riprap? X f Stone deterioration? X g Settlements, slides, depressions, bulges? X h Animal burrows? None observed. Continue to monitor. X 5 DOWNSTREAM SLOPE
a Erosion? X b Inadequate ground cover? X

2015 Annual CCR Impoundment and Landfill Inspection Report 15 January, 2016 APS Cholla Power Plant
Bottom Ash Dam/Impoundment SID: 09.27
N/A
No
Yes
Mon
Rep
Inv
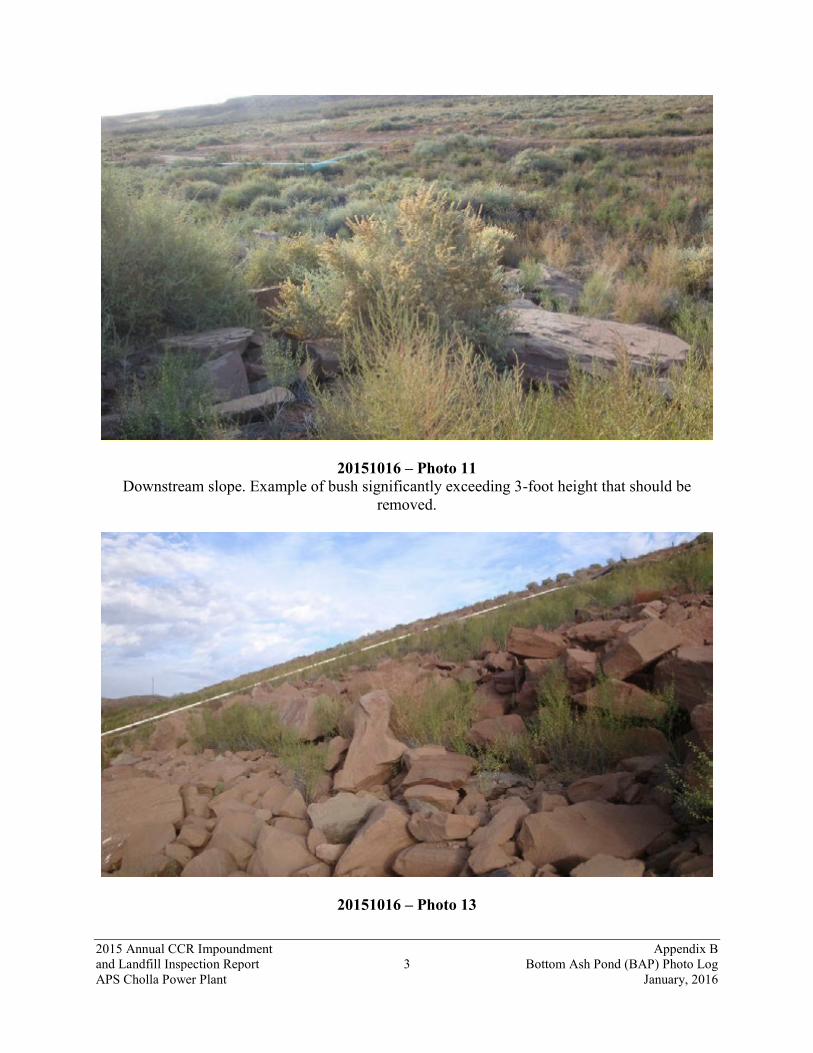
c Adverse vegetation? Yes, need to clear toe and remove bushes taller than 4 feet on slope. See for example, Photos BAP 3, and BAP 17 X X
d Longitudinal/Transverse cracking? X e Inadequate riprap? X f Stone deterioration? X g Settlements, slides, depressions, bulges? X
h Soft spots or boggy areas? Historic seepage at the toe and active seepage (1 gallon/37 seconds) at the right groin area. Continue to monitor. X X
i Movement at or beyond toe? Yes, minor evidence of soil wasting from below riprap in areas adjacent to downstream toe. X
j Animal burrows? None observed. Continue to monitor. X 6 ABUTMENT CONTACTS
a Erosion? No. See Photo BAP 31. X b Differential movement? X c Cracks? X d Settlements, slides, depressions, bulges? X e Seepage? Yes. Documented in past reports. See Photo BAP 1. X X f Animal burrows? None observed. Continue to monitor. X 7 SEEPAGE/PIPING CONTROL DESIGN FEATURE(S)
a Describe: Several monitoring, seepage, and pump back collection systems are located downstream of the dam. See Photos BAP 1 and BAP 22 (Petroglyph Seep).
b Internal drains flowing? X c Seepage at or beyond toe? X X d If so, does seepage contain fines? X e Evidence of sand boils at or beyond toe? X
RESERVOIR CHECKLIST
8 RESERVOIR
a High water marks? X b Erosion/slides into pool area? X
c Sediment accumulation? Bottom ash settles in the reservoir and is removed and placed in the monofill. X
d Floating debris present? X e Depressions, sinkholes, or vortices? X f Low ridges/saddles allowing overflow? X g Structures below dam crest elevation? X
Additional comments and recommendations:
Vegetation along the majority of the length of the downstream toe of the embankment is too thick to allow adequate visual inspection. See Photos BAP 3 and BAP 17. Vegetation has been removed by blading in specific locations, apparently for access to drill groundwater monitoring wells (see Photo BAP 20.) Recommend maintenance of all vegetation sufficient to allow thorough inspection of the soil and rip rap conditions on the faces and crests of the embankments. Vegetation removal should be performed along the entire toe of the west and east legs of the embankment in accordance with the NMOSE vegetation maintenance guidelines “Vegetation Management on Dams” reference.
The majority of vegetation on the downstream face of the embankment is considered acceptable ground cover in this environment. Bushes and trees (see Photo BAP 11)
2015 Annual CCR Impoundment and Landfill Inspection Report 16 January, 2016 APS Cholla Power Plant
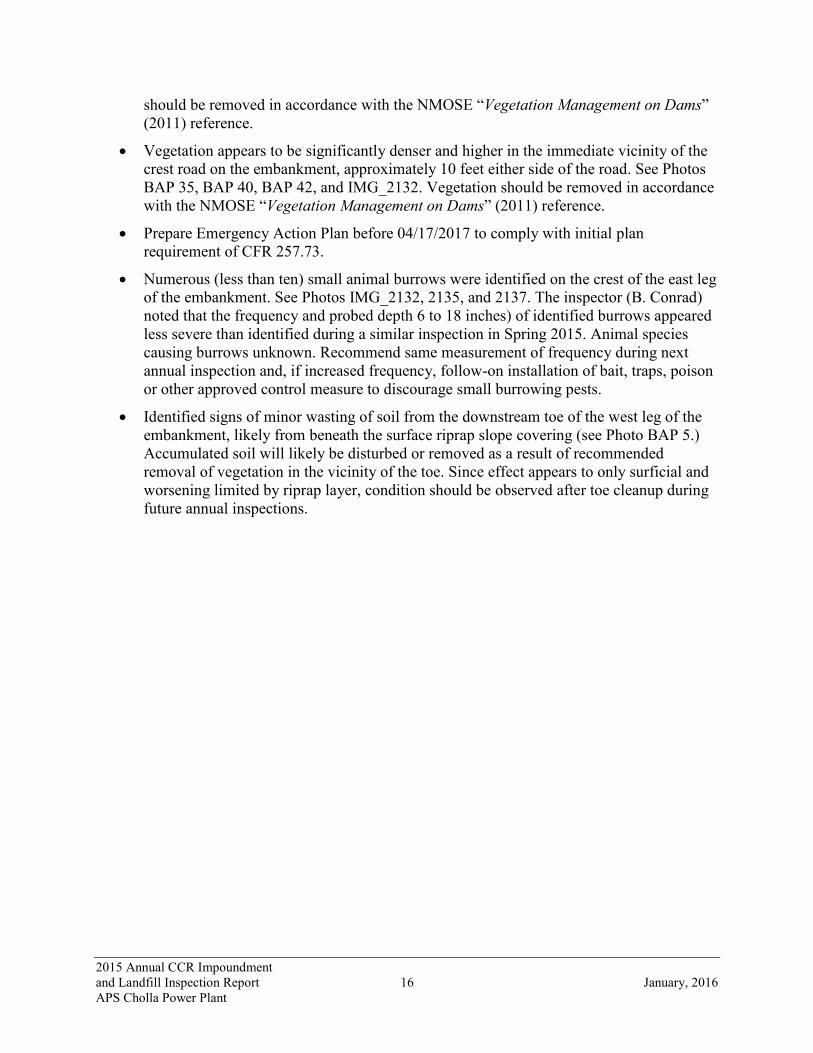
should be removed in accordance with the NMOSE “Vegetation Management on Dams” (2011) reference.
Vegetation appears to be significantly denser and higher in the immediate vicinity of the crest road on the embankment, approximately 10 feet either side of the road. See Photos BAP 35, BAP 40, BAP 42, and IMG_2132. Vegetation should be removed in accordance with the NMOSE “Vegetation Management on Dams” (2011) reference.
Prepare Emergency Action Plan before 04/17/2017 to comply with initial plan requirement of CFR 257.73.
Numerous (less than ten) small animal burrows were identified on the crest of the east leg of the embankment. See Photos IMG_2132, 2135, and 2137. The inspector (B. Conrad) noted that the frequency and probed depth 6 to 18 inches) of identified burrows appeared less severe than identified during a similar inspection in Spring 2015. Animal species causing burrows unknown. Recommend same measurement of frequency during next annual inspection and, if increased frequency, follow-on installation of bait, traps, poison or other approved control measure to discourage small burrowing pests.
Identified signs of minor wasting of soil from the downstream toe of the west leg of the embankment, likely from beneath the surface riprap slope covering (see Photo BAP 5.) Accumulated soil will likely be disturbed or removed as a result of recommended removal of vegetation in the vicinity of the toe. Since effect appears to only surficial and worsening limited by riprap layer, condition should be observed after toe cleanup during future annual inspections.

2015 Annual CCR Impoundment and Landfill Inspection Report 17 January, 2016 APS Cholla Power Plant
4.3 APS FIELD INSPECTION – CHOLLA SEDIMENTATION POND
Cholla Sedimentation Pond SID: N/A
SID: N/A Dam Name: Cholla Sedimentation Pond Type: Earth
Purpose: CCR-Impacted Surface Water Collection
Not A
pplicable
No
Yes
Monitor
Repair
Investigate
Contact(s): Byron Conrad, P.E. (APS) Report Date: December 15, 2015
Inspected by: Alexander W. Gourlay, P.E. (AECOM) Byron Conrad, P.E. (APS) Inspection Date: October 16, 2015
Reviewed by: Byron Conrad, P.E. (APS) Date: January 4, 2016
Design Dam Crest Elevation (ft): 5019 (2010 EPA ICR) Design Spillway Crest Elevation: Twin 16-inch corrugated polyethylene pipes, ungated, with trash rack
Design Total Freeboard (ft): 2 (2010 EPA ICR) Measured Total Freeboard (ft): Not measured
Statutory Dam Height (ft): 11 (2010 EPA ICR) Structural Height (ft): East embankment: 11 ft West embankment: 0 ft (incised)
Dam Crest Length (ft): 1,100 (approx.) Upstream Slope: 1.5:1 (by inspection)
Downstream Slope: 1.5:1(by inspection)
Dam Crest Width (ft): 24 (approx.)
Lat: 34° 56′ 29.9″N
Water Rights: N/A
Long: 110° 18′ 14.9″W
Reservoir Area (acres): 1.6 (2010 EPA ICR) Reservoir Storage (ac-ft): 10.7 (2010 EPA ICR)
Inflow Design Flood/Safe Flood-Passing Capacity: Not Calculated
Reservoir Level During Inspection (ft): 5016 (by observation) Photos: Yes Page: 1 of 3

2015 Annual CCR Impoundment and Landfill Inspection Report 18 January, 2016 APS Cholla Power Plant
Cholla Sedimentation Pond SID: N/A
N/A
No
Yes
Mon
Rep
Inv
COMPLIANCE CHECKLIST
1 CONDITION SUMMARY/LICENSE/EAP/NEXT INSPECTION
a Recorded downstream hazard: Very Low Should hazard be revised? X
b If high hazard, estimate downstream persons-at-risk (PAR): N/A Is there a significant increase since the last inspection? X
c Recorded size: Small Should size be revised? X d Any safety deficiencies? No Describe: X e Any statute or rule violations? No Describe and list required action: X f Safe storage level on License: N/A Should level be revised: X g Any License violations? No Describe and list required action: X h Date of current License: N/A Should new License be issued? X i Date of last Emergency Action Plan revision: N/A Should EAP be revised? X j Any Agency actions? No Describe and list required action: X k Normal inspection frequency: Weekly, Annually Should inspection frequency be revised? X l Recommended date for next inspection: October 2016 for next annual inspection
MONITORING CHECKLIST
2 INSTRUMENTATION AND MONITORING
a Describe:
1) There exist no instruments or other monitoring devices for this structure due to small size.
b Any repair or replacement required? N/A Describe: N/A X c Date of last monitoring report: None Should new readings be taken and new report
provided? N/A X
DAM EMBANKMENT CHECKLIST
3 DAM CREST
a Settlements, slides, depressions? X b Misalignment? X c Longitudinal/Transverse cracking? X d Animal burrows? None observed. Continue to monitor. X X e Adverse vegetation? X
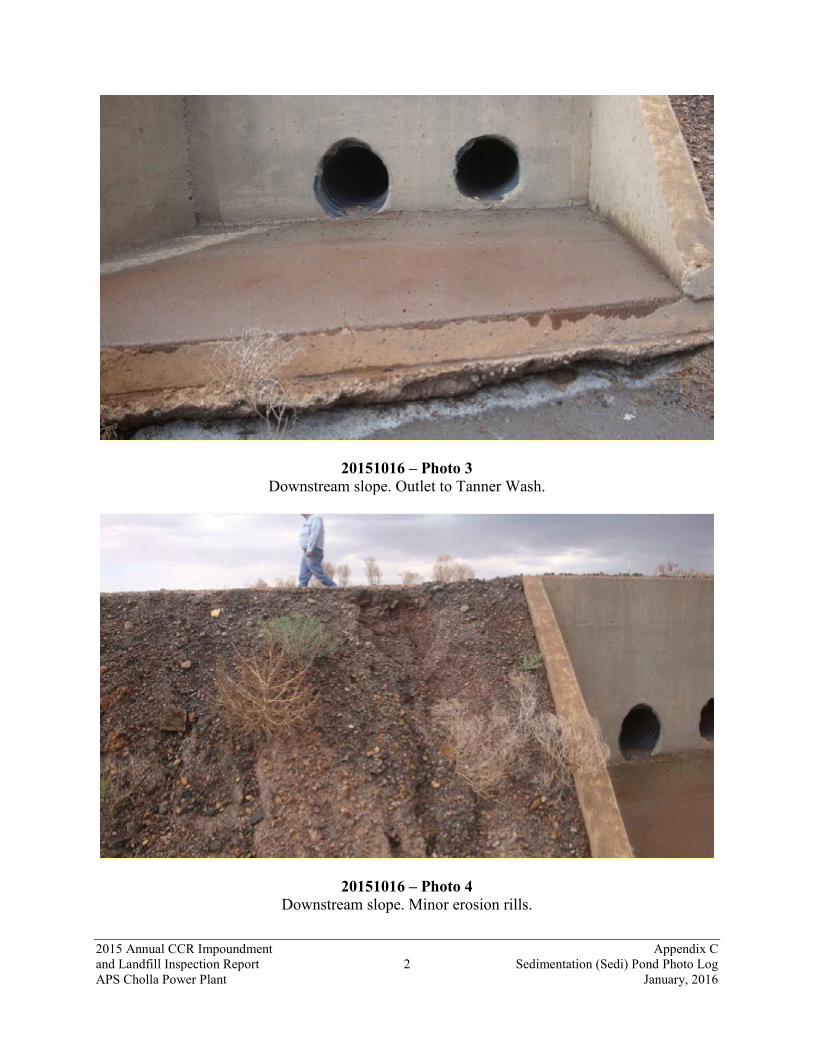
f Erosion? Indications of concentrated runoff caused by road grading that is causing erosion rills on d/s slope. See Photos Sedi 4 and 5. X
4 UPSTREAM SLOPE
a Erosion? X b Inadequate ground cover? X c Adverse vegetation? Shrubs and other vegetation observed. See Photos Sedi 2 and 11. X X d Longitudinal/Transverse cracking? X e Inadequate riprap? X f Stone deterioration? X g Settlements, slides, depressions, bulges? X h Animal burrows? None observed. Continue to monitor. X X 5 DOWNSTREAM SLOPE
a Erosion? Several rills, 1 to 2 feet deep, likely caused by concentrated runoff caused by crest road grading. See Photos Sedi 4 and 5. X X
b Inadequate ground cover? Mostly gravel-faced. X

2015 Annual CCR Impoundment and Landfill Inspection Report 19 January, 2016 APS Cholla Power Plant
Cholla Sedimentation Pond SID: N/A
N/A
No
Yes
Mon
Rep
Inv
c Adverse vegetation? X d Longitudinal/Transverse cracking? X e Inadequate riprap? X f Stone deterioration? X g Settlements, slides, depressions, bulges? X h Soft spots or boggy areas? X i Movement at or beyond toe? X j Animal burrows? None observed. Continue to monitor. X X 6 ABUTMENT CONTACTS
a Erosion? Abutments not defined due to general plant grading. X b Differential movement? X c Cracks? X d Settlements, slides, depressions, bulges? X e Seepage? X f Animal burrows? None observed. Continue to monitor. X X 7 SEEPAGE/PIPING CONTROL DESIGN FEATURE(S)
a Describe: None.
b Internal drains flowing? X
c Seepage at or beyond toe? Slight evidence of evaporites in drainage ditch at toe of embankment, may just result from water in channel. See Photo 3. X X
d If so, does seepage contain fines? X e Evidence of sand boils at or beyond toe? X
RESERVOIR CHECKLIST
8 RESERVOIR
a High water marks? X b Erosion/slides into pool area? X
c Sediment accumulation? Suspended sediment and CCR settle in the two chambers of the impoundment. X
d Floating debris present? X
e Depressions, sinkholes, or vortices? X
f Low ridges/saddles allowing overflow? X
g Structures below dam crest elevation?
Yes, twin 16-inch corrugated polyethylene pipe outlets from south chamber to drainage wash parallel to railroad tracks. See Photos Sedi 4 and 11.
X
Additional comments and recommendations:
Adjust embankment crest road grading to cause runoff to flow into south chamber of impoundment to eliminate erosion on downstream slope of embankment.

2015 Annual CCR Impoundment and Landfill Inspection Report 20 January, 2016 APS Cholla Power Plant
4.4 APS FIELD INSPECTION – CHOLLA BOTTOM ASH LANDFILL
Cholla Bottom Ash Landfill SID: N/A
SID: N/A Landfill Name: Cholla Bottom Ash Landfill
Type: Landfill
Purpose: Permanent Storage of Dry Bottom Ash Dredged from Bottom Ash Pond
Not A
pplicable
No
Yes
Monitor
Repair
Investigate
Contact(s): Byron Conrad, P.E. (APS) Report Date: December 30, 2015
Inspected by: Alexander W. Gourlay, P.E. (AECOM) Byron Conrad, P.E. (APS) Inspection Date: October 16, 2015
Reviewed by: Byron Conrad, P.E. (APS) Date: January 4, 2016
Design Maximum Ash Elevation (ft): 5261 Current Ash Elevation: 5204 feet for capped west portion, 5124 feet for newly-prepared east portion.
Dam Crest Length (ft): Not a dam, not applicable. Design Side Slope: 3:1
Observed Side Slope: Mainly 3:1, steeper (2:1) towards south end of west side.
Dam Crest Width (ft): Not a dam, not applicable.
Lat: 34°57'35.4"
Water Rights: N/A
Long: 110°17'06.3
Landfill Area (acres): 43 acres (max permitted) Landfill Capacity (ac-ft): 2417 (from Phasing Plan)
Inflow Design Flood/Safe Flood-Passing Capacity: Diversion of 100-year, 24-hour run-on storm
Reservoir Level During Inspection (ft): All Run-off and Run-on reservoirs were dry at time of inspection. Photos: Yes Page: 1 of 2
2015 Annual CCR Impoundment and Landfill Inspection Report 21 January, 2016 APS Cholla Power Plant
Cholla Bottom Ash Landfill SID: N/A
N/A
No
Yes
Mon
Rep
Inv
MONITORING CHECKLIST
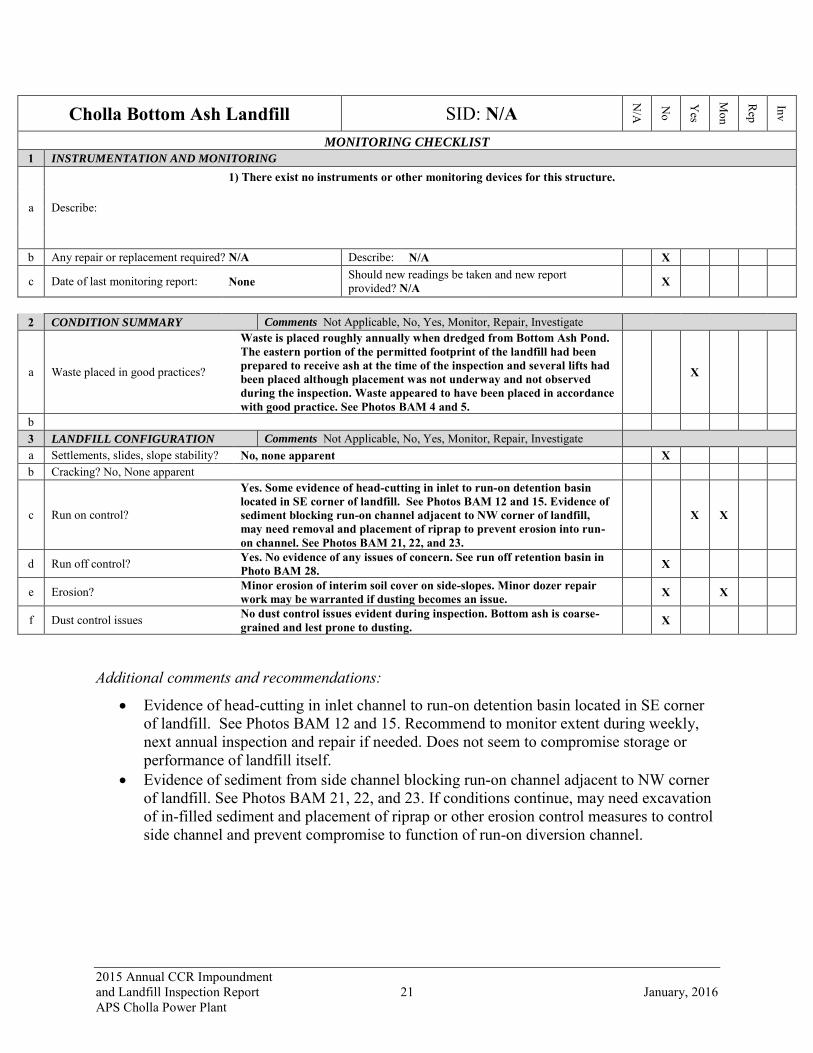
1 INSTRUMENTATION AND MONITORING
a Describe:
1) There exist no instruments or other monitoring devices for this structure.
b Any repair or replacement required? N/A Describe: N/A X c Date of last monitoring report: None Should new readings be taken and new report
provided? N/A X
2 CONDITION SUMMARY Comments Not Applicable, No, Yes, Monitor, Repair, Investigate
a Waste placed in good practices?
Waste is placed roughly annually when dredged from Bottom Ash Pond. The eastern portion of the permitted footprint of the landfill had been prepared to receive ash at the time of the inspection and several lifts had been placed although placement was not underway and not observed during the inspection. Waste appeared to have been placed in accordance with good practice. See Photos BAM 4 and 5.
X
b 3 LANDFILL CONFIGURATION Comments Not Applicable, No, Yes, Monitor, Repair, Investigate
a Settlements, slides, slope stability? No, none apparent X b Cracking? No, None apparent
c Run on control?
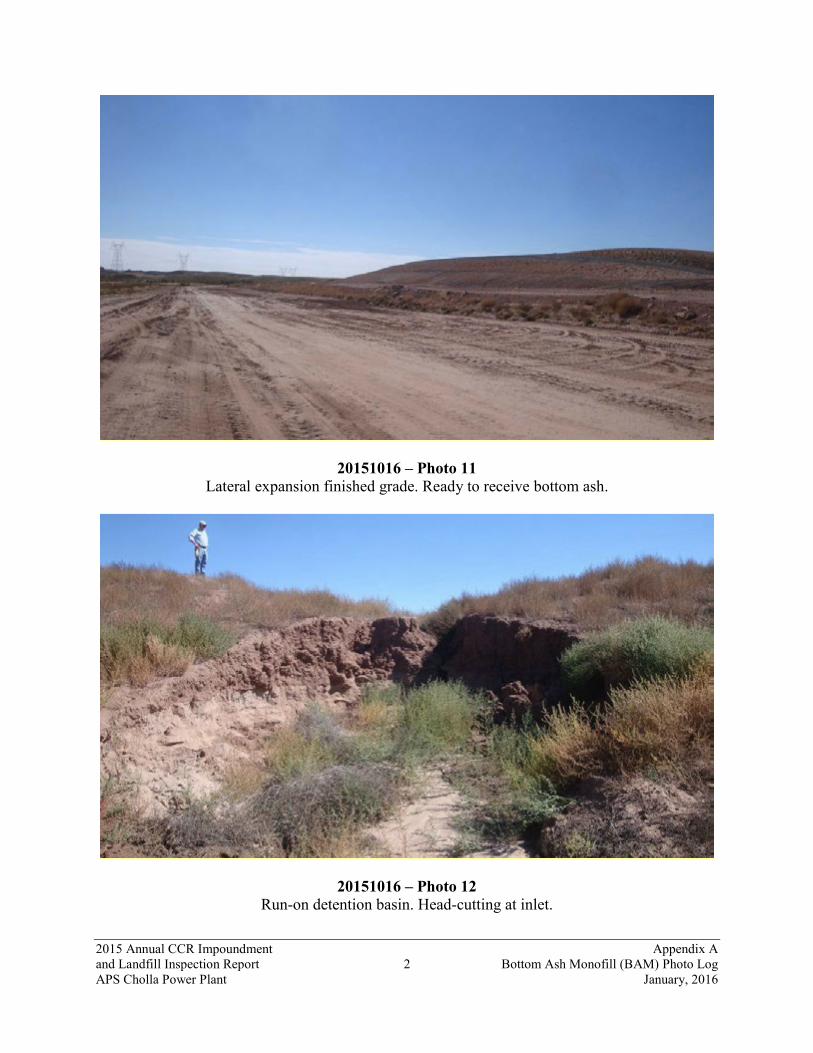
Yes. Some evidence of head-cutting in inlet to run-on detention basin located in SE corner of landfill. See Photos BAM 12 and 15. Evidence of sediment blocking run-on channel adjacent to NW corner of landfill, may need removal and placement of riprap to prevent erosion into run-on channel. See Photos BAM 21, 22, and 23.
X X
d Run off control? Yes. No evidence of any issues of concern. See run off retention basin in Photo BAM 28. X
e Erosion? Minor erosion of interim soil cover on side-slopes. Minor dozer repair work may be warranted if dusting becomes an issue. X X
f Dust control issues No dust control issues evident during inspection. Bottom ash is coarse-grained and lest prone to dusting. X
Additional comments and recommendations:
Evidence of head-cutting in inlet channel to run-on detention basin located in SE corner of landfill. See Photos BAM 12 and 15. Recommend to monitor extent during weekly, next annual inspection and repair if needed. Does not seem to compromise storage or performance of landfill itself.
Evidence of sediment from side channel blocking run-on channel adjacent to NW corner of landfill. See Photos BAM 21, 22, and 23. If conditions continue, may need excavation of in-filled sediment and placement of riprap or other erosion control measures to control side channel and prevent compromise to function of run-on diversion channel.

2015 Annual CCR Impoundment and Landfill Inspection Report 22 January, 2016 APS Cholla Power Plant
5.0 BASIC DATA REPORT REVIEW
5.1 FLY ASH POND/DAM 5.1.1 Geometry Changes Since Last Inspection
No significant changes in the geometry of the unit have occurred since the last inspection in 2014.
5.1.2 Instrumentation
The location of geotechnical and other related instrumentation in the vicinity of the Fly Ash Pond are shown on Figure 5 - Fly Ash Pond Instrumentation Map.
The maximum recorded readings for each instrument since the last annual inspection (2014) are reported in the following Table:
Fly Ash Dam
Instrument Name Maximum Minimum Unit F-81 5059.46 5059.27 ft
F-88 4999.51 4997.42 ft
F-89 5056.94 5059.27 ft
F-90 5064.56 5059.27 ft
F-91 5003.55 5002.40 ft
F-92 5010.54 5009.96 ft
F-93 5017.79 5017.40 ft
F-100 5082.59 5081.91 ft
F-101 5051.13 5050.86 ft
F-102 5026.71 5026.21 ft
F-103 5017.85 5017.46 ft
F-104 5066.81 5065.98 ft
F-105 5089.44 5088.70 ft
F-106 5016.02 5015.53 ft
F-107 5025.20 5024.47 ft
F-108 5060.00 5058.94 ft
F-109 5036.05 5035.17 ft
F-110 5093.04 5091.34 ft
F-111 5030.81 5030.23 ft
F-112 5027.48 5027.02 ft
F-113 5039.09 5038.45 ft
F-114 5024.18 5024.18 ft
F-115 5030.27 5029.87 ft

2015 Annual CCR Impoundment and Landfill Inspection Report 23 January, 2016 APS Cholla Power Plant
Instrument Name Maximum Minimum Unit
F-117 5088.95 5088.45 ft
F-123 5090.25 5089.56 ft
F-124 5088.30 5088.09 ft
F-125 5073.04 5072.92 ft
F-126 5086.00 5082.87 ft
F-127 5078.14 5075.43 ft
F-128 5092.87 5092.66 ft
F-129 5097.74 5083.84 ft
F-130 5083.31 5080.23 ft
F-131 5062.20 5060.27 ft
F-132 5091.03 5090.03 ft
F-133 5081.77 5074.98 ft
F-134 5068.44 5066.01 ft
W-123 5037.14 5036.90 ft
M-1 5120.97 5120.91 EL
M-2 5120.49 5120.45 EL
M-3 5119.84 5119.83 EL
M-4 5119.04 5119.02 EL
M-5 5118.03 5117.98 EL
M-5A 5117.84 5117.82 EL
M-5B 5117.65 5117.63 EL
M-5C 5118.01 5117.96 EL
M-6 5119.13 5119.11 EL
M-6A 5118.73 5118.71 EL
M-6B 5119.72 5119.72 EL
M-6C 5120.08 5120.03 EL
M-7 5119.52 5119.50 EL
M-8 5119.68 5119.66 EL
M-9 5120.03 5120.02 EL
M-10 5119.95 5119.93 EL
Geronimo 39.78 15.10 gpm
Hunt 8.59 5.97 gpm
The 2015 data for the piezometers indicate no significant elevation changes or trends related to the performance of the dam.
2015 Annual CCR Impoundment and Landfill Inspection Report 24 January, 2016 APS Cholla Power Plant
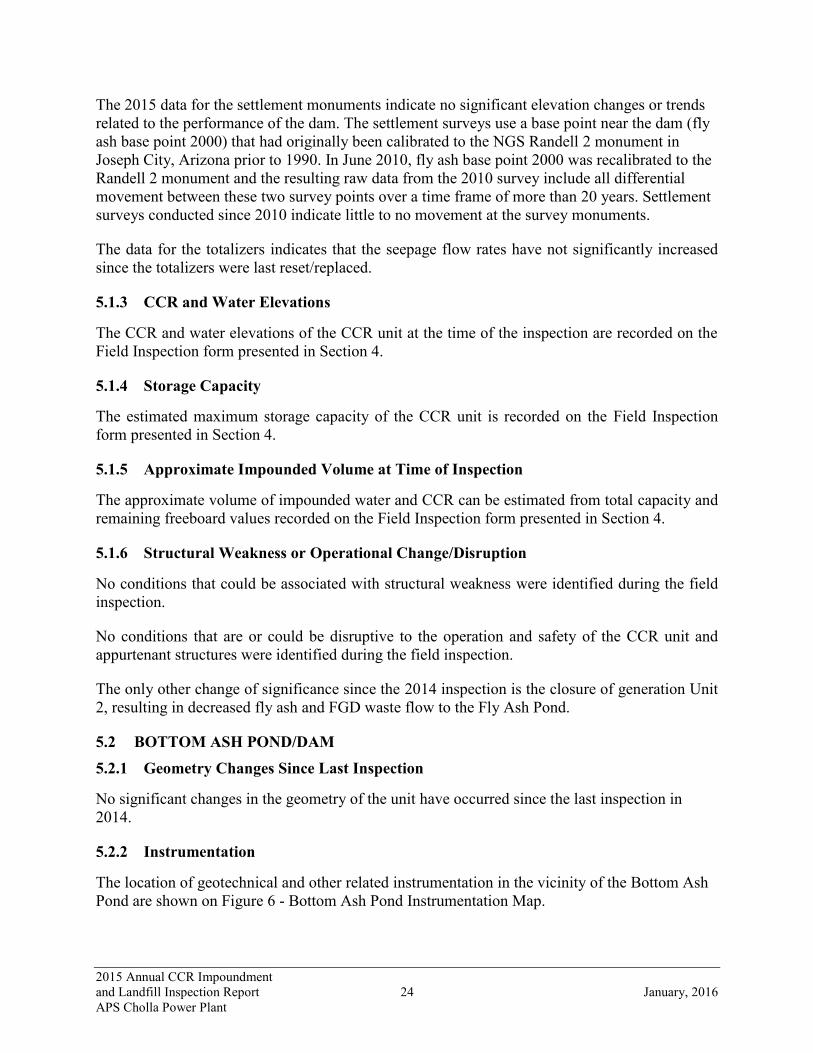
The 2015 data for the settlement monuments indicate no significant elevation changes or trends related to the performance of the dam. The settlement surveys use a base point near the dam (fly ash base point 2000) that had originally been calibrated to the NGS Randell 2 monument in Joseph City, Arizona prior to 1990. In June 2010, fly ash base point 2000 was recalibrated to the Randell 2 monument and the resulting raw data from the 2010 survey include all differential movement between these two survey points over a time frame of more than 20 years. Settlement surveys conducted since 2010 indicate little to no movement at the survey monuments.
The data for the totalizers indicates that the seepage flow rates have not significantly increased since the totalizers were last reset/replaced.
5.1.3 CCR and Water Elevations
The CCR and water elevations of the CCR unit at the time of the inspection are recorded on the Field Inspection form presented in Section 4.
5.1.4 Storage Capacity
The estimated maximum storage capacity of the CCR unit is recorded on the Field Inspection form presented in Section 4.
5.1.5 Approximate Impounded Volume at Time of Inspection
The approximate volume of impounded water and CCR can be estimated from total capacity and remaining freeboard values recorded on the Field Inspection form presented in Section 4.
5.1.6 Structural Weakness or Operational Change/Disruption
No conditions that could be associated with structural weakness were identified during the field inspection.
No conditions that are or could be disruptive to the operation and safety of the CCR unit and appurtenant structures were identified during the field inspection.
The only other change of significance since the 2014 inspection is the closure of generation Unit 2, resulting in decreased fly ash and FGD waste flow to the Fly Ash Pond.
5.2 BOTTOM ASH POND/DAM 5.2.1 Geometry Changes Since Last Inspection
No significant changes in the geometry of the unit have occurred since the last inspection in 2014.
5.2.2 Instrumentation
The location of geotechnical and other related instrumentation in the vicinity of the Bottom Ash Pond are shown on Figure 6 - Bottom Ash Pond Instrumentation Map.

2015 Annual CCR Impoundment and Landfill Inspection Report 25 January, 2016 APS Cholla Power Plant
The maximum recorded readings for each instrument since the last annual inspection (2014) are reported in the following Table:
Bottom Ash Dam
Instrument Name Maximum Minimum Unit B-200 5047.89 5045.50 ft
B-201 5045.93 5043.78 ft
B-202 5041.74 5040.37 ft
B-204 5100.63 5097.67 ft
B-206 5030.15 5028.86 ft
B-207 5032.86 5031.22 ft
B-208B 5073.16 5073.16 no water
B-209 5072.99 5072.47 ft
B-210 5066.75 5066.22 ft
B-211 5085.81 5085.81 no water
B-212 5092.03 5091.37 ft
B-213 5080.40 5079.77 ft
B-214 5079.78 5079.12 ft
B-215 5079.62 5078.96 ft
B-216 5073.70 5072.54 ft
B-217 5103.08 5099.95 ft
B-218 5095.35 5093.48 ft
B-225 5059.64 5058.85 ft
W-227 5092.54 5090.30 ft
M-11 5123.303 5123.298 EL
M-12 5122.903 5122.883 EL
M-13 5122.790 5122.410 EL
M-14 5119.455 5119.409 EL
M-15 5123.061 5123.003 EL
M-16 5123.658 5123.542 EL
M-17 5122.972 5122.951 EL
M-18 5123.258 5123.233 EL
M-19 5123.372 5123.352 EL
PI 5123.478 5123.432 EL West Abutment
Totalizer 6.94 4.10 gpm
West Abutment Weir 4.00 1.00 gpm
P-226 26.88 14.72 gpm
2015 Annual CCR Impoundment and Landfill Inspection Report 26 January, 2016 APS Cholla Power Plant
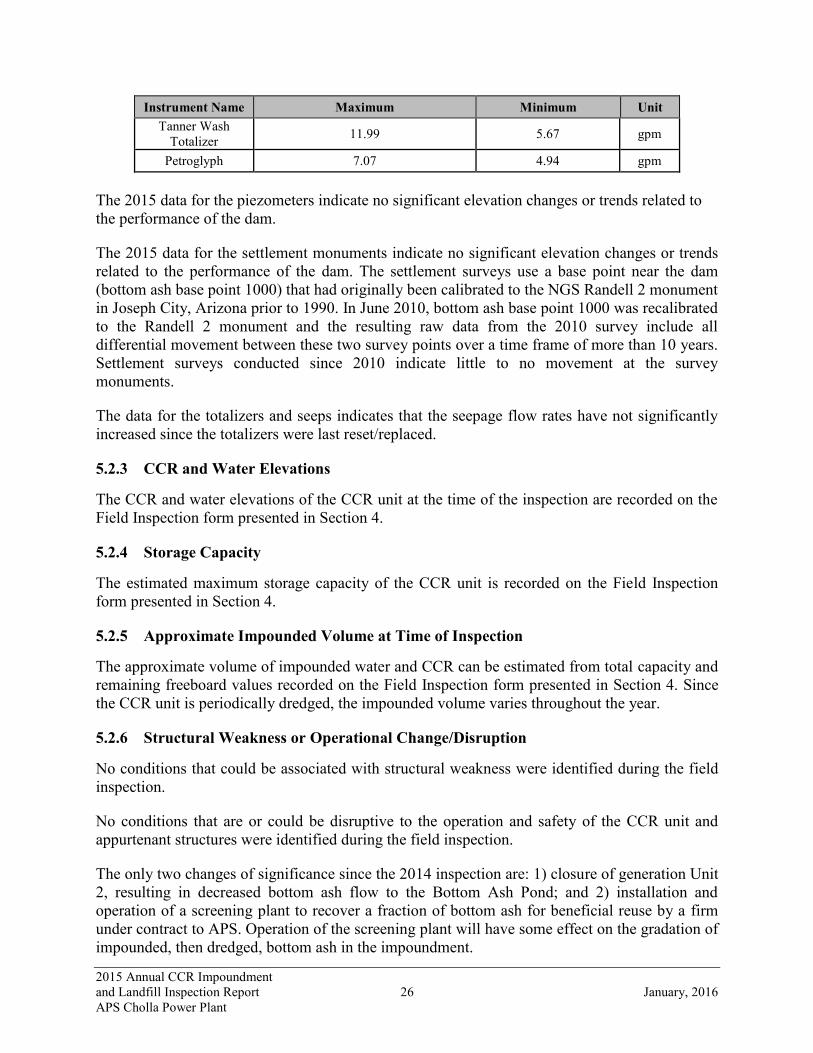
Instrument Name Maximum Minimum Unit Tanner Wash
Totalizer 11.99 5.67 gpm
Petroglyph 7.07 4.94 gpm
The 2015 data for the piezometers indicate no significant elevation changes or trends related to the performance of the dam.
The 2015 data for the settlement monuments indicate no significant elevation changes or trends related to the performance of the dam. The settlement surveys use a base point near the dam (bottom ash base point 1000) that had originally been calibrated to the NGS Randell 2 monument in Joseph City, Arizona prior to 1990. In June 2010, bottom ash base point 1000 was recalibrated to the Randell 2 monument and the resulting raw data from the 2010 survey include all differential movement between these two survey points over a time frame of more than 10 years. Settlement surveys conducted since 2010 indicate little to no movement at the survey monuments.
The data for the totalizers and seeps indicates that the seepage flow rates have not significantly increased since the totalizers were last reset/replaced.
5.2.3 CCR and Water Elevations
The CCR and water elevations of the CCR unit at the time of the inspection are recorded on the Field Inspection form presented in Section 4.
5.2.4 Storage Capacity
The estimated maximum storage capacity of the CCR unit is recorded on the Field Inspection form presented in Section 4.
5.2.5 Approximate Impounded Volume at Time of Inspection
The approximate volume of impounded water and CCR can be estimated from total capacity and remaining freeboard values recorded on the Field Inspection form presented in Section 4. Since the CCR unit is periodically dredged, the impounded volume varies throughout the year.
5.2.6 Structural Weakness or Operational Change/Disruption
No conditions that could be associated with structural weakness were identified during the field inspection.
No conditions that are or could be disruptive to the operation and safety of the CCR unit and appurtenant structures were identified during the field inspection.
The only two changes of significance since the 2014 inspection are: 1) closure of generation Unit 2, resulting in decreased bottom ash flow to the Bottom Ash Pond; and 2) installation and operation of a screening plant to recover a fraction of bottom ash for beneficial reuse by a firm under contract to APS. Operation of the screening plant will have some effect on the gradation of impounded, then dredged, bottom ash in the impoundment.

2015 Annual CCR Impoundment and Landfill Inspection Report 27 January, 2016 APS Cholla Power Plant
5.3 SEDIMENTATION IMPOUNDMENT 5.3.1 Geometry Changes Since Last Inspection
No significant changes in the geometry of the unit have occurred since the last inspection in 2014.
5.3.2 Instrumentation
There are no instruments associated with the Sedimentation Impoundment.
5.3.3 CCR and Water Elevations
The CCR and water elevations of the CCR unit at the time of the inspection are recorded on the Field Inspection form presented in Section 4.
5.3.4 Storage Capacity
The estimated maximum storage capacity of the CCR unit is recorded on the Field Inspection form presented in Section 4.
5.3.5 Approximate Impounded Volume at Time of Inspection
The approximate volume of impounded water and CCR can be estimated from total capacity and remaining freeboard values recorded on the Field Inspection form presented in Section 4. Since the CCR unit is periodically emptied, the impounded volume varies throughout the year.
5.3.6 Structural Weakness or Operational Change/Disruption
No conditions that could be associated with structural weakness were identified during the field inspection.
No conditions that are or could be disruptive to the operation and safety of the CCR unit and appurtenant structures were identified during the field inspection.
There are no changes of significance since the last 2014 inspection.
5.4 BOTTOM ASH MONOFILL 5.4.1 Geometry Changes Since Last Inspection
The landfill was expanded to its full 43-acre permitted footprint during 2015. Bottom ash placement occurred in campaigns and corresponded with previous and permitted practice.
5.4.2 Instrumentation
There are no instruments associated with the Bottom Ash Monofill.
5.4.3 CCR Volume
The CCR elevations of the CCR unit at the time of the inspection are recorded on the Field Inspection form presented in Section 4. Based on planned fill rate, the CCR unit contained
2015 Annual CCR Impoundment and Landfill Inspection Report 28 January, 2016 APS Cholla Power Plant
between 1.75 and 2.0 million cubic yards at the time of inspection. A survey was not performed. The estimated maximum storage capacity of the CCR unit is recorded on the Field Inspection form presented in Section 4.
5.4.4 Structural Weakness or Operational Change/Disruption
No conditions that could be associated with structural weakness were identified during the field inspection.
No conditions that are or could be disruptive to the operation and safety of the CCR unit and appurtenant structures were identified during the field inspection.
There are no changes of significance since the last 2014 inspection.

2015 Annual CCR Impoundment and Landfill Inspection Report 29 January, 2016 APS Cholla Power Plant
6.0 OPERATION AND MAINTENANCE RECOMMENDATIONS
The following items were noted during inspections as requiring attention.
6.1 FLY ASH DAM
Action Item Action Status 1) Identify and remediate scattered animal
burrows. 1) Mark, using irrigation flag or equivalent,
animal burrows identified during weekly inspections.
2) Establish regular schedule (e.g. semi-annually) to remediate flagged burrows.
NOTE: This will always be an ongoing maintenance activity.
2) Erosion was observed in the groin of the West Abutment.
Monitor after storms and repair as needed.
3) Continue to maintain, treat, or remove excessive vegetation.
1) Remove trees, shrubs, and other deleterious vegetation on face of dam as per NMOSE (2011).
2) Remove trees, shrubs, and other deleterious vegetation at toe of dam, as was performed in Fall 2015 for monitor well installation, to allow inspection and identification of wet zones or other problems.
NOTE: This will always be an ongoing maintenance activity.
5) Erosion along the toe of the South
Embankment near the access road. Monitor and repair as needed.
7) Re-establish water level gauge in reservoir
or establish a new alternative means of regularly recording reservoir levels.
Prior gauge submerged early in 2015. No current means other than land survey of measuring pond level and rate of rise/decline.
8) Prepare budget, plan, and scope work to update the Emergency Action Plan.
EAP under CFR 257.73 due 4/17/2017.

2015 Annual CCR Impoundment and Landfill Inspection Report 30 January, 2016 APS Cholla Power Plant
6.2 BOTTOM ASH DAM
Action Item Action Status 1) Identify and remediate scattered animal
burrows. 1) Mark, using irrigation flag or equivalent,
animal burrows identified during weekly inspections.
2) Establish regular schedule (e.g. semi-annually) to remediate flagged burrows.
NOTE: This will always be an ongoing maintenance activity.
2) Continue to maintain, treat, or remove excessive vegetation.
1) Remove trees, shrubs, and other deleterious vegetation on face of dam as per NMOSE (2011).
2) Remove trees, shrubs, and other deleterious vegetation at toe of dam, as was performed in Fall 2015 for monitor well installation, to allow inspection and identification of wet zones or other problems.
NOTE: This will always be an ongoing maintenance activity.
3) Remove vegetation and debris from the V-notch weir at the West Abutment.
1) Location is currently obscured and access restricted. Location should cleared so that it can be accessed and measured during regular inspections.
2) Add to maintenance work list and repair as needed.
4) Prepare budget, plan, and scope work to update the Emergency Action Plan.
EAP under CFR 257.73 due 4/17/2017.

2015 Annual CCR Impoundment and Landfill Inspection Report 31 January, 2016 APS Cholla Power Plant
6.3 SEDIMENTATION IMPOUNDMENT
Action Item Action Status 1) Adjust embankment crest road grading to
cause runoff to flow into south chamber of impoundment to eliminate erosion on downstream slope of embankment.
Add to maintenance work list and repair as needed. NOTE: This will always be an ongoing maintenance activity.
6.4 BOTTOM ASH MONOFILL
Action Item Action Status 1) Evidence of head-cutting in inlet channel
to run-off detention basin located in SE corner of landfill. Recommend to monitor extent during weekly, next annual inspection and repair if needed. Does not seem to compromise storage or performance of landfill itself.
Add to maintenance work list and repair as needed. NOTE: This will always be an ongoing maintenance activity.
2) Evidence of sediment from side channel blocking run-on channel adjacent to NW corner of landfill. Recommend excavation of in-filled sediment and placement of riprap or other erosion control measures to control side channel and prevent compromise to function of run-on diversion channel.
Add to maintenance work list and repair as needed. NOTE: This will always be an ongoing maintenance activity.

2015 Annual CCR Impoundment and Landfill Inspection Report 32 January, 2016 APS Cholla Power Plant
7.0 REFERENCES
Arizona Public Service Corporation. 2014. Cholla Power Plant Bottom and Fly Ash Ponds & Cooling Reservoir Annual Dam Safety Inspection Report.
United States Environmental Protection Agency (EPA), 2015. 40 CFR Parts 257 and 261 – Hazardous and Solid Waste Management System; Disposal of Coal Combustion Residuals from Electric Utilities; Final Rule. Federal Register Vol. 80, No. 74. April 17.
Federal Emergency Management Agency. 2005. Technical Manual for Dam Owners, Impacts of Plants on Earthen Dams, FEMA Manual 534. September.
National Geodetic Survey. Web. 2014. < http://www.ngs.noaa.gov/cgi-bin/ds_desig.prl>. 18 November.
New Mexico Office of the State Engineer (NMOSE). Dam Safety Bureau. 2011. Vegetation Management on Dams. 3 pgs. August 15.

FIGURES

FLY ASH POND
INTERSTATE 40
CHOLLA POWER PLANTCCR IMPOUNDMENT AND LANDFILL INSPECTION REPORTARIZONA PUBLIC SERVICEProject No. 60445840: 2015-01-13
Last saved by: LEE_WRIGHT(2016-01-13) Last Plotted: 2016-01-13Filename: P:\PROJECTS\ARIZONA_PUBLIC_SERVICE\60428720_CHSTUCTINT\5_TECHNICAL\5_6_CADD\FIGURES\A21182 - FIGURE 1 - FAP.DWG
FIGURE 1
ANSI A 8.5" x 11"
FLY ASH PONDSITE MAP

BOTTOM ASH POND
CHOLLA POWER PLANTCCR IMPOUNDMENT AND LANDFILL INSPECTION REPORTARIZONA PUBLIC SERVICEProject No. 60445840: 2015-01-13
Last saved by: LEE_WRIGHT(2016-01-13) Last Plotted: 2016-01-13Filename: P:\PROJECTS\ARIZONA_PUBLIC_SERVICE\60428720_CHSTUCTINT\5_TECHNICAL\5_6_CADD\FIGURES\A21183 - FIGURE 2 - BAP.DWG
FIGURE 2
ANSI A 8.5" x 11"
BOTTOM ASH PONDSITE MAP

SEDIMENTATION POND
Last saved by: LEE_WRIGHT(2016-01-13) Last Plotted: 2016-01-13Filename: P:\PROJECTS\ARIZONA_PUBLIC_SERVICE\60428720_CHSTUCTINT\5_TECHNICAL\5_6_CADD\FIGURES\A21184 - FIGURE 3 - SEDIMENT POND.DWG
FIGURE 3
ANSI A 8.5" x 11"
SEDIMENTATION PONDSITE MAP
CHOLLA POWER PLANTCCR IMPOUNDMENT AND LANDFILL INSPECTION REPORTARIZONA PUBLIC SERVICEProject No. 60445840: 2015-01-13
BOTTOM ASH MONOFILL
CHOLLA POWER PLANTCCR IMPOUNDMENT AND LANDFILL INSPECTION REPORTARIZONA PUBLIC SERVICEProject No. 60445840: 2015-01-13
Last saved by: LEE_WRIGHT(2016-01-13) Last Plotted: 2016-01-13Filename: P:\PROJECTS\ARIZONA_PUBLIC_SERVICE\60428720_CHSTUCTINT\5_TECHNICAL\5_6_CADD\FIGURES\A21185 - FIGURE 4 - BAM.DWG
FIGURE 4
ANSI A 8.5" x 11"
BOTTOM ASH MONOFILLSITE MAP

F-100
F-117
F-81
F-102
F-107
F-106
F-103
F-93
F-101
F-112W-123
F-92
F-91
F-90
F-111
F-113 F-114F-115
F-89
F-110
F-109
F-108
F-105
F-104
F-132
F-131
F-124
F-127
F-128
F-123
F-125F-126
F-129F-130
F-133
F-134
F-88
GERONIMO
HUNT
CHOLLA POWER PLANTCCR IMPOUNDMENT AND LANDFILL INSPECTION REPORTARIZONA PUBLIC SERVICEProject No. 60445840: 2015-01-13
Last saved by: LEE_WRIGHT(2016-01-13) Last Plotted: 2016-01-13Filename: P:\PROJECTS\ARIZONA_PUBLIC_SERVICE\60428720_CHSTUCTINT\5_TECHNICAL\5_6_CADD\FIGURES\A21169 - FIGURE 5 - FAP INSTRUMENTS.DWG
FIGURE 5
ANSI A 8.5" x 11"
FLY ASH PONDINSTRUMENTATION MAP
PIEZOMETERLOCATIONS AREAPPROXIMATE

B-210
B-204B-208B
B-201
B-200
B-209
B-211
B-218
B-212
B-213
B-225
B-216
B-214
B-215
B-207
B-206
B-202
W-227
B-217
PETROGLYPH SEEP
TANNER WASH SEEP
WEST ABUTMENT WEIR
P-226 SEEP
TOE DRAIN SEEP
CHOLLA POWER PLANTCCR IMPOUNDMENT AND LANDFILL INSPECTION REPORTARIZONA PUBLIC SERVICEProject No. 60445840: 2015-01-13
Last saved by: LEE_WRIGHT(2016-01-13) Last Plotted: 2016-01-13Filename: P:\PROJECTS\ARIZONA_PUBLIC_SERVICE\60428720_CHSTUCTINT\5_TECHNICAL\5_6_CADD\FIGURES\A21170 - FIGURE 6 - BAP INSTRUMENTS.DWG
FIGURE 6
ANSI A 8.5" x 11"
BOTTOM ASH PONDINSTRUMENTATION MAP
PIEZOMETERLOCATIONS AREAPPROXIMATE

APPENDIX A
FLY ASH POND (FAP) PHOTO LOG

2015 Annual CCR Impoundment Appendix A and Landfill Inspection Report 1 Fly Ash Pond (FAP) Photo Log APS Cholla Power Plant January, 2016
20151016 – Photo 8 Downstream slope, right abutment groin. Erosion at contact.
20151016 – Photo 10 Crest. Apparent minor animal burrow.

2015 Annual CCR Impoundment Appendix A and Landfill Inspection Report 2 Fly Ash Pond (FAP) Photo Log APS Cholla Power Plant January, 2016
20151016 – Photo 11 Downstream slope. FGD/ash lines. Vegetation generally less than 3 feet high.
20151016 – Photo 12 Upstream slope. FGD/ash lines. Discharge to impoundment.

2015 Annual CCR Impoundment Appendix A and Landfill Inspection Report 3 Fly Ash Pond (FAP) Photo Log APS Cholla Power Plant January, 2016
20151016 – Photo 15 Impoundment. Beach created by deposition at upstream slope of dam.
20151016 – Photo 16 Upstream slope. Vegetation generally less than 3 feet high. Geronimo seep recovery system in
foreground.

2015 Annual CCR Impoundment Appendix A and Landfill Inspection Report 4 Fly Ash Pond (FAP) Photo Log APS Cholla Power Plant January, 2016
20151016 – Photo 17 Crest. Apparent minor animal burrow.
20151016 – Photo 18 Crest. Piezometer completion.

2015 Annual CCR Impoundment Appendix A and Landfill Inspection Report 5 Fly Ash Pond (FAP) Photo Log APS Cholla Power Plant January, 2016
20151016 – Photo 22 Upstream slope. Left abutment. Vegetation generally less than 3 feet high.
20151016 – Photo 25 APS sign. Identifies allowed and disallowed materials in the Fly Ash Pond.
2015 Annual CCR Impoundment Appendix A and Landfill Inspection Report 6 Fly Ash Pond (FAP) Photo Log APS Cholla Power Plant January, 2016
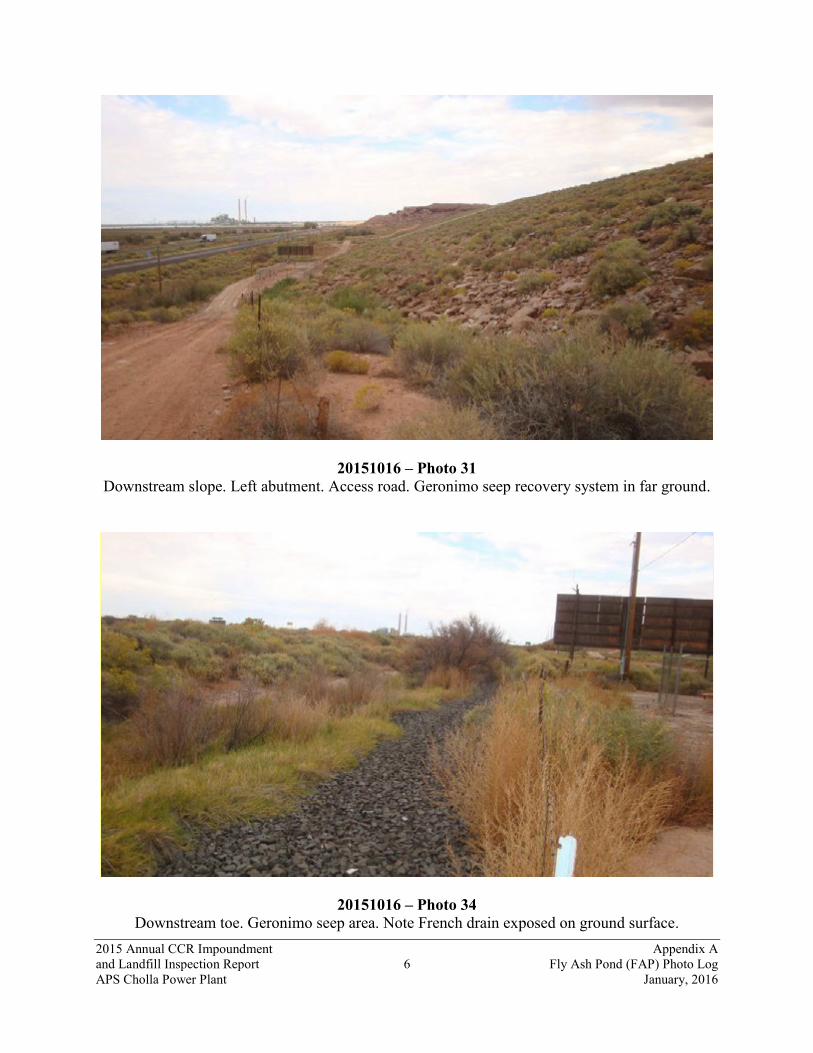
20151016 – Photo 31 Downstream slope. Left abutment. Access road. Geronimo seep recovery system in far ground.
20151016 – Photo 34 Downstream toe. Geronimo seep area. Note French drain exposed on ground surface.

2015 Annual CCR Impoundment Appendix A and Landfill Inspection Report 7 Fly Ash Pond (FAP) Photo Log APS Cholla Power Plant January, 2016
20151016 – Photo 35 Downstream slope. FGD/ash lines. Vegetation generally less than 3 feet high. Note rip rap facing
on dam.
20151016 – Photo 36

2015 Annual CCR Impoundment Appendix A and Landfill Inspection Report 8 Fly Ash Pond (FAP) Photo Log APS Cholla Power Plant January, 2016
Downstream slope. Right abutment toe. Clearing for planned monitoring well. Note evaporates on ground surface.
20151016 – Photo 38 Exposed foundation and seep condition on edge of Interstate 40.

2015 Annual CCR Impoundment Appendix A and Landfill Inspection Report 9 Fly Ash Pond (FAP) Photo Log APS Cholla Power Plant January, 2016
20151016 – IMG_2148 Crest. Apparent minor animal burrow.

APPENDIX B
BOTTOM ASH POND (BAP) PHOTO LOG
2015 Annual CCR Impoundment Appendix B and Landfill Inspection Report 1 Bottom Ash Pond (BAP) Photo Log APS Cholla Power Plant January, 2016
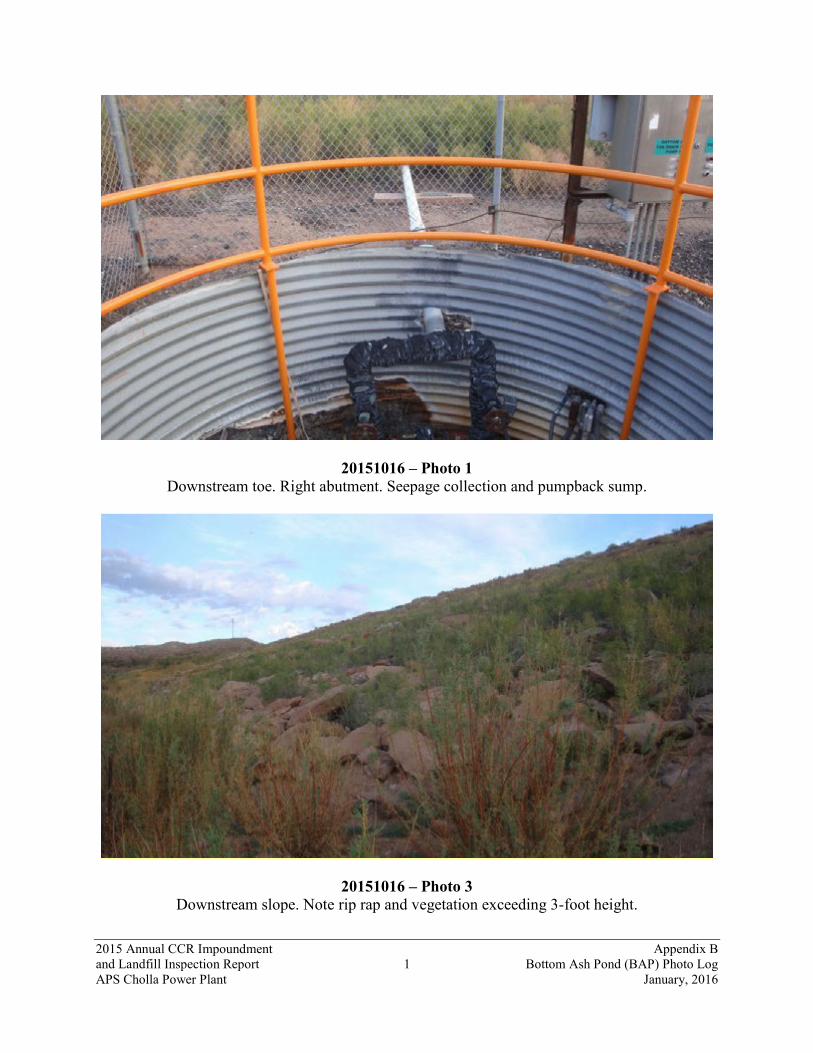
20151016 – Photo 1 Downstream toe. Right abutment. Seepage collection and pumpback sump.
20151016 – Photo 3 Downstream slope. Note rip rap and vegetation exceeding 3-foot height.
2015 Annual CCR Impoundment Appendix B and Landfill Inspection Report 2 Bottom Ash Pond (BAP) Photo Log APS Cholla Power Plant January, 2016
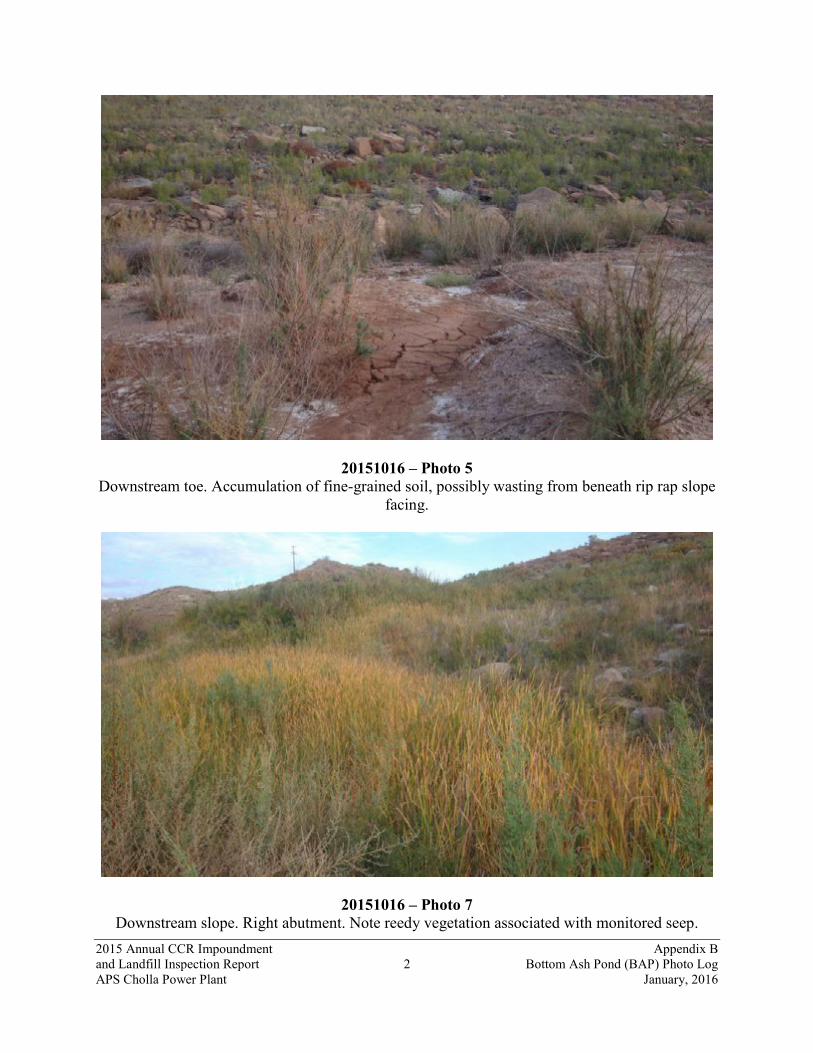
20151016 – Photo 5 Downstream toe. Accumulation of fine-grained soil, possibly wasting from beneath rip rap slope
facing.
20151016 – Photo 7 Downstream slope. Right abutment. Note reedy vegetation associated with monitored seep.
2015 Annual CCR Impoundment Appendix B and Landfill Inspection Report 3 Bottom Ash Pond (BAP) Photo Log APS Cholla Power Plant January, 2016
20151016 – Photo 11 Downstream slope. Example of bush significantly exceeding 3-foot height that should be
removed.
20151016 – Photo 13
2015 Annual CCR Impoundment Appendix B and Landfill Inspection Report 4 Bottom Ash Pond (BAP) Photo Log APS Cholla Power Plant January, 2016
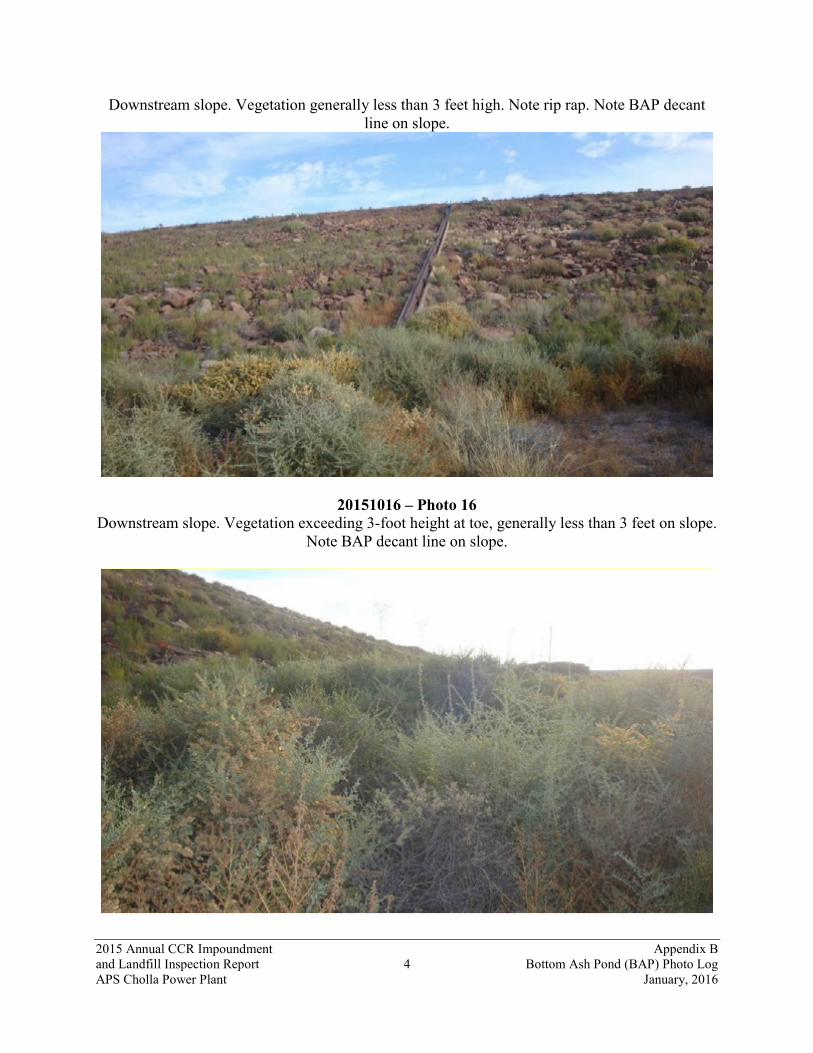
Downstream slope. Vegetation generally less than 3 feet high. Note rip rap. Note BAP decant line on slope.
20151016 – Photo 16 Downstream slope. Vegetation exceeding 3-foot height at toe, generally less than 3 feet on slope.
Note BAP decant line on slope.

2015 Annual CCR Impoundment Appendix B and Landfill Inspection Report 5 Bottom Ash Pond (BAP) Photo Log APS Cholla Power Plant January, 2016
20151016 – Photo 17 Downstream slope. Vegetation exceeding 3-foot height at toe.
20151016 – Photo 20 Downstream slope. Toe area clearing for planned monitoring well.

2015 Annual CCR Impoundment Appendix B and Landfill Inspection Report 6 Bottom Ash Pond (BAP) Photo Log APS Cholla Power Plant January, 2016
20151016 – Photo 22 Downstream toe. “Petroglyph Seep” area. Seep collection/pumpback sump.
20151016 – Photo 29 APS sign. Identifies allowed and disallowed materials in Bottom Ash Pond.

2015 Annual CCR Impoundment Appendix B and Landfill Inspection Report 7 Bottom Ash Pond (BAP) Photo Log APS Cholla Power Plant January, 2016
20151016 – Photo 30 Downstream slope from crest at right abutment.
20151016 – Photo 31 Downstream slope. Right abutment groin.

2015 Annual CCR Impoundment Appendix B and Landfill Inspection Report 8 Bottom Ash Pond (BAP) Photo Log APS Cholla Power Plant January, 2016
20151016 – Photo 33 Crest. Well-maintained road.
20151016 – Photo 35 Upstream slope. Note thick vegetation.

2015 Annual CCR Impoundment Appendix B and Landfill Inspection Report 9 Bottom Ash Pond (BAP) Photo Log APS Cholla Power Plant January, 2016
20151016 – Photo 36 Impoundment. Intake for decant discharge line.
20151016 – Photo 37 Downstream slope. Vegetation generally less than 3 feet high.

2015 Annual CCR Impoundment Appendix B and Landfill Inspection Report 10 Bottom Ash Pond (BAP) Photo Log APS Cholla Power Plant January, 2016
20151016 – Photo 40 Upstream slope. Vegetation exceeding 3-foot height adjacent to crest.
20151016 – Photo 42 Impoundment. East side, showing bottom ash beach.

2015 Annual CCR Impoundment Appendix B and Landfill Inspection Report 11 Bottom Ash Pond (BAP) Photo Log APS Cholla Power Plant January, 2016
20151016 – Photo 46 Crest. Apparent minor animal burrow.
20151016 – Photo 48 Impoundment. Decant from settling cell to free water reclaim pond.

2015 Annual CCR Impoundment Appendix B and Landfill Inspection Report 12 Bottom Ash Pond (BAP) Photo Log APS Cholla Power Plant January, 2016
20151016 – Photo 54 SRMG Screening Plant. West side of impoundment. Not operational during inspection. Recovers
specific gradation of bottom ash for beneficial reuse.
20151016 – IMG_2132 Crest. East leg of embankment. Apparent minor animal burrow.

2015 Annual CCR Impoundment Appendix B and Landfill Inspection Report 13 Bottom Ash Pond (BAP) Photo Log APS Cholla Power Plant January, 2016
20151016 – IMG_2135 Crest. East leg of embankment. Apparent minor animal burrow.
20151016 – IMG_2137 Crest. East leg of embankment. Apparent minor animal burrow.

2015 Annual CCR Impoundment Appendix B and Landfill Inspection Report 14 Bottom Ash Pond (BAP) Photo Log APS Cholla Power Plant January, 2016
20151016 – IMG_2140 SRMG Screening Plant. West side of impoundment. Bypass to impoundment visible in
background.

APPENDIX C
SEDIMENTATION (SEDI) POND PHOTO LOG

2015 Annual CCR Impoundment Appendix C and Landfill Inspection Report 1 Sedimentation (Sedi) Pond Photo Log APS Cholla Power Plant January, 2016
20151016 – Photo 1 Sedimentation Pond. View across pond to northeast.
20151016 – Photo 2 West Embankment. Downstream slope. Minor erosion rills.
2015 Annual CCR Impoundment Appendix C and Landfill Inspection Report 2 Sedimentation (Sedi) Pond Photo Log APS Cholla Power Plant January, 2016
20151016 – Photo 3 Downstream slope. Outlet to Tanner Wash.
20151016 – Photo 4 Downstream slope. Minor erosion rills.

2015 Annual CCR Impoundment Appendix C and Landfill Inspection Report 3 Sedimentation (Sedi) Pond Photo Log APS Cholla Power Plant January, 2016
20151016 – Photo 5 Downstream slope. Minor erosion rills.
20151016 – Photo 11 Upstream slope. Gated inlet, partially blocked by vegetation.

APPENDIX D
BOTTOM ASH MONOFILL (BAM) PHOTO LOG

2015 Annual CCR Impoundment Appendix A and Landfill Inspection Report 1 Bottom Ash Monofill (BAM) Photo Log APS Cholla Power Plant January, 2016
20151016 – Photo 4 Fresh ash placement. Looking south.
20151016 – Photo 5 Fresh ash placement. View from crest of previously placed bottom ash cell.
2015 Annual CCR Impoundment Appendix A and Landfill Inspection Report 2 Bottom Ash Monofill (BAM) Photo Log APS Cholla Power Plant January, 2016
20151016 – Photo 11 Lateral expansion finished grade. Ready to receive bottom ash.
20151016 – Photo 12 Run-on detention basin. Head-cutting at inlet.

2015 Annual CCR Impoundment Appendix A and Landfill Inspection Report 3 Bottom Ash Monofill (BAM) Photo Log APS Cholla Power Plant January, 2016
20151016 – Photo 15 Run-on detention basin. General view.
20151016 – Photo 21 Run-on diversion channel. Looking up-gradient. Partially blocked by debris side drainage.
2015 Annual CCR Impoundment Appendix A and Landfill Inspection Report 4 Bottom Ash Monofill (BAM) Photo Log APS Cholla Power Plant January, 2016
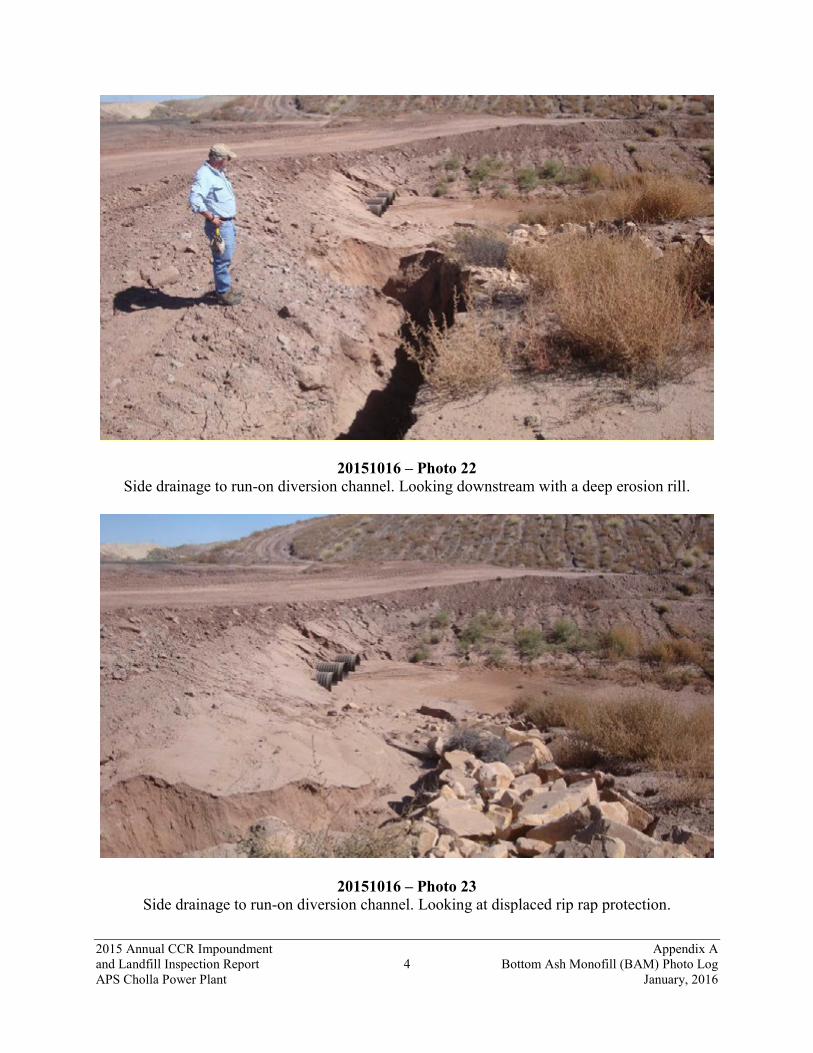
20151016 – Photo 22 Side drainage to run-on diversion channel. Looking downstream with a deep erosion rill.
20151016 – Photo 23 Side drainage to run-on diversion channel. Looking at displaced rip rap protection.

2015 Annual CCR Impoundment Appendix A and Landfill Inspection Report 5 Bottom Ash Monofill (BAM) Photo Log APS Cholla Power Plant January, 2016
20151016 – Photo 28 Run-off retention basin.