Embed Size (px)
Citation preview
Cholesterol is an important risk factor for heart disease and
current dietary recommendations do more good than harm
Jacques E. Rossouw, MBChB, FCP(SA), MD
Chief, Women’s Health Initiative Branch Program on Prevention and Population Sciences
Division of Cardiovascular Sciences National Heart, Lung, and Blood Institute
National Institutes of Health
No conflicts of interest
Disclosures
§ Serum Cholesterol as Risk Factor § The Diet-Heart Hypothesis § Diet, Obesity, and Diabetes
Outline
Serum Cholesterol as Risk Factor
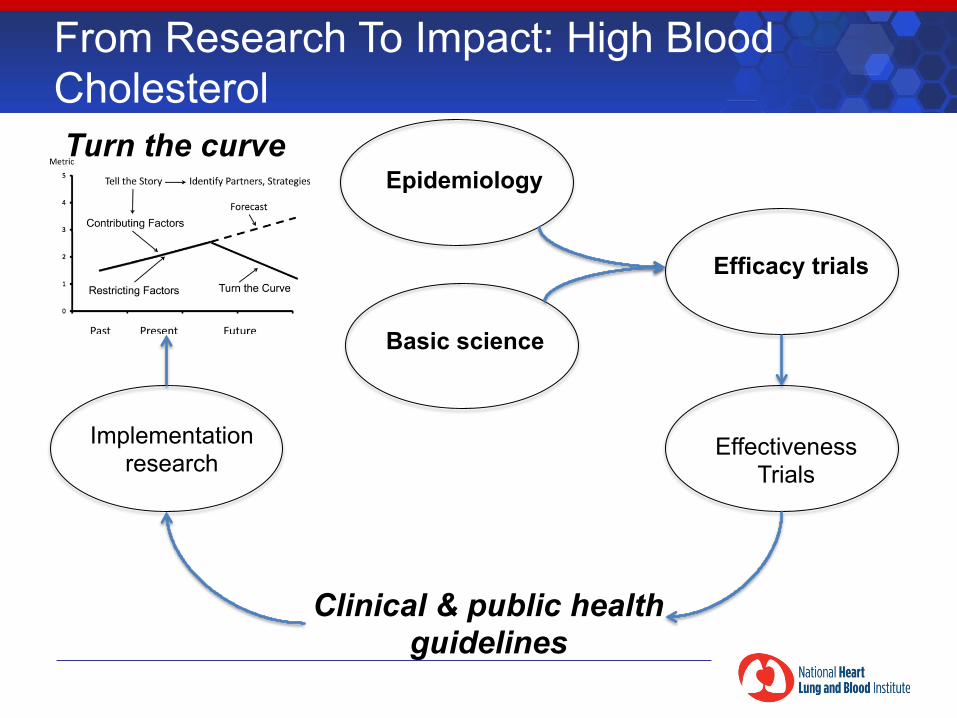
Basic science
Epidemiology
Efficacy trials
Effectiveness Trials
Clinical & public health guidelines
Turn the curve
From Research To Impact: High Blood Cholesterol
Implementation research
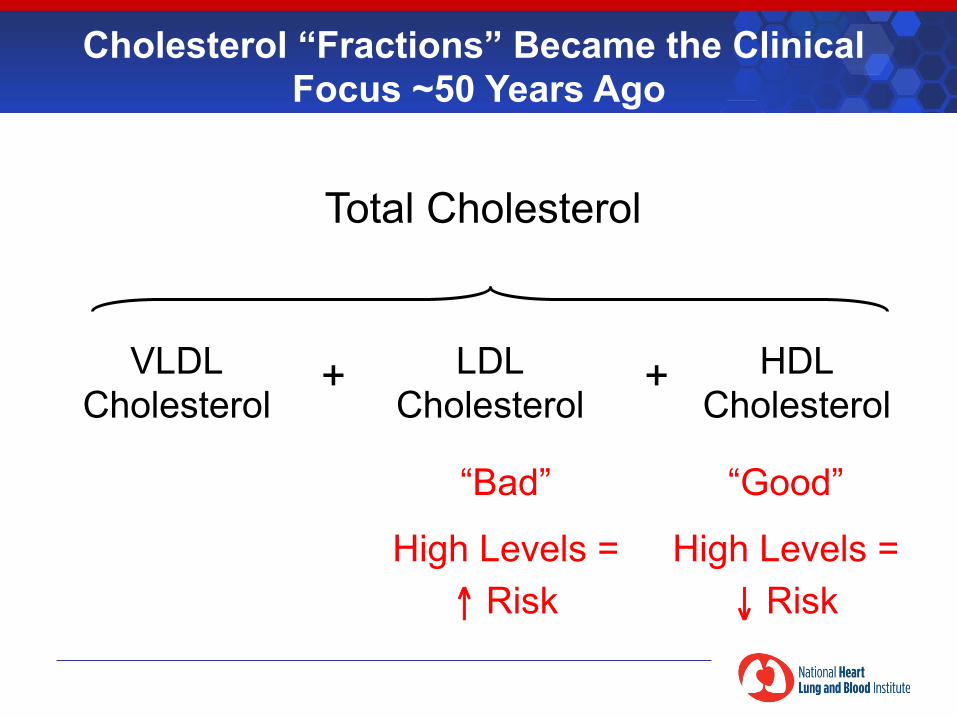
Cholesterol “Fractions” Became the Clinical Focus ~50 Years Ago
Total Cholesterol
“Bad”
High Levels = ↑ Risk
“Good”
High Levels = ↓ Risk
VLDL Cholesterol
LDL Cholesterol
HDL Cholesterol
+ +
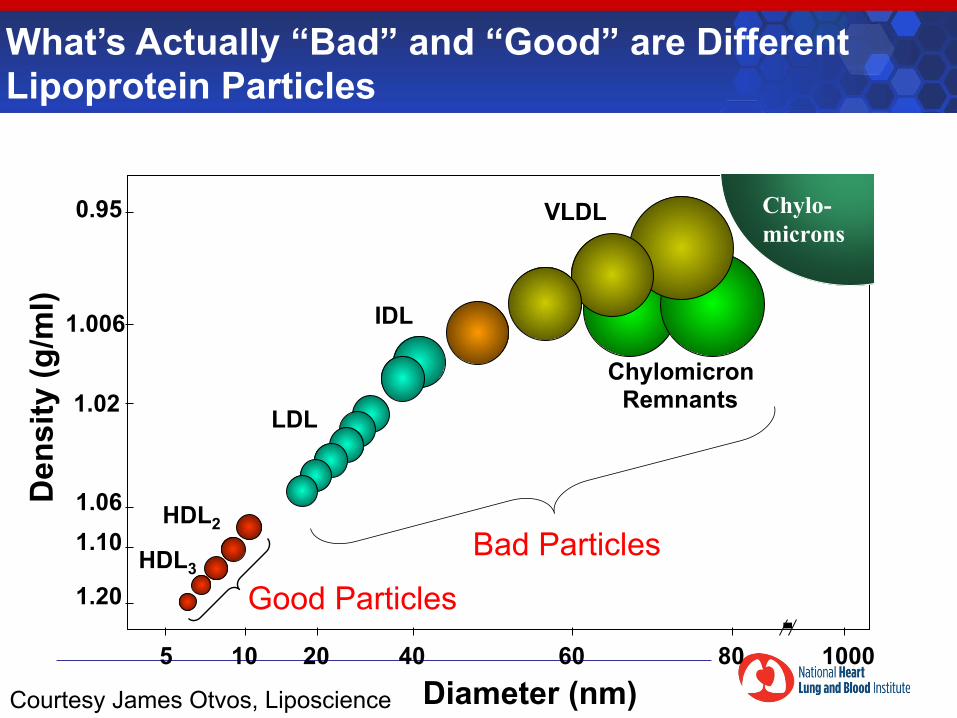
1.20
1.10 1.06
1.02
1.006
0.95
5 10 20 40 60 80 1000
Chylomicron Remnants
VLDL
IDL
HDL2
LDL
HDL3
Diameter (nm)
Den
sity
(g/m
l)
Chylo-micronsChylo-microns
Bad Particles
Good Particles
What’s Actually “Bad” and “Good” are Different Lipoprotein Particles
Courtesy James Otvos, Liposcience
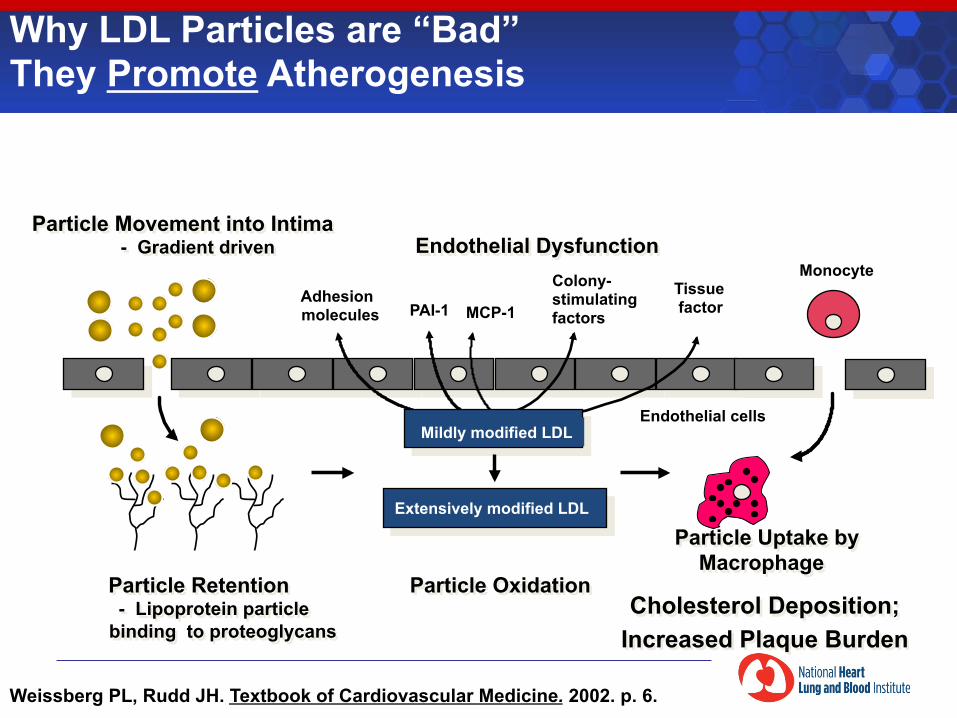
� Particle Uptake by Macrophage
Cholesterol Deposition; Increased Plaque Burden
Particle Movement into Intima - Gradient driven
� Particle Oxidation
Adhesion molecules MCP-1
Colony- stimulating factors
Tissue factor PAI-1
Endothelial cells
Monocyte
Particle Retention - Lipoprotein particle
binding to proteoglycans
Mildly modified LDL
Extensively modified LDL
� Endothelial Dysfunction
Weissberg PL, Rudd JH. Textbook of Cardiovascular Medicine. 2002. p. 6.
Why LDL Particles are “Bad” They Promote Atherogenesis
Lumen
Intima
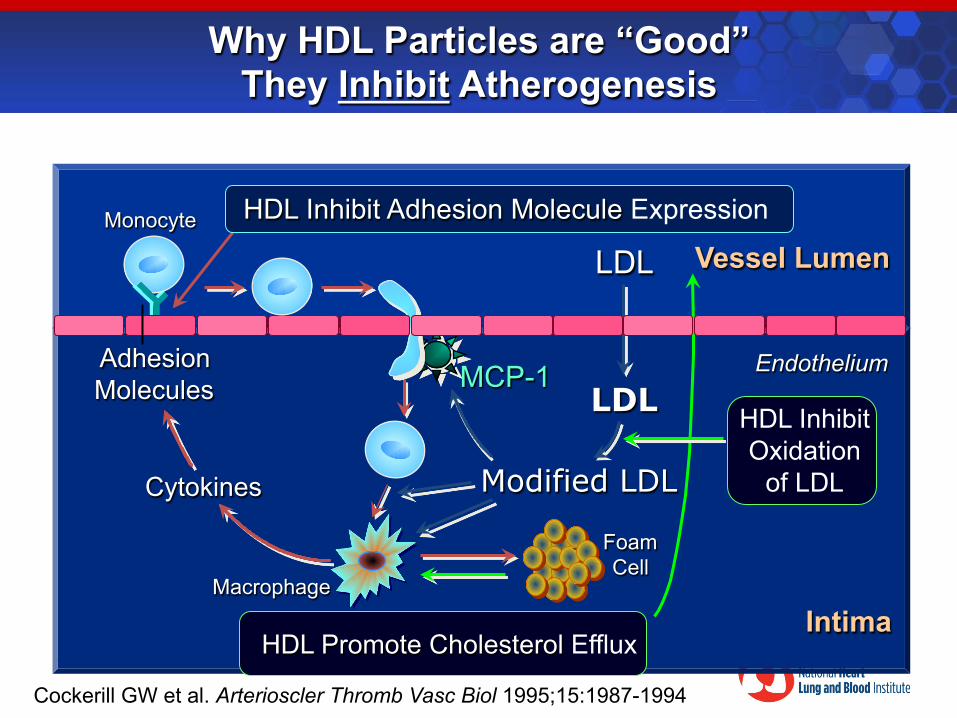
LDL
LDL
Cockerill GW et al. Arterioscler Thromb Vasc Biol 1995;15:1987-1994.
Endothelium
Vessel Lumen Monocyte
Modified LDL
Macrophage
MCP-1 Adhesion Molecules
Cytokines
Why HDL Particles are “Good” They Inhibit Atherogenesis
Intima
HDL Inhibit Adhesion Molecule Expression
Foam Cell
HDL Inhibit Oxidation
of LDL
HDL Promote Cholesterol Efflux
1.20
1.10 1.06
1.02
1.006
0.95
5 10 20 40 60 80 1000
Chylomicron Remnants
VLDL
IDL
HDL2
LDL
HDL3
Diameter (nm)
Den
sity
(g/m
l)
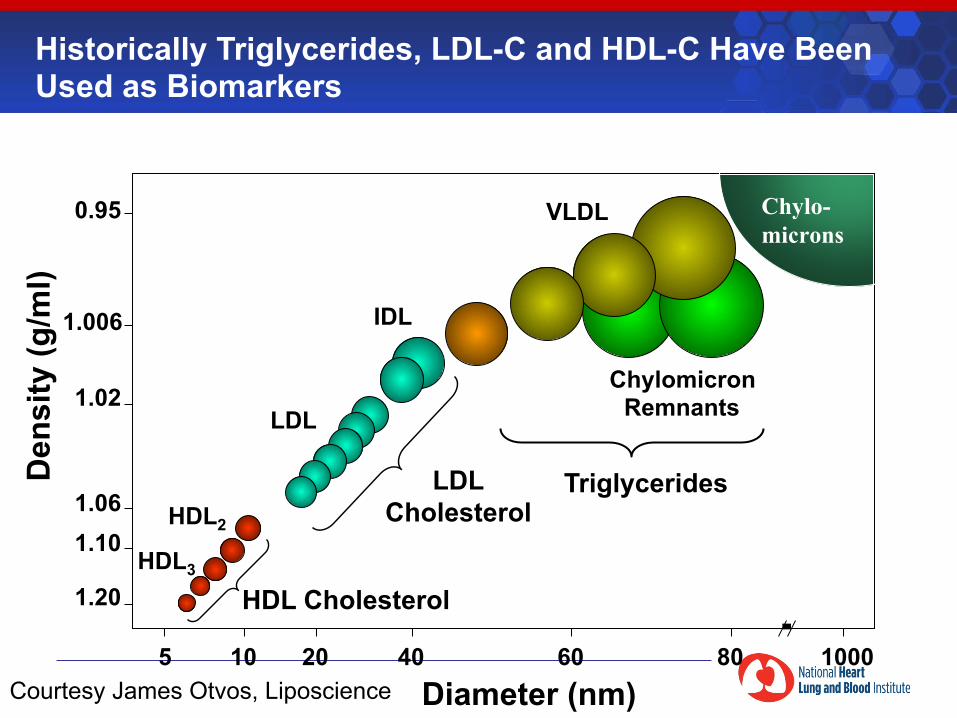
HDL Cholesterol
LDL Cholesterol
Triglycerides (mainly)
Chylo-micronsChylo-microns
Historically Triglycerides, LDL-C and HDL-C Have Been Used as Biomarkers
Courtesy James Otvos, Liposcience
1.20
1.10 1.06
1.02
1.006
0.95
5 10 20 40 60 80 1000
Chylomicron Remnants
VLDL
IDL
HDL2
LDL
HDL3
Diameter (nm)
Den
sity
(g/m
l)
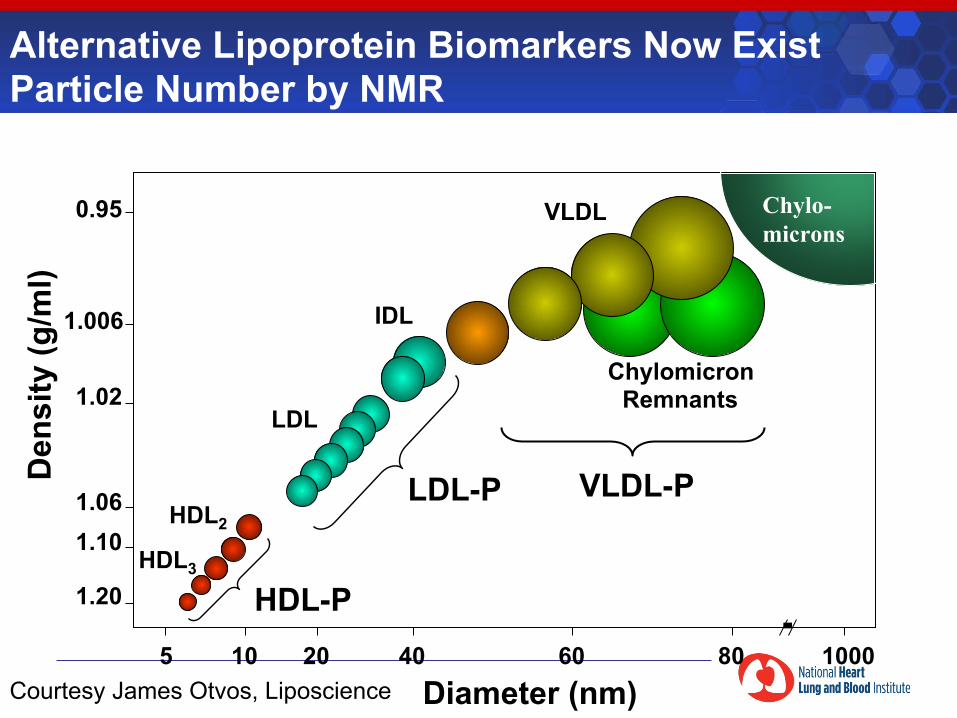
HDL-P
LDL-P VLDL-P
Chylo-micronsChylo-microns
Alternative Lipoprotein Biomarkers Now Exist Particle Number by NMR
Courtesy James Otvos, Liposcience
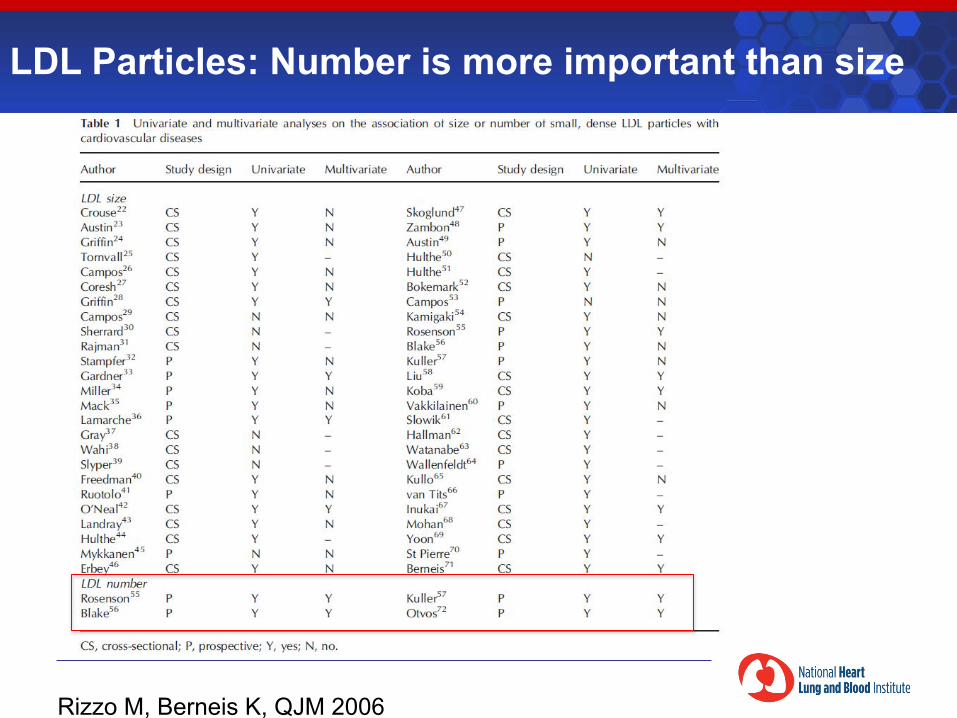
LDL Particles: Number is more important than size
Rizzo M, Berneis K, QJM 2006
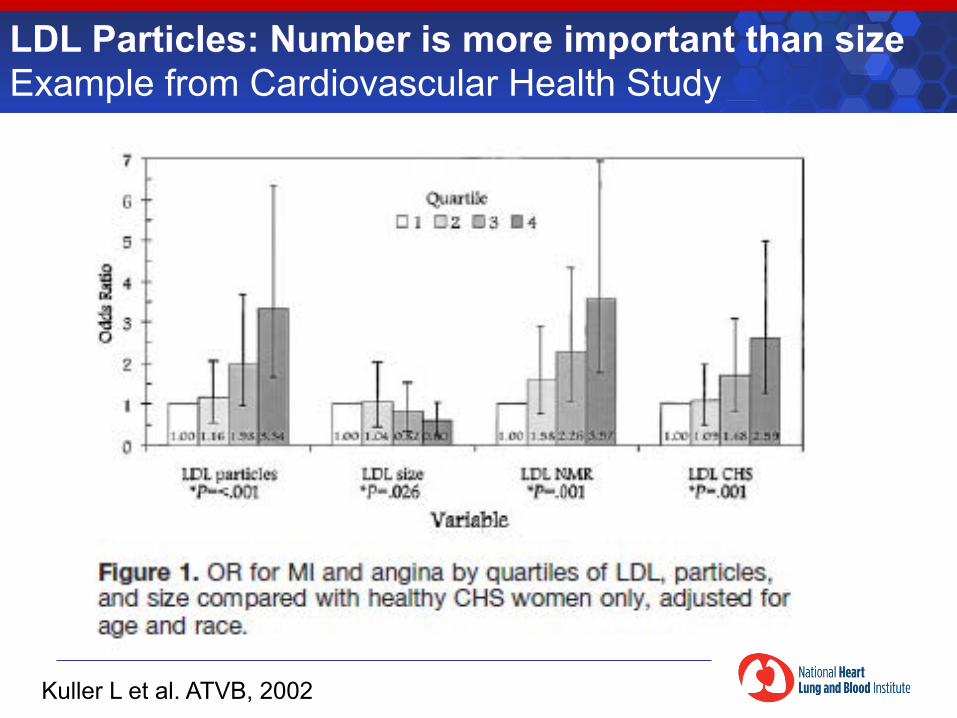
LDL Particles: Number is more important than size Example from Cardiovascular Health Study
Kuller L et al. ATVB, 2002

1.20
1.10 1.06
1.02
1.006
0.95
5 10 20 40 60 80 1000
Chylomicron Remnants
VLDL
IDL
HDL2
LDL
HDL3
Diameter (nm)
Den
sity
(g/m
l)
Chylo-micronsChylo-microns
Apo B Apo A-1
Alternative Lipoprotein Biomarkers Now Exist: Apolipoproteins
Courtesy James Otvos, Liposcience
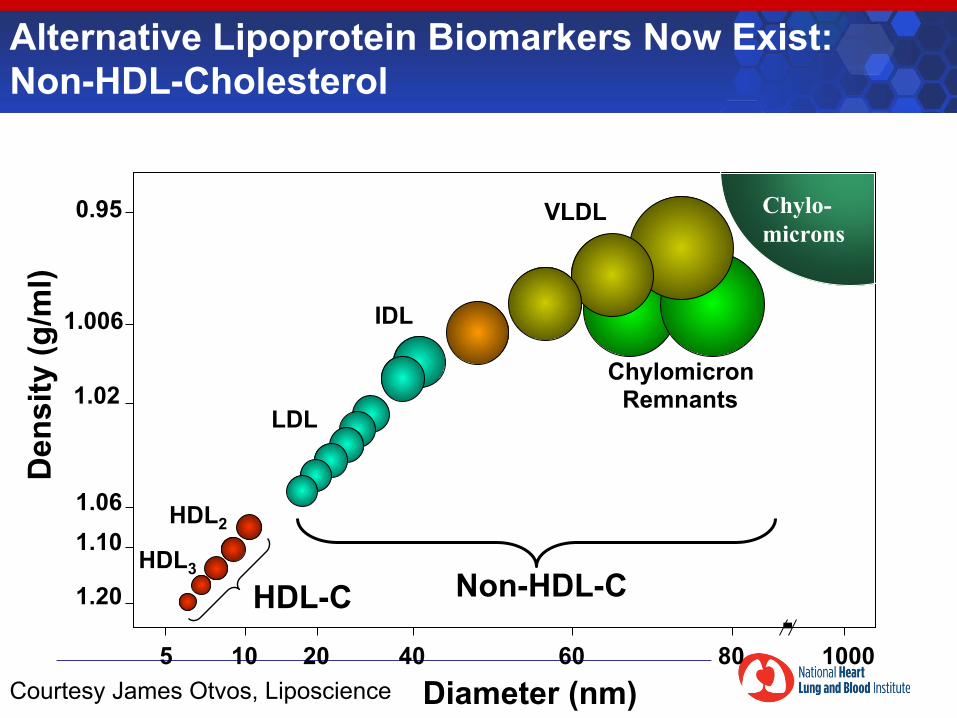
1.20
1.10 1.06
1.02
1.006
0.95
5 10 20 40 60 80 1000
Chylomicron Remnants
VLDL
IDL
HDL2
LDL
HDL3
Diameter (nm)
Den
sity
(g/m
l)
Chylo-micronsChylo-microns
Non-HDL-C HDL-C
Alternative Lipoprotein Biomarkers Now Exist: Non-HDL-Cholesterol
Courtesy James Otvos, Liposcience
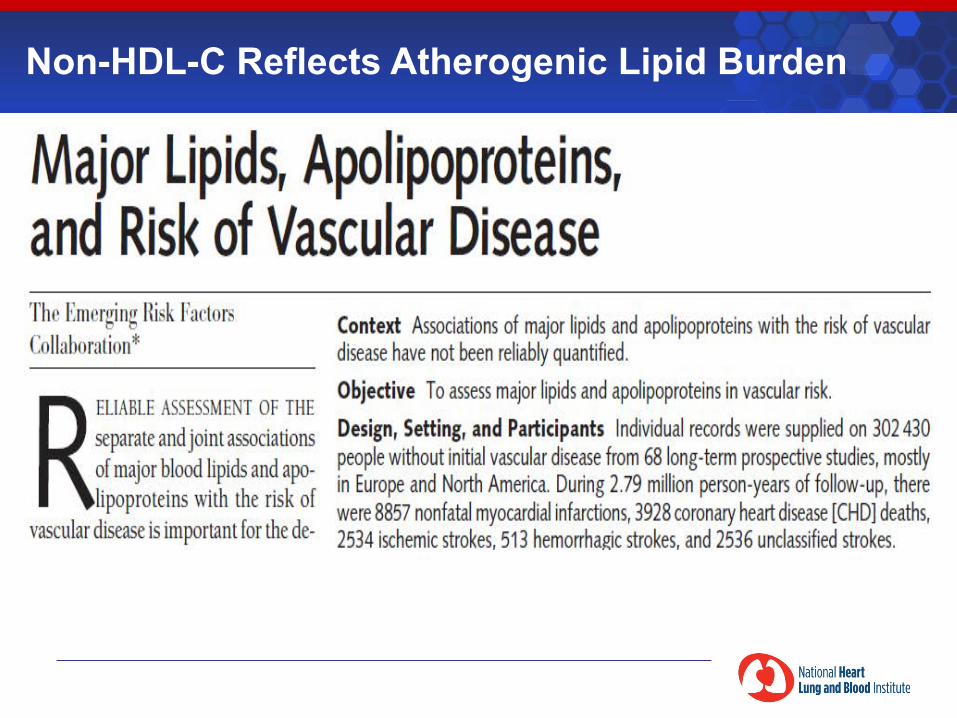
Non-HDL-C Reflects Atherogenic Lipid Burden
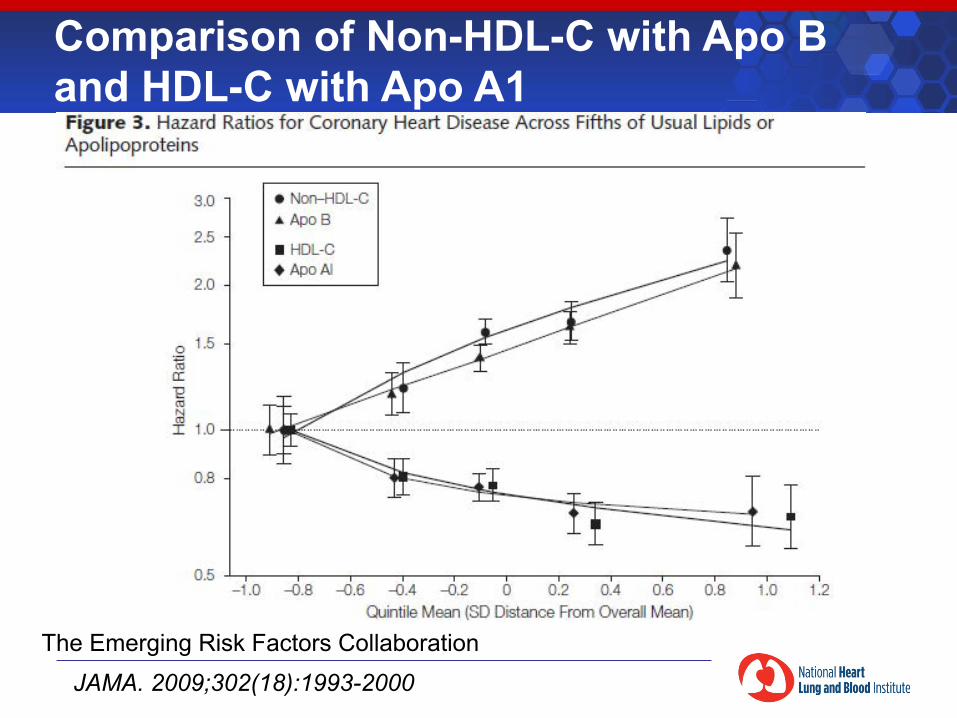
Comparison of Non-HDL-C with Apo B and HDL-C with Apo A1
The Emerging Risk Factors Collaboration
JAMA. 2009;302(18):1993-2000
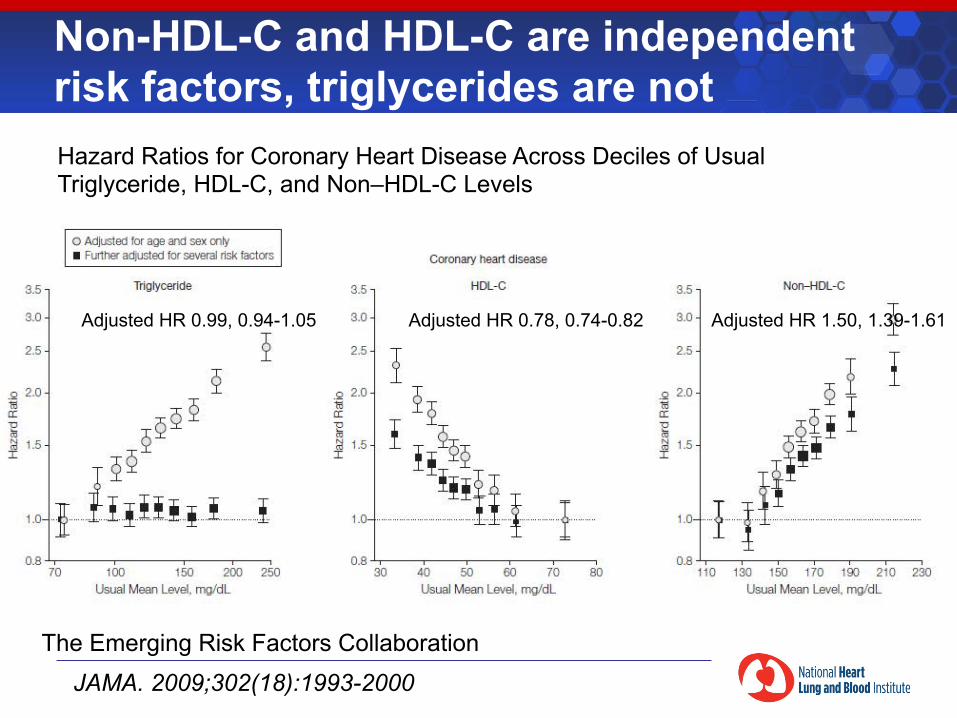
Non-HDL-C and HDL-C are independent risk factors, triglycerides are not Hazard Ratios for Coronary Heart Disease Across Deciles of Usual Triglyceride, HDL-C, and Non–HDL-C Levels
The Emerging Risk Factors Collaboration
JAMA. 2009;302(18):1993-2000
Adjusted HR 0.99, 0.94-1.05 Adjusted HR 0.78, 0.74-0.82 Adjusted HR 1.50, 1.39-1.61
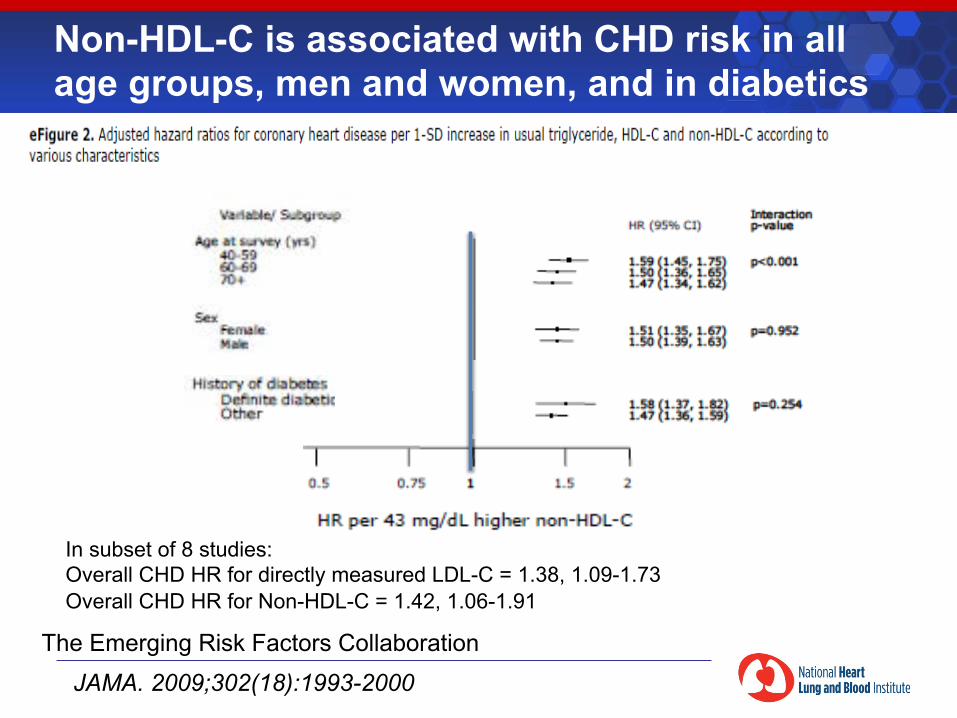
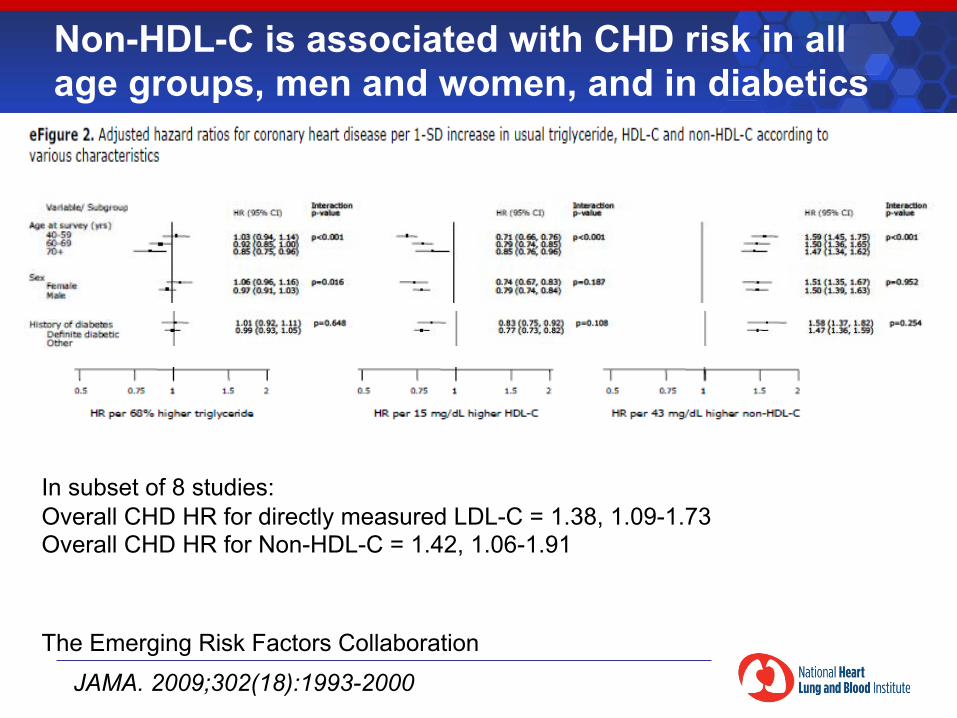
Non-HDL-C is associated with CHD risk in all age groups, men and women, and in diabetics
The Emerging Risk Factors Collaboration
JAMA. 2009;302(18):1993-2000
In subset of 8 studies: Overall CHD HR for directly measured LDL-C = 1.38, 1.09-1.73 Overall CHD HR for Non-HDL-C = 1.42, 1.06-1.91
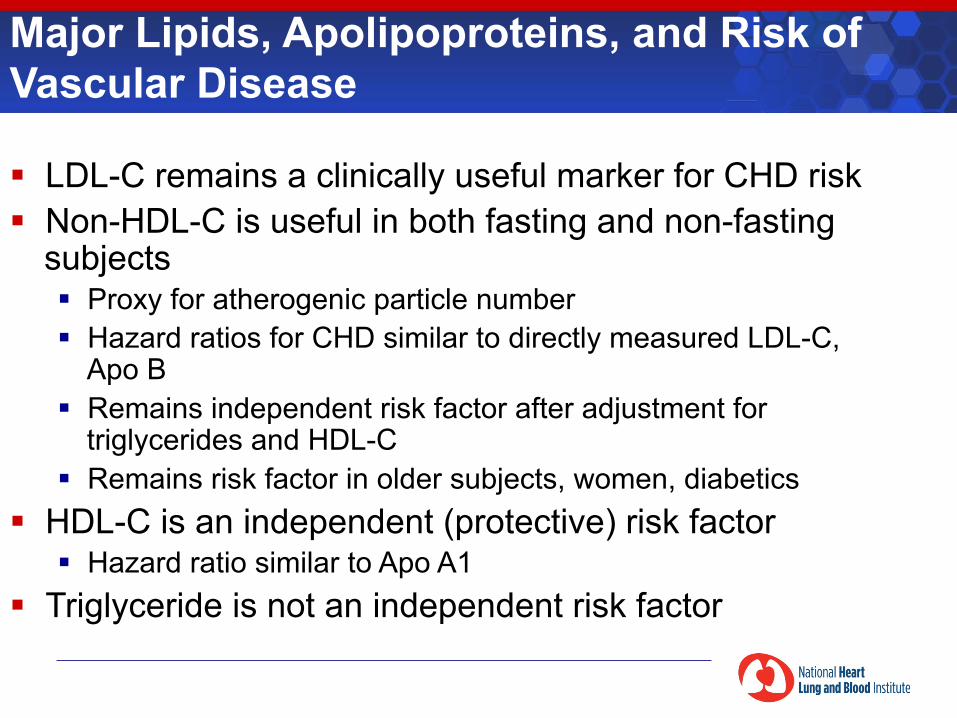
Major Lipids, Apolipoproteins, and Risk of Vascular Disease
§ LDL-C remains a clinically useful marker for CHD risk § Non-HDL-C is useful in both fasting and non-fasting
subjects § Proxy for atherogenic particle number § Hazard ratios for CHD similar to directly measured LDL-C,
Apo B § Remains independent risk factor after adjustment for
triglycerides and HDL-C § Remains risk factor in older subjects, women, diabetics
§ HDL-C is an independent (protective) risk factor § Hazard ratio similar to Apo A1
§ Triglyceride is not an independent risk factor
Integral to initiation and progression of coronary heart disease
Estimated heritability: ~40-50%
Rare monogenic conditions leading to very high (LDLR, APOB, LDLRAP1) or low (MTTP, APOB, PCSK9) LDL cholesterol
Causality of low density lipoprotein (LDL) cholesteroll
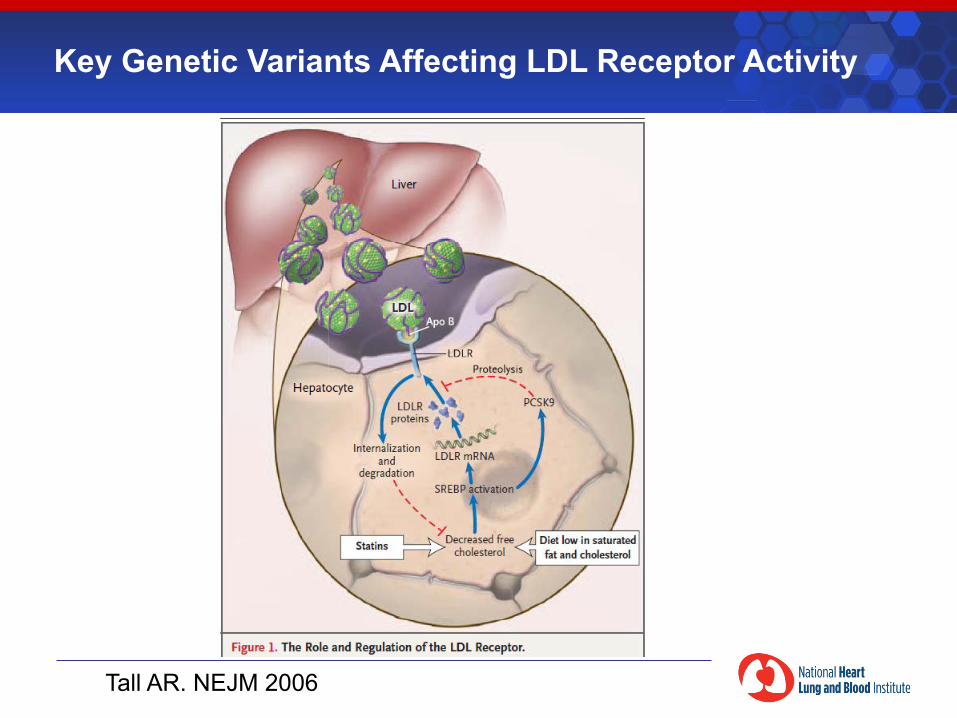
Key Genetic Variants Affecting LDL Receptor Activity
Tall AR. NEJM 2006
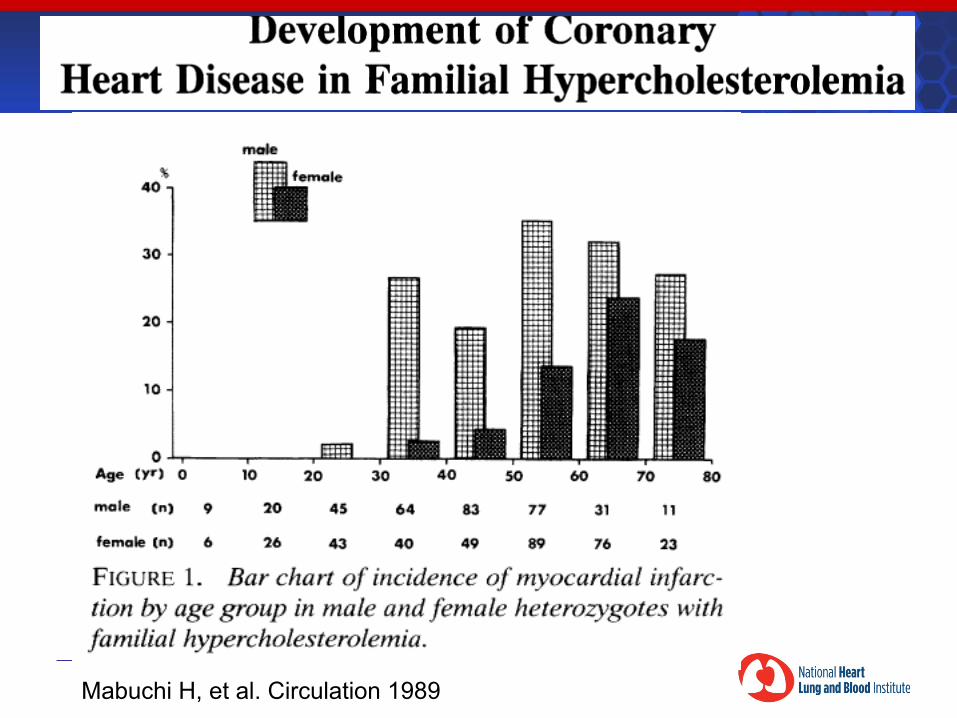
Mabuchi H, et al. Circulation 1989
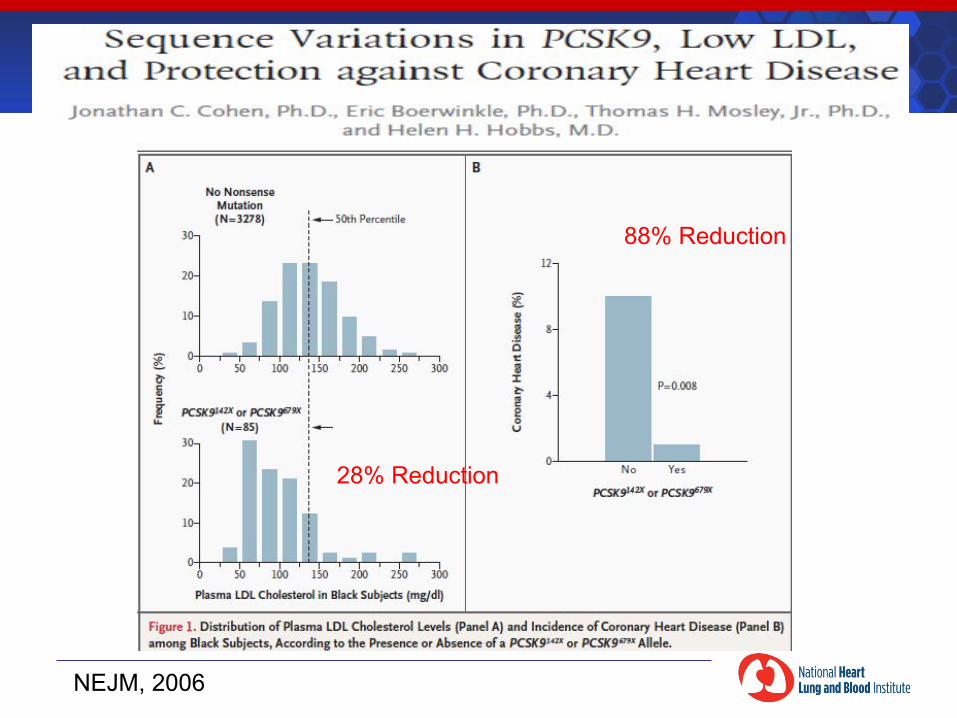
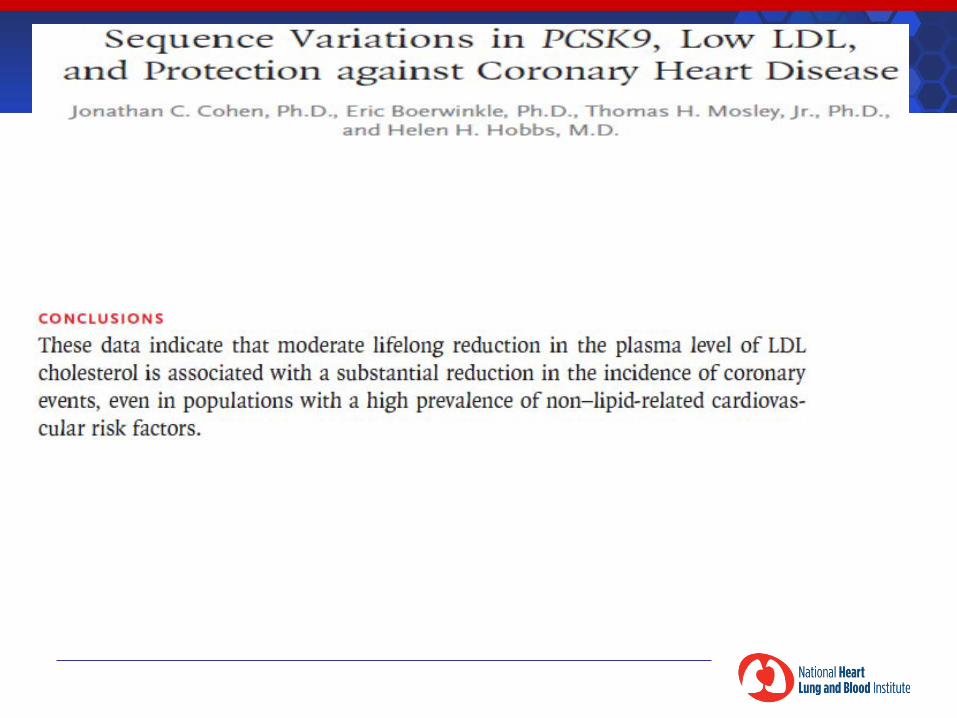
NEJM, 2006
28% Reduction
88% Reduction
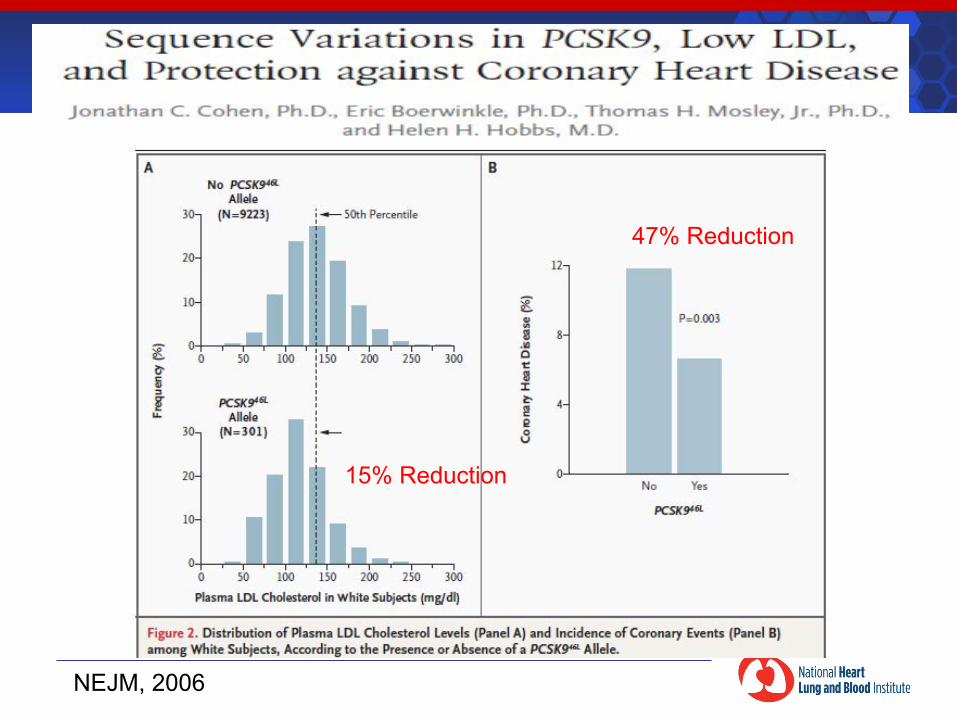
NEJM, 2006
15% Reduction
47% Reduction
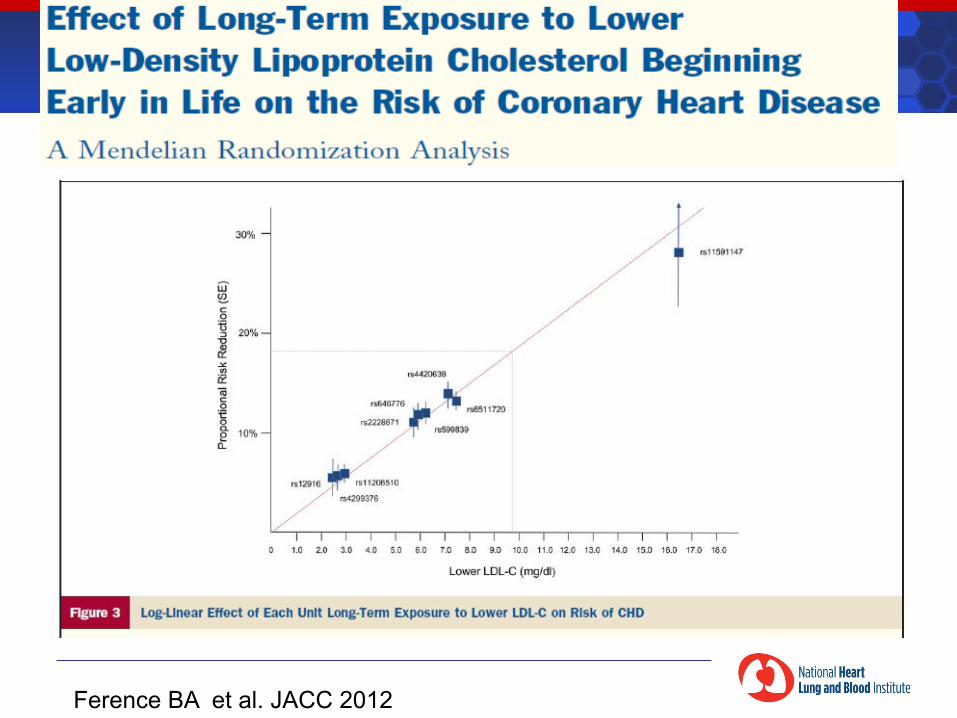
Ference BA et al. JACC 2012
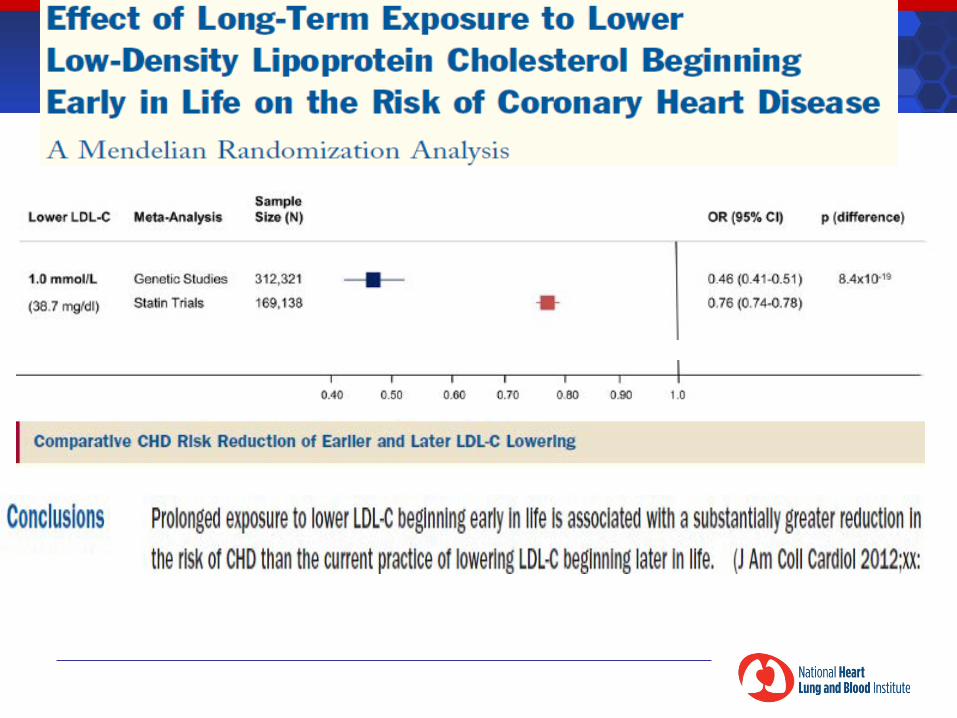
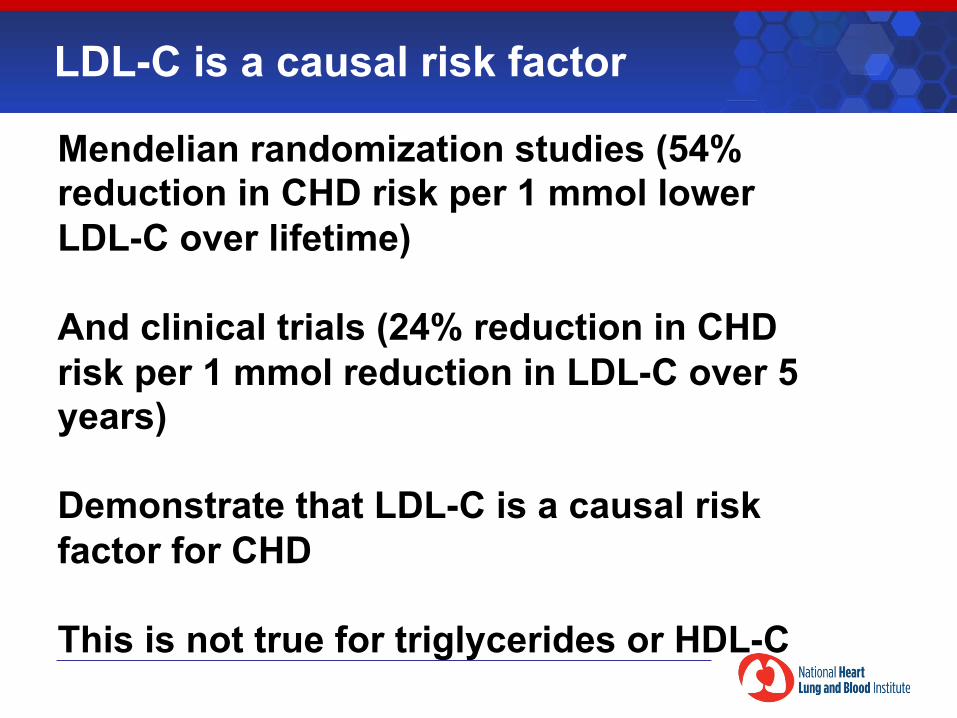
LDL-C is a causal risk factor
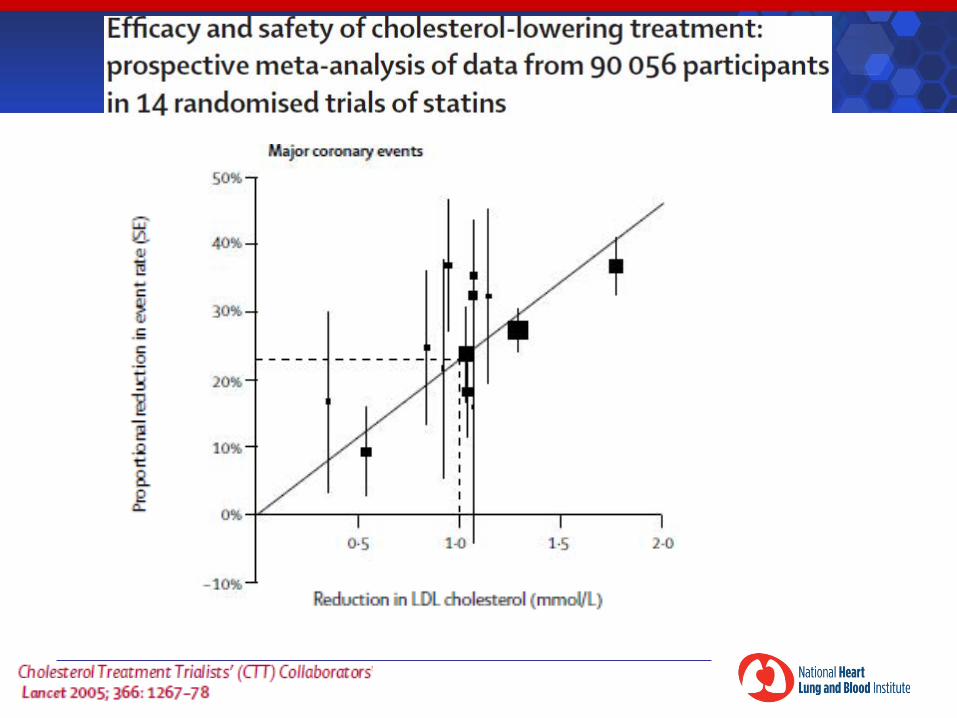
Mendelian randomization studies (54% reduction in CHD risk per 1 mmol lower LDL-C over lifetime) And clinical trials (24% reduction in CHD risk per 1 mmol reduction in LDL-C over 5 years) Demonstrate that LDL-C is a causal risk factor for CHD This is not true for triglycerides or HDL-C
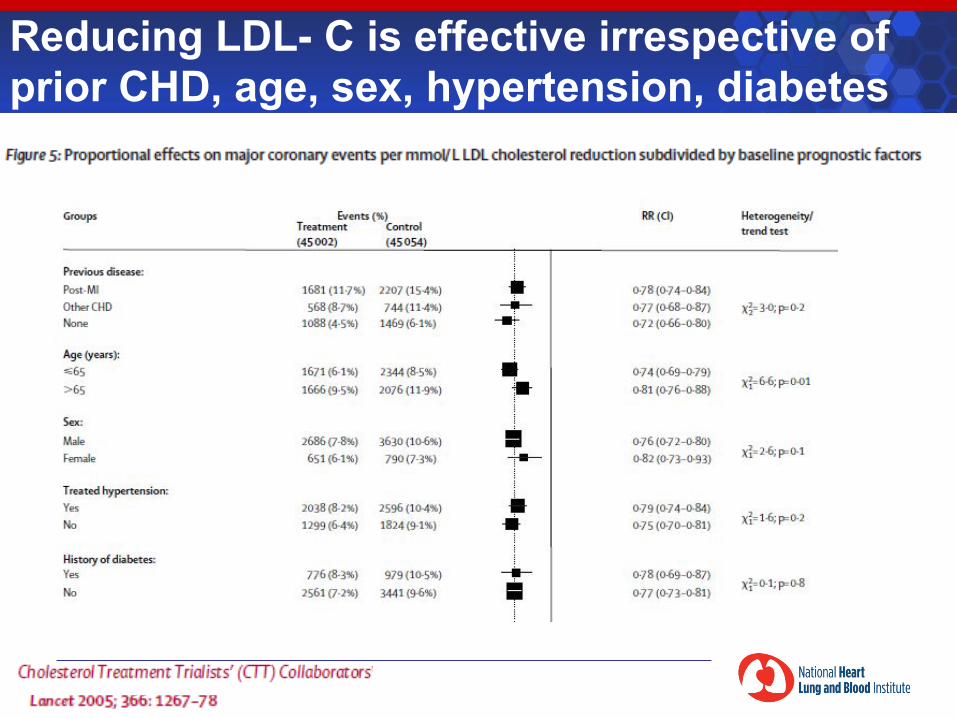
Reducing LDL- C is effective irrespective of prior CHD, age, sex, hypertension, diabetes
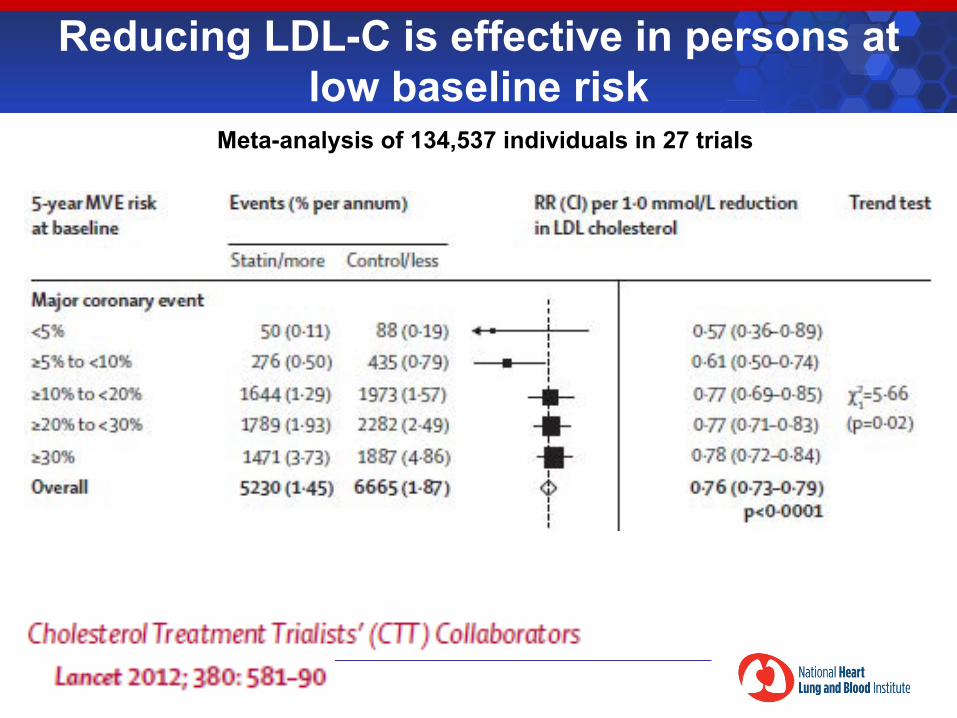
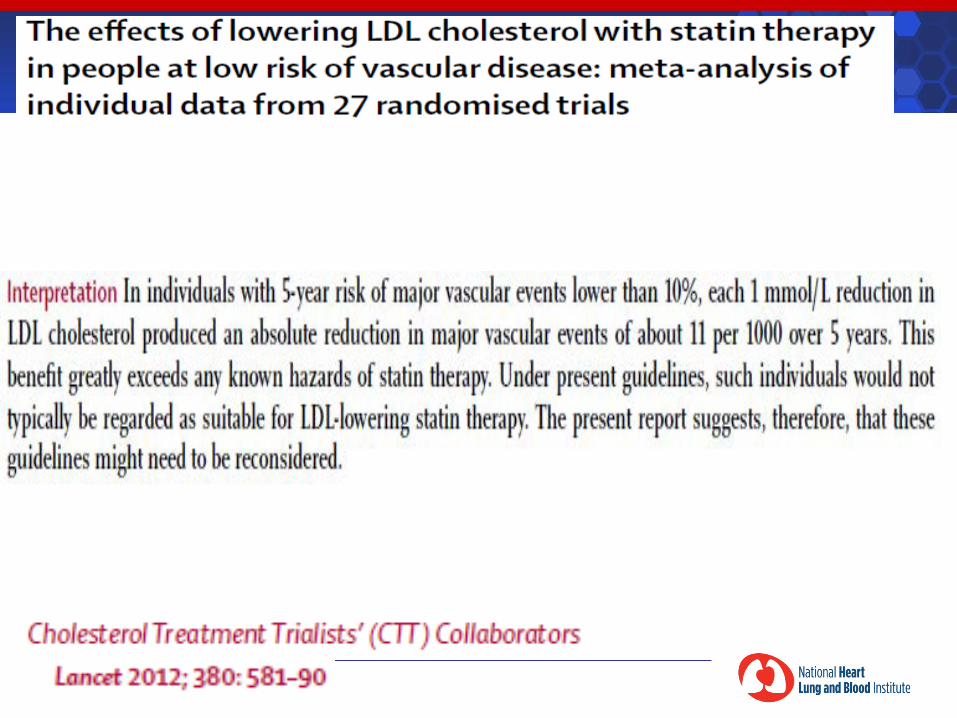
Reducing LDL-C is effective in persons at low baseline risk
Meta-analysis of 134,537 individuals in 27 trials
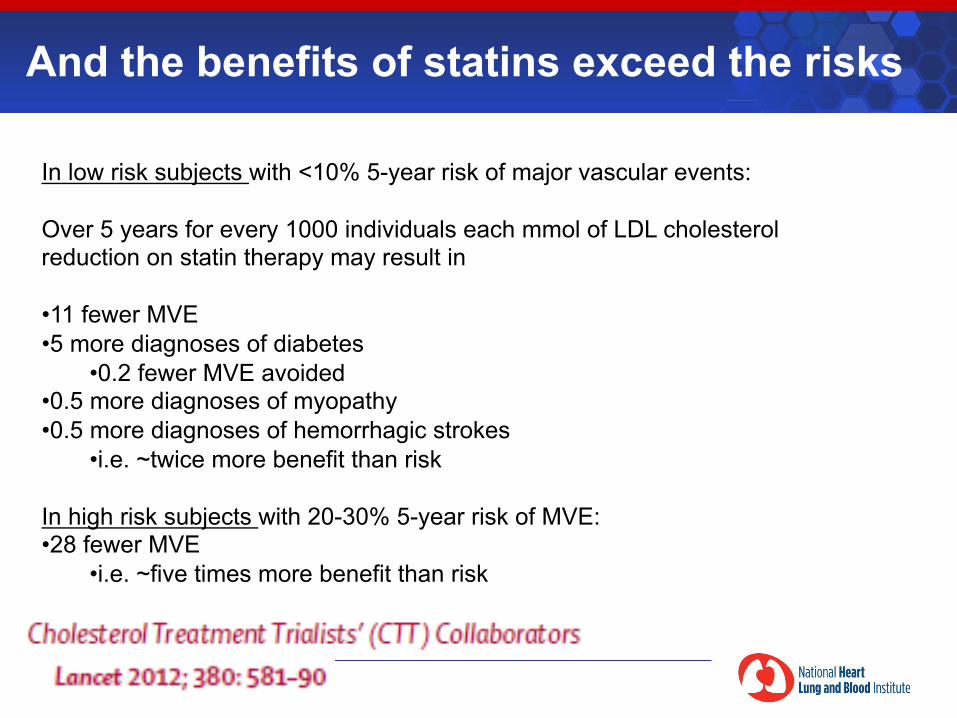
And the benefits of statins exceed the risks
In low risk subjects with <10% 5-year risk of major vascular events: Over 5 years for every 1000 individuals each mmol of LDL cholesterol reduction on statin therapy may result in • 11 fewer MVE • 5 more diagnoses of diabetes
• 0.2 fewer MVE avoided • 0.5 more diagnoses of myopathy • 0.5 more diagnoses of hemorrhagic strokes
• i.e. ~twice more benefit than risk
In high risk subjects with 20-30% 5-year risk of MVE: • 28 fewer MVE
• i.e. ~five times more benefit than risk
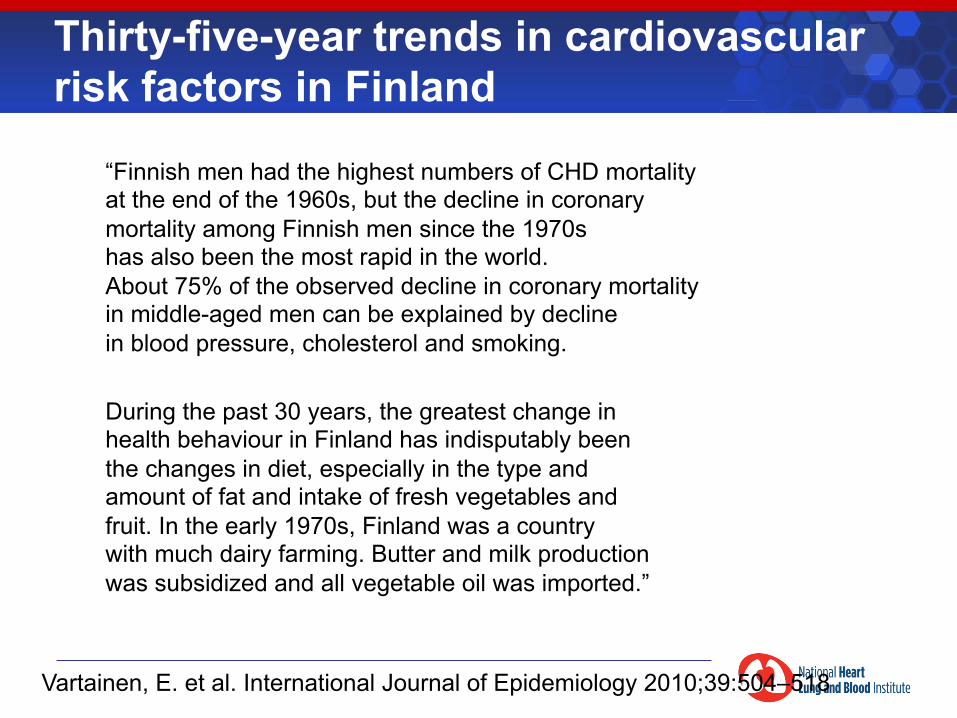
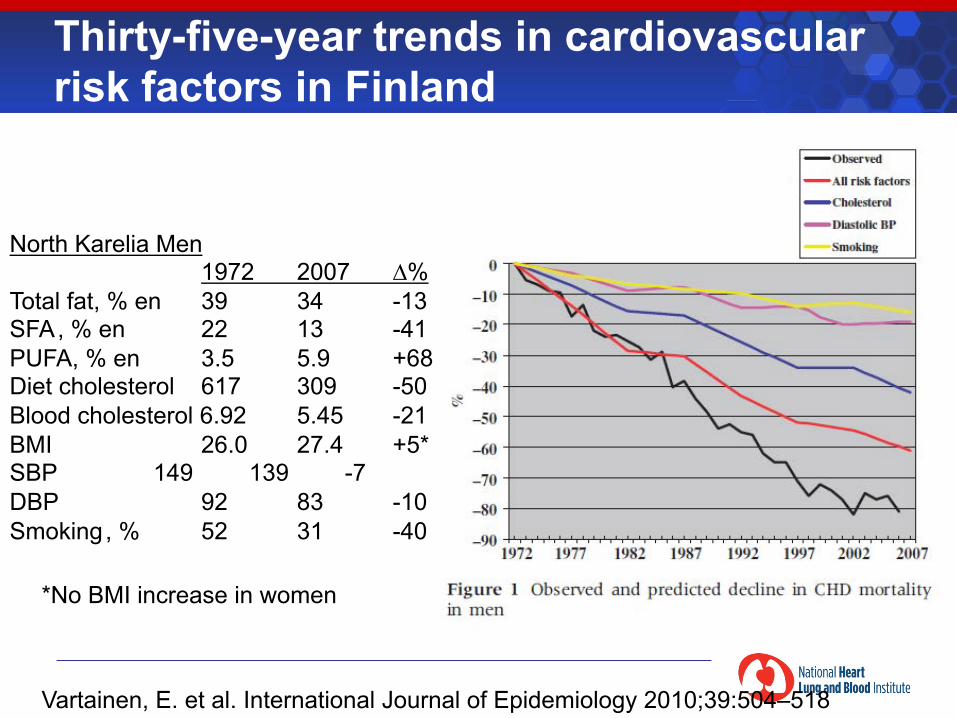
Thirty-five-year trends in cardiovascular risk factors in Finland
Vartainen, E. et al. International Journal of Epidemiology 2010;39:504–518
“Finnish men had the highest numbers of CHD mortality at the end of the 1960s, but the decline in coronary mortality among Finnish men since the 1970s has also been the most rapid in the world. About 75% of the observed decline in coronary mortality in middle-aged men can be explained by decline in blood pressure, cholesterol and smoking.
During the past 30 years, the greatest change in health behaviour in Finland has indisputably been the changes in diet, especially in the type and amount of fat and intake of fresh vegetables and fruit. In the early 1970s, Finland was a country with much dairy farming. Butter and milk production was subsidized and all vegetable oil was imported.”
Thirty-five-year trends in cardiovascular risk factors in Finland
Vartainen, E. et al. International Journal of Epidemiology 2010;39:504–518
North Karelia Men 1972 2007 ∆%
Total fat, % en 39 34 -13 SFA , % en 22 13 -41 PUFA, % en 3.5 5.9 +68 Diet cholesterol 617 309 -50 Blood cholesterol 6.92 5.45 -21 BMI 26.0 27.4 +5* SBP 149 139 -7 DBP 92 83 -10 Smoking , % 52 31 -40
*No BMI increase in women
©2011 American Heart Association, Inc. All rights reserved. Roger VL et al. Published online in Circulation Dec. 15, 2011
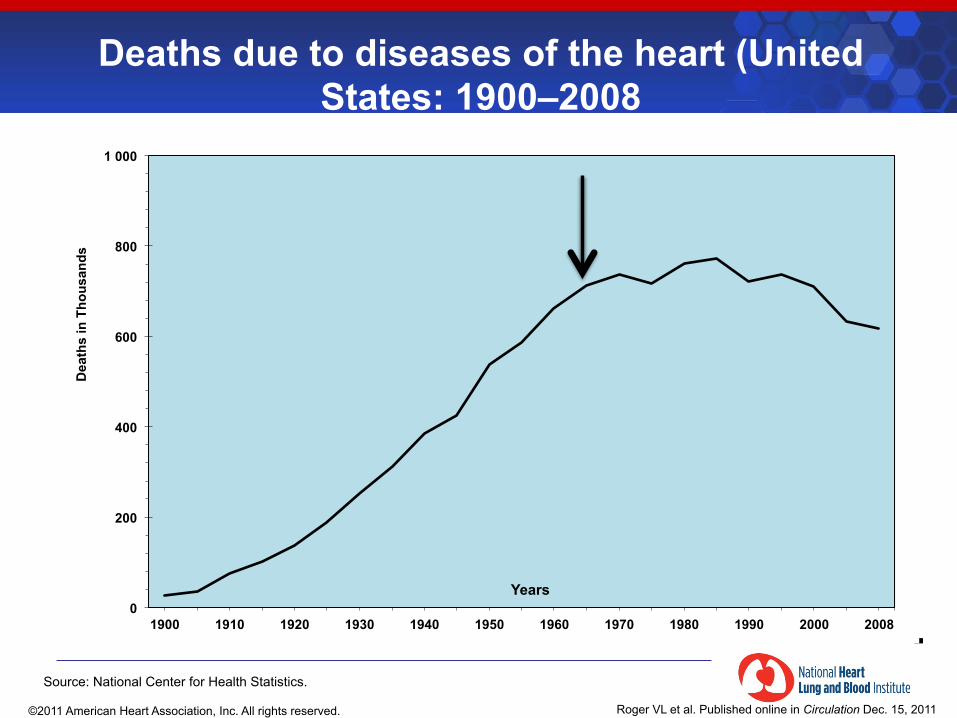
Deaths due to diseases of the heart (United States: 1900–2008
0
200
400
600
800
1 000
1900 1910 1920 1930 1940 1950 1960 1970 1980 1990 2000 2008
Dea
ths
in T
hous
ands
Years
Source: National Center for Health Statistics.
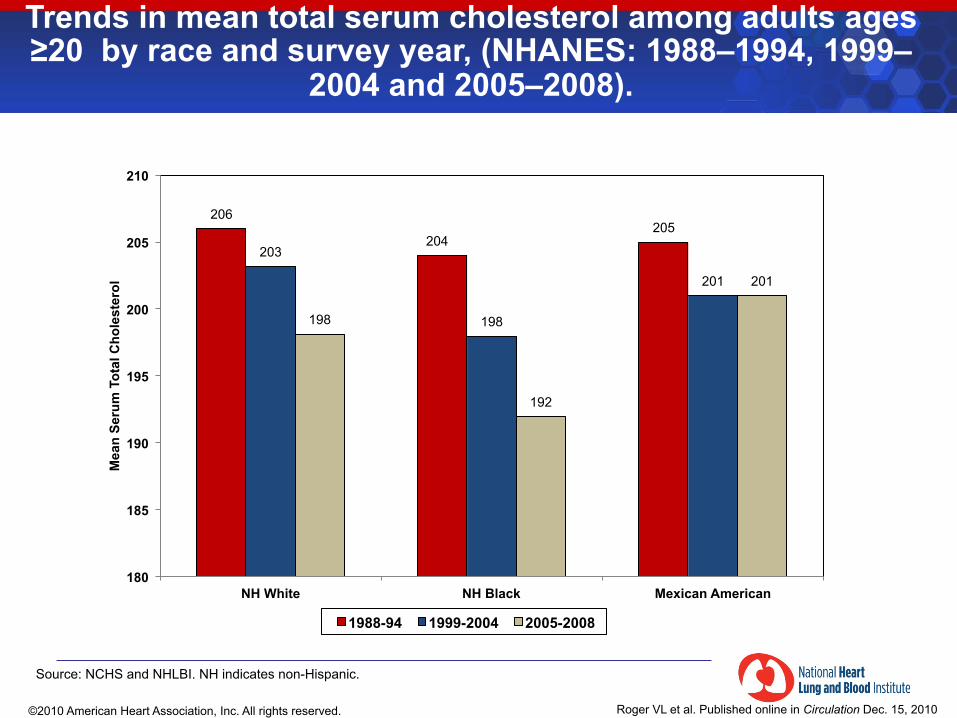
Trends in mean total serum cholesterol among adults ages ≥20 by race and survey year, (NHANES: 1988–1994, 1999–
2004 and 2005–2008).
206
204 205
203
198
201
198
192
201
180
185
190
195
200
205
210
NH White NH Black Mexican American
Mea
n Se
rum
Tot
al C
hole
ster
ol
1988-94 1999-2004 2005-2008
Source: NCHS and NHLBI. NH indicates non-Hispanic.
©2010 American Heart Association, Inc. All rights reserved.
Roger VL et al. Published online in Circulation Dec. 15, 2010
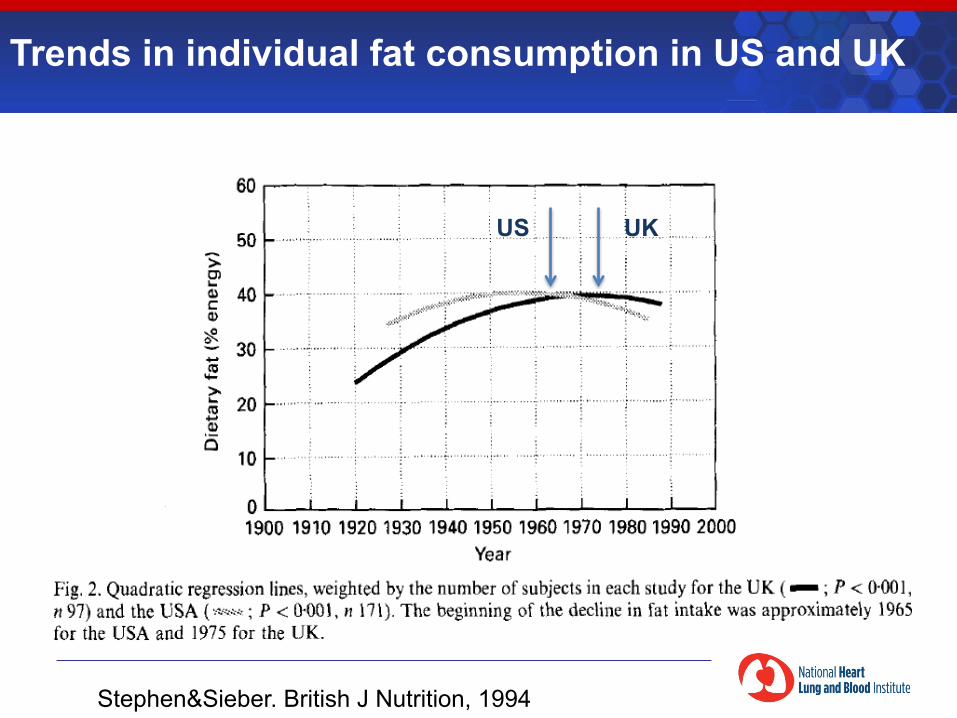
Stephen&Sieber. British J Nutrition, 1994
US UK
Trends in individual fat consumption in US and UK
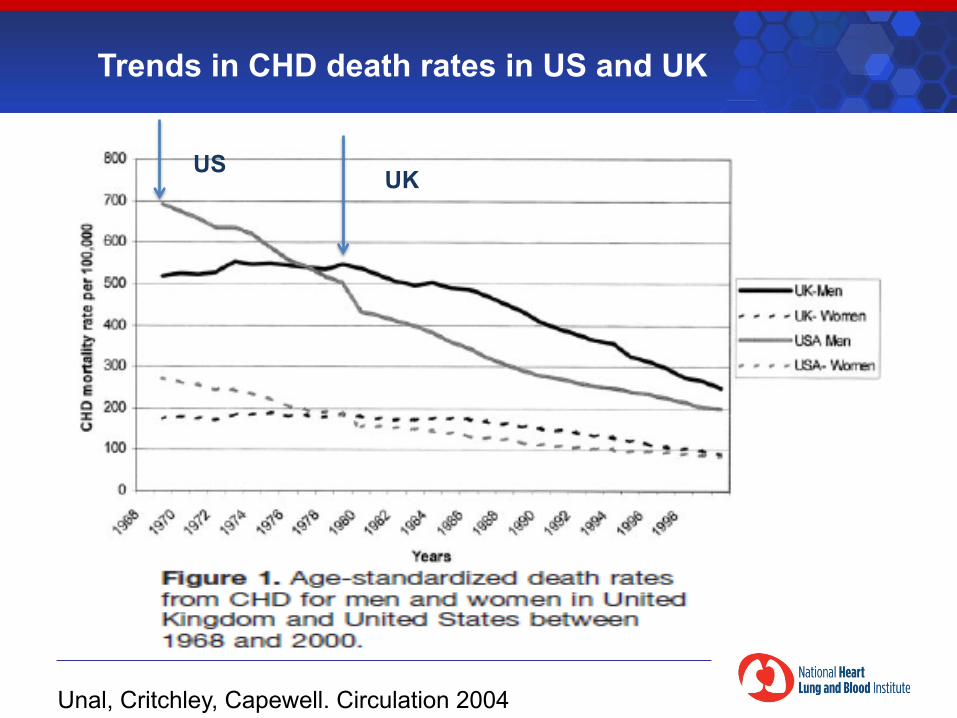
Unal, Critchley, Capewell. Circulation 2004
UK
US
Trends in CHD death rates in US and UK
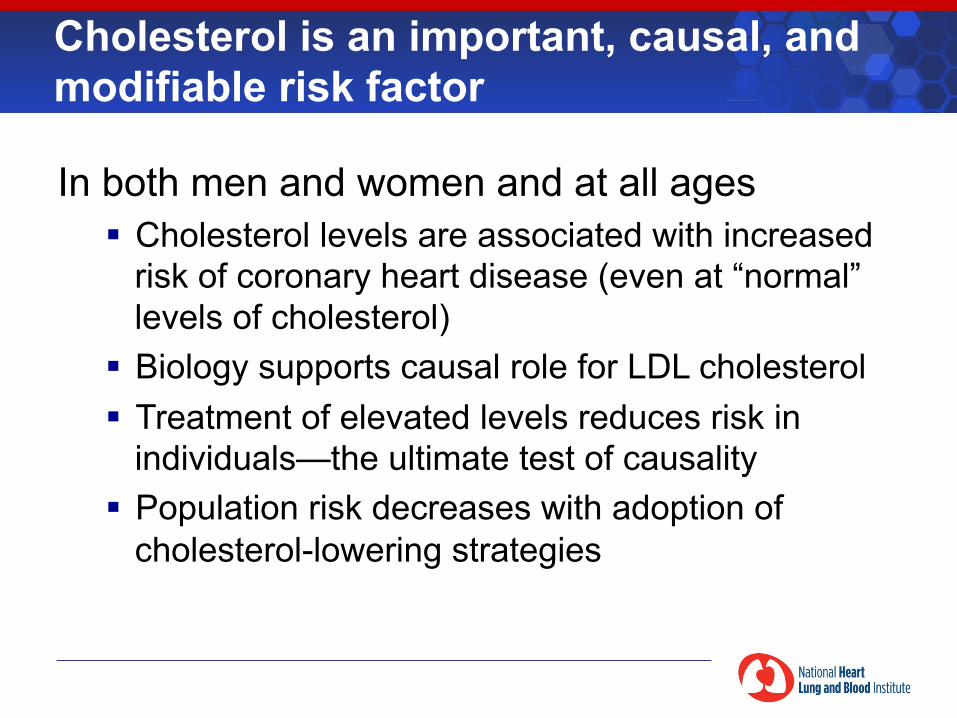
In both men and women and at all ages § Cholesterol levels are associated with increased
risk of coronary heart disease (even at “normal” levels of cholesterol)
§ Biology supports causal role for LDL cholesterol § Treatment of elevated levels reduces risk in
individuals—the ultimate test of causality § Population risk decreases with adoption of
cholesterol-lowering strategies
Cholesterol is an important, causal, and modifiable risk factor
The Diet-Heart Hypothesis
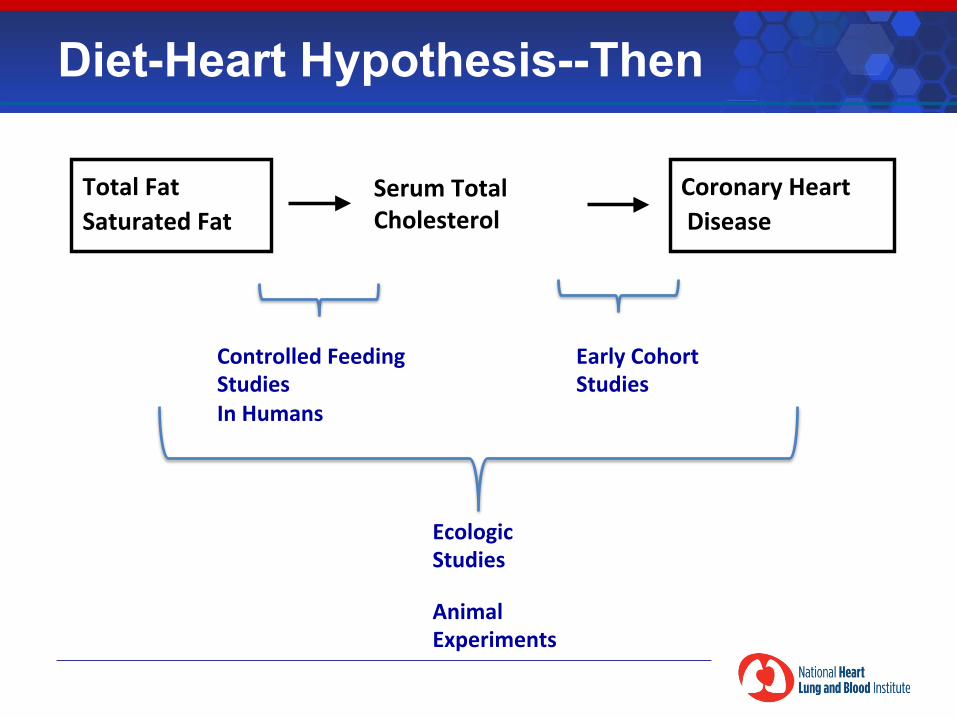
Total Fat Saturated Fat
Serum Total Cholesterol
Coronary Heart Disease
Ecologic Studies
Controlled Feeding Studies In Humans
Animal Experiments
Diet-Heart Hypothesis--Then
Early Cohort Studies
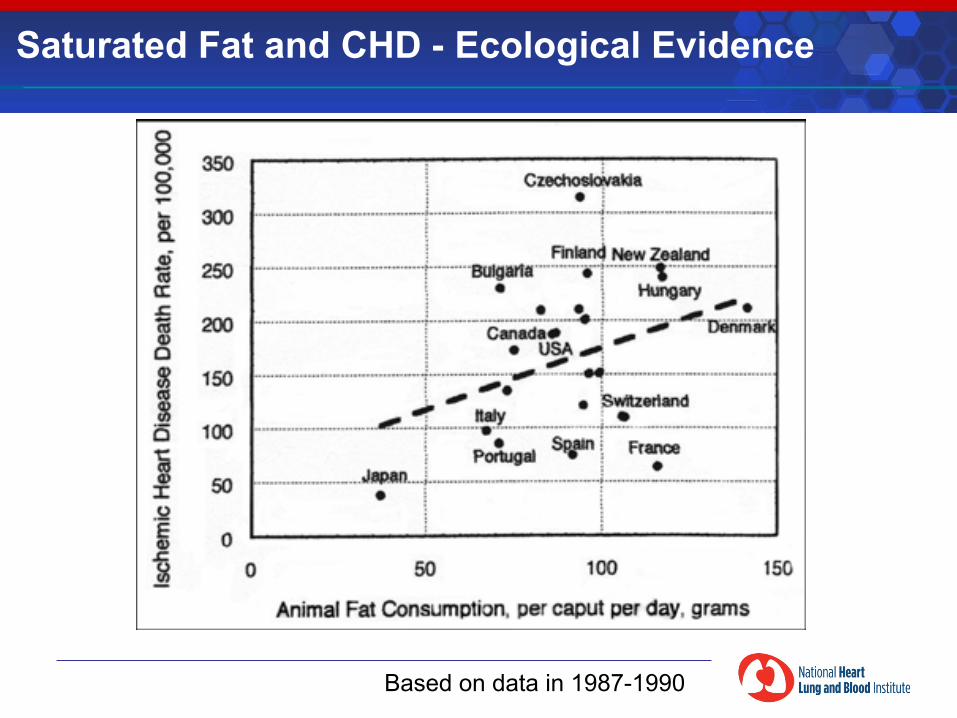
Based on data in 1987-1990
Saturated Fat and CHD - Ecological Evidence
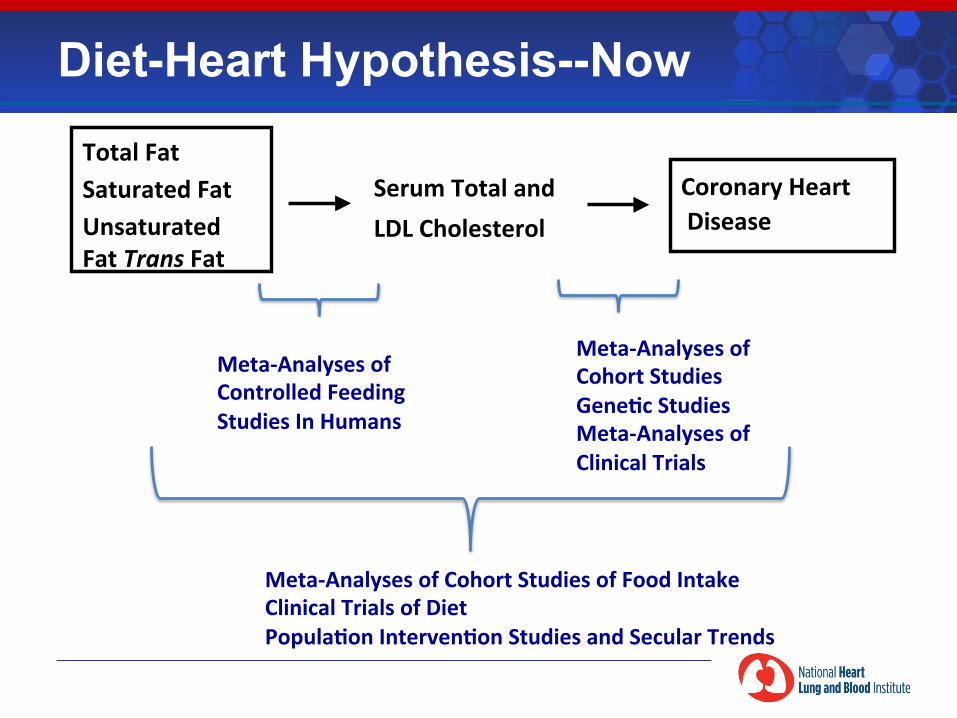
Total Fat Saturated Fat Unsaturated Fat Trans Fat
Serum Total and LDL Cholesterol
Coronary Heart Disease
Meta-‐Analyses of Cohort Studies of Food Intake Clinical Trials of Diet PopulaDon IntervenDon Studies and Secular Trends
Diet-Heart Hypothesis--Now
Meta-‐Analyses of Cohort Studies GeneDc Studies Meta-‐Analyses of Clinical Trials
Meta-‐Analyses of Controlled Feeding Studies In Humans
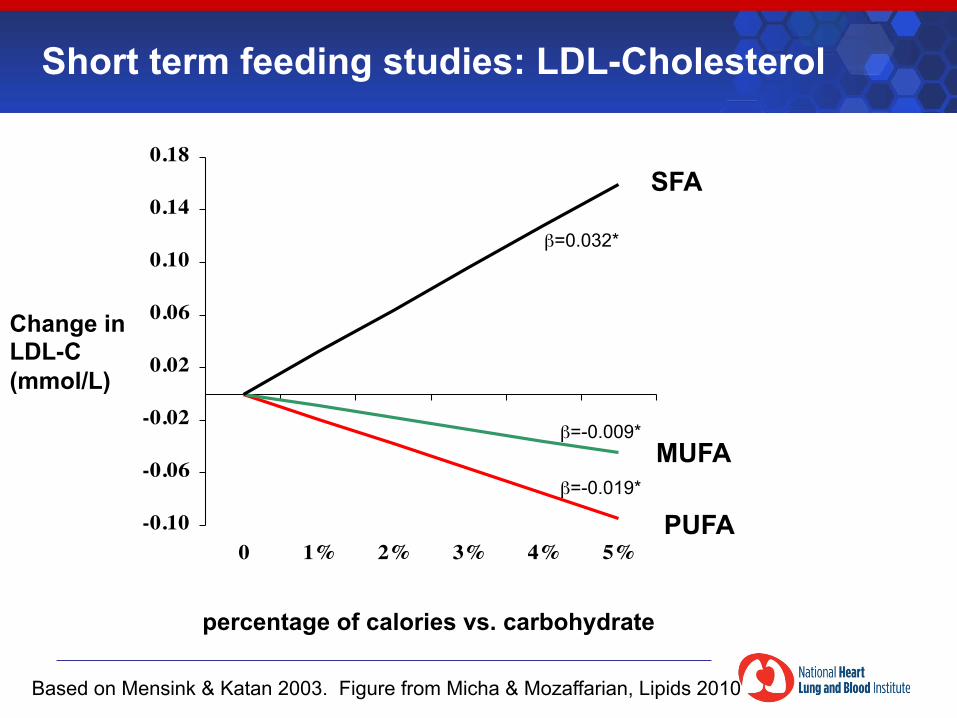
Based on Mensink & Katan 2003. Figure from Micha & Mozaffarian, Lipids 2010
Short term feeding studies: LDL-Cholesterol
-0.10
-0.06
-0.02
0.02
0.06
0.10
0.14
0.18
0 1% 2% 3% 4% 5%
β=0.032*
β=-0.009*
β=-0.019*
PUFA
MUFA
SFA
percentage of calories vs. carbohydrate
Change in LDL-C (mmol/L)
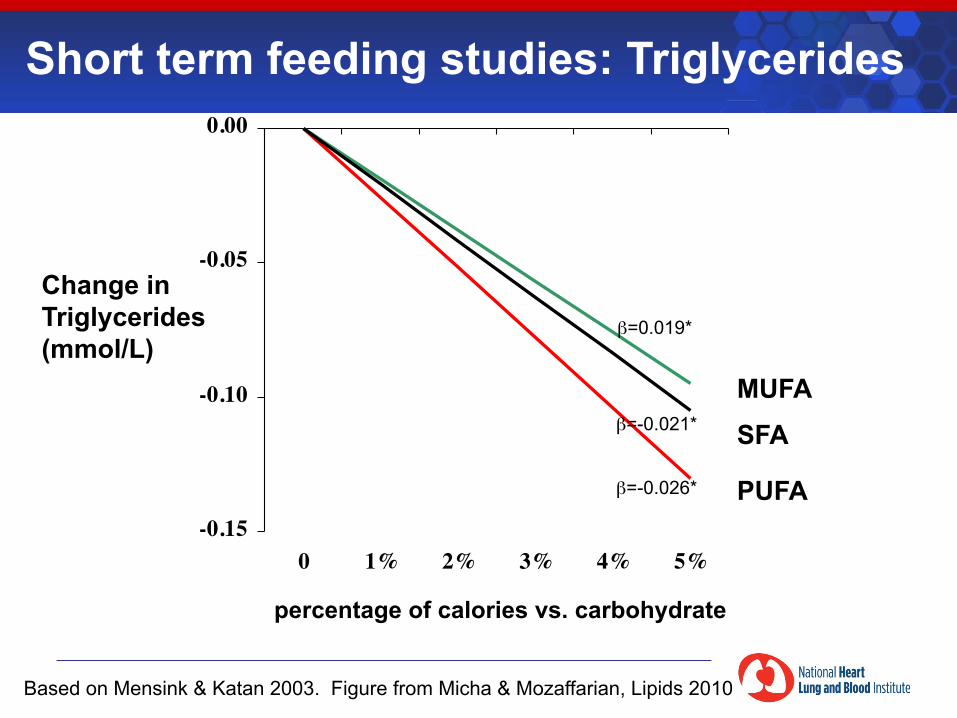
Short term feeding studies: Triglycerides
-0.15
-0.10
-0.05
0.00
0 1% 2% 3% 4% 5%
β=0.019*
β=-0.021*
β=-0.026* PUFA
MUFA SFA
percentage of calories vs. carbohydrate
Change in Triglycerides (mmol/L)
Based on Mensink & Katan 2003. Figure from Micha & Mozaffarian, Lipids 2010
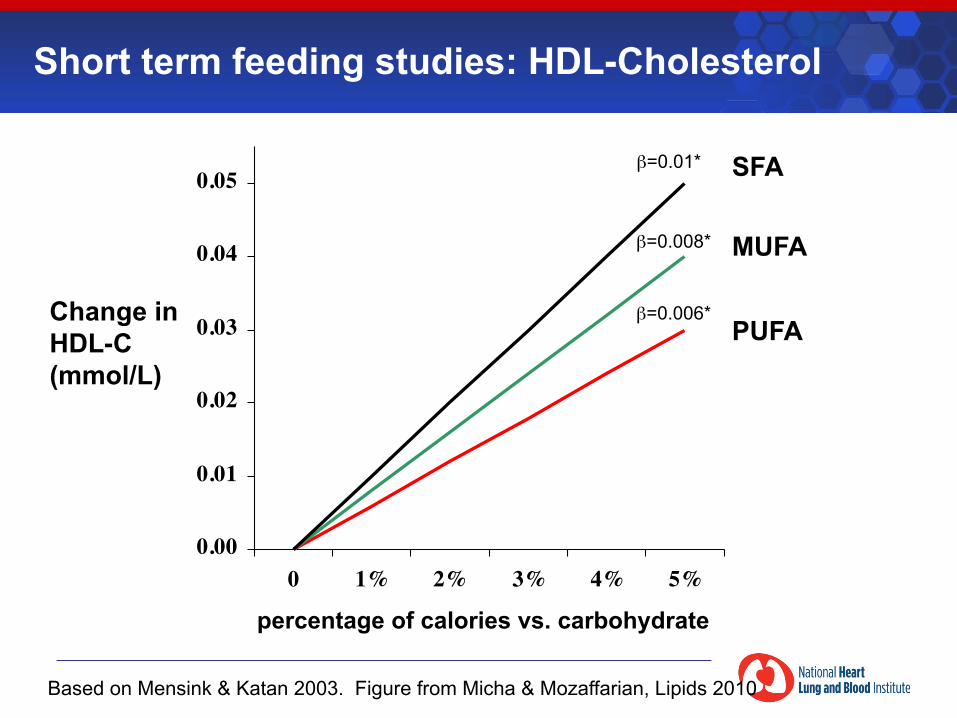
0.00
0.01
0.02
0.03
0.04
0.05
0 1% 2% 3% 4% 5%
β=0.01*
β=0.008*
β=0.006* PUFA
MUFA
SFA
percentage of calories vs. carbohydrate
Change in HDL-C (mmol/L)
Short term feeding studies: HDL-Cholesterol
Based on Mensink & Katan 2003. Figure from Micha & Mozaffarian, Lipids 2010
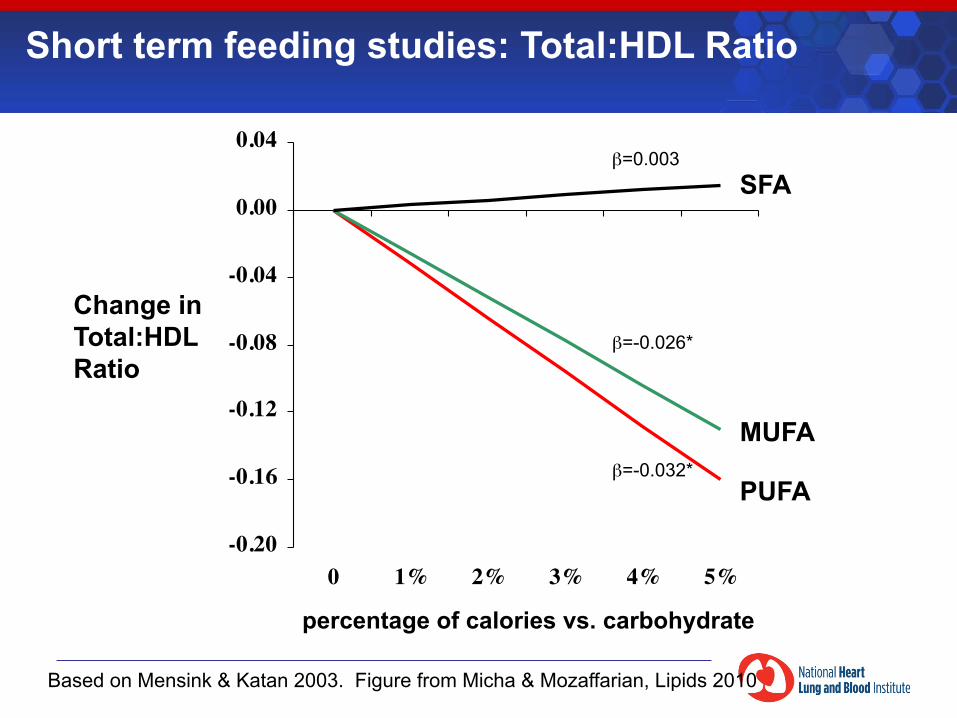
Based on Mensink & Katan 2003. Figure from Micha & Mozaffarian, Lipids 2010
-0.20
-0.16
-0.12
-0.08
-0.04
0.00
0.04
0 1% 2% 3% 4% 5%
β=0.003
β=-0.026*
β=-0.032* PUFA
MUFA
SFA
percentage of calories vs. carbohydrate
Change in Total:HDL Ratio
Short term feeding studies: Total:HDL Ratio
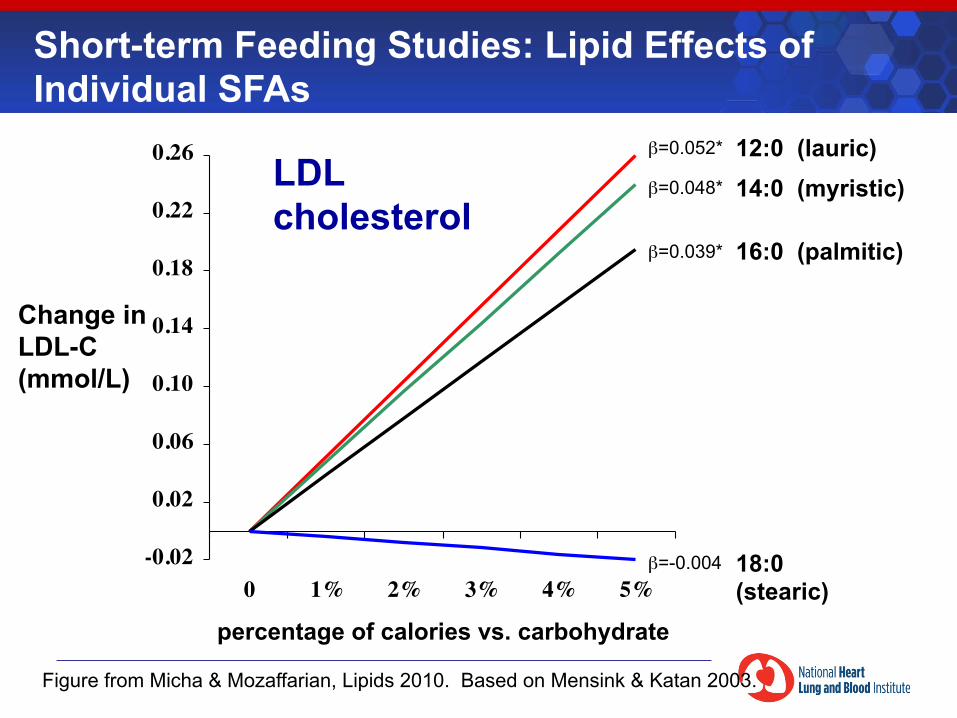
-0.02
0.02
0.06
0.10
0.14
0.18
0.22
0.26
0 1% 2% 3% 4% 5%
Change in LDL-C (mmol/L)
β=0.052*
β=0.048*
β=0.039*
β=-0.004
16:0 (palmitic)
14:0 (myristic) 12:0 (lauric)
18:0 (stearic)
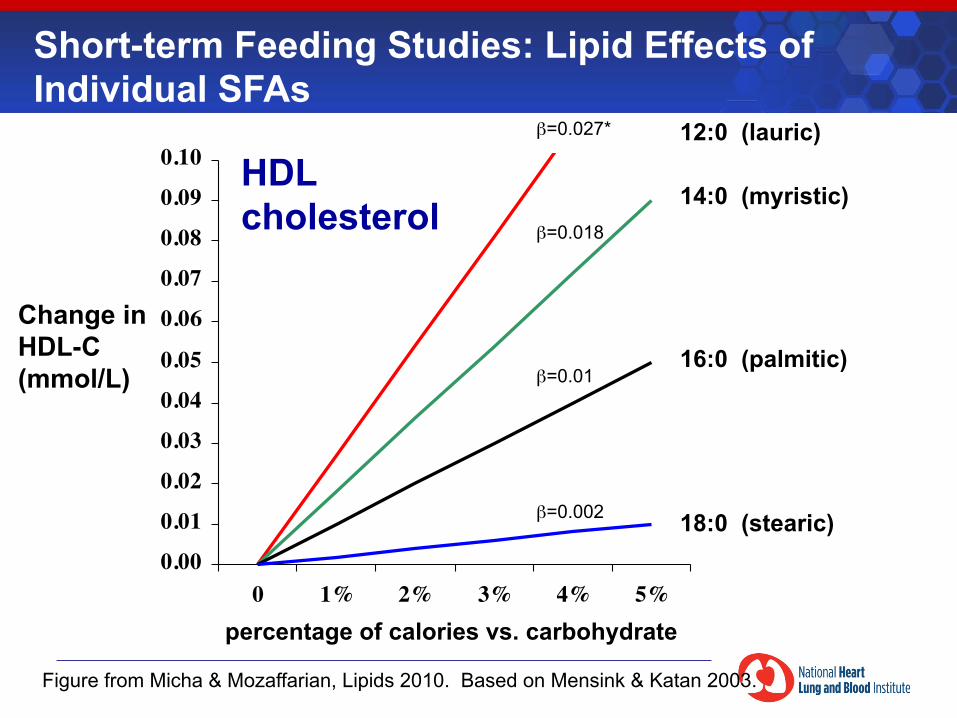
Short-term Feeding Studies: Lipid Effects of Individual SFAs
percentage of calories vs. carbohydrate
LDL cholesterol
Figure from Micha & Mozaffarian, Lipids 2010. Based on Mensink & Katan 2003.
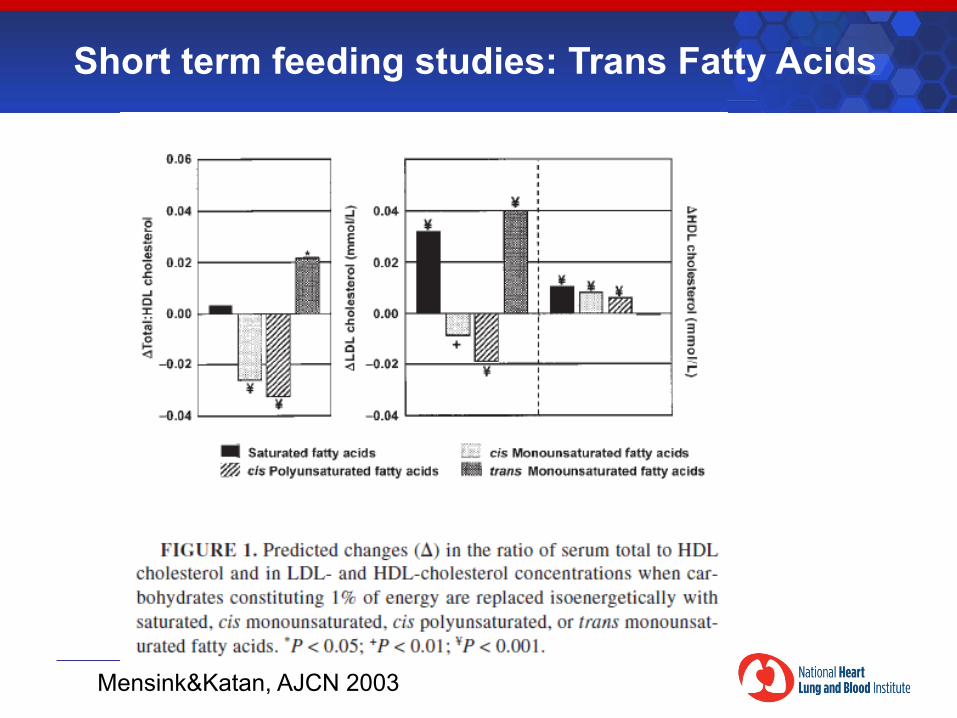
Short term feeding studies: Trans Fatty Acids
Mensink&Katan, AJCN 2003
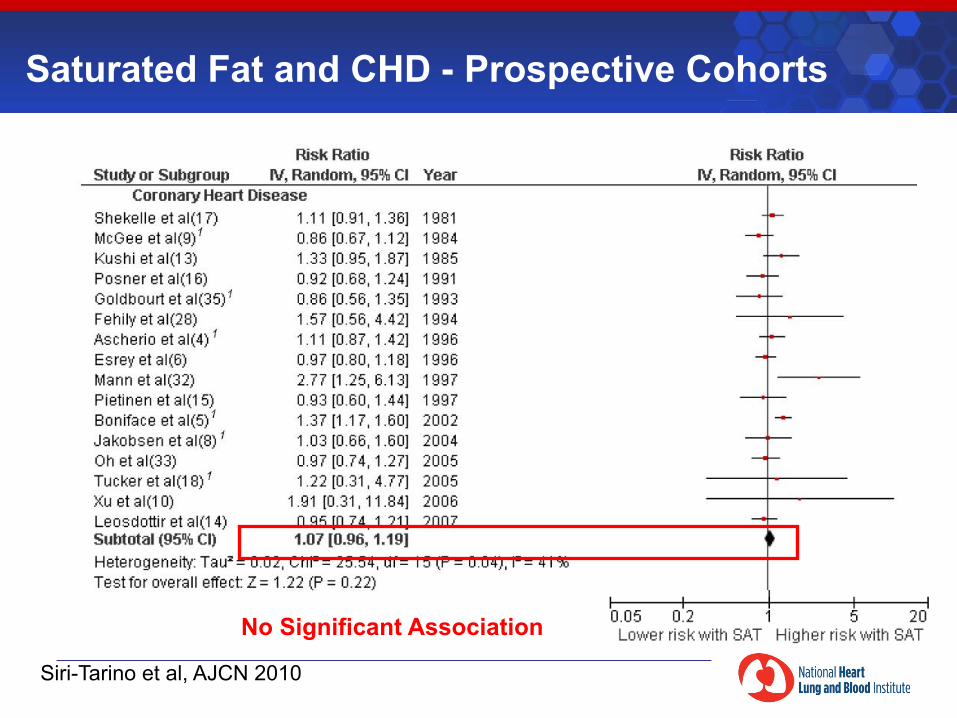
Saturated Fat and CHD - Prospective Cohorts
Siri-Tarino et al, AJCN 2010
No Significant Association
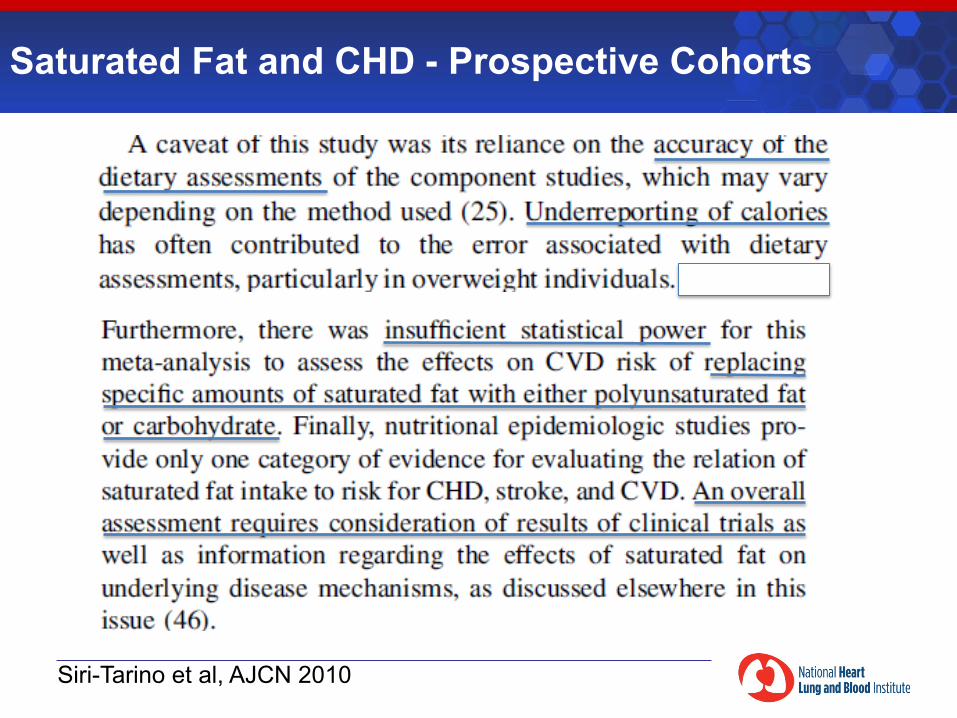
Siri-Tarino et al, AJCN 2010
Saturated Fat and CHD - Prospective Cohorts
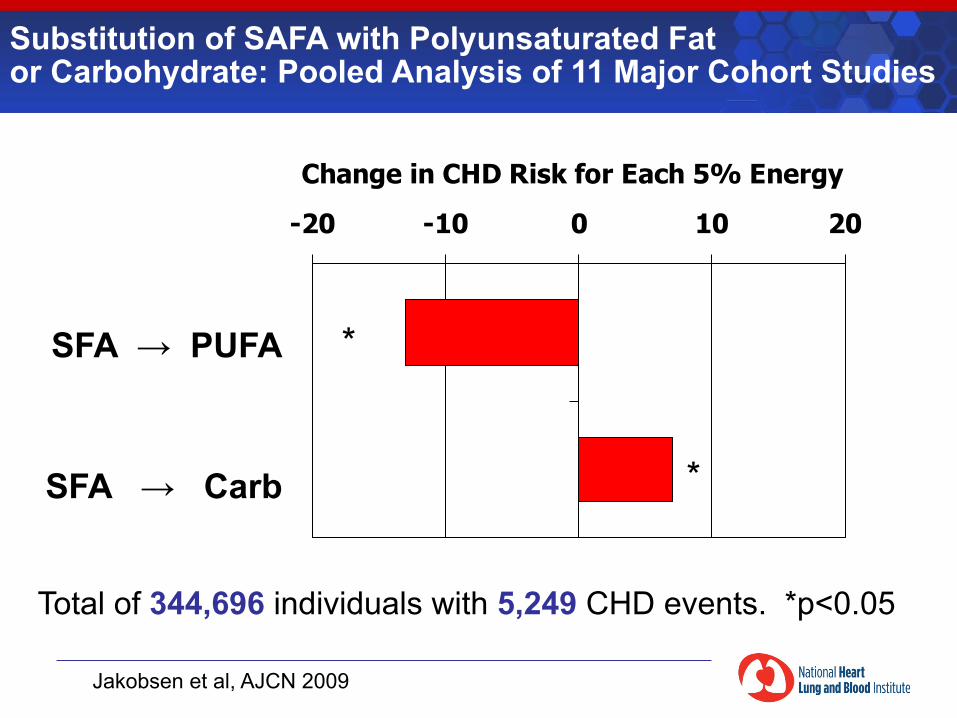
Substitution of SAFA with Polyunsaturated Fat or Carbohydrate: Pooled Analysis of 11 Major Cohort Studies
Jakobsen et al, AJCN 2009
Total of 344,696 individuals with 5,249 CHD events. *p<0.05
-20 -10 0 10 20
Change in CHD Risk for Each 5% Energy
SFA → PUFA
SFA → Carb
*
*
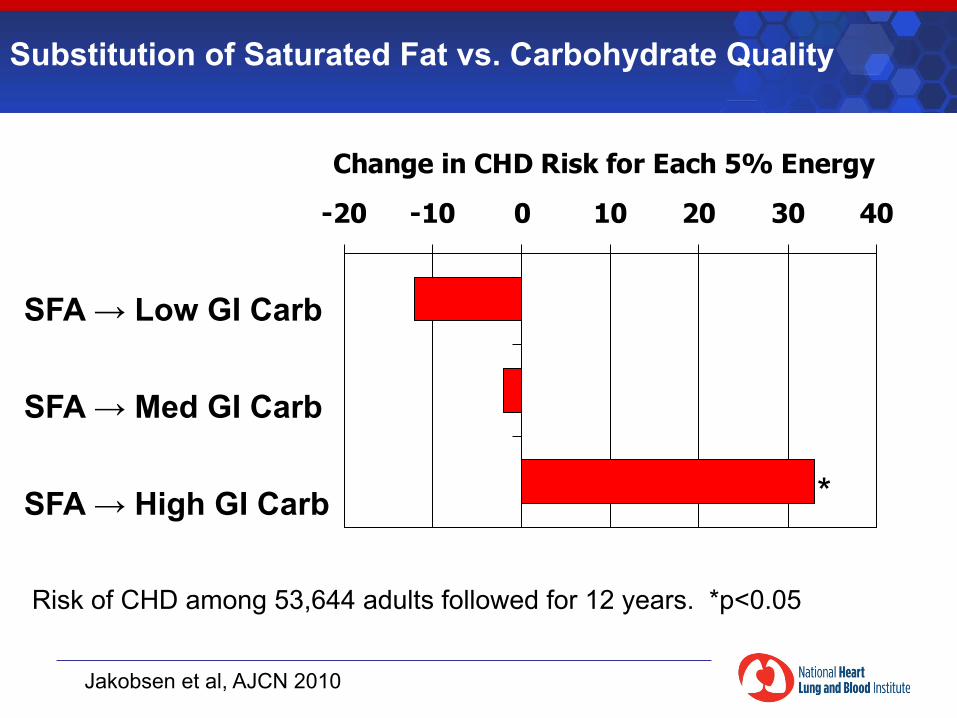
Substitution of Saturated Fat vs. Carbohydrate Quality
Jakobsen et al, AJCN 2010
Risk of CHD among 53,644 adults followed for 12 years. *p<0.05
-20 -10 0 10 20 30 40
Change in CHD Risk for Each 5% Energy
SFA → Low GI Carb
SFA → Med GI Carb
SFA → High GI Carb *
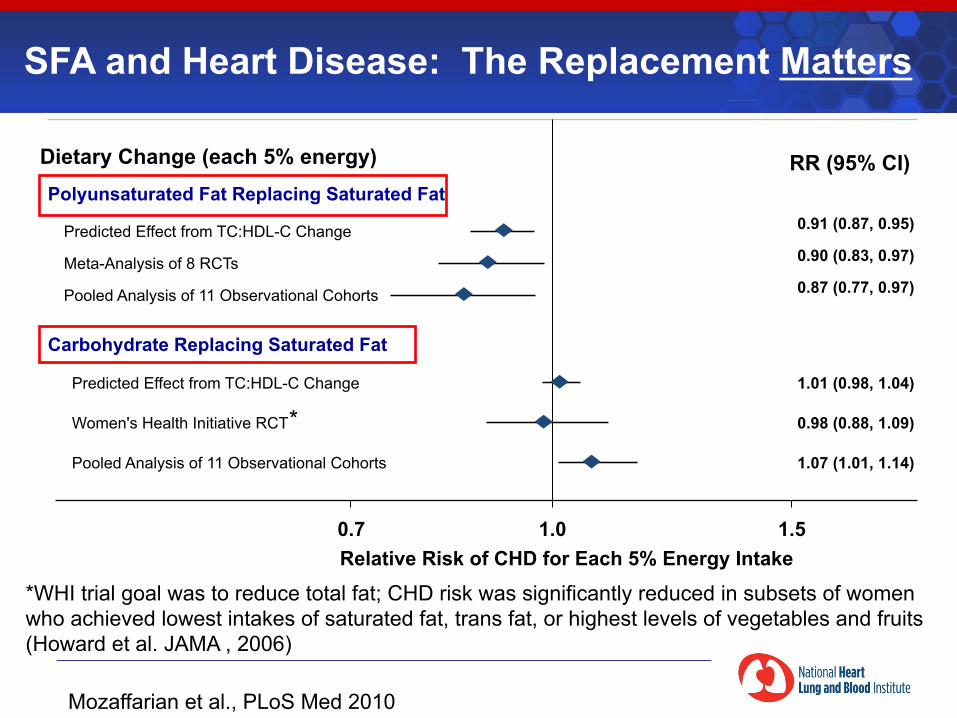
Mozaffarian et al., PLoS Med 2010
SFA and Heart Disease: The Replacement Matters
Carbohydrate Replacing Saturated Fat
0.90 (0.83, 0.97)
RR (95% CI)
0.7 1.0 1.5 Relative Risk of CHD for Each 5% Energy Intake
Women's Health Initiative RCT 0.98 (0.88, 1.09)
Polyunsaturated Fat Replacing Saturated Fat
Meta-Analysis of 8 RCTs
0.91 (0.87, 0.95) Predicted Effect from TC:HDL-C Change
0.87 (0.77, 0.97) Pooled Analysis of 11 Observational Cohorts
Predicted Effect from TC:HDL-C Change 1.01 (0.98, 1.04)
Pooled Analysis of 11 Observational Cohorts 1.07 (1.01, 1.14)
Dietary Change (each 5% energy)
*
*WHI trial goal was to reduce total fat; CHD risk was significantly reduced in subsets of women who achieved lowest intakes of saturated fat, trans fat, or highest levels of vegetables and fruits (Howard et al. JAMA , 2006)
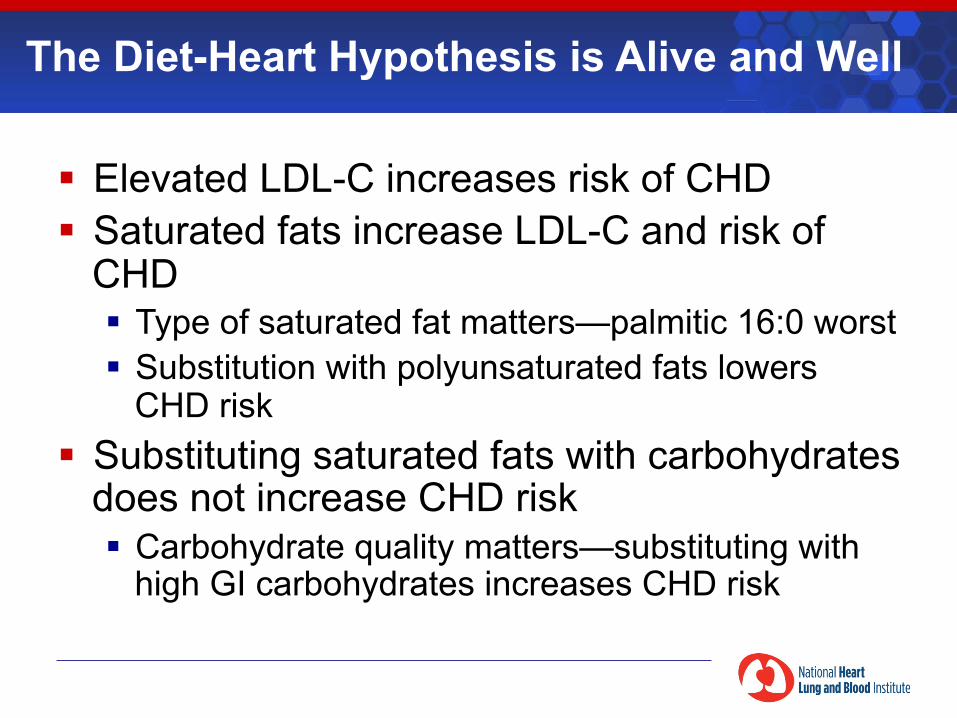
The Diet-Heart Hypothesis is Alive and Well
§ Elevated LDL-C increases risk of CHD § Saturated fats increase LDL-C and risk of
CHD § Type of saturated fat matters—palmitic 16:0 worst § Substitution with polyunsaturated fats lowers
CHD risk § Substituting saturated fats with carbohydrates
does not increase CHD risk § Carbohydrate quality matters—substituting with
high GI carbohydrates increases CHD risk

Diet, Obesity, and Diabetes
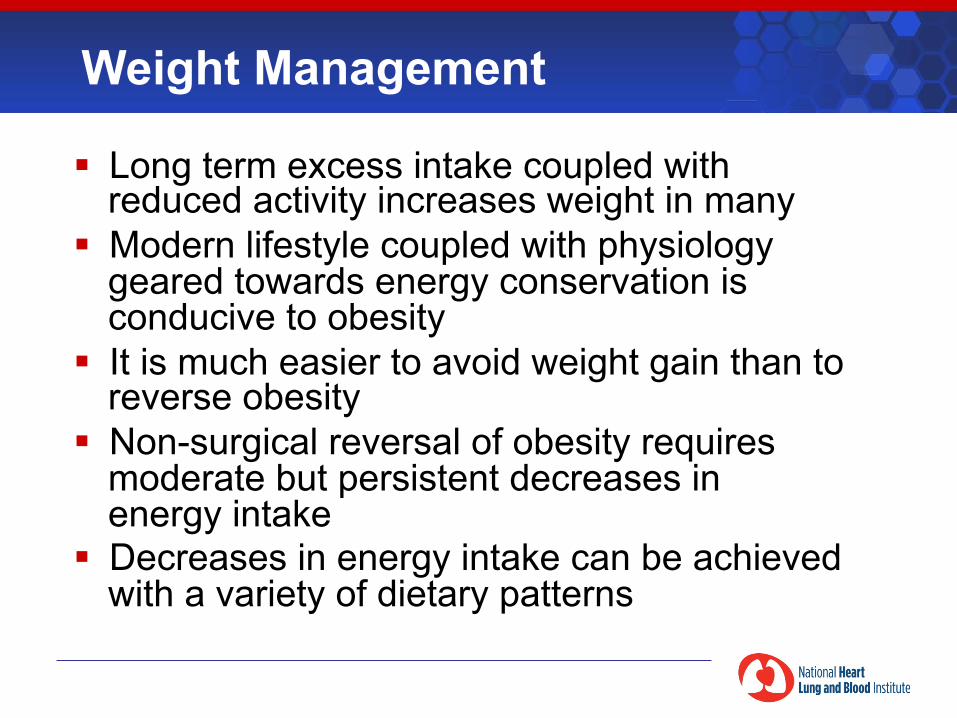
Weight Management
§ Long term excess intake coupled with reduced activity increases weight in many
§ Modern lifestyle coupled with physiology geared towards energy conservation is conducive to obesity
§ It is much easier to avoid weight gain than to reverse obesity
§ Non-surgical reversal of obesity requires moderate but persistent decreases in energy intake
§ Decreases in energy intake can be achieved with a variety of dietary patterns
Criticisms of Low Fat, Higher-Carbohydrate Diets
§ They stimulate insulin and worsen
glucose tolerance § They raise triglycerides and lower HDL
§ They promote weight gain
Do fats or carbohydrates have unique roles in obesity?
§ Cannot do experiments in humans to induce obesity § Cohort studies § Secular trends in human populations
§ Can do experiments in obesity prevention or treatment § Short term comparisons of calorie-restricted high
carbohydrate versus high fat diets § Long term RCT of low fat, high carbohydrate diet § Surgical calorie restriction
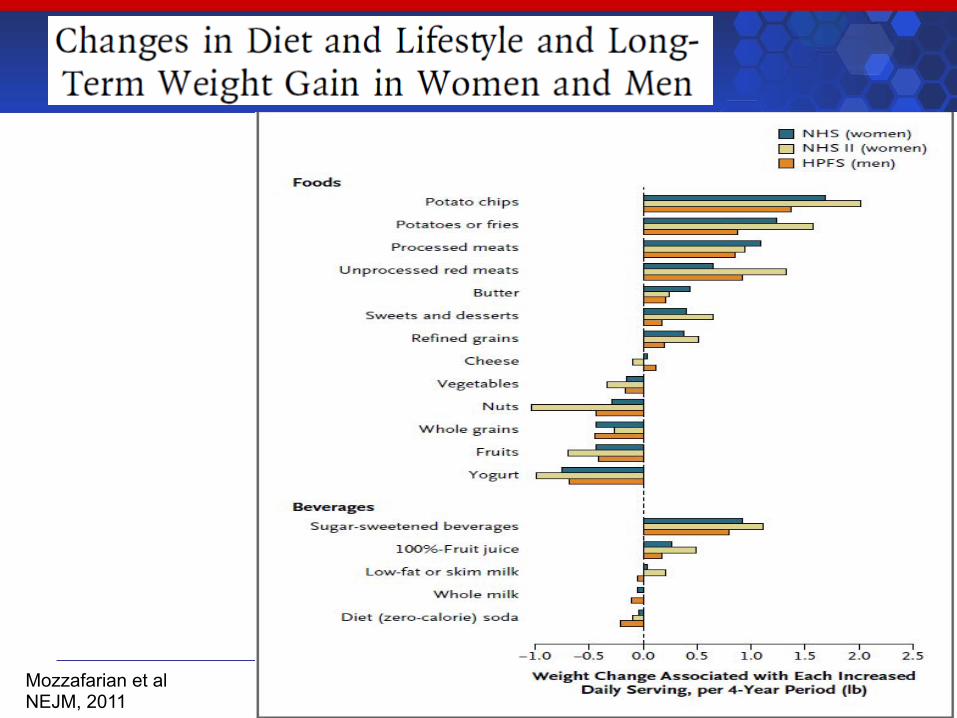
Mozzafarian et al NEJM, 2011
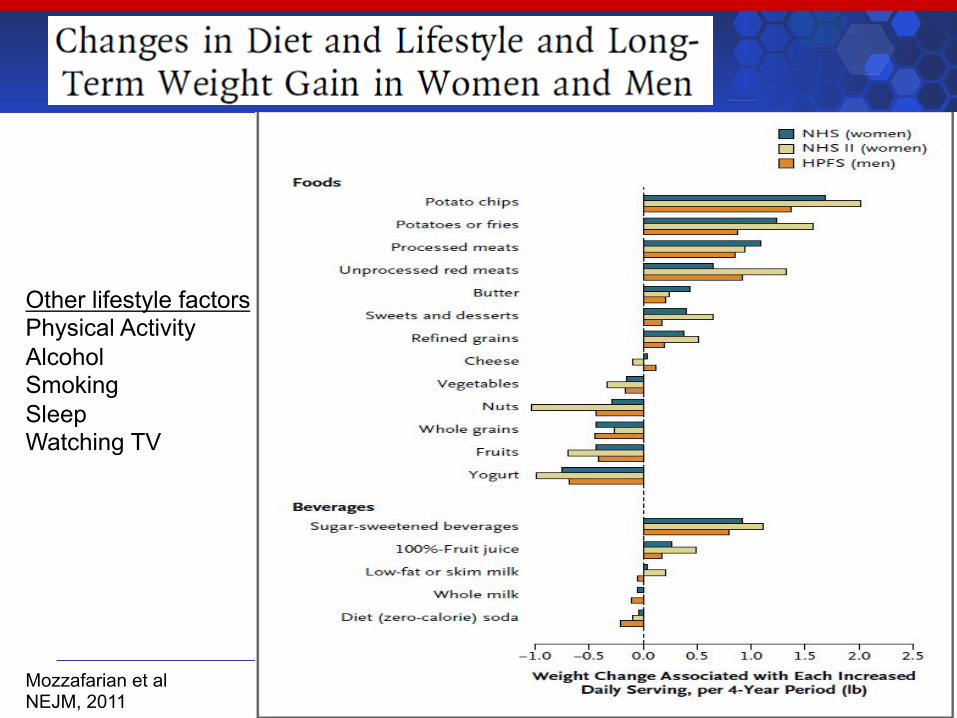
Mozzafarian et al NEJM, 2011
Other lifestyle factors Physical Activity Alcohol Smoking Sleep Watching TV
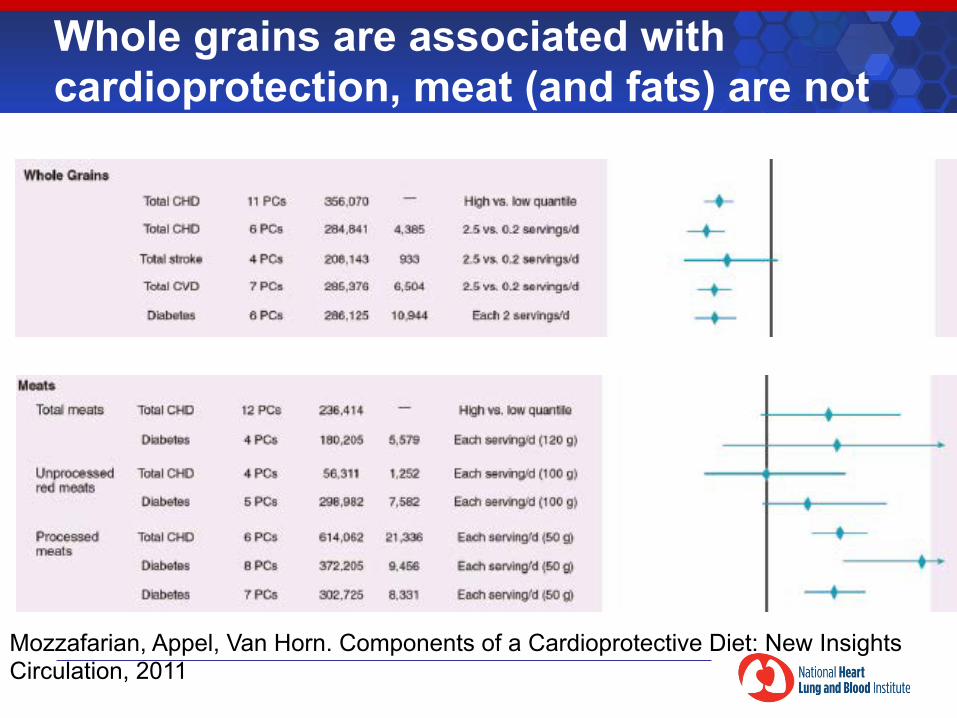
Whole grains are associated with cardioprotection, meat (and fats) are not
Mozzafarian, Appel, Van Horn. Components of a Cardioprotective Diet: New Insights Circulation, 2011
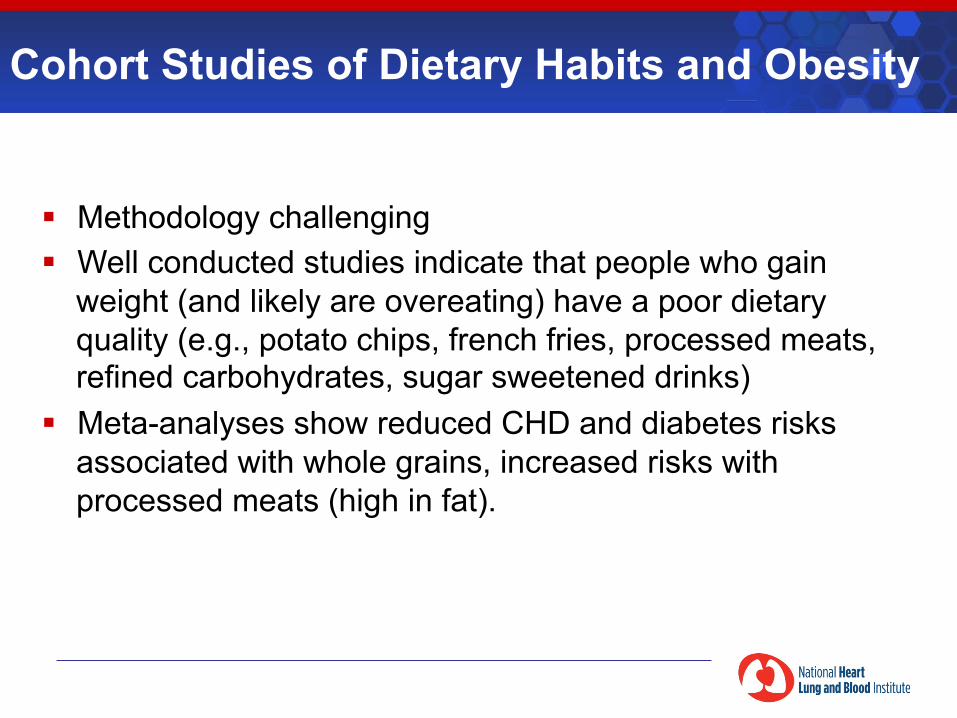
Cohort Studies of Dietary Habits and Obesity
§ Methodology challenging § Well conducted studies indicate that people who gain
weight (and likely are overeating) have a poor dietary quality (e.g., potato chips, french fries, processed meats, refined carbohydrates, sugar sweetened drinks)
§ Meta-analyses show reduced CHD and diabetes risks associated with whole grains, increased risks with processed meats (high in fat).
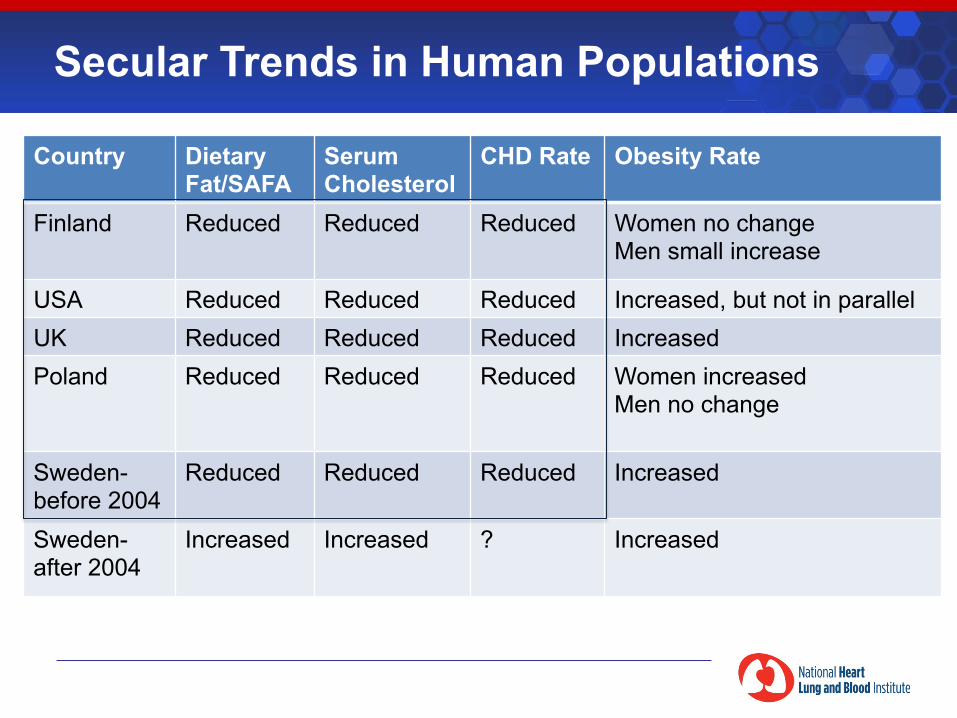
Country Dietary Fat/SAFA
Serum Cholesterol
CHD Rate Obesity Rate
Finland Reduced Reduced Reduced Women no change Men small increase
USA Reduced Reduced Reduced Increased, but not in parallel UK Reduced Reduced Reduced Increased Poland Reduced Reduced Reduced Women increased
Men no change
Sweden-before 2004
Reduced Reduced Reduced Increased
Sweden-after 2004
Increased Increased ? Increased
Secular Trends in Human Populations
©2011 American Heart Association, Inc. All rights reserved.
Roger VL et al. Published online in Circulation Dec. 15, 2011
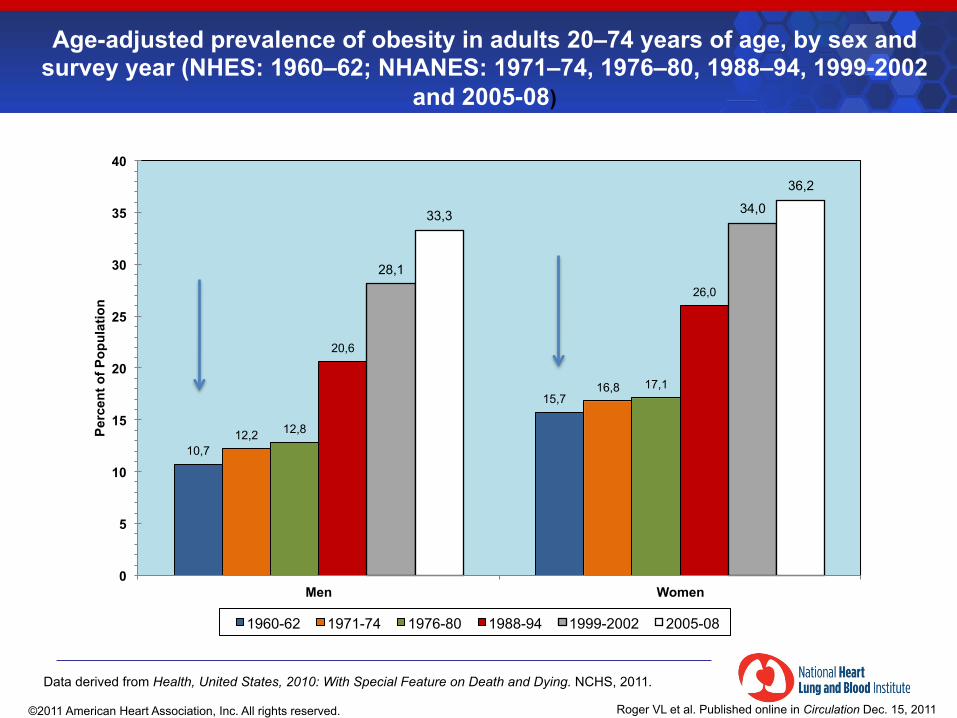
Age-adjusted prevalence of obesity in adults 20–74 years of age, by sex and survey year (NHES: 1960–62; NHANES: 1971–74, 1976–80, 1988–94, 1999-2002
and 2005-08)
10,7
15,7
12,2
16,8
12,8
17,1
20,6
26,0
28,1
34,0 33,3
36,2
0
5
10
15
20
25
30
35
40
Men Women
Perc
ent o
f Pop
ulat
ion
1960-62 1971-74 1976-80 1988-94 1999-2002 2005-08
Data derived from Health, United States, 2010: With Special Feature on Death and Dying. NCHS, 2011.

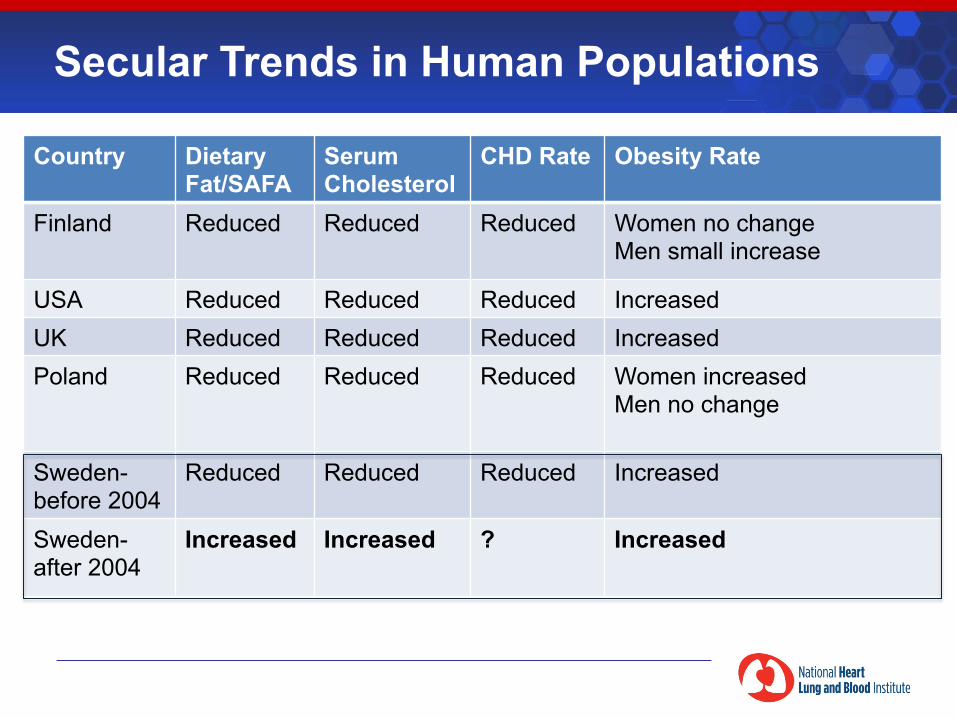
Country Dietary Fat/SAFA
Serum Cholesterol
CHD Rate Obesity Rate
Finland Reduced Reduced Reduced Women no change Men small increase
USA Reduced Reduced Reduced Increased UK Reduced Reduced Reduced Increased Poland Reduced Reduced Reduced Women increased
Men no change
Sweden-before 2004
Reduced Reduced Reduced Increased
Sweden-after 2004
Increased Increased ? Increased
Secular Trends in Human Populations
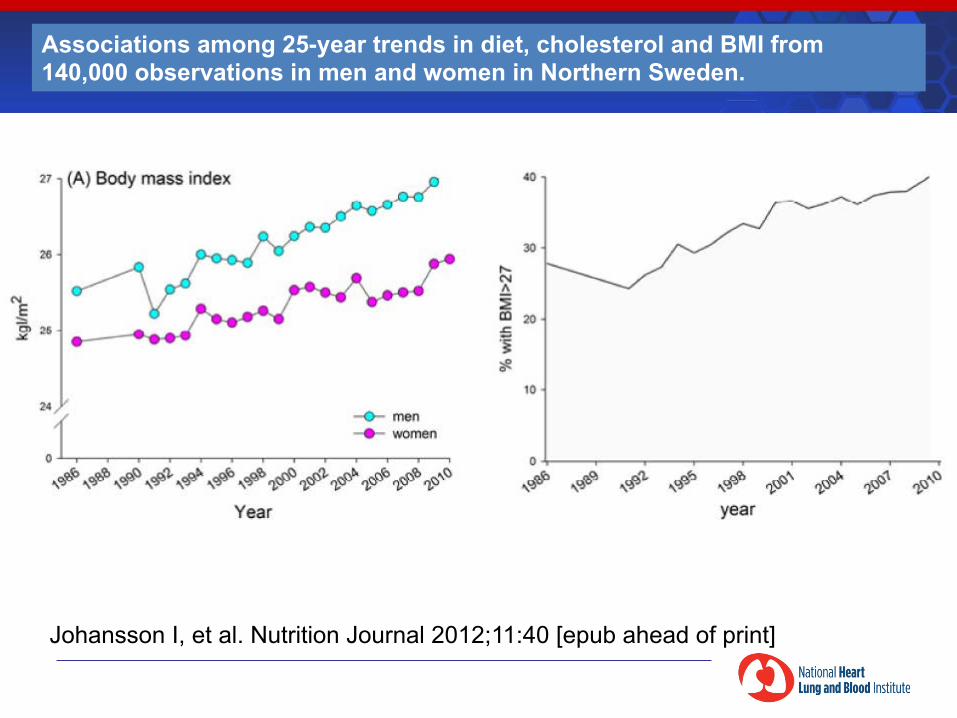
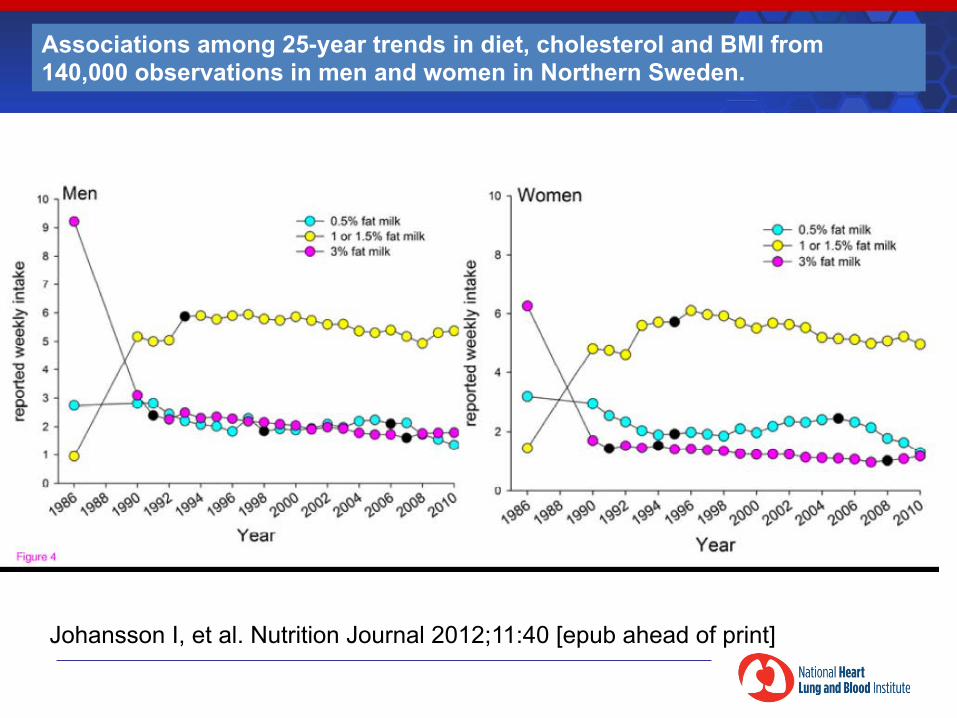
Associations among 25-year trends in diet, cholesterol and BMI from 140,000 observations in men and women in Northern Sweden.
Johansson I, et al. Nutrition Journal 2012;11:40 [epub ahead of print]
§ 1970’s Northern Sweden among highest CVD rates in world
§ 1985 Community intervention program launched
§ Central component was intervention on diet § “modified Mediterranean diet” § i.e. reduction in total fat, shift from saturated to
polyunsaturated fatty acids, fewer eggs, more vegetables, fruit, fish, and whole grain bread
§ By 2002 CVD rates had declined by 50%
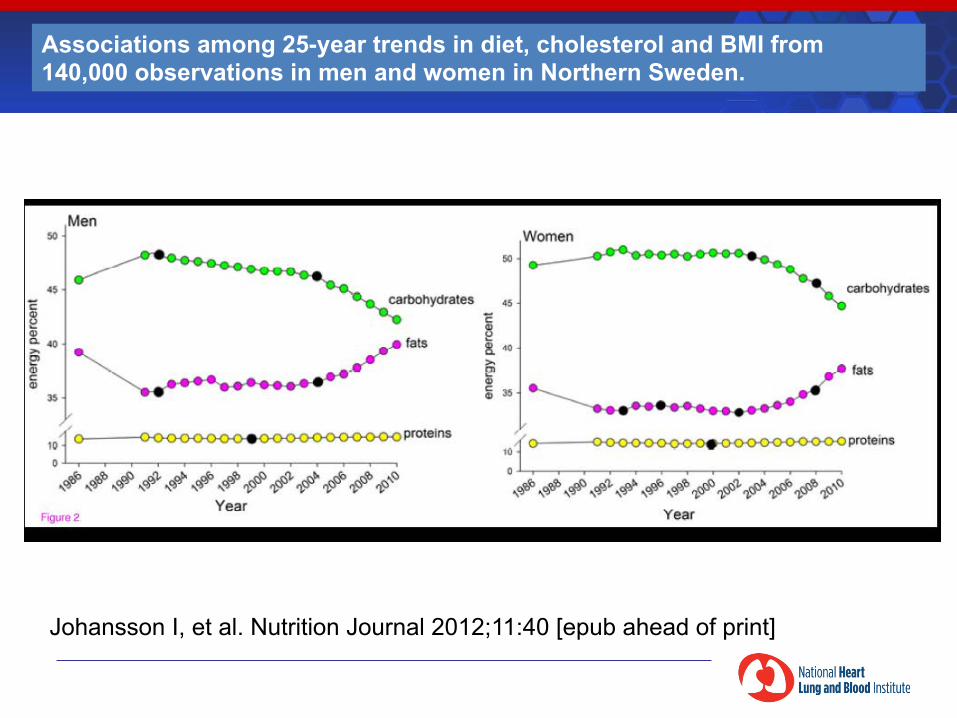
Associations among 25-year trends in diet, cholesterol and BMI from 140,000 observations in men and women in Northern Sweden.
Johansson I, et al. Nutrition Journal 2012;11:40 [epub ahead of print]
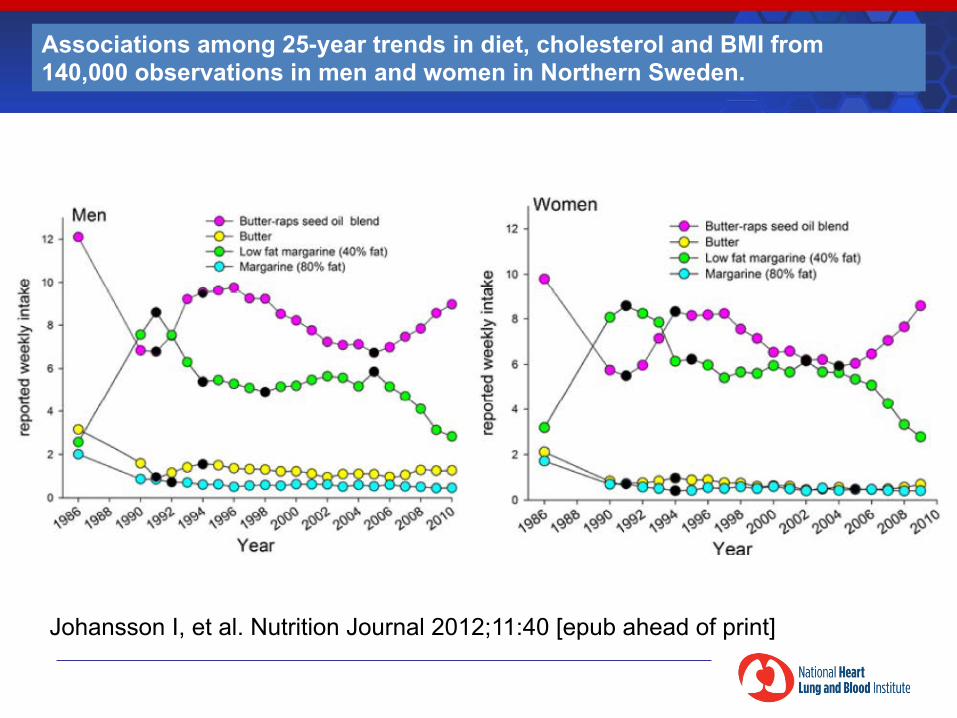
Associations among 25-year trends in diet, cholesterol and BMI from 140,000 observations in men and women in Northern Sweden.
Johansson I, et al. Nutrition Journal 2012;11:40 [epub ahead of print]
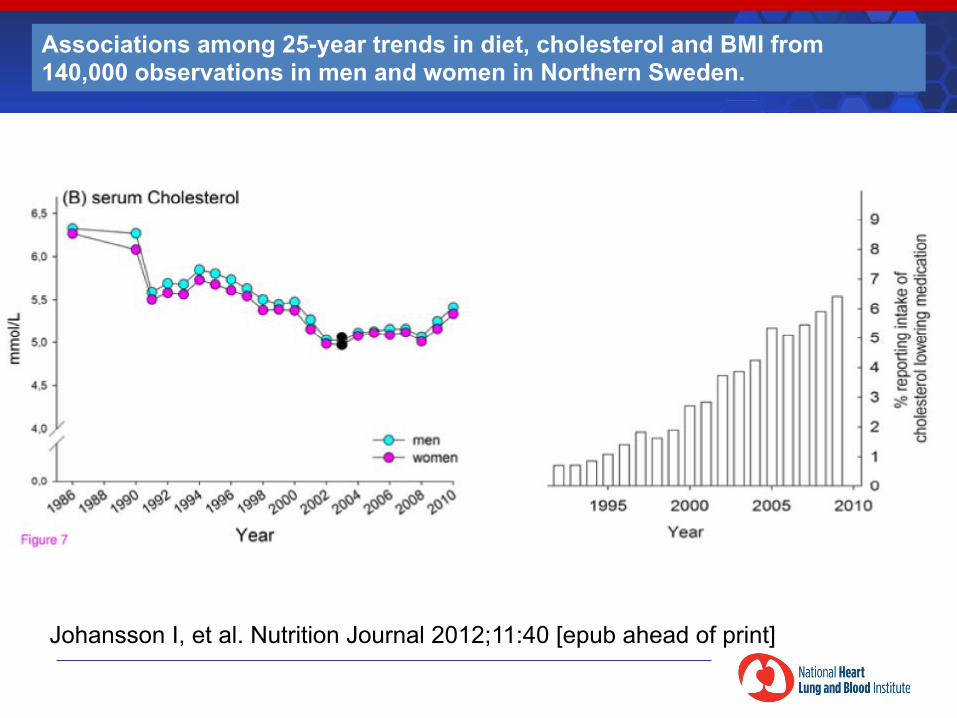
Associations among 25-year trends in diet, cholesterol and BMI from 140,000 observations in men and women in Northern Sweden.
Johansson I, et al. Nutrition Journal 2012;11:40 [epub ahead of print]
Associations among 25-year trends in diet, cholesterol and BMI from 140,000 observations in men and women in Northern Sweden.
Johansson I, et al. Nutrition Journal 2012;11:40 [epub ahead of print]
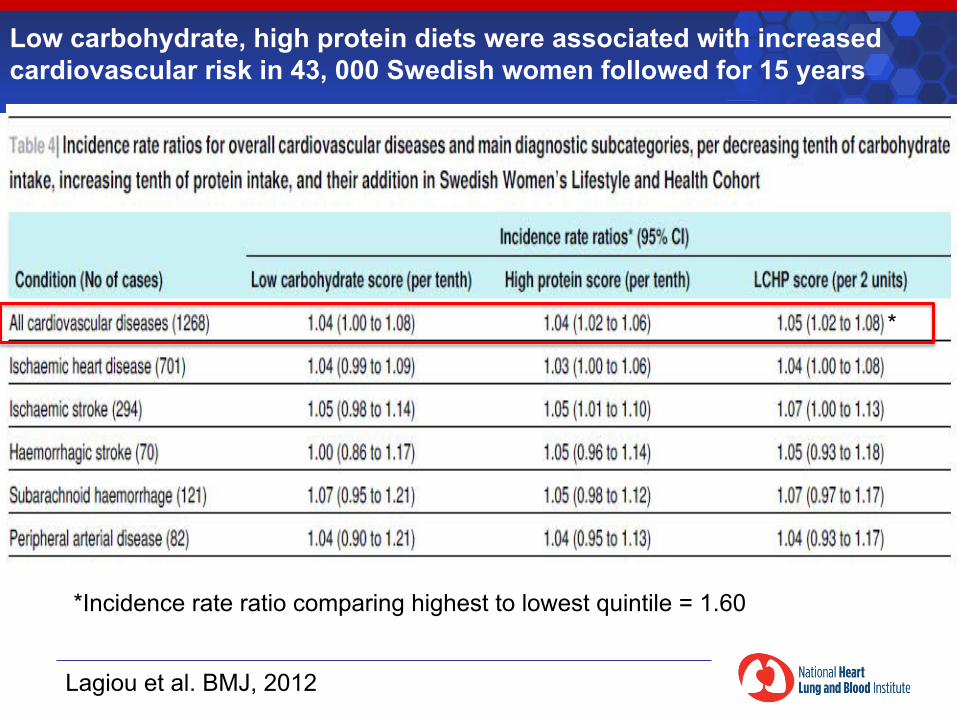
Lagiou et al. BMJ, 2012
Low carbohydrate, high protein diets were associated with increased cardiovascular risk in 43, 000 Swedish women followed for 15 years
*Incidence rate ratio comparing highest to lowest quintile = 1.60
*
§ The trend towards increasing obesity is not uniquely associated with low fat/higher carbohydrate diets; other factors are responsible
§ However, adoption of these diets do result in lower cholesterol levels, CHD risk, total mortality
§ Implementation of dietary recommendations has been beneficial
§ Reverting to higher fat/lower carbohydrate diets may not reverse a trend towards obesity, but may reverse the cardiovascular benefits
Studies of Secular Trends
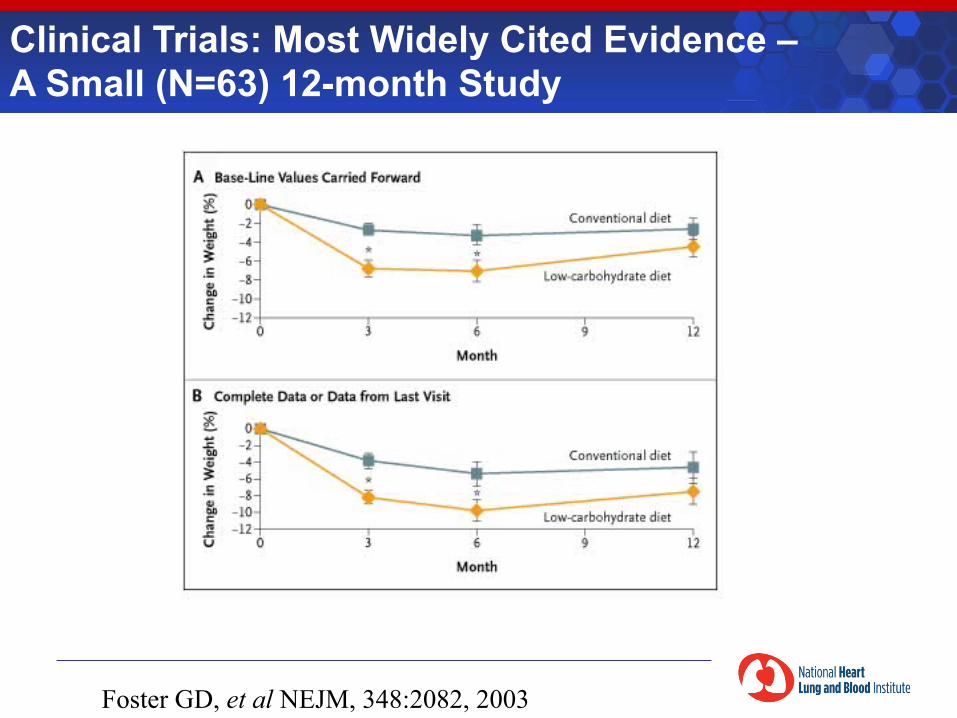
Clinical Trials: Most Widely Cited Evidence – A Small (N=63) 12-month Study
Foster GD, et al NEJM, 348:2082, 2003
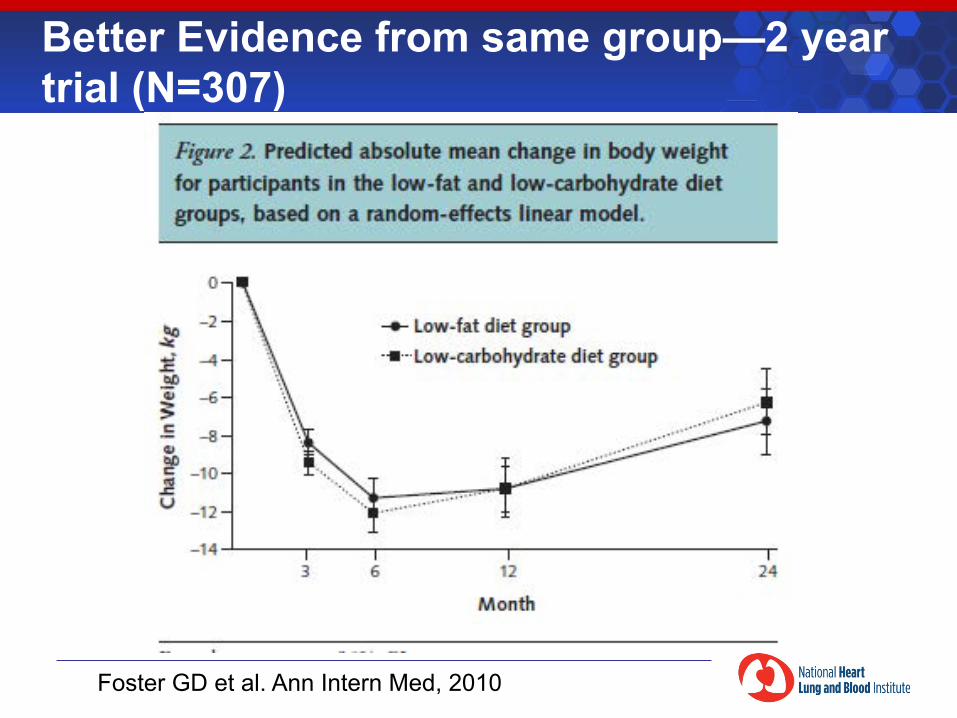
Better Evidence from same group—2 year trial (N=307)
Foster GD et al. Ann Intern Med, 2010
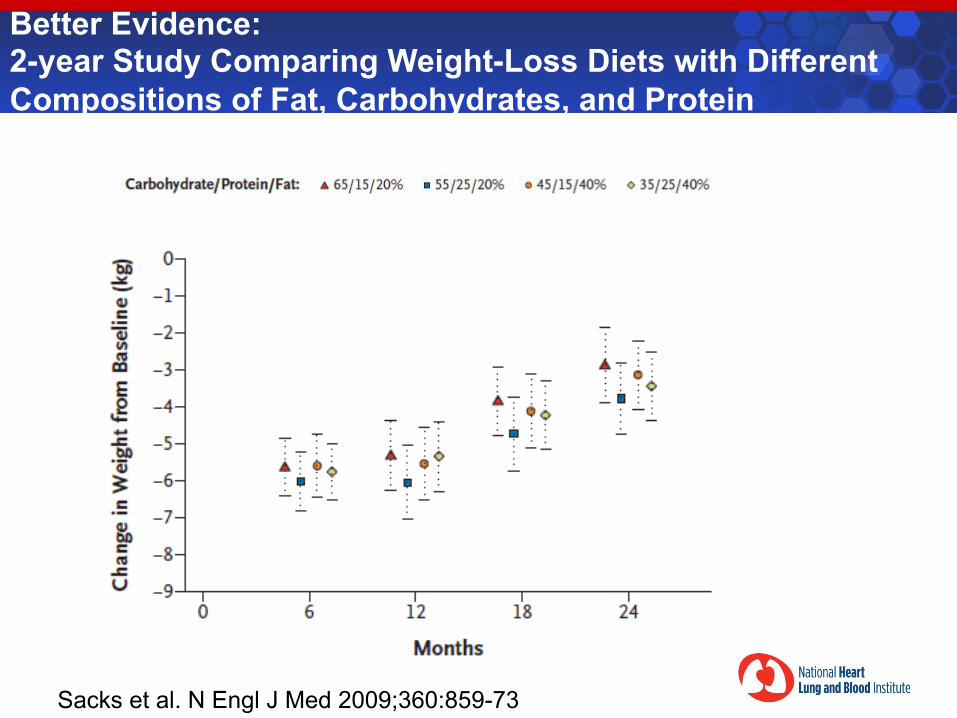
Better Evidence: 2-year Study Comparing Weight-Loss Diets with Different Compositions of Fat, Carbohydrates, and Protein
Sacks et al. N Engl J Med 2009;360:859-73
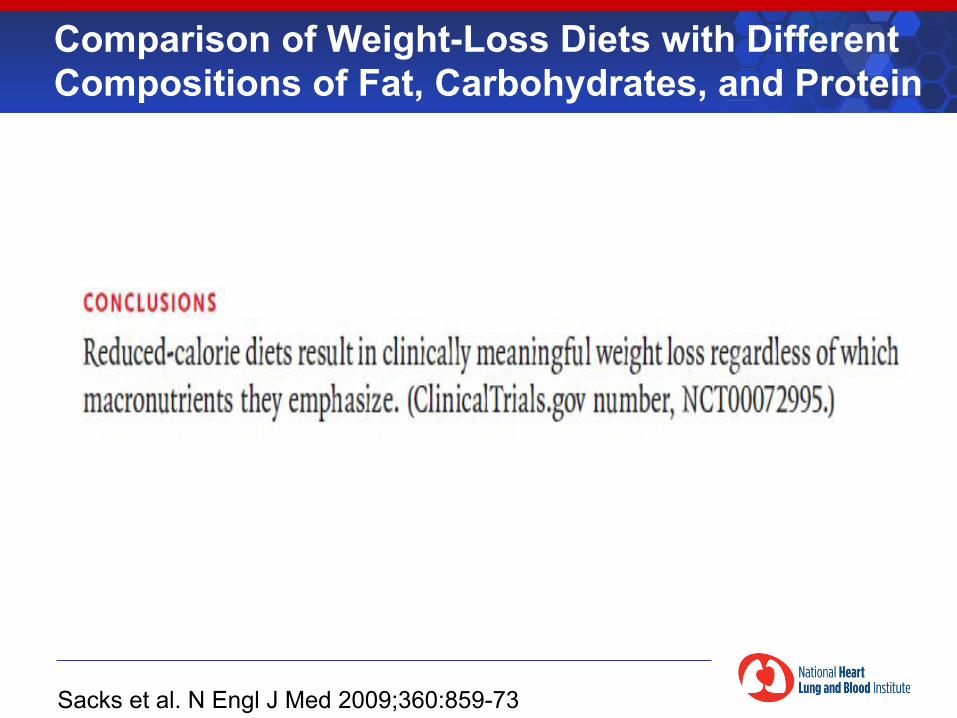
Comparison of Weight-Loss Diets with Different Compositions of Fat, Carbohydrates, and Protein
Sacks et al. N Engl J Med 2009;360:859-73
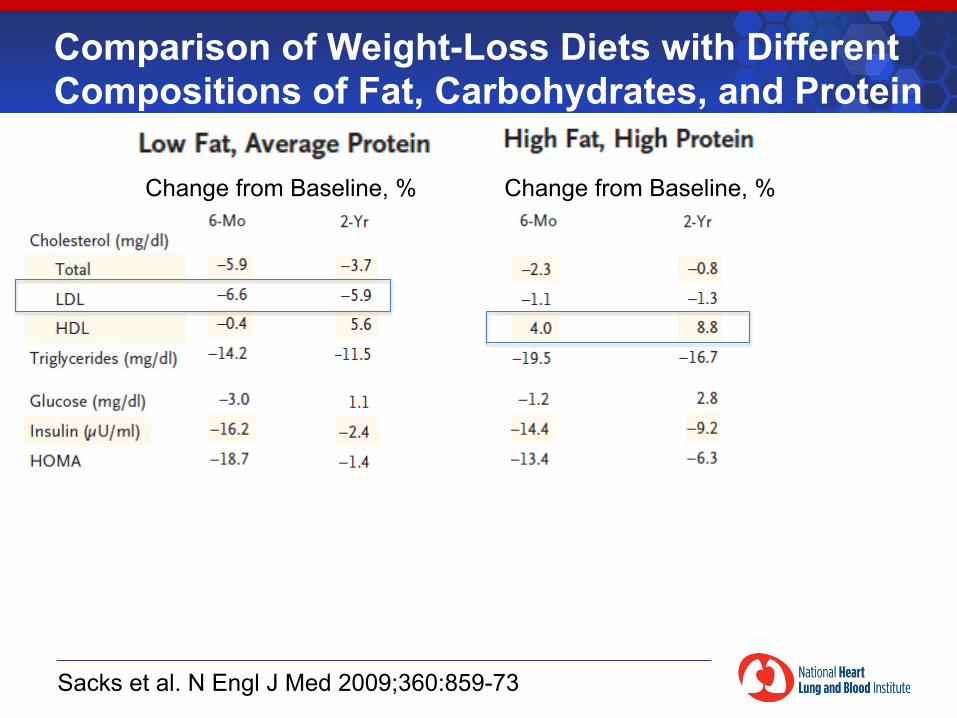
Comparison of Weight-Loss Diets with Different Compositions of Fat, Carbohydrates, and Protein
Sacks et al. N Engl J Med 2009;360:859-73
Change from Baseline, % Change from Baseline, %
Comparison of Weight-Loss Diets with Different Compositions of Fat, Protein, and Carbohydrates
Sacks et al. N Engl J Med 2009;360:859-73
“In conclusion, diets that are successful in causing weight loss can emphasize a range of fat, protein, and carbohydrate compositions that have beneficial effects on risk factors for cardiovascular disease and diabetes. Such diets can also be tailored to individual patients on the basis of their personal and cultural preferences and may therefore have the best chance for long-term success.”
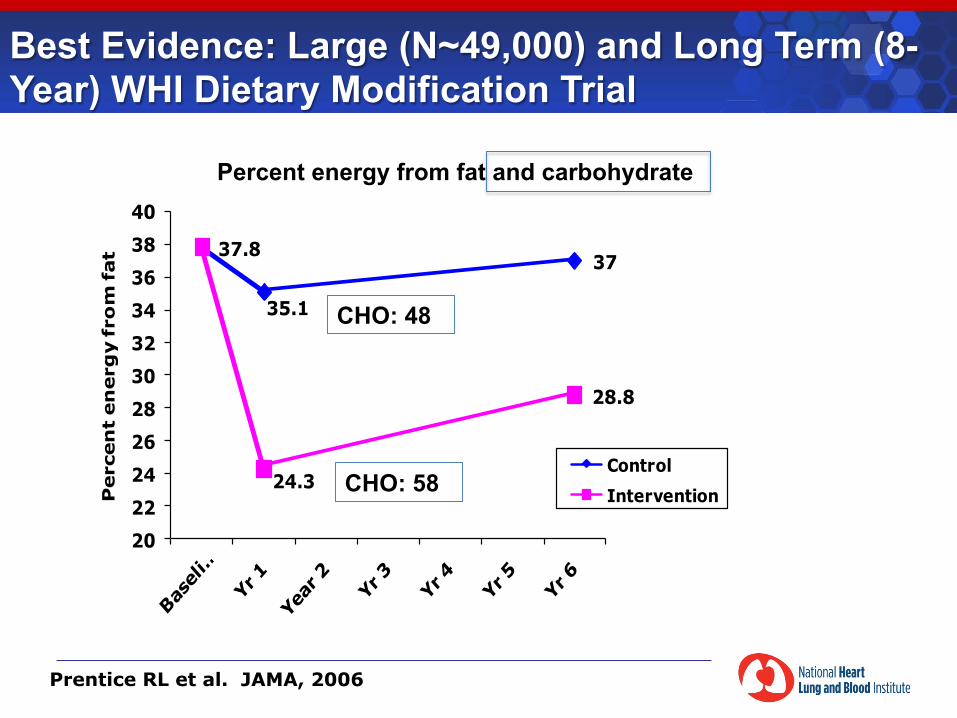
Best Evidence: Large (N~49,000) and Long Term (8-Year) WHI Dietary Modification Trial
37.8
35.1
37
24.3
28.8
2022242628303234363840
Perc
en
t en
erg
y fro
m fat
ControlIntervention
Prentice RL et al. JAMA, 2006
CHO: 58
CHO: 48
Percent energy from fat and carbohydrate
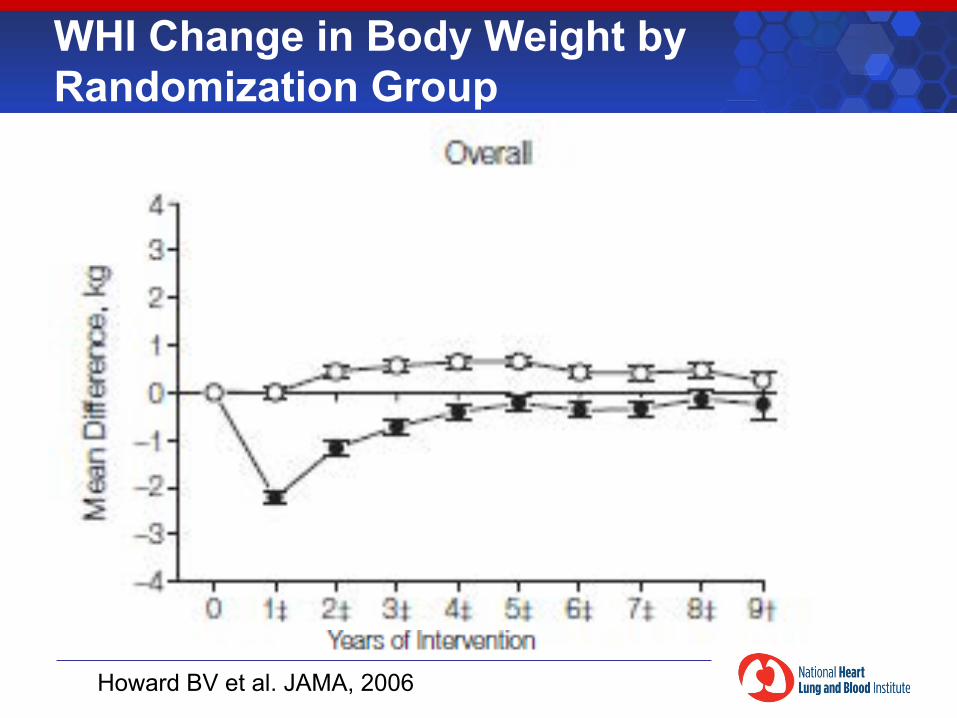
WHI Change in Body Weight by Randomization Group
Howard BV et al. JAMA, 2006
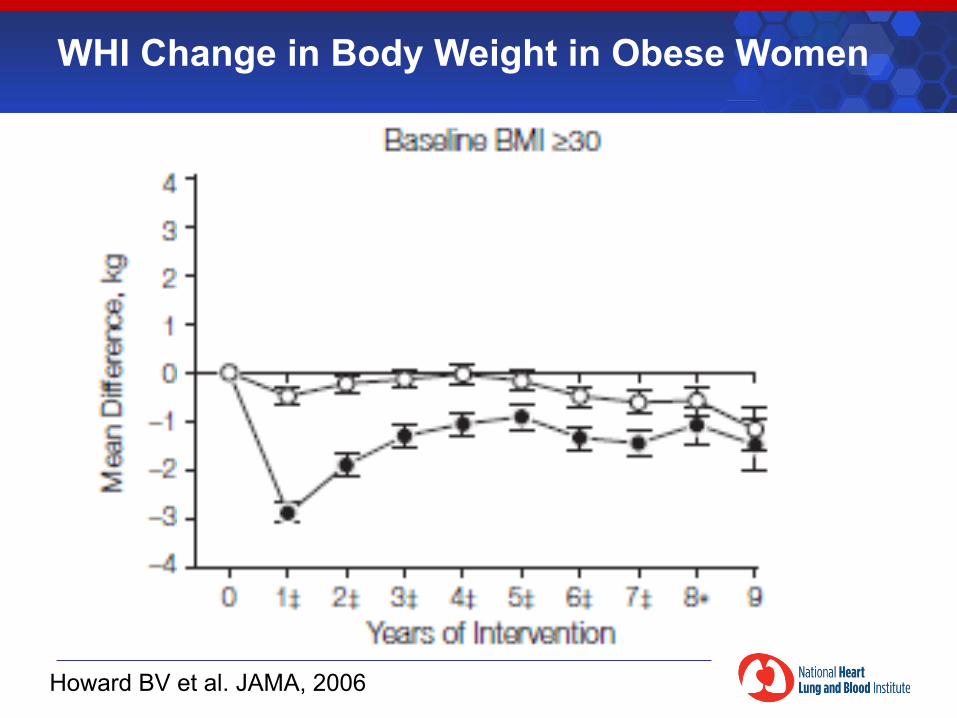
WHI Change in Body Weight in Obese Women
Howard BV et al. JAMA, 2006
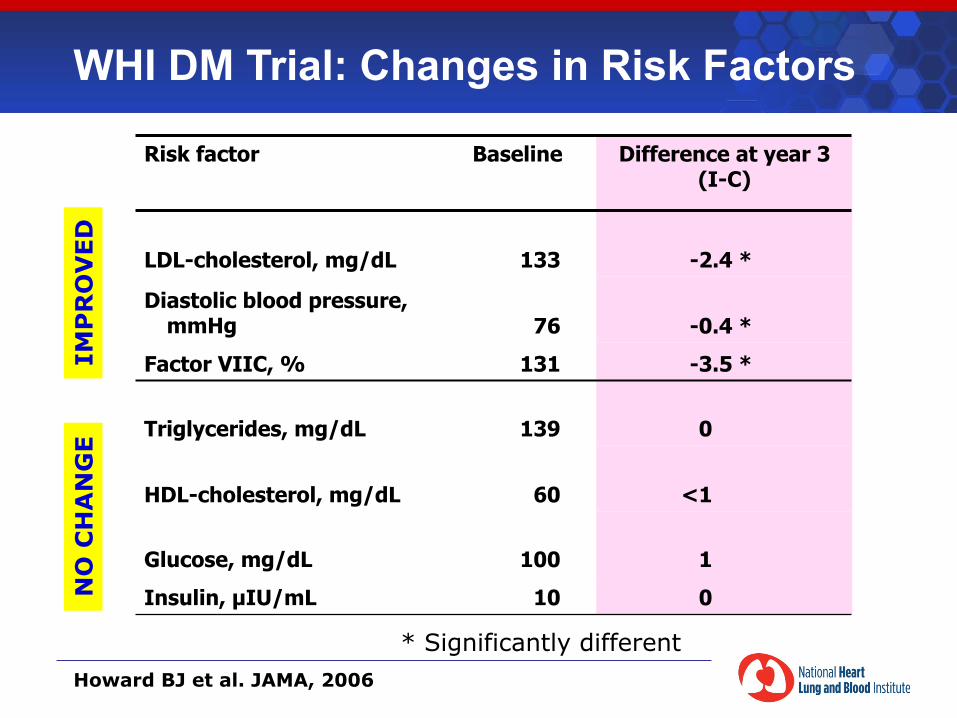
WHI DM Trial: Changes in Risk Factors
Risk factor
Baseline Difference at year 3 (I-C)
LDL-cholesterol, mg/dL 133 -2.4 *
Diastolic blood pressure, mmHg 76 -0.4 *
Factor VIIC, % 131 -3.5 *
Triglycerides, mg/dL 139 0
HDL-cholesterol, mg/dL 60 <1
Glucose, mg/dL 100 1
Insulin, µIU/mL 10 0
* Significantly different
IMP
RO
VED
N
O C
HA
NG
E
Howard BJ et al. JAMA, 2006
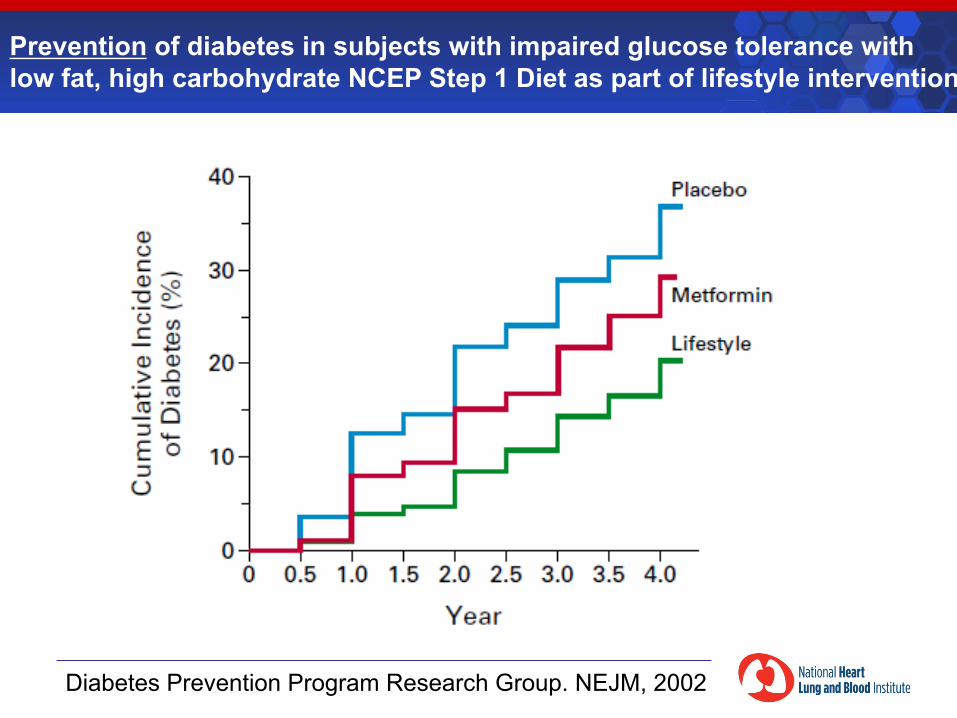
Prevention of diabetes in subjects with impaired glucose tolerance with low fat, high carbohydrate NCEP Step 1 Diet as part of lifestyle intervention
Diabetes Prevention Program Research Group. NEJM, 2002
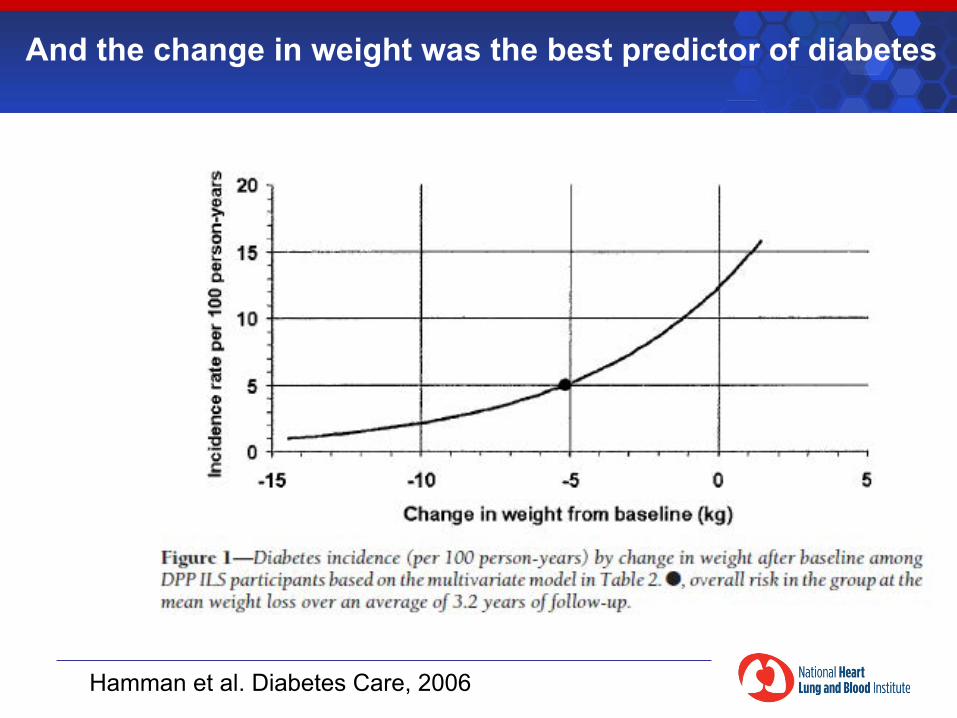
And the change in weight was the best predictor of diabetes
Hamman et al. Diabetes Care, 2006
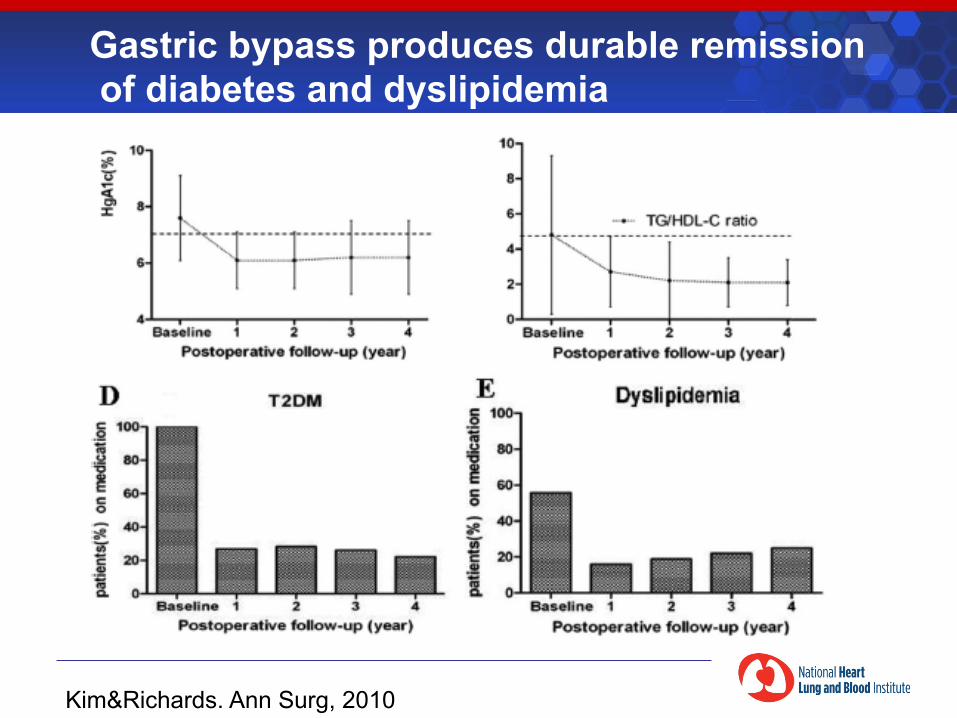
Gastric bypass produces durable remission of diabetes and dyslipidemia
Kim&Richards. Ann Surg, 2010
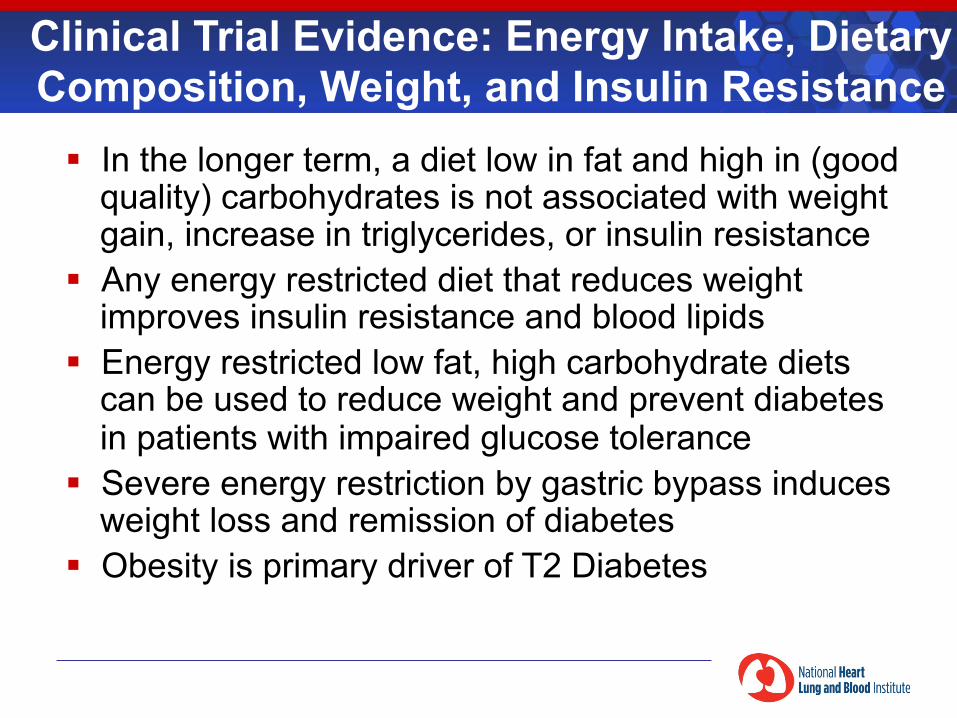
§ In the longer term, a diet low in fat and high in (good quality) carbohydrates is not associated with weight gain, increase in triglycerides, or insulin resistance
§ Any energy restricted diet that reduces weight improves insulin resistance and blood lipids
§ Energy restricted low fat, high carbohydrate diets can be used to reduce weight and prevent diabetes in patients with impaired glucose tolerance
§ Severe energy restriction by gastric bypass induces weight loss and remission of diabetes
§ Obesity is primary driver of T2 Diabetes
Clinical Trial Evidence: Energy Intake, Dietary Composition, Weight, and Insulin Resistance
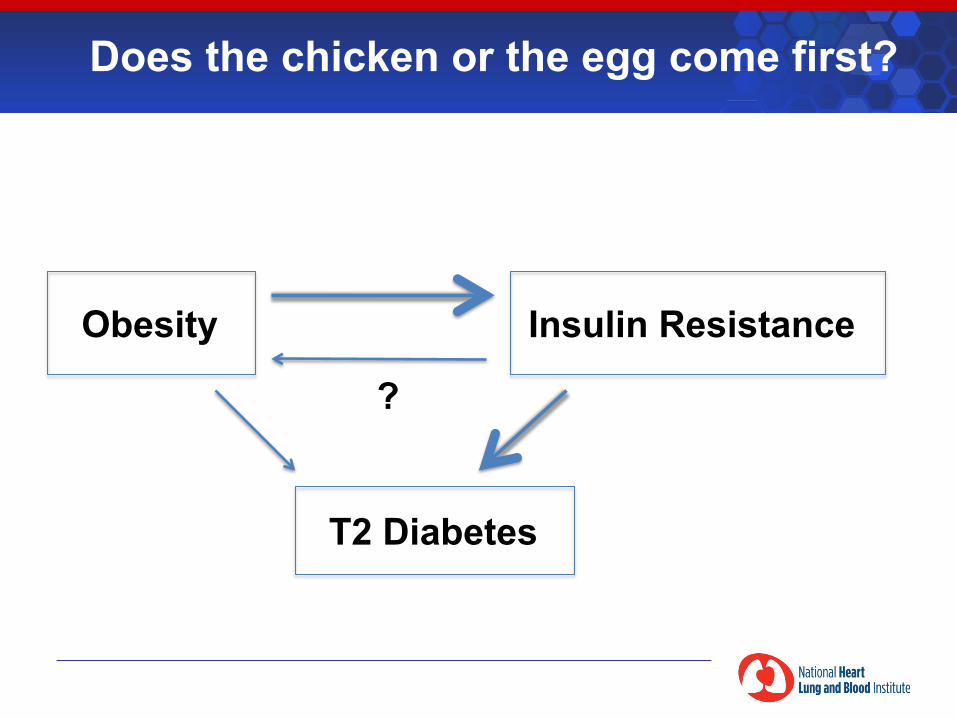
Does the chicken or the egg come first?
Obesity Insulin Resistance
T2 Diabetes
?
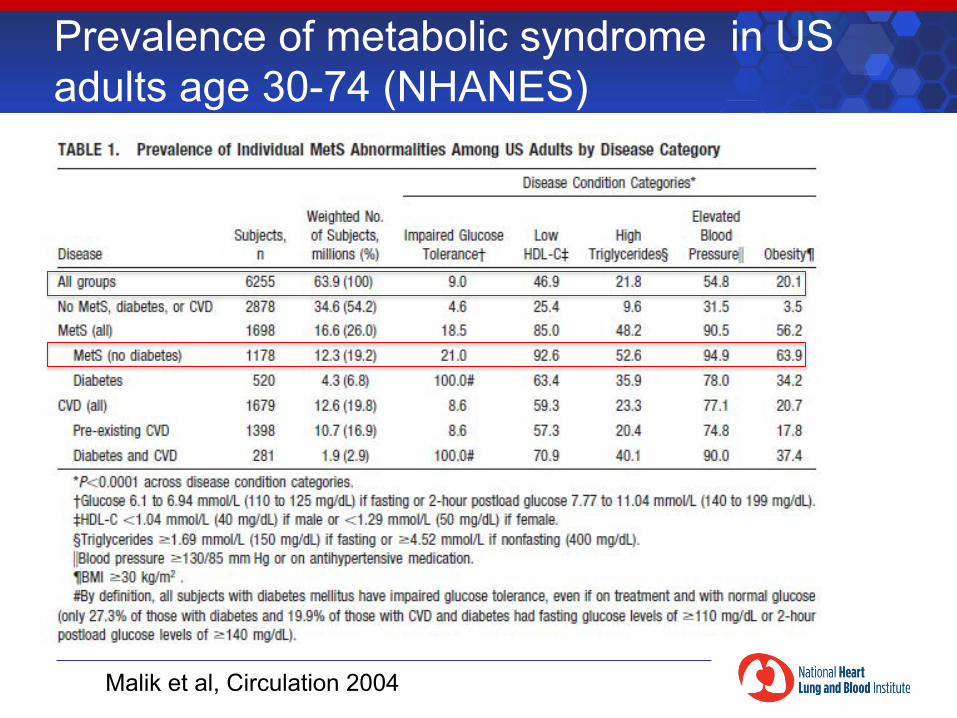
Prevalence of metabolic syndrome in US adults age 30-74 (NHANES)
Malik et al, Circulation 2004

The Good
The Ugly
Seafood Omega-‐3 PUFA
Plant Omega-‐6 PUFA
Saturated Fat
Monounsaturated Fat
Industrial Trans Fat
Plant Omega-‐3 PUFA
Refined Carbohydrates & Starches
The Bad
Courtesy Dariush Mozzafarian
The Good
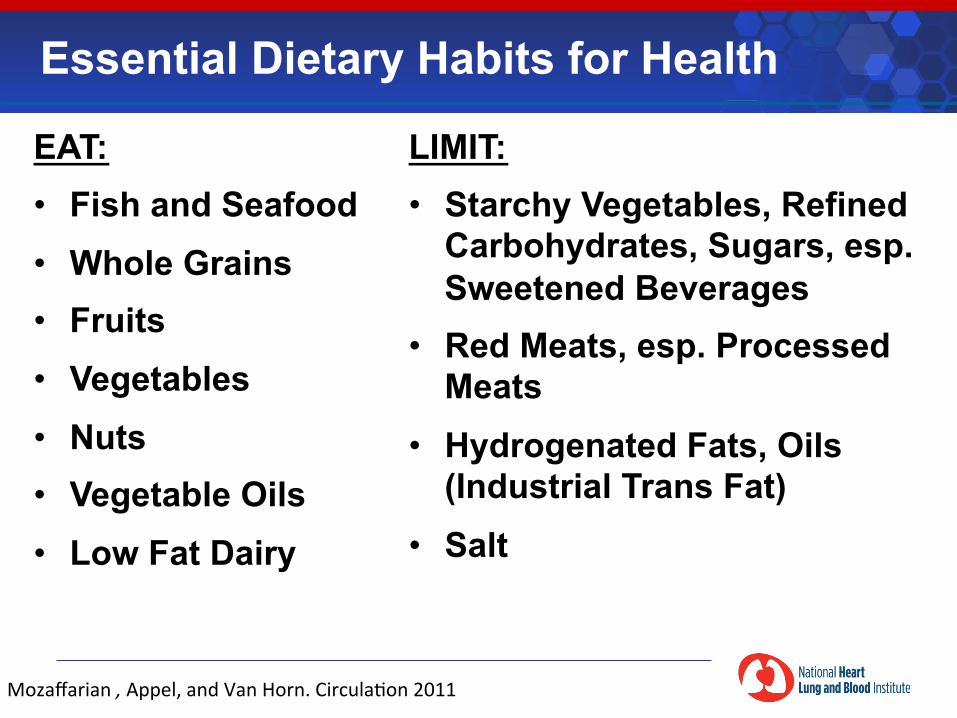
EAT: • Fish and Seafood • Whole Grains • Fruits • Vegetables • Nuts • Vegetable Oils • Low Fat Dairy
Essential Dietary Habits for Health
LIMIT: • Starchy Vegetables, Refined
Carbohydrates, Sugars, esp. Sweetened Beverages
• Red Meats, esp. Processed Meats
• Hydrogenated Fats, Oils (Industrial Trans Fat)
• Salt
Mozaffarian , Appel, and Van Horn. Circula<on 2011

Hippocratic Oath
I will apply dietetic measures for the benefit of the sick according to my ability and
judgment; I will keep them from harm and injustice.
“Primum non nocere”
Source: Wikipedia


Reserve Slides
Non-HDL-C is associated with CHD risk in all age groups, men and women, and in diabetics
The Emerging Risk Factors Collaboration
JAMA. 2009;302(18):1993-2000
In subset of 8 studies: Overall CHD HR for directly measured LDL-C = 1.38, 1.09-1.73 Overall CHD HR for Non-HDL-C = 1.42, 1.06-1.91
0.00
0.01
0.02
0.03
0.04
0.05
0.06
0.07
0.08
0.09
0.10
0 1% 2% 3% 4% 5%
β=0.027*
β=0.018
β=0.01
β=0.002
16:0 (palmitic)
14:0 (myristic)
12:0 (lauric)
18:0 (stearic)
percentage of calories vs. carbohydrate
Change in HDL-C (mmol/L)
HDL cholesterol
Short-term Feeding Studies: Lipid Effects of Individual SFAs
Figure from Micha & Mozaffarian, Lipids 2010. Based on Mensink & Katan 2003.
-0.20
-0.18
-0.15
-0.13
-0.10
-0.08
-0.05
-0.03
0.00
0.03
0 1% 2% 3% 4% 5%
β=0.005
β=-0.013
β=-0.037*
β=-0.003
18:0 (stearic)
14:0 (myristic)
16:0 (palmitic)
12:0 (lauric)
percentage of calories vs. carbohydrate
Change in Total:HDL Ratio
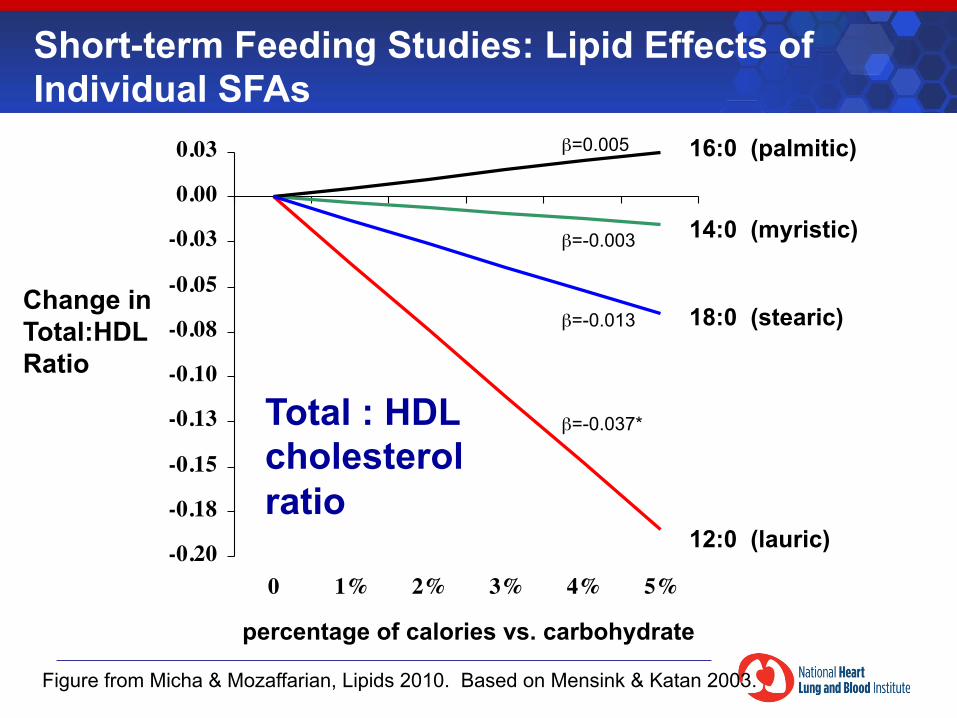
Figure from Micha & Mozaffarian, Lipids 2010. Based on Mensink & Katan 2003.
Total : HDL cholesterol ratio
Short-term Feeding Studies: Lipid Effects of Individual SFAs
Associations among 25-year trends in diet, cholesterol and BMI from 140,000 observations in men and women in Northern Sweden.
Johansson I, et al. Nutrition Journal 2012;11:40 [epub ahead of print]
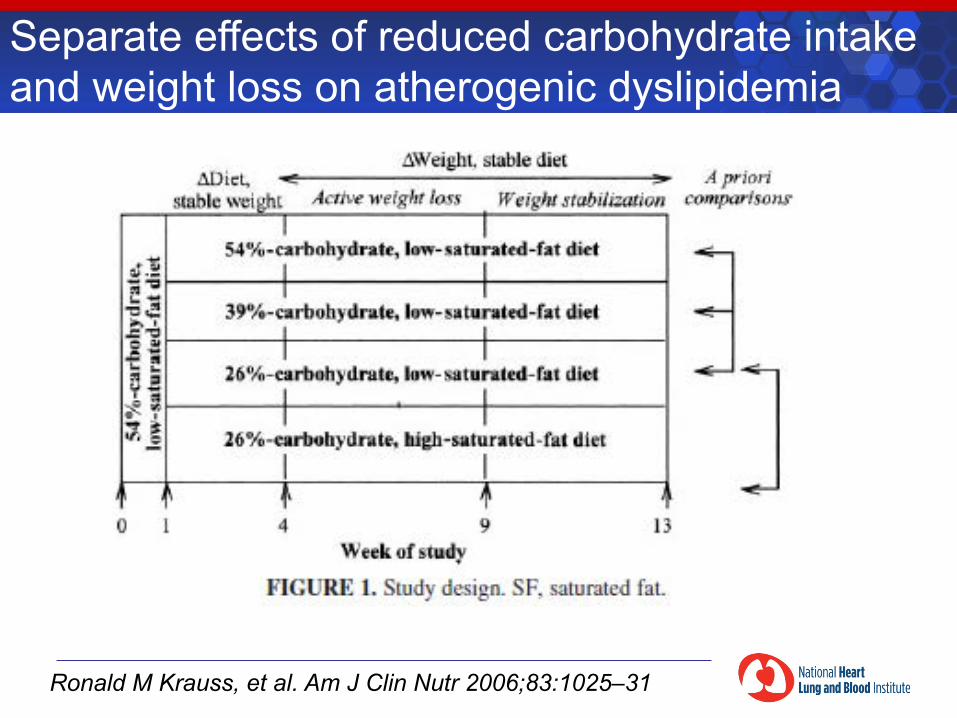
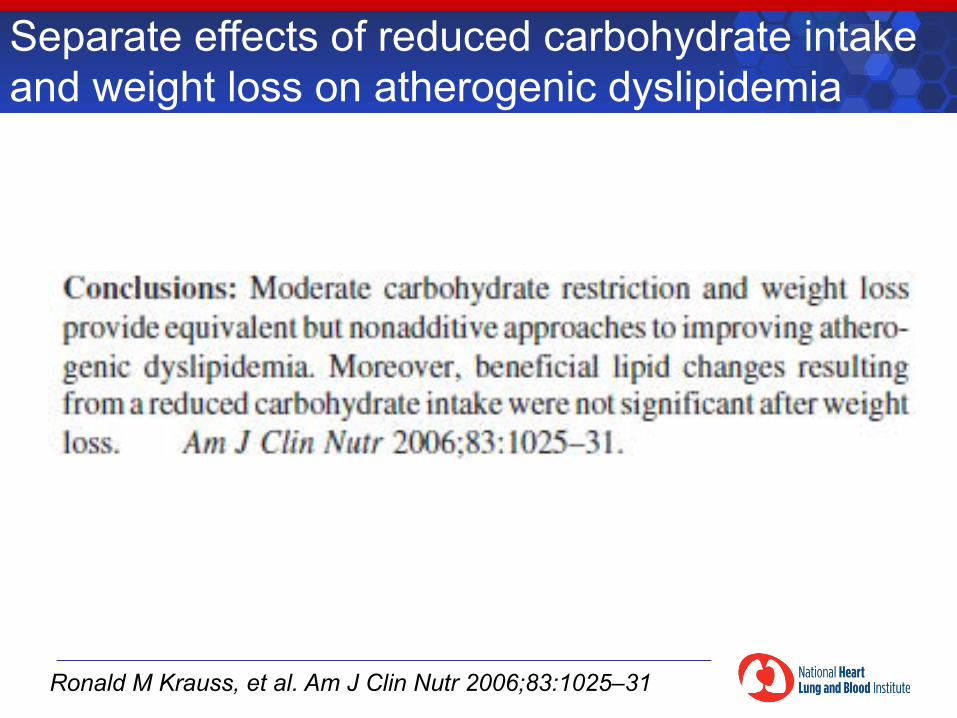
Separate effects of reduced carbohydrate intake and weight loss on atherogenic dyslipidemia
Ronald M Krauss, et al. Am J Clin Nutr 2006;83:1025–31
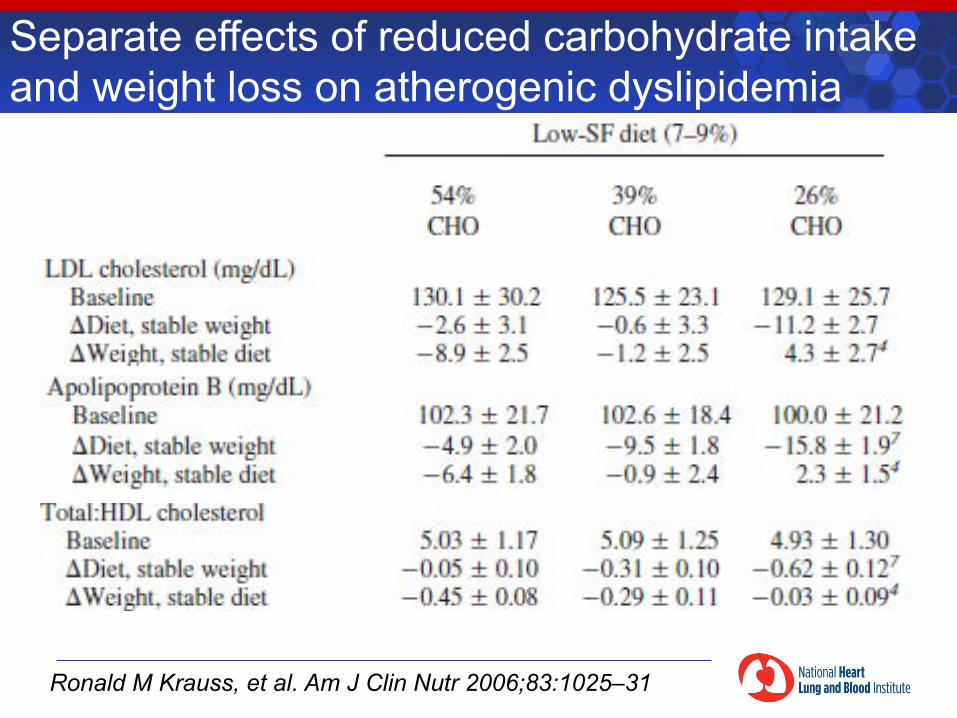
Separate effects of reduced carbohydrate intake and weight loss on atherogenic dyslipidemia
Ronald M Krauss, et al. Am J Clin Nutr 2006;83:1025–31
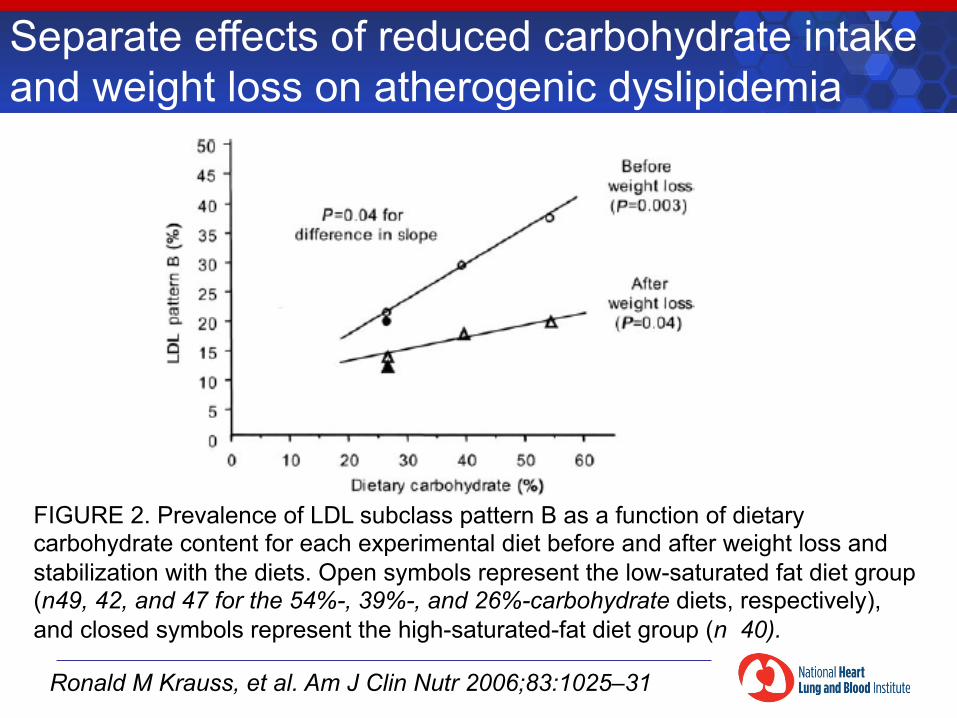
Separate effects of reduced carbohydrate intake and weight loss on atherogenic dyslipidemia
Ronald M Krauss, et al. Am J Clin Nutr 2006;83:1025–31
FIGURE 2. Prevalence of LDL subclass pattern B as a function of dietary carbohydrate content for each experimental diet before and after weight loss and stabilization with the diets. Open symbols represent the low-saturated fat diet group (n49, 42, and 47 for the 54%-, 39%-, and 26%-carbohydrate diets, respectively), and closed symbols represent the high-saturated-fat diet group (n 40).
Separate effects of reduced carbohydrate intake and weight loss on atherogenic dyslipidemia
Ronald M Krauss, et al. Am J Clin Nutr 2006;83:1025–31
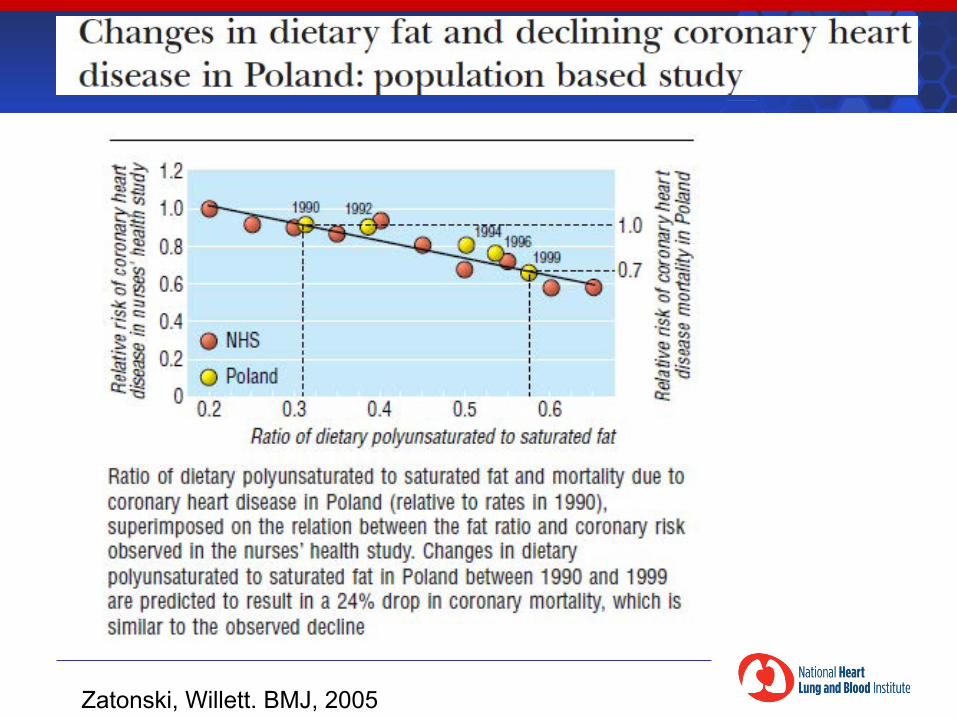
Zatonski, Willett. BMJ, 2005