Embed Size (px)
Citation preview
1
Choices that students make between different post-18 routes and whether these choices are effective and reliably informed: Review of relevant literature and evidence Final Report
May 2019
Peter Dickinson, Institute for Employment Research, University of Warwick
2
Contents Executive summary 7
Introduction 7
Key Findings 7
1. Introduction 14
1.1. Project aim 14
1.2. Background 15
2. Methodology 20
2.1. Focused Literature Review of Academic Articles 20
2.2. Grey Literature 22
3. Choices between Higher Education (HE), Further Education (FE) and Apprenticeships 24
3.1. Introduction 24
3.2. Overview of the decision making pathway of young people 27
3.3. Demographic factors impaction on choices between Higher Education (HE), Further Education (FE) and Apprenticeships 34
3.4. The impact of access to information, advice and guidance on post-18 choices 42
3.5. The impact of job prospects, future financial returns and lifestyle factors on choice 55
4. Choices within HE and FE 67
4.1. Choice of Provider 67
4.2. Choice of Course 71
5. Finance 75
5.1. How does the available information about finance (e.g. relating to fees, loans, bursaries, accommodation rates etc.) influence the choices students make 75
5.2. What is the impact of the funding system on choice in other developed countries 78
5.3. Summary 82
6. Mature Students 83
6.1. Which factors shape mature students’ choices? 83
6.1.1. People as individuals 83
6.1.2. Older people in HE 85
6.1.3. People in employment 86
3
6.1.4. People not in employment 88
6.1.5. Summary 89
7. Summary 91
7.1. Choices between Higher Education (HE), Further Education (FE) and Apprenticeships 91
7.1.1. Overview of decision making pathway 91
7.1.2. Demographic factors impacting on choices between Higher Education (HE), Further Education (FE) and Apprenticeships 91
7.1.3. The impact of access to information, advice and guidance (IAG) on young people’s choices between HE, FE and Apprenticeships 92
7.1.4. The impact of future financial returns, job prospects and ‘lifestyle’ factors on young people’s choices between HE, FE and Apprenticeships 94
7.2. Choices within HE and FE 94
7.2.1. Choice of provider 94
7.2.2. Choice of course 95
7.3. How financial factors influence choice 96
7.4. Choice factors for mature students 96
8. Bibliography 98
9. Websites consulted 106
4
List of tables Table1: Profile of 16-18 education and training in England 2010-2016 .......................... 17
Table 2: Profile of 19+ FE education and training in England 2010/11-2015/16 ............. 18
Table 3: Profile of HE participation in England 2012/13-2016/17 by mode of study ....... 18
Table 4: Abstract review (N = 156) and Grouping of those saved (N = 98)..................... 21
Table 5: Timeline of decision making from two studies ................................................... 28
Table 6: When young people first started thinking about what to do after Year 11/13 .... 30
Table 7: When young people made the final decision to do the course they are doing now .................................................................................................................................. 31
Table 8: Likelihood of going to HE when old enough? .................................................... 31
Table 9: Learner characteristics by route ........................................................................ 35
Table 10: Online sources of information used in decision-making .................................. 44
Table 11: Proportion of respondents who strongly disagree with statements about IAG by route ............................................................................................................................ 48
Table 12: Source of information about apprenticeships .................................................. 53
Table 13: Young people’s motivations for applying to an apprenticeship ....................... 57
Table 14: Factors of above average importance on whether to go to university by SEG – Index scores (MaxDiff method) ........................................................................................ 61
Table 15: Factors of below average importance on whether to go to university by SEG – Index scores (MaxDiff method) ........................................................................................ 61
Table 16: Websites with relevant literature ................................................................... 106
5
List of figures Figure 1: Factors shaping individuals’ choices and behaviours towards participation in education and learning .................................................................................................... 26
Figure 2: Post-16 cluster compositions extracted from the LSYPE ................................. 33
Figure 3: Proportion NEET by characteristic in 2013/14 (for those above the national average) ........................................................................................................................... 37
Figure 4: Average rank of test scores at 22, 42, 60 and 120 months, by SES of parents and early rank position ..................................................................................................... 39
Figure 5: How likely do you think it is that you will go to university? By gender .............. 41
Figure 6: Which tools and resources young people used in order to help make decisions about what to do after Year 11/13 by route ...................................................................... 43
Figure 7: Whether sought information in relation to questions when deciding on current course to help inform decision-making by route (% who agreed/strongly agreed) ........... 45
Figure 8: Extent to which agree with statements in relation to making decisions about education and training by route (% who agreed/strongly agreed) .................................... 47
Figure 9: How satisfied young people are with their current educational choice by route ......................................................................................................................................... 49
Figure 10: Which individuals young people spoke to in order to help make decisions about what to do after Year 11/13 by route ...................................................................... 50
Figure 11: Helpfulness of individuals in supporting decisions about what to do after Year 11/13 ................................................................................................................................ 51
Figure 12: Encouragement from school for doing an apprenticeship .............................. 52
Figure 13: Why did Foundation degree applicants decide to enter higher education? .... 56
Figure 14; Median earnings by level achieved at age 23 and GCSE attainment score .. 59
Figure 15: For those put off by HE costs, which aspects of funding persuaded you to apply to university? .......................................................................................................... 63
Figure 16: Reasons given for not considering an apprenticeship or FE college, by socio economic group ............................................................................................................... 65
Figure 17: Why did students choose to study at a given institution? ............................... 67
Figure 18: Influences on which University ....................................................................... 68
6
Figure 19: Apprenticeship Programme Starts by Sector Framework and Gender 2014/15 ......................................................................................................................................... 72
Figure 20: Distribution of share women in girls’ and boys’ aspired occupations, MCS age 14 ..................................................................................................................................... 73
Figure 21: Ease of obtaining information in relation to questions when deciding on current course to help inform decision-making by route................................................... 76
Figure 22: Ease of sourcing funding information about advanced learner loans ............. 77
Figure 23: Simplified average income structure of public universities 2014 (rounded up to the nearest multiple of five) .............................................................................................. 79
Figure 24: Overview of older people’s career decision-making styles ............................ 85
Figure 25: Percentage of people who participated in training in 2017 and 2010, by age group ............................................................................................................................... 87
7
Executive summary
Introduction DfE commissioned the Institute for Employment Research at Warwick University to undertake a review of relevant literature and evidence into choices that students make between different post-18 vocational, academic and technical, and whether these choices are effective and reliably informed.
There were four main research question areas:
• How are choices made between HE, FE and apprenticeship routes?
• How are choices made within these three routes?
• What role does finance, and information about finance, play?
• How are choices made by mature students?
The review included:
• A focused literature search of academic articles yielding 184 sources of which 143 were reviewed;
• A ‘grey’ literature review of non-academic published sources identified through a general web search, and targeted searches of 82 websites. 43 websites generated literature of relevance to the study and 85 documents were included in the review.
The ‘grey’ literature review produced the most relevant sources used in this report.
Key Findings
Choices between Higher Education (HE), Further Education (FE) and Apprenticeships
Overview of decision making pathway
Most young people consciously make their post-18 choices in Year 9 (when choosing their GCSE options), in Year 11 (the transition point into post-16 education and training), and in Year 12 (for those in HE).
Young people tend not to amass a large amount of information before they make a broad decision. They tend decide on a chosen route first (based on an array of factors) and then seek out information about it.
Young people on academic pathways start to think about their post-18 choices earlier than those on technical routes, and make their final decisions sooner. While 8 per cent of those on a HE (Academic) pathway first considered their future education
8
choices in Years 7 or 8, only 2% of HE (Technical) learners did so. One third (33%) of those on HE (Academic) routes made their final decision about their post-18 route during Year 12 and just under half (47%) made it during Year 13. This compares to 19% and 63% respectively for HE (Technical) learners on higher level apprenticeships.
Evidence from the Longitudinal Study of Young People in England suggests that there is little movement between different broad types of post-18 pathway (e.g. higher education, technical education or employment), especially after Year 13. This suggests that the 16-18 year old transition point is critical for longer term outcomes in a young person’s life.
Demographic factors impacting on choices between Higher Education (HE), Further Education (FE) and Apprenticeships
The choice that young people make between HE, FE and Apprenticeships is heavily influenced by their demographic characteristics. In particular:
• Socio-economic group (SEG): Young people from lower socio-economic groups are less likely to progress to HE. Those in receipt of Free School Meals (FSM) or a 16-19 Bursary are more likely to follow FE or Technical routes, as are those whose parents did not go to university. However, the role of SEG in learning and skills decision making is complex, given that it is closely related to prior attainment, which is the best predictor of future outcomes.
• Prior attainment: Attainment at age 16 is a key determinant of young people’s post-18 pathways, with higher attainment at this age associated with higher rates of post-18 participation in education and training and, specifically, higher rates of participation in HE.
• Gender: Take-up of the broad post-18 options is relatively balanced between women and men, although women are more likely than men to enter education and training. (Women account for 57% of HE starts and 54% of apprenticeship starts.) There are significant differences in the subjects chosen by men and women on both technical and academic post-18 routes. In terms of apprenticeships, women are more likely to choose subjects like Hairdressing, Children’s Care, Learning and Development and Supporting Teaching in Learning and School. Men are more likely to choose subjects such as Construction, Electrotechnical and Vehicle Maintenance and Repair.
The impact of access to information, advice and guidance (IAG) on young people’s choices between HE, FE and Apprenticeships
Young people pursuing different post-18 pathways have different information needs. Young people are most interested in finding out about course entry requirements and what they will learn on a course, regardless of their post-18 route (Technical HE/FE, HE Academic and Academic). However, young people looking to HE Academic routes are more likely than those on other routes to want to know about: the satisfaction of
9
previous learners; costs; the availability of financial support; and job, and earnings outcomes. Young people aiming for Technical FE/HE routes are more interested in how the course is assessed. Large proportions of those on the HE Academic, and Technical FE/HE routes also want to know about location and accessibility.
Most young people would like careers information in one place, and want personalised IAG that is relevant to them. Their preference would be to speak to someone face-to-face, by phone or text, and this preference is strongest amongst those on Technical FE/HE routes.
Most young people are broadly satisfied with the IAG available, however, significant minorities have faced issues. These issues include not finding the information to help them make a decision (<20%), not finding all the information they wanted to make a fully informed decision (<15%) and not being aware of available IAG (<15%).
A significant minority of young people are also confused about which sources of information they can trust. 30% of all young people agreed or strongly agreed that ‘I did not know what source of information I could trust to give me accurate information’. Young people on HE Academic pathways were most likely to agree with this (40%).
Parents/carers and other relatives were the individuals consulted most by young people following each of the three routes – Technical FE/HE, HE (Academic) and FE (Academic) – followed by subject teacher, and friends.
Those following technical routes were much less likely to have consulted their subject teachers compared with those following academic routes. 48 percent of those following technical pathways had consulted subject teachers compared to 69% of those following HE (Academic) and 68% following FE (Academic) routes.
Young people following technical routes were also less likely than those following other pathways to find subject teachers helpful or very helpful. Three quarters (74%) of those on FE/HE Technical routes found their subject teachers helpful or very helpful, compared to 91% on the HE Academic route and 90% on the FE Academic route. Perceptions about the helpfulness of other individuals, including careers advisers, family, friends and staff during open days, were broadly similar among young people following different pathways.
There is some qualitative evidence that IAG is perceived to be biased towards academic routes and away from more technical or vocational options. In particular, studies highlight the often perceived poor quality of information about apprenticeships given to young people by teachers and careers advisers in schools.
There are also potential issues with the timing of IAG in relation to technical routes. When pupils are told about apprenticeships is potentially important and
10
could influence the effectiveness of information received. In those schools where more than 6% of pupils graduated into apprenticeships, around 70 per cent told pupils in Year 10 or younger compared to just over 50% of other schools.
Despite these issues, most young people are satisfied with their chosen route. 87% of those taking the Technical FE/HE route are satisfied or very satisfied, compared with 89% taking the HE Academic route and 90% on the FE Academic route.
The impact of future financial returns, job prospects and ‘lifestyle’ factors on young people’s choices between HE, FE and Apprenticeships
Future career prospects are of paramount importance to young people following academic and technical routes. This is true despite the fact many young people on HE Academic pathways do not have a clear idea about what job they want to go into after completing their course. 38% of those on the HE Academic route agreed or strongly agreed with the statement ‘I know what I want to do when I finish my current course’, compared to 75% of those on the Technical HE/FE route and 73% of those on the FE Academic route
Young people also make their post-18 choices with their future earnings in mind. Higher levels of qualification lead to higher financial returns. Despite the 2012 rise in tuition fees, HE is still considered a relatively good financial investment, and understanding of this among young people has grown over time. The main reason given by young people for applying to university is to improve their job opportunities and salary prospects.
This holds true for young people of all social classes. Although those in lower social classes are more concerned about student debt, and feel more reluctant about entering HE, participation rates among this group have actually increased.
‘Lifestyle factors’ play a key role in underpinning the decision of many young people to enter higher education as opposed to other routes, such as apprenticeships. When asked why they did not choose alternatives to HE, the most popular response, given by four out of five HE applicants, was simply that they ‘wanted to go to university’. Qualitative research has found that young people consistently speak about non-academic aspects when considering university. For some, university represents a ‘rite of passage’, in contrast to apprenticeships which were not seen to provide a narrative about lifestyle.
11
Choices within HE and FE
Choice of provider
In terms of provider choice, most young people entering HE choose providers because they offer the particular course they want to study. This is the primary reason given by both Foundation degree students and other HE students for choosing a given provider.
It is also important to potential HE students that a prospective provider ‘feels right’. In this context, provider open days are important for students in making their choice of provider, and numerous studies have shown that talking to staff at an open day is among the most important sources of information for young people entering HE.
The reputation of the institution was also deemed important by young people making their choice of provider. However, university reputation is a greater influence on students from higher SEGs than lower.
Among those entering FE, provider proximity was a major factor influencing where to study, but this tended to be by default. If someone wants to pursue a particular course, programme or qualification, there is often only one General FE college in an area, so the choice of provider is limited.
Location is also an important factor for mature HE students in choosing their provider, but not for young HE students. Mature students are more likely to have other commitments (such as jobs and family), and are less likely to be able and willing to relocate to study. However, being closer to home was more important to students from lower SEGs. Over one third (36%) of those in SEGs C1-E rated being able to live at home as having some influence and 25% rated it as the major influence. This compares with 19% and 10% of students in SEGs AB respectively.
Choice of course
Gender plays a key role in influencing the course choice of young people pursuing both academic and technical pathways. For example, in all but three of the top 20 apprenticeship frameworks/standards, the percentage point difference between male and female starts is greater than 20. In 13 of the top 20 frameworks/standards, the difference is greater than 50 percentage points.
Future earnings potential plays a role in young people’s course choice. 57% of students sought information on what previous learners on a course now earned, but this varied by route. 48% of FE Academic learners sought this information, compared to 56% of Technical FE/HE and 68% of HE Academic students.
In terms of course choice, there is some evidence that students whose parents are more educated are more likely to choose subjects for intrinsic reasons, such as
12
enjoyment. Students whose parents had higher levels of education were more likely to choose arts and humanities subjects, and less likely to choose social sciences, law or business, compared to students whose parents had lower levels of education.
How financial factors influence choice
Information about the earnings of previous learners was more important to young people than how much the course cost and whether there was financial support available. This was true for all routes students chose (HE Academic, FE Academic and HE/FE Technical).
Young people found information about the cost of and financial support available to them easier to locate than information about earnings. For example, 88% of those on the HE Academic route found information about cost easy or very easy to get hold of. 71% of the same group found information about financial support easy/very easy to access and 65% found earnings data easy/very easy to access.
The decision making processes of young people in England are similar to those in other countries. This is relatively surprising, given the higher tuition fees paid by students in the England compared with other countries. Young people develop a predisposition to pursuing a particular route. HE funding is an important component of this decision, but it is not the main one and is offset to a large extent by the deferred repayment of income contingent loans repaid when earnings reach a certain threshold.
Similar to England, studies from other countries suggest that young people from low income (and other) backgrounds would benefit from more accurate information about HE, which could help them make more informed choices about whether to consider HE in the first place, which subjects to study and which HE providers to attend.
Choice factors for mature students
Older people’s aspirations, choices and intentions evolve over time. While this is similar to the decision making process of younger people, older people’s moments of choice are much less predictable and can be prompted by uncertain events e.g. being made redundant, health issues, bereavement, promotion, changes in caring responsibilities etc.
Like younger people, older people access a wide range of information and support. Friends and family tend to be heavily involved.
Older people’s participation in HE appears has been significantly affected by the increase in tuition fees. Part-time student numbers especially have declined.

13
When deciding on HE options, location is a much more important decision-making factor for older students, compared with younger students. Interest in the subject, earnings and careers and flexibility of learning are also important motivating factors.
Unlike younger people, older people are more likely to have organisations heavily involved in their education and training decisions. Employers can be the major decision maker for people in employment, while Jobcentre+ advisers play an important role in supporting unemployed people into work related training.
14
1. Introduction DfE require a review of relevant literature and evidence into choices that students make between academic, technical, and vocational routes after 18, and whether these choices are effective and reliably informed. This work will feed into the evidence base for the Review of post-18 education and funding announced on 19th February 2018.
The literature review should improve our knowledge of how students makes choices about their education and training and what information and guidance they use to make these choices.
1.1. Project aim The aim of the literature and evidence review was to improve the Department for Education’s (DfE) knowledge of how students makes choices about their education and training and what information and guidance they use to make these choices.
Within this overall aim, the review seeks to answer the following key research questions (RQs):
1. (RQ1) Choices between Higher Education (HE),Further Education (FE) and Apprenticeships.
• (RQ1a) How do students choose between HE, FE and apprenticeship routes and who influences the choices they make (for e.g. parents, peers, pre-18 teachers?)
• (RQ1b) What are the most important factors when marginal students (i.e. those on the HE-FE borderline) choose between HE and FE? For similar outcomes and qualifications; why do students choose more costly HE routes rather than lower cost FE routes?
• (RQ1c) How do students seek out FE and apprenticeship courses and opportunities?
• (RQ1d) What is the effectiveness of different information, advice and guidance (IAG) routes, and which routes do students use?
• (RQ1e) When choosing between HE, FE and apprenticeships what role do the following play:
i. Location ii. Outcomes/salary iii. Career pathway/ plan iv. Passion/ personal fulfilment/ career calling
• (RQ1e) How have the factors influencing student choice changed over time? (i.e. before 9k tuition fees vs. under the current system).
2. (RQ2) Choices within HE and FE. • (RQ2a) Which factors influence students’ choice of:
i. institution, ii. course, iii. mode of study / length of course (full or part-time or accelerated)
15
iv. location (i.e. living at home or leaving home). • (RQ2b) When choosing between courses/ pathways what role do the following
play: i. outcomes/salary ii. passion/ personal/ fulfilment/ career calling iii. signalling (of the value of the qualification)
3. (RQ3) Finance. • (RQ3a) How does the available information about finance (e.g. relating to fees,
loans, bursaries, accommodation rates etc.) influence the choices students make? • (RQ3b) What is the impact of the funding system on choice in other developed
countries? [Wales, USA, Scotland, Northern Ireland, Scandinavian countries].
4. (RQ4) Mature students. • (RQ4a) Which factors shape mature students’ choices? • (RQ4b) In which ways do these factors impact on mature students in the following
groups: i. Those from disadvantaged backgrounds ii. Those seeking to retrain iii. Those who previously pursued an FE or level 4/5 route and go back to HE?
The report is structured around these research questions.
1.2. Background The post-16 education and training landscape has changed radically. For 16-18 year olds: they must stay in education or training until age 18; there has been a change in the number and range of providers; and an increased emphasis on apprenticeships as a mechanism for meeting the vocational aspirations of young people and the labour market needs of employers. The introduction of T-Level qualifications over the coming years will also provide additional options. For 19-24 year olds the main route continues to be HE, despite the financial costs for students being increased. Advanced and degree level apprenticeships have created progression pathways for young people to higher level qualifications and skills outside of the HE academic route. The main growth in apprenticeship take up has occurred amongst adults, but there has been a sharp decline in adult part-time HE take-up, and in post 19+ government-funded FE. Employer investment in skills training has also been declining since the financial crisis. In addition to the growth in adult apprentices, the National Retraining Programme is also being developed, as well as a successor to the European Social Fund (ESF) which traditionally supports disadvantaged learners.
Alongside these radical changes in the topography and funding of education and training, the quality of Government funded information, advice and guidance (IAG) available to young people and adults since the start of the decade has remained patchy. Evidence
16
from the Education Select Committee1 and Ofsted2 (amongst others) highlighted a particular issue with the quality of careers provision in schools. Recognising the need for improvement, the Government published a Careers Strategy in December 20173, this strategy recognised the variable quality in careers IAG available through England, especially for young people at the key transition points. It retains a school and college led careers system, but provides additional support to improve quality by adopting the Gatsby Foundation’s Benchmarks which define excellence in careers provision. The strategy pledges that adults will have: “…access [to] local, high-quality advice from a National Careers Service adviser, with more bespoke advice and support available when you need it most”4.
For over a decade there has been an intention to make education and training more demand-led. A key element of the Post-16 Skills Plan is empowering people – young people, adults and their formal and informal advisers – to access IAG in order to make more informed decisions. As we have seen, the education and training landscape is becoming more complex which requires effective careers IAG so that choices are well informed. The Industrial Strategy identified the issues for young people:
“People choosing apprenticeships or courses in colleges currently face significant complexity when selecting and applying for a course… We will therefore explore how to give technical education students clear information and better support throughout the application process, with a similar platform to UCAS, which will also make it easier for students to compare options in technical education and higher education”5.
For adults too, there is significant evidence that the provision of high quality, impartial careers information and guidance is key to supporting choices and transitions into education, training and employment (see for example Hooley et al., 20126). It also has a crucial role to play in encouraging and supporting those disengaged or disadvantaged to engage in education and learning activities.
1.2.1. Post 16 education and training
Table 1 provides a context to the report, describing the education and training of 16-18 year olds since the start of the decade. There have been significant falls in the number of 16, 17 and 18 year olds who are Not in Education, Employment or Training (NEET).
1 House of Commons Education Committee March 2015), Closing the gap: the work of the Education Committee in the 2010–15 Parliament. Eighth Report of Session 2014–15 2 Ofsted (2013), Going in the right direction? Careers guidance in schools from September 2012. See also Ofsted’s Chief Inspectors evidence to the Education Committee 16 September 2015. 3 Department for Education (December 2017), Careers strategy: making the most of everyone’s skills and talents 4 Ibid. 5 HMG (January 2017) Building our Industrial Strategy: Green Paper, London. 6 Hooley T. et al (2012) Tackling unemployment, supporting business and developing careers. UK Commission for Employment and Skills.
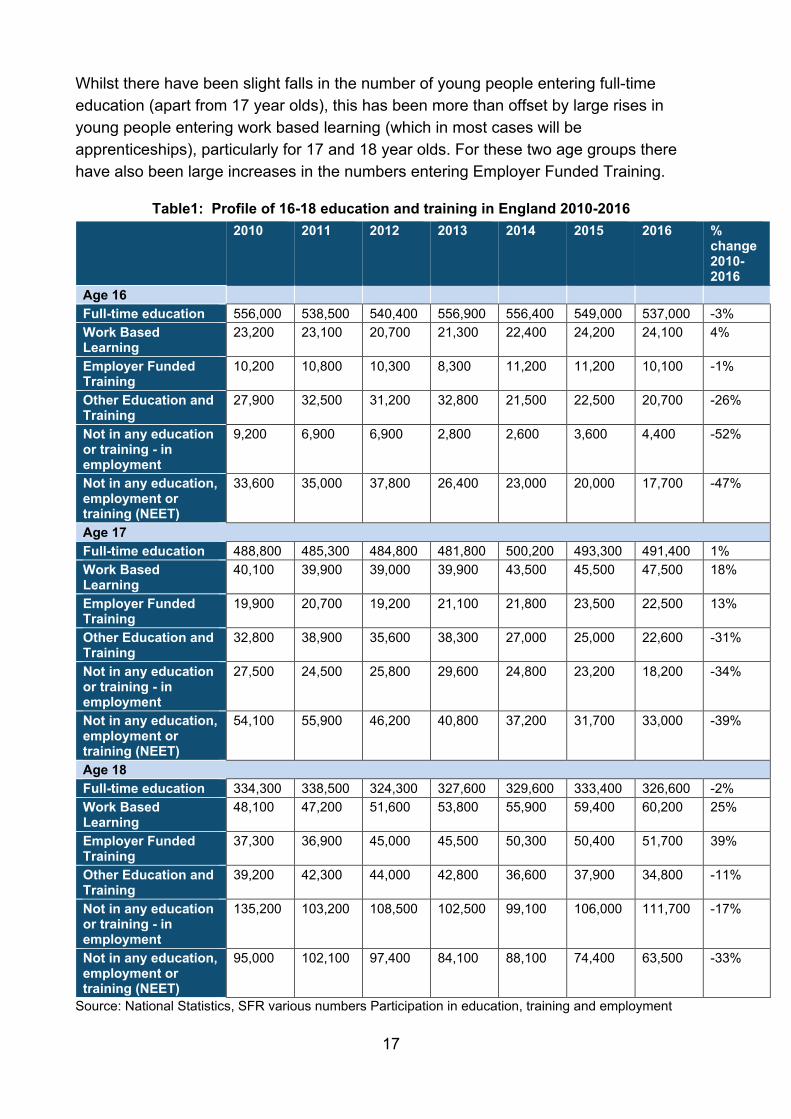
17
Whilst there have been slight falls in the number of young people entering full-time education (apart from 17 year olds), this has been more than offset by large rises in young people entering work based learning (which in most cases will be apprenticeships), particularly for 17 and 18 year olds. For these two age groups there have also been large increases in the numbers entering Employer Funded Training.
Table1: Profile of 16-18 education and training in England 2010-2016
2010 2011 2012 2013 2014 2015 2016 % change 2010-2016
Age 16 Full-time education 556,000 538,500 540,400 556,900 556,400 549,000 537,000 -3% Work Based Learning
23,200 23,100 20,700 21,300 22,400 24,200 24,100 4%
Employer Funded Training
10,200 10,800 10,300 8,300 11,200 11,200 10,100 -1%
Other Education and Training
27,900 32,500 31,200 32,800 21,500 22,500 20,700 -26%
Not in any education or training - in employment
9,200 6,900 6,900 2,800 2,600 3,600 4,400 -52%
Not in any education, employment or training (NEET)
33,600 35,000 37,800 26,400 23,000 20,000 17,700 -47%
Age 17 Full-time education 488,800 485,300 484,800 481,800 500,200 493,300 491,400 1% Work Based Learning
40,100 39,900 39,000 39,900 43,500 45,500 47,500 18%
Employer Funded Training
19,900 20,700 19,200 21,100 21,800 23,500 22,500 13%
Other Education and Training
32,800 38,900 35,600 38,300 27,000 25,000 22,600 -31%
Not in any education or training - in employment
27,500 24,500 25,800 29,600 24,800 23,200 18,200 -34%
Not in any education, employment or training (NEET)
54,100 55,900 46,200 40,800 37,200 31,700 33,000 -39%
Age 18 Full-time education 334,300 338,500 324,300 327,600 329,600 333,400 326,600 -2% Work Based Learning
48,100 47,200 51,600 53,800 55,900 59,400 60,200 25%
Employer Funded Training
37,300 36,900 45,000 45,500 50,300 50,400 51,700 39%
Other Education and Training
39,200 42,300 44,000 42,800 36,600 37,900 34,800 -11%
Not in any education or training - in employment
135,200 103,200 108,500 102,500 99,100 106,000 111,700 -17%
Not in any education, employment or training (NEET)
95,000 102,100 97,400 84,100 88,100 74,400 63,500 -33%
Source: National Statistics, SFR various numbers Participation in education, training and employment
18
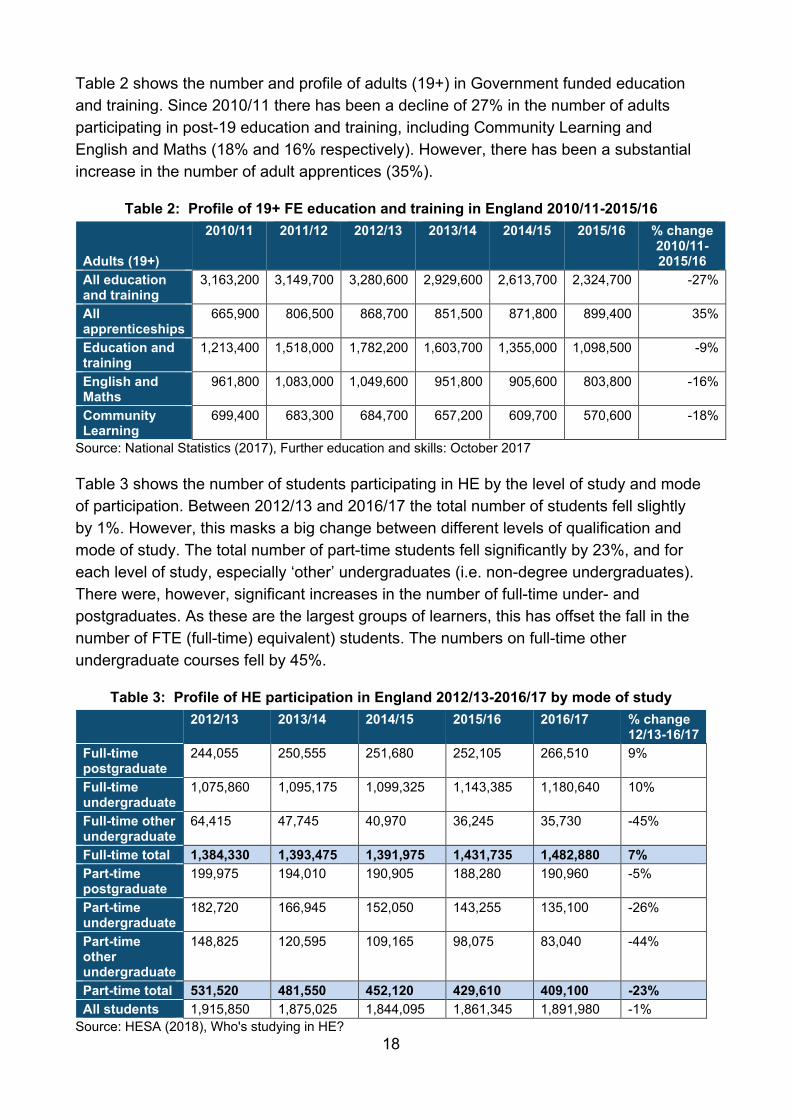
Table 2 shows the number and profile of adults (19+) in Government funded education and training. Since 2010/11 there has been a decline of 27% in the number of adults participating in post-19 education and training, including Community Learning and English and Maths (18% and 16% respectively). However, there has been a substantial increase in the number of adult apprentices (35%).
Table 2: Profile of 19+ FE education and training in England 2010/11-2015/16
Adults (19+)
2010/11 2011/12 2012/13 2013/14 2014/15 2015/16 % change 2010/11-2015/16
All education and training
3,163,200 3,149,700 3,280,600 2,929,600 2,613,700 2,324,700 -27%
All apprenticeships
665,900 806,500 868,700 851,500 871,800 899,400 35%
Education and training
1,213,400 1,518,000 1,782,200 1,603,700 1,355,000 1,098,500 -9%
English and Maths
961,800 1,083,000 1,049,600 951,800 905,600 803,800 -16%
Community Learning
699,400 683,300 684,700 657,200 609,700 570,600 -18%
Source: National Statistics (2017), Further education and skills: October 2017
Table 3 shows the number of students participating in HE by the level of study and mode of participation. Between 2012/13 and 2016/17 the total number of students fell slightly by 1%. However, this masks a big change between different levels of qualification and mode of study. The total number of part-time students fell significantly by 23%, and for each level of study, especially ‘other’ undergraduates (i.e. non-degree undergraduates). There were, however, significant increases in the number of full-time under- and postgraduates. As these are the largest groups of learners, this has offset the fall in the number of FTE (full-time) equivalent) students. The numbers on full-time other undergraduate courses fell by 45%.
Table 3: Profile of HE participation in England 2012/13-2016/17 by mode of study 2012/13 2013/14 2014/15 2015/16 2016/17 % change
12/13-16/17 Full-time postgraduate
244,055 250,555 251,680 252,105 266,510 9%
Full-time undergraduate
1,075,860 1,095,175 1,099,325 1,143,385 1,180,640 10%
Full-time other undergraduate
64,415 47,745 40,970 36,245 35,730 -45%
Full-time total 1,384,330 1,393,475 1,391,975 1,431,735 1,482,880 7% Part-time postgraduate
199,975 194,010 190,905 188,280 190,960 -5%
Part-time undergraduate
182,720 166,945 152,050 143,255 135,100 -26%
Part-time other undergraduate
148,825 120,595 109,165 98,075 83,040 -44%
Part-time total 531,520 481,550 452,120 429,610 409,100 -23% All students 1,915,850 1,875,025 1,844,095 1,861,345 1,891,980 -1%
Source: HESA (2018), Who's studying in HE?

19
As has been discussed, these overall numbers hide fundamental and significant changes in the type, level and mode of study, and with further reforms on the horizon and current reforms settling in, further changes are likely.
20
2. Methodology The approach used in this study was a rapid evidence assessment (REA). This is a structured and rigorous search of published evidence, though it is not as extensive or formalised as a systematic review. The REA was primarily based on a focused review of relevant academic, peer-reviewed journal articles and a review of relevant ‘grey’ literature published on websites of relevant national and international organisations.
2.1. Focused Literature Review of Academic Articles
2.1.1. Search Summary
The focus literature search was undertaken across the following databases: EBSCOhost, Emerald, ProQuest and Web of Science. The search process was in iterative exploratory process the main components of which were:
• The primary search terms were choice OR decision with secondary search terms around education (further, higher, vocational and appren*), and using search terms for the UK and its composite countries, rather than using geographic limiters for the UK and its constituent parts.
• Combining the above search terms still accumulated a large number 12,000+, however, it was clear that many of these were in the field of health.
• The next step in the process was to use subject area and journal name to target education choice and decision making. This approach excluded all health and medical subject areas and journals, but included those in the fields of behavioural science, economics, education, psychology and sociology.
• A review of publication titles further reduced the total.
• Originally the timeframe for inclusion was the past fifteen years i.e. 2003 to the present day. However, given the abundance of references this was shortened to 2005 onwards. In addition, articles and reports focusing on specific aspects of earlier education policy were omitted e.g. evaluation of Education Action Zones.
As a result of these new searches, 398 titles (or a brief look at the abstract) were reviewed.
Once all duplicates were removed, the total number of abstracts saved for review from all searches (across the four databases) was 184.
2.1.2. Abstract Review Stage
Table 4 shows the number of abstracts that were reviewed against the inclusion criteria and the initial groups they were assigned to.
21
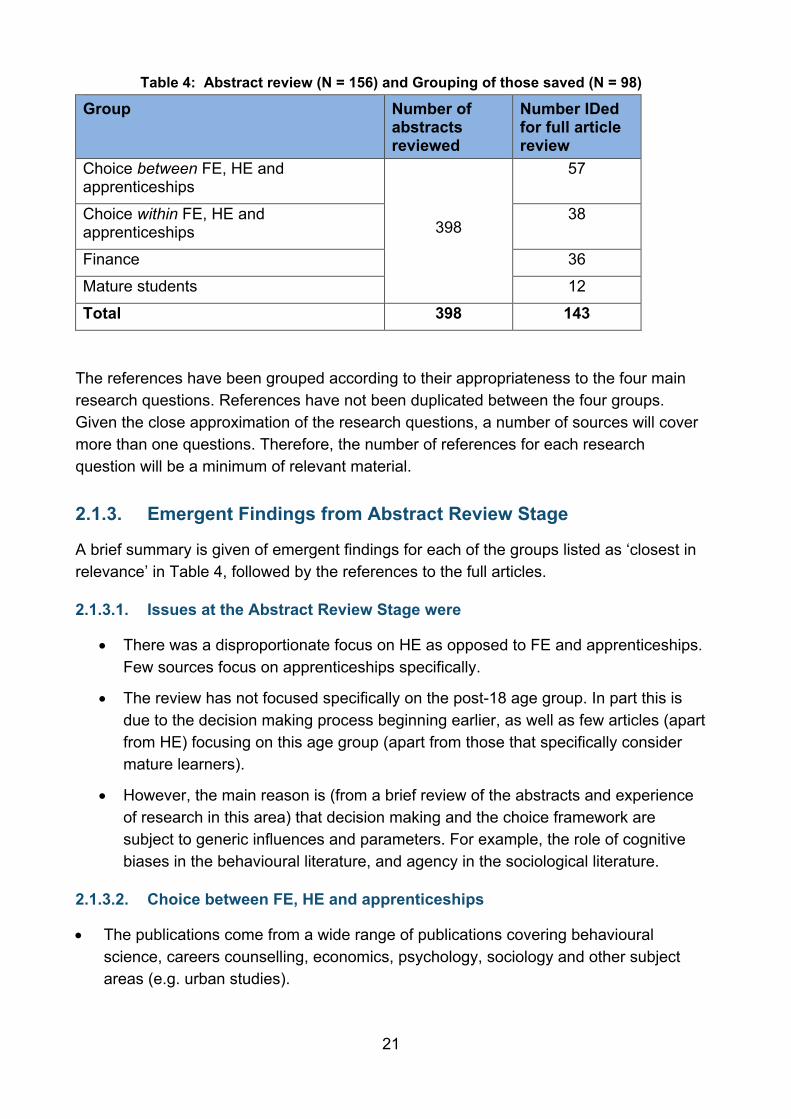
Table 4: Abstract review (N = 156) and Grouping of those saved (N = 98)
Group Number of abstracts reviewed
Number IDed for full article review
Choice between FE, HE and apprenticeships
398
57
Choice within FE, HE and apprenticeships
38
Finance 36 Mature students 12 Total 398 143
The references have been grouped according to their appropriateness to the four main research questions. References have not been duplicated between the four groups. Given the close approximation of the research questions, a number of sources will cover more than one questions. Therefore, the number of references for each research question will be a minimum of relevant material.
2.1.3. Emergent Findings from Abstract Review Stage
A brief summary is given of emergent findings for each of the groups listed as ‘closest in relevance’ in Table 4, followed by the references to the full articles.
2.1.3.1. Issues at the Abstract Review Stage were
• There was a disproportionate focus on HE as opposed to FE and apprenticeships. Few sources focus on apprenticeships specifically.
• The review has not focused specifically on the post-18 age group. In part this is due to the decision making process beginning earlier, as well as few articles (apart from HE) focusing on this age group (apart from those that specifically consider mature learners).
• However, the main reason is (from a brief review of the abstracts and experience of research in this area) that decision making and the choice framework are subject to generic influences and parameters. For example, the role of cognitive biases in the behavioural literature, and agency in the sociological literature.
2.1.3.2. Choice between FE, HE and apprenticeships
• The publications come from a wide range of publications covering behavioural science, careers counselling, economics, psychology, sociology and other subject areas (e.g. urban studies).
22
• As mentioned above, many sources focus on the 14-19 age range and the determinants of choice and the decision making process of young people.
2.1.3.3. Choice within FE, HE and apprenticeships
• Most references relate to choices between different HE institutions.
• A number focus on the gender difference of different occupational (and therefore VET) choices.
• A small number focus on choice of particular subjects (mostly STEM).
2.1.3.4. Finance
• Most references focus on the financial decision, as opposed to the use of information about that decision.
• There are a small number of sources looking at financial choices and decision making in other countries.
2.1.3.5. Mature
• This group has the fewest number of references.
• However, a number of the references in other groups will be relevant here as they relate to the generic underpinnings of decision making and choice e.g. social capital and rational choice.
2.2. Grey Literature Grey literature consists of materials and research produced by organizations outside of the normal commercial or academic publishing and distribution channels. Common grey literature publication types include reports (annual, research, technical, project, etc.), working papers, government documents, white papers and evaluations. They are not peer reviewed.
The grey literature review covered 82 websites identified as relevant (through the researchers’ experience) to the main research questions. This covered the websites of international organisations (such as the ILO and UNESCO), European and UK governmental organisations (e.g. Cedefop and the Department for Education), other governmental organisations (for example, Ofsted), as well as research institutions and third sector organisations (TSOs). A full list of websites visited is contained in Section 9.
Initially, the research and/or publications page (or similar) of relevant sites was reviewed to identify any literature relevant to the study. In addition, a site search was undertaken using the following search terms separately: choice*; decision*; further, higher, vocational and appren*. Finally, a Google search was undertaken using the search terms of the focused review.

23
43 websites generated literature of broad relevance to the study, and a total of 85 documents were identified.
24
3. Choices between Higher Education (HE), Further Education (FE) and Apprenticeships
3.1. Introduction This section focuses on how individuals make choices between the academic, technical and vocational routes after the age of 18 (i.e. Year 13).
Background
Over the past decade the post-16 options of young people have been radically transformed:
• The funding regime for HE (which now includes tuition fees, and no longer includes grant support for low income families) has changed.
• The introduction of the apprenticeship levy has switched apprenticeship funding from the Government to employers.
• There has been an expansion in the number and occupational range of higher level and degree apprenticeships.
• Technical Level Qualifications (T-Levels) are being introduced at Level 3 for 16-18 year olds to provide a high quality technical route as an alternative to A levels.
The new Careers Strategy, based on the Gatsby Foundation’s Benchmarks of Good Career Guidance7 will take time to implement8. The Government is investing over £70m each year until 2020, including funding for the National Careers Service and The Careers & Enterprise Company, but it is uncertain what additional funding will be available beyond this period. Although there are debates around the amount and quality of Government funded IAG, there has grown a myriad of alternative information sources, mostly on the internet.
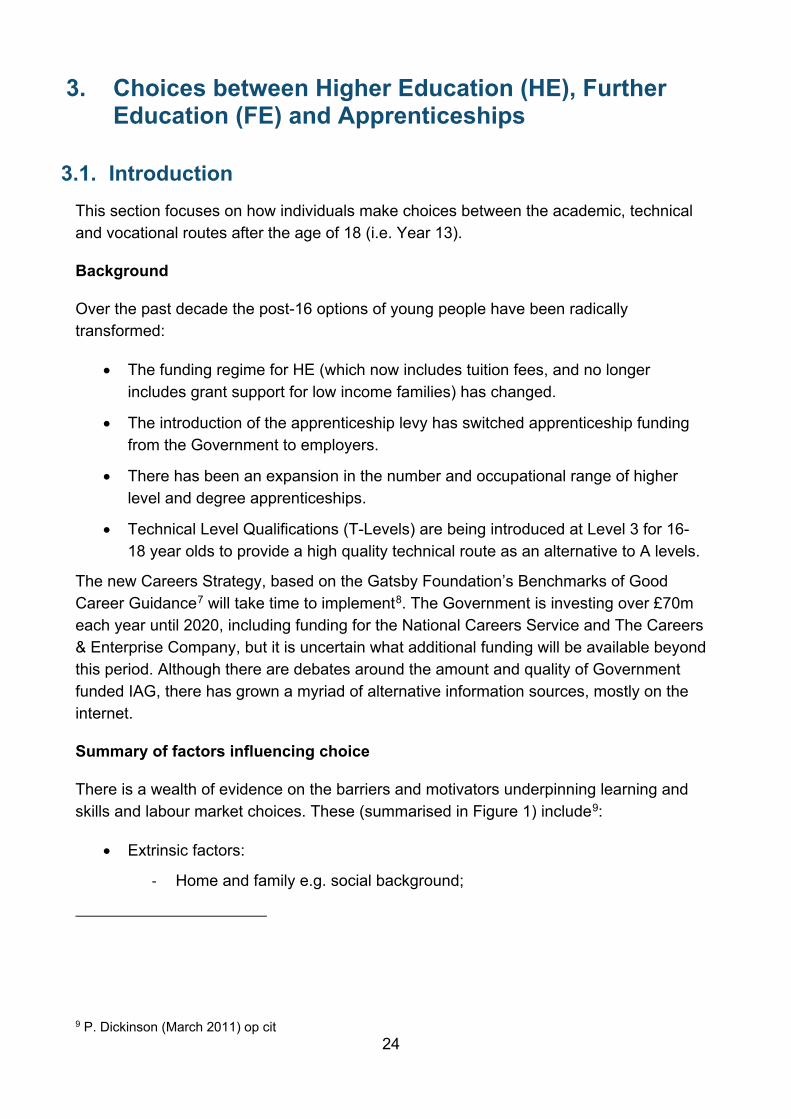
Summary of factors influencing choice
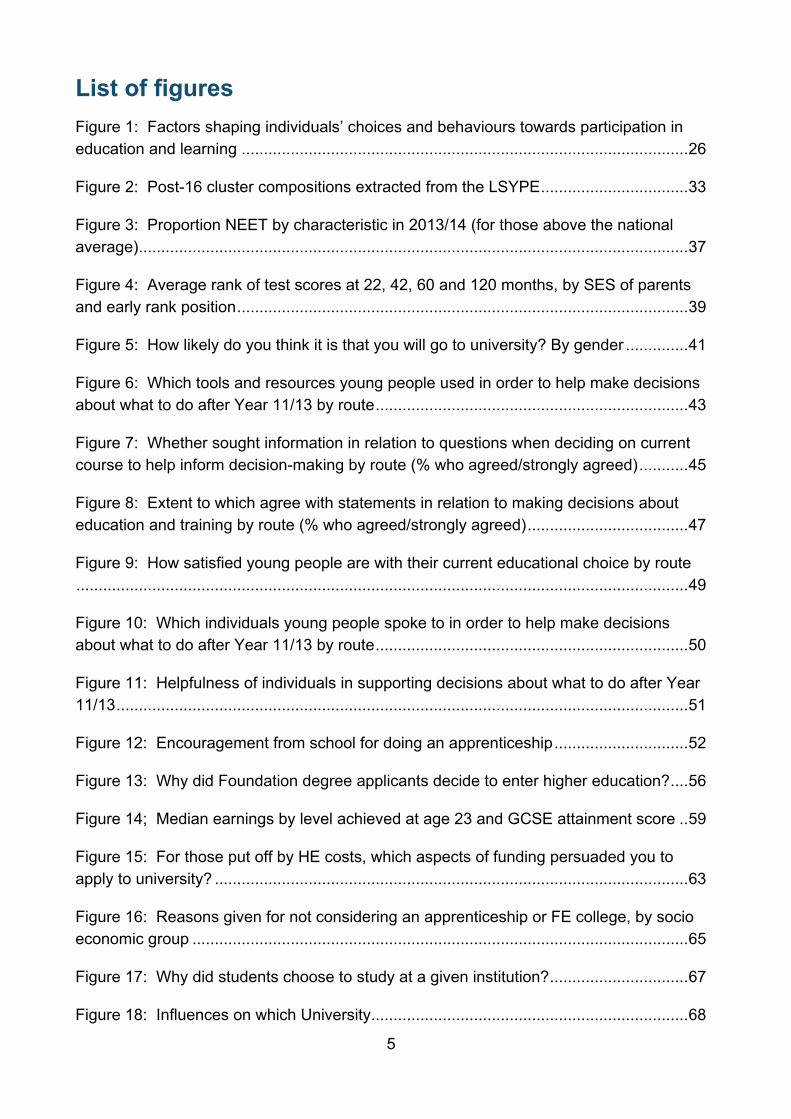
There is a wealth of evidence on the barriers and motivators underpinning learning and skills and labour market choices. These (summarised in Figure 1) include9:
• Extrinsic factors:
- Home and family e.g. social background;
9 P. Dickinson (March 2011) op cit
25
- Learning attainment and provision e.g. quality of schooling, availability of progression pathways;
- IAG e.g. type and quality available;
- Wider social relations e.g. peer group and other social networks;
- Work e.g. size and sector of employer; and,
- Financial e.g. monetary resources available to an individual and their family.
• Intrinsic factors:
- Progression and aspiration e.g. clarity and linearity of progression routes;
- Disposition e.g. levels of motivation and self-esteem; and,
- Attitudes and barriers e.g. attitudes and interest in learning.
As described below, the picture is nuanced. Different drivers and challenges can have different levels of importance depending on what point an individual is in their learning and skills, and labour market pathway.
26
Figure 1: Factors shaping individuals’ choices and behaviours towards participation in education and learning
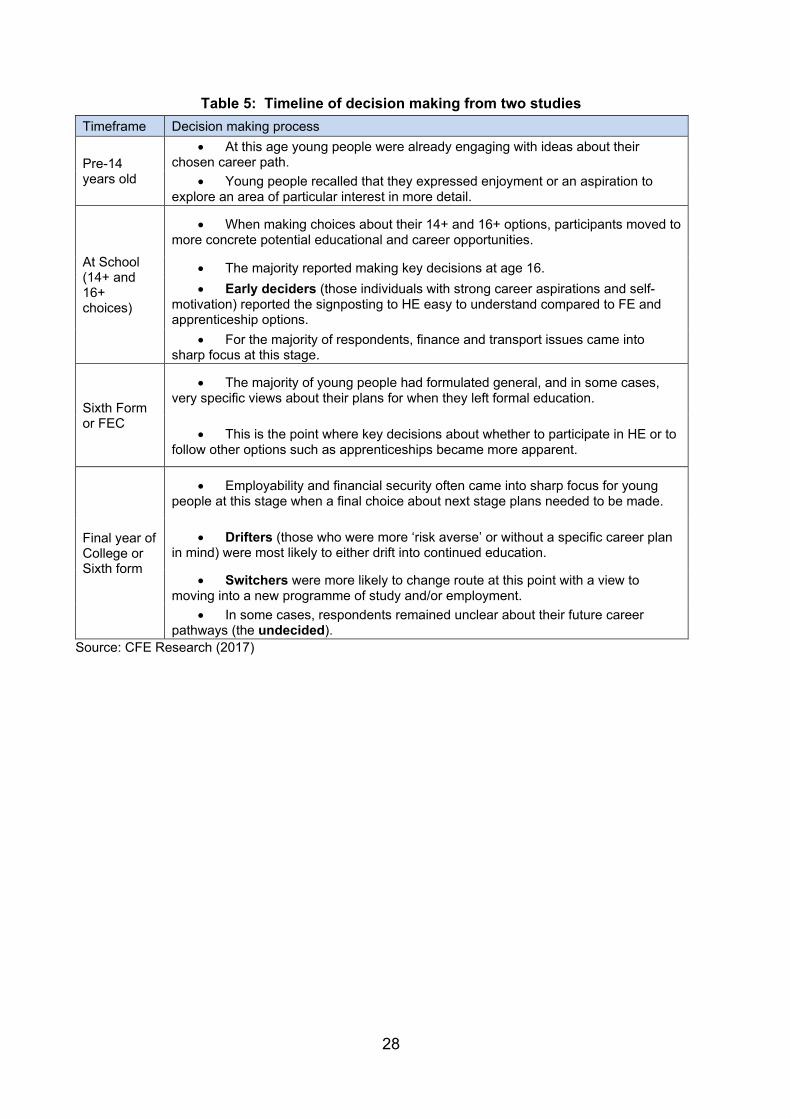
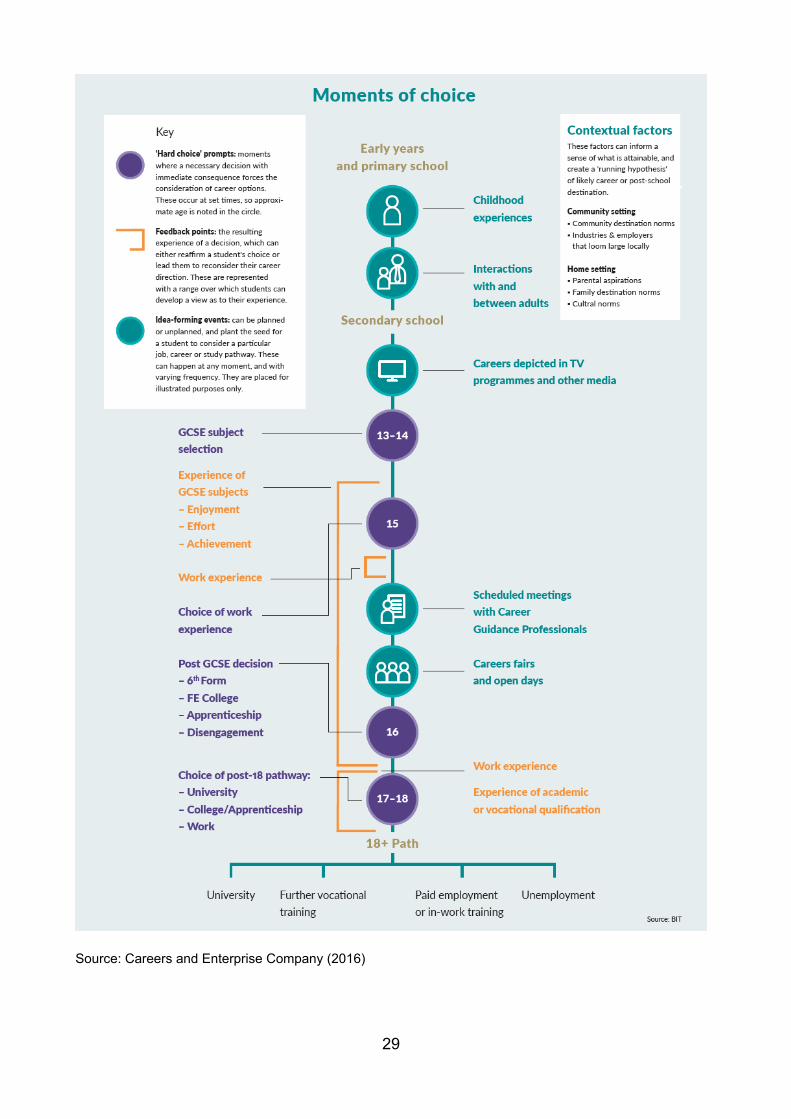
27
3.2. Overview of the decision making pathway of young people Research by CFE Research10 and the Careers and Enterprise Company (Moments of Choice) provide summaries of the decision making process for young people (see Table 5)11 12. The research by CFE Research identifies four groups of young people (though does not indicate the relative sizes of these groups), based on how and when they make their post-18 choices:
• Early deciders, those individuals with strong career aspirations and self-motivation, who often develop their choices (e.g. in relation to a particular career or a desire to go to university) before 16 years old.
• Drifters, those who were more ‘risk averse’ or without a specific career plan in mind, who were most likely to either drift into continued education.
• Switchers, those who were more likely to change route in the final year of college or sixth form with a view to moving into a new programme of study and/or employment.
• Undecided, those who remained unclear about their future pathways.
Young people tend not to amass a large amount of information before they make a broad decision. Almost two thirds of young people (63%) consult two or fewer resources (i.e. information sources) when making a decision about what to do after their Year 11/1313.
They tend to arrive at a decision on a chosen route first (based on an array of factors) and then seek out information about it. For many young people, their choices are developed before 16 years old, and for many these choices are maintained. That choice may be a particular career or a desire simply to go to university, but it appears that for many young people it is a stable trajectory.
10 CFE Research with D. Hughes (December 2017), User insight research into post-16 choices. Department for Education 11 Ibid. 12 Careers and Enterprise Company (2016), Moments of Choice: How education outcomes data can support better informed career decisions 13 CFE Research with D. Hughes (December 2017)
28
Table 5: Timeline of decision making from two studies
Timeframe Decision making process
Pre-14 years old
• At this age young people were already engaging with ideas about their chosen career path.
• Young people recalled that they expressed enjoyment or an aspiration to explore an area of particular interest in more detail.
At School (14+ and 16+ choices)
• When making choices about their 14+ and 16+ options, participants moved to more concrete potential educational and career opportunities.
• The majority reported making key decisions at age 16. • Early deciders (those individuals with strong career aspirations and self-
motivation) reported the signposting to HE easy to understand compared to FE and apprenticeship options.
• For the majority of respondents, finance and transport issues came into sharp focus at this stage.
Sixth Form or FEC
• The majority of young people had formulated general, and in some cases, very specific views about their plans for when they left formal education.
• This is the point where key decisions about whether to participate in HE or to follow other options such as apprenticeships became more apparent.
Final year of College or Sixth form
• Employability and financial security often came into sharp focus for young people at this stage when a final choice about next stage plans needed to be made.
• Drifters (those who were more ‘risk averse’ or without a specific career plan in mind) were most likely to either drift into continued education.
• Switchers were more likely to change route at this point with a view to moving into a new programme of study and/or employment.
• In some cases, respondents remained unclear about their future career pathways (the undecided).
Source: CFE Research (2017)
29
Source: Careers and Enterprise Company (2016)
30
Research by CFE Research14 found that most young people consciously make their post-16 and post-18 choices in Year 9 (when choosing their GCSE options), at Year 11 (the transition point into post-16 education and training), and in their Year 12 (for those in HE).
Young people on academic pathways start to think about their post-18 choices earlier than those on technical routes, and make their final decisions about post-18 routes sooner.
Eight per cent of participants in HE (Academic) reported that they first considered their future education choices in Years 7 or 8, only 2% of HE (Technical) learners did so.
Table 6: When young people first started thinking about what to do after Year 11/13 Year % In primary school 7% In Year 7 or 8 8% When I had to decide on my GCSE options in Year 9 21% During Year 10 16% During Year 11 31% During Year 12* 22% During Year 13* 10% I'm not sure 7%
Base=2,017 (For options with an * the base=620) Source: CFE Research (December 2017)
Young people on academic routes were also clearer about their decision making pathway: only 7% of FE (Academic) learners were unsure when they made their final decision about what to study after Year 11, compared to one fifth (21%) of those on FE (Technical) routes.
For young people making post-18 choices: one third (33%) of those on HE (Academic) routes made their final decision during Year 12 and just under half (47%) made it during Year 13. This compares to 19% and 63% respectively for HE (Technical) learners on higher level apprenticeships.
14 CFE Research with D. Hughes (December 2017), User insight research into post-16 choices. Department for Education
31
Table 7: When young people made the final decision to do the course they are doing now15
Year % In Year 7 or 8 1% When I had to decide on my GCSE options in Year 9 5% During Year 10 6% During Year 11 51% During Year 12* 31% During Year 13* 50% I'm not sure 12%
Base=2,017 (For options with an * the base=620) Source: CFE Research (December 2017)
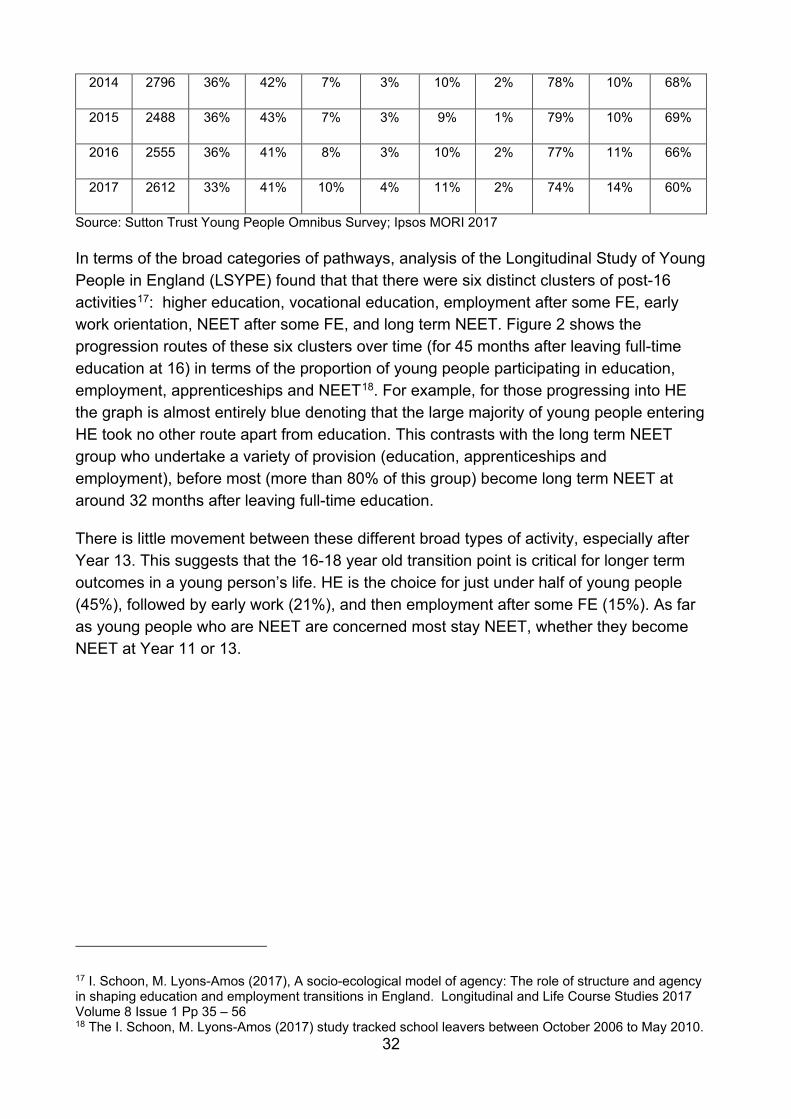
Research undertaken by the Sutton Trust16 found that for many post-18 HE choices were increasingly being made before they were 16. When asked how likely or unlikely they were to go into HE, only one in ten 11-16 year olds (11%) said they were not sure in 2017, compared with 19 per cent responding before the financial crisis in 2008.
Table 8: Likelihood of going to HE when old enough?
15 CFE Research (December 2017) op. cit. 16 Ipsos MORI (2017), Young People Omnibus Survey 2017. Sutton Trust
Year Base: Very likely
Fairly likely
Fairly unlikely
Very unlikely
Not sure
Not stated
Likely Unlikely Net likely
2003 2469 40% 31% 8% 5% 14% 2% 71% 13% 58%
2004 2303 33% 36% 7% 5% 18% * 70% 12% 58%
2005 2709 34% 35% 7% 5% 18% 1% 69% 11% 58%
2006 2334 34% 37% 5% 4% 19% 1% 71% 9% 62%
2007 2417 37% 34% 8% 4% 17% 1% 71% 11% 60%
2008 2387 39% 34% 6% 3% 19% 1% 72% 8% 64%
2009 2447 41% 32% 6% 4% 13% 5% 73% 9% 64%
2010 2700 39% 41% 6% 2% 11% 2% 80% 7% 72%
2011 2739 39% 39% 7% 3% 10% 1% 78% 10% 68%
2012 2757 38% 43% 6% 2% 9% 1% 81% 8% 73%
2013 2595 38% 43% 6% 3% 8% 1% 81% 9% 72%
32
Source: Sutton Trust Young People Omnibus Survey; Ipsos MORI 2017
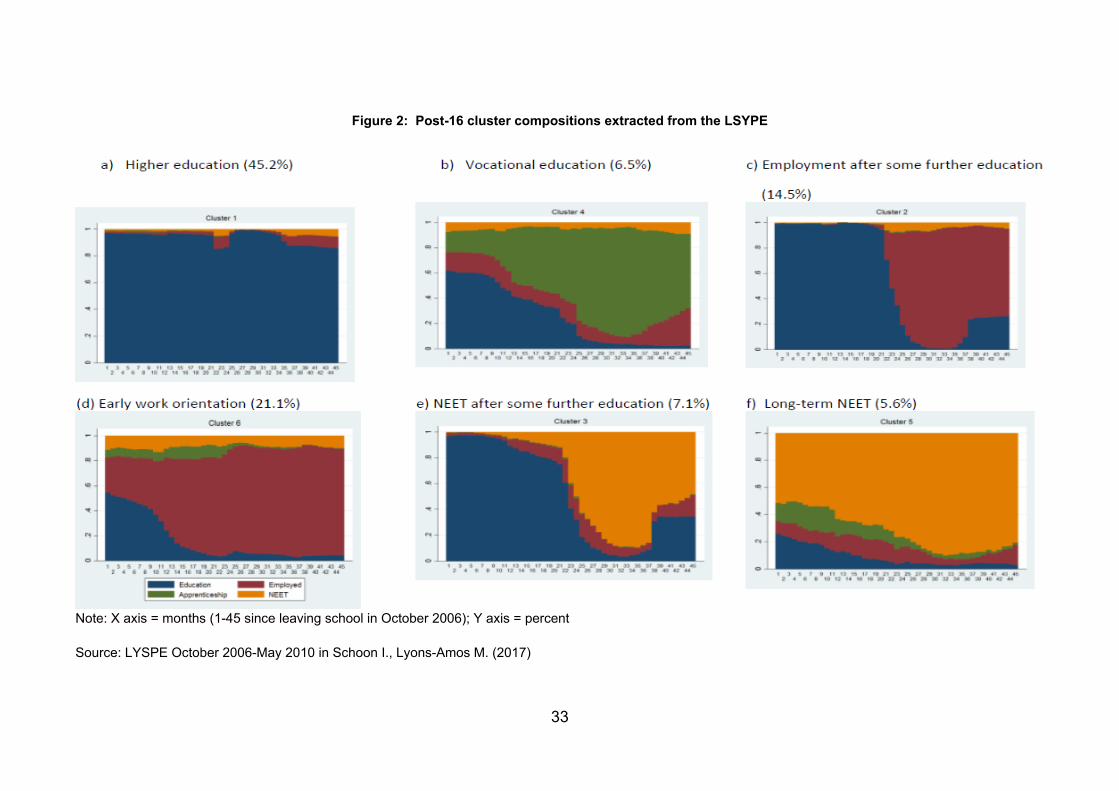
In terms of the broad categories of pathways, analysis of the Longitudinal Study of Young People in England (LSYPE) found that that there were six distinct clusters of post-16 activities17: higher education, vocational education, employment after some FE, early work orientation, NEET after some FE, and long term NEET. Figure 2 shows the progression routes of these six clusters over time (for 45 months after leaving full-time education at 16) in terms of the proportion of young people participating in education, employment, apprenticeships and NEET18. For example, for those progressing into HE the graph is almost entirely blue denoting that the large majority of young people entering HE took no other route apart from education. This contrasts with the long term NEET group who undertake a variety of provision (education, apprenticeships and employment), before most (more than 80% of this group) become long term NEET at around 32 months after leaving full-time education.
There is little movement between these different broad types of activity, especially after Year 13. This suggests that the 16-18 year old transition point is critical for longer term outcomes in a young person’s life. HE is the choice for just under half of young people (45%), followed by early work (21%), and then employment after some FE (15%). As far as young people who are NEET are concerned most stay NEET, whether they become NEET at Year 11 or 13.
17 I. Schoon, M. Lyons-Amos (2017), A socio-ecological model of agency: The role of structure and agency in shaping education and employment transitions in England. Longitudinal and Life Course Studies 2017 Volume 8 Issue 1 Pp 35 – 56 18 The I. Schoon, M. Lyons-Amos (2017) study tracked school leavers between October 2006 to May 2010.
2014 2796 36% 42% 7% 3% 10% 2% 78% 10% 68%
2015 2488 36% 43% 7% 3% 9% 1% 79% 10% 69%
2016 2555 36% 41% 8% 3% 10% 2% 77% 11% 66%
2017 2612 33% 41% 10% 4% 11% 2% 74% 14% 60%
33
Figure 2: Post-16 cluster compositions extracted from the LSYPE
Note: X axis = months (1-45 since leaving school in October 2006); Y axis = percent
Source: LYSPE October 2006-May 2010 in Schoon I., Lyons-Amos M. (2017)
34
3.2.1. Summary
Most young people consciously make their post-18 choices in Year 9 (when choosing their GCSE options), in Year 11 (the transition point into post-16 education and training), and in Year 12 (for those in HE).
Young people tend not to amass a large amount of information before they make a broad decision. They tend decide on a chosen route first (based on an array of factors) and then seek out information about it.
Young people on academic pathways start to think about their post-18 choices earlier than those on technical routes, and make their final decisions sooner. While 8 per cent of those on a HE (Academic) pathway first considered their future education choices in Years 7 or 8, only 2% of HE (Technical) learners did so. One third (33%) of those on HE (Academic) routes made their final decision about their post-18 route during Year 12 and just under half (47%) made it during Year 13. This compares to 19% and 63% respectively for HE (Technical) learners on higher level apprenticeships.
Evidence from the Longitudinal Study of Young People in England suggests that there is little movement between different broad types of post-18 pathway (e.g. higher education, technical education or employment), especially after Year 13. This suggests that the 16-18 year old transition point is critical for longer term outcomes in a young person’s life.
3.3. Demographic factors impaction on choices between Higher Education (HE), Further Education (FE) and Apprenticeships
3.3.1. Socioeconomic group
A key feature of the analysis of many studies is that the choice architecture, information, advice and guidance (IAG), and spread of options is much more restricted for those from lower SEGs19.
Table 9 shows a variety of learner characteristics by route, many of which are closely related to SEG. For example, those in receipt of Free School Meals (FSM) or a 16-19 Bursary are much more likely to be on the Technical FE/HE route, as are those whose parents did not go to university, and if their parent did an apprenticeship.
19 There are similar arguments made for other disadvantaged groups (e.g. ethnicity and disability) but it was agreed that the study would not explore these.
35
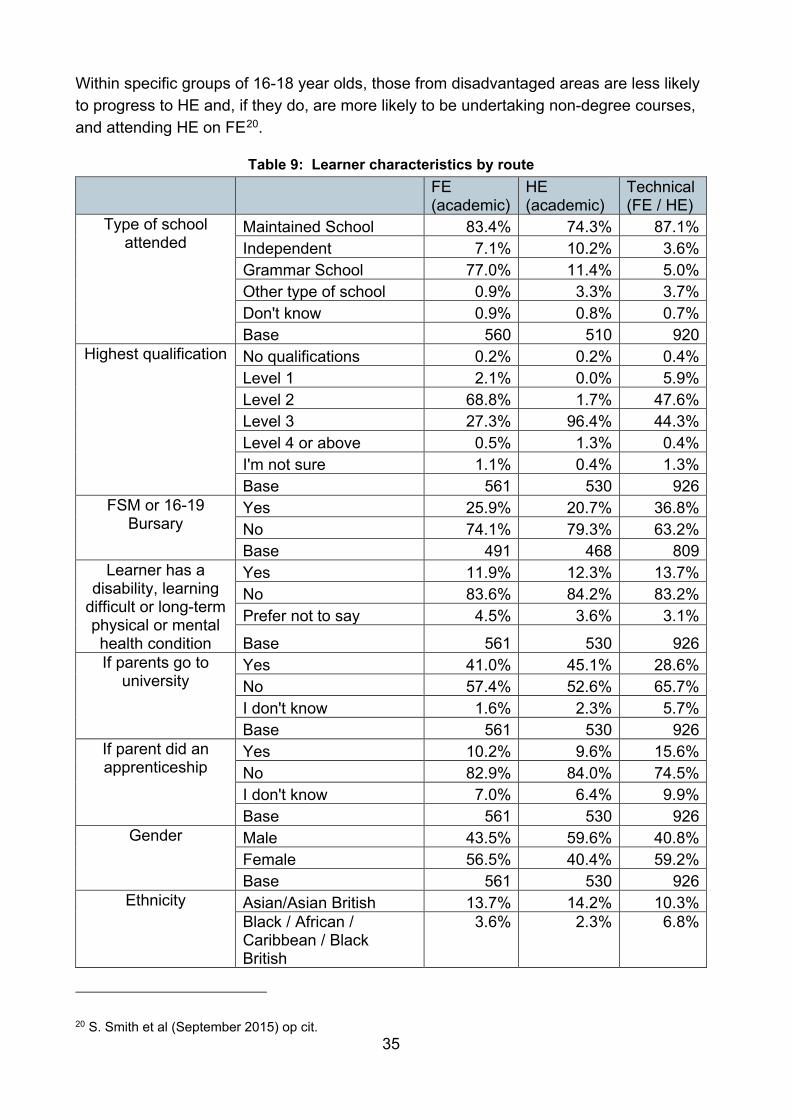
Within specific groups of 16-18 year olds, those from disadvantaged areas are less likely to progress to HE and, if they do, are more likely to be undertaking non-degree courses, and attending HE on FE20.
Table 9: Learner characteristics by route
FE (academic)
HE (academic)
Technical (FE / HE)
Type of school attended
Maintained School 83.4% 74.3% 87.1% Independent 7.1% 10.2% 3.6% Grammar School 77.0% 11.4% 5.0% Other type of school 0.9% 3.3% 3.7% Don't know 0.9% 0.8% 0.7% Base 560 510 920
Highest qualification No qualifications 0.2% 0.2% 0.4% Level 1 2.1% 0.0% 5.9% Level 2 68.8% 1.7% 47.6% Level 3 27.3% 96.4% 44.3% Level 4 or above 0.5% 1.3% 0.4% I'm not sure 1.1% 0.4% 1.3% Base 561 530 926
FSM or 16-19 Bursary
Yes 25.9% 20.7% 36.8% No 74.1% 79.3% 63.2% Base 491 468 809
Learner has a disability, learning
difficult or long-term physical or mental health condition
Yes 11.9% 12.3% 13.7% No 83.6% 84.2% 83.2% Prefer not to say 4.5% 3.6% 3.1%
Base 561 530 926 If parents go to
university Yes 41.0% 45.1% 28.6% No 57.4% 52.6% 65.7% I don't know 1.6% 2.3% 5.7% Base 561 530 926
If parent did an apprenticeship
Yes 10.2% 9.6% 15.6% No 82.9% 84.0% 74.5% I don't know 7.0% 6.4% 9.9% Base 561 530 926
Gender Male 43.5% 59.6% 40.8% Female 56.5% 40.4% 59.2% Base 561 530 926
Ethnicity Asian/Asian British 13.7% 14.2% 10.3% Black / African / Caribbean / Black British
3.6% 2.3% 6.8%
20 S. Smith et al (September 2015) op cit.
36
Mixed / multiple ethnic groups
3.9% 3.4% 3.3%
White 76.5% 77.7% 76.6% Other ethnic group 1.4% 1.3% 1.4% Prefer not to say 0.9% 1.1% 1.6% Base 561 530 926
Source: CFE Research (December 2017)
The role of SEG in learning and skills decision making is complex. In part, SEG is closely related to prior attainment which is the best predictor of future outcomes (see below). Others believe it is due to the influence of parents either through the socialisation process and/or at the point of decision in encouraging or discouraging various options (see below). Whilst others conclude it is the role of agency and social capital which includes or excludes different options, and young people’s perceptions of which options are ‘right’ for them.
Hedges and Speckesser (2017)21 examined whether the educational choices that young people make after the completion of their GCSEs (at age 16) are influenced by their peers. The authors conclude that:
“…higher ability peers reduce the likelihood that an individual will choose a vocational course at age 16 after controlling for the individual’s own ability. We also find a very strong effect of household income on education choices, showing that the more deprived a student’s background is, the more likely they are to opt for a vocational trajectory over an academic one”.
Whilst an individual’s ability (as measured by their KS2 score) is the main driver of educational choice (technical or academic) peers significantly impact on the choice as well. Furthermore, the study found that SEG (as measured by deprivation using the IMD) was a significant predictor of education choice.
One of the problems is that SEG is often used as a catch-all term to encompass a range of factors – deprivation, disadvantage and disaffection – which are often not related to SEG.
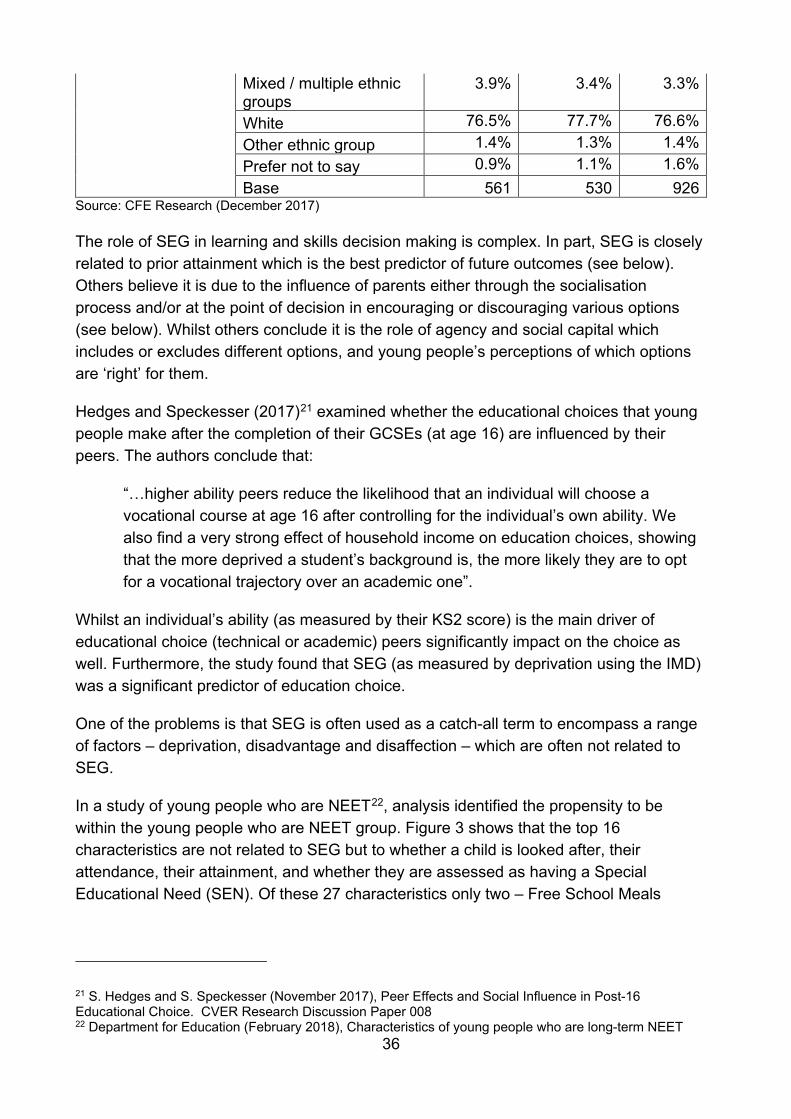
In a study of young people who are NEET22, analysis identified the propensity to be within the young people who are NEET group. Figure 3 shows that the top 16 characteristics are not related to SEG but to whether a child is looked after, their attendance, their attainment, and whether they are assessed as having a Special Educational Need (SEN). Of these 27 characteristics only two – Free School Meals
21 S. Hedges and S. Speckesser (November 2017), Peer Effects and Social Influence in Post-16 Educational Choice. CVER Research Discussion Paper 008 22 Department for Education (February 2018), Characteristics of young people who are long-term NEET
37
(FSM) and living in a deprived area – can be identified as indirect measures of SEG, and the latter is marginally above gender and ethnicity.
Figure 3: Proportion NEET by characteristic in 2013/14 (for those above the national average)
Source: Department for Education (February 2018)
Linked to the literature on socio-economic group, Anders et al. (2017) found that the subjects that young people study from age 14 onwards is determined in part by the demographic intake of their schools and impacts on their future academic and labour market outcomes23. The choice of subject at 14-16 was believed to prime future learning and skills choices. The authors ranked subjects according to their academic selectivity, by calculating the average prior academic attainment of pupils who study for each one. This placed languages and science subjects at the top, and ‘applied’ subjects (e.g. Applied Hospitality) at the bottom. They found that:
23 J. Anders et al (2017), The role of schools in explaining individuals’ subject choices at age 14. Centre for Longitudinal Studies Working paper 2017/9
38
“…young people’s prior attainment, socio-economic background, and gender are all associated with the subjects they study at age 14-16. We find that individuals in schools with more advantaged intakes are more likely to study more academically selective subjects, even after conditioning on individuals’ own socioeconomic status. Individuals’ prior attainment is associated with studying more academically selective subjects as, again, is the prior attainment of the school more generally. Overall, schools explain about a third of the variation in the academic selectivity of the subjects that young people study; once we take into account the demographics of the school this is reduced to closer to a quarter”.
However, Callender and Mason (2017) found that there is now little difference between school type when analysing anticipated HE participation. They found that encouragement from teachers played a significant role in expectations of HE participation. But whilst for pupils in 2002, independent schools had a greater positive effect on participation, any difference had disappeared by 2015.
3.3.2. Prior educational attainment
Attainment at age 16 is generally seen as a key determinant of post-16 outcomes: “Higher attainment during compulsory school age is associated with higher rates of [HE] participation. This is a point strongly made across the literature, and according to some this is the single most important predictor of adult participation in education and training”24. This report highlights analysis of longitudinal data from the NCDS and BHPS longitudinal survey data which found that early school attainment is the best predictor of progression by age 33 and by age 42.
The issue with prior educational attainment as a determinant of outcomes on its own is that it is highly related to SEG. Whitty and Anders present the results of an analysis by Feinstein25.
24 S. Smith (September 2015) 25 G. Whitty and J. Anders (December 2012), (How) did New Labour narrow the achievement and participation gap? LLAKES
39
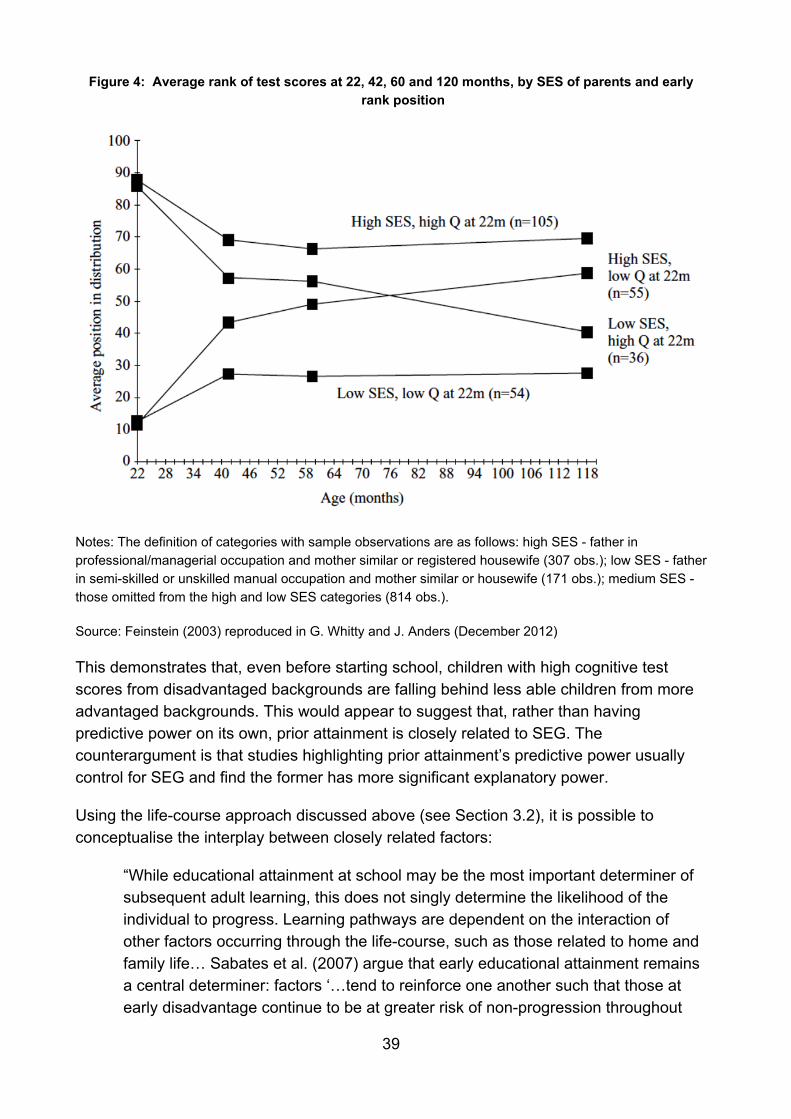
Figure 4: Average rank of test scores at 22, 42, 60 and 120 months, by SES of parents and early rank position
Notes: The definition of categories with sample observations are as follows: high SES - father in professional/managerial occupation and mother similar or registered housewife (307 obs.); low SES - father in semi-skilled or unskilled manual occupation and mother similar or housewife (171 obs.); medium SES - those omitted from the high and low SES categories (814 obs.).
Source: Feinstein (2003) reproduced in G. Whitty and J. Anders (December 2012)
This demonstrates that, even before starting school, children with high cognitive test scores from disadvantaged backgrounds are falling behind less able children from more advantaged backgrounds. This would appear to suggest that, rather than having predictive power on its own, prior attainment is closely related to SEG. The counterargument is that studies highlighting prior attainment’s predictive power usually control for SEG and find the former has more significant explanatory power.
Using the life-course approach discussed above (see Section 3.2), it is possible to conceptualise the interplay between closely related factors:
“While educational attainment at school may be the most important determiner of subsequent adult learning, this does not singly determine the likelihood of the individual to progress. Learning pathways are dependent on the interaction of other factors occurring through the life-course, such as those related to home and family life… Sabates et al. (2007) argue that early educational attainment remains a central determiner: factors ‘…tend to reinforce one another such that those at early disadvantage continue to be at greater risk of non-progression throughout
40
their lives, while those who established positive early trajectories are more likely to maintain involvement in learning. This may be a reflection of the positive effects of underlying personal factors such as ability or enjoyment of learning, or conversely, the negative effects of difficulties in mastering skills, or antipathy to learning’”26.
Sabates et al. (2017) go on to say: “However, that propensity to learn is not fixed. It has been shown for example that learning in adulthood can influence attitudes and well-being and that this in turn can encourage further participation in learning”.
In their study tracking the FE Level 3 population longitudinally, Smith et al. (2015) found that some students do not progress into HE immediately but enter 2-5 years later. Similar progression and attainment rates are achieved by people following different trajectories, implying that the non-traditional routes into HE available to young people from disadvantaged backgrounds can achieve similar outcomes: “Achievement rates of FE and Sixth Form College students who progress to First degrees at university hold up well when compared to all England figures for both school and college entrants (75% compared to 79% for all England). The proportion of FE and Sixth Form College students achieving a good degree (First or 2:1) was 62% compared to all UK qualifiers where the rate is 64%. When put into the context of the relatively high proportion of students coming from disadvantaged backgrounds, these figures illustrate the important role the FE sector has in offering alternative pathways to success and ultimately increased opportunities for social mobility”27.
3.3.3. Gender
A key factor, especially in vocational choices, is gender. However, the decisions between the broad learning and skills options tends to be quite balanced between women and men.
The proportion of young people (16-24) who are NEET has, historically, been higher for women that it is for men. At the beginning of the decade the gap between men and women who are NEET was around three percentage points, but that gap has now disappeared28. However, the reasons vary significantly between women and men.
26 S. Smith (September 2015) quoting Sabates et al (2007), Determinants and Pathways of Progression to Level 2 Qualifications: Evidence from the NCDS and BHPS. Wider Benefits of Learning Research Report No.21. 27 S. Smith (September 2015) 28 Department for Education and National Statistics (August 2017), NEET Statistics Quarterly Brief April to June 2017, England
41
Women tend to be NEET because they are economically inactive29 whilst men are more likely to be unemployed30.
Similarly, whilst apprenticeship rates between men and women are similar, the Standards/Frameworks they choose are very different (see Figure 19). In 2016/17, 54% of apprenticeship starts were by women and 46% by men31.
In HE, the gender split was similar to that of apprenticeships with women accounting for 57% of HE starts. As with apprenticeships, it is less the broad option which differentiates men and women but their specific subject choices32.
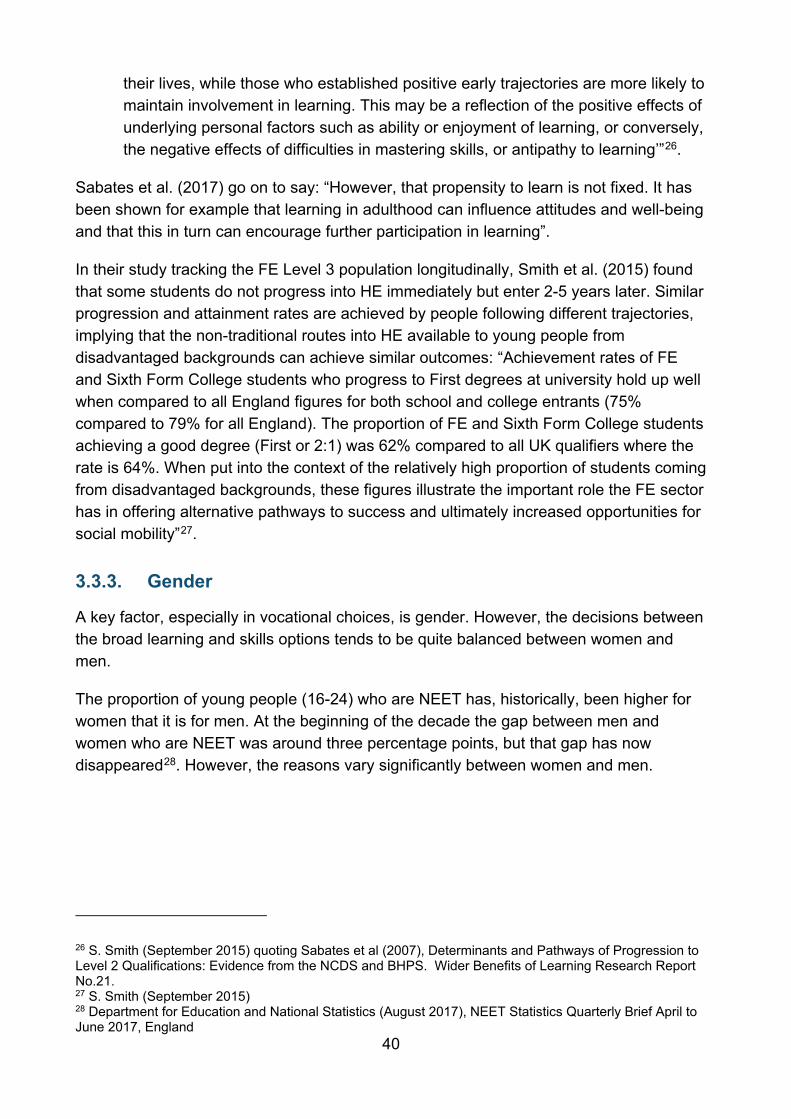
Research by the Centre for Longitudinal Studies found that the HE expectations of girls at age 14 was greater than that of boys33. Figure 5 shows that, on average, girls reported a 71% chance of entering HE, whereas the proportion for boys was 63%. Girls also tended to be more certain that they would be going to university with 14% of girls being 100% certain they would go into HE compared to 10% of boys.
Figure 5: How likely do you think it is that you will go to university? By gender
Source: Centre for Longitudinal Studies (December 2017)
29 According to the ILO definition this group mostly comprises people who are studying, looking after a family and/or long term sick or disabled. 30 According to the ILO, this group comprises people who are without work and are available for, and seeking work. 31 A. Powell (January 2018), Apprenticeship Statistics: England. House of Commons Library Briefing Paper Number 06113 32 Universities UK (July 2017), Patterns And Trends In UK Higher Education 2017 33 Centre for Longitudinal Studies (December 2017), The university and occupational aspirations of UK teenagers: how do they vary by gender? Initial findings from the Millennium Cohort Study Age 14 Survey
42
3.3.4. Summary
• Socio-economic group (SEG): Young people from lower socio-economic groups are less likely to progress to HE. Those in receipt of Free School Meals (FSM) or a 16-19 Bursary are more likely to follow FE or Technical routes, as are those whose parents did not go to university. However, the role of SEG in learning and skills decision making is complex, given that it is closely related to prior attainment, which is the best predictor of future outcomes.
• Prior attainment: Attainment at age 16 is a key determinant of young people’s post-18 pathways, with higher attainment at this age associated with higher rates of post-18 participation in education and training and, specifically, higher rates of participation in HE.
• Gender: Take-up of the broad post-18 options is relatively balanced between women and men, although women are more likely than men to enter education and training. (Women account for 57% of HE starts and 54% of apprenticeship starts.) There are significant differences in the subjects chosen by men and women on both technical and academic post-18 routes. In terms of apprenticeships, women are more likely to choose subjects like Hairdressing, Children’s Care, Learning and Development and Supporting Teaching in Learning and School. Men are more likely to choose subjects such as Construction, Electrotechnical and Vehicle Maintenance and Repair.
3.4. The impact of access to information, advice and guidance on post-18 choices
There are differences in the type and source of information, advice and guidance (IAG) accessed by young people pursuing different post-18 pathways. These differences are explored in this chapter.
3.4.1. Which resources do young people use to choose between HE, FE and apprenticeships
As described above, people tend not to amass a large amount of information before they make a broad decision. They tend to arrive at a decision on a chosen route first (based on an array of factors) and then seek out information about it.
Figure 6 shows the different tools and resources used by young people pursing different routes34. Differences were found in the use of resources by route (i.e. technical, HE or FE academic) and a variety of other learner characteristics. The main differences are due to
34 CFE Research (December 2017) op cit
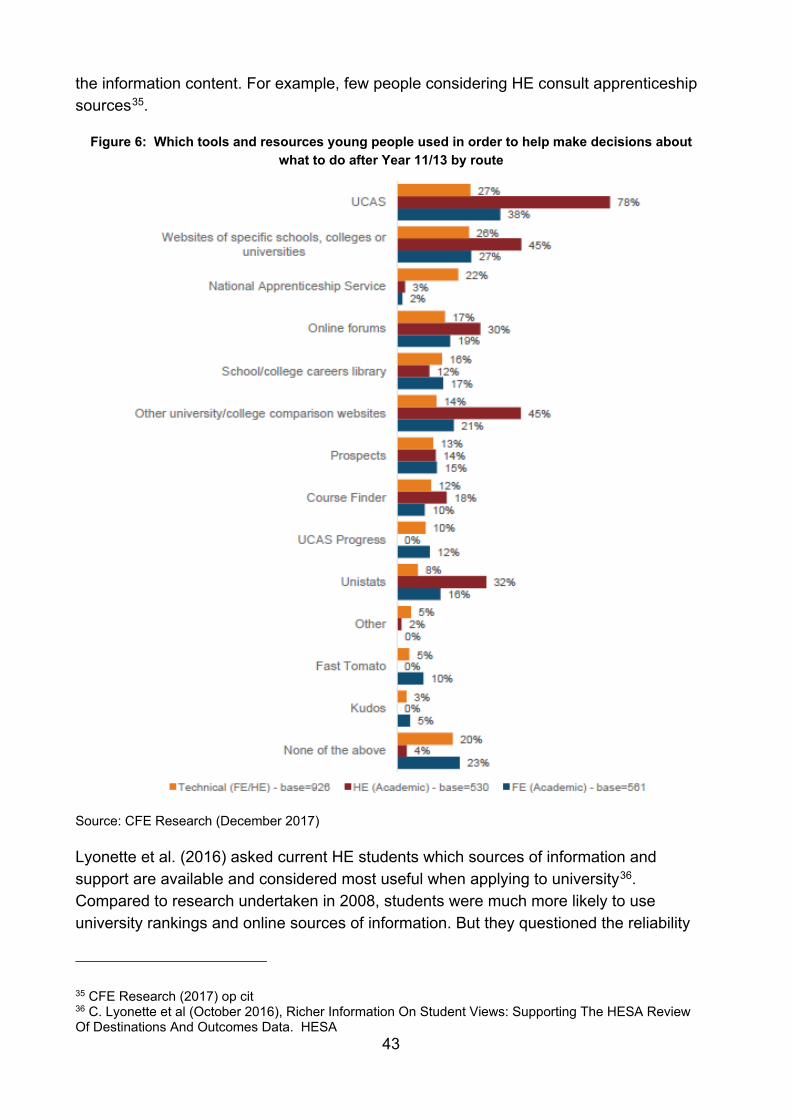
43
the information content. For example, few people considering HE consult apprenticeship sources35.
Figure 6: Which tools and resources young people used in order to help make decisions about what to do after Year 11/13 by route
Source: CFE Research (December 2017)
Lyonette et al. (2016) asked current HE students which sources of information and support are available and considered most useful when applying to university36. Compared to research undertaken in 2008, students were much more likely to use university rankings and online sources of information. But they questioned the reliability
35 CFE Research (2017) op cit 36 C. Lyonette et al (October 2016), Richer Information On Student Views: Supporting The HESA Review Of Destinations And Outcomes Data. HESA
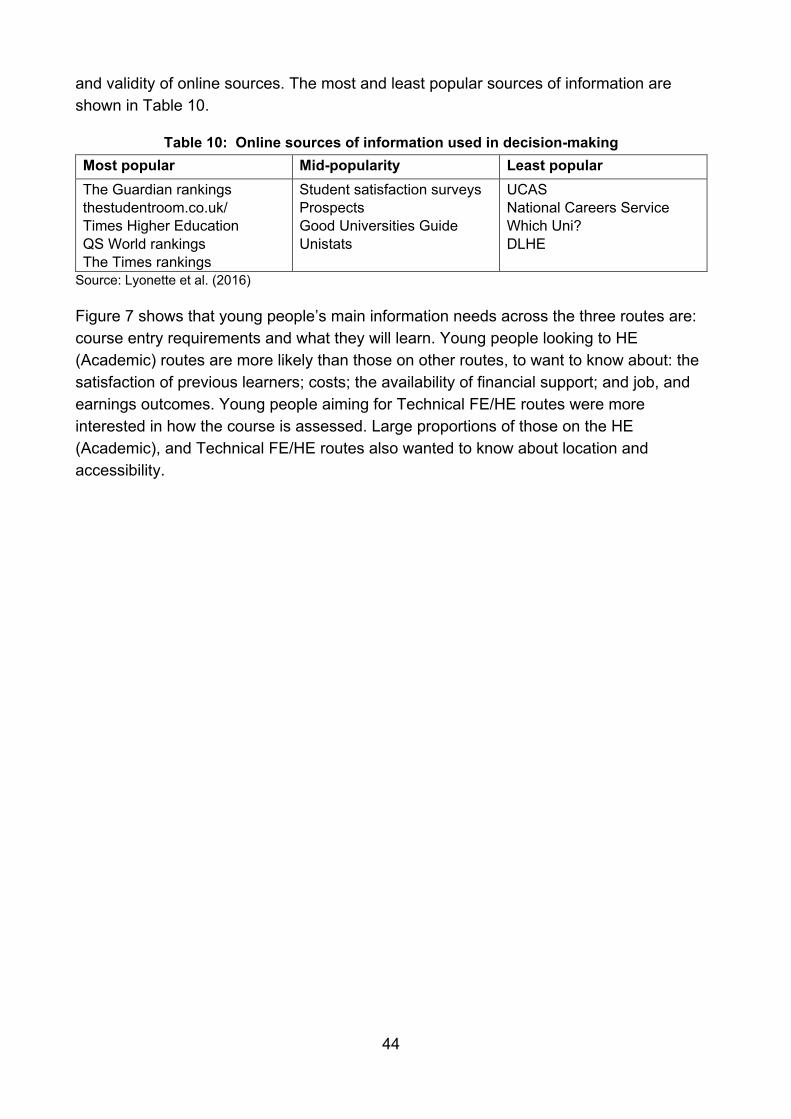
44
and validity of online sources. The most and least popular sources of information are shown in Table 10.
Table 10: Online sources of information used in decision-making Most popular Mid-popularity Least popular The Guardian rankings thestudentroom.co.uk/ Times Higher Education QS World rankings The Times rankings
Student satisfaction surveys Prospects Good Universities Guide Unistats
UCAS National Careers Service Which Uni? DLHE
Source: Lyonette et al. (2016)
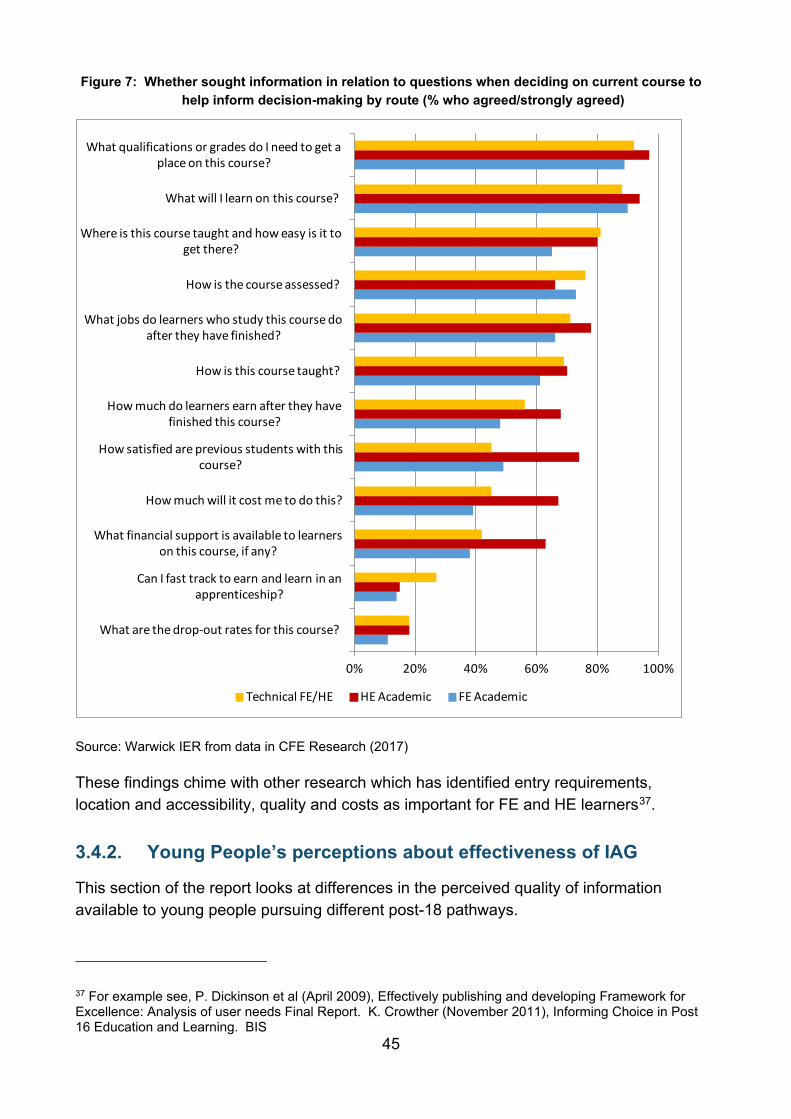
Figure 7 shows that young people’s main information needs across the three routes are: course entry requirements and what they will learn. Young people looking to HE (Academic) routes are more likely than those on other routes, to want to know about: the satisfaction of previous learners; costs; the availability of financial support; and job, and earnings outcomes. Young people aiming for Technical FE/HE routes were more interested in how the course is assessed. Large proportions of those on the HE (Academic), and Technical FE/HE routes also wanted to know about location and accessibility.
45
Figure 7: Whether sought information in relation to questions when deciding on current course to help inform decision-making by route (% who agreed/strongly agreed)
Source: Warwick IER from data in CFE Research (2017)
These findings chime with other research which has identified entry requirements, location and accessibility, quality and costs as important for FE and HE learners37.
3.4.2. Young People’s perceptions about effectiveness of IAG
This section of the report looks at differences in the perceived quality of information available to young people pursuing different post-18 pathways.
37 For example see, P. Dickinson et al (April 2009), Effectively publishing and developing Framework for Excellence: Analysis of user needs Final Report. K. Crowther (November 2011), Informing Choice in Post 16 Education and Learning. BIS
0% 20% 40% 60% 80% 100%
What are the drop-out rates for this course?
Can I fast track to earn and learn in an apprenticeship?
What financial support is available to learners on this course, if any?
How much will it cost me to do this?
How satisfied are previous students with this course?
How much do learners earn after they have finished this course?
How is this course taught?
What jobs do learners who study this course do after they have finished?
How is the course assessed?
Where is this course taught and how easy is it to get there?
What will I learn on this course?
What qualifications or grades do I need to get a place on this course?
Technical FE/HE HE Academic FE Academic
46
The Moments of Choice38 study identifies the following elements as constituting effective IAG:
1. Understanding the cognitive context of the decision so that the design of advice works with the grain of the intuitive system, and supports good reflective decision making.
2. Being trustworthy.
3. Being personal to the individual and meaningful to them.
4. Giving young people agency and being transparent about how their input preferences have led to outputs or advice.
5. Structuring information provision so big decisions are broken down into smaller choice sets.
6. Providing information when needed, rather than overloading young people with information that is not salient, relevant or useful to them at that time.
7. Helping influencers (teachers, parents or carers, Careers Advisors) give meaningful advice to young people, and
8. Signposting actions.
An important quality of IAG is reducing the cognitive burden or overload on young people; when they have so much information, or options to access information, they end up making poor decisions.
As demonstrated in Figure 8, most young people when making a decision would prefer: all of the information in one place; and to speak to someone face-to-face. The largest proportion of young people on Technical FE/HE and FE Academic routes (around three quarters) know what they are going to do after they finish their current course, compared to 38% of those on HE Academic routes. Similarly, those on Technical FE/HE and FE Academic routes are much more likely to say they want to study near to where they live.
38 Careers and Enterprise Company (2016) op cit
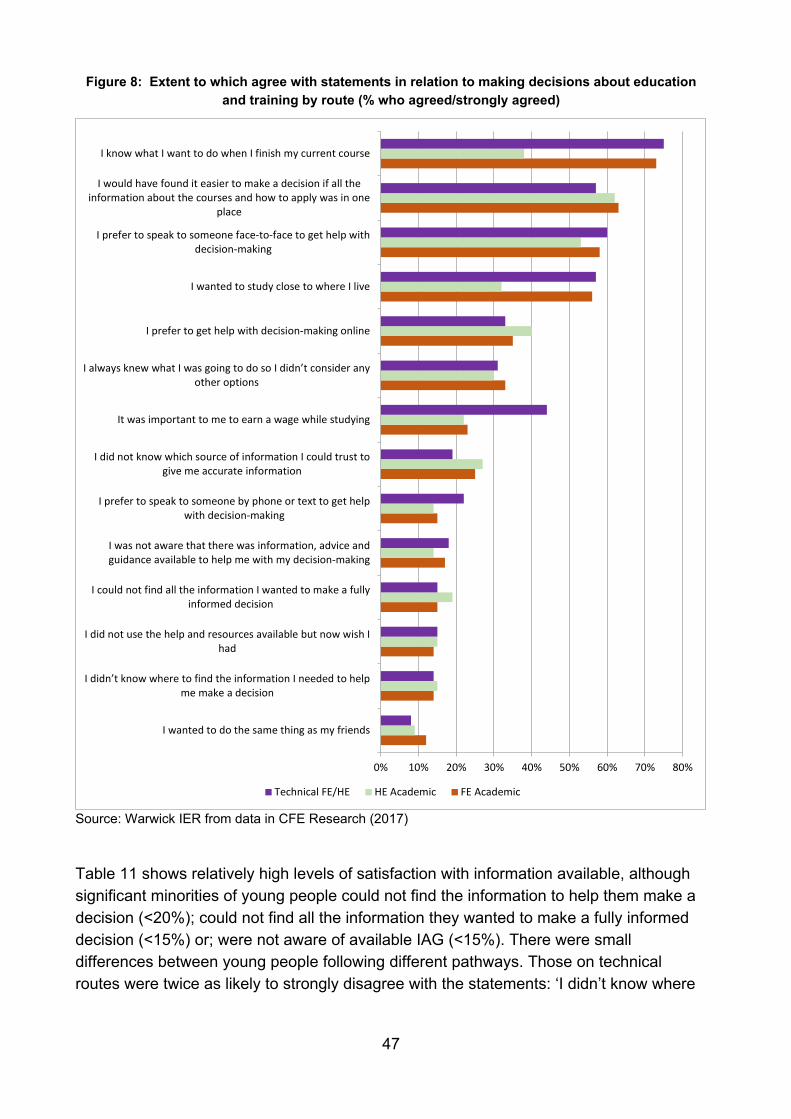
47
Figure 8: Extent to which agree with statements in relation to making decisions about education and training by route (% who agreed/strongly agreed)
Source: Warwick IER from data in CFE Research (2017)
Table 11 shows relatively high levels of satisfaction with information available, although significant minorities of young people could not find the information to help them make a decision (<20%); could not find all the information they wanted to make a fully informed decision (<15%) or; were not aware of available IAG (<15%). There were small differences between young people following different pathways. Those on technical routes were twice as likely to strongly disagree with the statements: ‘I didn’t know where
0% 10% 20% 30% 40% 50% 60% 70% 80%
I wanted to do the same thing as my friends
I didn’t know where to find the information I needed to help me make a decision
I did not use the help and resources available but now wish Ihad
I could not find all the information I wanted to make a fullyinformed decision
I was not aware that there was information, advice andguidance available to help me with my decision-making
I prefer to speak to someone by phone or text to get helpwith decision-making
I did not know which source of information I could trust togive me accurate information
It was important to me to earn a wage while studying
I always knew what I was going to do so I didn’t consider any other options
I prefer to get help with decision-making online
I wanted to study close to where I live
I prefer to speak to someone face-to-face to get help withdecision-making
I would have found it easier to make a decision if all theinformation about the courses and how to apply was in one
place
I know what I want to do when I finish my current course
Technical FE/HE HE Academic FE Academic
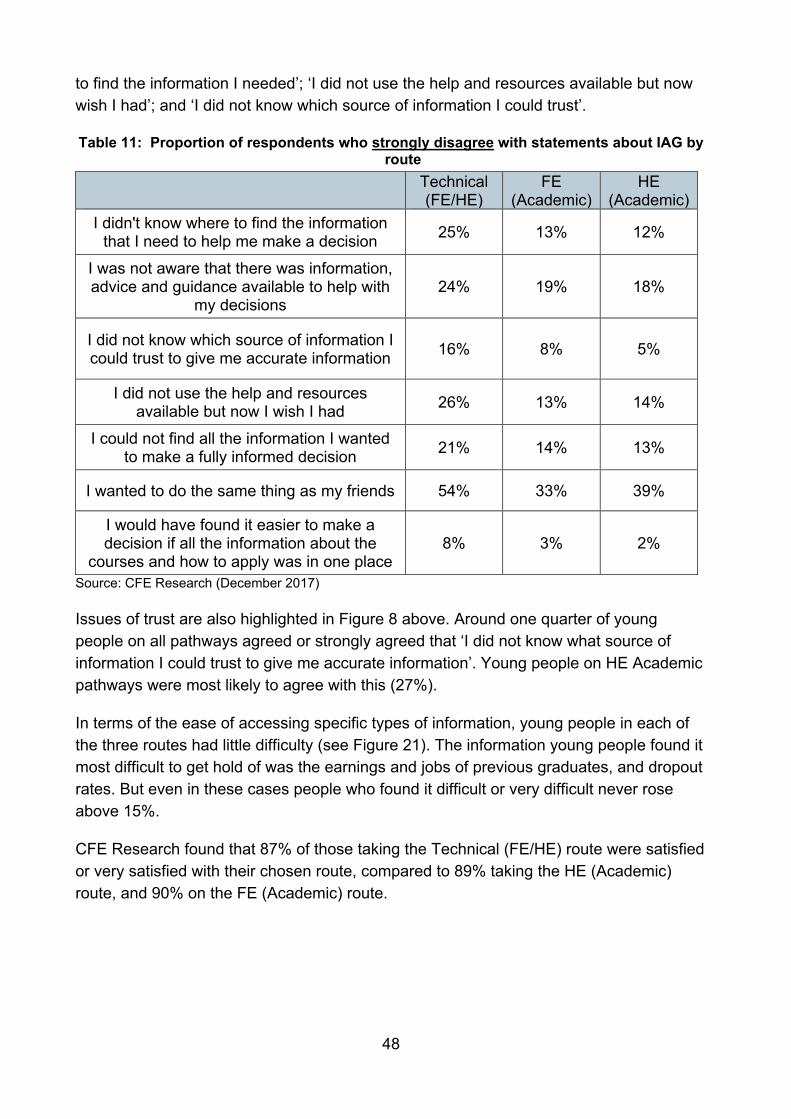
48
to find the information I needed’; ‘I did not use the help and resources available but now wish I had’; and ‘I did not know which source of information I could trust’.
Table 11: Proportion of respondents who strongly disagree with statements about IAG by route
Technical (FE/HE)
FE (Academic)
HE (Academic)
I didn't know where to find the information that I need to help me make a decision 25% 13% 12%
I was not aware that there was information, advice and guidance available to help with
my decisions 24% 19% 18%
I did not know which source of information I could trust to give me accurate information 16% 8% 5%
I did not use the help and resources available but now I wish I had 26% 13% 14%
I could not find all the information I wanted to make a fully informed decision 21% 14% 13%
I wanted to do the same thing as my friends 54% 33% 39%
I would have found it easier to make a decision if all the information about the
courses and how to apply was in one place 8% 3% 2%
Source: CFE Research (December 2017)
Issues of trust are also highlighted in Figure 8 above. Around one quarter of young people on all pathways agreed or strongly agreed that ‘I did not know what source of information I could trust to give me accurate information’. Young people on HE Academic pathways were most likely to agree with this (27%).
In terms of the ease of accessing specific types of information, young people in each of the three routes had little difficulty (see Figure 21). The information young people found it most difficult to get hold of was the earnings and jobs of previous graduates, and dropout rates. But even in these cases people who found it difficult or very difficult never rose above 15%.
CFE Research found that 87% of those taking the Technical (FE/HE) route were satisfied or very satisfied with their chosen route, compared to 89% taking the HE (Academic) route, and 90% on the FE (Academic) route.
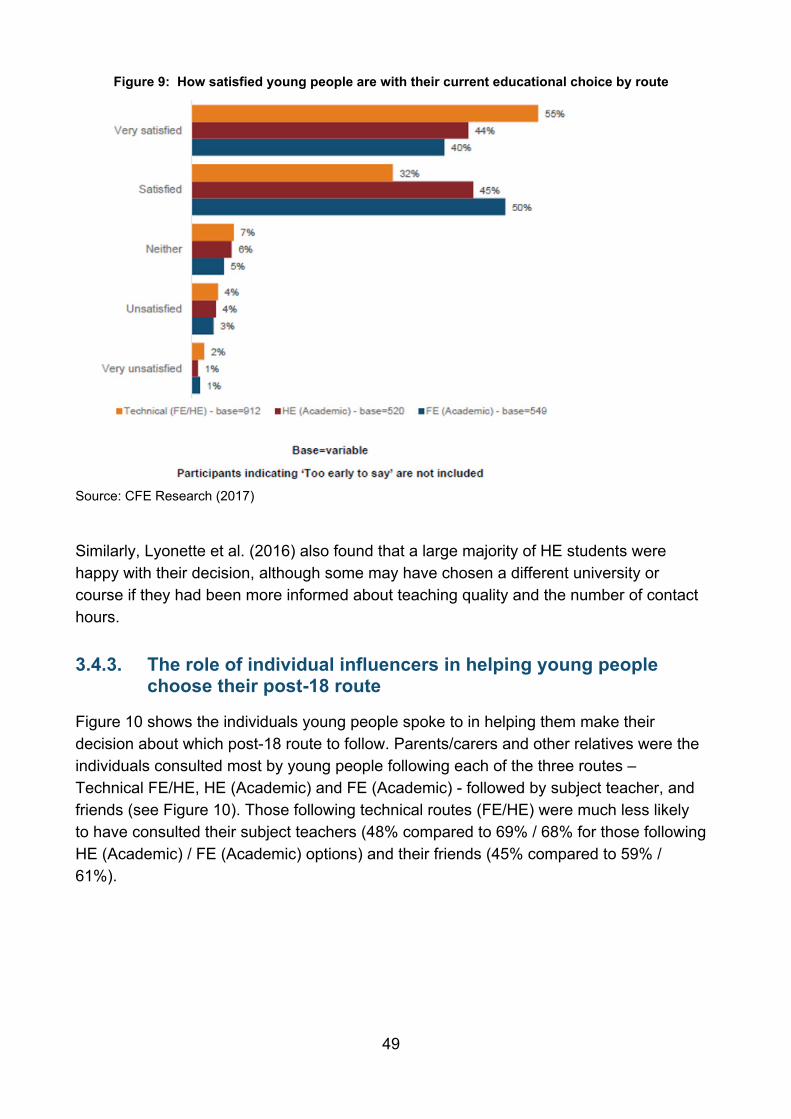
49
Figure 9: How satisfied young people are with their current educational choice by route
Source: CFE Research (2017)
Similarly, Lyonette et al. (2016) also found that a large majority of HE students were happy with their decision, although some may have chosen a different university or course if they had been more informed about teaching quality and the number of contact hours.
3.4.3. The role of individual influencers in helping young people choose their post-18 route
Figure 10 shows the individuals young people spoke to in helping them make their decision about which post-18 route to follow. Parents/carers and other relatives were the individuals consulted most by young people following each of the three routes – Technical FE/HE, HE (Academic) and FE (Academic) - followed by subject teacher, and friends (see Figure 10). Those following technical routes (FE/HE) were much less likely to have consulted their subject teachers (48% compared to 69% / 68% for those following HE (Academic) / FE (Academic) options) and their friends (45% compared to 59% / 61%).
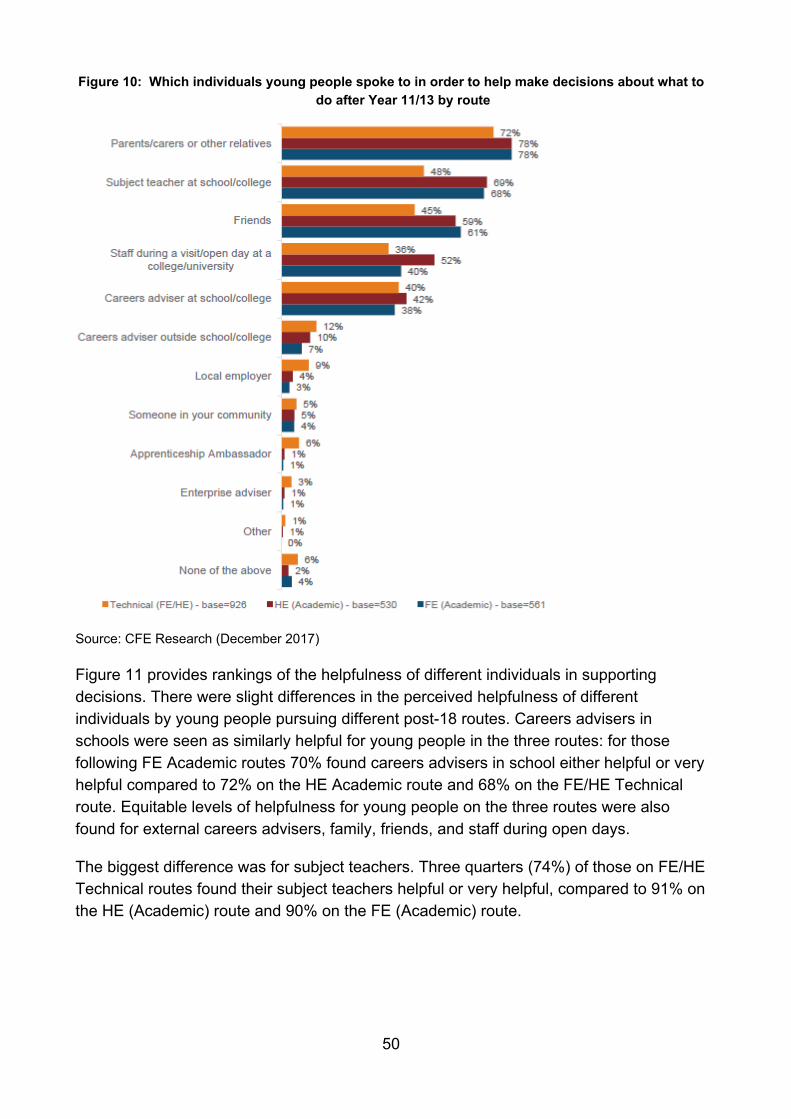
50
Figure 10: Which individuals young people spoke to in order to help make decisions about what to do after Year 11/13 by route
Source: CFE Research (December 2017)
Figure 11 provides rankings of the helpfulness of different individuals in supporting decisions. There were slight differences in the perceived helpfulness of different individuals by young people pursuing different post-18 routes. Careers advisers in schools were seen as similarly helpful for young people in the three routes: for those following FE Academic routes 70% found careers advisers in school either helpful or very helpful compared to 72% on the HE Academic route and 68% on the FE/HE Technical route. Equitable levels of helpfulness for young people on the three routes were also found for external careers advisers, family, friends, and staff during open days.
The biggest difference was for subject teachers. Three quarters (74%) of those on FE/HE Technical routes found their subject teachers helpful or very helpful, compared to 91% on the HE (Academic) route and 90% on the FE (Academic) route.
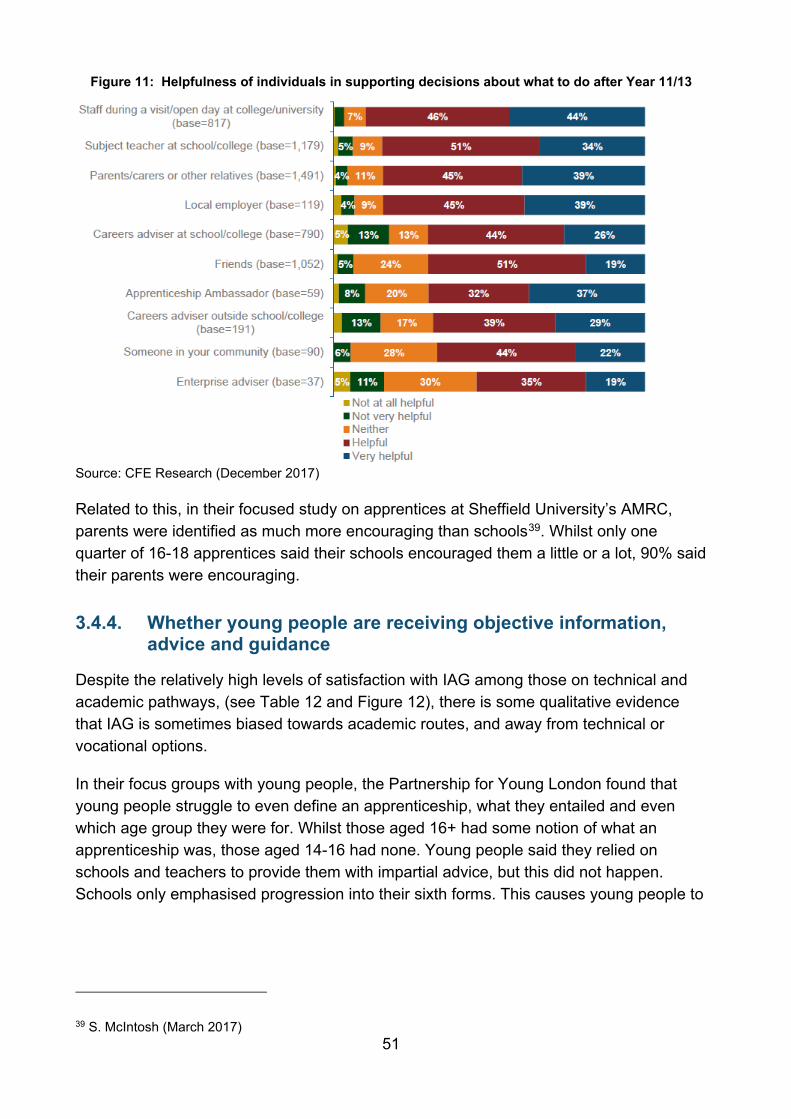
51
Figure 11: Helpfulness of individuals in supporting decisions about what to do after Year 11/13
Source: CFE Research (December 2017)
Related to this, in their focused study on apprentices at Sheffield University’s AMRC, parents were identified as much more encouraging than schools39. Whilst only one quarter of 16-18 apprentices said their schools encouraged them a little or a lot, 90% said their parents were encouraging.
3.4.4. Whether young people are receiving objective information, advice and guidance
Despite the relatively high levels of satisfaction with IAG among those on technical and academic pathways, (see Table 12 and Figure 12), there is some qualitative evidence that IAG is sometimes biased towards academic routes, and away from technical or vocational options.
In their focus groups with young people, the Partnership for Young London found that young people struggle to even define an apprenticeship, what they entailed and even which age group they were for. Whilst those aged 16+ had some notion of what an apprenticeship was, those aged 14-16 had none. Young people said they relied on schools and teachers to provide them with impartial advice, but this did not happen. Schools only emphasised progression into their sixth forms. This causes young people to
39 S. McIntosh (March 2017)
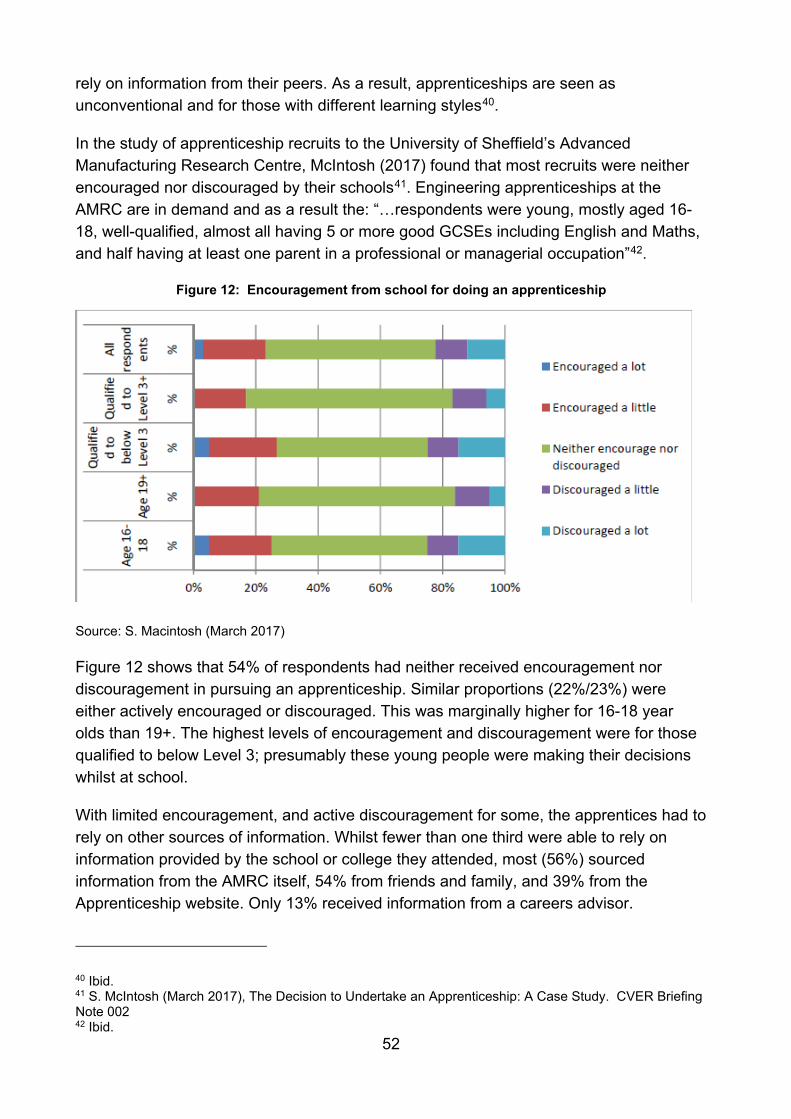
52
rely on information from their peers. As a result, apprenticeships are seen as unconventional and for those with different learning styles40.
In the study of apprenticeship recruits to the University of Sheffield’s Advanced Manufacturing Research Centre, McIntosh (2017) found that most recruits were neither encouraged nor discouraged by their schools41. Engineering apprenticeships at the AMRC are in demand and as a result the: “…respondents were young, mostly aged 16-18, well-qualified, almost all having 5 or more good GCSEs including English and Maths, and half having at least one parent in a professional or managerial occupation”42.
Figure 12: Encouragement from school for doing an apprenticeship
Source: S. Macintosh (March 2017)
Figure 12 shows that 54% of respondents had neither received encouragement nor discouragement in pursuing an apprenticeship. Similar proportions (22%/23%) were either actively encouraged or discouraged. This was marginally higher for 16-18 year olds than 19+. The highest levels of encouragement and discouragement were for those qualified to below Level 3; presumably these young people were making their decisions whilst at school.
With limited encouragement, and active discouragement for some, the apprentices had to rely on other sources of information. Whilst fewer than one third were able to rely on information provided by the school or college they attended, most (56%) sourced information from the AMRC itself, 54% from friends and family, and 39% from the Apprenticeship website. Only 13% received information from a careers advisor.
40 Ibid. 41 S. McIntosh (March 2017), The Decision to Undertake an Apprenticeship: A Case Study. CVER Briefing Note 002 42 Ibid.
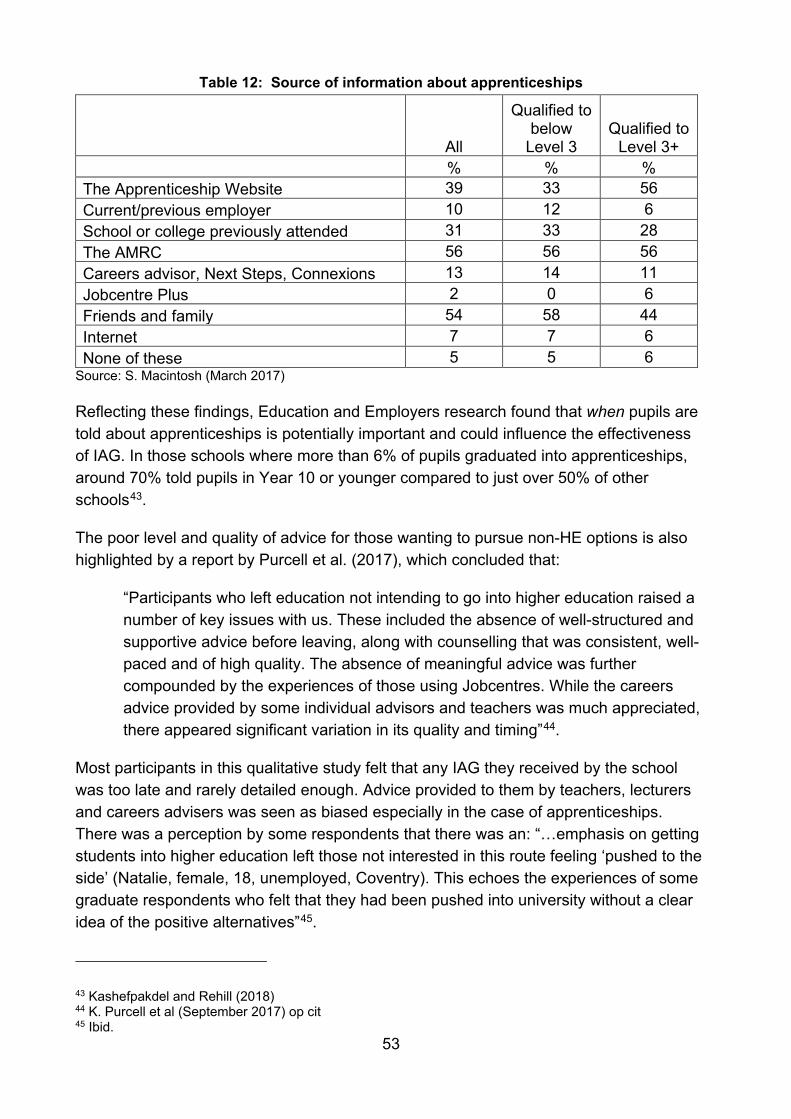
53
Table 12: Source of information about apprenticeships
All
Qualified to below
Level 3 Qualified to
Level 3+ % % %
The Apprenticeship Website 39 33 56 Current/previous employer 10 12 6 School or college previously attended 31 33 28 The AMRC 56 56 56 Careers advisor, Next Steps, Connexions 13 14 11 Jobcentre Plus 2 0 6 Friends and family 54 58 44 Internet 7 7 6 None of these 5 5 6
Source: S. Macintosh (March 2017)
Reflecting these findings, Education and Employers research found that when pupils are told about apprenticeships is potentially important and could influence the effectiveness of IAG. In those schools where more than 6% of pupils graduated into apprenticeships, around 70% told pupils in Year 10 or younger compared to just over 50% of other schools43.
The poor level and quality of advice for those wanting to pursue non-HE options is also highlighted by a report by Purcell et al. (2017), which concluded that:
“Participants who left education not intending to go into higher education raised a number of key issues with us. These included the absence of well-structured and supportive advice before leaving, along with counselling that was consistent, well-paced and of high quality. The absence of meaningful advice was further compounded by the experiences of those using Jobcentres. While the careers advice provided by some individual advisors and teachers was much appreciated, there appeared significant variation in its quality and timing”44.
Most participants in this qualitative study felt that any IAG they received by the school was too late and rarely detailed enough. Advice provided to them by teachers, lecturers and careers advisers was seen as biased especially in the case of apprenticeships. There was a perception by some respondents that there was an: “…emphasis on getting students into higher education left those not interested in this route feeling ‘pushed to the side’ (Natalie, female, 18, unemployed, Coventry). This echoes the experiences of some graduate respondents who felt that they had been pushed into university without a clear idea of the positive alternatives”45.
43 Kashefpakdel and Rehill (2018) 44 K. Purcell et al (September 2017) op cit 45 Ibid.
54
The downgrading of non-HE options is not something unique to the UK. In their comparison of the UK and Denmark, Kersh and Juul (2015) found that: “Although the Danish context differs from the English in several important ways the two countries have in common the problem of lack of parity between the academic and the vocational track. Young people, their parents and society as such tend to attribute more prestige and status to general upper secondary education than to VET”46. The authors found that a key difference between the two systems was a greater esteem in Denmark for apprenticeships from employers.
3.4.5. Summary
Young people pursuing different post-18 pathways have different information needs. Young people are most interested in finding out about course entry requirements and what they will learn on a course, regardless of their post-18 route (Technical HE/FE, HE (Academic) and FE (Academic)). However, young people looking to HE Academic routes are more likely than those on other routes to want to know about: the satisfaction of previous learners; costs; the availability of financial support; and job, and earnings outcomes. Young people aiming for Technical FE/HE routes are more interested in how the course is assessed. Large proportions of those on the HE (Academic), and Technical FE/HE routes also want to know about location and accessibility.
Most young people would like careers information in one place, and want personalised IAG that is relevant to them. Their preference would be to speak to someone face-to-face, by phone or text, and this preference is strongest amongst those on Technical FE/HE routes.
Most young people are broadly satisfied with the IAG available, however, significant minorities have faced issues. These issues include not finding the information to help them make a decision (<20%), not finding all the information they wanted to make a fully informed decision (<15%) and not being aware of available IAG (<15%).
A significant minority of young people are also confused about which sources of information they can trust. 23% of all young people agreed or strongly agreed that ‘I did not know what source of information I could trust to give me accurate information’. Young people on HE Academic pathways were most likely to agree with this (27%).
Parents/carers and other relatives were the individuals consulted most by young people following each of the three routes – Technical FE/HE, HE (Academic) and FE (Academic) – followed by subject teacher, and friends.
46 N. Kersh and I. Juul (2015), Vocational Education and Training as a Career Path for Young People: Making Choices in England and Denmark. LLAKES Research Paper 52
55
Those following technical routes were much less likely to have consulted their subject teachers compared with those following academic routes. 48 percent of those following technical pathways had consulted subject teachers compared to 69% of those following HE (Academic) and 68% following FE (Academic) routes.
Young people following technical routes were also less likely than those following other pathways to find subject teachers helpful or very helpful. Three quarters (74%) of those on FE/HE Technical routes found their subject teachers helpful or very helpful, compared to 91% on the HE (Academic) route and 90% on the FE (Academic) route. Perceptions about the helpfulness of other individuals, including careers advisers, family, friends and staff during open days, were broadly similar among young people following different pathways.
There is some qualitative evidence that IAG is perceived to be biased towards academic routes and away from more technical or vocational options. In particular, studies highlight the often perceived poor quality of information about apprenticeships given to young people by teachers and careers advisers in schools.
There are also potential issues with the timing of IAG in relation to technical routes. When pupils are told about apprenticeships is potentially important and could influence the effectiveness of information received. In those schools where more than 6% of pupils graduated into apprenticeships, 70 per cent told pupils in year 10 or younger compared to just over 50% of other schools.
Despite these issues, most young people are satisfied with their chosen route. 87% of those taking the Technical FE/HE route are satisfied or very satisfied, compared with 89% taking the HE (Academic) route and 90% on the FE (Academic) route.
3.5. The impact of job prospects, future financial returns and lifestyle factors on choice
3.5.1. The impact of job prospects on choice
Higgins et al. (2010) asked students why they decided to enter HE. Figure 13 shows that career and job outcomes were paramount in their decision, as a reason and the main reason. Wanting to study a particular course or subject was the fourth most important reason.
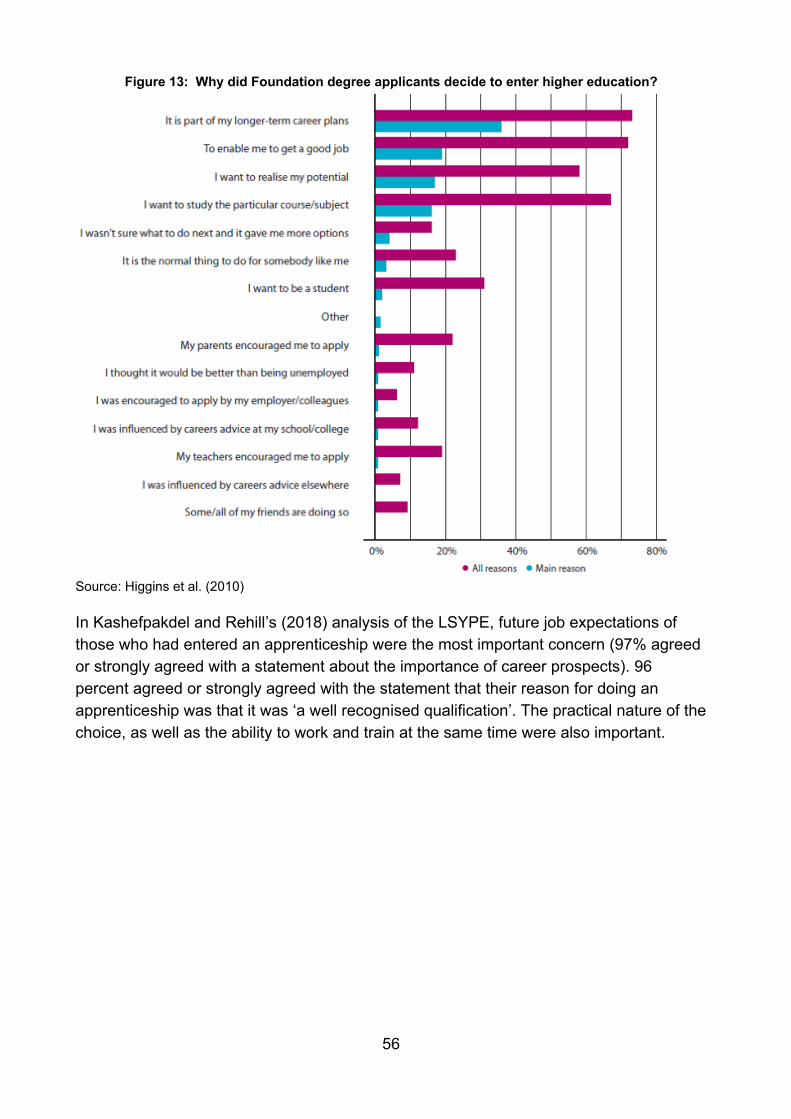
56
Figure 13: Why did Foundation degree applicants decide to enter higher education?
Source: Higgins et al. (2010)
In Kashefpakdel and Rehill’s (2018) analysis of the LSYPE, future job expectations of those who had entered an apprenticeship were the most important concern (97% agreed or strongly agreed with a statement about the importance of career prospects). 96 percent agreed or strongly agreed with the statement that their reason for doing an apprenticeship was that it was ‘a well recognised qualification’. The practical nature of the choice, as well as the ability to work and train at the same time were also important.
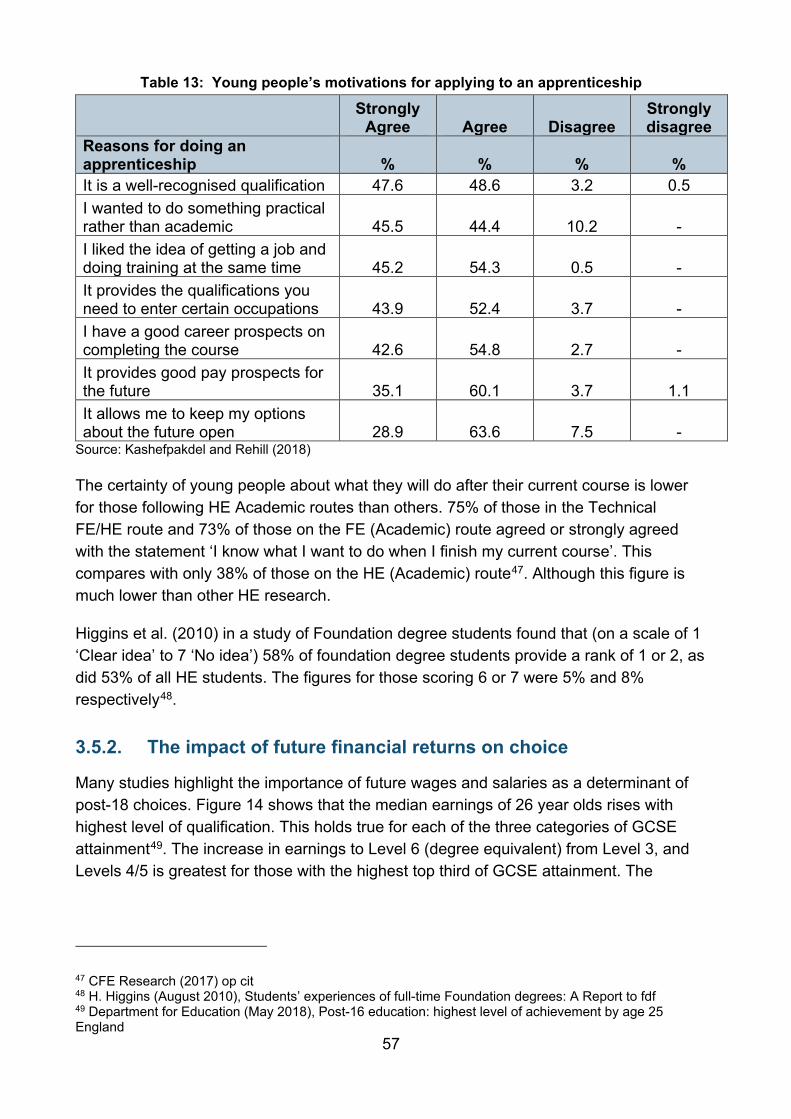
57
Table 13: Young people’s motivations for applying to an apprenticeship
Strongly
Agree Agree Disagree Strongly disagree
Reasons for doing an apprenticeship % % % % It is a well-recognised qualification 47.6 48.6 3.2 0.5 I wanted to do something practical rather than academic 45.5 44.4 10.2 - I liked the idea of getting a job and doing training at the same time 45.2 54.3 0.5 - It provides the qualifications you need to enter certain occupations 43.9 52.4 3.7 - I have a good career prospects on completing the course 42.6 54.8 2.7 - It provides good pay prospects for the future 35.1 60.1 3.7 1.1 It allows me to keep my options about the future open 28.9 63.6 7.5 -
Source: Kashefpakdel and Rehill (2018)
The certainty of young people about what they will do after their current course is lower for those following HE Academic routes than others. 75% of those in the Technical FE/HE route and 73% of those on the FE (Academic) route agreed or strongly agreed with the statement ‘I know what I want to do when I finish my current course’. This compares with only 38% of those on the HE (Academic) route47. Although this figure is much lower than other HE research.
Higgins et al. (2010) in a study of Foundation degree students found that (on a scale of 1 ‘Clear idea’ to 7 ‘No idea’) 58% of foundation degree students provide a rank of 1 or 2, as did 53% of all HE students. The figures for those scoring 6 or 7 were 5% and 8% respectively48.
3.5.2. The impact of future financial returns on choice
Many studies highlight the importance of future wages and salaries as a determinant of post-18 choices. Figure 14 shows that the median earnings of 26 year olds rises with highest level of qualification. This holds true for each of the three categories of GCSE attainment49. The increase in earnings to Level 6 (degree equivalent) from Level 3, and Levels 4/5 is greatest for those with the highest top third of GCSE attainment. The
47 CFE Research (2017) op cit 48 H. Higgins (August 2010), Students’ experiences of full-time Foundation degrees: A Report to fdf 49 Department for Education (May 2018), Post-16 education: highest level of achievement by age 25 England

58
earnings premium for those in the top third GCSE attainment with a Level 6 qualification, is also much higher than those in the middle third of GCSE attainment.
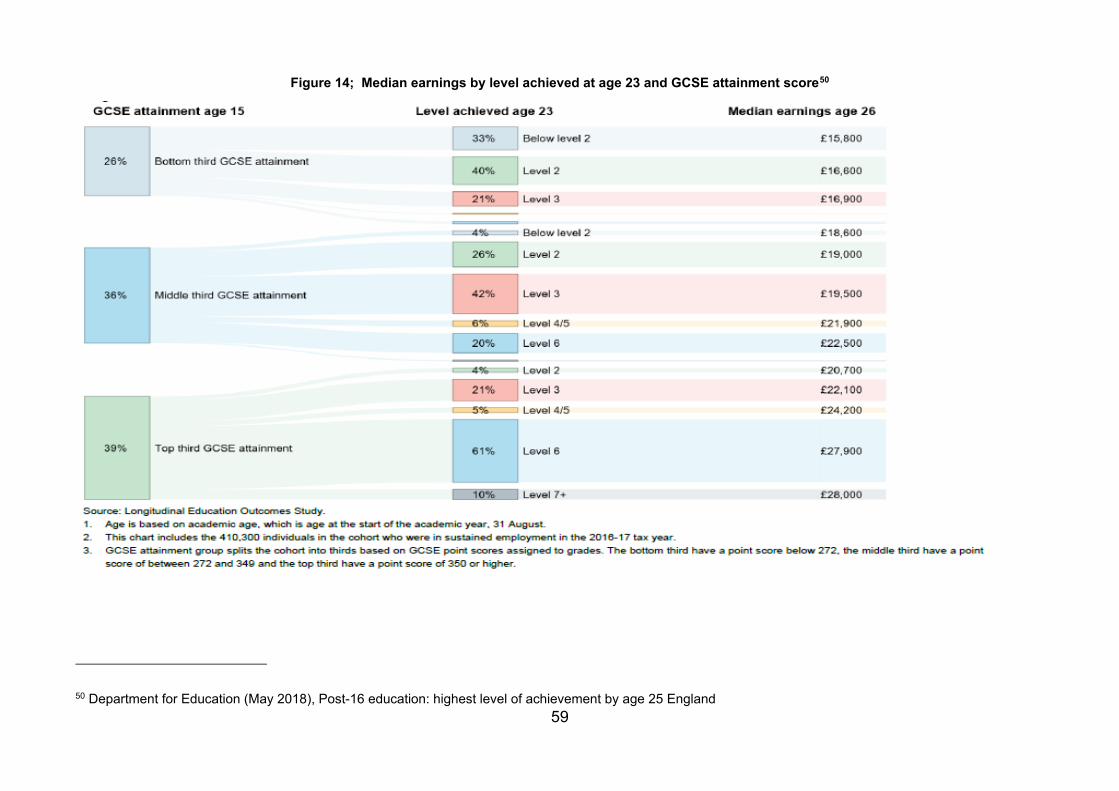
59
Figure 14; Median earnings by level achieved at age 23 and GCSE attainment score50
50 Department for Education (May 2018), Post-16 education: highest level of achievement by age 25 England
Thus as far as earning returns are concerned, it makes sense for people to achieve a higher level of qualification at all attainment levels. But the greatest absolute and relative returns are for those in the highest GCSEs attainment group with a Level 6 qualification. The incentives for other learners of gaining an additional qualification are much less.
Whilst the earnings returns may be lower for other groups of learners and qualifications, for example those doing apprenticeships, all the recent studies in this review have reported earnings premiums. In their analysis of the returns to apprenticeships, Cavaglie et al. (2017) found:
• For men with a Level 2 apprenticeship, taking into account observable factors (such as prior attainment), at age 28 men earn 23% more than those who left school with only GCSEs and roughly 16% more than those who left education with a level 2 vocational qualification. For women, those who start an apprenticeship earn 15% more than those who left school with only GCSEs and about 4% more than those who left education with a level 2 vocational qualification.
• At Level 3, the returns for men are much greater. Men who start an apprenticeship earn about 37% more than those who left education with A-levels (and did not progress any further), and 35% more than those who left education with a level 3 vocational qualification. For women they are not significantly different. Women Level 3 apprentices earn about 9% more than those who left education with A-levels by the time they are age 28. They earn roughly 15% more that those who left education with a level 3 vocational qualification.
Other studies also conclude that there are higher returns for both academic and vocational qualifications, although these vary by level and type of qualification51.
Some post-18 routes (especially HE) involves substantial financial investment. Table 14 and Table 15 shows what factors were most and least important for young people from different SEGs on whether to go to university. For all applicants, those from SEG AB, and from SEG C1-E, wanting to improve their job opportunities/salary prospects was the main influencing factor52. Financial costs of HE – getting a loan, living costs and tuition costs – were amongst the least influential. Although they did rank higher for those in SEG C1-E than those in SEG AB.
51 For example, A. Bhutoria (September 2016), Economic Returns to Education in the United Kingdom: Foresight Report. Government Office for Science 52 S. Fagence and J. Hansom (March 2018), Influence of finance on higher education decision-making: Research report. Department for Education
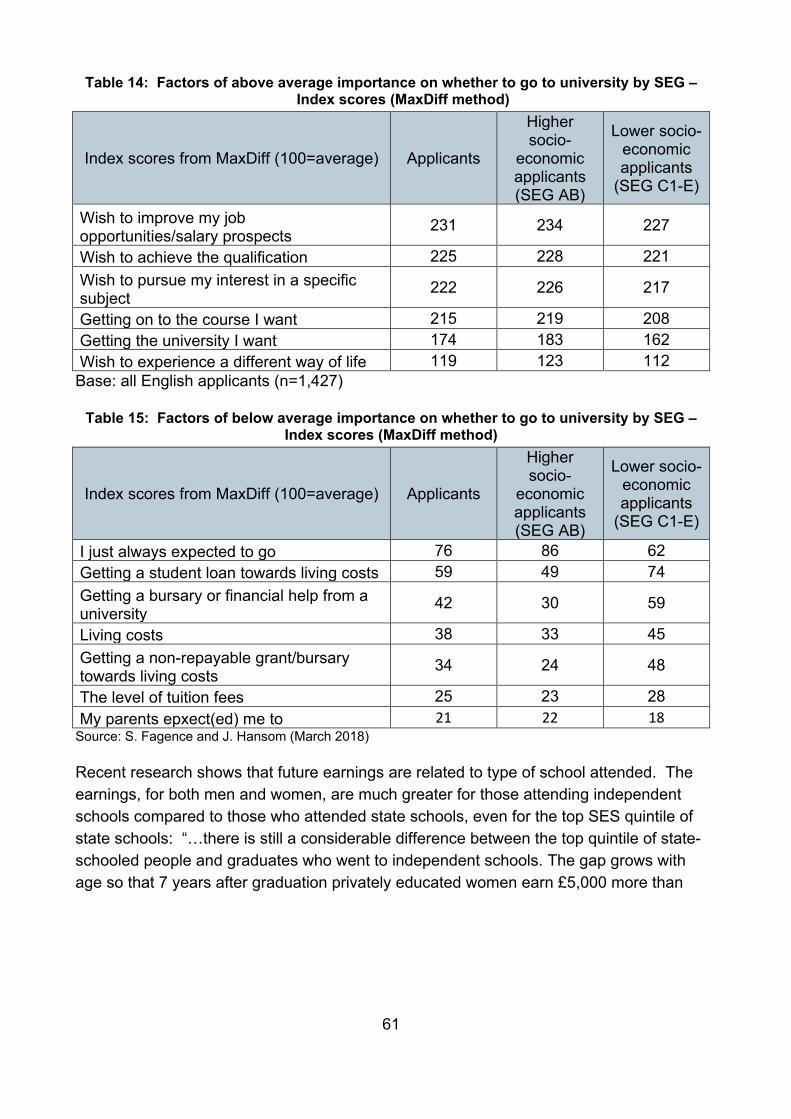
61
Table 14: Factors of above average importance on whether to go to university by SEG – Index scores (MaxDiff method)
Index scores from MaxDiff (100=average) Applicants
Higher socio-
economic applicants (SEG AB)
Lower socio-economic applicants
(SEG C1-E)
Wish to improve my job opportunities/salary prospects
231 234 227
Wish to achieve the qualification 225 228 221 Wish to pursue my interest in a specific subject
222 226 217
Getting on to the course I want 215 219 208 Getting the university I want 174 183 162 Wish to experience a different way of life 119 123 112 Base: all English applicants (n=1,427)
Table 15: Factors of below average importance on whether to go to university by SEG – Index scores (MaxDiff method)
Index scores from MaxDiff (100=average) Applicants
Higher socio-
economic applicants (SEG AB)
Lower socio-economic applicants
(SEG C1-E)
I just always expected to go 76 86 62 Getting a student loan towards living costs 59 49 74 Getting a bursary or financial help from a university
42 30 59
Living costs 38 33 45 Getting a non-repayable grant/bursary towards living costs
34 24 48
The level of tuition fees 25 23 28 My parents epxect(ed) me to 21 22 18
Source: S. Fagence and J. Hansom (March 2018)
Recent research shows that future earnings are related to type of school attended. The earnings, for both men and women, are much greater for those attending independent schools compared to those who attended state schools, even for the top SES quintile of state schools: “…there is still a considerable difference between the top quintile of state-schooled people and graduates who went to independent schools. The gap grows with age so that 7 years after graduation privately educated women earn £5,000 more than
62
the top quintile of state-educated women and privately educated men earn £7,000 more than state-educated men”.53
One reason for the high ranking of financial/status benefits of job and pay, and the much lower ranking of costs is that degrees may now be seen as a must have qualification. In their study of young people living in London (focus groups with 42 young people), Partnership for London found that: “London was largely seen as a city in which getting a degree was a near necessity to working, with opportunity being less for non-graduate roles”54.
This is not to say that finance is an insignificant factor in the equation. Figure 15 shows that for those who were put off by the cost of university but still applied (54% of all applicants) those from lower SEGs were more likely to mention: the repayment threshold (71%), maintenance loans (70%), maintenance grants (63%) and the availability of a bursary from the university (42%). Those from higher SEGs were more likely to mention the ability of their parents to support them financially, and being able to draw on their own earnings or savings.
53 C. Belfield et al (June 2018), The relative labour market returns to different degrees Research report. DfE 54 Partnership for Young London (September 2017), Young people’s perceptions and attitudes of their post-16 options: Full report

63
Figure 15: For those put off by HE costs, which aspects of funding persuaded you to apply to university?
Source: S. Fagence and J. Hansom (March 2018)
Callender and Mason (2017) 55 appear to confirm the findings from the Partnership for London study (see above) in that HE is considered a relatively good investment, and that this understanding had increased over time. In 2015, 74% of students agreed with a statement that “borrowing money to pay for a university education is a good investment” compared with 52% in 2002.
3.5.3. The impact of cost of study on choice
The 2012 increase in tuition fees has led to higher levels of debt aversion, particularly among lower SEGs, but HE participation rates have not been affected.
Callender and Mason (2017) found that students from lower SEGs are more likely to be debt averse, and this debt aversion has increased over time. Between 2002 and 2015: “…debt averse attitudes increased among lower-class prospective students, the gap in
55 C. Callender and G. Mason (2017), Does student loan debt deter Higher Education participation? New evidence from England. LLAKES Research Paper 58
64
attitudes between lower- and upper-class students widened, and fear of debt negatively contributed to lower-class students’ anticipated higher education participation relative to other social classes”56.
However, whilst young people from lower social classes may have felt more reluctant to enter HE, participation figures show that when it came to the decision participation rates increased: “The percentage of 18-year-olds entering higher education aged 18 or 19 from the lowest participation areas of the country (which correlates closely to lower socio-economic status) increased from 21% to 26% between 2011 and 2016” 57.
Quoting the findings from another study, the National Audit Office reported that, as a result of the 2012 rise in tuition fees, we are likely to find that: “Students from disadvantaged backgrounds are less geographically mobile and more likely to live in their family home while studying” 58. However, more recent analysis59 found that it was students from higher socioeconomic groups that were more likely to study closer to home post-2012. Azmat and Simion (2017) also found that the funding changes in 2012: “…had an insignificant negative effect on participation…[and]… do not seem to negatively impact students from lower socio-economic backgrounds more”.
The authors suggest that lack of negative impact is down to the fact that HE attracts no ex ante financial cost on participation, and that many students will never have to pay off the full amount60.
3.5.4. Lifestyle factors
Fagence and Hansom asked HE applicants why they did not choose other alternatives to entering HE. Simply wanting to go to university was the main reason given by four out of five HE applicants in both SEGs.
56 C. Callender and G. Mason (2017) op cit. 57 National Audit Office (December 2017), The higher education market 58 S Gibbons and A Vignoles, ‘Geography, choice and participation in higher education in England’, Regional Science and Urban Economics, vol. 42 issue 1, 2013, pp. 98–113 in Ibid. 59 G. Azmat and S. Simion (October 2017), Higher Education Funding Reforms: A Comprehensive Analysis of Educational and Labour Market Outcomes in England. CEPR Discussion Paper No. DP12389. 60 Ibid.
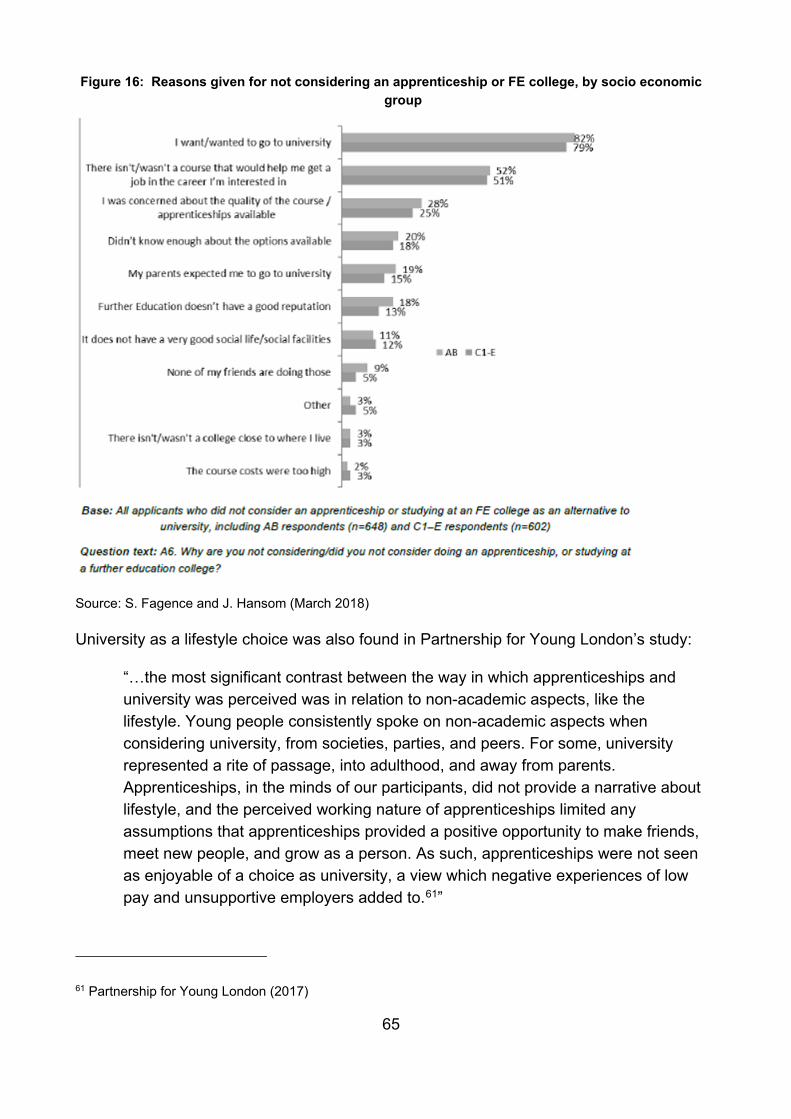
65
Figure 16: Reasons given for not considering an apprenticeship or FE college, by socio economic group
Source: S. Fagence and J. Hansom (March 2018)
University as a lifestyle choice was also found in Partnership for Young London’s study:
“…the most significant contrast between the way in which apprenticeships and university was perceived was in relation to non-academic aspects, like the lifestyle. Young people consistently spoke on non-academic aspects when considering university, from societies, parties, and peers. For some, university represented a rite of passage, into adulthood, and away from parents. Apprenticeships, in the minds of our participants, did not provide a narrative about lifestyle, and the perceived working nature of apprenticeships limited any assumptions that apprenticeships provided a positive opportunity to make friends, meet new people, and grow as a person. As such, apprenticeships were not seen as enjoyable of a choice as university, a view which negative experiences of low pay and unsupportive employers added to.61”
61 Partnership for Young London (2017)
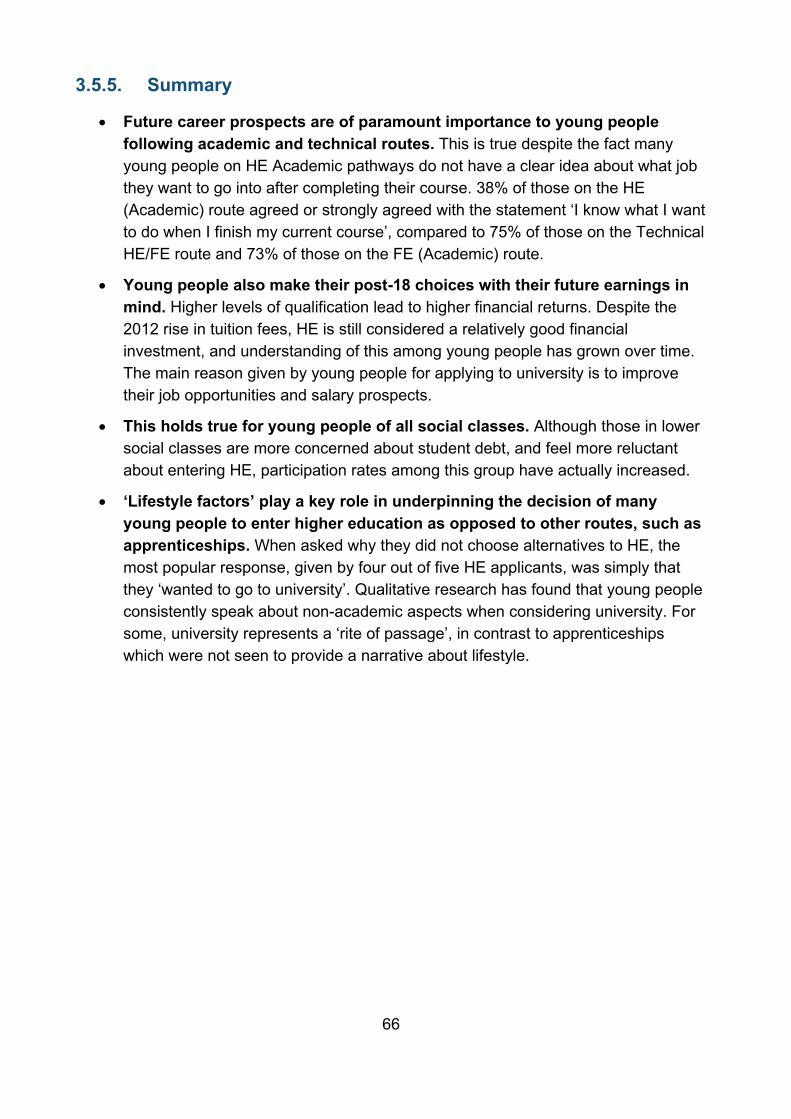
66
3.5.5. Summary
• Future career prospects are of paramount importance to young people following academic and technical routes. This is true despite the fact many young people on HE Academic pathways do not have a clear idea about what job they want to go into after completing their course. 38% of those on the HE (Academic) route agreed or strongly agreed with the statement ‘I know what I want to do when I finish my current course’, compared to 75% of those on the Technical HE/FE route and 73% of those on the FE (Academic) route.
• Young people also make their post-18 choices with their future earnings in mind. Higher levels of qualification lead to higher financial returns. Despite the 2012 rise in tuition fees, HE is still considered a relatively good financial investment, and understanding of this among young people has grown over time. The main reason given by young people for applying to university is to improve their job opportunities and salary prospects.
• This holds true for young people of all social classes. Although those in lower social classes are more concerned about student debt, and feel more reluctant about entering HE, participation rates among this group have actually increased.
• ‘Lifestyle factors’ play a key role in underpinning the decision of many young people to enter higher education as opposed to other routes, such as apprenticeships. When asked why they did not choose alternatives to HE, the most popular response, given by four out of five HE applicants, was simply that they ‘wanted to go to university’. Qualitative research has found that young people consistently speak about non-academic aspects when considering university. For some, university represents a ‘rite of passage’, in contrast to apprenticeships which were not seen to provide a narrative about lifestyle.
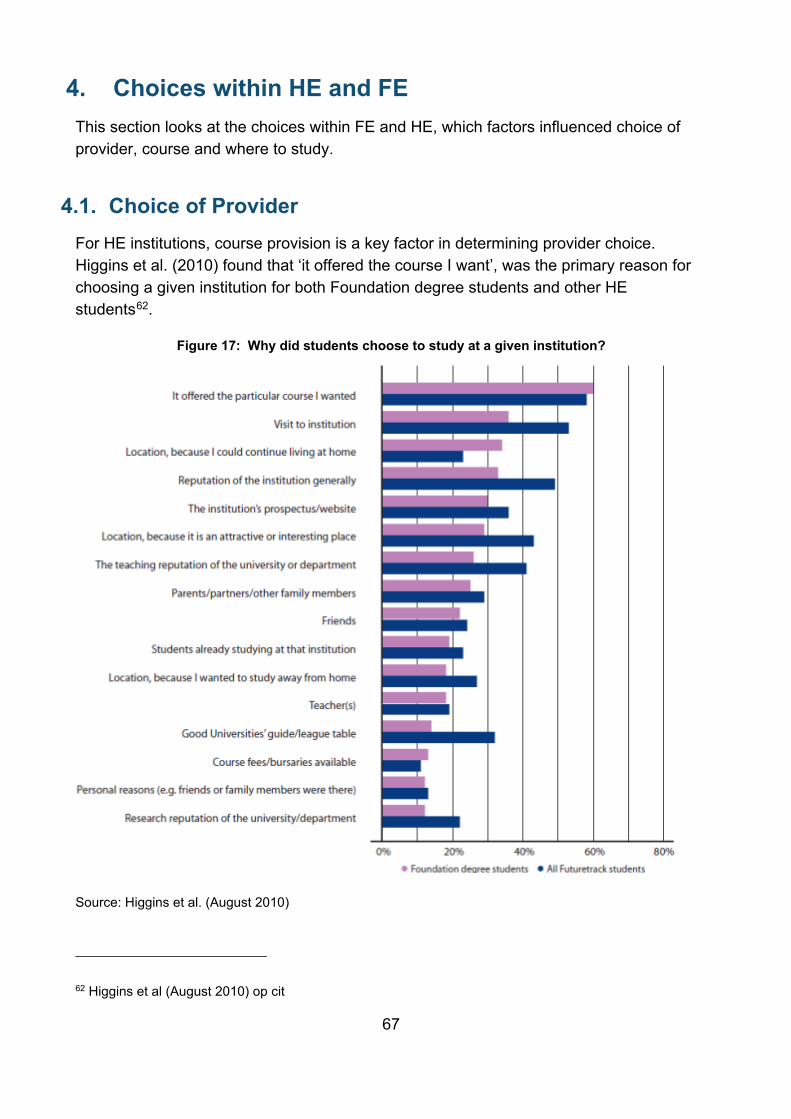
67
4. Choices within HE and FE This section looks at the choices within FE and HE, which factors influenced choice of provider, course and where to study.
4.1. Choice of Provider For HE institutions, course provision is a key factor in determining provider choice. Higgins et al. (2010) found that ‘it offered the course I want’, was the primary reason for choosing a given institution for both Foundation degree students and other HE students62.
Figure 17: Why did students choose to study at a given institution?
Source: Higgins et al. (August 2010)
62 Higgins et al (August 2010) op cit
68
Fagence and Hansom’s (2018) more recent study also found that the course offered was the main factor, and this was for people from both SEGs.
Figure 18: Influences on which University
Source: S. Fagence and J. Hansom (March 2018)
A number of reports highlight the importance of provider open days in encouraging students to attend their institution. CFE Research (2017) found that talking to staff at an open day was the fourth most important source of information, but it was the most helpful especially for HE (Academic) students (see Figure 11). Higgins et al. found (2010) that the visit to the HEI provider was the second most important factor in choice for both Foundation and other degree students (see Figure 17).
69
Diamond et al. (2012) also reached this conclusion:
“One of the most striking statistics to emerge from the 2010 HEFCE report is the large percentage of respondents who rated formal university visits as “very useful‟ – a greater percentage than any other source of information covered by the research. This suggests that physically visiting a university plays a particularly valuable and distinctive role. Part of the reason for this undoubtedly lies in the fact that formal open days allow prospective students and their parents to gather more detailed and tailored information. Yet existing qualitative studies of student choice as well as the research conducted for this study show that this is not the sole reason; it is also because personal contact with an institution often leads to the forming of emotional ties between the prospective student and the institution.63”
Potential students want to know whether a prospective university ‘feels right’.
Universities are well aware of this and they: “…recognised that the open day was the place where, as one staff member put it, prospective candidates stop being simply “candidates on paper” and start to “place themselves” at the institution. As a consequence, concerted efforts had been made to distil the feel good factors into the open day experience”64.
A number of studies have focused on the factors underlying choices between ‘higher’ and ‘lower’ status HEIs. Status is often operationalised as the Russel Group/Other Universities, and pre- and post-1992 HEIs. Figure 18 above shows that university reputation (which is defined by the individual) is a greater influence on students from higher SEGs than lower. Figure 17 shows that reputation was ranked similarly high for Foundation degree and other HE students, but for a much higher proportion for the latter.
Dickinson et al. (April 2009) found that, for those entering FE, provider proximity was a major factor influencing the choice of where to study65, but that this tended to be by default. The limited range of choice in the FE sector for individuals (due to mergers and/or agreements between providers around delivering particular programmes so as not to compete for limited student numbers) meant that there was usually only one provider available in reasonable travelling distance.
Proximity is not just a measure of distance but of access. A provider may be closer in mileage, but not on public transport routes. Learners are often reluctant to change buses. In rural areas, having sufficient car parking spaces is also important66.
63 Diamond et al (2012) 64 Ibid. 65 Dickinson et al (April 2009) 66 Dickinson et al (2009), Evaluation of the impact of Longley Park Sixth Form College
70
In their analysis of HE decisions, Fagence and Hansom (2018) found that location was the least important of a range of factors presented to students. Of a list of 11 factors, when asked how influential they were; ‘located where I can continue to live at home’ was the tenth most important, having some influence on 26% of students and being the major influence on 16%. ‘Being close to friends’ was identified as having some influence on 18% and a major influence on 3% of students. However, being closer to home was much more important to students from lower SEGs. Over one third (36%) of those in SEGs C1-E rated being able to live at home as having some influence and 25% rated it as the major influence. This compares with 19% and 10% of students in SEGs AB respectively67.
Higgins et al. (2010) found that ‘because I could continue living at home’ was an influence for 34% of Foundation degree students and was the third highest reason for choosing the HE provider. This compared with 23% among other HE students where it was the 11th highest ranked influence.
For other HE students ‘because it is an attractive or interesting place’ was of much more importance, rated as important by 43% of HE students and ranked as the fourth most influential factor. This compares with 29% of Foundation degree students who ranked it in sixth place.
4.1.1. Summary
In terms of provider choice, most young people entering HE choose providers because they offer the particular course they want to study. This is the primary reason given by both Foundation degree students and other HE students for choosing a given provider.
It is also important to potential HE students that a prospective provider ‘feels right’. In this context, provider open days are important for students in making their choice of provider, and numerous studies have shown that talking to staff at an open day is among the most important sources of information for young people entering HE.
The reputation of the institution was also deemed important by young people making their choice of provider. However, university reputation is a greater influence on students from higher SEGs than lower.
Among those entering FE, provider proximity was a major factor influencing where to study, but this tended to be by default. If someone wants to pursue a particular
67 Fagence and Hansom (March 2018) op cit.
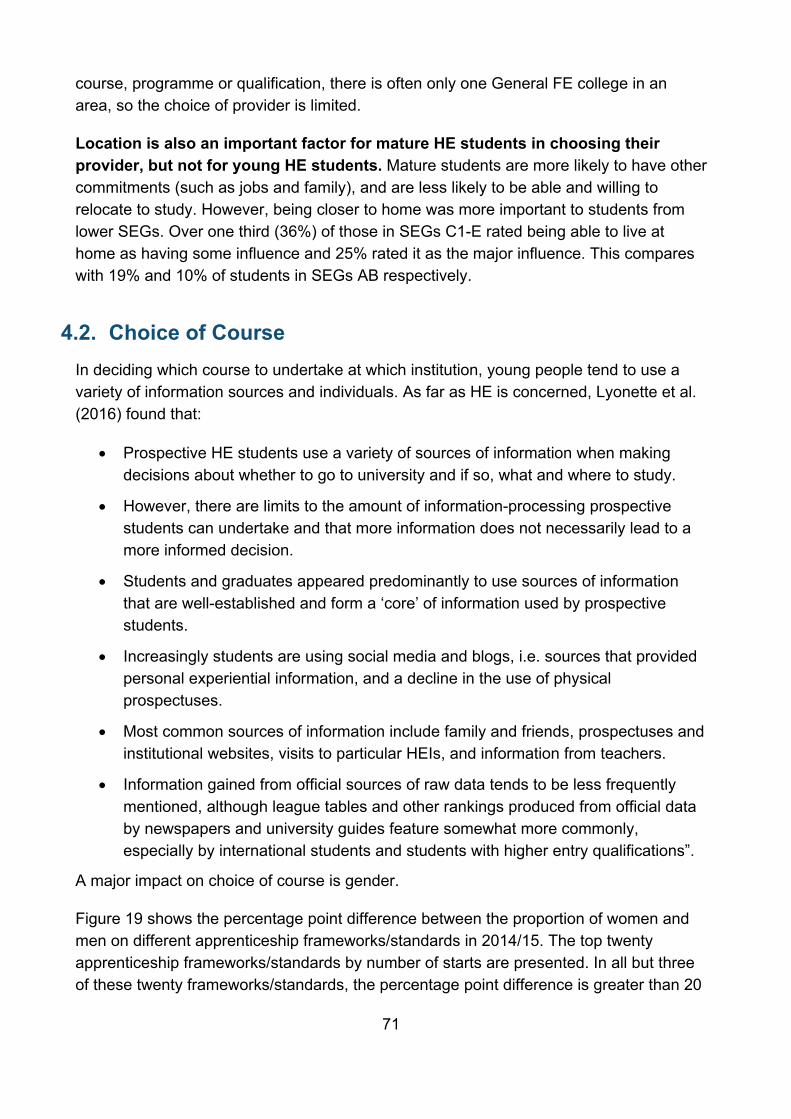
71
course, programme or qualification, there is often only one General FE college in an area, so the choice of provider is limited.
Location is also an important factor for mature HE students in choosing their provider, but not for young HE students. Mature students are more likely to have other commitments (such as jobs and family), and are less likely to be able and willing to relocate to study. However, being closer to home was more important to students from lower SEGs. Over one third (36%) of those in SEGs C1-E rated being able to live at home as having some influence and 25% rated it as the major influence. This compares with 19% and 10% of students in SEGs AB respectively.
4.2. Choice of Course In deciding which course to undertake at which institution, young people tend to use a variety of information sources and individuals. As far as HE is concerned, Lyonette et al. (2016) found that:
• Prospective HE students use a variety of sources of information when making decisions about whether to go to university and if so, what and where to study.
• However, there are limits to the amount of information-processing prospective students can undertake and that more information does not necessarily lead to a more informed decision.
• Students and graduates appeared predominantly to use sources of information that are well-established and form a ‘core’ of information used by prospective students.
• Increasingly students are using social media and blogs, i.e. sources that provided personal experiential information, and a decline in the use of physical prospectuses.
• Most common sources of information include family and friends, prospectuses and institutional websites, visits to particular HEIs, and information from teachers.
• Information gained from official sources of raw data tends to be less frequently mentioned, although league tables and other rankings produced from official data by newspapers and university guides feature somewhat more commonly, especially by international students and students with higher entry qualifications”.
A major impact on choice of course is gender.
Figure 19 shows the percentage point difference between the proportion of women and men on different apprenticeship frameworks/standards in 2014/15. The top twenty apprenticeship frameworks/standards by number of starts are presented. In all but three of these twenty frameworks/standards, the percentage point difference is greater than 20
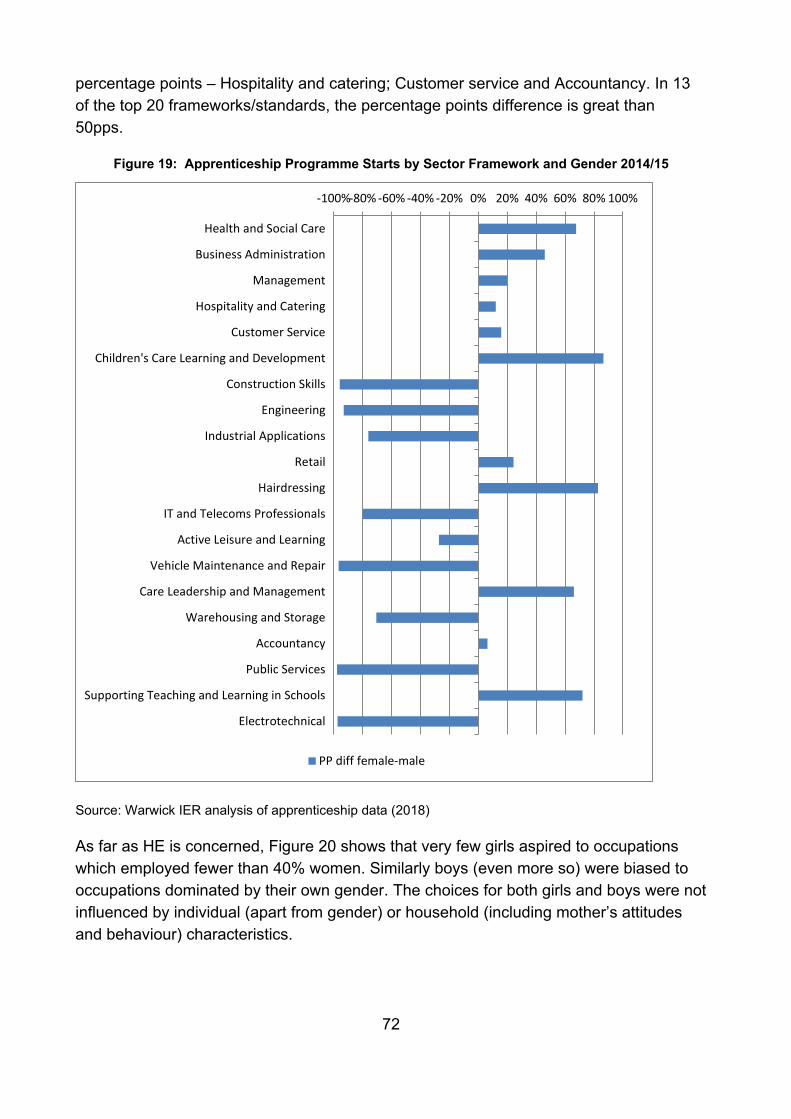
72
percentage points – Hospitality and catering; Customer service and Accountancy. In 13 of the top 20 frameworks/standards, the percentage points difference is great than 50pps.
Figure 19: Apprenticeship Programme Starts by Sector Framework and Gender 2014/15
Source: Warwick IER analysis of apprenticeship data (2018)
As far as HE is concerned, Figure 20 shows that very few girls aspired to occupations which employed fewer than 40% women. Similarly boys (even more so) were biased to occupations dominated by their own gender. The choices for both girls and boys were not influenced by individual (apart from gender) or household (including mother’s attitudes and behaviour) characteristics.
-100%-80% -60% -40% -20% 0% 20% 40% 60% 80% 100%
Health and Social Care
Business Administration
Management
Hospitality and Catering
Customer Service
Children's Care Learning and Development
Construction Skills
Engineering
Industrial Applications
Retail
Hairdressing
IT and Telecoms Professionals
Active Leisure and Learning
Vehicle Maintenance and Repair
Care Leadership and Management
Warehousing and Storage
Accountancy
Public Services
Supporting Teaching and Learning in Schools
Electrotechnical
PP diff female-male
73
Figure 20: Distribution of share women in girls’ and boys’ aspired occupations, MCS age 14
Source: L. Platt and S. Parsons (2017)
Future earnings potential plays a role in young people’s course choice. CFE Research (2017) found that 57% of students sought information on what previous learners on a course now earned, but this varied by type of route. 48% of FE (Academic) learners sought this information, compared to 56% of Technical FE/HE and 68% of HE (Academic) students. In Fagence and Hansom’s (2018) study of HE students, future earnings potential was the fourth highest ranked influential factor as to where to study. It played some part of the decision for 82% of students and was the major factor (3rd ranked) for 41% of students. Future earnings potential was marginally more important for those form a higher SEG (2-3 percentage points).
Few studies have therefore focused on such factors as passion, fulfilment and calling when analysing the factors which people use to decide between courses. Codiroli Mcmaster (2017) did analyse whether differences in students’ choices are driven by differences in their personal attributes, specifically ratings of their own abilities and enjoyment in studying STEM; Social sciences, Law and Business (SLB); and arts and
74
humanities subjects68. Analysing data from Next Steps (formerly the LSYPE), Codiroli Mcmaster used parents’ highest qualification, and young people’s responses. The author found that: “…students whose parents are more educated are most likely to choose subjects for intrinsic reasons”. The author concluded:
“Students whose parents had higher levels of education were both more likely to choose arts and humanities subjects, and less likely to choose social sciences, law or business, compared to students whose parents had lower levels of education. The study also confirmed findings from the psychological literature, showing that students from a range of social backgrounds were most likely to choose subjects they thought they were good at and enjoyed…Recent research into the efficacy of these interventions suggests that for all students attitudes are difficult to manipulate, and it is more effective for practitioners to foster students’ knowledge of positive outcomes associated with studying STEM. This study presents support for the argument that for many students, attitudes to science and maths are not the key issue.69”
4.2.1. Summary
• Gender plays a key role in influencing the course choice of young people pursuing both academic and technical pathways. For example, in all but three of the top 20 apprenticeship frameworks/standards, the percentage point difference between male and female starts is greater than 20. In 13 of the top 20 frameworks/standards, the difference is greater than 50 percentage points.
• Future earnings potential plays a role in young people’s course choice. 57% of students sought information on what previous learners on a course now earned, but this varied by route. 48% of FE (Academic) learners sought this information, compared to 56% of Technical FE/HE and 68% of HE (Academic) students.
• In terms of course choice, there is some evidence that students whose parents are more educated are more likely to choose subjects for intrinsic reasons, such as enjoyment. Students whose parents had higher levels of education were more likely to choose arts and humanities subjects, and less likely to choose social sciences, law or business, compared to students whose parents had lower levels of education.
68 N. Codiroli Mcmaster, (2017). What role do enjoyment and students’ perception of ability play in social disparities in subject choices at university? Centre for Longitudinal Studies. 69 Ibid.
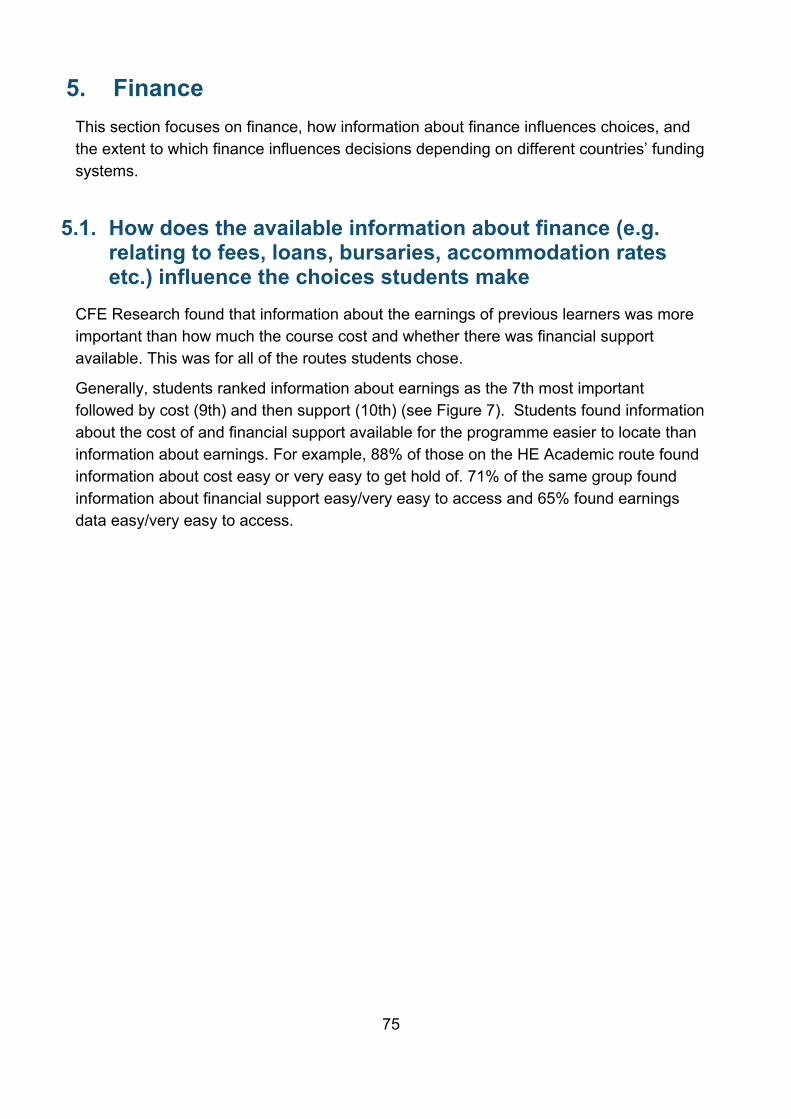
75
5. Finance This section focuses on finance, how information about finance influences choices, and the extent to which finance influences decisions depending on different countries’ funding systems.
5.1. How does the available information about finance (e.g. relating to fees, loans, bursaries, accommodation rates etc.) influence the choices students make
CFE Research found that information about the earnings of previous learners was more important than how much the course cost and whether there was financial support available. This was for all of the routes students chose.
Generally, students ranked information about earnings as the 7th most important followed by cost (9th) and then support (10th) (see Figure 7). Students found information about the cost of and financial support available for the programme easier to locate than information about earnings. For example, 88% of those on the HE Academic route found information about cost easy or very easy to get hold of. 71% of the same group found information about financial support easy/very easy to access and 65% found earnings data easy/very easy to access.
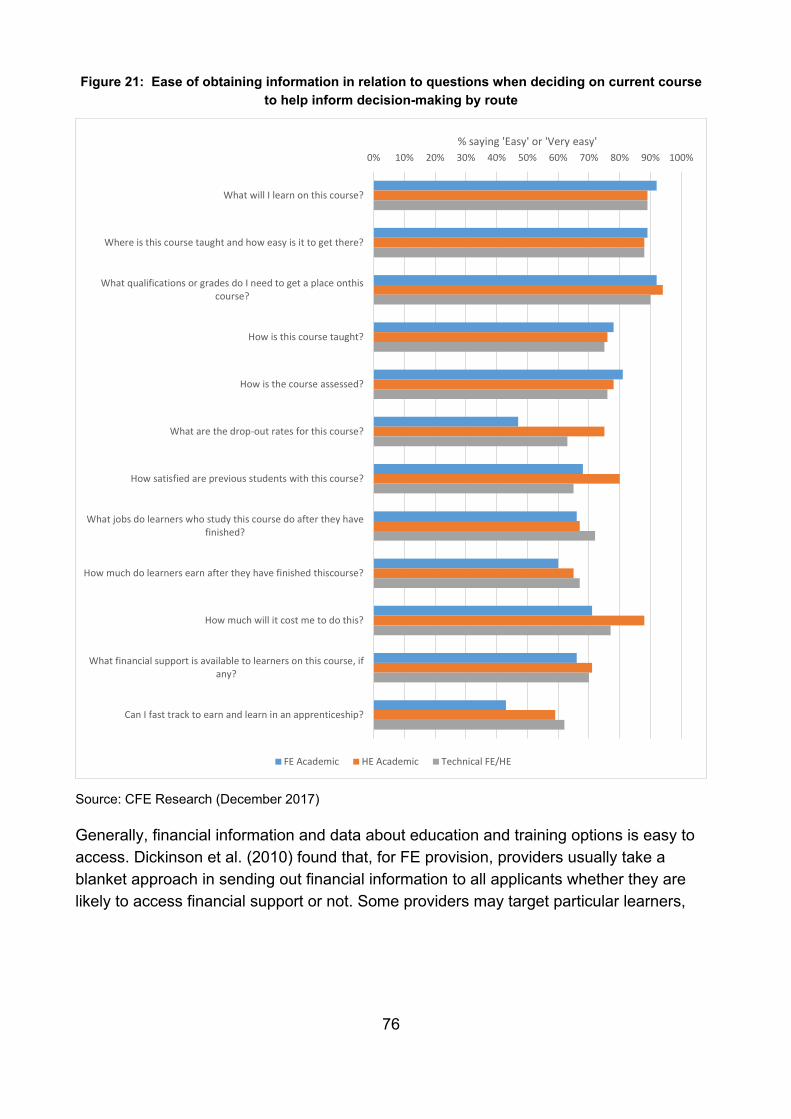
76
Figure 21: Ease of obtaining information in relation to questions when deciding on current course to help inform decision-making by route
Source: CFE Research (December 2017)
Generally, financial information and data about education and training options is easy to access. Dickinson et al. (2010) found that, for FE provision, providers usually take a blanket approach in sending out financial information to all applicants whether they are likely to access financial support or not. Some providers may target particular learners,
0% 10% 20% 30% 40% 50% 60% 70% 80% 90% 100%
What will I learn on this course?
Where is this course taught and how easy is it to get there?
What qualifications or grades do I need to get a place onthiscourse?
How is this course taught?
How is the course assessed?
What are the drop-out rates for this course?
How satisfied are previous students with this course?
What jobs do learners who study this course do after they havefinished?
How much do learners earn after they have finished thiscourse?
How much will it cost me to do this?
What financial support is available to learners on this course, ifany?
Can I fast track to earn and learn in an apprenticeship?
% saying 'Easy' or 'Very easy'
FE Academic HE Academic Technical FE/HE
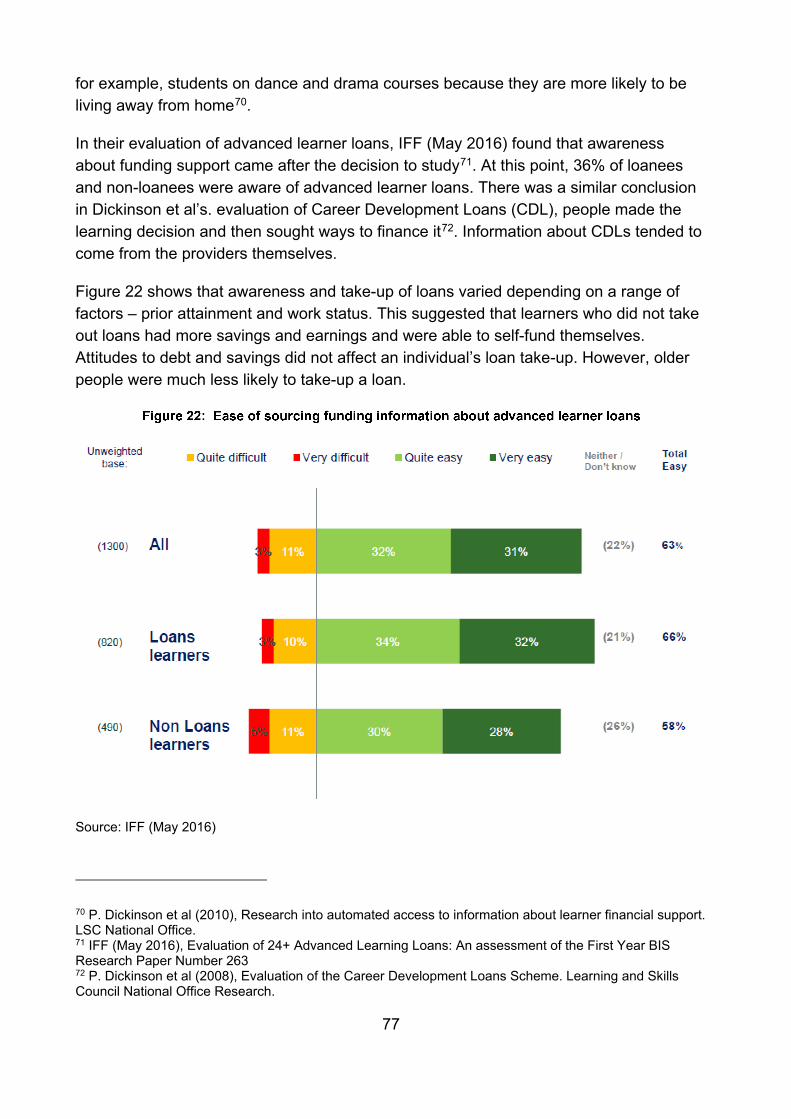
77
for example, students on dance and drama courses because they are more likely to be living away from home70.
In their evaluation of advanced learner loans, IFF (May 2016) found that awareness about funding support came after the decision to study71. At this point, 36% of loanees and non-loanees were aware of advanced learner loans. There was a similar conclusion in Dickinson et al’s. evaluation of Career Development Loans (CDL), people made the learning decision and then sought ways to finance it72. Information about CDLs tended to come from the providers themselves.
Figure 22 shows that awareness and take-up of loans varied depending on a range of factors – prior attainment and work status. This suggested that learners who did not take out loans had more savings and earnings and were able to self-fund themselves. Attitudes to debt and savings did not affect an individual’s loan take-up. However, older people were much less likely to take-up a loan.
Figure 22: Ease of sourcing funding information about advanced learner loans
Source: IFF (May 2016)
70 P. Dickinson et al (2010), Research into automated access to information about learner financial support. LSC National Office. 71 IFF (May 2016), Evaluation of 24+ Advanced Learning Loans: An assessment of the First Year BIS Research Paper Number 263 72 P. Dickinson et al (2008), Evaluation of the Career Development Loans Scheme. Learning and Skills Council National Office Research.
78
5.2. What is the impact of the funding system on choice in other developed countries
There are very few studies which analyse the HE decision making processes of young people in other countries. Those that do suggest it is very similar to young people in England.
The expansion of HE seen in the UK since the turn of the millennium is being replicated across the World in high-, medium- and low income countries. Between 2000 and 2013, the Gross Tertiary Enrolment Rate increased in every continent73. The World participation rate increased from 19% in 2000 to 33% in 2013, and in Latin America and the Caribbean, East Asia and the Pacific, Arab states, South and West Asia, and Sub-Saharan Africa the rate doubled. In North America and Western Europe there was a 17 percentage point increase to 77%.
This increase is bringing millions of first generation students into the HE system and also raising concerns about how best to fund this expansion.
The UK HE system is very different in how it is funded compared to other European countries74. It depends to a much greater extent on student fees and other sources of income (such as, commercial activities, philanthropic funding and European funding) as Figure 23 shows. In the UK, only 40% of HE funding comes from the Government which is 20 percentage points lower than the next two countries Ireland and the Netherlands, and half the median Government contribution (80%).
73 S. Marginson (2016), The worldwide trend to high participation higher education: dynamics of social stratification in inclusive systems. High Educ (2016) 72:413–434 74 Claeys-Kulik A. and Estermann T. (2015), Define Thematic Report: Performance Based Funding Of Universities in Europe. European University Association
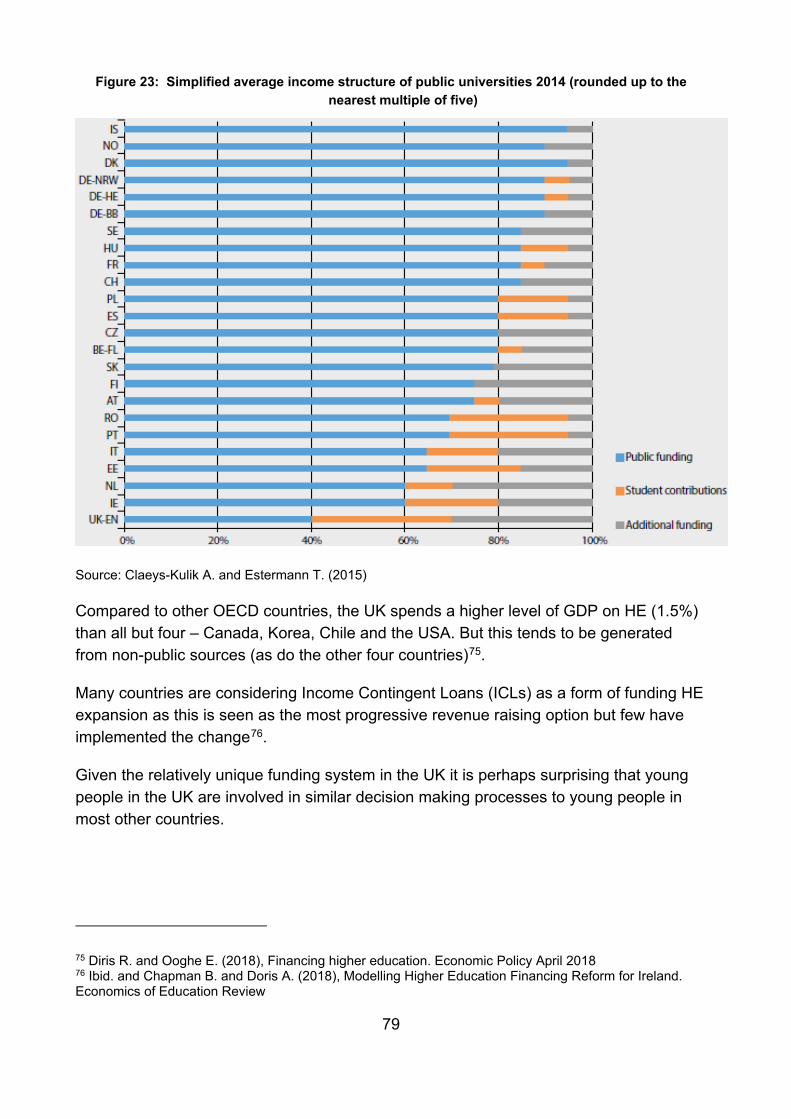
79
Figure 23: Simplified average income structure of public universities 2014 (rounded up to the nearest multiple of five)
Source: Claeys-Kulik A. and Estermann T. (2015)
Compared to other OECD countries, the UK spends a higher level of GDP on HE (1.5%) than all but four – Canada, Korea, Chile and the USA. But this tends to be generated from non-public sources (as do the other four countries)75.
Many countries are considering Income Contingent Loans (ICLs) as a form of funding HE expansion as this is seen as the most progressive revenue raising option but few have implemented the change76.
Given the relatively unique funding system in the UK it is perhaps surprising that young people in the UK are involved in similar decision making processes to young people in most other countries.
75 Diris R. and Ooghe E. (2018), Financing higher education. Economic Policy April 2018 76 Ibid. and Chapman B. and Doris A. (2018), Modelling Higher Education Financing Reform for Ireland. Economics of Education Review
80
In a study comparing decision making between German and English students the author77 differentiated between those who consciously made decisions and those who were ‘embedded choosers’. The latter made non-decisions. They were on the ‘royal route’ by default mainly thanks to the fact that their parents were also graduates and attended university-oriented schools. The ‘embedded choosers’ were more prevalent in England than Germany primarily due to the fact that fewer German students attended academic schools. The other key difference was that the status of HE providers was important to English students but virtually irrelevant to German students78. But apart from these two areas, it was an interest in a future job/career (though not salaries), enjoyment of learning and intellectual development which were the biggest draws.
Similarly, in research into the reasons why students became involved in the Erasmus programme (which gave students the chance to study in another countries’ HE provider) the authors concluded that: “…students in Europe are rather similar when it comes to barriers and drivers…How students make their decisions, what motivates them, and how they reach the conclusion for participation in the Erasmus program does not seem to be highly country-specific. In what stages of the decision-making process a barrier emerges also seems to be rather predictable, with some exceptions”79.
In a study of high-poverty urban High School students’ plans for HE in the USA, Sebnem and Drotos (2016) found that the rewards of HE outweigh the costs in a similar way to those of young people in London (see Section 3.5.1): “The study’s findings suggest that students saw higher education as a reward and therefore wanted to attain it—primarily to improve their future economic security. In addition to the expected economic returns of higher education, however, reasons for aspiring to attend college also included students’ perceptions of symbolic meaning and value of college (i.e., higher education as a symbol of life success) and desire for personal and/or societal betterment.”80
Studies in other countries found that whilst financial costs and benefits do play a role, they are often based on incorrect or incomplete information. In their study of decision making in Italy, Barone et al. (2017): “…found that student beliefs about the profitability of HE are highly inaccurate, systematically biased, and only partially updated over the final year of high school. Moreover, students show limited awareness of the marked
77 Budd R. (2017), Undergraduate orientations towards higher education in Germany and England: problematizing the notion of ‘student as customer’. High Educ (2017) 73:23–37 78 However, the author does point out that this finding is at odds with other research which shows that 60% of German students consider rankings when choosing their university. But this is unrelated to future earnings and career trajectories as it is in England. 79 Beerkens M. et al (2016), Similar Students and Different Countries? An Analysis of the Barriers and Drivers for Erasmus Participation in Seven Countries. Journal of Studies in International Education 2016, Vol. 20(2) 184–204 80 Sebnem C. and Drotos S.M. (2016), High-Poverty Urban High School Students’ Plans for Higher Education: Weaving Their Own Safety Nets Urban Education 2016, Vol. 51(1) 3–31
81
differences between tertiary fields in terms of career opportunities”81. Students were optimistic about the outcomes from HE and overplayed the costs. In this study, students and their parents were given more accurate and up-to-date information about the financial costs and benefits of HE. The intervention did not change students’ intentions to apply for university in general and in those from different social groups. The only difference was that those from lower social groups were more likely to consider subjects where the prospective earnings were higher.
An evaluation of an Australian programme, targeting high achievers from low income families and encouraging them to apply to HE, found similar decision making processes reported in earlier sections (for example see Sections 3.3 and 3.4)82. Providing young people and their parents with information improved their decision making processes by making HE an option for them through making them aware of what’s involved with becoming a university student, what career and study options are available, the steps they need to take, and what support is available.
In Canada, Greene and Kirby (2012) found that students were attracted to HE providers with lower tuition fees83. Memorial University in Newfoundland charged lower tuition fees and this attracted students from further away due to the lower costs. In many ways these ‘migrant’ students were similar to other students in that they: “…consult a wide variety of sources before arriving at a choice of university and…utilise a wide range of resources including family, friends, educators, co-workers and Memorial University alumni, as well as services and programmes available from online sources and university promotional materials”. However, tuition fee costs are an especially important consideration along with university reputation and programme availability.
Marginson (2016), and Gallacher (2014)84 voice similar concerns to authors in the UK; that the expansion and widening participation of HE leads to a stratified system, with those from higher social groups attending the highest ranked HE providers and vice versa. Using analysis of attendance at different types of HE providers by deprivation quintile, Gallacher found that those from the most deprived areas were increasingly likely to attend colleges and post-1992 HEIs. Marginson reports on a census-level study of all 2008 applicants to US higher education. The large majority (percentage not specified) of those students in the top 4% by SAT scores and grade point averages and in the bottom
81 Barone C. et al (2017), Information Barriers, Social Inequality, and Plans for Higher Education: Evidence from a Field Experiment. European Sociological Review, 2017, Vol. 33, No. 1, 84–96 82 Cuthill M. and Jansen D. (2013), Initial results from a longitudinal impact study focusing on a higher education ‘widening participation’ program in Australia. Widening Participation and Lifelong Learning Volume 15, Number 1, April 2013. 83 Greene M. and Kirby D. (2012), The impact of tuition fees on access and student migration: lessons from Canada’s Atlantic coast. Widening Participation and Lifelong Learning Volume 14, Number 1, June 2012 84 Gallacher J. (2014) Higher education in Scotland: differentiation and diversion? The impact of college-university progression links, International Journal of Lifelong Education, 33:1, 96-106
82
family income quartile did not apply to a ‘selective college’. Even though such colleges charged lower tuition than many non-selective institutions, due to the provision of financial aid in selective institutions. The reason proposed is that: “Low-income high achievers opted for uniformly safe choices”85.
5.3. Summary • Information about the earnings of previous learners was more important to young
people than how much the course cost and whether there was financial support available. This was true for all routes students chose (HE (Academic), FE (Academic) and HE/FE Technical).
• Young people found information about the cost of and financial support available to them easier to locate than information about earnings. For example, 88% of those on the HE (Academic) route found information about cost easy or very easy to get hold of. 71% of the same group found information about financial support easy/very easy to access and 65% found earnings data easy/very easy to access.
• The decision making processes of young people in England are similar to those in other countries. This is relatively surprising, given the higher tuition fees paid by students in England compared with other countries. Young people develop a predisposition to pursuing a particular route. HE funding is an important component of this decision, but it is not the main one and is offset to a large extent by the deferred repayment of income contingent loans repaid when earnings reach a certain threshold.
• Similar to England, studies from other countries suggest that young people from low income (and other) backgrounds would benefit from more accurate information about HE, which could help them make more informed choices about whether to consider HE in the first place, which subjects to study and which HE providers to attend.
85 Marginson (2016) op cit.
83
6. Mature Students This section focuses on mature students86 and whether their decisions, and the content of those decisions are in any way different from those of young people.
6.1. Which factors shape mature students’ choices? The decision making process for older people is different to that of younger people. They are much less likely to frame or make decisions about engagement in learning and skills on their own; other organisations, primarily employers and Jobcentre+, are much more likely to take the lead in those decisions.
6.1.1. People as individuals Previous sections have shown that, when the individual is the prime decision maker, older people tend to prioritise location much more than younger people. This is because of their other commitments to family and work. But in most respects, older people go through a similar process to younger people. For whatever reason, whether it is to improve their labour market prospects, return to work, support their children’s education or for pleasure, the decision to engage in education will evolve over time. Practical choices (which provider, can I afford it?) will then manifest themselves, and barriers and incentives can be evaluated.
A key difference in the decision making and choices of older compared to young people, is that older people’s moments of choice are much less predictable, and can be prompted by uncertain events: being made redundant, health issues, bereavement, promotion, changes in caring responsibilities etc.
R. Gloster et al. (2013) consider behavioural approaches to older people’s decision making processes87. People accessed and utilised a range of sources of support, of which family and friends were the most important. However, these sources could be discouraging as well as encouraging. Older people tended to use the internet to access information, although in the main it was used to find and apply for jobs. The internet was not just a source of information but also support; older people were happy to communicate with on-line advisers and use internet based tools (e.g. CV builders)88.
86 The definition of mature student will vary depending on the focus of the research. For example, UCAS define a ‘mature’ student as: ‘…over the age of 21 who didn't go to university after school or college’. But in FE it tends to mean those aged 24+. In this section mature students are also referred to as older people as some are not students. 87 R. Gloster et al. (September 2013), Adult career decision-making: qualitative research. BIS 88 Ibid.
84
Only a small number of interviewees in the study used formal careers services. Some of these people had used the National Careers Service (NCS) although many were unaware that it was the NCS they were using, or what the full range of NCS support was that they could access. Respondents tended to receive employability type support (i.e. help to get people into work), when what they really wanted was: “…support in helping them to make sense of their opportunities and constraints, and to develop an understanding of their interests and preferences”.
The authors developed a typology of decision making styles:
• Strategic: Reflective about self; systematic; seeking out information and consulting others; deliberate weighing up of factors influencing the decision.
• Exploratory: Reflective after periods of experience; testing ideas through experience; evaluating how they feel about experiences; can be pro-active in looking for opportunities.
• Opportunistic: Reactive; responding to opportunities; often taking opportunities pointed out by others.
• Impulsive: Emotional; instinctive; often taking very quick decisions with little or no thought about real options or the consequences of decision.
• Passive: Laid back; drifting; reacting to choices presented; strongly influenced by others in their choices.
Figure 24 puts these decision making typologies in a wider context.
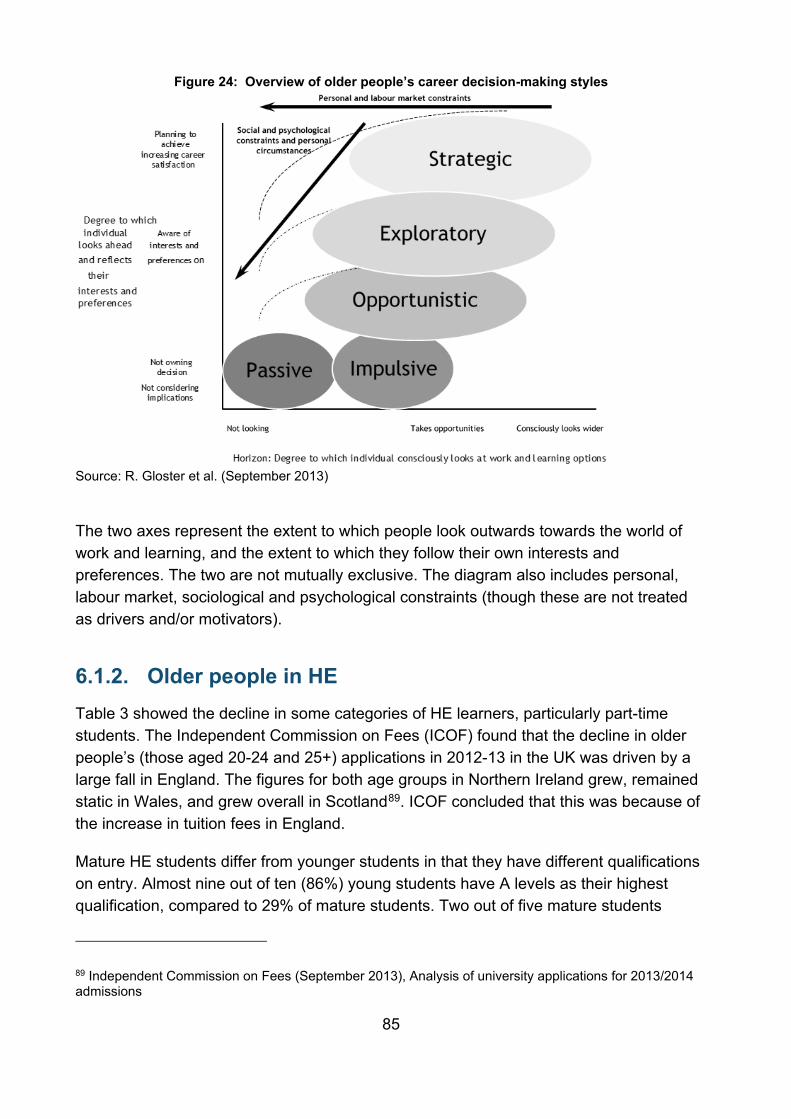
85
Figure 24: Overview of older people’s career decision-making styles
Source: R. Gloster et al. (September 2013)
The two axes represent the extent to which people look outwards towards the world of work and learning, and the extent to which they follow their own interests and preferences. The two are not mutually exclusive. The diagram also includes personal, labour market, sociological and psychological constraints (though these are not treated as drivers and/or motivators).
6.1.2. Older people in HE Table 3 showed the decline in some categories of HE learners, particularly part-time students. The Independent Commission on Fees (ICOF) found that the decline in older people’s (those aged 20-24 and 25+) applications in 2012-13 in the UK was driven by a large fall in England. The figures for both age groups in Northern Ireland grew, remained static in Wales, and grew overall in Scotland89. ICOF concluded that this was because of the increase in tuition fees in England.
Mature HE students differ from younger students in that they have different qualifications on entry. Almost nine out of ten (86%) young students have A levels as their highest qualification, compared to 29% of mature students. Two out of five mature students
89 Independent Commission on Fees (September 2013), Analysis of university applications for 2013/2014 admissions
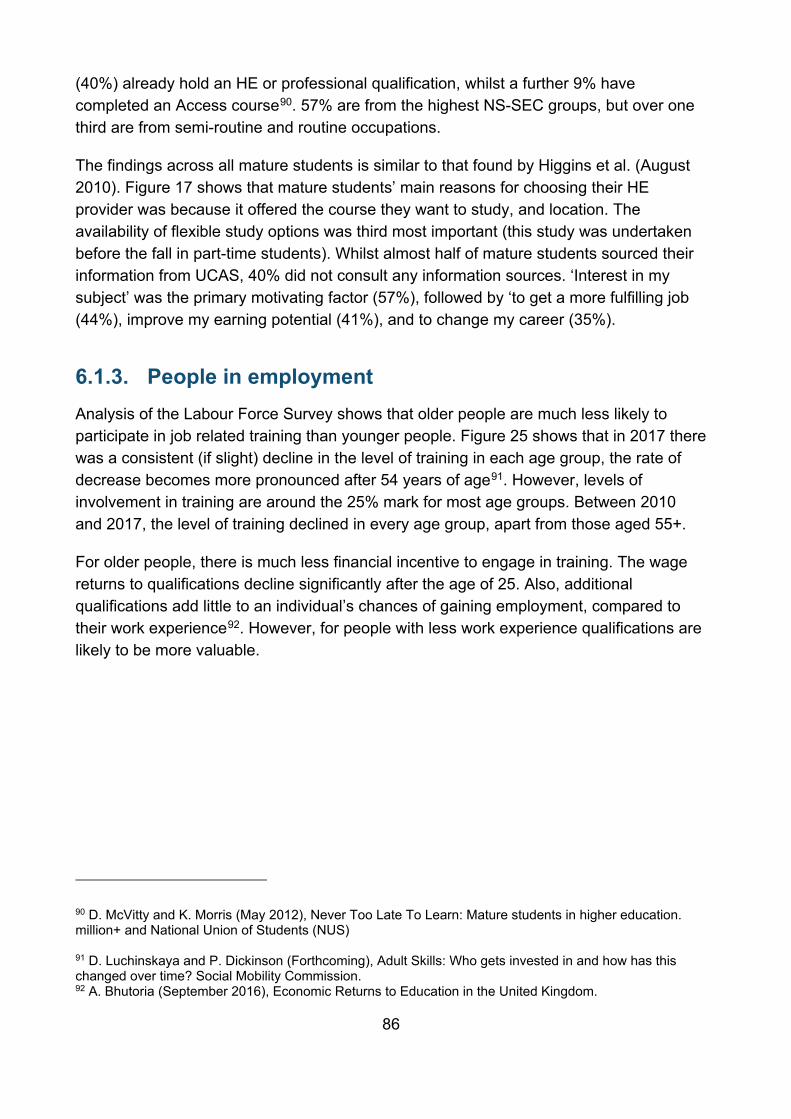
86
(40%) already hold an HE or professional qualification, whilst a further 9% have completed an Access course90. 57% are from the highest NS-SEC groups, but over one third are from semi-routine and routine occupations.
The findings across all mature students is similar to that found by Higgins et al. (August 2010). Figure 17 shows that mature students’ main reasons for choosing their HE provider was because it offered the course they want to study, and location. The availability of flexible study options was third most important (this study was undertaken before the fall in part-time students). Whilst almost half of mature students sourced their information from UCAS, 40% did not consult any information sources. ‘Interest in my subject’ was the primary motivating factor (57%), followed by ‘to get a more fulfilling job (44%), improve my earning potential (41%), and to change my career (35%).
6.1.3. People in employment Analysis of the Labour Force Survey shows that older people are much less likely to participate in job related training than younger people. Figure 25 shows that in 2017 there was a consistent (if slight) decline in the level of training in each age group, the rate of decrease becomes more pronounced after 54 years of age91. However, levels of involvement in training are around the 25% mark for most age groups. Between 2010 and 2017, the level of training declined in every age group, apart from those aged 55+.
For older people, there is much less financial incentive to engage in training. The wage returns to qualifications decline significantly after the age of 25. Also, additional qualifications add little to an individual’s chances of gaining employment, compared to their work experience92. However, for people with less work experience qualifications are likely to be more valuable.
90 D. McVitty and K. Morris (May 2012), Never Too Late To Learn: Mature students in higher education. million+ and National Union of Students (NUS) 91 D. Luchinskaya and P. Dickinson (Forthcoming), Adult Skills: Who gets invested in and how has this changed over time? Social Mobility Commission. 92 A. Bhutoria (September 2016), Economic Returns to Education in the United Kingdom.
87
Figure 25: Percentage of people who participated in training in 2017 and 2010, by age group
Source: Luchinskaya and Dickinson (2018). Labour Force Survey 2010 and 2017, June-September quarter, people aged 25 to 64 in employment, weighted.
A key feature of apprenticeships over the past decade has been the increase in adult starts . However, over the past five years (2011/12 to 2015/16) the age profile of apprentices has remained fairly stable. In 2015/16, 26% of apprentice starts were made by 16-18 year olds, 30.2% by 19-24 year olds, and 44% of those aged 25+93.
However, the prime mover and funder of job related training in general, and apprenticeships in particular, will be the employer. People working in large organisations, the public sector, in managerial, professional, associate professional and technical, and personal service occupations are the most likely to be involved in training. Occupational training is also highly related to gender94.
In their study of advanced apprentices, Smith et al. (2015) found that the progression rate to HE of older people was half that of younger apprentices95. The progression rate for
93 Department for Education (2018), Apprenticeships demographics data tool: starts 2011/12 to 2016/17. FE data library: apprenticeships 94 D. Luchinskaya and P. Dickinson (Forthcoming) op cit 95 S. Smith et al (September 2015), Progression of Apprentices to Higher Education – 2nd Cohort Update
0 10 20 30 40Per cent
60-64
55-59
50-54
45-49
40-44
35-39
30-34
25-29
20172010
20172010
20172010
20172010
20172010
20172010
20172010
20172010
88
25+ apprentices peaked at 7% for the 2006-07 cohort dropping to 5.7% for 2010-11 apprentices. The progression rate for 17-19 year old apprentices in 2008-09 peaked at 15.8% dropping to 12% for 2010-11 young apprentices.
If advanced apprentices did progress to HE this happened several years after completing the advanced apprenticeship. They were also likely to study HE at an FE College.
6.1.4. People not in employment DWP’s Six Month Offer mandated claimants to choose one of four options: an employment voucher to give to a potential employer, advice on self-employment, a volunteering placement or work-focused training. The options were offered to different numbers of unemployed people depending on their profiles. For example, more qualified people were less likely to receive the training offer. Take-up of the training option was second behind the employment voucher.
Take-up of the training offer was marginally higher among those aged 18-24 (32%) than those aged 25-49 (29%), which was higher than those aged 50+ (25%). Older learners were much more likely than younger ones to undertake the training in order to gain new skills or update existing ones. It was the highest ranked reason for those aged 25-49 (45% gave this reason) and 50+ (46%) compared to 18-24 year olds (32%)96. This supports findings from a number of studies that the primary motivating factor for unemployed people in undertaking training is to get a job.
In their study of approaches used by UK online centres, Dickson and Frearson (2007) found that engagement with hard to help learners on the individual’s terms was very important97. Engagement was primarily through organisations working with the target hard to reach groups (e.g. a women’s refuge). This was the first step in developing a trusted relationship. Getting the atmosphere, communication and contact was also important in order to make learners feel comfortable, many of whom would not have undertaken education and training since leaving school. Basic skills and ICT courses were the most popular.
Gloster et al. (2017) applied behavioural insights to claimants’ decision to train98. The authors identified critical moments when claimants are receptive to training: the initial assessment when they first sign-on; through ongoing adviser support when the person is
96 L. Adams et al (2010). Six Month Offer Evaluation: A report on quantitative research findings. DWP. L. Adams et al (2011). Six Month Offer Evaluation: Findings from the longitudinal claimant survey. DWP. 97 A. Dickson and M. Frearson (2007), Engaging the hardest to reach what works at UK online centres. LSDA 98 R. Gloster (July 2017), Using behavioural insights to examine benefit claimants’ approaches to training opportunities
89
unable to find work; and if they have positive experiences from undertaking training that is job oriented and relevant to them.
The last point is important. Claimants were open and willing to train: “…particularly if they perceived that the training opportunity was a good fit with their skills and experience and would add value by helping them to work towards their employment goals”. The study also found that Jobcentre Plus advisers were frequently used as a source of information about training provision99. The study found that mandated learners tended to be directed to employability courses (e.g. CV writing) whereas self-referred claimants tended to undertake vocational courses.
As far as motivation is concerned, conditionality and mandation are key elements. A claimant’s capability (their individual skills, experiences and work goals) need to be taken into account and this is where adviser support and understanding is required as they perform a gatekeeper role to training opportunities:
“The motivations for training are complex and personal. Claimants react to mandation to training differently. For some it does not affect their planned behaviour and they continue to train. For others it can create a sense of anxiety that overshadows their learning experience. Mandation changes the nature of the interaction, and it made some claimants more defensive or dismissive of the training opportunity”100.
It is a fine balancing act because positive experiences of training encourage people to undertake more training. And this is critical in getting disadvantaged learners, many of whom will have negative attitudes to education and training, on to a positive and progressive path.
6.1.5. Summary • Older people’s aspirations, choices and intentions evolve over time. While
this is similar to the decision making process of younger people, older people’s moments of choice are much less predictable and can be prompted by uncertain events e.g.: being made redundant, health issues, bereavement, promotion, changes in caring responsibilities etc.
• Like younger people, older people access a wide range of information and support. Friends and family tend to be heavily involved.
• Older people’s participation in HE appears has been significantly affected by the increase in tuition fees. Part-time student numbers especially have declined.
99 Ibid. 100 Ibid.

90
• When deciding on HE options, location is a much more important decision-making factor for older students, compared with younger students. Interest in the subject, earnings and careers and flexibility of learning are also important motivating factors.
• Unlike younger people, older people are more likely to have organisations heavily involved in their education and training decisions. Employers can be the major decision maker for people in employment, while Jobcentre+ advisers play an important role in supporting unemployed people into work related training.
91
7. Summary This section brings together the main summary points from the review under the research question headings.
7.1. Choices between Higher Education (HE), Further Education (FE) and Apprenticeships
7.1.1. Overview of decision making pathway Most young people consciously make their post-18 choices in Year 9 (when choosing their GCSE options), in Year 11 (the transition point into post-16 education and training), and in Year 12 (for those in HE).
Young people tend not to amass a large amount of information before they make a broad decision. They tend decide on a chosen route first (based on an array of factors) and then seek out information about it.
Young people on academic pathways start to think about their post-18 choices earlier than those on technical routes, and make their final decisions sooner. While 8 per cent of those on a HE (Academic) pathway first considered their future education choices in Years 7 or 8, only 2% of HE (Technical) learners did so. One third (33%) of those on HE (Academic) routes made their final decision about their post-18 route during Year 12 and just under half (47%) made it during Year 13. This compares to 19% and 63% respectively for HE (Technical) learners on higher level apprenticeships.
Evidence from the Longitudinal Study of Young People in England suggests that there is little movement between different broad types of post-18 pathway (e.g. higher education, technical education or employment), especially after Year 13. This suggests that the 16-18 year old transition point is critical for longer term outcomes in a young person’s life.
7.1.2. Demographic factors impacting on choices between Higher Education (HE), Further Education (FE) and Apprenticeships
The choice that young people make between HE, FE and Apprenticeships is heavily influenced by their demographic characteristics. In particular:
• Socio-economic group (SEG): Young people from lower socio-economic groups are less likely to progress to HE. Those in receipt of Free School Meals (FSM) or a
92
16-19 Bursary are more likely to follow FE or Technical routes, as are those whose parents did not go to university. However, the role of SEG in learning and skills decision making is complex, given that it is closely related to prior attainment, which is the best predictor of future outcomes.
• Prior attainment: Attainment at age 16 is a key determinant of young people’s post-18 pathways, with higher attainment at this age associated with higher rates of post-18 participation in education and training and, specifically, higher rates of participation in HE.
• Gender: Take-up of the broad post-18 options is relatively balanced between women and men, although women are more likely than men to enter education and training. (Women account for 57% of HE starts and 54% of apprenticeship starts.) There are significant differences in the subjects chosen by men and women on both technical and academic post-18 routes. In terms of apprenticeships, women are more likely to choose subjects like Hairdressing, Children’s Care, Learning and Development and Supporting Teaching in Learning and School. Men are more likely to choose subjects such as Construction, Electrotechnical and Vehicle Maintenance and Repair.
7.1.3. The impact of access to information, advice and guidance (IAG) on young people’s choices between HE, FE and Apprenticeships
Young people pursuing different post-18 pathways have different information needs. Young people are most interested in finding out about course entry requirements and what they will learn on a course, regardless of their post-18 route (Technical HE/FE, HE (Academic) and FE (Academic)). However, young people looking to HE (Academic) routes are more likely than those on other routes to want to know about: the satisfaction of previous learners; costs; the availability of financial support; and job, and earnings outcomes. Young people aiming for Technical FE/HE routes are more interested in how the course is assessed. Large proportions of those on the HE (Academic), and Technical FE/HE routes also want to know about location and accessibility.
Most young people would like careers information in one place, and want personalised IAG that is relevant to them. Their preference would be to speak to someone face-to-face, by phone or text, and this preference is strongest amongst those on Technical FE/HE routes.
Most young people are broadly satisfied with the IAG available, however, significant minorities have faced issues. These issues include not finding the information to help them make a decision (<20%), not finding all the information they
93
wanted to make a fully informed decision (<15%) and not being aware of available IAG (<15%).
A significant minority of young people are also confused about which sources of information they can trust. 30% of all young people agreed or strongly agreed that ‘I did not know what source of information I could trust to give me accurate information’. Young people on HE (Academic) pathways were most likely to agree with this (40%).
Parents/carers and other relatives were the individuals consulted most by young people following each of the three routes – Technical FE/HE, HE (Academic) and FE (Academic) – followed by subject teacher, and friends.
Those following technical routes were much less likely to have consulted their subject teachers compared with those following academic routes. 48 percent of those following technical pathways had consulted subject teachers compared to 69% of those following HE (Academic) and 68% following FE (Academic) routes.
Young people following technical routes were also less likely than those following other pathways to find subject teachers helpful or very helpful. Three quarters (74%) of those on FE/HE Technical routes found their subject teachers helpful or very helpful, compared to 91% on the HE (Academic) route and 90% on the FE (Academic) route. Perceptions about the helpfulness of other individuals, including careers advisers, family, friends and staff during open days, were broadly similar among young people following different pathways.
There is some qualitative evidence that IAG is perceived to be biased towards academic routes and away from more technical or vocational options. In particular, studies highlight the often perceived poor quality of information about apprenticeships given to young people by teachers and careers advisers in schools.
There are also potential issues with the timing of IAG in relation to technical routes. When pupils are told about apprenticeships is potentially important and could influence the effectiveness of information received. In those schools where more than 6% of pupils graduated into apprenticeships, around 70 per cent told pupils in Year 10 or younger compared to just over 50% of other schools.
Despite these issues, most young people are satisfied with their chosen route. 87% of those taking the Technical FE/HE route are satisfied or very satisfied, compared with 89% taking the HE (Academic) route and 90% on the FE (Academic) route.
94
7.1.4. The impact of future financial returns, job prospects and ‘lifestyle’ factors on young people’s choices between HE, FE and Apprenticeships
Future career prospects are of paramount importance to young people following academic and technical routes. This is true despite the fact many young people on HE (Academic) pathways do not have a clear idea about what job they want to go into after completing their course. 38% of those on the HE (Academic) route agreed or strongly agreed with the statement ‘I know what I want to do when I finish my current course’, compared to 75% of those on the Technical HE/FE route and 73% of those on the FE (Academic) route.
Young people also make their post-18 choices with their future earnings in mind. Higher levels of qualification lead to higher financial returns. Despite the 2012 rise in tuition fees, HE is still considered a relatively good financial investment, and understanding of this among young people has grown over time. The main reason given by young people for applying to university is to improve their job opportunities and salary prospects.
This holds true for young people of all social classes. Although those in lower social classes are more concerned about student debt, and feel more reluctant about entering HE, participation rates among this group have actually increased.
‘Lifestyle factors’ play a key role in underpinning the decision of many young people to enter higher education as opposed to other routes, such as apprenticeships. When asked why they did not choose alternatives to HE, the most popular response, given by four out of five HE applicants, was simply that they ‘wanted to go to university’. Qualitative research has found that young people consistently speak about non-academic aspects when considering university. For some, university represents a ‘rite of passage’, in contrast to apprenticeships which were not seen to provide a narrative about lifestyle.
7.2. Choices within HE and FE
7.2.1. Choice of provider In terms of provider choice, most young people entering HE choose providers because they offer the particular course they want to study. This is the primary reason given by both Foundation degree students and other HE students for choosing a given provider.
95
It is also important to potential HE students that a prospective provider ‘feels right’. In this context, provider open days are important for students in making their choice of provider, and numerous studies have shown that talking to staff at an open day is among the most important sources of information for young people entering HE.
The reputation of the institution was also deemed important by young people making their choice of provider. However, university reputation is a greater influence on students from higher SEGs than lower.
Among those entering FE, provider proximity was a major factor influencing where to study, but this tended to be by default. If someone wants to pursue a particular course, programme or qualification, there is often only one General FE college in an area, so the choice of provider is limited.
Location is also an important factor for mature HE students in choosing their provider, but not for young HE students. Mature students are more likely to have other commitments (such as jobs and family), and are less likely to be able and willing to relocate to study. However, being closer to home was more important to students from lower SEGs. Over one third (36%) of those in SEGs C1-E rated being able to live at home as having some influence and 25% rated it as the major influence. This compares with 19% and 10% of students in SEGs AB respectively.
7.2.2. Choice of course Gender plays a key role in influencing the course choice of young people pursuing both academic and technical pathways. For example, in all but three of the top 20 apprenticeship frameworks/standards, the percentage point difference between male and female starts is greater than 20. In 13 of the top 20 frameworks/standards, the difference is greater than 50 percentage points.
Future earnings potential plays a role in young people’s course choice. 57% of students sought information on what previous learners on a course now earned, but this varied by route. 48% of FE (Academic) learners sought this information, compared to 56% of Technical FE/HE and 68% of HE (Academic) students.
In terms of course choice, there is some evidence that students whose parents are more educated are more likely to choose subjects for intrinsic reasons, such as enjoyment. Students whose parents had higher levels of education were more likely to choose arts and humanities subjects, and less likely to choose social sciences, law or business, compared to students whose parents had lower levels of education.
96
7.3. How financial factors influence choice Information about the earnings of previous learners was more important to young people than how much the course cost and whether there was financial support available. This was true for all routes students chose (HE (Academic), FE (Academic) and HE/FE Technical).
Young people found information about the cost of and financial support available to them easier to locate than information about earnings. For example, 88% of those on the HE (Academic) route found information about cost easy or very easy to get hold of. 71% of the same group found information about financial support easy/very easy to access and 65% found earnings data easy/very easy to access.
The decision making processes of young people in England are similar to those in other countries. This is relatively surprising, given the higher tuition fees paid by students in the England compared with other countries. Young people develop a predisposition to pursuing a particular route. HE funding is an important component of this decision, but it is not the main one and is offset to a large extent by the deferred repayment of income contingent loans repaid when earnings reach a certain threshold.
Similar to England, studies from other countries suggest that young people from low income (and other) backgrounds would benefit from more accurate information about HE, which could help them make more informed choices about whether to consider HE in the first place, which subjects to study and which HE providers to attend.
7.4. Choice factors for mature students Older people’s aspirations, choices and intentions evolve over time. While this is similar to the decision making process of younger people, older people’s moments of choice are much less predictable and can be prompted by uncertain events e.g. being made redundant, health issues, bereavement, promotion, changes in caring responsibilities etc.
Like younger people, older people access a wide range of information and support. Friends and family tend to be heavily involved.
Older people’s participation in HE appears has been significantly affected by the increase in tuition fees. Part-time student numbers especially have declined.
When deciding on HE options, location is a much more important decision-making factor for older students, compared with younger students. Interest in the subject, earnings and careers and flexibility of learning are also important motivating factors.

97
Unlike younger people, older people are more likely to have organisations heavily involved in their education and training decisions. Employers can be the major decision maker for people in employment, while Jobcentre+ advisers play an important role in supporting unemployed people into work related training.
98
8. Bibliography Adams, L., Oldfield, K., & Tindle , A. (2010). Six Month Offer Evaluation: A report on quantitative research findngs. DWP.
Adams, L., Oldfield, K., & Tindle , A. (2011). Six Month Offer Evaluation: Findings from the longitudinal claimant survey. DWP.
Alcott, B. (2017). Does 'Teacher Encouragement Influence Students’, Educational Progress? A Propensity-Score Matching Analysis. Res High Educ (2017) 58773-804.
Anders, J., & Dorsett, R. (2016). What young English people do once they reach school-leaving age: A cross-cohort comparison for the last 30 years; LLAKES Research Paper 56. LLAKES.
Anders, J., Henderso, M., Moulton, V., & Sullivan, A. (2017). The role of schools in explaining individuals’ subject choices at age 14. Centre for Longitudinal Studies.
Apprenticeship Programme Starts by Sector Framework, Apprenticeship Standard, Level and Gender (2002/03 to 2014/15). (2018). SFA; BIS.
Azmat, G., & Simion, S. (2018). Higher Education Funding Reforms: A Comprehensive Analysis of Educational and Labour Market Outcomes in England; CEP Discussion Paper No 1529. Centre for Economic Performance.
Barone C. et al. (2047), Information Barriers, Social Inequality, and Plans for Higher Education: Evidence from a Field Experiment. European Sociological Review, 2017, Vol. 33, No. 1, 84–96.
Bates, P., Pollard, E., Usher, T., & Oakley, J. (2009). Who is Heading for HE? Young People’s Perceptions of, and Decisions About, Higher Education; BIS Research Paper No 3. BIS.
Bathmaker, A. (2018). Getting In. Higher Education, Social Class and Social Mobility, DOI 10.1057/978-1-137-53481-1_4.
Beerkens M. et al. (2016), Similar Students and Different Countries? An Analysis of the Barriers and Drivers for Erasmus Participation in Seven Countries. Journal of Studies in International Education 2016, Vol. 20(2) 184–204.
Behavioral Insights Team. (2016). Behavioral Insights for Cities. The Behavioral Insights Team.
Behavioural Insight Team. (2016). Moments of Choice, Final Report. Behavioural Insight Team.

99
Behtoui, A. (2017). Social capital and the educational expectations of young people. EERJ, Vol. 16(4) 487–.
Belfield, C. et al (June 2018), The relative labour market returns to different degrees Research report. DfE
Benton, T. (2012). Do I really need a degree? The impact of tuition fee increases on young people’s attitudes towards the need for qualifications. NFER.
Bhutoria, A. (2016). Economic Returns to Education in the United Kingdom. Foresight Government Office for Science.
BIS (2013). Adult Career Decision-Making: Qualitative Research; BIS Research Paper No 132.
BIS and Department for Education (2016). Technical education reform: the case for change.
Briggs, S. (2006). An exploratory study of the factors influencing undergraduate student choice: the case of higher education in Scotland. Studies in Higher Education, Vol. 31, No. 6, pp. 705–722.
Brown, A., & Bimrose J. (2014), Model of Learning for Career and Labour Market Transitions. Research in Comparative and International Education Volume 9 Number 3 2014.
Budd R. (2017), Undergraduate orientations towards higher education in Germany and England: problematizing the notion of ‘student as customer’. High Educ (2017) 73:23–37.
Brunello, G., & Rocco, L. (2017). The Labor Market Effects of Academic and Vocational Education over the Life Cycle: Evidence Based on a British Cohort. Journal of Human Capital, 2017, vol. 11, no. 1.
Callender, C., & Mason, G. (2017). Does student loan debt deter Higher Education participation? New evidence from England, LLAKES Research Paper 58. LLAKES; Institute of Education.
Cavaglia, C., McNally, S., & Ventura, G. (2017). Apprenticeships for Young People in England: Is there a Payoff? Research Discussion Paper 010. Centre for Vocational Education Research.
Centre for Longitudinal Studies. (2017). The university and occupational aspirations of UK teenagers: how do they vary by gender? Initial findings from the Millennium Cohort Study Age 14 Survey. Centre for Longitudinal Studies, UCK.
100
CFE Research & Hughes OBE, D. (2017). User insight research into post-16 choices . DfE.
Claeys-Kulik A. and Estermann T. (2015), Define Thematic Report: Performance Based Funding Of Universities in Europe. European University Association.
Chapman B. and Doris A. (2018), Modelling Higher Education Financing Reform for Ireland. Economics of Education Review.
Codiroli Mcmaster, N. (2017). What role do enjoyment and students’ perception of ability play in social disparities in subject choices at university? Centre for Longitudinal Studies.
Collier, W., Valbuena, J., & Zhu, Y. (2011). What Determines Post-Compulsory Educational Choice? Evidence from the Longitudinal Survey of Young People in England. University of Kent.
Conlon, G., Hedges, S., McIntosh, S., Morris, D., & Patrignani, P. (2017). The Payoff to Vocational Qualifications: Reconciling Estimates from Survey and Administrative Data. Centre for Vocational Education Research.
Crawford, C., Duckworth, K., Vignoles, A., & Wyness, G. (2010). Young people’s education and labour market choices aged 16/17 to 18/19, Research Report DFE-RR182. DfE.
Crowther, K. (2011). BIS Research Paper Number 49: Informing Choice in Post 16 Education and Learning. BIS.
Cuthill M. and Jansen D. (2013), Initial results from a longitudinal impact study focusing on a higher education ‘widening participation’ program in Australia. Widening Participation and Lifelong Learning Volume 15, Number 1, April 2013.
Darnton, A. (2008). Reference Report: An overview of behaviour change models and their uses. GSR Behaviour Change Knowledge Review.
Denoël, E., Dorn, E., Goodman, A., Hiltunen, J., Krawitz, M., & Mourshed, M. (2017). Drivers of Student Performance: Insights from Europe. McKinser & Company.
Department for Education (2017). Careers strategy: making the most of everyone’s skills and talents.
Department for Education (2017). NEET Statistics Quarterly Brief April to June 2017, England.
Department for Education (2018). Characteristics of young people who are long-term NEET.
101
Department for Education (2018). Level 2 and 3 attainment in England: Attainment by Age 19 in 2017
Department for Education (2018). Post-16 education: highest level of achievement by age 25 (England).
Department for Education (2018), Apprenticeships demographics data tool: starts 2011/12 to 2016/17. FE data library: apprenticeships
Diamond, A., Vorley, T., Roberts, J., & Jones, S. (2012). Behavioural Approaches to Understanding Student Choice. HEA and NUS.
Dickinson, P., Darnton, A., Sanderson, J., & Scott, D., (March 2011), Individuals’ Learning Choices: A Review Of Literature And Behavioural Change Approaches. BIS.
Dickinson, P., Farrell, J., & Sanderson, J. (2010). Research into automated access to information about learner financial support. LSC National Office.
Dickinson, P., Farrell, J., & Sanderson, J. (April 2009). Effectively publishing and developing Framework for Excellence: Analysis of user needs, Final report. LSC National Office.
Dickinson, P., Farrell, J., & Sanderson, J. (2009a). Evaluation of Career Development Loans. LSC National Office.
Dickinson, P., & Pinnock, K., (2009b) Effective practice in raising the aspirations of young people. LSC National Office.
Dickinson, P., & Button, A. (2009c), Evaluation of the impact of Longley Park Sixth Form College
Dickinson, P., Farrell, J., & Sanderson, J. (2008), Evaluation of the Career Development Loans Scheme. Learning and Skills Council National Office.
Dickinson, P., Farrell, J., & Sanderson, J. (2007). Research into who accesses learner support funding. LSC National Office.
Dickson, A., & Frearson, M. (??). Enaging the hardest to reach, what works at UK online centres. LSN.
Dilnot, C. (2017). The relationship between A-level subject choice and league table score of university attended: the ‘facilitating’, the ‘less suitable’ and the counter-intuitive. Centre for Longitudinal Studies.
Diris R. and Ooghe E. (2018), Financing higher education. Economic Policy April 2018.
102
DWP (2015). Evaluating the In-Work Progression Advice Trial. Research Report No 912.
Fagence, S., & Hansom, J. (2018). Influence of finance on higher education decision-making; Research report. DfE.
Gallacher J. (2014) Higher education in Scotland: differentiation and diversion? The impact of college-university progression links, International Journal of Lifelong Education, 33:1, 96-106
Gloster, R., Bertram, C., Buzzeo, J., Fletcher, L., Tassinari, A., Cox, A., & Vlaev, I. (2017). Using behavioural insights to examine benefit claimants’ approaches to training opportunities. DfE.
Greene M. and Kirby D. (2012), The impact of tuition fees on access and student migration: lessons from Canada’s Atlantic coast. Widening Participation and Lifelong Learning Volume 14, Number 1, June 2012.
Guldborg Hansen, P. (2016). The Definition of Nudge and Libertarian Paternalism: Does the Hand Fit the Glove? EJRR.
Hedges, S., & Speckesser, S. (2017). Peer Effects and Social Influence in Post-16 Educational Choice. Centre for Vocational Education Research.
HMG (January 2017) Building our Industrial Strategy: Green Paper, London.
Higgins, H., Artess, J., & Johnstone, I. (2010). Students’ experiences of full-time Foundation degrees. fdf.
Hooley, T., Devins, D., Watts, A.G., Hutchinson, J., Marriott, J. and Walton, F. (2012) Tackling unemployment, supporting business and developing careers. London: UK Commission for Employment and Skills.
House of Commons Education Committee March 2015), Closing the gap: the work of the Education Committee in the 2010–15 Parliament. Eighth Report of Session 2014–15
IFF (May 2016), Evaluation of 24+ Advanced Learning Loans: An assessment of the First Year BIS Research Paper Number 263
Independent Commission on Fees (2013). Analysis of university applications for 2013/2014 admissions.
Independent Panel on Technical Education (2016). Report of the Independent Panel on Technical Education.
Institute for Government. (2010). MINDSPACE Influencing behaviour through public policy.
103
Ipsos MORI (2017). Young People Omnibus Survey 2017. 2017. The Sutton Trust.
Kashefpakdel, E. T., & Rehill, J. (2018). Teenage apprenticeships, Converting awareness to recruitment. Education and Employers.
Keep, E. (2009). Internal and External Incentives to Engage in Education and Training – a Framework for Analysing the Forces Acting on Individuals? ESRC funded Centre on Skills, Knowledge and Organisational Performance Cardiff and Oxford Universities.
Keep, E. (2012). Youth Transitions, the Labour Market and Entry into Employment: Some Reflections and Questions, Research Paper No. 108. SKOPE, Cardiff University.
Keep, E., & James, S. (2010). What Incentives to Learn at the Bottom End of the Labour Market? Research Paper No. 94. SKOPE, Cardiff University and SKOPE, University of Oxford.
Kersh, N., & Juul, I. (2016). Vocational Education and Training as a Career Path for Young People: Making Choices in England and Denmark; LLAKES Research Paper 52. LLAKES; Institute of Education.
Laming, M. M., Martin-Lynch, P., & Morris, A. (2016). Mature-Age Men’s Experiences Of Higher Education: Australia And England Compared. A Literature Review. . Society for Research into Higher Education.
Levin, J., & Milgrom, P. (2004). Introduction to Choice Theory.
Luchinskaya D. & Dickinson P. (Forthcoming), Adult Skills: Who gets invested in and how has this changed over time? Social Mobility Commission.
Lyonette, C., Atfield, G., & Barnes, S.-A. (2016). Richer Information On Student Views, Supporting The Hesa Review Of Destinations And Outcomes Data. Higher Education Statistics Agency (HESA).
Machin, S., McNally, S., & Ruiz-Valenzuela, J. (2018). Entry Through the Narrow Door: The Costs of Just Failing High Stakes Exams. Centre for Vocational Education Research.
McGuinness, F. (2018). Poverty in the UK: statistics - Briefing Paper Number 7096. House of Commons Library.
McIntosh, S. (2017). The Decision to Undertake an Apprenticeship, A Case Study Briefing Note 002. Centre for Vocational Education Research.
McVitty, D., & Morris, K. (2012). Never Too Late To Learn Mature students in higher education. million + and nus.
Manoogian, J. (2016). The Cognitive Bias Codex. Wikipeadia...
104
Marginson S. (2016), The worldwide trend to high participation higher education: dynamics of social stratification in inclusive systems. High Educ (2016) 72:413–434
Moote, J., & Archer, L. (2017). Failing to deliver? Exploring the current status of career education provision in England. Research Papers in Education 33:2,, 187-215.
National Audit Office (December 2017), The higher education market.
Ofsted (2013). Local accountability and autonomy in colleges.
Ofsted (2013), Going in the right direction? Careers guidance in schools from September 2012.
Patrignani, P., Conlon, G., & Hedges, S. (2017). The earnings differentials associated with vocational education and training using the Longitudinal Education Outcomes data. Centre for Vocational Education Research.
Platt, L., & Parsons, S. (2017). Is the future female? Educational and occupational aspirations of teenage boys and girls in the UK. Centre for Longitudinal Studies.
Powell, A. (2018). Apprenticeship Statistics: England; Briefing Paper Number 06113. House of Commosn Library.
Powell, A. (2018). NEET: Young People Not in Education, Employment or Training; Briefing Paper Number SN 06705. House of Commons Library.
Purcell, P. K., Elias, P. P., Green, P. A., Mizen, P. P., Simms, P. M., Whiteside, P. N., . . . Tzanakou, D. C. (2017). Present Tense, Future Imperfect? Young people’s pathways into work. ESRC.
Raconteur. (n.d.). Cognitive Bias Examples Show Why Mental Mistakes Get Made.
Samson, A. (2014). An Introduction to Behavioral Economics. Behavioral Economics Guide, Behavioraleconomics.com.
Sanders, M., Chande, R., & Selley, E. (2017). Encouraging People into University, Research report. DfE.
Schoon, I., & Lyons-Amos, M. (2018). A socio-ecological model of agency: The role of structure and agency in shaping education and employment transitions in England. Longitudinal and Life Course Studies, Volume 8 Issue 1 Pp 35 – 56.
Sebnem C. and Drotos S.M. (2016), High-Poverty Urban High School Students’ Plans for Higher Education: Weaving Their Own Safety Nets Urban Education 2016, Vol. 51(1) 3–31
105
Sir Amyas Morse KCB. (2017). The higher education market. National Audit Office.
Sisk, V. F., Burgoyne, A. P., Sun, J., Butler, J. L., & Macnamara, B. N. (2018). To What Extent and Under Which Circumstances Are Growth Mind-Sets Important to Academic Achievement? Two Meta-Analyses. Psychological Science, Vol. 29(4) 549–571.
Smith, S., Joslin, H., & Jameson, J. (2015). Progression of College Students in England to Higher Education; BIS Research Paper Number 239. Department for Business, Innovation and Skills.
Smith, S., Joslin, H., & Jameson, J. (2016). Progression of Apprentices to Higher Education – 2nd Cohort Update, BIS Research Paper Number 240. Department for Business, Innovation and Skills.
Taylor, R. (2016). A response to the Moments of Choice research - A programme to support informed choice. The Careers & Enterprise Company.
Taylor., R. (2016). Moments of Choice - How education outcomes data can support better informed career decisions. The Careers & Enterprise Company.
U.S. Department of Education (2014). WWC Review of the Report ‘Expanding College Opportunities for High-Achieving, Low Income Students’
Universities UK (2017). Patterns And Trends In UK Higher Education.
Walsham, M. (2017). Young people’s perceptions and attitudes of their post-16 options. Partnership for Young London.
Whitty, G., & Anders, J. (2012). (How) did New Labour narrow the achievement and participation gap? LLAKES.
Wilshaw, Sir Michael., (September 2015), Oral evidence: The Work of Ofsted, HC 400 Wednesday 16 September 2015. Education Committee.
Wiseman, J., Roe, P., & Hawkins, D. J. (2010). BMG Research Report - Audit of Factors Affecting Participation and Achievement in Learning. LSC.
106
9. Websites consulted Table 16: Websites with relevant literature
Organisation Web address AELP https://www.aelp.org.uk/resource-and-information-centre/ Association of Colleges
https://www.aoc.co.uk/
Behavioural Insights http://www.behaviouralinsights.co.uk/ Campbell Collaboration
https://www.campbellcollaboration.org/
Career and Enterprise Company
https://www.careersandenterprise.co.uk/research
CBI http://www.cbi.org.uk/ Cedefop http://www.cedefop.europa.eu/en Centre for Longitudinal Studies
http://www.cls.ioe.ac.uk/default.aspx
Centre for Research on Learning and Life Chances
http://www.llakes.ac.uk/
Centre for the Economics of Education
http://cee.lse.ac.uk/
Children and Young People Now
https://www.cypnow.co.uk/
Cochrane Collaboration
http://www.cochrane.org/
Centre for Vocational Education and Research
http://cver.lse.ac.uk/publications/default.asp
DfE, DWP, BIS etc. https://www.gov.uk/government/publications DG Employment, Social Affairs & Inclusion
http://ec.europa.eu/social/main.jsp?langId=en&catId=22
Economics of Education in Europe
http://www.eenee.de/eeneeHome.html
Edge Foundation http://www.edge.co.uk/ Education and Employers
https://www.educationandemployers.org/research-main/
Education and Training Foundation
http://www.et-foundation.co.uk/
107
Organisation Web address Education Endowment Foundation
https://educationendowmentfoundation.org.uk/
EPPI Centre http://eppi.ioe.ac.uk/cms/Default.aspx?tabid=53 European Expert Network on Economics of Education
http://www.eenee.de/eeneeHome/EENEE.html
Gatsby http://www.gatsby.org.uk/ ILO http://www.ilo.org/global/publications/lang--en/index.htm Institute for Apprenticeships
https://www.instituteforapprenticeships.org/
IPPR https://www.ippr.org/ Joseph Rowntree Foundation
https://www.jrf.org.uk/
Learning and Work Institute
http://www.learningandwork.org.uk/
Living Map of Jobs Innovators
https://jobsinnovators.org/
National Foundation for Educational Research (NfER)
https://www.nfer.ac.uk/
National Institute of Economic and Social Research
https://www.niesr.ac.uk/publications/search
OECD - education http://www.oecd-ilibrary.org/education;jsessionid=1m44398oar1y8.x-oecd-live-02
OECD - employment http://www.oecd-ilibrary.org/employment;jsessionid=1m44398oar1y8.x-oecd-live-02
OECD library http://www.oecd-ilibrary.org/ Ofsted https://www.gov.uk/government/organisations/ofsted Paul Hamlyn Foundation
https://www.phf.org.uk/publications/
Poverty Reduction in Europe: Social Policy and Innovation (ImPRovE)
http://improve-research.eu/
Sutton Trust https://www.suttontrust.com/research/

108
Organisation Web address UK Commission for Employment and Skills
https://www.gov.uk/government/organisations/uk-commission-for-employment-and-skills
UNESCO http://www.unesco.org/ulis/en/advanced_search.html#6401922 University College London
http://discovery.ucl.ac.uk/
VOCEDplus http://www.voced.edu.au/ Work Foundation http://www.theworkfoundation.com/wf-reports/

© Crown Copyright 2019
Reference: DFE-RR858
ISBN: 978-1-83870-021-8
The views expressed in this report are the authors’ and do not necessarily reflect those of the Department for Education.
Any enquiries regarding this publication should be sent to us at: www.education.gov.uk/contactus
This document is available for download at www.gov.uk/government/publications