Embed Size (px)
Citation preview
WHO ARE THE CHILDREN?Choctaw Nation Head Start
Prepared by the Community Service CouncilJuly 2011
TO TELL THE STORY…
Demographic Trends Economics and Employment Child Indicators
Dem
og
rap
hic
s

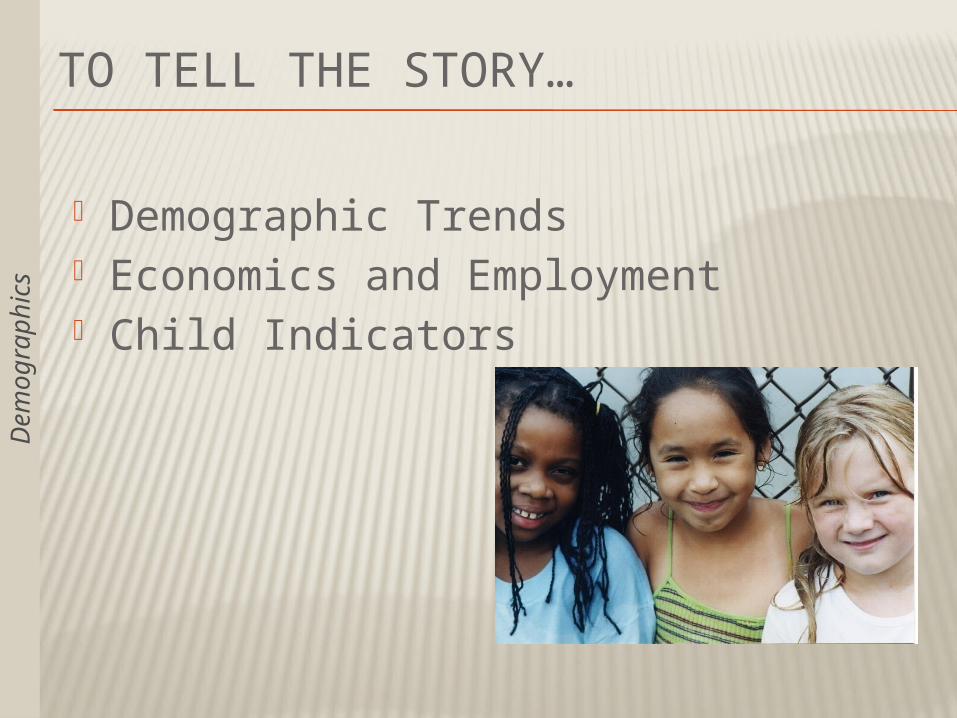
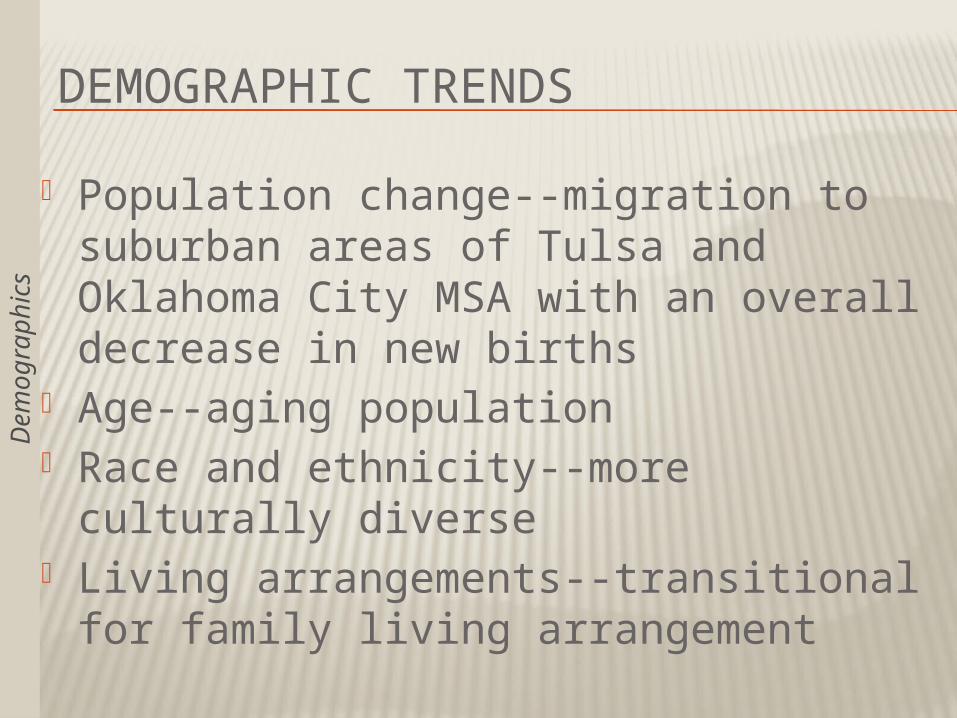
DEMOGRAPHIC TRENDS
DEMOGRAPHIC TRENDS
Population change--migration to suburban areas of Tulsa and Oklahoma City MSA with an overall decrease in new births
Age--aging population Race and ethnicity--more culturally
diverse Living arrangements--transitional for
family living arrangement
Dem
og
rap
hic
s

Population Trends for Total Population and Under Age 5Bryan County, 1980 through 2030
Source: US Census Bureau, 1980, 1990, 2000 & 2010 Censuses; Population Estimates Program.
1980 1990 2000 2010 2020(proj.)
2030(proj.)
0
10,000
20,000
30,000
40,000
50,000
60,000
Under age 5 2,080 2,143 2,369 2,830 2,952 3,163
Total Population 30,535 32,089 36,534 42,416 44,930 49,172

Prepared by the Community Service Council of Greater Tulsa
Dem
og
rap
hic
sRace Comparison for Total Population and Children under 5
State of Oklahoma and Bryan County, 2010
Source: US Census Bureau, 2010 Census.
59.3%
8.2%
11.0%
1.6%
19.8%
63.5%
1.3%
18.1%
0.5%
16.6%
72.2%
7.4%
8.6%
1.7%
10.1%
76.2%
1.5%
12.9%
0.5%
8.8%
White Black American Indian Asian Other/2+ races
Oklahoma Bryan County
Under 5
Total Population
N = 264,126
N = 3,751,351
Hispanic16.8%
Hispanic8.9%
N = 2,830
N = 42,416
Hispanic11.0%
Hispanic5.0%
Prepared by the Community Service Council of Greater Tulsa
Dem
og
rap
hic
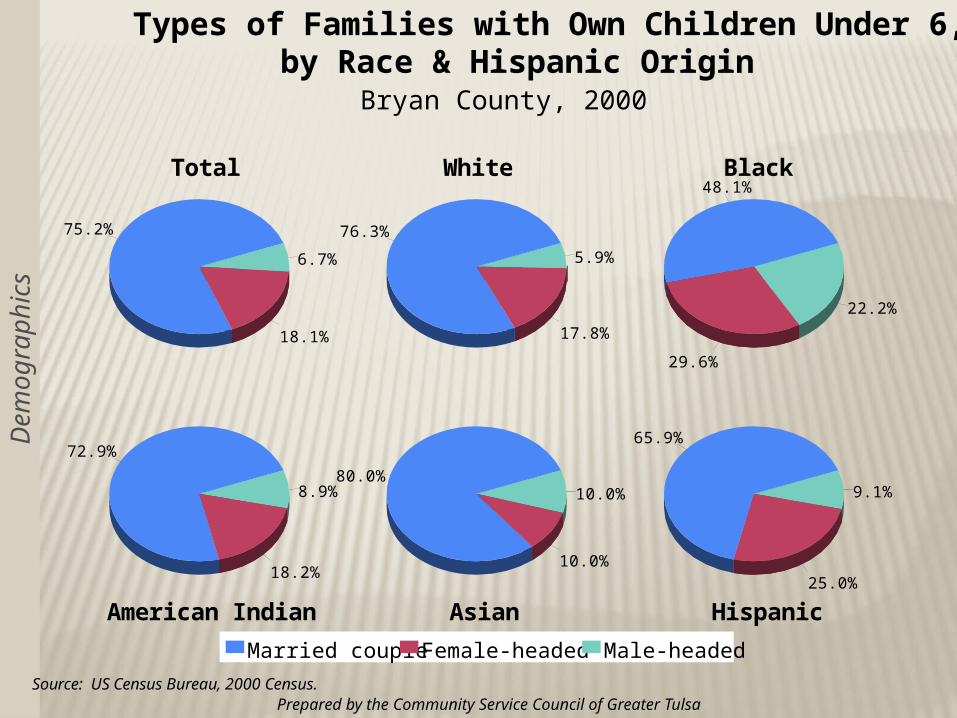
sTypes of Families with Own Children Under 6,
by Race & Hispanic OriginBryan County, 2000
Source: US Census Bureau, 2000 Census.
75.2%
18.1%
6.7%
76.3%
17.8%
5.9%
48.1%
29.6%
22.2%
72.9%
18.2%
8.9%80.0%
10.0%
10.0%
65.9%
25.0%
9.1%
Married couple Female-headed Male-headed
Total White Black
American Indian Asian Hispanic

ECONOMICS AND EMPLOYMENT
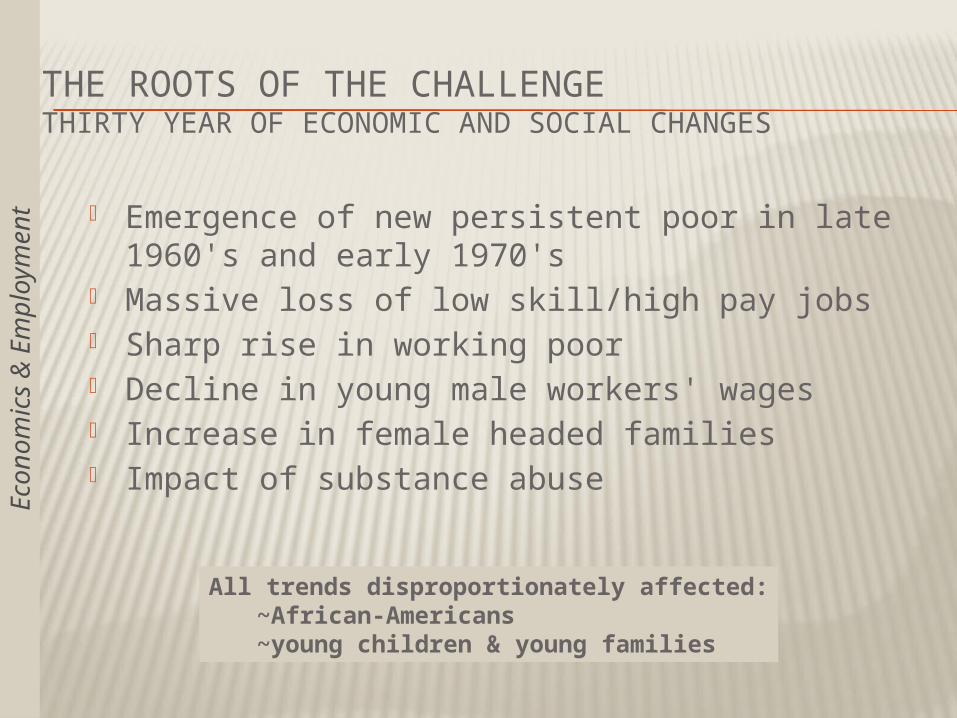
THE ROOTS OF THE CHALLENGETHIRTY YEAR OF ECONOMIC AND SOCIAL CHANGES
Emergence of new persistent poor in late 1960's and early 1970's
Massive loss of low skill/high pay jobs Sharp rise in working poor Decline in young male workers' wages Increase in female headed families Impact of substance abuse
All trends disproportionately affected:~African-Americans~young children & young families
Eco
nom
ics
& E
mp
loym
en
t
Prepared by the Community Service Council of Greater Tulsa
Source: Hodgkinson, Harold, "The Client," Education Demographer, 1988.
1900 - 1940(Pre-War)
1940 - 1990(Post WWII)
1990 - ?(New Millenia)
0%
20%
40%
60%
80%
100%
Poor - 75%
Poor - 20%Poor - 10%
Rich - 20%
Middle - 60%
Rich - 5% Rich - 10%
Middle - 20%
Middle - 80%
The trend: housing patterns and income mirror the job structure, with more rich, more poor, and fewer in the middle -- the "hourglass effect"
The Overall Dominant Trend...The Shrinking Middle Class
Eco
nom
ics
& E
mp
loym
en
t
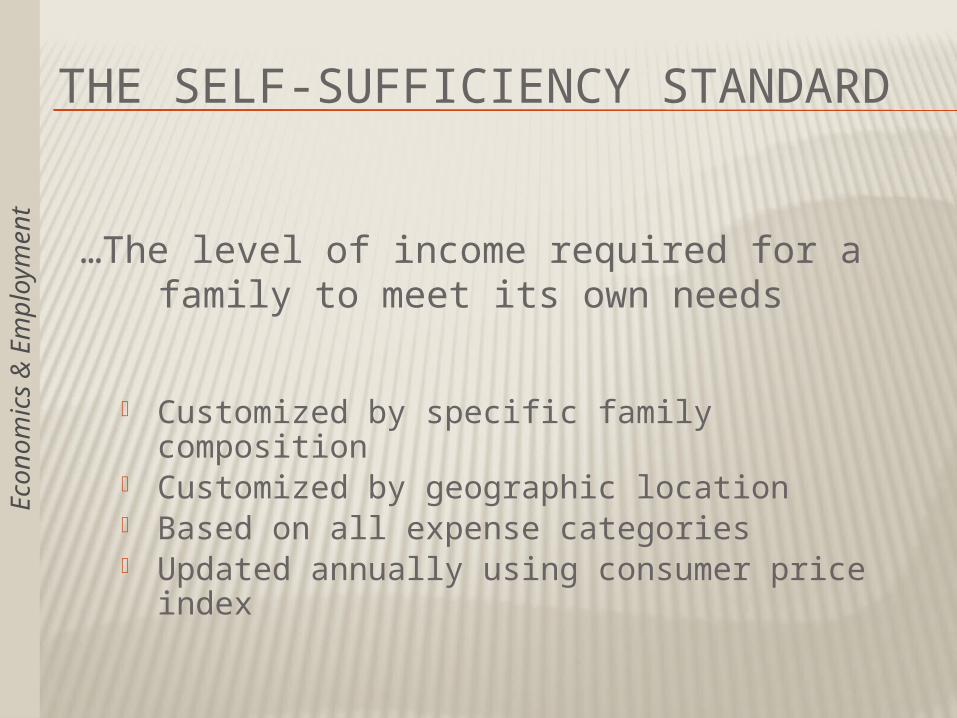
THE SELF-SUFFICIENCY STANDARD
Customized by specific family composition Customized by geographic location Based on all expense categories Updated annually using consumer price
index
…The level of income required for a family to meet its own needs
Eco
nom
ics
& E
mp
loym
en
t
Eco
nom
ics
& E
mp
loym
en
t
Self-Sufficiency
Wage(annual)
Poverty Guidelines
(annual)
Dollar Difference
Self-SufficiencyPercent of
Poverty
One person
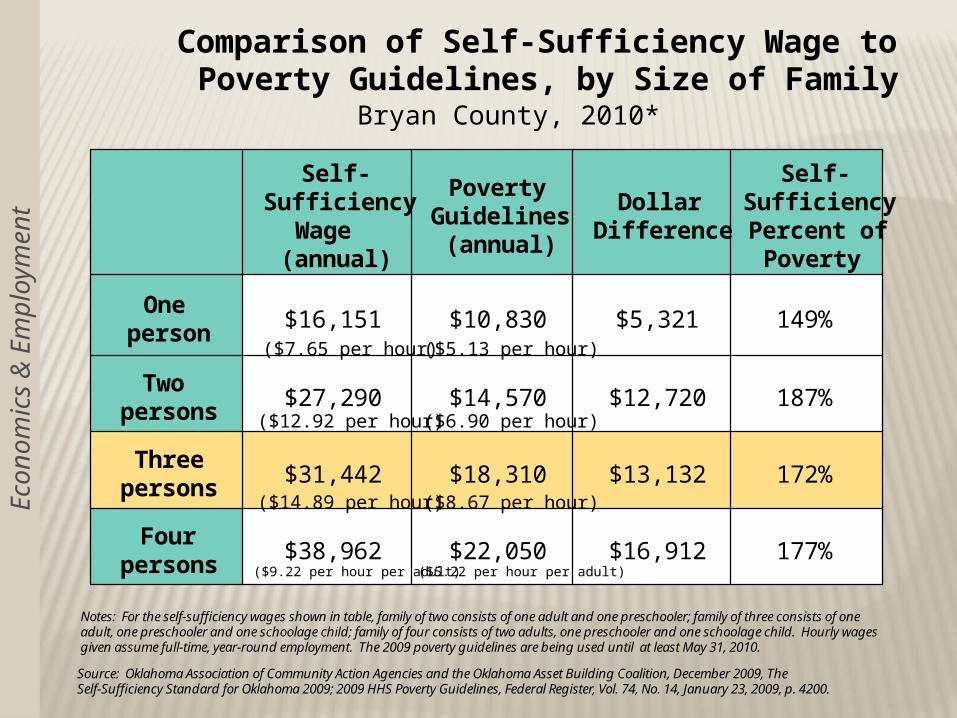
$16,151 $10,830 $5,321 149%
Two persons
$27,290 $14,570 $12,720 187%
Three persons
$31,442 $18,310 $13,132 172%
Four persons
$38,962 $22,050 $16,912 177%
Comparison of Self-Sufficiency Wage to Poverty Guidelines, by Size of Family
Bryan County, 2010*
Source: Oklahoma Association of Community Action Agencies and the Oklahoma Asset Building Coalition, December 2009, The Self-Sufficiency Standard for Oklahoma 2009; 2009 HHS Poverty Guidelines, Federal Register, Vol. 74, No. 14, January 23, 2009, p. 4200.
($7.65 per hour)
($12.92 per hour)
($14.89 per hour)
($9.22 per hour per adult)
Notes: For the self-sufficiency wages shown in table, family of two consists of one adult and one preschooler; family of three consists of one adult, one preschooler and one schoolage child; family of four consists of two adults, one preschooler and one schoolage child. Hourly wages given assume full-time, year-round employment. The 2009 poverty guidelines are being used until at least May 31, 2010.
($5.13 per hour)
($6.90 per hour)
($8.67 per hour)
($5.22 per hour per adult)
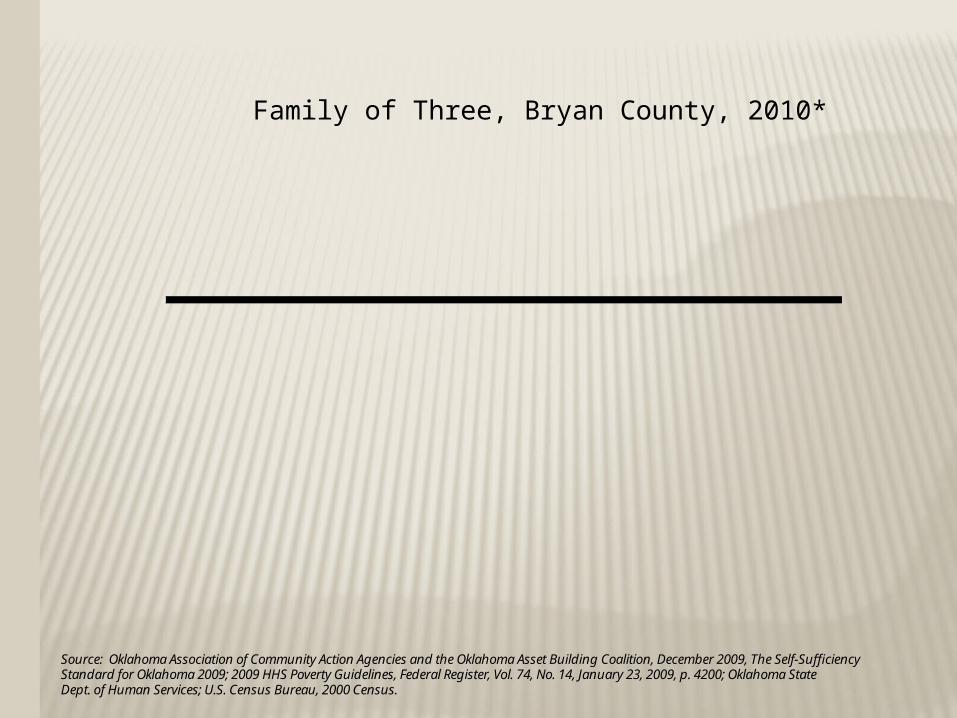
Family of Three, Bryan County, 2010*
Source: Oklahoma Association of Community Action Agencies and the Oklahoma Asset Building Coalition, December 2009, The Self-Sufficiency Standard for Oklahoma 2009; 2009 HHS Poverty Guidelines, Federal Register, Vol. 74, No. 14, January 23, 2009, p. 4200; Oklahoma State Dept. of Human Services; U.S. Census Bureau, 2000 Census.
$40,683
$33,207
$21,019
$10,309
$15,312$18,310
$33,874
$14,159
WelfareWage
MinimumWage
PovertyWage
185% PovertyWage
Median FamilyIncome
(2000 census)
$0
$10,000
$20,000
$30,000
$40,000
$50,000Annual Wage
Self-Sufficiency Wage = $31,442 ($14.89/hr)
Comparison of Wages: Self-Sufficiency, Welfare, Minimum, Poverty, 185% of Poverty, and Median Family Income
($4.88/hr) ($7.25/hr) ($8.67/hr) ($16.04/hr)
Notes: For the self-sufficiency wage, family of three consists of one adult, one preschooler and one schoolage child. Hourly wages given assume full-time, year-round employment. The 2009 poverty guidelines are being used until at least May 31, 2010. Welfare wage is the combined value of TANF, SNAP, & WIC.
Married-couple families w/ children <18($19.26/hr)
All families w/ children <18
Male-headed families w/ children <18
Female-headed families w/ children <18
($9.95/hr)
($15.72/hr)
($6.70/hr)
Eco
nom
ics
& E
mp
loym
en
t

Monthly Budget Distribution for Typical Family of Three Earning Self-Sufficiency Wage
Bryan County, 2010
Source: Oklahoma Association of Community Action Agencies and the Oklahoma Asset Building Coalition, December 2009, The Self-Sufficiency Standard for Oklahoma 2009.
Housing$563
Child Care$744
Food$483
Transportation$263
Health Care$394
Miscellaneous$245
21%
28%
18%
10%
15%
9%
Notes: Family of three in this example consists of one adult, one preschooler and one schoolage child.
Self-sufficiency wage = $2,620 per month.
Tax credit$71
Eco
nom
ics
& E
mp
loym
en
t
Prepared by the Community Service Council of Greater Tulsa
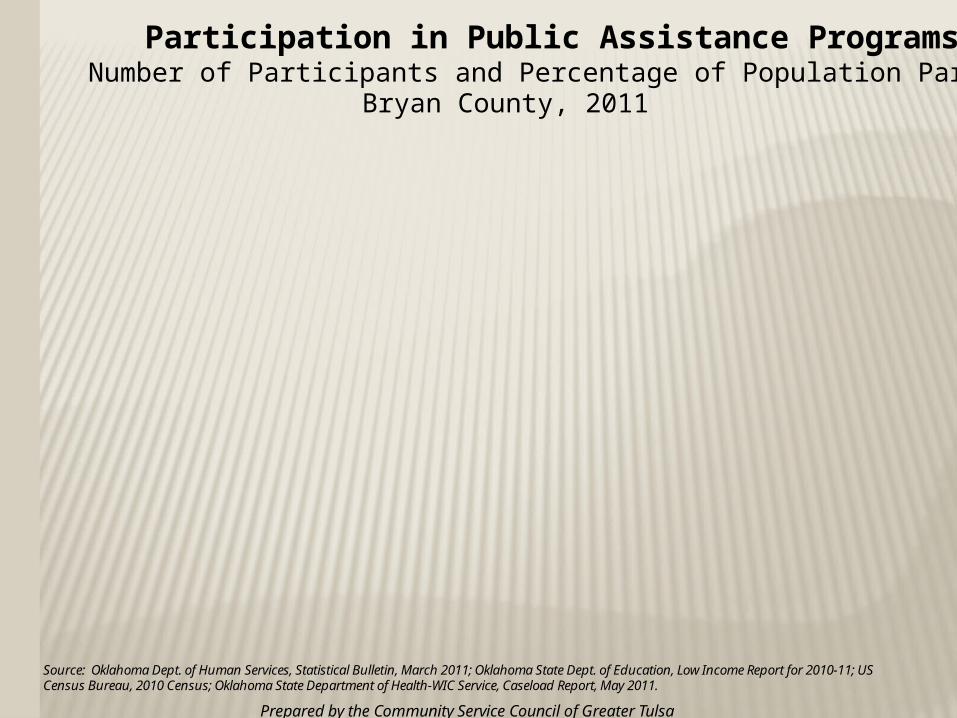
Participation in Public Assistance ProgramsNumber of Participants and Percentage of Population Participating
Bryan County, 2011
Source: Oklahoma Dept. of Human Services, Statistical Bulletin, March 2011; Oklahoma State Dept. of Education, Low Income Report for 2010-11; US Census Bureau, 2010 Census; Oklahoma State Department of Health-WIC Service, Caseload Report, May 2011.
9,775
5,870
304
501
214
6,837
96
3,012
465
23%
55.4%
51%
18.1%
7.6%
16.1%
1%
64.1%
9.9%
Soonercare Total (185%/100%) (6/11)
Soonercare <19 (185%) (6/11)
WIC Infants (185%) (5/11)
WIC age 1-5 (185%) (5/11)
Child Care Subsidy <5 (185%) (3/11)
SNAP Total (130%) (3/11)
TANF <18 (50%) (3/11)
Elem. School Free Lunch (130%)(SY 2010-11)
Elem. School Reduced Lunch (185%)(SY 2010-11)
03,0006,0009,00012,000
Number of Participants
0% 20% 40% 60% 80%
Percent of Population
Eco
nom
ics
& E
mp
loym
en
t
Prepared by the Community Service Council of Greater Tulsa
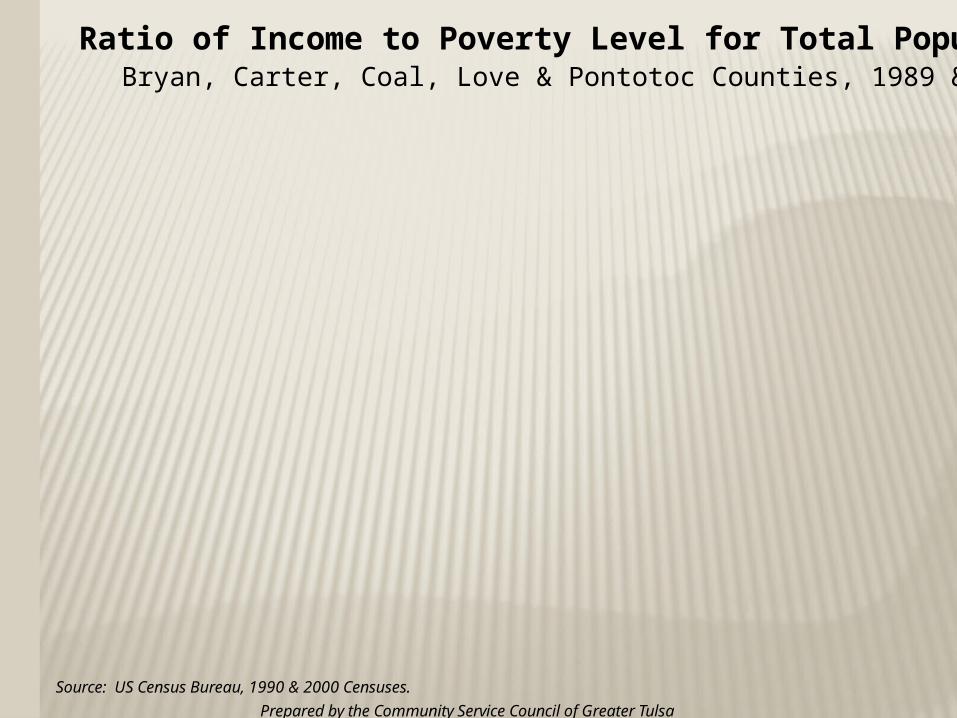
Ratio of Income to Poverty Level for Total PopulationBryan, Carter, Coal, Love & Pontotoc Counties, 1989 & 1999
Source: US Census Bureau, 1990 & 2000 Censuses.
Bryan Carter Coal Love Pontotoc Bryan Carter Coal Love Pontotoc0%
10%
20%
30%
40%
50%
60%
Percentage of population
Below 100% Below 185% Below 200%
Below 100% 24.5% 19.7% 27.4% 15.9% 21.7% 18.4% 16.6% 23.1% 11.8% 16.5%
Below 185% 48.2% 39.5% 53.9% 39.2% 45.8% 41.7% 38.9% 47.6% 34.6% 40.5%
Below 200% 51.2% 41.8% 56.7% 42.6% 49.1% 44.7% 41.8% 52.7% 37.8% 43%
1989 1999
Eco
nom
ics
& E
mp
loym
en
t

Prepared by the Community Service Council of Greater Tulsa
Median Family IncomeBy Family Type and Presence of Children under 18
State of Oklahoma, Bryan & Carter Counties, 1999
Source: U.S. Census Bureau, 2000 Census.
$48,369
$63,779
$19,611
$32,857
$33,207
$40,683
$14,159
$21,019
$35,133
$43,499
$13,491
$21,034
$56,592
$61,881
$35,886
$41,811
$34,494
$36,263
$22,155
$33,125
$37,473
$41,171
$25,280
$27,500
Oklahoma
All families
Married-couple
Female-headed
Male-headed
Bryan Co.
All families
Married-couple
Female-headed
Male-headed
Carter Co.
All families
Married-couple
Female-headed
Male-headed
$0$25,000$50,000$75,000
Families WITH children
$0 $25,000 $50,000 $75,000
Families WITHOUT children
Eco
nom
ics
& E
mp
loym
en
t

Prepared by the Community Service Council of Greater Tulsa
Educational Attainment for Persons Age 25 & OlderBryan, Carter & Coal Counties, 2000
Source: US Census Bureau, 2000 Census.
Less than high school
High school graduate
Some college
Associate degree
Bachelor's degree
Master's degree
Professional school degree
Doctorate degree
0%
10%
20%
30%
40%
50%Percent of persons 25+
Bryan Co. Carter Co. Coal Co. Love Co. Pontotoc Co.
Bryan Co. 25.1% 31.8% 21.5% 3.7% 11.2% 4.8% 0.8% 1.1%
Carter Co. 23% 36.8% 21.3% 3.8% 10.4% 3.4% 0.9% 0.5%
Coal Co. 31.4% 37% 17.1% 2.2% 7.2% 3.9% 1.1% 0.3%
Love Co. 26.4% 41.4% 18.6% 2.8% 6.8% 3% 0.9% 0.2%
Pontotoc Co. 21.8% 31.7% 21.9% 2.8% 12.6% 6.7% 1.3% 1.2%
Eco
nom
ics
& E
mp
loym
en
t

Prepared by the Community Service Council of Greater Tulsa
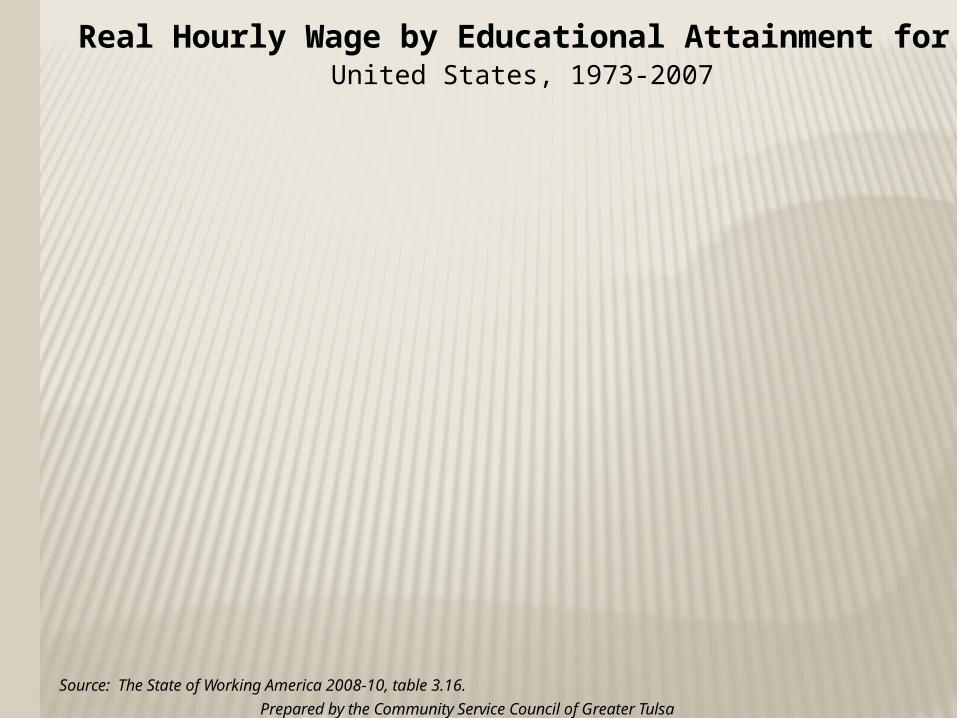
Real Hourly Wage by Educational AttainmentUnited States, 1973-2007
Source: The State of Working America 2008-10, table 3.15.
1973
1975
1977
1979
1981
1983
1985
1987
1989
1991
1993
1995
1997
1999
2001
2003
2005
2007
$0
$10
$20
$30
$40
Real hourly wage (2007 dollars)
Less than high school High school Some college
College degree Advanced degree
Eco
nom
ics
& E
mp
loym
en
t
Prepared by the Community Service Council of Greater Tulsa
Real Hourly Wage by Educational Attainment for MenUnited States, 1973-2007
Source: The State of Working America 2008-10, table 3.16.
1973
1975
1977
1979
1981
1983
1985
1987
1989
1991
1993
1995
1997
1999
2001
2003
2005
2007
$0
$10
$20
$30
$40
Real hourly wage (2007 dollars)
Less than high school High school Some college
College degree Advanced degree
Eco
nom
ics
& E
mp
loym
en
t

Prepared by the Community Service Council of Greater Tulsa
Real Hourly Wage by Educational Attainment for WomenUnited States, 1973-2007
Source: The State of Working America 2008-10, table 3.17.
1973
1975
1977
1979
1981
1983
1985
1987
1989
1991
1993
1995
1997
1999
2001
2003
2005
2007
$0
$10
$20
$30
$40
Real hourly wage (2007 dollars)
Less than high school High school Some college
College degree Advanced degree
Eco
nom
ics
& E
mp
loym
en
t
Prepared by the Community Service Council of Greater Tulsa
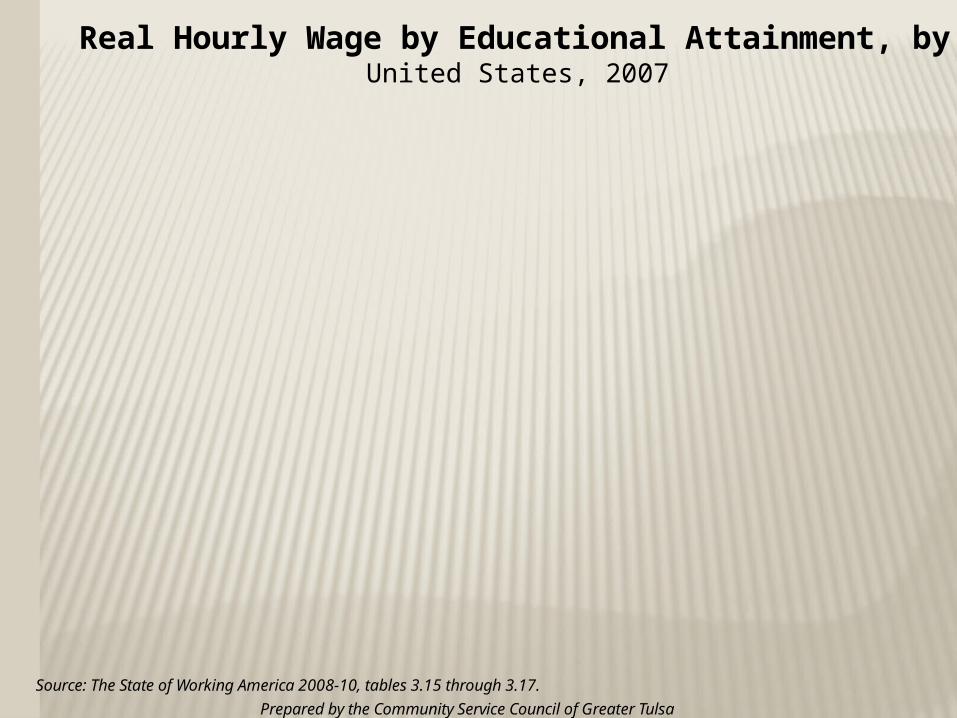
Real Hourly Wage by Educational Attainment, by SexUnited States, 2007
Source: The State of Working America 2008-10, tables 3.15 through 3.17.
Less than high school High school College degree Advanced degree$0.00
$10.00
$20.00
$30.00
$40.00Real hourly wage (2007 dollars)
Both sexes Men Women
Both sexes $11.38 $15.01 $26.51 $33.57
Men $12.32 $16.68 $30.36 $38.10
Women $9.43 $13.10 $22.63 $28.77
Eco
nom
ics
& E
mp
loym
en
t

Prepared by the Community Service Council of Greater Tulsa
Unemployment RatesBryan, Carter, Coal, Love & Pontotoc Counties, 1990 - 2010
Source: U.S. Department of Labor, Bureau of Labor Statistics.
1990 1991 1992 1993 1994 1995 1996 1997 1998 1999 2000 2001 2002 2003 2004 2005 2006 2007 2008 2009 Apr.'10
0.0
3.0
6.0
9.0
12.0
15.0
Bryan Co. 5.9 7.3 6.4 5.4 5.0 4.1 3.8 3.6 2.9 2.5 3.0 3.4 3.9 4.7 4.1 3.8 3.6 3.4 3.4 5.3 5.0
Love Co. 5.7 5.7 5.5 7.1 6.7 6.4 4.7 4.2 5.0 4.1 3.6 3.9 4.5 5.0 6.2 4.3 3.6 3.0 2.8 5.5 4.5
Pontotoc Co. 6.6 7.9 7.5 6.5 5.6 6.6 5.5 4.9 5.3 3.4 3.3 3.9 4.9 5.1 6.0 4.4 3.7 3.5 3.1 5.5 4.9
Carter Co. 6.2 7.0 6.7 6.2 6.1 6.6 5.5 5.7 6.6 5.2 3.8 3.9 4.9 4.9 4.8 4.4 3.9 3.4 3.2 5.9 5.2
Coal Co. 12.3 13.4 11.6 10.5 9.5 9.1 8.5 9.0 8.8 6.6 4.3 5.4 6.6 12.4 10.6 7.1 5.9 6.1 4.8 8.6 7.2
Eco
nom
ics
& E
mp
loym
en
t
CHILD INDICATORS

WHY ARE CHILDREN AT RISK?
Lack of health insurance Limited access to preventative
services Living in high risk families Living in a state with a high level of
premature death
Prepared by the Community Service Council of Greater Tulsa
Ch
ild In
dic
ato
rs
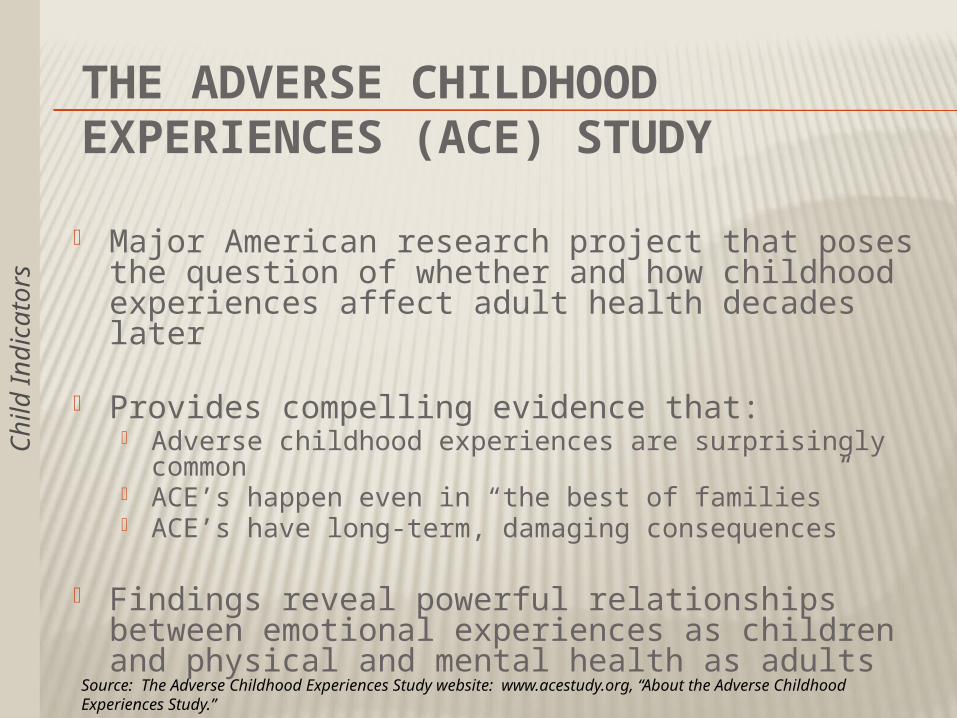
THE ADVERSE CHILDHOOD EXPERIENCES (ACE) STUDY
Major American research project that poses the question of whether and how childhood experiences affect adult health decades later
Provides compelling evidence that: Adverse childhood experiences are surprisingly common ACE’s happen even in “the best of families” ACE’s have long-term, damaging consequences
Findings reveal powerful relationships between emotional experiences as children and physical and mental health as adults
Source: The Adverse Childhood Experiences Study website: www.acestudy.org, “About the Adverse Childhood Experiences Study.”
Ch
ild In
dic
ato
rs
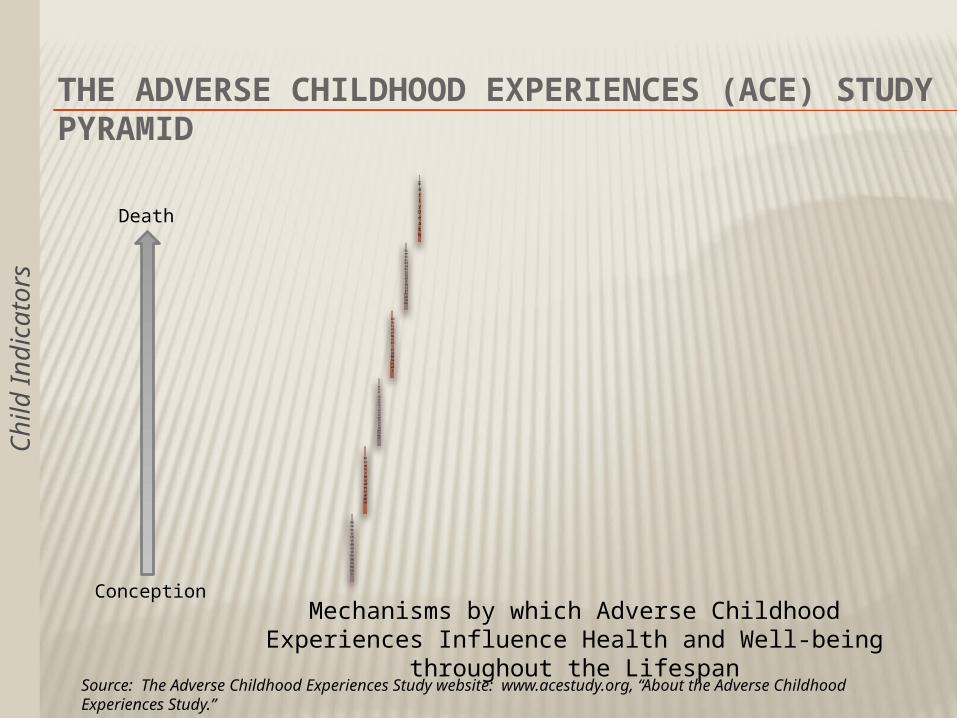
THE ADVERSE CHILDHOOD EXPERIENCES (ACE) STUDY PYRAMID
Early Death
Disease, Disability and Social Problems
Adoption of Health-
risk
Behaviors
Social, Emotional and
Cognitive
Impairment
Disrupted Neurodevelopment
Adverse Childhood Experiences
Ch
ild In
dic
ato
rs
Conception
Death
Mechanisms by which Adverse Childhood Experiences Influence Health and Well-being throughout the Lifespan
Source: The Adverse Childhood Experiences Study website: www.acestudy.org, “About the Adverse Childhood Experiences Study.”

ADVERSE CHILDHOOD EXPERIENCES…
Recurrent physical abuse
Recurrent emotional abuse
Sexual abuse An alcohol or drug
abuser An incarcerated
household member
Someone who is chronically depressed, suicidal, institutionalized or mentally ill
Mother being treated violently
One or no parents Emotional or
physical neglectSource: The Adverse Childhood Experiences Study website: www.acestudy.org, “What are Adverse Childhood Experieinces (ACE’s).”
Ch
ild In
dic
ato
rs
…GROWING UP IN A HOUSEHOLD WITH:
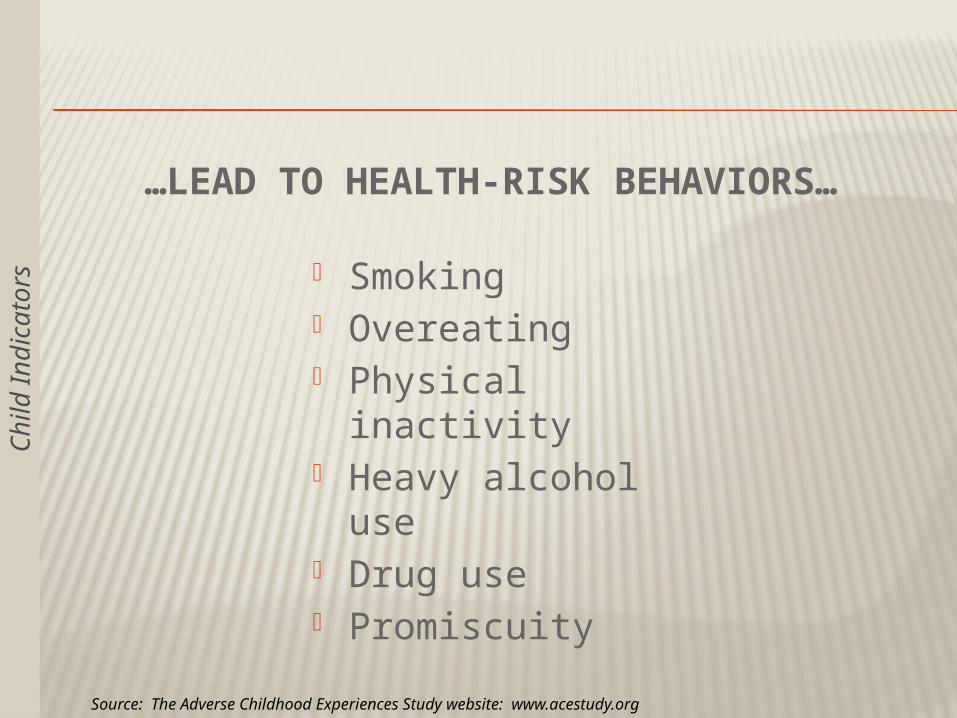
…LEAD TO HEALTH-RISK BEHAVIORS…
Smoking Overeating Physical inactivity Heavy alcohol use Drug use Promiscuity
Source: The Adverse Childhood Experiences Study website: www.acestudy.org
Ch
ild In
dic
ato
rs

…WHICH CAUSE DISEASE, DISABILITY AND SOCIAL PROBLEMS IN ADULTHOOD
Heart disease Cancer Chronic lung and
liver disease Stroke Diabetes Sexually transmitted
diseases
Nicotine addiction Alcoholism Drug addiction Obesity Depression Suicide Injuries Unintentional
pregnancy
Source: Felitti, Vincent J., “The Relationship of Adverse Childhood Experiences to Adult Health: Turning gold into lead;” CDC Media Relations, May 14, 1998, “Adult Health Problems Linked to Traumatic Childhood Experiences.”
Ch
ild In
dic
ato
rs
Ch
ild In
dic
ato
rs
Prepared by the Community Service Council of Greater Tulsa
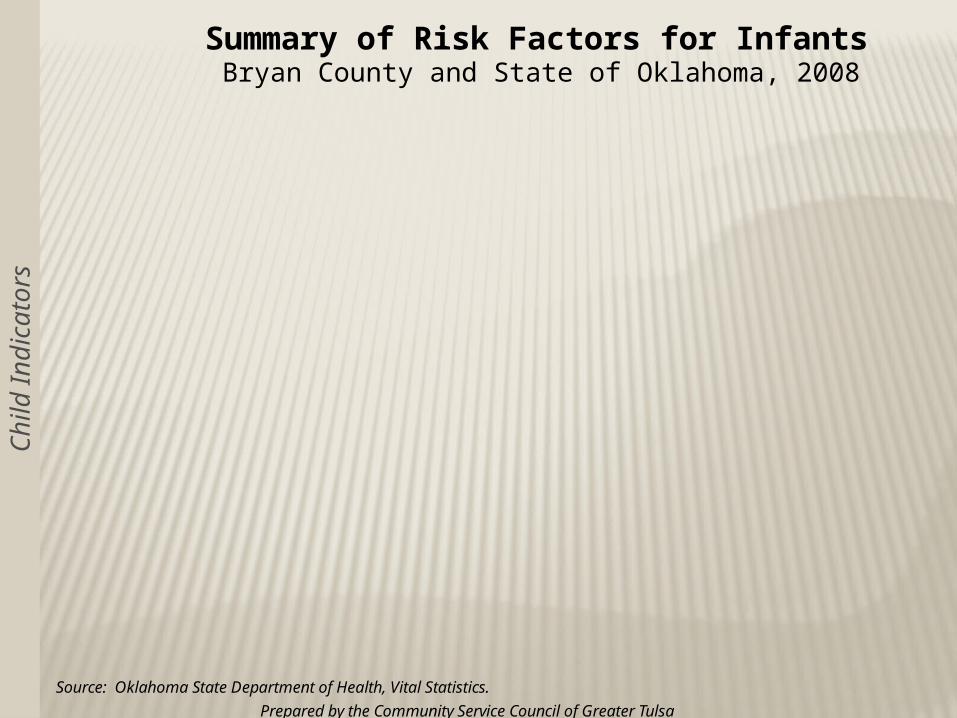
Summary of Risk Factors for InfantsBryan County and State of Oklahoma, 2008
Source: Oklahoma State Department of Health, Vital Statistics.
13.7%
42.3%
5.4%
21.4%
6.9%
1.4%
34.8%
20.5%
11%
17.8%
46.1%
6%
22.5%
7.2%
0.2%
36.2%
22%
8.8%
Teen mother(age 15-19)
Unmarried mother
Poor prenatal care(3rd trimester/no care)
Mother w/ <12th gradeeducation
Low birthweight(1500-2499 grams)
Very low birthweight(<1500 grams)
Short birth spacing(<24 mos. apart)
Very short birth spacing(<18 mos. apart)
Premature(<37 weeks gest.)
0% 10% 20% 30% 40% 50% 60%
Percent of Births
Bryan Co.
Oklahoma
Bryan County births: 614Oklahoma births: 54,753
Ch
ild In
dic
ato
rs
Prepared by the Community Service Council of Greater Tulsa
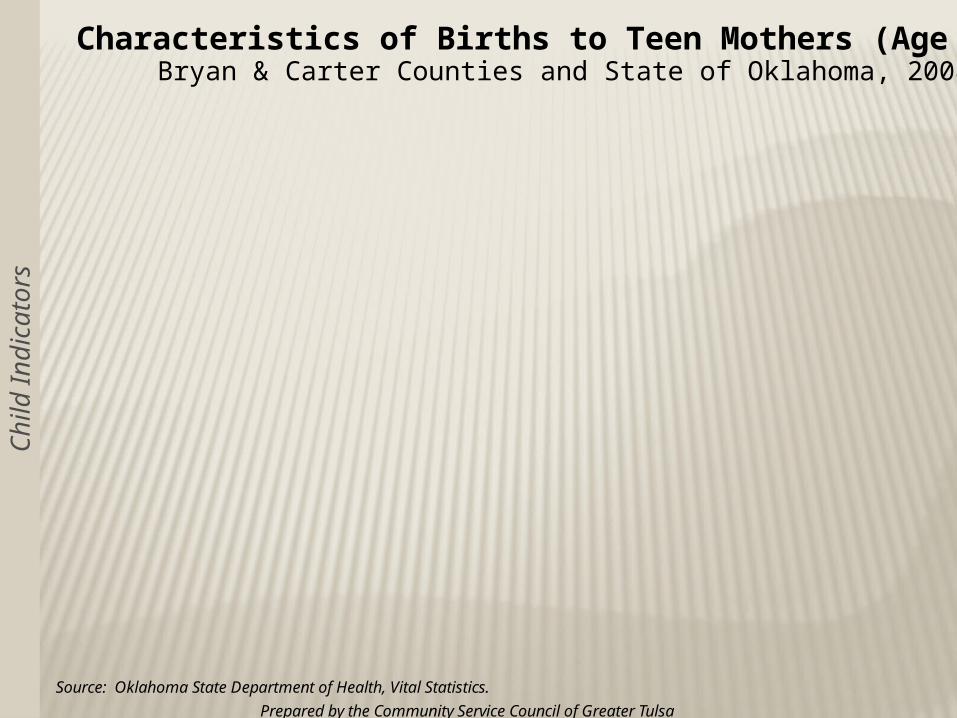
Characteristics of Births to Teen Mothers (Age 15-19)Bryan & Carter Counties and State of Oklahoma, 2008
Source: Oklahoma State Department of Health, Vital Statistics.
81.6%
7.1%
54.1%
7.9%
1.8%
67.6%
46.9%
11.6%
20.8%
3.6%
78.9%
8.3%
49.5%
10.1%
58.5%
43.9%
12.8%
26.6%
9.2%
Unmarried
Poor prenatal care(3rd trimester/no care)
Mother w/ <12th gradeeducation
Low birthweight(1500-2499 grams)
Very low birthweight(<1500 grams)
Short birth spacing(<24 mos. apart)
Very short birth spacing(<18 mos. apart)
Premature(<37 weeks gest.)
1+ previous births
2+ previous births
0% 20% 40% 60% 80% 100%
Percent of Teen Births
Bryan Co.
Oklahoma
Bryan County births to teens: 109Bryan County teen birth rate: 75.6 (per 100,000 females age 15-19)
Oklahoma births to teens: 7,492Oklahoma teen birth rate: 61.6 (per 100,000 females age 15-19)
Prepared by the Community Service Council of Greater Tulsa
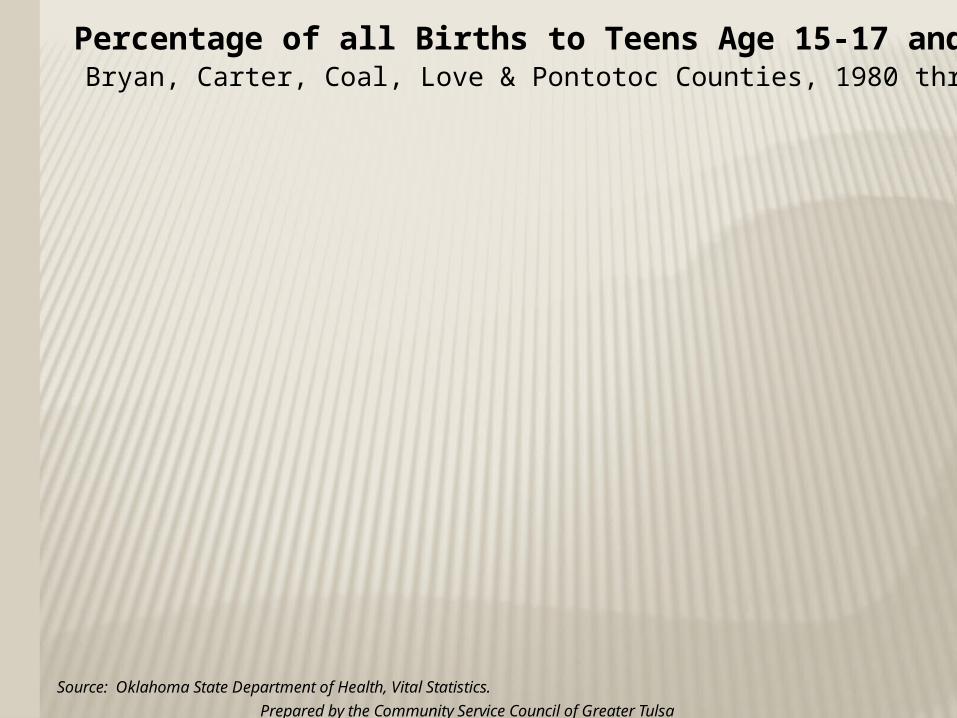
Percentage of all Births to Teens Age 15-17 and 18-19Bryan, Carter, Coal, Love & Pontotoc Counties, 1980 through 2007
Source: Oklahoma State Department of Health, Vital Statistics.
'80 '90 '00 '07 '80 '90 '00 '07 '80 '90 '00 '07 '80 '90 '00 '07 '80 '90 '00 '070
5
10
15
20Percent of births
Births 15-17 7 6.8 5.2 5.5 6.8 8 4.4 4.6 10.1 12.8 7.8 10.1 12.9 5 9.6 6.2 6 4.5 4.5 6.4
Births 18-19 14.6 16 13.8 12.2 18.3 9.5 12.3 9.1 13.9 16 16.9 15.9 12.9 13.4 12.8 6.9 11 11.2 10.8 10.6
Bryan CoalCarter Love Pontotoc
Ch
ild In
dic
ato
rs
Prepared by the Community Service Council of Greater Tulsa
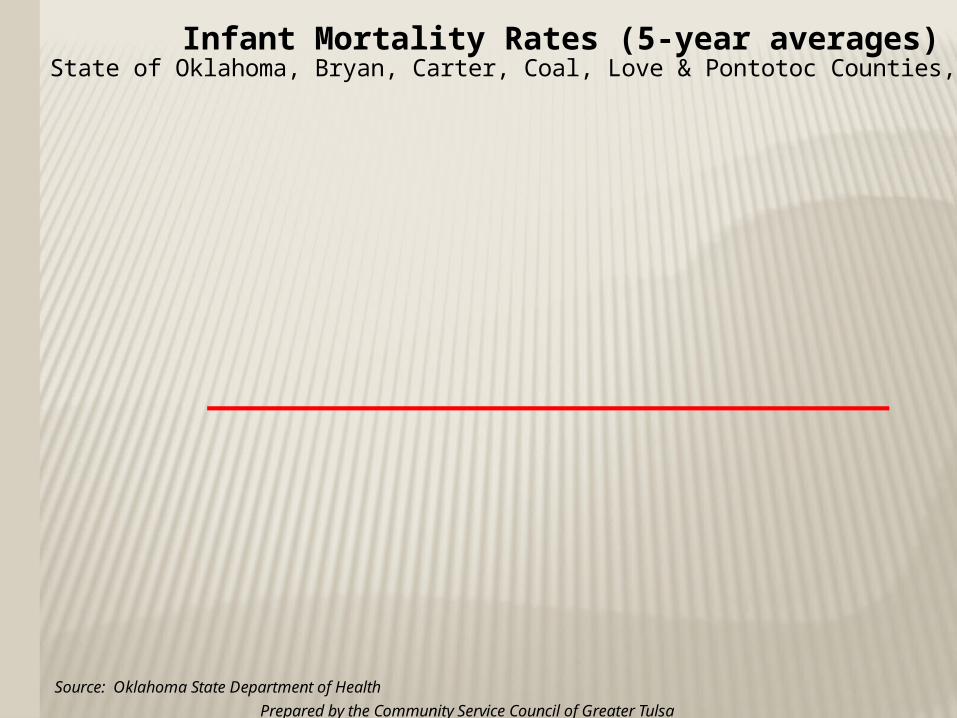
Infant Mortality Rates (5-year averages)State of Oklahoma, Bryan, Carter, Coal, Love & Pontotoc Counties, 1980 to 2006
Source: Oklahoma State Department of Health
19
80
-84
19
81
-85
19
82
-86
19
83
-87
19
84
-88
19
85
-89
19
86
-90
19
87
-91
19
88
-92
19
89
-93
19
90
-94
19
91
-95
19
92
-96
19
93
-97
19
94
-98
19
95
-99
19
96
-20
00
19
97
-20
01
19
98
-20
02
19
99
-20
03
20
00
-04
20
01
-05
20
02
-06
0
5
10
15
20
25
30Number of infant deaths per 1,000 live births
Oklahoma Bryan Co. Carter Co.
Coal Co. Love Co. Pontotoc Co.
Oklahoma 11.2 10.9 10.6 10.1 9.8 9.3 9 8.9 8.7 8.7 8.7 8.6 8.4 8.2 8.2 8.2 8.3 8 8.1 8 7.9 7.8 8
Bryan Co. 10.4 9.9 9.7 10 9.6 11.1 9.6 8.3 6.9 5.6 4.6 5.1 5.5 7.8 7.6 7 6.3 7 5.3 4.8 7.2 9.5 8.6
Carter Co. 12.9 12.3 12 10.1 8.7 7.9 7.3 5.2 6.5 6.2 7.8 7.9 8.3 6.7 6.9 5.1 4.6 5.6 5.2 4.6 5.2 6.4 6.2
Coal Co. 23 23.8 23.4 27.2 20.2 10.8 7.5 12.8 7.6 9.8 14.4 15.3 10.1 10.1 9.9 5 7.4 7.7 17.3 15.8 21.2 22.3 26.8
Love Co. 12.9 11 9.1 15.8 15.9 11.9 14.8 12.5 5.4 5.4 7.2 3.9 4 4 5.9 5.9 5.7 9.5 9.3 7.6 5.6 5.5 5.2
Pontotoc Co. 10.6 10.2 8.2 8.8 8.6 7.1 6.4 7 5.7 4.9 7 8 8.8 9.5 9.3 9 9.5 8.6 8.2 9.4 8.5 7.7 8.3
“Healthy People 2010” goal = 5
per 1,000
Ch
ild In
dic
ato
rs

Prepared by the Community Service Council of Greater Tulsa
Average Daily Membership and Percentage of Children Enrolled in Special Education, by School District
Bryan County County, School Year 2008-09
Source: Oklahoma State Department of Education, Education Oversight Board, Office of Accountability, Profiles 2009 Reports.
Silo Rock Creek Achille Colbert Caddo Bennington Calera Durant0
500
1,000
1,500
2,000
2,500
3,000
3,500ADM
0%
5%
10%
15%
20%
25%
30%
35%Percent in Special Education
ADM % Spec. Ed.
ADM 688 516 403 863 441 259 611 3,294
% Spec. Ed. 23.4% 17.8% 17.4% 17.4% 21.3% 27.8% 18% 14.7%
Bryan County total ADM = 7,075; percentage in special education = 17.4%
Ch
ild In
dic
ato
rs
Prepared by the Community Service Council of Greater Tulsa
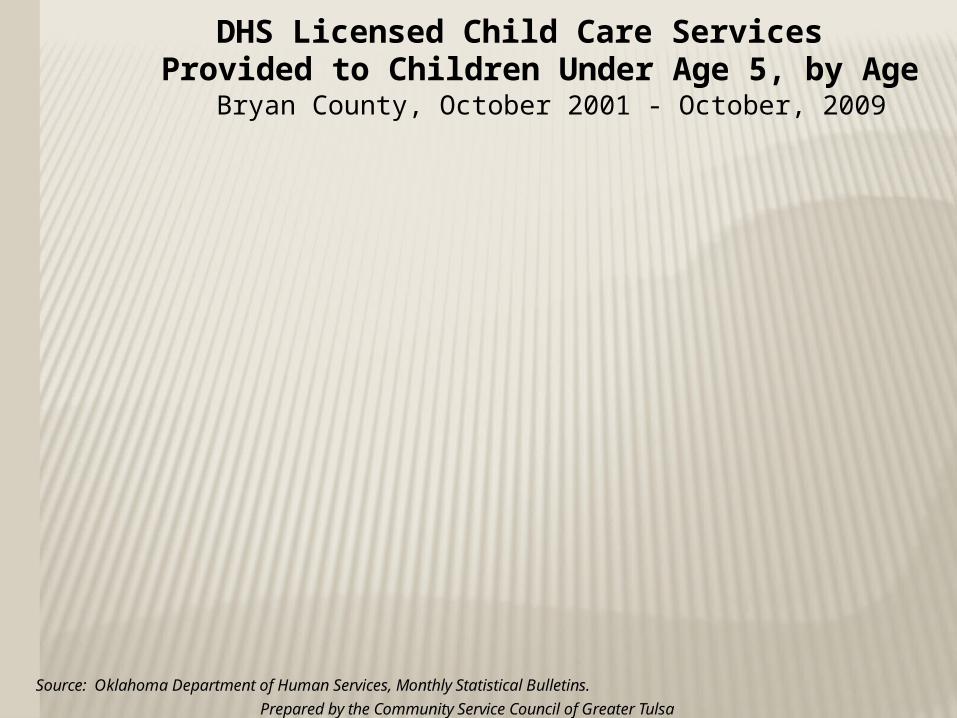
DHS Licensed Child Care Services Provided to Children Under Age 5, by Age
Bryan County, October 2001 - October, 2009
Source: Oklahoma Department of Human Services, Monthly Statistical Bulletins.
October2001
October2002
October2003
October2004
October2005
October2006
October2007
October2008
October2009
0
10
20
30
40
50
60
70
80
Age <1 19 41 35 38 44 32 32 30 35
Age 1 44 53 40 63 67 68 54 44 47
Age 2 44 62 60 60 50 56 59 37 51
Age 3 48 56 45 58 47 51 41 36 38
Age 4 39 62 26 35 33 32 29 28 28
Ch
ild In
dic
ato
rs
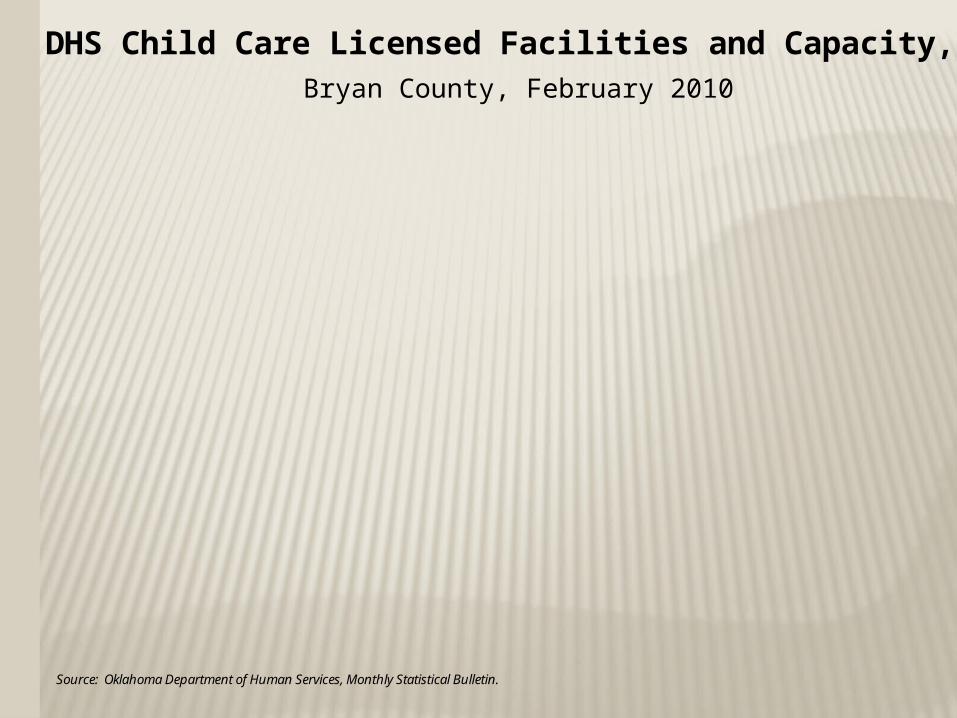
DHS Child Care Licensed Facilities and Capacity, by TypeBryan County, February 2010
Source: Oklahoma Department of Human Services, Monthly Statistical Bulletin.
37
22
27
16
10
6
1,364
987
1,266
920
98
67
Total
DHS Contract Total
Total Centers
DHS Contract Centers
Total Homes
DHS Contract Homes
01020304050
Facilities
0 500 1,000 1,500
Capacity
Prepared by the Community Service Council of Greater Tulsa
Ch
ild In
dic
ato
rs
Prepared by the Community Service Council of Greater Tulsa
Ch
ild In
dic
ato
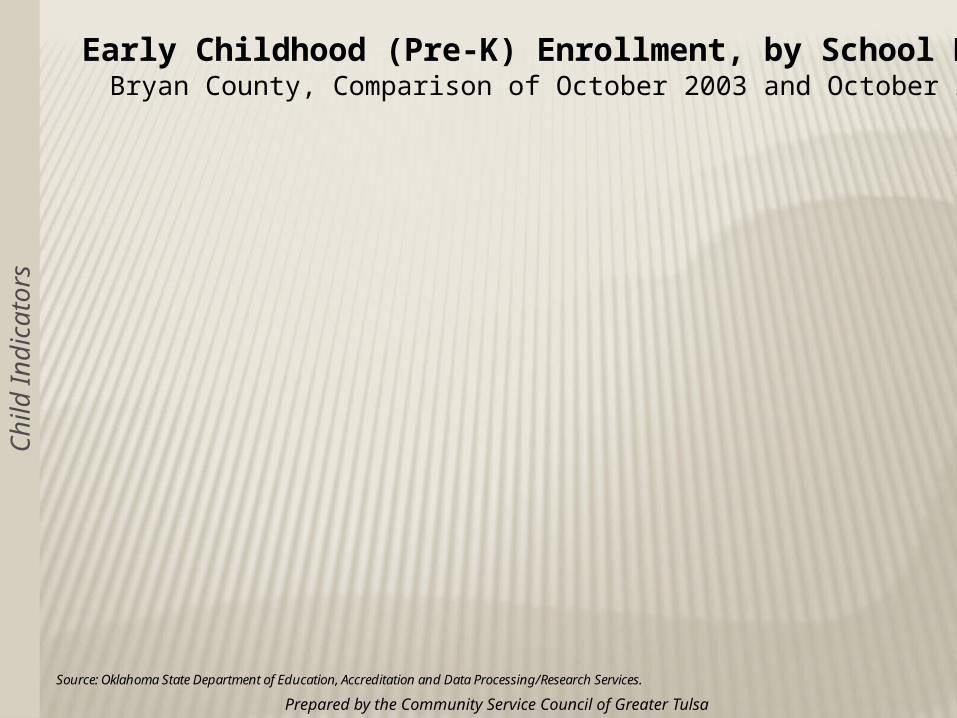
rsEarly Childhood (Pre-K) Enrollment, by School District
Bryan County, Comparison of October 2003 and October 2009
Source: Oklahoma State Department of Education, Accreditation and Data Processing/Research Services.
00
00
40
0
00
00
0
00
23
53
048
199
1920
1933
3938
2020
0
0
4
10
0
0
1
0
32
133
48
260
20
33
38
20
Achille - 20032009
Colbert - 20032009
Silo - 20032009
Durant - 20032009
Bennington - 20032009
Caddo - 20032009
Calera - 20032009
Rock Creek - 20032009
0100200300 0 100 200 300
4 year old half day 4 year old full day
3 year old half day 3 year old full day


Child Deaths Due to AbuseOklahoma, Fiscal Years 1978 - 2008
Source: Oklahoma Dept. of Human Services, Children & Family Services Division.
75
12 13
1821
16 16
24
31
2325
18
38
2023
3134
29
4245
47 48
3835
27
51
40
32
3941
1978
1979
1980
1981
1982
1983
1984
1985
1986
1987
1988
1989
1990
1991
1992
1993
1994
1995
1996
1997
1998
1999
2000
2001
2002
2003
2004
2005
2006
2007
2008
0
10
20
30
40
50
60
CH
IL
D I
ND
IC
AT
OR
S

CHILD ABUSE & NEGLECT Bryan County
In Bryan County in FY 2009, there were 518 reports of child abuse and/or neglect accepted for investigation or assessment. 1,010 children were involved in these reports (duplicated count).
161 children were confirmed victims of child abuse and/or neglect. 21 were abused, 128 were neglected, 12 were victims of both abuse and neglect.
17 of every 1,000 children in Bryan County are victims of abuse and/or neglect.
Prepared by the Community Service Council of Greater Tulsa
Ch
ild In
dic
ato
rs
Carter County In Carter County in FY
2009, there were 477 reports of child abuse and/or neglect accepted for investigation or assessment. 825 children were involved in these reports (duplicated count).
106 children were confirmed victims of child abuse and/or neglect. 9 were abused, 86 were neglected, 11 were victims of both abuse and neglect.
9 of every 1,000 children in Carter County are victims of abuse and/or neglect.

Prepared by the Community Service Council of Greater Tulsa
Age of Children of Confirmed Abuse and NeglectOklahoma, FY 2009
Source: Oklahoma Dept. of Human Services, Children & Family Services Division.
Under 11,492 (17.3%)
1-21,480 (17.2%)
3-62,351 (27.3%)
7-111,883 (21.9%)
12 & older1,399 (16.3%)
Ch
ild In
dic
ato
rs
Prepared by the Community Service Council of Greater Tulsa
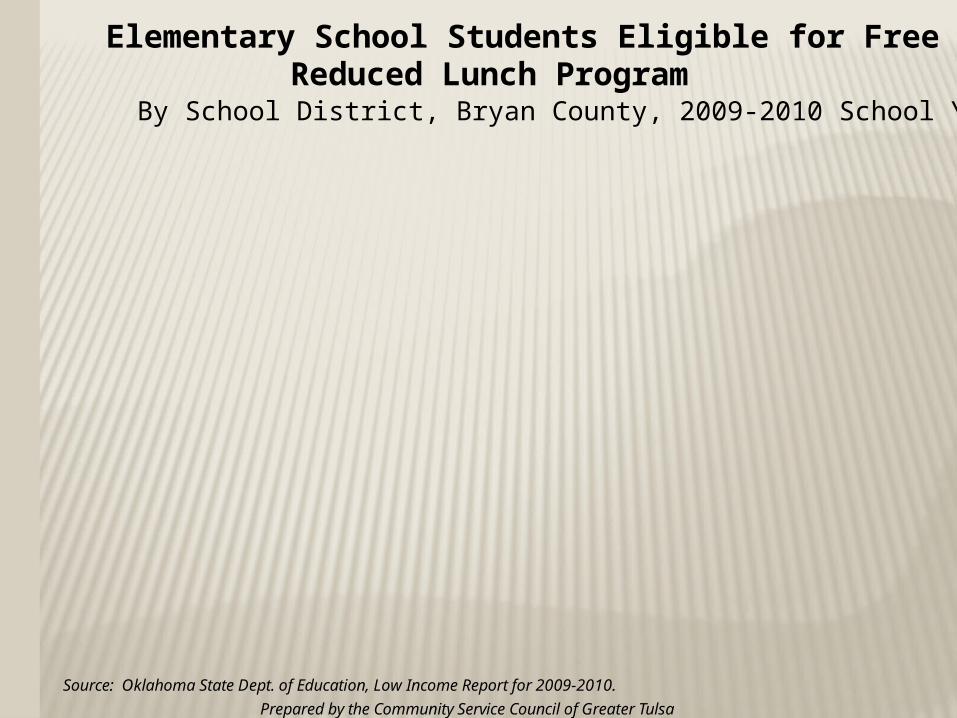
Elementary School Students Eligible for Free and Reduced Lunch Program
By School District, Bryan County, 2009-2010 School Year
Source: Oklahoma State Dept. of Education, Low Income Report for 2009-2010.
62%
83.3%
77.5%
72.4%
71.8%
62.2%
62.2%
56%
56.2%
11.1%
7.5%
9.3%
8.8%
7.4%
13.9%
11.3%
12.5%
9.9%
Bryan County Total
Bennington
Caddo
Achille
Rock Creek
Silo
Calera
Durant
Colbert
0% 20% 40% 60% 80% 100%
Percent of Students Eligible
Free
ReducedFree lunch eligibility requirement: annual household income below 130% of poverty, which currently is $23,803 for a family of three.
Reduced lunch eligibility requirement: annual household income below 185% of poverty, which currently is $33,874 for a family of three.
Ch
ild In
dic
ato
rs
Prepared by the Community Service Council of Greater Tulsa
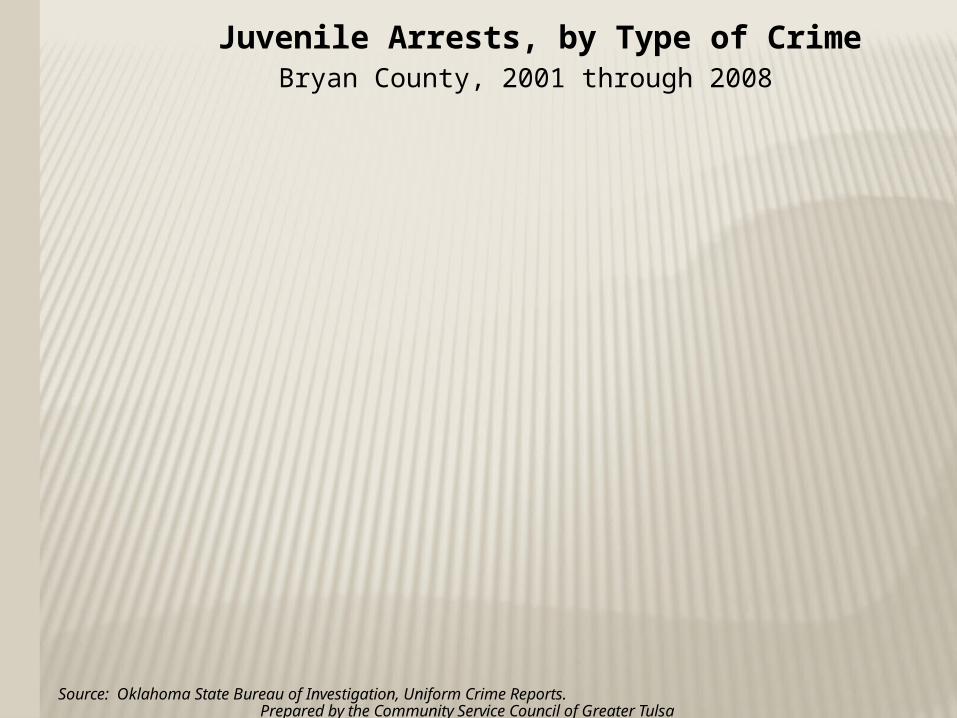
Juvenile Arrests, by Type of CrimeBryan County, 2001 through 2008
Source: Oklahoma State Bureau of Investigation, Uniform Crime Reports.
Index crimes Drug related Alcohol related Other crimes0
20
40
60
80
100
120
140
160Number of arrests
2001 2002 2003 2004 2005 2006 2007 2008
A total of 160 juvenile arrests were made in Bryan County in 2008, for a rate of 37.2 per 1,000 juveniles age 10-17, down from 240 arrests for a
rate of 57.5 in 2001.
Includes murder, rape, robbery aggravated
assault, burglary, larceny, and motor vehicle theft.
Includes sale/manufacturing
and possession of drugs.
Includes driving under the influence, liquor law violations, and
drunkenness.
Includes other assaults, disorderly conduct, curfew & loitering, runaway and all other non-traffic offenses
Ch
ild In
dic
ato
rs

Prepared by the Community Service Council of Greater Tulsa
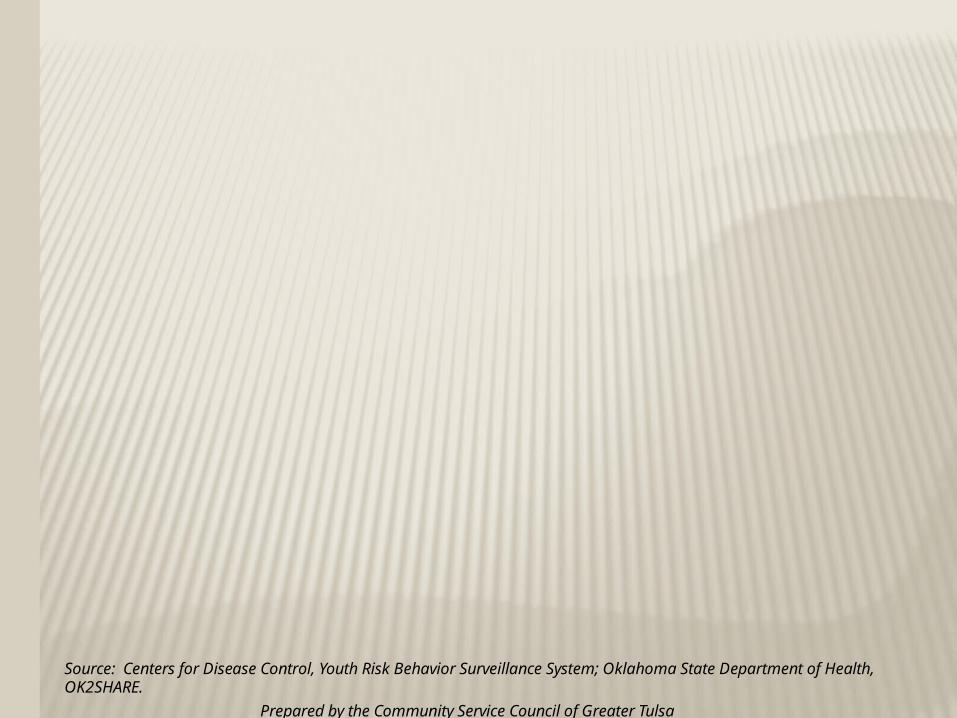
Source: Centers for Disease Control, Youth Risk Behavior Surveillance System; Oklahoma State Department of Health, OK2SHARE.
47.8%
22%
9.9%
22.2%
26.5%
17.5%
30.6%
40.5%
18.7%
7.1%
18.4%
28.6%
12.3%
25.8%
43.1%
15.9%
5.5%
19.1%
23.2%
13.3%
26.8%
39%
17.2%
4.8%
16.8%
22.6%
11%
23.1%
44.7%
19.7%
4.4%
22.3%
20%
10.5%
29.1%
Alcohol
Marijuana
Methamphetamine
Offered/sold/givenillegal drugs at school
Smoked cigarettesduring past month
Drove after drinkingalcohol in past month
Rode with drinkingdriver in past month
0% 20%40%60%80%100%
2003 Oklahoma
2005 Oklahoma
2007 Oklahoma
2009 Oklahoma
2007 US
Youth Risk Behavior Survey:Summary of Alcohol, Other Drug & Tobacco Use
High School Students, Oklahoma, 2003 through 2009, and U.S., 2007
Used once or more during past 30 days...
Ever used...
Note: National 2009 YRBSS data have not yet been released.
Ch
ild In
dic
ato
rs
Prepared by the Community Service Council of Greater Tulsa
Source: Centers for Disease Control, Youth Risk Behavior Surveillance System; Oklahoma State Department of Health, OK2SHARE.
50%
5.8%
64.3%
17.7%
7%
14.2%
49.3%
6.5%
61.7%
16.4%
7.9%
15.9%
38.2%
50.9%
5.8%
59.6%
16.7%
5.9%
15.2%
49.6%
51.1%
4.7%
56.7%
22.7%
7%
16.4%
47.4%
47.8%
7.1%
61.5%
16%
6.9%
15.8%
34.7%
Ever hadsexual intercourse
Had sex before age 13
Used condom last time
Used birth controlpills last time
Attempted suicidein past year
Overweight(according to BMI)
Physical activity for60 min/day 5 of past 7 days
0% 20% 40% 60% 80% 100%
2003 Oklahoma
2005 Oklahoma
2007 Oklahoma
2009 Oklahoma
2007 US
Youth Risk Behavior Survey:Summary of Sexual Behaviors, Suicide & Physical Health
High School Students, Oklahoma, 2003 through 2009, and U.S., 2007
Note: National 2009 YRBSS data have not yet been released.
na
Ch
ild In
dic
ato
rs

Prepared by the Community Service Council of Greater Tulsa
Health StatusOklahoma and United States, 1996 - 2009
Source: United Health Foundation, “America’s Health Rankings.“
'96 '97 '98 '99 '00 '01 '02 '03 '04 '05 '06 '07 '08 '090%
5%
10%
15%
20%
25%
Pe
rce
nt a
du
lt s r
ep
ort
ing
f air
or
po
or
he
alt h
0
10
20
30
40
50
Sta
te ra
nk
Oklahoma Rank US
Oklahoma 13.1% 14% 13.4% 12.6% 17.4% 15.3% 19.6% 17.7% 17.8% 19.7% 18.7% 20.2% 19.2% 18.7%
Rank 26 32 28 25 42 34 45 41 41 44 42 46 43 42
US 12.9% 12.9% 12.8% 12.6% 13% 13.9% 14% 14.7% 14.7% 14.9% 14.8% 14.7% 14.9% 14.4%
Ch
ild In
dic
ato
rs
Prepared by the Community Service Council of Greater Tulsa
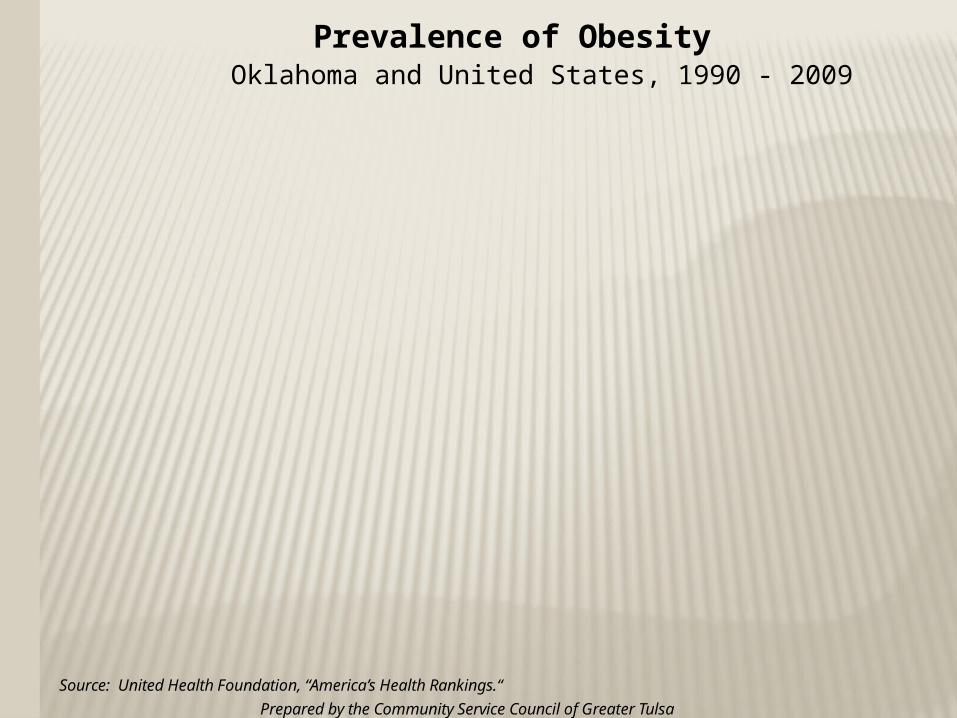
Prevalence of ObesityOklahoma and United States, 1990 - 2009
Source: United Health Foundation, “America’s Health Rankings.“
'90 '91 '92 '93 '94 '95 '96 '97 '98 '99 '00 '01 '02 '03 '04 '05 '06 '07 '08 '090%
5%
10%
15%
20%
25%
30%
35%
Pe
rce
nt o
f po
pu
l ati o
n e
stim
at e
d t o
be
ob
ese
0
10
20
30
40
50
Sta
te ra
nk
Oklahoma Rank US
Ch
ild In
dic
ato
rs
Prepared by the Community Service Council of Greater Tulsa
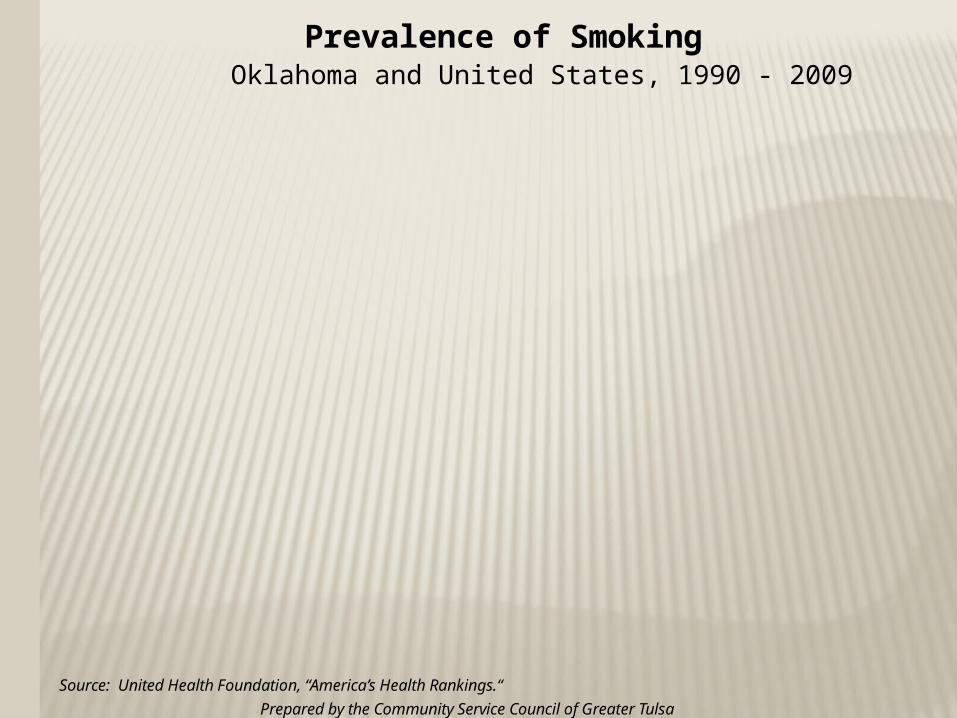
Prevalence of SmokingOklahoma and United States, 1990 - 2009
Source: United Health Foundation, “America’s Health Rankings.“
'90 '91 '92 '93 '94 '95 '96 '97 '98 '99 '00 '01 '02 '03 '04 '05 '06 '07 '08 '090%
10%
20%
30%
40%
50%
60%
Pe
rce
nt o
f po
pu
l ati o
n o
ver
18
t ha
t sm
oke
re
gu
lar l
y
0
10
20
30
40
50
60
Sta
te ra
nk
Oklahoma Rank US
Ch
ild In
dic
ato
rs
Prepared by the Community Service Council of Greater Tulsa
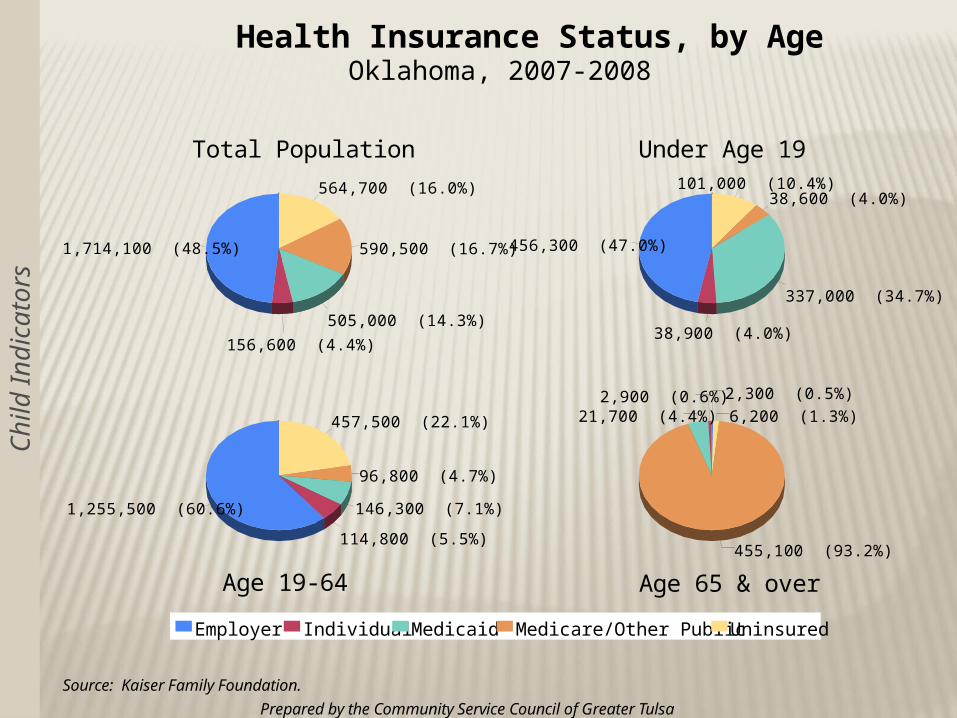
Health Insurance Status, by AgeOklahoma, 2007-2008
Source: Kaiser Family Foundation.
1,714,100 (48.5%)
156,600 (4.4%)
505,000 (14.3%)
590,500 (16.7%)
564,700 (16.0%)
456,300 (47.0%)
38,900 (4.0%)
337,000 (34.7%)
38,600 (4.0%)101,000 (10.4%)
1,255,500 (60.6%)
114,800 (5.5%)
146,300 (7.1%)
96,800 (4.7%)
457,500 (22.1%)
2,300 (0.5%)2,900 (0.6%)21,700 (4.4%)
455,100 (93.2%)
6,200 (1.3%)
Employer Individual Medicaid Medicare/Other Public Uninsured
Total Population Under Age 19
Age 19-64 Age 65 & over
Ch
ild In
dic
ato
rs
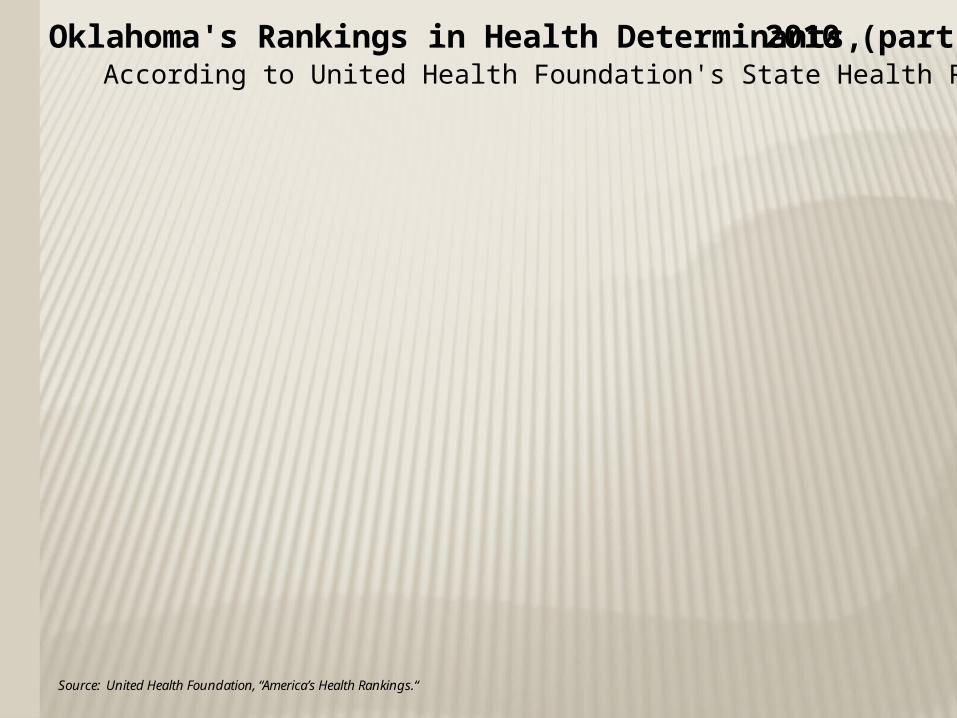
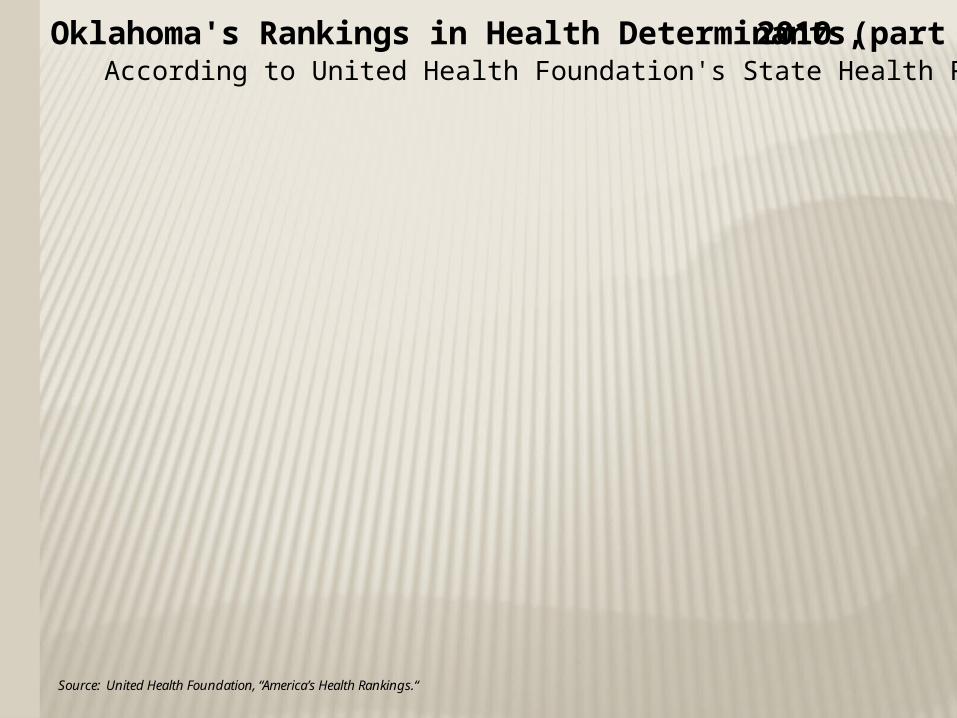
Oklahoma's Rankings in Health Determinants, 2010 (part 1)According to United Health Foundation's State Health Rankings
Source: United Health Foundation, “America’s Health Rankings.“
#48
#10
#46
#23
#40
#44
#28
#31
#24
Personal Behaviors
Prevalence of smoking
Prevalence of Binge Drinking
Prevalence of obesity
Community & Environment
High school graduation
Violent crime
Occupational fatalities
Infectious disease
Children in poverty
Air pollution
#0 #10 #20 #30 #40 #50
1990 2010
Ranking: 1=best, 50=worst
HE
AL
TH
I
ND
IC
AT
OR
S
Oklahoma's Rankings in Health Determinants, 2010 (part 2)According to United Health Foundation's State Health Rankings
Source: United Health Foundation, “America’s Health Rankings.“
#35
#14
#18
#47
#49
#46
#45
Public & Health Policies
Lack of health insurance
Public health funding (per capita)
Immunization coverage
Clinical Care
Early prenatal care
Primary Care Physicians
Preventable Hospitalizations
All Determinants
#0 #10 #20 #30 #40 #50
1990 2010
Ranking: 1=best, 50=worst
HE
AL
TH
I
ND
IC
AT
OR
S
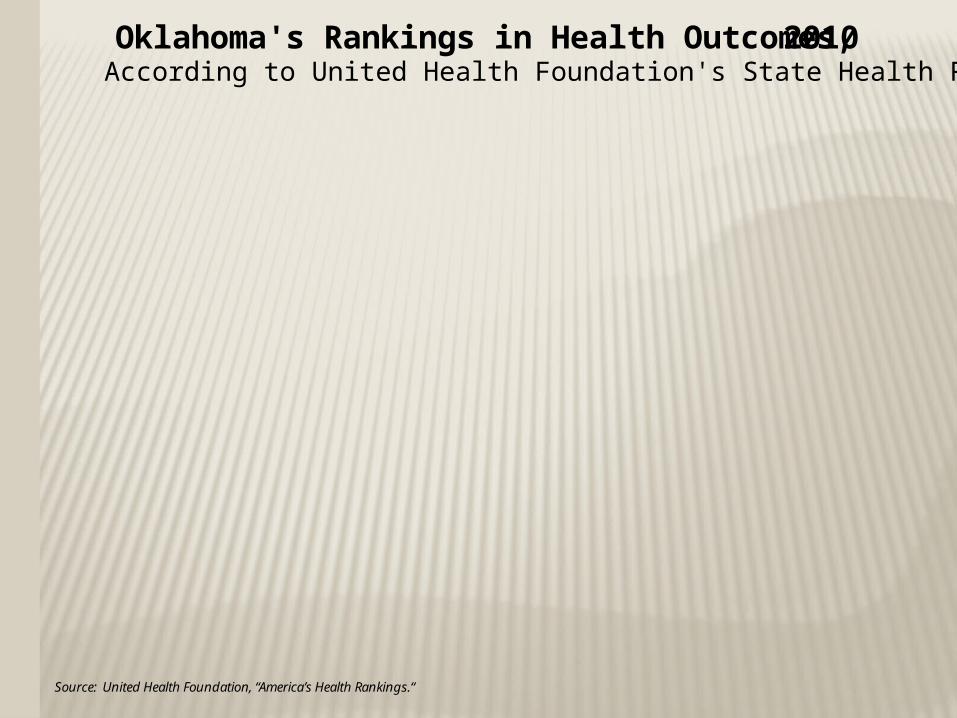
Oklahoma's Rankings in Health Outcomes, 2010According to United Health Foundation's State Health Rankings
Source: United Health Foundation, “America’s Health Rankings.“
#48
#46
#21
#44
#48
#40
#46
#46
Poor mental health days
Poor physical health days
Geographic disparity
Infant mortality
Cardiovascular deaths
Cancer deaths
Premature death
All Health Outcomes
#0 #10 #20 #30 #40 #50
1990 2010
Ranking: 1=best, 50=worst
Oklahoma’s overall health ranking for 2010 is # 46
HE
AL
TH
I
ND
IC
AT
OR
S

ADVERSE CHILDHOOD EXPERIENCESCOUNTY RANKINGS
Rankings: 1 = best, 77 = worst*Indicates a tie with at least one other county
Source: Oklahoma KIDS COUNT Factbook, 2006-2007, Oklahoma Institute for Child Advocacy
Ch
ild In
dic
ato
rs
Bryan
Carter
Coal
Love
Pontotoc
Parental separation or divorce 71 25 74 48 38
Incarcerated household member 70 74 37 27 58
Mentally ill household member 43* 43* 43* 43* 43*
Substance abusing household member
11* 11* 11* 11* 11*
Violence against mother
51 1 72 5 31
Psychological, physical & sexual abuse
62 54 77 52 42
Emotional & physical neglect 66 63 77 49 56
Overall ranking 72 59 77 47 55

…IN SUMMARY

BEST PRACTICES STRATEGIES
Outcome performance measures Community coalitions
Collaborative, public-private partnerships Consumer/client investments
Successful outreach and recruitment Case management/Care coordination Strong social marketing Risk reduction education Access to services and care
Child care Transportation Translation
Su
mm
ary

Prepared by the Community Service Council of Greater Tulsa
Best Practices
Source: Institute of Medicine, Reducing Risk for Mental Disorders, 1994.
Continuum of Intervention
Su
mm
ary
Prepared by the Community Service Council of Greater Tulsa
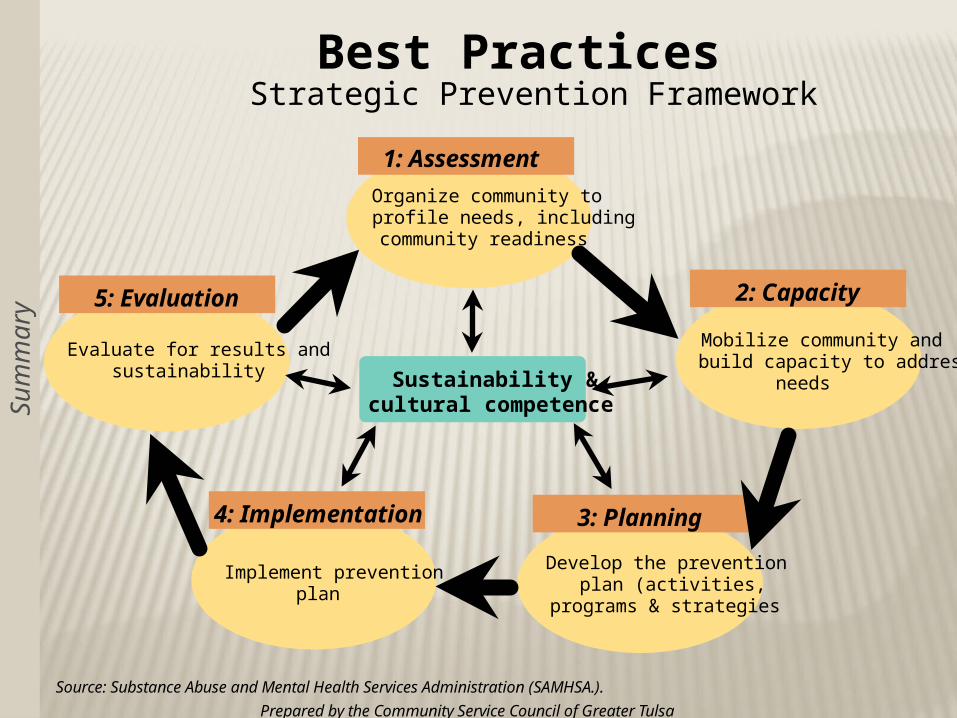
Best PracticesStrategic Prevention Framework
Source: Substance Abuse and Mental Health Services Administration (SAMHSA.).
Organize community to profile needs, including community readiness
Mobilize community and build capacity to address
needs
Develop the prevention plan (activities,
programs & strategies
Implement prevention plan
Evaluate for results and sustainability
1: Assessment
2: Capacity
3: Planning4: Implementation
5: Evaluation
Sustainability & cultural competenceS
um
mary
Prepared by the Community Service Council of Greater Tulsa
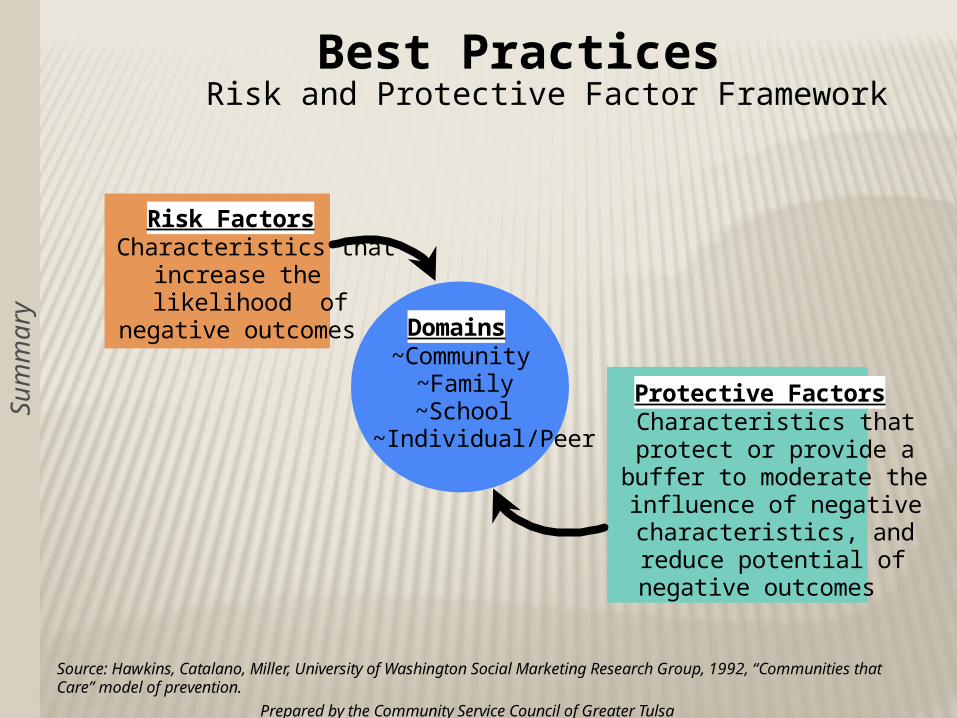
Best PracticesRisk and Protective Factor Framework
Source: Hawkins, Catalano, Miller, University of Washington Social Marketing Research Group, 1992, “Communities that Care” model of prevention.
Risk FactorsCharacteristics that
increase the likelihood of
negative outcomes
Protective FactorsCharacteristics that protect or provide a
buffer to moderate the influence of negative characteristics, and reduce potential of negative outcomes
Domains~Community
~Family~School
~Individual/Peer
Su
mm
ary

WHO ARE THE CHILDREN?
Prepared by the Community Service Council of Greater TulsaJuly 2011
…is available on our website:www.csctulsa.org