Embed Size (px)
Citation preview
NOTE / NOTE
Chloroplast DNA variation of Tilia cordata(Tiliaceae)
S. Fineschi, D. Salvini, D. Taurchini, S. Carnevale, and G.G. Vendramin
Abstract: The distribution of haplotypic diversity of 17 Tilia cordata Mill. populations was investigated by PCR–RFLPmarkers of the chloroplast genomes. A high number of haplotypes (14) and high total genetic diversity (hT = 0.881)were detected. The distribution of the chloroplast DNA haplotypes revealed low geographic structure of the genetic di-versity; the coefficient of differentiation between populations, Gst = 0.552, was lower than the mean value reported formaternally inherited markers in Angiosperm tree species. The value of population subdivision for ordered alleles, asmeasured by Nst, was significantly higher than the value of population subdivision for unordered alleles (Nst = 0.662,Gst = 0.552), thus indicating the presence of a phylogeographic structure. The relatively low genetic differentiationamong T. cordata populations may be explained mainly as a consequence of human impact on this species.
Résumé : Les auteurs ont étudié la répartition de la diversité des haplotypes de 17 populations de Tilia cordata Mill.à l’aide de marqueurs PCR–RFLP du génome chloroplastique. Un nombre élevé d’haplotypes (14) a été observé et ladiversité génétique totale était également élevée (hT = 0,881). La répartition des haplotypes d’ADN chloroplastiquecorrespondait à une structuration géographique faible de la diversité génétique; le coefficient de différenciation inter po-pulation, Gst = 0,552, était plus faible que la valeur moyenne rapportée pour les marqueurs transmis maternellementchez les espèces angiospermes arborescentes. La valeur de différenciation de populations pour les allèles ordonnés, telleque mesurée par Nst, était significativement plus élevée que la valeur de différenciation de populations pour les allèlesnon ordonnés (Nst = 0,662, Gst = 0,552). Cet écart indique la présence d’une structure phylogéographique. La différen-ciation génétique relativement faible parmi les populations de T. cordata pourrait être due principalement à des effetsde l’activité humaine sur l’espèce.
[Traduit par la Rédaction] Fineschi et al. 2508
Introduction
The genus Tilia has a widespread, though scattered, distri-bution in the European continent, where it usually occurs inmixed deciduous stands. As a consequence of human influ-ence, this “noble hardwood” became rare in the wild and afrequent tree in urban areas.
The Tiliaceae comprise about 50 genera and 450 speciesof trees, shrubs, and herbs distributed throughout the world.
The genus Tilia is present in all temperate regions of theAmerican, Asian, and European continents; it is the only ge-nus of the family native to Europe.
The two main European species, small-leaved lime (Tiliacordata Mill.) and large-leaved lime (Tilia platyphyllosScop.), have a wide distribution in Europe, including most ofthe central and southern part of the continent; they are rarelyfound as forest dominants and occur most frequently as ele-ments of a mixed deciduous canopy (Huntley and Birks1983). Both T. cordata and T. platyphyllos produce valuablewood. For this reason, they are common in managed wood-lands; currently limes are largely utilized as shade and orna-mental trees and are planted along city streets.
The present distribution of the tree flora in Europe is theresult of alternating episodes of local extinction and new mi-gration and colonization that tree taxa experienced duringdifferent climatic phases of the Quaternary age (Bennet et al.1991; Hewitt 1996; Taberlet et al. 1998; Thompson 1999).The history of Tilia is characterized by early expansion start-ing in the late glacial, followed by episodes of local extinc-tion during the Holocene, which resulted in rangefragmentation. According to the pollen maps by Huntley andBirks (1983) and S. Brewer (http://www.pierroton.inra.fr/Cytofor/Maps/index.html), the expansion of Tilia pollen dur-ing Pleistocene interglacial stages (Eemian, Holsteinian, and
Can. J. For. Res. 33: 2503–2508 (2003) doi: 10.1139/X03-179 © 2003 NRC Canada
2503
Received 29 November 2002. Accepted 29 July 2003.Published on the NRC Research Press Web site athttp://cjfr.nrc.ca on 12 December 2003.
S. Fineschi,1,2 D. Salvini,2 and D. Taurchini. Istituto diBiologia Agroambientale e Forestale, Consiglio Nazionaledelle Ricerche, via Marconi 2, I-05010 Porano – TR, Italy.S. Carnevale and G.G. Vendramin. Istituto di GeneticaVegetale, Sezione di Firenze, Consiglio Nazionale delleRicerche, Polo Scientifico Sesto Fiorentino, Via Madonna delPiano, Edificio D, I-50019 Sesto Fiorentino, Firenze, Italy.
1Corresponding author (e-mail: [email protected]).2Present address: Istituto per la Protezione delle Piante,Consiglio Nazionale delle Ricerche, Polo Scientifico SestoFiorentino, Via Madonna del Piano, Edificio E, I-50019Sesto Fiorentino, Firenze, Italy.
I:\cjfr\cjfr3312\X03-179.vpDecember 9, 2003 11:13:24 AM
Color profile: Generic CMYK printer profileComposite Default screen
earlier) coincides with that of Quercus and Ulmus, althoughthe maximum values of Tilia pollen concentration are onlyapprox. 5%. The postglacial expansion of Tilia continueduntil 5000 BP. Subsequently, its distribution started to de-cline, presumably in response to deteriorating climate (oscil-lations of temperature), until 3000 BP. After this time,human activities, particularly forest clearance, contributed tothe fragmentation of its range. By 1000 BP, Tilia was con-sistently present in only a few scattered areas where pollenrecords may reflect the local presence of relict stands leftbehind by the retreating glacial front after the mid-Holocene(Huntley and Birks 1983). On the basis of their results,Huntley and Birks (1983) and S. Brewer (http://www.pierroton.inra.fr/Cytofor/Maps/index.html) describe the re-gions of northern Balkans, Italy, Southern Alps, and north-ward into Russia as the most likely refugia for Tilia.
Here we analyse the distribution of genetic diversity ofT. cordata by PCR–RFLP of chloroplast (cp) DNA markersand compare genetic data with the pollen maps available forTilia. The major objective of this work is to characterize thegenetic structure of T. cordata and to test the existence ofa phylogeographic structure to better understand the roleplayed by important factors (such as life history traits andhuman intervention) during the postglacial history of thisspecies on its present distribution.
Materials and methods
Tilia cordata was collected from 17 European forests; 2–10 individuals were sampled from each population (Table 1).The sampling strategy followed general criteria proposedwithin the frame of the European project “Cytofor” (http://www.pierroton.inra.fr/Cytofor/) for the collection of materialfrom different species within different forests. According tothese criteria, 10 individuals per species should have been
collected in each European forest within a 2 km × 2 km areathat was selected where species diversity was maximum. In-dividuals should be collected 50–100 m apart from eachother. If a species was rare or absent within the identifiedarea, collection was carried out at the peripheral points tocollect 10 individuals. Tilia was rare in several cases (e.g.,in the German populations Forstbezirk Kenzingen andBovenden; in the French population Valbonne; and in theItalian population Alto Garda Bresciano); therefore, forthose populations, the sampling size was particularly limitedbecause of the scarcity of this species in those specific for-ests. For each collected plant, samples were conserved in aherbarium to check the field identification. DNA was ex-tracted using the Qiagen DNeasy plant extraction kit accord-ing to the manufacturer’s instructions.
Maternally inherited cpDNA was amplified using sevenuniversal primer pairs amplifying the following fragments:TF (Taberlet et al. 1991), CD, CS, DT, HK, K1K2 (Demesureet al. 1995), and VL (Dumolin-Lapègue et al. 1997a). Am-plification reactions, digestion with restriction enzymes(TaqI and HinfI), and gel electrophoresis followed proce-dures described in Demesure et al. (1996) and Fineschi et al.(2000). Polymorphic fragments were labelled by decreasingorder of fragment length, as visualized in the polyacrylamidegels and as described by Demesure et al. (1996). Haplotypeswere defined according to different combinations of lengthvariants.
Diversity and differentiation parameters were calculatedaccording to Pons and Petit (1995, 1996) using the softwarePermut (http://www.pierroton.inra.fr/genetics/labo/Software):the average within-population gene diversity (hS), the totalgene diversity (hT), and the differentiation for unorderedalleles (Gst) and for ordered alleles (Nst). One thousand ran-dom permutations of haplotype identities were made, keep-ing the haplotype frequencies and the matrix of pairwise
© 2003 NRC Canada
2504 Can. J. For. Res. Vol. 33, 2003
PCR–RFLP haplotypes
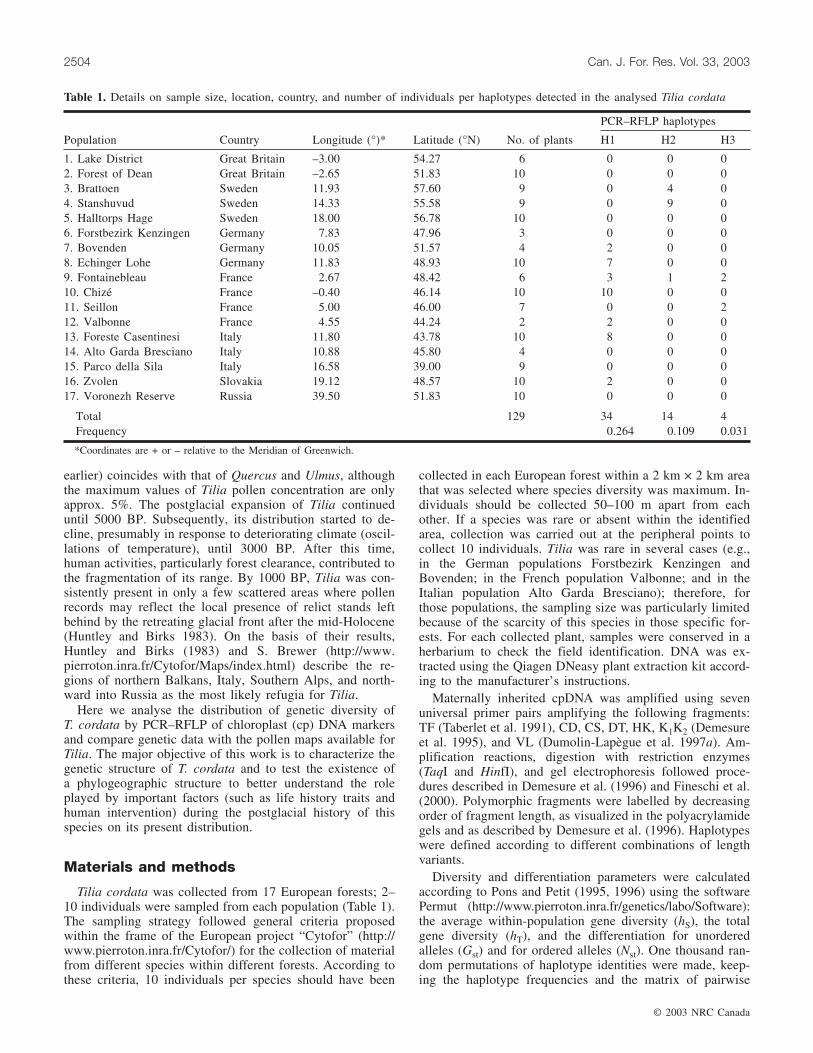
Population Country Longitude (°)* Latitude (°N) No. of plants H1 H2 H3
1. Lake District Great Britain –3.00 54.27 6 0 0 02. Forest of Dean Great Britain –2.65 51.83 10 0 0 03. Brattoen Sweden 11.93 57.60 9 0 4 04. Stanshuvud Sweden 14.33 55.58 9 0 9 05. Halltorps Hage Sweden 18.00 56.78 10 0 0 06. Forstbezirk Kenzingen Germany 7.83 47.96 3 0 0 07. Bovenden Germany 10.05 51.57 4 2 0 08. Echinger Lohe Germany 11.83 48.93 10 7 0 09. Fontainebleau France 2.67 48.42 6 3 1 210. Chizé France –0.40 46.14 10 10 0 011. Seillon France 5.00 46.00 7 0 0 212. Valbonne France 4.55 44.24 2 2 0 013. Foreste Casentinesi Italy 11.80 43.78 10 8 0 014. Alto Garda Bresciano Italy 10.88 45.80 4 0 0 015. Parco della Sila Italy 16.58 39.00 9 0 0 016. Zvolen Slovakia 19.12 48.57 10 2 0 017. Voronezh Reserve Russia 39.50 51.83 10 0 0 0
Total 129 34 14 4Frequency 0.264 0.109 0.031
*Coordinates are + or – relative to the Meridian of Greenwich.
Table 1. Details on sample size, location, country, and number of individuals per haplotypes detected in the analysed Tilia cordata
I:\cjfr\cjfr3312\X03-179.vpDecember 9, 2003 11:13:24 AM
Color profile: Generic CMYK printer profileComposite Default screen
haplotype differences as in the original study (Burban et al.1999). The distribution of values obtained by permutationwas compared with the observed values. For the Nst analysis,a distance matrix derived from the pairwise number of muta-tional differences between haplotypes was used. Accordingto Pons and Petit (1996), significantly higher values for Nstthan for Gst indicate the existence of a phylogeographicstructure. Statistical parsimony was used to reconstructphylogenetic relationships between haplotypes (TCS, ver-sion 1.06, Clement et al. 2000).
Results
Four out of seven analysed fragments were polymorphic(HK, DT, K1K2, and CD); digestion with two restriction en-zymes (TaqI and HinfI) generated 14 haplotypes (Table 2).
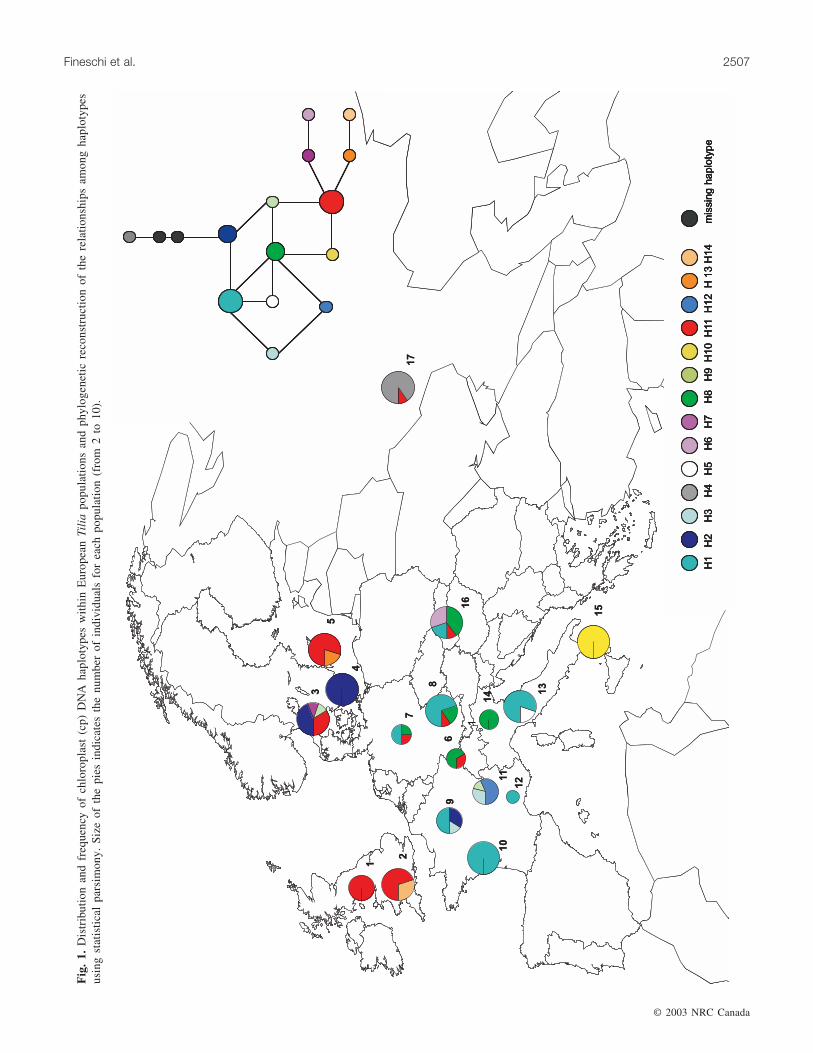
The most frequent haplotypes are haplotype 1 (26%) and11 (23%) (Table 1). Haplotype 1 and related haplotypes 2, 3,and 12 are mainly distributed in the central part of the conti-nent. Haplotype 11 and related haplotypes 13 (1.6%) and 14(2.3%) are distributed in Scandinavia, in the British islands,and, at lower frequency, in the German, Slovakian, andRussian populations. Haplotype 8 has an eastern–central Eu-ropean distribution and is fixed in the alpine Italian popula-tion. Haplotypes 10, occurring in the Calabrian population,and 4, occurring in the Russian population, are private forthose regions. The Russian haplotype has the highest phylo-genetic distance from all other haplotypes.
The Seillon population differs from all other French popu-lations because of the absence of the most frequent haplo-type (haplotype 1), the presence of haplotype 9, and thepresence of a private haplotype (haplotype 12, related tohaplotype 1). The German populations appear as a mixtureof different haplotypes. The three Italian populations differfrom each other, being characterized by distinct haplotypes.
The Slovakian population comprises the most frequent ha-plotype 1, the central European haplotypes 8 and 11, and aprivate one (haplotype 6).
The cladogram of cpDNA haplotypes, as inferred usingstatistical parsimony (included in Fig. 1), shows that groupsof closely related haplotypes are also geographically close toeach other. The Russian haplotype 4 is clearly separatedfrom all others.
Genetic diversity analysis revealed a high value of totalgenetic diversity: hT = 0.881 (SE = 0.03); the diversity with-in populations was lower: hS = 0.395 (SE = 0.08). The num-ber of detected haplotypes per population varied betweenone and four. Six populations out of seventeen were mono-morphic (Table 1, Fig. 1). The level of population differenti-ation was Gst = 0.552 (SE = 0.09); the value obtained for Nstwas 0.662 (SE = 0.08) and was significantly higher (p <0.05) than that for Gst, as revealed by the permutation test.
Discussion
The coefficient of population subdivision calculated forsmall-leaved lime (Gst = 0.55) is lower than the mean value(Gst = 0.73) reported for maternally inherited genomes inAngiosperm tree species (Petit 1999). Differentiation be-tween populations is lower in Tilia than in Quercus petraea(Gst = 0.85 (SE = 0.02), Dumolin-Lapègue et al. 1997b);Fagus sylvatica (Gst = 0.83 (SE = 0.06), Demesure et al.1996); Alnus glutinosa (Gst = 0.87 (SE = 0.05), King andFerris 1998; Gst = 0.82 (SE = 0.06), S. Rendell andR. Ennos, personal communication); Carpinus betulus (Gst =0.97 (SE = 0.03), Grivet and Petit 2002); and it is closer tothe value calculated for Castanea sativa (Gst = 0.43 (SE =0.06), Fineschi et al. 2000).
Different factors may be responsible for the relatively lowpopulation subdivision, in particular the seed dispersal
© 2003 NRC Canada
Fineschi et al. 2505
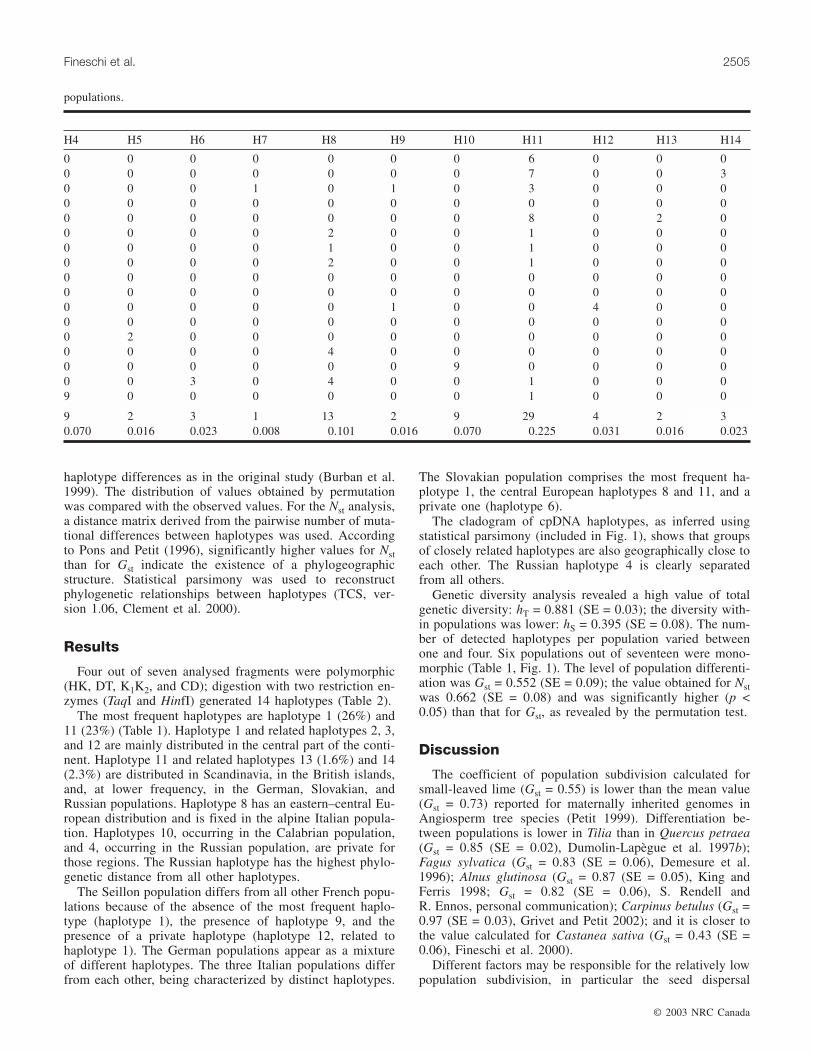
H4 H5 H6 H7 H8 H9 H10 H11 H12 H13 H14
0 0 0 0 0 0 0 6 0 0 00 0 0 0 0 0 0 7 0 0 30 0 0 1 0 1 0 3 0 0 00 0 0 0 0 0 0 0 0 0 00 0 0 0 0 0 0 8 0 2 00 0 0 0 2 0 0 1 0 0 00 0 0 0 1 0 0 1 0 0 00 0 0 0 2 0 0 1 0 0 00 0 0 0 0 0 0 0 0 0 00 0 0 0 0 0 0 0 0 0 00 0 0 0 0 1 0 0 4 0 00 0 0 0 0 0 0 0 0 0 00 2 0 0 0 0 0 0 0 0 00 0 0 0 4 0 0 0 0 0 00 0 0 0 0 0 9 0 0 0 00 0 3 0 4 0 0 1 0 0 09 0 0 0 0 0 0 1 0 0 0
9 2 3 1 13 2 9 29 4 2 30.070 0.016 0.023 0.008 0.101 0.016 0.070 0.225 0.031 0.016 0.023
populations.
I:\cjfr\cjfr3312\X03-179.vpDecember 9, 2003 11:13:24 AM
Color profile: Generic CMYK printer profileComposite Default screen
mechanism and the influence of human activities. Tilia pro-duces small fruits bearing a long wing that assures a highlyefficient wind dispersal of the seeds. Efficient seed dispersalshould lower genetic differentiation among populations, asin the case of Salix (Palmé et al. 2003) and Populus (Salviniet al. 2001). Wind dispersal strategy is not always linkedwith high dispersal ability, as observed in the case ofCarpinus betulus, a species characterized by tiny, wingedseeds and by a Gst value close to 1 (Grivet and Petit 2002).
Human activities may be partly responsible for the presenthaplotype distribution in Tilia species. Indeed, the develop-ment of agriculture and forestry resulted also in cultivationof species producing valuable timber, such as Tilia. Cultiva-tion also includes transferring propagation material throughdifferent regions, which may have generated haplotype ad-mixture and blurred the phylogeographic pattern. However,some hypotheses about the possible colonization dynamicsof Tilia can be inferred by the haplotype distribution and bythe evidence from fossil pollen data (S. Brewer, personalcommunication).
The history of Tilia after the last glacial period is distin-guished first by its early diffusion that lasted until 3000 BP,and later by its decline caused by both climatic changes andhuman activities. As a consequence, present day cpDNApolymorphism does not cast much light on the distributionof full glacial refugia. The significantly higher value of Nstthan Gst has revealed the presence of a phylogeographicstructure (Pons and Petit 1996) that did not disappear, inspite of the human intervention on the distribution of thisspecies.
According to Huntley and Birks (1983) and Brewer’sresults (http://www.pierroton.inra.fr/Cytofor/Maps/index.html),at least two refugia can be identified for Tilia from theisochrone maps in the Italian and Balkan peninsulas. A pos-sible additional refugial area can be identified in westernRussia. In the Russian population (Voronezh Reserve), oneprivate haplotype (4) divergent from all others (Fig. 1) wasdetected, supporting the assumption of a possible refugialarea in western Russia. The presence of a refugium in cen-
tral Italy seems to be confirmed by the distribution of themost frequent haplotype, which might have subsequentlymigrated northward into France and Germany. A similarmigration pathway has been described for deciduous oaks(Dumolin-Lapègue et al. 1997b; Fineschi et al. 2002; Petit etal. 2002). The opposite has been found for beech (Demesureet al. 1996) and hornbeam (Grivet and Petit 2002); Italianhaplotypes did not migrate northwards and were probablyblocked by the barrier represented by the Alps.
According to Huntley and Birks (1983), Tilia was proba-bly present in the southern Alps during the late glacial pe-riod. Our results report the presence of one haplotype (8)distributed in the populations from the Italian Alps (Parcodell’Alto Garda Bresciano) and in those from eastern–central Europe.
Interestingly, the Calabrian population is characterized bya private haplotype, which appears to have remained isolatedin this area. Although southern Italy is reported to have beenan important refugial area for several temperate tree species,there is no evidence from fossil pollen data of a Calabrianrefugium for Tilia. Therefore, any hypothesis about the ori-gin of haplotype 10 is difficult to formulate on the basis ofour data set. Misclassification of these samples or intro-gression with T. platyphyllos are not likely, considering thata survey of European large-leaved lime populations did notreveal the presence of haplotype 10 (S. Fineschi, D. Salvini,D. Taurchini, and G.G. Vendramin. Unpublished data). Anonindigenous origin of the sampled population can be ex-cluded on the basis of the historical records and on the basisof its remote and inaccessible location within the area of theNational Park of Sila; finally, this haplotype is absent inother European regions analysed.
Present-day haplotype distribution in central Europe mayrepresent the meeting point of different migration routes.This pattern has been described by Taberlet et al. (1998) andGrivet (2002) for several tree species; in fact, a high level ofchloroplast diversity is detected in those areas where migra-tion routes from different refugia meet. Our data on Tiliaprovide additional evidence, since the populations from cen-
© 2003 NRC Canada
2506 Can. J. For. Res. Vol. 33, 2003
HaplotypeHK HinfIband 1
DT HinfIband 1
K1K2 TaqIband 2
K1K2 HinfIband 3
CD TaqIband 1
CD HinfIband 5
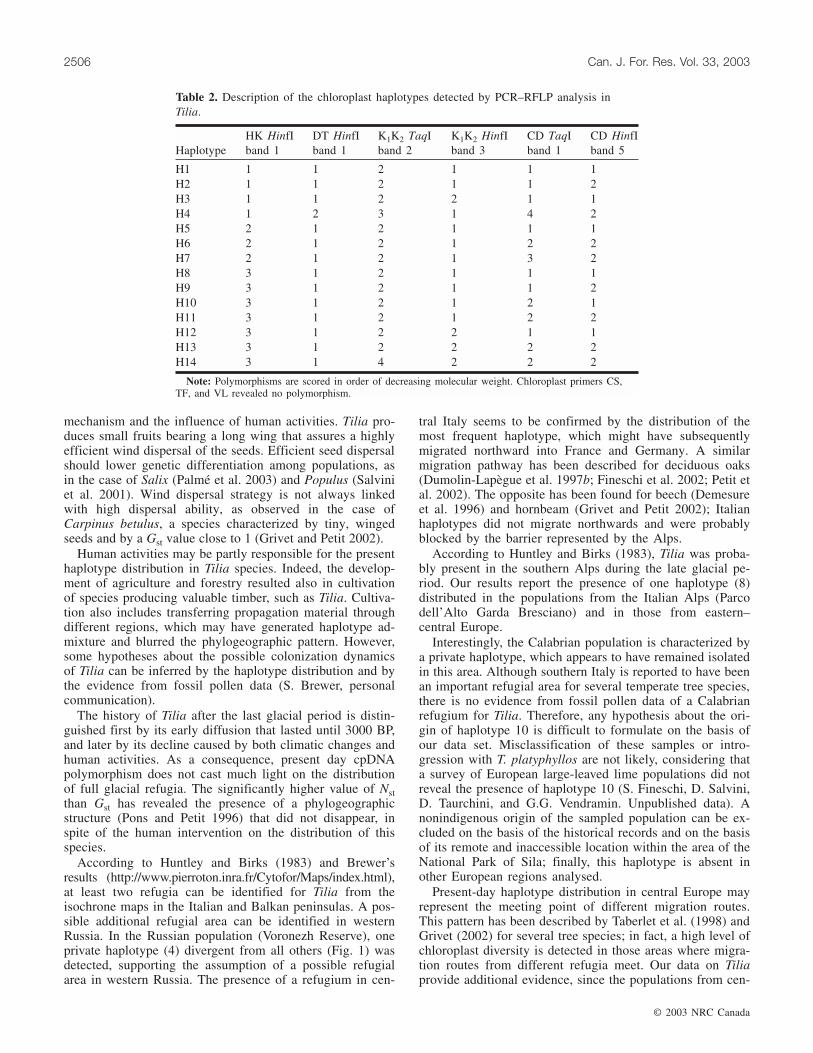
H1 1 1 2 1 1 1H2 1 1 2 1 1 2H3 1 1 2 2 1 1H4 1 2 3 1 4 2H5 2 1 2 1 1 1H6 2 1 2 1 2 2H7 2 1 2 1 3 2H8 3 1 2 1 1 1H9 3 1 2 1 1 2H10 3 1 2 1 2 1H11 3 1 2 1 2 2H12 3 1 2 2 1 1H13 3 1 2 2 2 2H14 3 1 4 2 2 2
Note: Polymorphisms are scored in order of decreasing molecular weight. Chloroplast primers CS,TF, and VL revealed no polymorphism.
Table 2. Description of the chloroplast haplotypes detected by PCR–RFLP analysis inTilia.
I:\cjfr\cjfr3312\X03-179.vpDecember 9, 2003 11:13:25 AM
Color profile: Generic CMYK printer profileComposite Default screen
© 2003 NRC Canada
Fineschi et al. 2507
Fig
.1.
Dis
trib
utio
nan
dfr
eque
ncy
ofch
loro
plas
t(c
p)D
NA
hapl
otyp
esw
ithi
nE
urop
ean
Tili
apo
pula
tion
san
dph
ylog
enet
icre
cons
truc
tion
ofth
ere
lati
onsh
ips
amon
gha
plot
ypes
usin
gst
atis
tica
lpa
rsim
ony.
Siz
eof
the
pies
indi
cate
sth
enu
mbe
rof
indi
vidu
als
for
each
popu
lati
on(f
rom
2to
10).
I:\cjfr\cjfr3312\X03-179.vpDecember 9, 2003 11:13:25 AM
Color profile: Generic CMYK printer profileComposite Default screen
tral Europe are characterized by the highest haplotypic di-versity.
Acknowledgements
This study was supported by the European grant FAIR-CT97-3795 “Measuring molecular differentiation of Euro-pean deciduous forests for conservation and management”(CYTOFOR). We acknowledge Rémy Petit and SalvatoreCozzolino for a critical reading of a previous draft of themanuscript.
References
Bennet, K.D., Tzedakis, P.C., and Willesk, K.J. 1991. Quaternaryrefugia of the North Europeans trees. J. Biogeogr. 18: 103–115.
Burban, C., Petit, R.J., Carcreff, E., and Jactel, H. 1999. Range-wide variation of the maritime pine bast scale Matsucoccusfeytaudi Duc. (Homoptera: Matsucoccidea) in relation to the ge-netic structure of its host. Mol. Ecol. 8: 1593–1602.
Clement, M.D., Posada, M.D., and Crandall, K.A. 2000. TCS: acomputer program to estimate gene genealogies. Mol. Ecol. 9:1657–1660.
Demesure, B., Sodzi, N., and Petit, R.J. 1995. A set of universalprimers for amplification of polymorphic non-coding regions ofmitochondrial and chloroplast DNA in plants. Mol. Ecol. 4:129–131.
Demesure, B., Comps, B., and Petit, R.J. 1996. Chloroplast DNAphylogeography of the common beech (Fagus sylvatica L.) inEurope. Evolution, 50: 2515–2510.
Dumolin-Lapègue, S., Pemonge, M.H., and Petit, R.J. 1997a. Anenlarged set of consensus primers for the study of organelleDNA in plants. Mol. Ecol. 6: 393–397.
Dumolin-Lapègue, S., Demesure, B., Le Corre, V., Fineschi, S.,and Petit, R.J. 1997b. Phylogeographic structure of white oaksthroughout the European continent. Genetics, 146: 1475–1487.
Fineschi, S., Taurchni, D., Villani, F., and Vendramin, G.G. 2000.Chloroplast DNA polymorphism reveals little geographicalstructure in Castanea sativa Mill. (Fagaceae) throughout south-ern European countries. Mol. Ecol. 9: 1495–1503.
Fineschi, S., Taurchini, D., Grossoni, P., Petit, R.J., and Vendra-min, G.G. 2002. Chloroplast DNA variation of white oaks in It-aly. For. Ecol. Manage. 156: 103–114.
Grivet, D. 2002. Phylogéographie et évolution moléculairecompaée d’arbres forestiers à l’aide des marqueurs chloroplasti-ques. Thèse de doctorat, Université Henri Poincaré-Nancy I,Vandoeuvre lès Nancy, France.
Grivet, D., and Petit, R.J. 2002. Chloroplast DNA phylogeographyof the hornbeam in Europe: evidence for a bottleneck at the out-set of postglacial colonization. Conserv. Genet. 4: 47–56.
Hewitt, G.M. 1996. Some genetic consequences of ice ages andtheir role in divergence and speciation. Biol. J. Linn. Soc. 58:247–276.
Huntley, B., and Birks, H.J.B. 1983. An atlas of past and presentpollen maps for Europe: 0 – 13000 years ago. Cambridge Uni-versity Press, Cambridge.
King, R.A., and Ferris, C. 1998. Chloroplast DNA phylogeographyof Alnus glutinosa (L.) Gaertn. Mol. Ecol. 7: 1151–1161.
Palmé, A.E., Semerikov, V., and Lascoux, M. 2003. Absence ofgeographical structure of chloroplast DNA variation in sallow,Salix caprea. Heredity, 91: 465–474.
Petit, R.J. 1999. Diversité génétique et histoire des populationsd’arbres forestiers. Dossier d’habilitation à diriger des recher-ches, Université de Paris-Sud, Université formation de rechercheScientifique d’Orsay, Paris.
Petit, R.J., Brewer, S., Bordács, S., Burg, K., Cheddadi, R., Coart,E., Cottrell, J., Csaikl, U.M., van Dam, B., Deans, J.D., Espinel,S., Fineschi, S., Finkeldey, R., Glaz, I., Goicoechea, P.G.,Jensen, J.S., König, A.O., Lowe, A.J., Madsen, S.F., Mátyás, G.,Munro, R.C., Popescu, F., Slade, D., Tabbener, H., de Vries,S.G.M., Ziegenhagen, B., de Beaulieu, J.L., and Kremer, A.2002. Identification of refugia and post-glacial colonizationroutes of European white oaks based on chloroplast DNA andfossil pollen evidence. For. Ecol. Manage. 156: 49–74.
Pons, O., and Petit, R.J. 1995. Estimation, variance and optimalsampling of gene diversity. 1. Haploid locus. Theor. Appl.Genet. 90: 462–470.
Pons, O., and Petit, R.J. 1996. Measuring and testing genetic dif-ferentiation with ordered versus unordered alleles. Genetics,144: 1237–1245.
Salvini, D., Anzidei, M., Fineschi, S., Malvolti, M.E., Taurchini,D., and Vendramin, G.G. 2001. Low genetic differentiationamong Italian populations of Populus tremula L. (Salicaceae)estimated using chloroplast PCR–RFLP and microsatellitemarkers. For. Genet. 8: 81–88.
Taberlet, P., Gielly, L., Patou, G., and Bouvet, J. 1991. Universalprimers for amplification of three non-coding regions of chloro-plast DNA. Plant Mol. Biol. 17: 1105–1109.
Taberlet, P., Fumagalli, L., Wust-Saucy, A.G., and Cosson, J.F.1998. Comparative phylogeography and postglacial colonizationroutes in Europe. Mol. Ecol. 7: 453–464.
Thompson, J.D. 1999. Population differentiation in Mediterraneanplants: insights into colonization history and the evolution andconservation of endemic species. Heredity, 82: 229–236.
© 2003 NRC Canada
2508 Can. J. For. Res. Vol. 33, 2003
I:\cjfr\cjfr3312\X03-179.vpDecember 9, 2003 11:13:25 AM
Color profile: Generic CMYK printer profileComposite Default screen