Embed Size (px)
Citation preview

Chlorophyll variability along the Louisiana-Texas coast from satellite wind and ocean color data
Eurico D’SaDepartment of Oceanography and Coastal Sciences
Louisiana State UniversityBaton Rouge, LA, USA
NASA - Applied Sciences Program Bureau of Ocean Energy Management
2012 Gregory G. Leptoukh Online Giovanni Workshop

Objectives
•Examine SeaWiFS derived chlorophyll a (Chl) distribution in relation to wind forcing using QuikSCAT satellite data in a large river-dominated coastal margin
•Use 10-year time series SeaWiFS Chl data to characterize its temporal variance by identifying dominant frequencies and examining their interannual variability
•Assess variability in Chl distribution (using Giovanni data) under two river discharge regimes
AtchafalayaMississippi
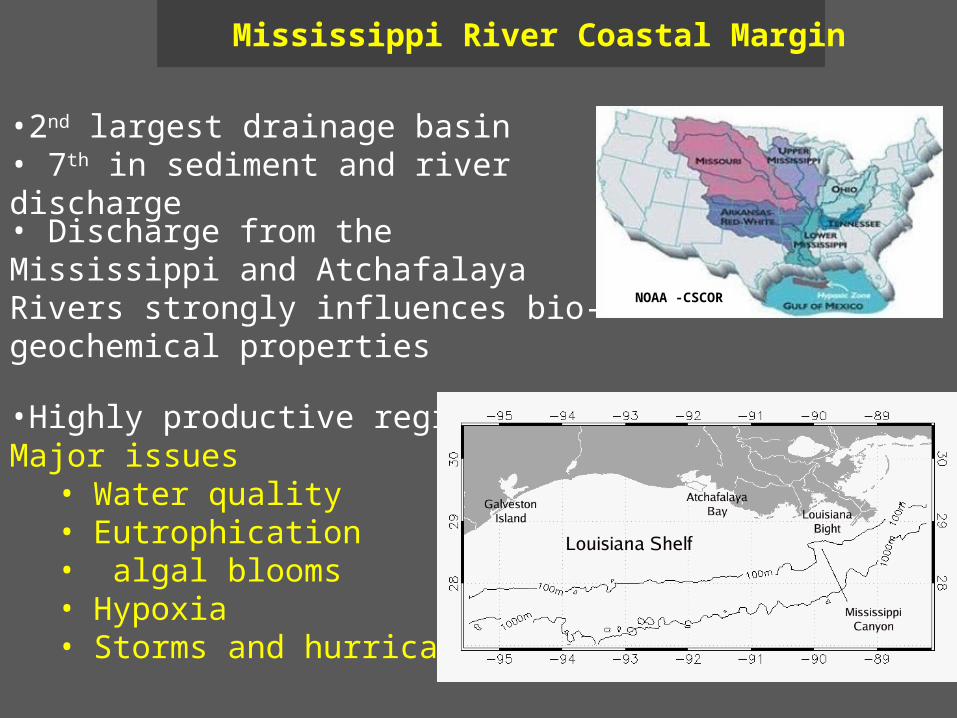
Mississippi River Coastal Margin
• Discharge from the Mississippi and Atchafalaya Rivers strongly influences bio-geochemical properties
•Highly productive region
•2nd largest drainage basin• 7th in sediment and river discharge
Major issues• Water quality • Eutrophication• algal blooms• Hypoxia • Storms and hurricanes
NOAA -CSCOR
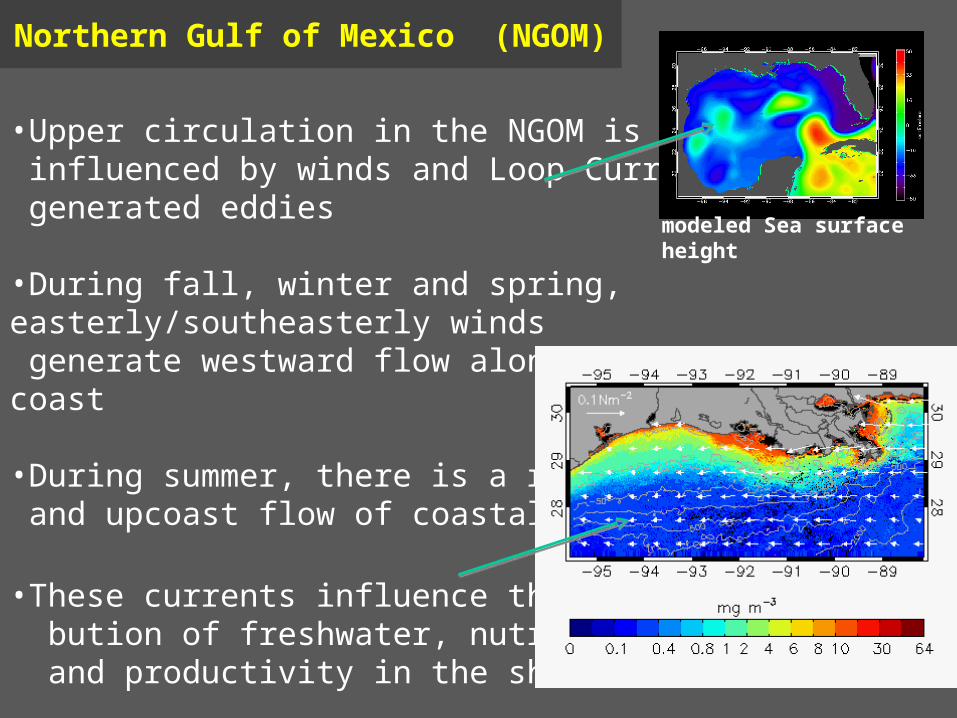
Northern Gulf of Mexico (NGOM)
•Upper circulation in the NGOM is strongly influenced by winds and Loop Current generated eddies
•During fall, winter and spring, easterly/southeasterly winds generate westward flow along the Louisiana coast
•During summer, there is a reversal and upcoast flow of coastal currents
•These currents influence the distri- bution of freshwater, nutrients and productivity in the shelf waters
modeled Sea surface height

Data
•QuikSCAT satellite wind data products were obtained from NASA JPL and processed for the Gulf (http://gulf-coast.lsu.edu)
•The 10-m scatterometer winds were converted to wind stress using the drag coefficient algorithm from Large and Pond 1981

QuikSCAT winds superimposed on Chl (monthly)
• An example of mean QuikSCAT derived wind stress vectors (N m-
2) superimposed on SeaWiFS Chl (mg m-3) for March 2000
• A, B, C and D denote locations for which time series Chl data were obtained from Giovanni

17 Mar 02
Chl dynamics during frontal passage
22 Mar 02
18 Mar 02
21 Mar 02
QuikSCAT winds
SeaWiFS Chl before and after a frontal passage in March 2002 (clouds masked in black)

Seasonal variability in Chl and river discharge
• River discharge (m3 s-1) from Jan 2000 to Dec 2001 obtained from Corps of Engineers gauge stations
• 2000 - was low flow river discharge year• 2001 – normal discharge year
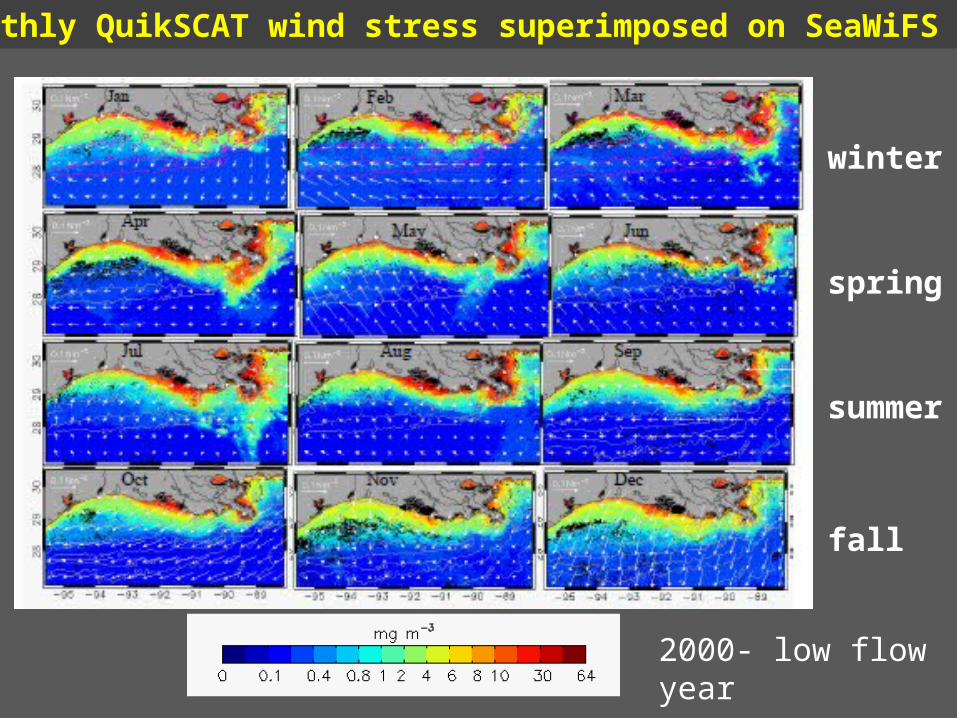
Monthly QuikSCAT wind stress superimposed on SeaWiFS Chl
winter
spring
summer
fall
2000- low flow year

Comparison to a normal discharge year
winter
spring
summer
fall
2001- normal flow year
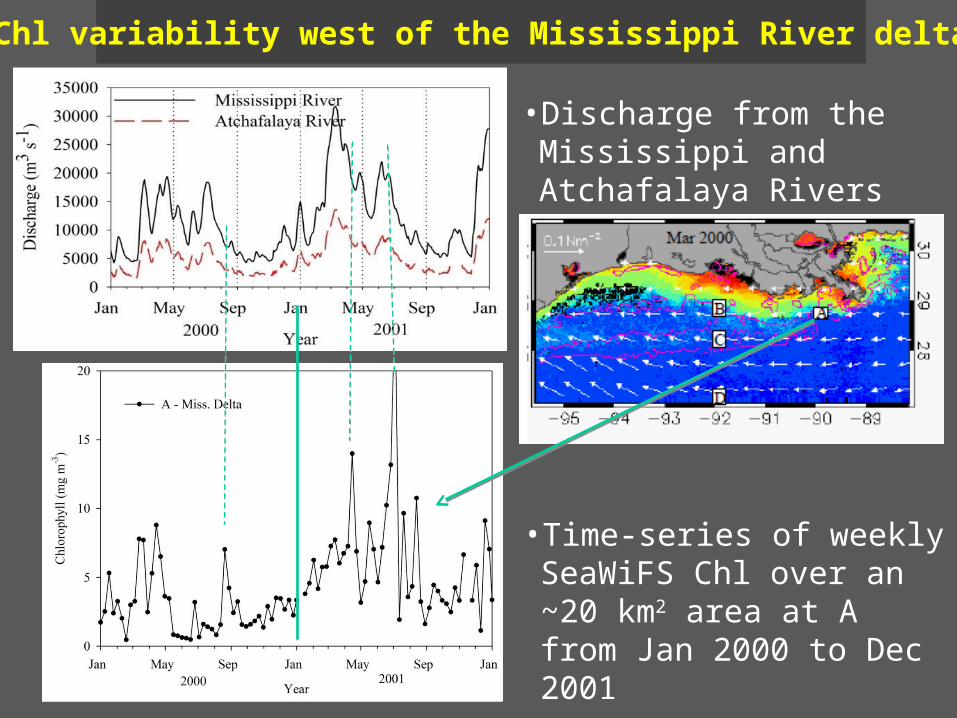
Chl variability west of the Mississippi River delta
• Time-series of weekly SeaWiFS Chl over an ~20 km2 area at A from Jan 2000 to Dec 2001
•Discharge from the Mississippi and Atchafalaya Rivers
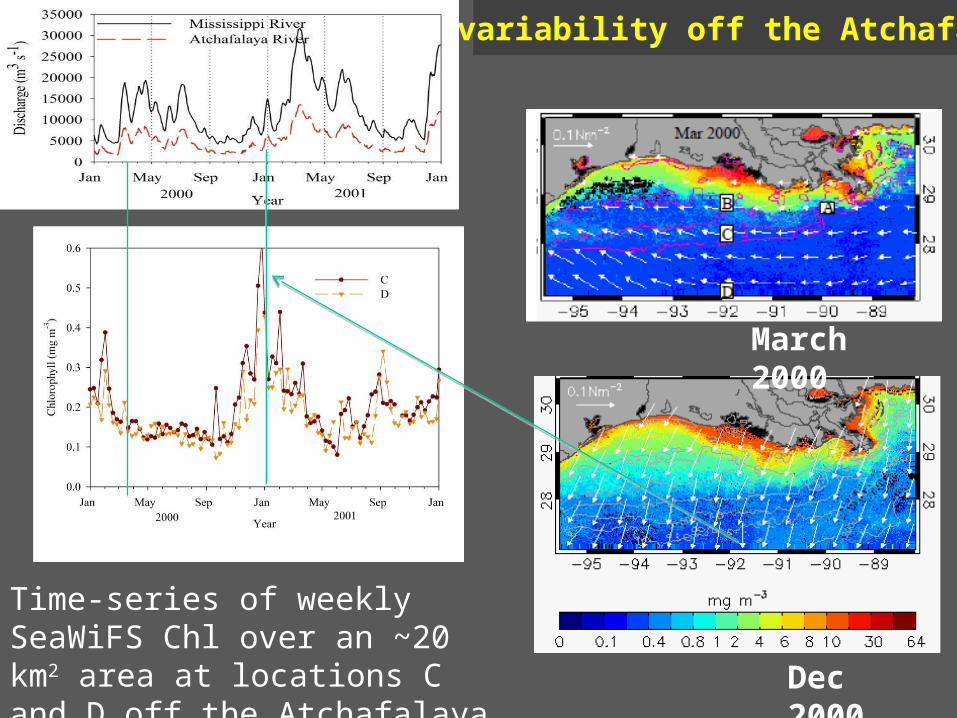
Chl variability off the Atchafalaya
Time-series of weekly SeaWiFS Chl over an ~20 km2 area at locations C and D off the Atchafalaya delta Dec 2000
March 2000

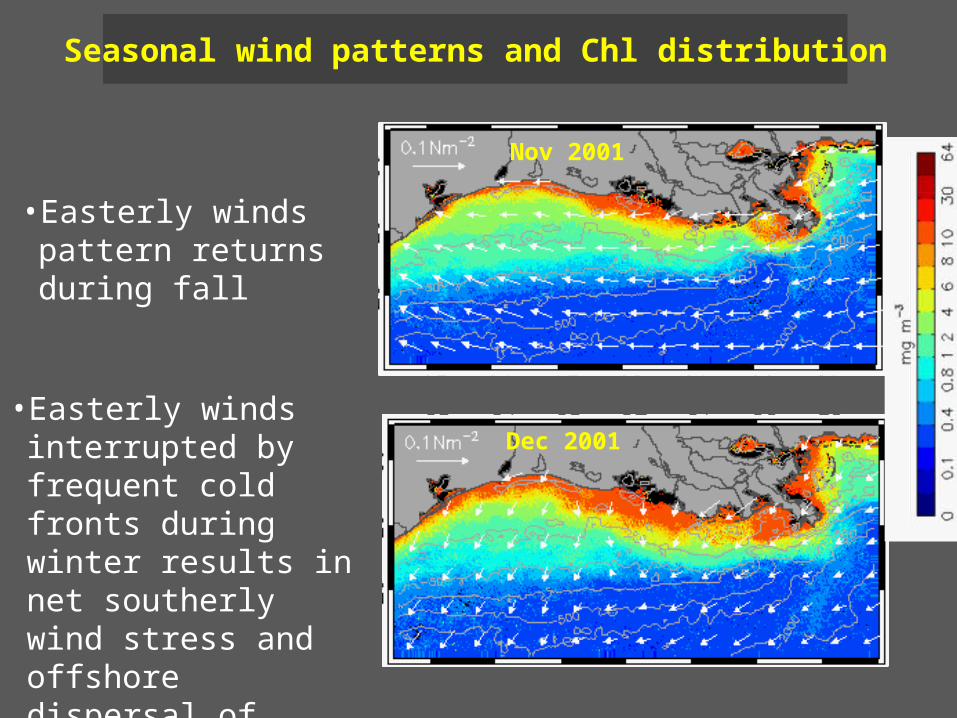
Seasonal wind patterns and Chl distribution
April 2001
June 2001
July 2001
• Easterly winds in April restrict plume waters with elevated Chl to inner shelf waters
• Easterly winds in April restrict plume waters with elevated Chl to inner shelf waters
• Easterly winds in April restrict plume waters with elevated Chl to inner shelf waters
Seasonal wind patterns and Chl distribution
Dec 2001
Nov 2001
• Easterly winds pattern returns during fall
• Easterly winds interrupted by frequent cold fronts during winter results in net southerly wind stress and offshore dispersal of nutrient enriched coastal waters

Wavelet analysis of time series Chl (1998-2007) along bathymetric contours
•Study area was divided into zones
•Time series Chl anomalies were determined for 20 m and 100 m isobaths and Wavelet Transform (WT) applied to mean Chl anomaly data
•The WT decomposes a signal into time-frequency space, quantifying not only the dominant modes of variability, but also how they vary in time
Applying the WT to the Chl time series yields the local wavelet power spectrum (original data unit squared or variance (mg m-3)2

Wavelet Analysis: Time series data 1998-2007 Chl variance at 20 m isobath west of Mississippi delta
• The wavelet power and can be interpreted as a ‘map’ of the time variability of dominant frequencies (Henson and Thomas 2007)
• The scale-averaged time series (bottom figure) is the mean variance contained in a 30-100 day period band
• The largest peak in wavelet power occurred in spring 2004 and a smaller peak in early 1999.
• In other years the variance was below 95% confidence interval

Chl variability west of the Atchafalaya delta – 100 m isobath
• Significant peaks in wavelet power occurred in June/July 2002 and September 2005 along 100 m isobath
Local wavelet power spectra
Scale-averaged time series for the period band 30-100 days

Chl variability west of the Atchafalaya delta – 100 m isobath
June/July 2002
Scale-averaged time series for the period band 30-100 days
• Significant variance in Chl in summer of 2002 off the Texas coast
Conclusions
•Combination of QuikSCAT winds and SeaWiFS chlorophyll data (processed and from Giovanni) have been used to examine short- and long-term Chl variability
•Synoptic influences of the wind field on surface Chl distributions were captured by the superimposed wind and Chl imagery
•In nearshore waters Chl was predominantly influenced by river discharge; at the offshore locations wind stress and energetic climatic events played a more significant role
•Strong seasonality in Chl spatial variability due to wind influence and river discharge
•New products in Giovanni 4 will be well suited for this type of study
References
•D’Sa, E. J., and M. Korobkin. 2009. Wind influence on chlorophyll variability along the Louisiana-Texas coast from satellite wind and ocean color data. Proceedings SPIE, Vol. 7473, 747305, doi:10.1117/12.830537.
•D’Sa, E. J., and M. Korobkin. 2009. Examining SeaWiFS chlorophyll variability along the Louisiana coast using wavelet analysis. Proceedings of the Oceans 2009 MTS/IEEE Conference, Biloxi, Mississippi, 5 pps. IEEE Catalog Number: 0-933957-38-1.
•Henson, S. and A. Thomas. 2007. Phytoplankton scales of variability in the California Current system: 1. Interannual and cross-shelf variability. JGR Oceans, 112, C07017.
•Walker, N. D., N. N. Rabalais. 2006. Relationships among satellite chlorophyll a, river inputs, and hypoxia on the Louisiana continental shelf, Gulf of Mexico. Estuaries and Coasts, 29, 1081-1093.

Thank You