Embed Size (px)
Citation preview
CHLORINE DIOXIDE WATERTREATMENT
- for hot and cold water services
N. L. PaveyM. Roper
B
Technical Note TN 2/98
CHLORINE DIOXIDE WATERTREATMENT
- for hot and cold water services
Technical Note TN 2/98
N L PaveyM Roper
BThe Building Services Researchand Information AssociationOld Bracknell Lane West,Bracknell, Berkshire RG12 7AHTel: + 44 (0)1344 426511 Fax: + 44 (0)1344 487575

ISBN 0 86022 486 4 Printed by Oakdale Printing Co ©BSRIA 79070 December 1997
All rights reserved. No part of this publication may be reproduced, stored in a retrieval system, or transmittedin any form or by any means electronic, mechanical, photocopying, recording or otherwise without prior writtenpermission of the publishers.

ACKNOWLEDGEMENTS
© BSRIA TN2/98 Chlorine Dioxide Water Treatment i
ACKNOWLEDGEMENTS
BSRIA would like to thank the following sponsors for their contributionwhich has led to the production of this Technical Note:
Department of the Environment, Transport and the RegionsChloroxy-Tech LtdFeedwater LtdHealth & Safety ExecutiveHertel (UK) LtdHouseman LtdNational Health Service Estates (DOH)The Royal Wolverhampton HospitalsPPP Healthcare GroupThames Water Utilities LtdWelsh Heath Estates (NHS)
The research project was undertaken under the guidance of a project steeringgroup drawn from industry representatives and BSRIA staff. The SteeringGroup contributors were:
Mr M Arrowsmith Dr D HoltDr D Charters Mr A LloydMr K Colgan Mr S MaidmentMr C H Dobson Mr T ParkinsonMr R Eycott Dr J RobinsonMr I Fraser Mr S ThomasMr R Godwin Mr J WilsonMr S Hartley
Microbiological results for this project were provided by the followingindividuals from the Centre for Applied Microbiology and Research(CAMR): Dr J Walker, Ms K Glavini
Acknowledgement is also given to the following companies who providedservices, technical advice or materials for this project:
Chloroxy-Tech Ltd ProMinent UK LtdFeedwater Ltd Water-Tech LtdGalco (UK) Ltd West of Scotland WaterPalintest Ltd
Contributing from BSRIA were: Mr N Pavey, Mr M Roper, Mr R Brown
Every opportunity has been taken to incorporate the views of the editorialpanel, but final editorial control of this document rests with BSRIA.

CONTENTS
© BSRIA TN2/98 Chlorine Dioxide Water Treatment iii
CONTENTS
PREFACE....................................................................................................................................... vii
EXECUTIVE SUMMARY............................................................................................................... ix
GLOSSARY OF TERMS................................................................................................................. xi
1 BACKGROUND INFORMATION ................................................................................................ 1
1.1 Legionella bacteria................................................................................................................... 11.2 Legislation............................................................................................................................... 11.3 Water quality standards............................................................................................................ 3
2 CHLORINE DIOXIDE WATER TREATMENT............................................................................ 6
2.1 Theory..................................................................................................................................... 62.2 Biocidal properties ................................................................................................................... 62.3 Chlorine dioxide in hot and cold water systems ......................................................................... 7
3 BSRIA TEST FACILITY ............................................................................................................. 13
3.1 Plant specification.................................................................................................................. 143.2 Microbiology ......................................................................................................................... 17
4 TEST PROGRAMME.................................................................................................................. 19
4.1 Objective ............................................................................................................................... 194.2 Infection ................................................................................................................................ 194.3 Disinfection ........................................................................................................................... 19
5 RESULTS .................................................................................................................................... 21
5.1 Chlorine dioxide control strategy ............................................................................................ 215.2 Measuring the success of bacteria disinfection ........................................................................ 215.3 Cisterns ................................................................................................................................. 22
5.3.1 Biofilms.......................................................................................................................... 245.4 Cold water pipework circuits.................................................................................................. 265.5 Cold water outlets .................................................................................................................. 305.6 Hot water calorifiers .............................................................................................................. 345.7 Hot water pipework circuits ................................................................................................... 355.8 Hot water outlets.................................................................................................................... 40
6 SUMMARY OF FINDINGS......................................................................................................... 46
6.1 Copper levels ......................................................................................................................... 47
7 CONCLUSIONS .......................................................................................................................... 49
7.1 Chlorine dioxide regime.......................................................................................................... 497.2 Temperature regime ............................................................................................................... 50
8 SPONSORS AND OTHER PROJECT CONTRIBUTORS........................................................... 51
INDEX............................................................................................................................................ 52
REFERENCES................................................................................................................................ 53
CONTENTS
iv Chlorine Dioxide Water Treatment ©BSRIA TN2/98
TABLES
Table 1.1 Bacterial Content Limits ........................................................................................4Table 4.1 Disinfection programme for the hot water system..................................................19Table 5.1 Biofilm coverage and recovery of heterotrophic bacteria and legionella from
biofilm on cold water outlet tap washers........................................................................33Table 5.2 Biofilm coverage and recovery of heterotrophic bacteria and legionella from
biofilm on copper coupons placed in base of calorifiers..................................................35Table 5.3 Biofilm coverage and recovery of heterotrophic bacteria and legionella from
washers on hot water taps with deadlegs .......................................................................41Table 5.4 Biofilm coverage and recovery of heterotrophic and legionella bacteria from
0-rings on shower mixers ..............................................................................................43Table 5.5 Biofilm coverage and recovery of heterotrophic bacteria and legionella from
washers on hot taps served from low temperature mixing valves....................................45Table 6.1 Disinfection rating of results..................................................................................46
FIGURES
Figure 3.1 Layout of chlorine dioxide system.......................................................................15Figure 3.2 BSRIA chlorine dioxide test rig - location for water sampling and
biofilm analysis..............................................................................................................17Figure 5.1 Chlorine dioxide concentrations in cisterns during disinfection .............................22Figure 5.2 Total oxidant levels measured in cisterns during disinfection ................................22Figure 5.3 Legionella (planktonic) results for cisterns during disinfection..............................23Figure 5.4 Heterotrophic bacteria (planktonic) results @ 22°C for cisterns during
disinfection....................................................................................................................24Figure 5.5 Biofilm coverage in cisterns during disinfection....................................................24Figure 5.6 Legionella recovered from biofilm in cisterns during disinfection..........................25Figure 5.7 Heterotrophic bacteria recovered @ 22°C from biofilm in cistern during
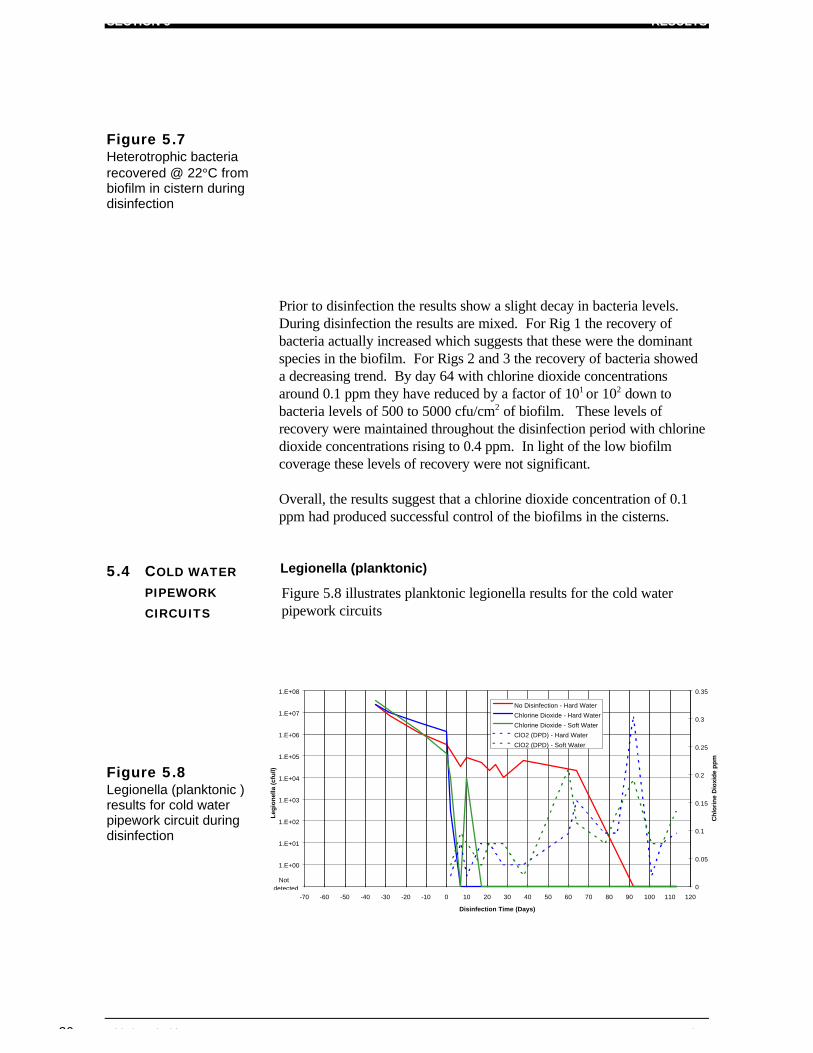
disinfection....................................................................................................................26Figure 5.8 Legionella (planktonic ) results for cold water pipework circuit during
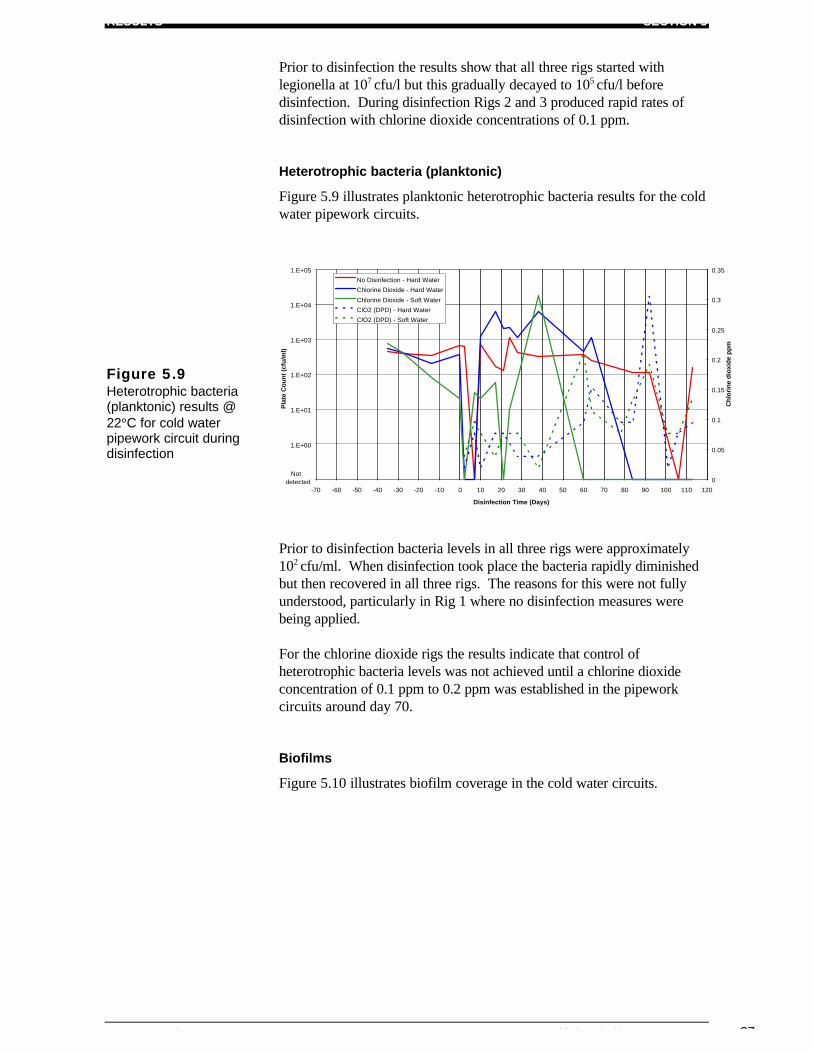
disinfection....................................................................................................................26Figure 5.9 Heterotrophic bacteria (planktonic) results @ 22°C for cold water
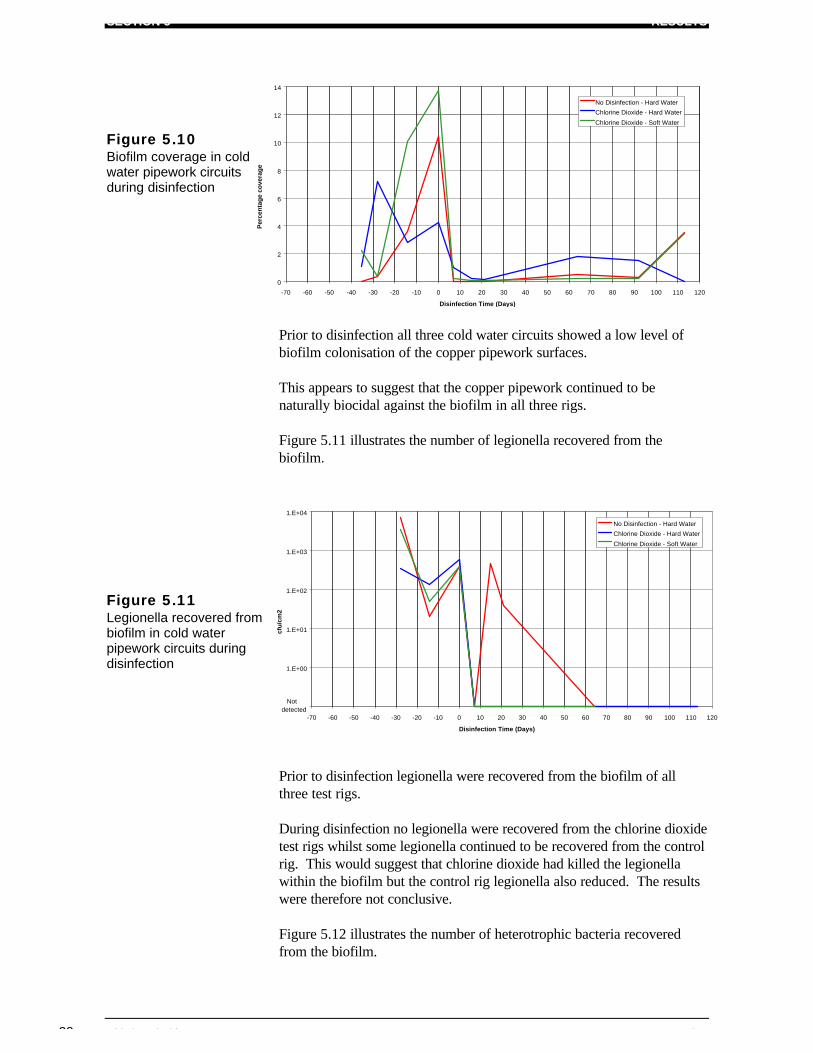
pipework circuit during disinfection...............................................................................27Figure 5.10 Biofilm coverage in cold water pipework circuits during disinfection..................28Figure 5.11 Legionella recovered from biofilm in cold water pipework circuits during
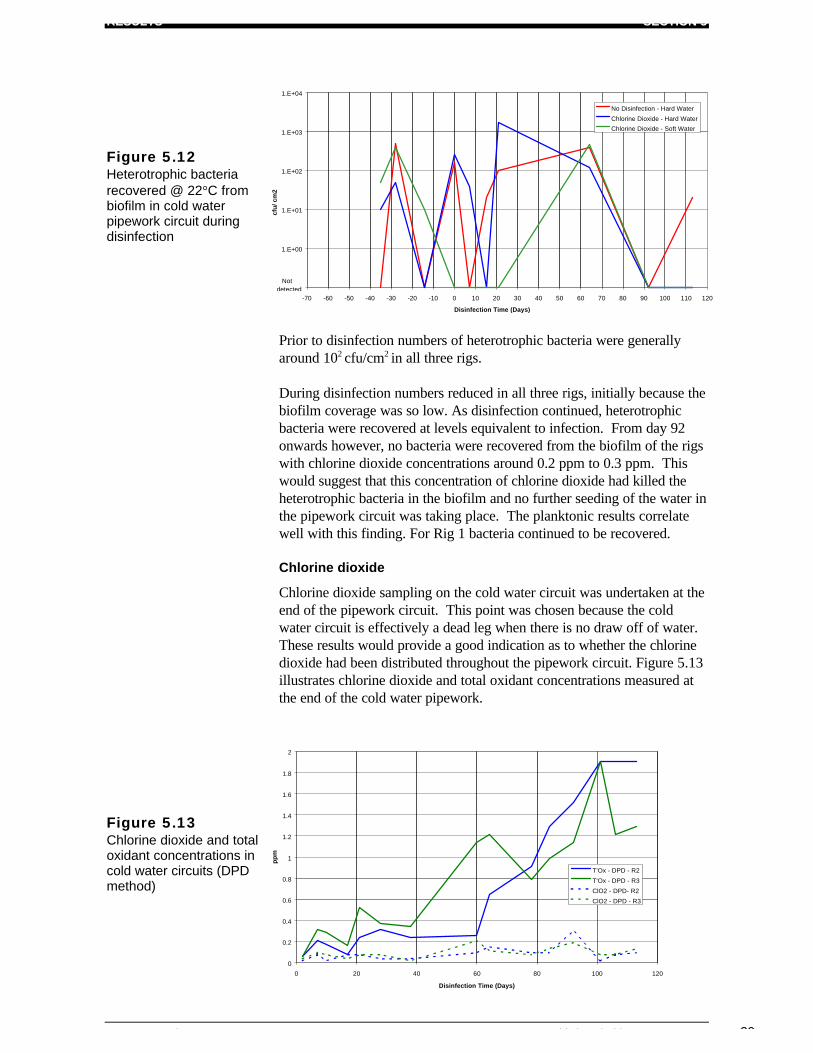
disinfection....................................................................................................................28Figure 5.12 Heterotrophic bacteria recovered @ 22°C from biofilm in cold water
pipework circuit during disinfection...............................................................................29Figure 5.13 Chlorine dioxide and total oxidant concentrations in cold water circuits
(DPD method) ..............................................................................................................29Figure 5.14 Copper levels measured in the cold water pipework circuits during
infection and disinfection...............................................................................................30Figure 5.15 Legionella (planktonic ) results for cold water outlet nearest to cistern
during disinfection.........................................................................................................31Figure 5.16 Legionella (planktonic ) results for cold water outlet furthest from cistern
during disinfection.........................................................................................................31
CONTENTS
© BSRIA TN2/98 Chlorine Dioxide Water Treatment v
Figure 5.17 Heterotrophic bacteria (planktonic) results @ 22°C for cold water outletnearest cistern during disinfection..................................................................................32
Figure 5.18 Heterotrophic bacteria (planktonic) results @ 22°C for cold water outletfurthest from cistern during disinfection.........................................................................32
Figure 5.19 Legionella (planktonic ) results for base of calorifier during disinfection.............34Figure 5.20 Heterotrophic bacteria (planktonic) results @ 37°C for base of calorifiers
during disinfection.........................................................................................................34Figure 5.21 Chlorine dioxide concentrations in hot water pipework circuits during
disinfection....................................................................................................................36Figure 5.22 Legionella (planktonic) results for hot water circuits during disinfection.............36Figure 5.23 Heterotrophic bacteria (planktonic) results @ 37°C for hot water circuits
during disinfection.........................................................................................................37Figure 5.24 Biofilm coverage in hot water pipework circuits during disinfection ...................37Figure 5.25 Legionella recovered from biofilm in hot water pipework circuits during
disinfection....................................................................................................................38Figure 5.26 Heterotrophic bacteria recovered @ 37°C from biofilm in hot water circuits
during disinfection.........................................................................................................39Figure 5.27 Copper levels measured in the hot water pipework circuits during
infection and disinfection...............................................................................................39Figure 5.28 Legionella (planktonic) results for hot water deadlegs during disinfection...........40Figure 5.29 Heterotrophic bacteria (planktonic) results @ 37°C for hot water deadlegs
during disinfection.........................................................................................................41Figure 5.30 Legionella (planktonic) results for showers during disinfection...........................42Figure 5.31 Heterotrophic bacteria (planktonic) results @ 37°C for showers during
disinfection....................................................................................................................43Figure 5.32 Legionella (planktonic) results for low temperature mixing valves during
disinfection....................................................................................................................44Figure 5.33 Heterotrophic bacteria (planktonic) results @ 37°C for low temperature
mixing valves during disinfection...................................................................................44
PLATES
Plate 2.1 Chlorine dioxide generation for potable water ........................................................10Plate 2.2 A typical chlorine dioxide generation unit...............................................................10Plate 3.1 BSRIA hot and cold water services test facility ......................................................13

PREFACE
© BSRIA TN2/98 Chlorine Dioxide Water Treatment vii
PREFACE
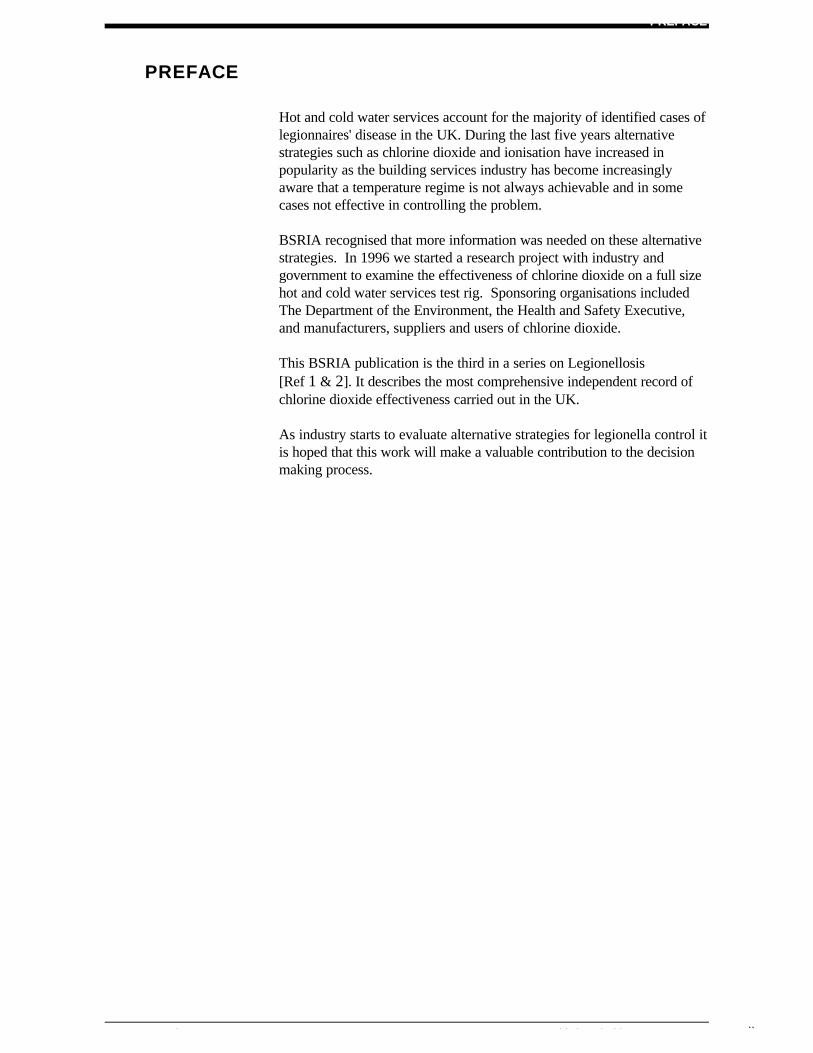
Hot and cold water services account for the majority of identified cases oflegionnaires' disease in the UK. During the last five years alternativestrategies such as chlorine dioxide and ionisation have increased inpopularity as the building services industry has become increasinglyaware that a temperature regime is not always achievable and in somecases not effective in controlling the problem.
BSRIA recognised that more information was needed on these alternativestrategies. In 1996 we started a research project with industry andgovernment to examine the effectiveness of chlorine dioxide on a full sizehot and cold water services test rig. Sponsoring organisations includedThe Department of the Environment, the Health and Safety Executive,and manufacturers, suppliers and users of chlorine dioxide.
This BSRIA publication is the third in a series on Legionellosis[Ref 1 & 2]. It describes the most comprehensive independent record ofchlorine dioxide effectiveness carried out in the UK.
As industry starts to evaluate alternative strategies for legionella control itis hoped that this work will make a valuable contribution to the decisionmaking process.

EXECUTIVE SUMMARY
© BSRIA TN2/98 Chlorine Dioxide Water Treatment ix
EXECUTIVE SUMMARY
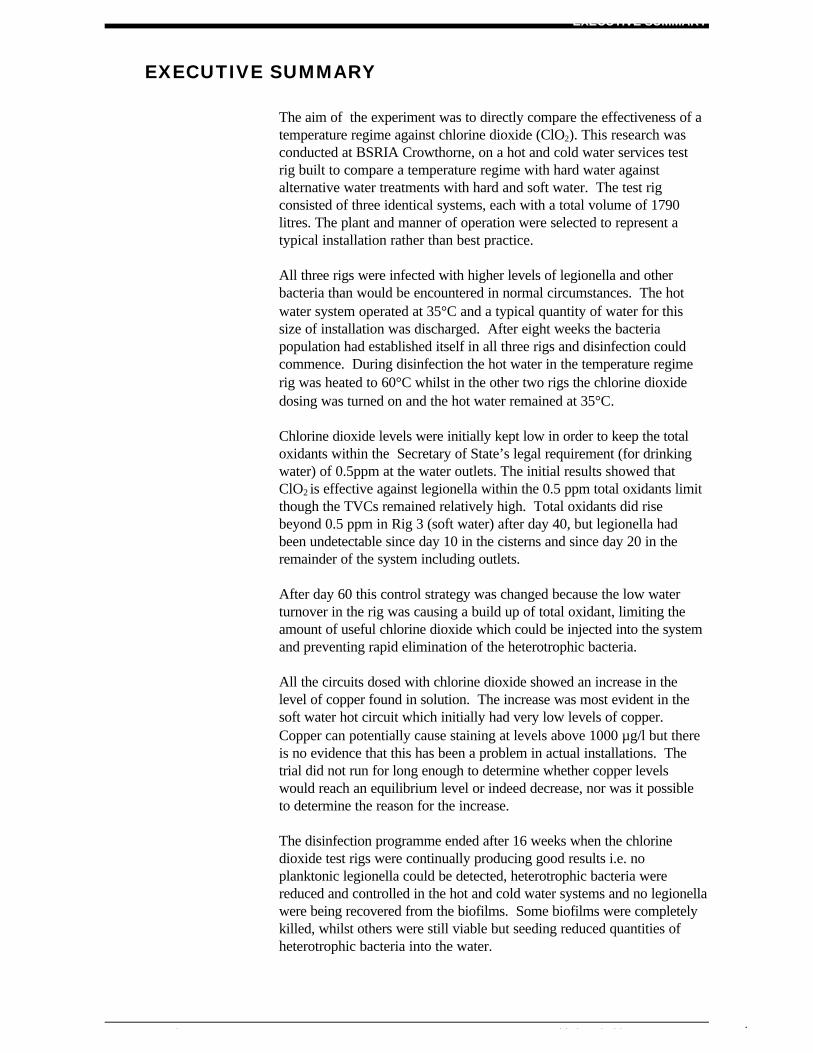
The aim of the experiment was to directly compare the effectiveness of atemperature regime against chlorine dioxide (ClO2). This research wasconducted at BSRIA Crowthorne, on a hot and cold water services testrig built to compare a temperature regime with hard water againstalternative water treatments with hard and soft water. The test rigconsisted of three identical systems, each with a total volume of 1790litres. The plant and manner of operation were selected to represent atypical installation rather than best practice.
All three rigs were infected with higher levels of legionella and otherbacteria than would be encountered in normal circumstances. The hotwater system operated at 35°C and a typical quantity of water for thissize of installation was discharged. After eight weeks the bacteriapopulation had established itself in all three rigs and disinfection couldcommence. During disinfection the hot water in the temperature regimerig was heated to 60°C whilst in the other two rigs the chlorine dioxidedosing was turned on and the hot water remained at 35°C.
Chlorine dioxide levels were initially kept low in order to keep the totaloxidants within the Secretary of State’s legal requirement (for drinkingwater) of 0.5ppm at the water outlets. The initial results showed thatClO2 is effective against legionella within the 0.5 ppm total oxidants limitthough the TVCs remained relatively high. Total oxidants did risebeyond 0.5 ppm in Rig 3 (soft water) after day 40, but legionella hadbeen undetectable since day 10 in the cisterns and since day 20 in theremainder of the system including outlets.
After day 60 this control strategy was changed because the low waterturnover in the rig was causing a build up of total oxidant, limiting theamount of useful chlorine dioxide which could be injected into the systemand preventing rapid elimination of the heterotrophic bacteria.
All the circuits dosed with chlorine dioxide showed an increase in thelevel of copper found in solution. The increase was most evident in thesoft water hot circuit which initially had very low levels of copper.Copper can potentially cause staining at levels above 1000 µg/l but thereis no evidence that this has been a problem in actual installations. Thetrial did not run for long enough to determine whether copper levelswould reach an equilibrium level or indeed decrease, nor was it possibleto determine the reason for the increase.
The disinfection programme ended after 16 weeks when the chlorinedioxide test rigs were continually producing good results i.e. noplanktonic legionella could be detected, heterotrophic bacteria werereduced and controlled in the hot and cold water systems and no legionellawere being recovered from the biofilms. Some biofilms were completelykilled, whilst others were still viable but seeding reduced quantities ofheterotrophic bacteria into the water.

EXECUTIVE SUMMARY
x Chlorine Dioxide Water Treatment ©BSRIA TN2/98
The corresponding results for the temperature regime were mixed. Incold water planktonic and biofilm results were poor because nodisinfection measures were applied. For hot water the results were muchbetter but planktonic legionella were detected even with watertemperatures maintained to HS(G)70 guidelines.
GLOSSARY OF TERMS
© BSRIA TN2/98 Chlorine Dioxide Water Treatment xi
GLOSSARY OF TERMS
BACTERIA These are typically single cell micro-organisms. Most are between 0.0005mm and 0.002 mm long and rarely exceed 0.01mm in length. They can bestudied under a high-powered microscope. Bacteria respire aerobically(using oxygen) eg legionella, or anaerobically (without oxygen). Diseasescaused by bacteria include pneumonia (eg legionnaires' disease), anthrax,typhoid fever, cholera etc.
BIOFILM A community of bacteria and other micro-organisms, embedded in aprotective layer with entrained debris, attached to a surface.
MICRO-ORGANISMS Microscopic life forms that can thrive in water systems. These includealgae, fungi and bacteria.
DROP TEST In this publication the phrase refers to a test used to determine totaloxidant. It uses a potassium iodide tablet and titration using sodiumthiosulphate.
DNA Deoxyribonucleic acid. This chemical consists of long molecules coiled ina double helix which along with protein forms chromosomes present in allorganisms. DNA is self-replicating. DNA is present in living and deadbacteria.
RNA Ribonucleic acid. This chemical is present in all organisms and plays animportant role in the synthesis of proteins. RNA is present in livingbacteria only.
ENZYMES Group of proteinaceous catalysts produced by living cells.
OXIDATION A process involving the gain of oxygen (or similar electronegative non-metals), loss of hydrogen or loss of electrons.
REDOX A reaction involving reduction and oxidation
TOTAL OXIDANT Expressed as ppm chlorine dioxide. It represents the total oxidisingcapability of the chlorine dioxide, chlorite and chlorate.

BACKGROUND INFORMATION SECTION 1
© BSRIA TN2/98 Chlorine Dioxide Water Treatment 1
1 BACKGROUND INFORMATION
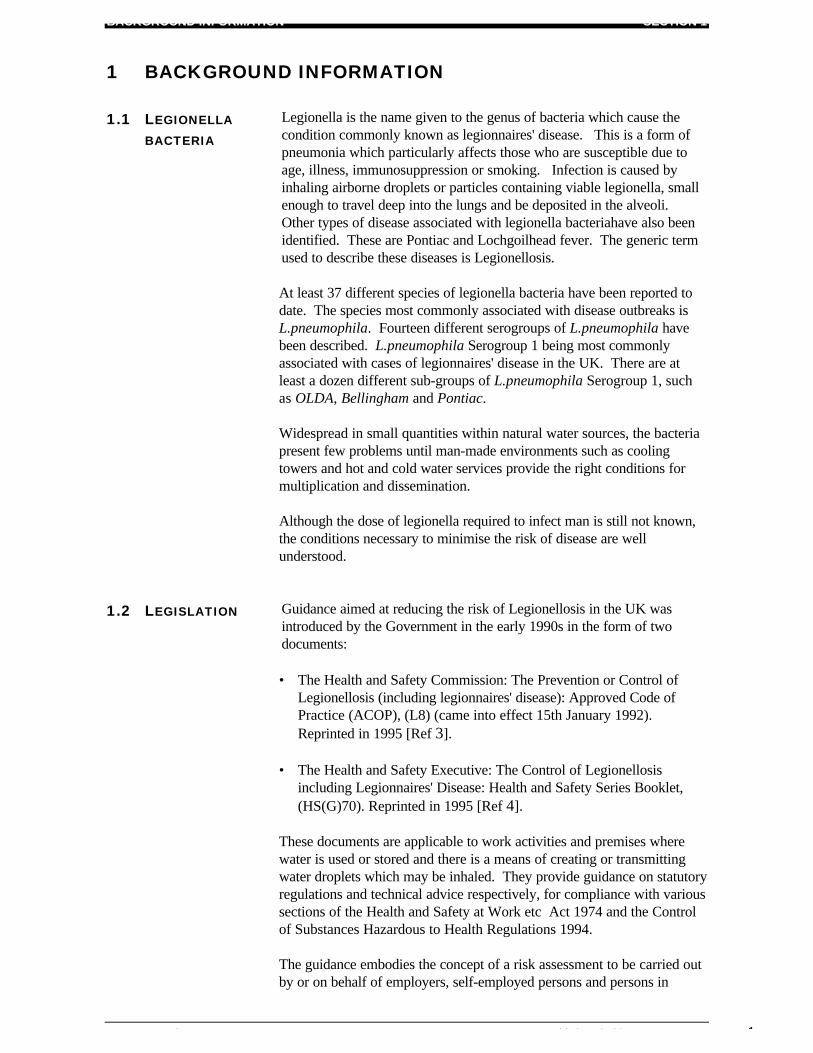
1.1 LEGIONELLABACTERIA
Legionella is the name given to the genus of bacteria which cause thecondition commonly known as legionnaires' disease. This is a form ofpneumonia which particularly affects those who are susceptible due toage, illness, immunosuppression or smoking. Infection is caused byinhaling airborne droplets or particles containing viable legionella, smallenough to travel deep into the lungs and be deposited in the alveoli.Other types of disease associated with legionella bacteriahave also beenidentified. These are Pontiac and Lochgoilhead fever. The generic termused to describe these diseases is Legionellosis.
At least 37 different species of legionella bacteria have been reported todate. The species most commonly associated with disease outbreaks isL.pneumophila. Fourteen different serogroups of L.pneumophila havebeen described. L.pneumophila Serogroup 1 being most commonlyassociated with cases of legionnaires' disease in the UK. There are atleast a dozen different sub-groups of L.pneumophila Serogroup 1, suchas OLDA, Bellingham and Pontiac.
Widespread in small quantities within natural water sources, the bacteriapresent few problems until man-made environments such as coolingtowers and hot and cold water services provide the right conditions formultiplication and dissemination.
Although the dose of legionella required to infect man is still not known,the conditions necessary to minimise the risk of disease are wellunderstood.
1.2 LEGISLATION Guidance aimed at reducing the risk of Legionellosis in the UK wasintroduced by the Government in the early 1990s in the form of twodocuments:
• The Health and Safety Commission: The Prevention or Control ofLegionellosis (including legionnaires' disease): Approved Code ofPractice (ACOP), (L8) (came into effect 15th January 1992).Reprinted in 1995 [Ref 3].
• The Health and Safety Executive: The Control of Legionellosis
including Legionnaires' Disease: Health and Safety Series Booklet,(HS(G)70). Reprinted in 1995 [Ref 4].
These documents are applicable to work activities and premises wherewater is used or stored and there is a means of creating or transmittingwater droplets which may be inhaled. They provide guidance on statutoryregulations and technical advice respectively, for compliance with varioussections of the Health and Safety at Work etc Act 1974 and the Controlof Substances Hazardous to Health Regulations 1994.
The guidance embodies the concept of a risk assessment to be carried outby or on behalf of employers, self-employed persons and persons in
SECTION 1 BACKGROUND INFORMATION
2 Chlorine Dioxide Water Treatment ©BSRIA TN2/98
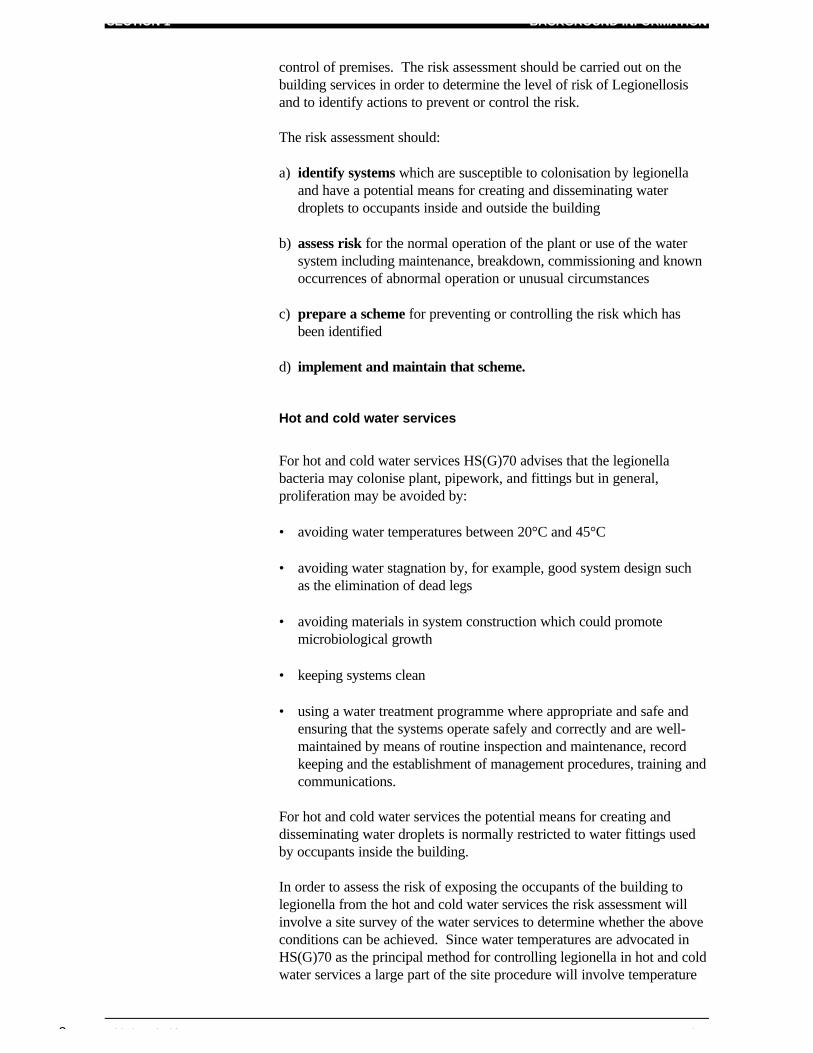
control of premises. The risk assessment should be carried out on thebuilding services in order to determine the level of risk of Legionellosisand to identify actions to prevent or control the risk.
The risk assessment should:
a) identify systems which are susceptible to colonisation by legionellaand have a potential means for creating and disseminating waterdroplets to occupants inside and outside the building
b) assess risk for the normal operation of the plant or use of the water
system including maintenance, breakdown, commissioning and knownoccurrences of abnormal operation or unusual circumstances
c) prepare a scheme for preventing or controlling the risk which has
been identified d) implement and maintain that scheme.
Hot and cold water services
For hot and cold water services HS(G)70 advises that the legionellabacteria may colonise plant, pipework, and fittings but in general,proliferation may be avoided by: • avoiding water temperatures between 20°C and 45°C • avoiding water stagnation by, for example, good system design such
as the elimination of dead legs • avoiding materials in system construction which could promote
microbiological growth • keeping systems clean • using a water treatment programme where appropriate and safe and
ensuring that the systems operate safely and correctly and are well-maintained by means of routine inspection and maintenance, recordkeeping and the establishment of management procedures, training andcommunications.
For hot and cold water services the potential means for creating anddisseminating water droplets is normally restricted to water fittings usedby occupants inside the building.
In order to assess the risk of exposing the occupants of the building tolegionella from the hot and cold water services the risk assessment willinvolve a site survey of the water services to determine whether the aboveconditions can be achieved. Since water temperatures are advocated inHS(G)70 as the principal method for controlling legionella in hot and coldwater services a large part of the site procedure will involve temperature
BACKGROUND INFORMATION SECTION 1
© BSRIA TN2/98 Chlorine Dioxide Water Treatment 3
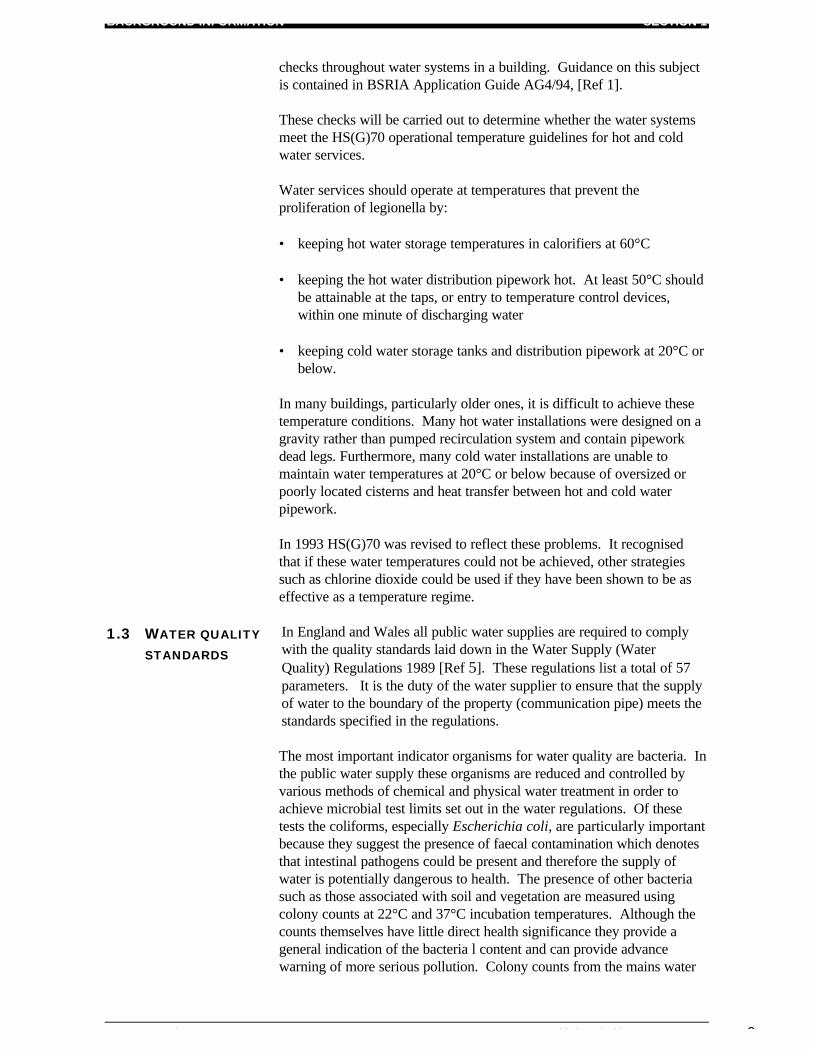
checks throughout water systems in a building. Guidance on this subjectis contained in BSRIA Application Guide AG4/94, [Ref 1].
These checks will be carried out to determine whether the water systemsmeet the HS(G)70 operational temperature guidelines for hot and coldwater services.
Water services should operate at temperatures that prevent theproliferation of legionella by:
• keeping hot water storage temperatures in calorifiers at 60°C • keeping the hot water distribution pipework hot. At least 50°C should
be attainable at the taps, or entry to temperature control devices,within one minute of discharging water
• keeping cold water storage tanks and distribution pipework at 20°C or
below.
In many buildings, particularly older ones, it is difficult to achieve thesetemperature conditions. Many hot water installations were designed on agravity rather than pumped recirculation system and contain pipeworkdead legs. Furthermore, many cold water installations are unable tomaintain water temperatures at 20°C or below because of oversized orpoorly located cisterns and heat transfer between hot and cold waterpipework.
In 1993 HS(G)70 was revised to reflect these problems. It recognisedthat if these water temperatures could not be achieved, other strategiessuch as chlorine dioxide could be used if they have been shown to be aseffective as a temperature regime.
1.3 WATER QUALITYSTANDARDS
In England and Wales all public water supplies are required to complywith the quality standards laid down in the Water Supply (WaterQuality) Regulations 1989 [Ref 5]. These regulations list a total of 57parameters. It is the duty of the water supplier to ensure that the supplyof water to the boundary of the property (communication pipe) meets thestandards specified in the regulations.
The most important indicator organisms for water quality are bacteria. Inthe public water supply these organisms are reduced and controlled byvarious methods of chemical and physical water treatment in order toachieve microbial test limits set out in the water regulations. Of thesetests the coliforms, especially Escherichia coli, are particularly importantbecause they suggest the presence of faecal contamination which denotesthat intestinal pathogens could be present and therefore the supply ofwater is potentially dangerous to health. The presence of other bacteriasuch as those associated with soil and vegetation are measured usingcolony counts at 22°C and 37°C incubation temperatures. Although thecounts themselves have little direct health significance they provide ageneral indication of the bacteria l content and can provide advancewarning of more serious pollution. Colony counts from the mains water
SECTION 1 BACKGROUND INFORMATION
4 Chlorine Dioxide Water Treatment ©BSRIA TN2/98
will vary according to seasonal factors. The water supply regulationstherefore prescribe that there should be no significant increase in thevalue of counts over that normally observed in the water supply.
The regulations do not list legionella as a control parameter for waterquality. This is because they are not normally infectious when swallowed.In practice low numbers of the bacteria have been found in the mainswater but it is widely accepted that conditions for colonisation are morefavourable in hot and cold water services within the building.
Quality of water in hot and cold water services
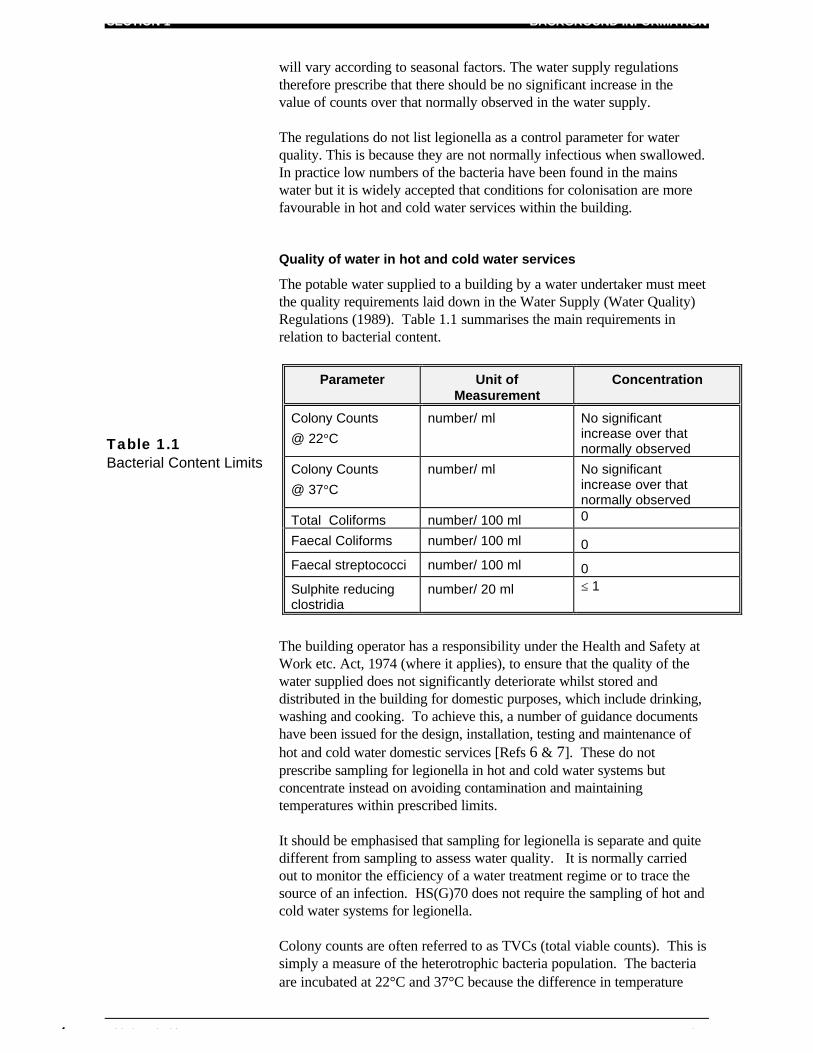
The potable water supplied to a building by a water undertaker must meetthe quality requirements laid down in the Water Supply (Water Quality)Regulations (1989). Table 1.1 summarises the main requirements inrelation to bacterial content.
Table 1.1Bacterial Content Limits
The building operator has a responsibility under the Health and Safety atWork etc. Act, 1974 (where it applies), to ensure that the quality of thewater supplied does not significantly deteriorate whilst stored anddistributed in the building for domestic purposes, which include drinking,washing and cooking. To achieve this, a number of guidance documentshave been issued for the design, installation, testing and maintenance ofhot and cold water domestic services [Refs 6 & 7]. These do notprescribe sampling for legionella in hot and cold water systems butconcentrate instead on avoiding contamination and maintainingtemperatures within prescribed limits.
It should be emphasised that sampling for legionella is separate and quitedifferent from sampling to assess water quality. It is normally carriedout to monitor the efficiency of a water treatment regime or to trace thesource of an infection. HS(G)70 does not require the sampling of hot andcold water systems for legionella.
Colony counts are often referred to as TVCs (total viable counts). This issimply a measure of the heterotrophic bacteria population. The bacteriaare incubated at 22°C and 37°C because the difference in temperature
Parameter Unit ofMeasurement
Concentration
Colony Counts
@ 22°C
number/ ml No significantincrease over thatnormally observed
Colony Counts
@ 37°C
number/ ml No significantincrease over thatnormally observed
Total Coliforms number/ 100 ml 0
Faecal Coliforms number/ 100 ml 0
Faecal streptococci number/ 100 ml 0
Sulphite reducingclostridia
number/ 20 ml ≤ 1

BACKGROUND INFORMATION SECTION 1
© BSRIA TN2/98 Chlorine Dioxide Water Treatment 5
provides an indication of the preferred habitat of the bacteria. 22°Crepresents the natural water environment and 37°C the body temperature.In general, bacteria results for cold water systems would tend to be higherat 22°C and results for hot water systems would tend to be higher at37°C. The preferred habitat of legionella bacteria is body temperature sothese bacteria are incubated at 37°C.
SECTION 2 CHLORINE DIOXIDE WATER TREATMENT
6 Chlorine Dioxide Water Treatment ©BSRIA TN2/98
2 CHLORINE DIOXIDE WATER TREATMENT
2.1 THEORY Chlorine dioxide (ClO2) is a yellow green gas and in its raw state it ishighly volatile and explosive at concentrations above 10% in air. It is amolecule with an unpaired electron that will readily react with othercompounds to gain an electron. The reaction process of chlorine dioxidewith bacteria or other substances involves two stages of oxidation whichleaves reduction by-products in the water. The first stage involvesgaining one electron to form chlorite and the second stage involvesgaining four electrons to form chloride (as in common salt). In practice,the first stage of oxidation predominates and therefore chlorite will be themajor by-product in the water. Another by-product in the water will bechlorate because this is present in proprietary solutions of chlorinedioxide. Both chlorite and chlorate have further oxidising capacity.
Chlorine dioxide, chlorate and chlorite ions are toxic. The WHOrecommended guideline for chlorite in drinking water is 0.2 mg/l. In orderto minimise the risk from ingestion of chlorine dioxide as well as theprecursors and by-products involved in the use of chlorine dioxide as adisinfection agent for drinking water, the Secretary of State’s legalrequirement is that the combined concentration of chlorine dioxide,chlorite and chlorate should not exceed 0.5 ppm chlorine dioxideequivalent (see section 2.3). The measurement of the combinedconcentration chlorine dioxide, chlorite and chlorate is described in thisreport as “total oxidants”
For hot and cold water services chlorine dioxide is usually generatedusing one of two methods. The first method is to generate the chlorinedioxide on site by mixing sodium chlorite with acid or chlorine. Thesecond method involves the use of proprietary solutions containing ablend of precursors which release chlorine dioxide on acidification.
2.2 BIOCIDALPROPERTIES
Chlorine dioxide is an oxidising biocide capable of reacting with a widerange of organic substances including many of the constituents ofbacterial cells. The low levels of chlorine dioxide used in drinking waterinactivate bacteria due to oxidation disrupting a number of different cellprocesses.
Several studies show that chlorine dioxide reacts readily with amino acids[Ref 8] and RNA [Ref 9]. Whether chlorine dioxide attacks theperipheral structure of the cell or the acids within is still not clear but it issuggested that oxidation reactions at both of these sites contribute to cellinactivation.
Other studies have looked at the effect of chlorine dioxide on thephysiological function of cells. These have shown that inactivation is dueto disruption of protein production [Ref 10 ] whilst other studies [Ref 11&12] have shown that the chlorine dioxide weakens the membrane of thecell and inhibits respiration. In general it has been shown that levels ofchlorine dioxide at 0.5 ppm produce an effective disinfection.
CHLORINE DIOXIDE WATER TREATMENT SECTION 2
© BSRIA TN2/98 Chlorine Dioxide Water Treatment 7
2.3 CHLORINEDIOXIDE IN HOTAND COLDWATER SYSTEMS
Background
As early as the 1940s published papers reported the efficacy of chlorinedioxide as a bactericide. Since 1949 it has occasionally been used for thetreatment of public water supplies and more often in large scaleprocesses like paper pulp mills where the gas is generated on site and canbe closely monitored. More recently, it has been used in the buildingservices industry as a method of water treatment.
The principles of the technology for building services were developed inthe 1970s with small scale chlorine dioxide generators and in the 1980swith a method of generating chlorine dioxide from a buffered solution.Chlorine dioxide is currently approved by the Secretary of State for theEnvironment, for use in the treatment of public water supplies, oncondition that the combined concentrations of chlorine dioxide, chloriteand chlorate, as chlorine dioxide, do not exceed 0.5 ppm. Such approvalis given upon the advice of the Committee on Chemicals and Materials ofConstruction for use in Public Water Supplies and Swimming Pools.
The construction of the chlorine dioxide plant
For chlorine dioxide generators the process typically relies on one of tworeactions with sodium chlorite to produce chlorine dioxide. The firstinvolves chlorine and the second is an acidification reaction using acid.In general the plant consists of two source chemicals, metering pumps,reaction chamber and monitoring system. The metering pumps aredesigned to transfer the source chemicals according to demand usingproportional dosing based on a water meter placed in the water system ora pulse controller. The dosing pumps feed the source chemicals into thereaction chamber where these react to form chlorine dioxide in solution.This chlorine dioxide solution is then injected into the water via aninjection valve.
For chlorine dioxide generated from a proprietary solution the plant isvery similar apart from the source chemicals. These are a solutioncontaining a blend of precursors and an acid. When mixed together in thereaction chamber the acid releases chlorine dioxide from the proprietarysolution.
The reaction chamber is normally a vortex chamber. This promotes theefficiency of generating chlorine dioxide by ensuring that the twochemicals completely mix at all water velocities.
The plant may contain a number of reaction chambers and injectionpoints dependent upon the size and complexity of the system beingserved. The size and number of dosing pumps and chemical stores willvary according to the application. This will depend upon a number offactors including the water volume in the system, flow rate, and theanticipated level of bacterial loading.
SECTION 2 CHLORINE DIOXIDE WATER TREATMENT
8 Chlorine Dioxide Water Treatment ©BSRIA TN2/98
In general, the most common injection point is the cold water cisternfeeding the hot and cold water services. This injection point wouldnormally dose the chlorine dioxide on a proportional basis according to asignal received from a water meter registering the amount of water beingused from the tank.
Other injection points in a hot and cold water services system are:
• The cold water main serving the entire water services in the building. • The hot water service return pipework to the water heater.
Operation and control
The dosing system is designed to inject chlorine dioxide at a controlledrate in order to maintain a desired concentration of chlorine dioxidethroughout the system.
The level of chlorine dioxide in the water is normally monitored and theratio of dosing relative to water usage adjusted accordingly. The methodof monitoring may be manual analysis or automatic via anelectrochemical (chlorine dioxide or redox) sensor.
The manual method involves measuring the level of chlorine dioxide insolution using portable test kits. The most commonly used method is thediethyl-p-phenylene diamine (DPD) method. This is based on the fact thatchlorine dioxide reacts with DPD in buffered solution to produce a pinkcolouration. Chlorine acts in a similar manner. Glycine is thereforeadded to prevent the reaction with chlorine in order to give specificdetermination of chlorine dioxide. A portable photometer is required toprovide the necessary precision of measurement. It is important to notethat the measured concentration of chlorine dioxide will not reflect theconcentration of by-products in the water.
As noted earlier, chlorine dioxide is authorised for use in public watersupplies on condition that the combined concentration of chlorine dioxide,chlorite and chlorate does not exceed 0.5 ppm. Whilst the condition ofapproval has no legal effect within buildings, where water is used fordrinking, washing, cooking or food production purposes it would beirresponsible to wilfully expose consumers to higher concentrations, giventhat the approval has been set to protect public health.
This means that the combined total of chlorine dioxide, chlorite andchlorate anywhere in the hot and cold water system may exceed 0.5 ppmprovided that this value is not contravened at the consumer’s taps. Toachieve this it is important to measure and take account of chlorites andchlorates already present in the incoming water supply and the watersystem. This should be done whether a manual or automatic system ofcontrol is used for the determination of the concentration of chlorinedioxide in the water. It is generally agreed that the combined total ofchlorine dioxide, chlorite and chlorate, commonly known as total oxidant

CHLORINE DIOXIDE WATER TREATMENT SECTION 2
© BSRIA TN2/98 Chlorine Dioxide Water Treatment 9
and can be measured using the DPD test, drop test or the oxidisingcapacity indicated by a redox sensor.
During the operation of the chlorine dioxide system it is important torecognise that variations in chlorine dioxide concentration and totaloxidant can occur according to the level of water usage. Periods of lowwater usage will generally produce low chlorine dioxide concentrationsand high total oxidant levels whilst those taken during periods of highwater usage will show high concentrations of chlorine dioxide and lowtotal oxidant levels. This is because chlorine dioxide is a comparativelytransient chemical.
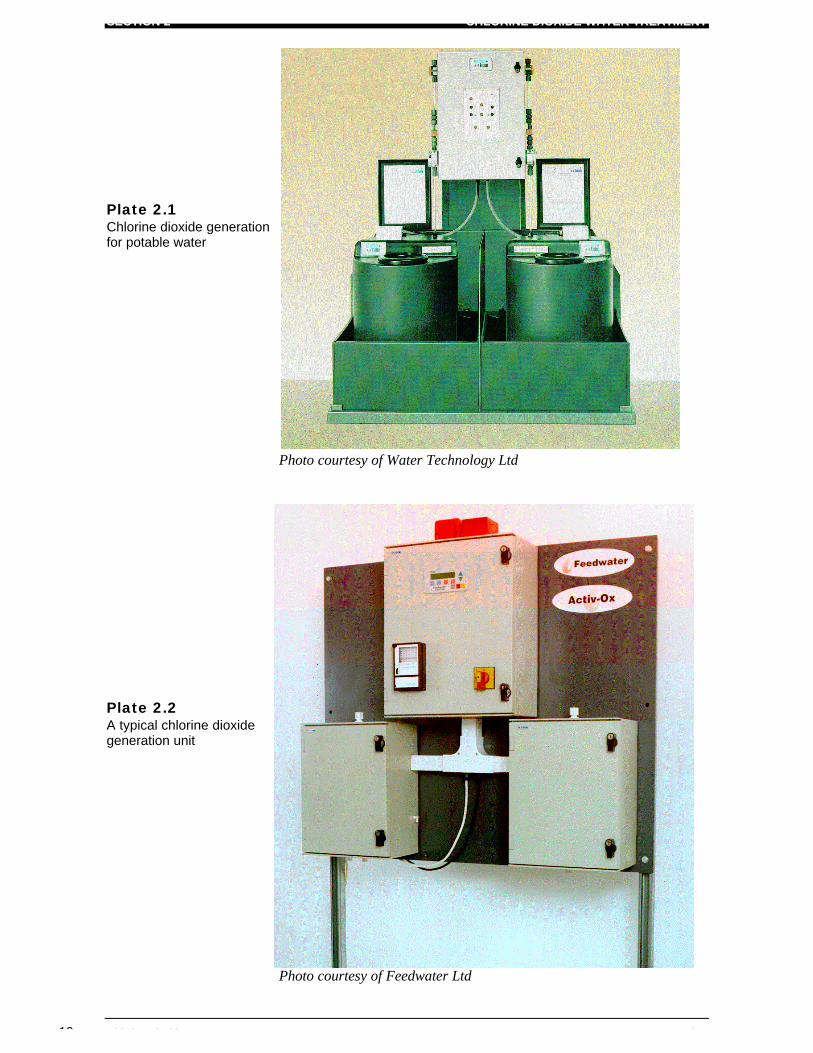
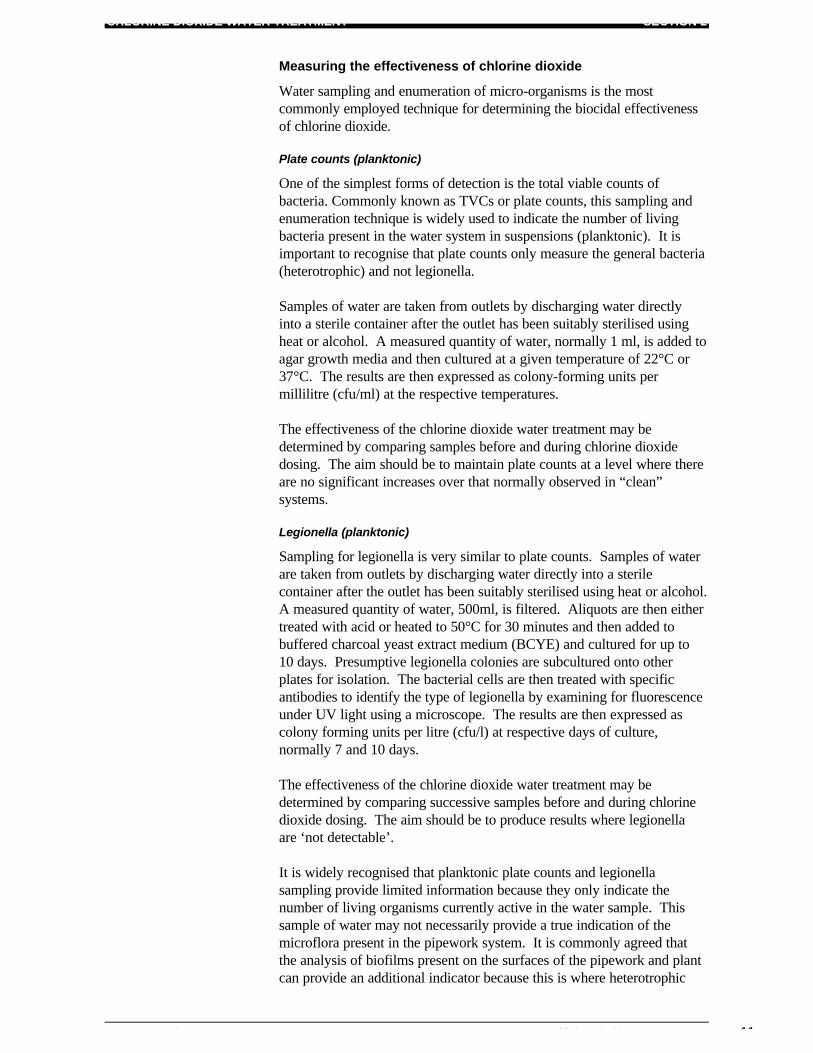
Plate 2.1 and Plate 2.2 illustrate chlorine dioxide units from UKmanufacturers.
SECTION 2 CHLORINE DIOXIDE WATER TREATMENT
10 Chlorine Dioxide Water Treatment ©BSRIA TN2/98
Plate 2.1Chlorine dioxide generationfor potable water
Photo courtesy of Water Technology Ltd
Plate 2.2A typical chlorine dioxidegeneration unit
Photo courtesy of Feedwater Ltd
CHLORINE DIOXIDE WATER TREATMENT SECTION 2
© BSRIA TN2/98 Chlorine Dioxide Water Treatment 11
Measuring the effectiveness of chlorine dioxide
Water sampling and enumeration of micro-organisms is the mostcommonly employed technique for determining the biocidal effectivenessof chlorine dioxide.
Plate counts (planktonic)
One of the simplest forms of detection is the total viable counts ofbacteria. Commonly known as TVCs or plate counts, this sampling andenumeration technique is widely used to indicate the number of livingbacteria present in the water system in suspensions (planktonic). It isimportant to recognise that plate counts only measure the general bacteria(heterotrophic) and not legionella.
Samples of water are taken from outlets by discharging water directlyinto a sterile container after the outlet has been suitably sterilised usingheat or alcohol. A measured quantity of water, normally 1 ml, is added toagar growth media and then cultured at a given temperature of 22°C or37°C. The results are then expressed as colony-forming units permillilitre (cfu/ml) at the respective temperatures.
The effectiveness of the chlorine dioxide water treatment may bedetermined by comparing samples before and during chlorine dioxidedosing. The aim should be to maintain plate counts at a level where thereare no significant increases over that normally observed in “clean”systems.
Legionella (planktonic)
Sampling for legionella is very similar to plate counts. Samples of waterare taken from outlets by discharging water directly into a sterilecontainer after the outlet has been suitably sterilised using heat or alcohol.A measured quantity of water, 500ml, is filtered. Aliquots are then eithertreated with acid or heated to 50°C for 30 minutes and then added tobuffered charcoal yeast extract medium (BCYE) and cultured for up to10 days. Presumptive legionella colonies are subcultured onto otherplates for isolation. The bacterial cells are then treated with specificantibodies to identify the type of legionella by examining for fluorescenceunder UV light using a microscope. The results are then expressed ascolony forming units per litre (cfu/l) at respective days of culture,normally 7 and 10 days.
The effectiveness of the chlorine dioxide water treatment may bedetermined by comparing successive samples before and during chlorinedioxide dosing. The aim should be to produce results where legionellaare ‘not detectable’.
It is widely recognised that planktonic plate counts and legionellasampling provide limited information because they only indicate thenumber of living organisms currently active in the water sample. Thissample of water may not necessarily provide a true indication of themicroflora present in the pipework system. It is commonly agreed thatthe analysis of biofilms present on the surfaces of the pipework and plantcan provide an additional indicator because this is where heterotrophic
SECTION 2 CHLORINE DIOXIDE WATER TREATMENT
12 Chlorine Dioxide Water Treatment ©BSRIA TN2/98
bacteriaand legionella survive even when planktonic measurementsindicate that the system is clean.
Biofilms
Work has shown that biofilm which occur on the internal surfaces ofpipework and plant are not homogenous layers [Ref 13]. In fact, theyhave a basal biofilm layer approximately 5-10 µm thick withmicrocolonies projecting 100 µm into the water. This feature is thought toallow water to circulate within the biofilm providing nutrients andoxygen to the bacteria present. The topology of the biofilm also providesa mosaic of micro-environments which are thought to provide a havenagainst biocide treatments.
For analysing biofilms a range of techniques is available, but the twomethods employed on this project were:
1. Fluorescent Microscopy
This technique is concerned with visualising the biofilm through amicroscope. On opaque materials such as copper pipework the techniqueuses a method called episcopic DIC (Differential Interference Contrast)microscopy. This involves staining a coupon specimen with a fluorescentdye which enables the biofilm on the surface to be visualised andphotographed. The images are then transferred to a computer andanalysed for percentage biofilm coverage using appropriate software.
2. Culture techniques
This technique is concerned with determining whether the biofilmcontains viable bacteria. The biofilm is scraped off the surface of thematerial and then cultured on a plate for heterotrophic or legionellabacteria using methods described in “Measuring the effectiveness ofchlorine dioxide”. Note that these results are expressed as colony-forming units per square centimetre of biofilm (cfu/cm2).
BSRIA TEST FACILITY SECTION 3
© BSRIA TN2/98 Chlorine Dioxide Water Treatment 13
3 BSRIA TEST FACILITY
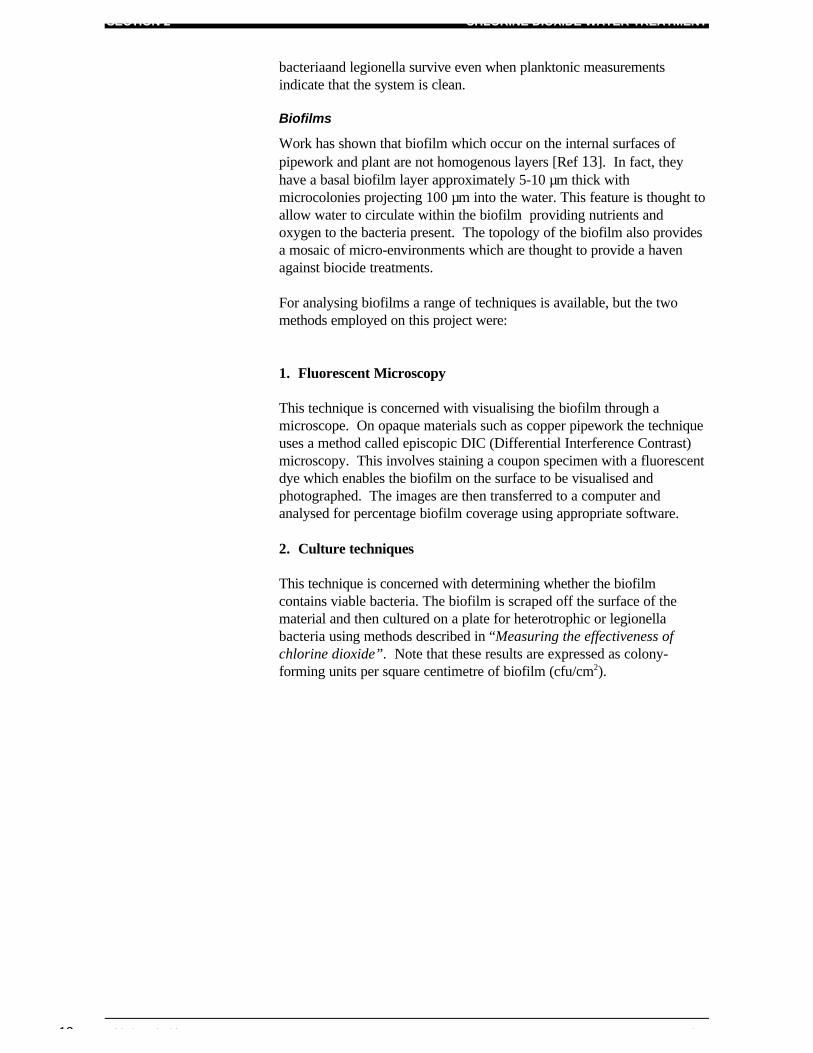
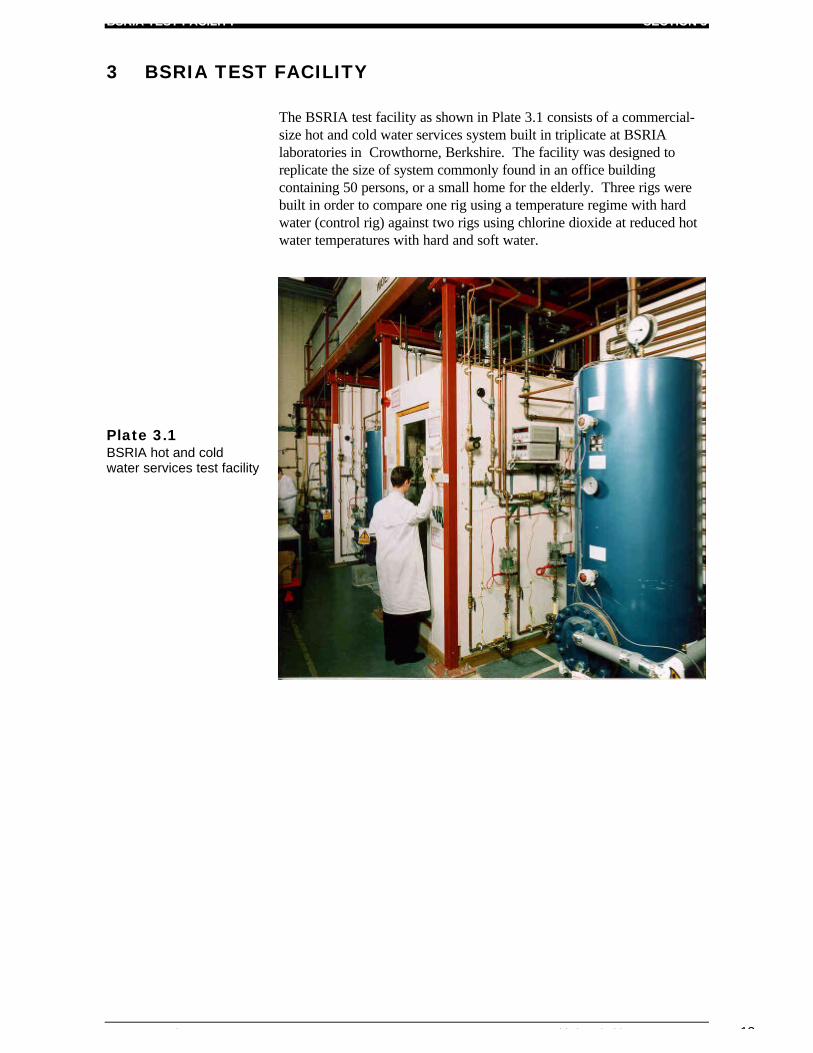
The BSRIA test facility as shown in Plate 3.1 consists of a commercial-size hot and cold water services system built in triplicate at BSRIAlaboratories in Crowthorne, Berkshire. The facility was designed toreplicate the size of system commonly found in an office buildingcontaining 50 persons, or a small home for the elderly. Three rigs werebuilt in order to compare one rig using a temperature regime with hardwater (control rig) against two rigs using chlorine dioxide at reduced hotwater temperatures with hard and soft water.
Plate 3.1BSRIA hot and coldwater services test facility
SECTION 3 BSRIA TEST FACILITY
14 Chlorine Dioxide Water Treatment ©BSRIA TN2/98
3.1 PLANTSPECIFICATION
Hot and cold water system
The cold water system in each rig consisted of a glass reinforced plasticcistern having a capacity of 1350 litres and manufactured to bylaw 30standards. This served a cold water copper pipework circuit 30 metres inlength.
The hot water system consisted of a vertical hot water storage calorifierof copper construction having a capacity of 440 litres. This had aconcave base and was not fitted with a shunt pump. This served a hotwater copper pipework circuit of 40 metres length. Each hot and coldwater pipework circuit was designed to replicate the normal length ofpipework which would be present in this size of system.
To discharge water from each circuit a number of water outlets wereinstalled on each rig:
• a hot water tap with a pipework dead leg exceeding therecommendations of BS 6700
• a thermostatic mixer shower with hose attachment • a low-temperature mixing valve • two cold water taps located nearest to and furthest from the cistern.
Each water outlet was fitted with a solenoid-operated valve controlled viaa building energy management system.
Water supplies
The success of a water treatment regime varies with different supplywaters. To give the chlorine dioxide results a national perspective a‘hard’ and ‘soft’ water were chosen as being representative of theextremes of water found in this country. The hard water was sourceddirect from the mains water supply in the building. This was used inRig 1 with the temperature regime, and Rig 2 with chlorine dioxide. Thesoft water was sourced from Glasgow. This was transported to BSRIAand stored in a tanker parked adjacent to the building housing the test rig.This was used in Rig 3 with chlorine dioxide.
Chlorine dioxide system
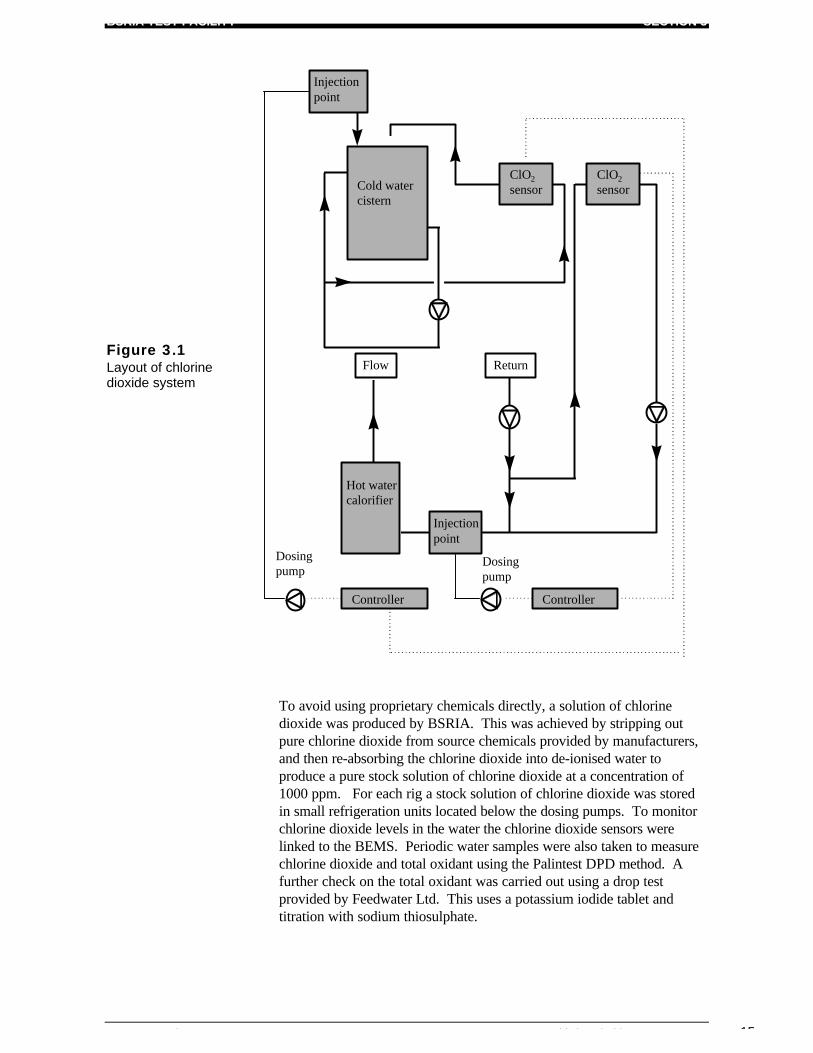
The BSRIA chlorine dioxide dosing system consists of one unit servingthe cold water cistern and one unit serving the hot water circuitindependently on each rig. Each unit consists of a dosing pump, chlorinedioxide sensor, controller and source chemicals. Each unit is designed tosense the chlorine dioxide in the water and dose a solution of chlorinedioxide into the system to achieve a set point on the controller. Figure 3.1illustrates the basic layout of the chlorine dioxide system.
BSRIA TEST FACILITY SECTION 3
© BSRIA TN2/98 Chlorine Dioxide Water Treatment 15
Figure 3.1Layout of chlorinedioxide system
To avoid using proprietary chemicals directly, a solution of chlorinedioxide was produced by BSRIA. This was achieved by stripping outpure chlorine dioxide from source chemicals provided by manufacturers,and then re-absorbing the chlorine dioxide into de-ionised water toproduce a pure stock solution of chlorine dioxide at a concentration of1000 ppm. For each rig a stock solution of chlorine dioxide was storedin small refrigeration units located below the dosing pumps. To monitorchlorine dioxide levels in the water the chlorine dioxide sensors werelinked to the BEMS. Periodic water samples were also taken to measurechlorine dioxide and total oxidant using the Palintest DPD method. Afurther check on the total oxidant was carried out using a drop testprovided by Feedwater Ltd. This uses a potassium iodide tablet andtitration with sodium thiosulphate.
Injectionpoint
Cold watercistern
ClO2
sensorClO2
sensor
Hot watercalorifier
Injection point
Controller Controller
Flow Return
Dosingpump
Dosingpump
SECTION 3 BSRIA TEST FACILITY
16 Chlorine Dioxide Water Treatment ©BSRIA TN2/98
General operating conditions
To replicate typical conditions in buildings the following conditions wereapplied to all three rigs:
• the water outlets were only discharged for 15 seconds every two hours • chlorine was removed from the incoming water supplies to the test
rigs. This was achieved by installing granulated activated carbon(GAC) filters. This action was taken for two reasons:
a) The mains water supply typically has free chlorine concentrationsbelow 1 ppm (mg/1). These concentrations are not sufficient toinactivate and suppress legionella or remove biofilm where thelegionella proliferate but they can have a disinfecting effect on theplanktonic heterotrophic bacteria Therefore, if the chlorine wasintroduced it would have been difficult to determine whether the decayof planktonic heterotrophic bacteriawas due to the chlorine in thewater or the method of disinfection being applied.
b) The amount of residual chlorine contained within the two incoming
supply waters would not be the same because the soft water is storedwhilst the hard water is direct from the main. This could lead todifferent results if the residual chlorine was allowed to enter the testrigs.
Building energy management system
A Trend BMS outstation was installed for controlling and monitoring allthree test rigs.
This carried out the following functions:
a) Control of hot water storage temperatures
b) Control of water discharges via solenoid valves
c) Monitoring water temperatures in the hot and cold water systems
d) Monitoring volume of water discharged from the entire test facility
e) Monitoring chlorine dioxide levels in the cisterns and hot water circuit
f) Control of safety circuits
The BMS system was linked to a personal computer running Trend ‘921’supervisory software. This offered the facility to alter control functionsand review data and produce graphs from current and historical data.
BSRIA TEST FACILITY SECTION 3
© BSRIA TN2/98 Chlorine Dioxide Water Treatment 17
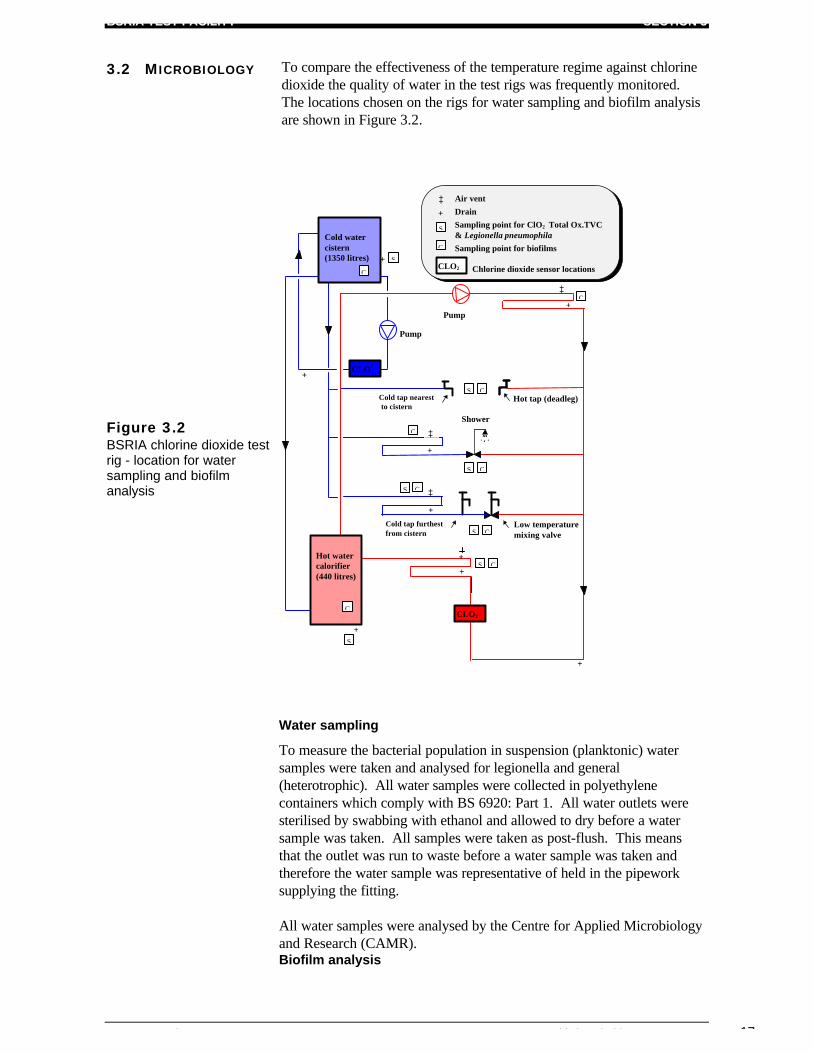
3.2 MICROBIOLOGY To compare the effectiveness of the temperature regime against chlorinedioxide the quality of water in the test rigs was frequently monitored.The locations chosen on the rigs for water sampling and biofilm analysisare shown in Figure 3.2.
Figure 3.2BSRIA chlorine dioxide testrig - location for watersampling and biofilmanalysis
Water sampling
To measure the bacterial population in suspension (planktonic) watersamples were taken and analysed for legionella and general(heterotrophic). All water samples were collected in polyethylenecontainers which comply with BS 6920: Part 1. All water outlets weresterilised by swabbing with ethanol and allowed to dry before a watersample was taken. All samples were taken as post-flush. This meansthat the outlet was run to waste before a water sample was taken andtherefore the water sample was representative of held in the pipeworksupplying the fitting.
All water samples were analysed by the Centre for Applied Microbiologyand Research (CAMR).Biofilm analysis
Cold watercistern(1350 litres) +
Cold tap nearest to cistern
Pump
Pump
+
Shower
Cold tap furthestfrom cistern
+
+ +
Hot watercalorifier(440 litres)
+
+
+
+
+
+ +C
Air vent
Drain
Sampling point for ClO2 Total Ox.TVC& Legionella pneumophila
Sampling point for biofilms
Chlorine dioxide sensor locations
S
C
+
+ +
+
+ +
Hot tap (deadleg)
Low temperaturemixing valve
S C
CS
CS
CS
CS
C
C
S
S
C
CLO2
CLO2
CLO2
SECTION 3 BSRIA TEST FACILITY
18 Chlorine Dioxide Water Treatment ©BSRIA TN2/98
This included analysing the coverage of biofilms and determining theexistence and number of viable legionella and heterotrophicbacteriawithin them. Biofilms were analysed in the copper pipeworkcircuits, base of the calorifiers and the GRP cisterns by removing smallmaterial coupons and visually recording the percentage biofilm coverageusing the episcopic DIC (Differential Interference Contrast) microscopytechnique. Total culturable counts of bacteria were obtained by scrapingthe biofilm and incubating on BCYE and selective buffered charcoalyeast extract medium with antibiotic supplements (GVPC) for legionella,and nutrient agar for heterotrophic bacteria. All biofilm samples wereanalysed by the Centre for Applied Microbiology and Research (CAMR).
Copper pipework coupons
To remove copper coupons from the pipework circuits a “trombone”arrangement was designed by BSRIA. This consisted of a pipeworktrombone with two valves having compression fittings, a drain cock and avent. The trombone was removed by isolating the valves, opening thevent and draining down. Using a pipe cutter, a copper coupon (section ofpipe) was removed from the top and bottom of the trombone. One ofthese coupons was then filled with source water, capped at both ends tokeep the biofilm hydrated, and boxed for transport to CAMR. Theremainder of the trombone was then installed back into the pipeworkcircuit using new olives on the compression fittings.
Biofilms are not homogenous throughout a pipework system. For thisreason, coupon samples were taken on a rotational basis at two locationson the cold and hot water circuits. These were at the beginning and endof the hot water pipework circuit and middle and end of the cold waterpipework circuits.
Base of calorifier coupons
On each rig a copper pipework coupon was placed in the base of thecalorifier before infection took place. These coupons were removed at theend of the project.
Cistern coupons
Glass reinforced plastic (GRP) coupons 2 cm2 in area were provided bythe manufacturer of the cisterns. These coupons had a smooth facereflecting the inside surface of the cisterns. The coupons were suspendedon monofilament lines in the cisterns. Sampling involved removing acoupon and placing it in a container with source water for transport toCAMR for analysis.
TEST PROGRAMME SECTION 4
© BSRIA TN2/98 Chlorine Dioxide Water Treatment 19
4 TEST PROGRAMME
4.1 OBJECTIVE The objective of the test programme was to assess the effectiveness ofchlorine dioxide at reduced water temperatures against a temperatureregime for the disinfection and control of microbiological contaminantsincluding legionella bacteria in a hot and cold water system.
To achieve this objective the test programme was divided into two distinctstages:
• Infection • Disinfection
4.2 INFECTION The infection stage of the project was designed to allow a mixture ofwaterborne micro-organisms, including a non-pathogenic strain oflegionella L. pneumophila, Serogroup 1, sub type ‘Pontiac’ to infect therig.
The inoculum for infection consisted of:
L.pneumophila, P. aeruginosa, P. acidovorans, P.diminuta,P.fluorescens, P.maltophilia, P.mendocina, P.paucimobilis, P.stutzeri,P.testosteroii, P.vesicularis, P.xylosoxidans, Actinomycetes sp.,Aeromonas sp.,Alcaligenes sp., Flavobacterium sp., Methylobacteriumsp., Klebsiella sp., Acinetobacter sp.
This inoculum was prepared by CAMR (The Centre for AppliedMicrobiology and Research) at Salisbury. Each rig was inoculated viathe cold water cistern and the cold and hot water systems were operated.To promote bacterial growth during this period the hot water storagetemperatures were held at 35°C.
Before disinfection could commence two conditions had to be achieved.Firstly, the bacterial population needed to have reached steady stateconditions so that any further population variations in bacteria could notbe then be attributed to any influences other than disinfection. Secondly,the resulting bacterial population had to be large enough to show, withoutquestion, the comparable effects of temperature and chlorine dioxidedisinfection.
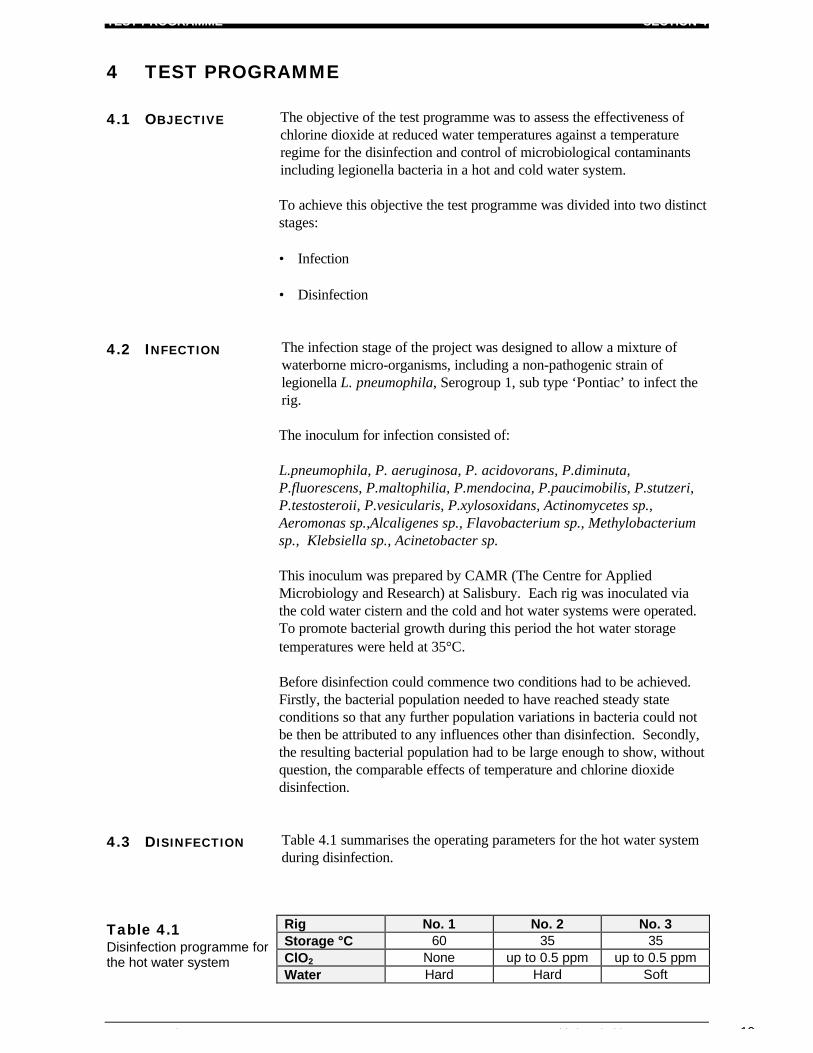
4.3 DISINFECTION Table 4.1 summarises the operating parameters for the hot water systemduring disinfection.
Table 4.1Disinfection programme forthe hot water system
Rig No. 1 No. 2 No. 3Storage °C 60 35 35ClO2 None up to 0.5 ppm up to 0.5 ppmWater Hard Hard Soft
SECTION 4 TEST PROGRAMME
20 Chlorine Dioxide Water Treatment ©BSRIA TN2/98
To evaluate chlorine dioxide at reduced hot water temperatures thedecision was taken to leave the stored hot water at the incubationtemperature of 35°C. This avoided any temperature induced changes inthe bacterial population during disinfection.
For the temperature regime the temperature of the stored hot water wasincreased to 60°C in the calorifier and the return water temperature to thecalorifier was maintained at 50°C or above throughout the disinfectionperiod.
For the cold water system the test programme was a direct comparisonbetween a rig with a temperature regime where the stored water is keptwithin HS(G)70 temperature recommendations and the other two rigswhere chlorine dioxide water treatment is additionally applied via thecisterns.
RESULTS SECTION 5
© BSRIA TN2/98 Chlorine Dioxide Water Treatment 21
5 RESULTS
5.1 CHLORINEDIOXIDECONTROLSTRATEGY
During the first sixty days of disinfection the chlorine dioxide levels werekept low in order to keep the total oxidant within the approved limit of0.5ppm at the water outlets. To achieve this the set points on the hotwater circuit and cold water cistern were set at 0.01 and 0.04 ppm ClO2
respectively. The set point for the hot water circuit was set lowerbecause the calorifier was fed with water from the cistern.
After day 60 this control strategy was changed because the low turnoverof water in the rig was causing the total oxidant levels to stay high whichlimited the amount of useful chlorine dioxide which could be injected intothe system. The bacteria results showed that whilst the planktoniclegionella were removed the heterotrophic bacteria remained and thebiofilm results were inconclusive. The set points for the hot and coldwater were therefore increased to 0.05 and 0.1 ppm ClO2 respectively andthe level of total oxidant at the outlets was measured but not used as acontrol parameter.
At day 72 the control strategy was further changed because theplanktonic TVCs suggested that biofilm was still present and seeding thesystem. The set points were increased to 0.2ppm ClO2 on both the hotand cold water.
At day 96 the set points were further increased to 0.4 ppm ClO2 on boththe hot and cold water till the end of the project. This was carried outbecause the planktonic TVC results were still questionable and the lasttwo weeks of testing provided the opportunity to see how effectivechlorine dioxide would be at these levels.
5.2 MEASURING THESUCCESS OFBACTERIADISINFECTION
To measure the success of bacteria disinfection, the following guidelineswere used:
Legionella and plate counts
A successful disinfection regime was considered to be one in which thelegionella were ‘not detectable’ and the plate counts at 22°C and 37°Cshowed no significant increase over background levels.
Biofilms
A successful disinfection regime for biofilms was considered to be one inwhich the capability of the biofilm to seed the water with legionellabacteria was removed, and heterotrophic bacteria were removed orreduced to low levels. To assess this two parameters were considered.
The first parameter was biofilm coverage. This would ideally reduce butbecause the analysis of biofilm coverage used a dye which reacts withDNA, present in both dead and live bacteria, the results would not beconclusive because dead bacteria can remain as deposits, particularly inhard water.
SECTION 5 RESULTS
22 Chlorine Dioxide Water Treatment ©BSRIA TN2/98
The second parameter was recovery of bacteria from the biofilm whichwould indicate whether the biofilm was viable. If the recovery of bacteriaproduced negative results for legionella and negative or low results forheterotrophic bacteria then disinfection was successful.
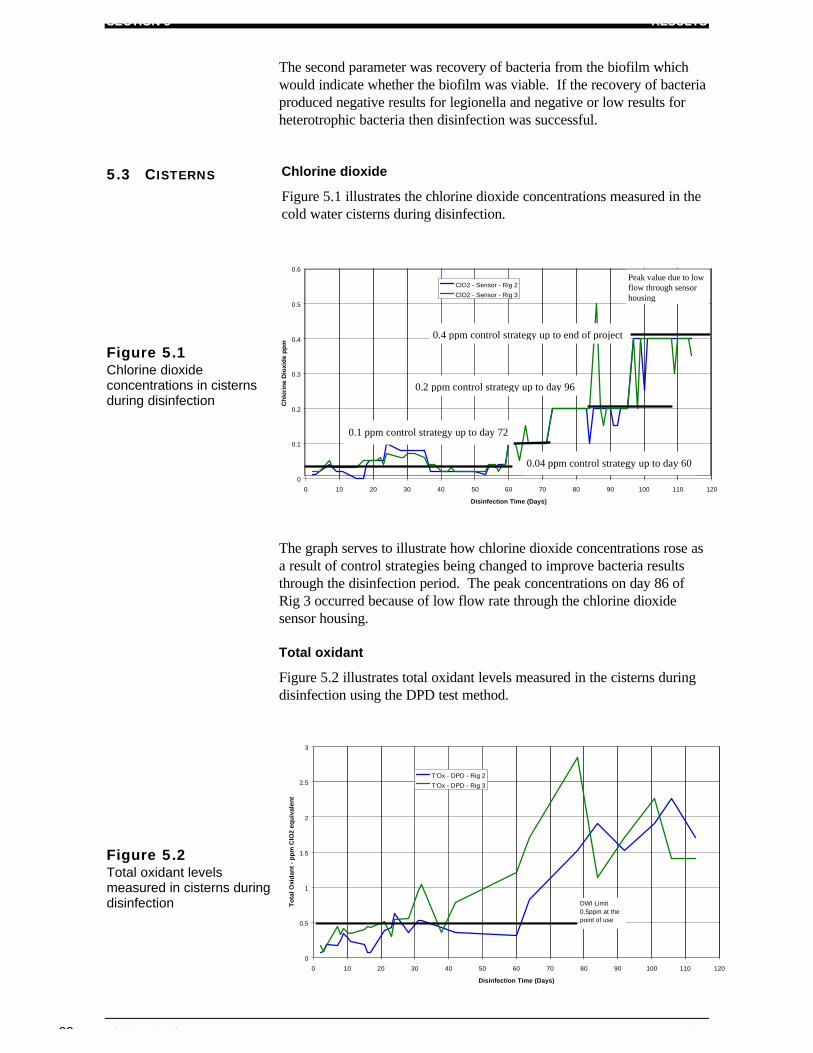
5.3 CISTERNS Chlorine dioxide
Figure 5.1 illustrates the chlorine dioxide concentrations measured in thecold water cisterns during disinfection.
Figure 5.1Chlorine dioxideconcentrations in cisternsduring disinfection
The graph serves to illustrate how chlorine dioxide concentrations rose asa result of control strategies being changed to improve bacteria resultsthrough the disinfection period. The peak concentrations on day 86 ofRig 3 occurred because of low flow rate through the chlorine dioxidesensor housing.
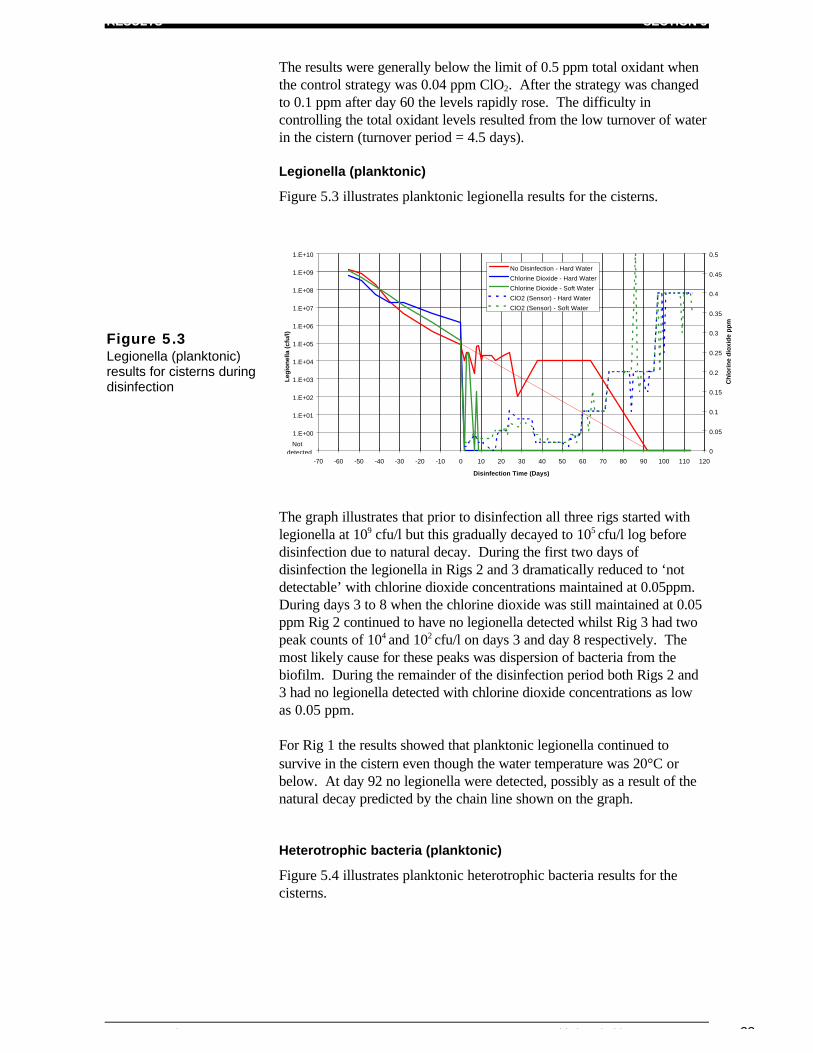
Total oxidant
Figure 5.2 illustrates total oxidant levels measured in the cisterns duringdisinfection using the DPD test method.
Figure 5.2Total oxidant levelsmeasured in cisterns duringdisinfection
0
0.1
0.2
0.3
0.4
0.5
0.6
0 10 20 30 40 50 60 70 80 90 100 110 120
Disinfection Time (Days)
Ch
lori
ne
Dio
xid
e p
pm
ClO2 - Sensor - Rig 2
ClO2 - Sensor - Rig 3
0.04 ppm control strategy up to day 60
0.1 ppm control strategy up to day 72
0.2 ppm control strategy up to day 96
0.4 ppm control strategy up to end of project
Peak value due to lowflow through sensorhousing
0
0.5
1
1.5
2
2.5
3
0 10 20 30 40 50 60 70 80 90 100 110 120
Disinfection Time (Days)
To
tal O
xid
ant
- p
pm
ClO
2 eq
uiv
alen
t
T'Ox - DPD - Rig 2
T'Ox - DPD - Rig 3
DWI Limit 0.5ppm at the point of use
RESULTS SECTION 5
© BSRIA TN2/98 Chlorine Dioxide Water Treatment 23
The results were generally below the limit of 0.5 ppm total oxidant whenthe control strategy was 0.04 ppm ClO2. After the strategy was changedto 0.1 ppm after day 60 the levels rapidly rose. The difficulty incontrolling the total oxidant levels resulted from the low turnover of waterin the cistern (turnover period = 4.5 days).
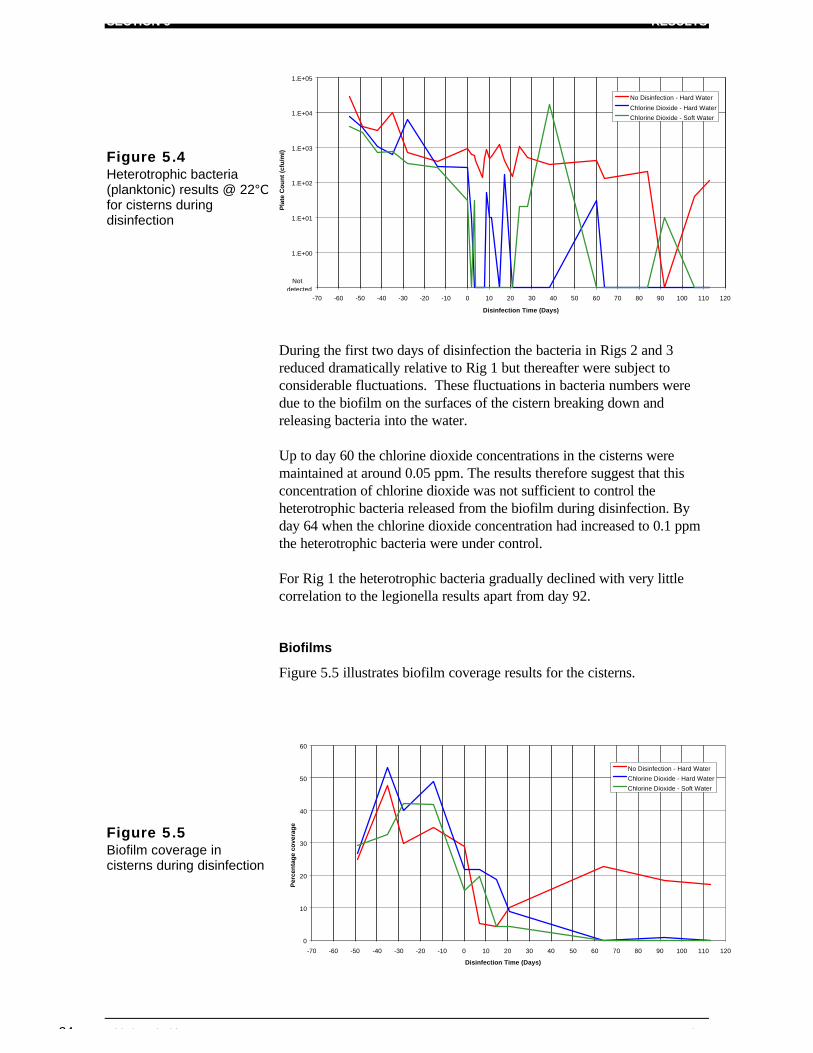
Legionella (planktonic)
Figure 5.3 illustrates planktonic legionella results for the cisterns.
Figure 5.3Legionella (planktonic)results for cisterns duringdisinfection
The graph illustrates that prior to disinfection all three rigs started withlegionella at 109 cfu/l but this gradually decayed to 105 cfu/l log beforedisinfection due to natural decay. During the first two days ofdisinfection the legionella in Rigs 2 and 3 dramatically reduced to ‘notdetectable’ with chlorine dioxide concentrations maintained at 0.05ppm.During days 3 to 8 when the chlorine dioxide was still maintained at 0.05ppm Rig 2 continued to have no legionella detected whilst Rig 3 had twopeak counts of 104 and 102 cfu/l on days 3 and day 8 respectively. Themost likely cause for these peaks was dispersion of bacteria from thebiofilm. During the remainder of the disinfection period both Rigs 2 and3 had no legionella detected with chlorine dioxide concentrations as lowas 0.05 ppm.
For Rig 1 the results showed that planktonic legionella continued tosurvive in the cistern even though the water temperature was 20°C orbelow. At day 92 no legionella were detected, possibly as a result of thenatural decay predicted by the chain line shown on the graph.
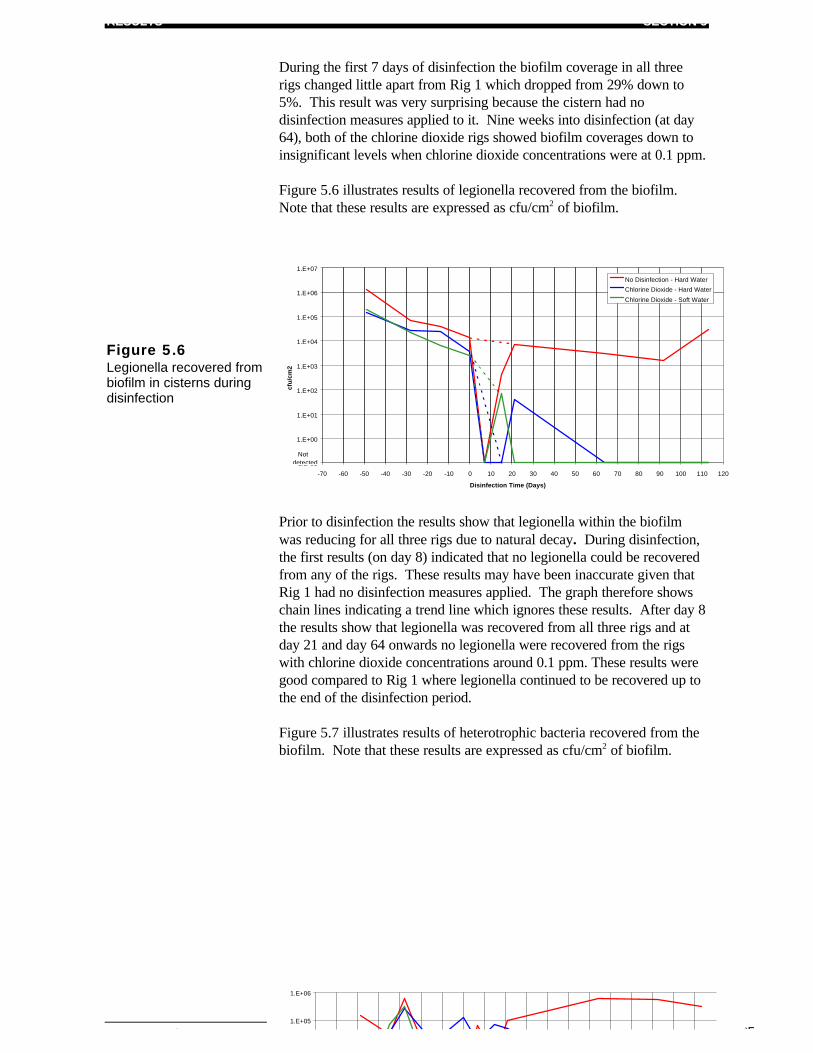
Heterotrophic bacteria (planktonic)
Figure 5.4 illustrates planktonic heterotrophic bacteria results for thecisterns.
1.E-01
1.E+00
1.E+01
1.E+02
1.E+03
1.E+04
1.E+05
1.E+06
1.E+07
1.E+08
1.E+09
1.E+10
-70 -60 -50 -40 -30 -20 -10 0 10 20 30 40 50 60 70 80 90 100 110 120
Disinfection Time (Days)
Leg
ion
ella
(cf
u/l)
0
0.05
0.1
0.15
0.2
0.25
0.3
0.35
0.4
0.45
0.5
Ch
lori
ne
dio
xid
e p
pm
No Disinfection - Hard Water
Chlorine Dioxide - Hard Water
Chlorine Dioxide - Soft Water
ClO2 (Sensor) - Hard Water
ClO2 (Sensor) - Soft Water
Not detected
SECTION 5 RESULTS
24 Chlorine Dioxide Water Treatment ©BSRIA TN2/98
Figure 5.4Heterotrophic bacteria(planktonic) results @ 22°Cfor cisterns duringdisinfection
During the first two days of disinfection the bacteria in Rigs 2 and 3reduced dramatically relative to Rig 1 but thereafter were subject toconsiderable fluctuations. These fluctuations in bacteria numbers weredue to the biofilm on the surfaces of the cistern breaking down andreleasing bacteria into the water.
Up to day 60 the chlorine dioxide concentrations in the cisterns weremaintained at around 0.05 ppm. The results therefore suggest that thisconcentration of chlorine dioxide was not sufficient to control theheterotrophic bacteria released from the biofilm during disinfection. Byday 64 when the chlorine dioxide concentration had increased to 0.1 ppmthe heterotrophic bacteria were under control.
For Rig 1 the heterotrophic bacteria gradually declined with very littlecorrelation to the legionella results apart from day 92.
Biofilms
Figure 5.5 illustrates biofilm coverage results for the cisterns.
Figure 5.5Biofilm coverage incisterns during disinfection
Prior to disinfection all three cisterns showed similar patterns of biofilmcolonisation on the GRP coupons suspended in the cisterns
1.E-01
1.E+00
1.E+01
1.E+02
1.E+03
1.E+04
1.E+05
-70 -60 -50 -40 -30 -20 -10 0 10 20 30 40 50 60 70 80 90 100 110 120
Disinfection Time (Days)
Pla
te C
ou
nt
(cfu
/ml)
No Disinfection - Hard Water
Chlorine Dioxide - Hard Water
Chlorine Dioxide - Soft Water
Not detected
0
10
20
30
40
50
60
-70 -60 -50 -40 -30 -20 -10 0 10 20 30 40 50 60 70 80 90 100 110 120
Disinfection Time (Days)
Per
cen
tag
e co
vera
ge
No Disinfection - Hard Water
Chlorine Dioxide - Hard Water
Chlorine Dioxide - Soft Water
RESULTS SECTION 5
© BSRIA TN2/98 Chlorine Dioxide Water Treatment 25
During the first 7 days of disinfection the biofilm coverage in all threerigs changed little apart from Rig 1 which dropped from 29% down to5%. This result was very surprising because the cistern had nodisinfection measures applied to it. Nine weeks into disinfection (at day64), both of the chlorine dioxide rigs showed biofilm coverages down toinsignificant levels when chlorine dioxide concentrations were at 0.1 ppm.
Figure 5.6 illustrates results of legionella recovered from the biofilm.Note that these results are expressed as cfu/cm2 of biofilm.
Figure 5.6Legionella recovered frombiofilm in cisterns duringdisinfection
Prior to disinfection the results show that legionella within the biofilmwas reducing for all three rigs due to natural decay. During disinfection,the first results (on day 8) indicated that no legionella could be recoveredfrom any of the rigs. These results may have been inaccurate given thatRig 1 had no disinfection measures applied. The graph therefore showschain lines indicating a trend line which ignores these results. After day 8the results show that legionella was recovered from all three rigs and atday 21 and day 64 onwards no legionella were recovered from the rigswith chlorine dioxide concentrations around 0.1 ppm. These results weregood compared to Rig 1 where legionella continued to be recovered up tothe end of the disinfection period.
Figure 5.7 illustrates results of heterotrophic bacteria recovered from thebiofilm. Note that these results are expressed as cfu/cm2 of biofilm.
1.E+05
1.E+06
1.E-01
1.E+00
1.E+01
1.E+02
1.E+03
1.E+04
1.E+05
1.E+06
1.E+07
-70 -60 -50 -40 -30 -20 -10 0 10 20 30 40 50 60 70 80 90 100 110 120
Disinfection Time (Days)
cfu
/cm
2
No Disinfection - Hard Water
Chlorine Dioxide - Hard Water
Chlorine Dioxide - Soft Water
Not detected
SECTION 5 RESULTS
26 Chlorine Dioxide Water Treatment ©BSRIA TN2/98
Figure 5.7Heterotrophic bacteriarecovered @ 22°C frombiofilm in cistern duringdisinfection
Prior to disinfection the results show a slight decay in bacteria levels.During disinfection the results are mixed. For Rig 1 the recovery ofbacteria actually increased which suggests that these were the dominantspecies in the biofilm. For Rigs 2 and 3 the recovery of bacteria showeda decreasing trend. By day 64 with chlorine dioxide concentrationsaround 0.1 ppm they have reduced by a factor of 101 or 102 down tobacteria levels of 500 to 5000 cfu/cm2 of biofilm. These levels ofrecovery were maintained throughout the disinfection period with chlorinedioxide concentrations rising to 0.4 ppm. In light of the low biofilmcoverage these levels of recovery were not significant.
Overall, the results suggest that a chlorine dioxide concentration of 0.1ppm had produced successful control of the biofilms in the cisterns.
5.4 COLD WATERPIPEWORKCIRCUITS
Legionella (planktonic)
Figure 5.8 illustrates planktonic legionella results for the cold waterpipework circuits
Figure 5.8Legionella (planktonic )results for cold waterpipework circuit duringdisinfection
1.E-01
1.E+00
1.E+01
1.E+02
1.E+03
1.E+04
1.E+05
1.E+06
1.E+07
1.E+08
-70 -60 -50 -40 -30 -20 -10 0 10 20 30 40 50 60 70 80 90 100 110 120
Disinfection Time (Days)
Leg
ion
ella
(cf
u/l)
0
0.05
0.1
0.15
0.2
0.25
0.3
0.35
Ch
lori
ne
Dio
xid
e p
pm
No Disinfection - Hard Water
Chlorine Dioxide - Hard Water
Chlorine Dioxide - Soft Water
ClO2 (DPD) - Hard Water
ClO2 (DPD) - Soft Water
Not detected
RESULTS SECTION 5
© BSRIA TN2/98 Chlorine Dioxide Water Treatment 27
Prior to disinfection the results show that all three rigs started withlegionella at 107 cfu/l but this gradually decayed to 105 cfu/l beforedisinfection. During disinfection Rigs 2 and 3 produced rapid rates ofdisinfection with chlorine dioxide concentrations of 0.1 ppm.
Heterotrophic bacteria (planktonic)
Figure 5.9 illustrates planktonic heterotrophic bacteria results for the coldwater pipework circuits.
Figure 5.9Heterotrophic bacteria(planktonic) results @22°C for cold waterpipework circuit duringdisinfection
Prior to disinfection bacteria levels in all three rigs were approximately102 cfu/ml. When disinfection took place the bacteria rapidly diminishedbut then recovered in all three rigs. The reasons for this were not fullyunderstood, particularly in Rig 1 where no disinfection measures werebeing applied.
For the chlorine dioxide rigs the results indicate that control ofheterotrophic bacteria levels was not achieved until a chlorine dioxideconcentration of 0.1 ppm to 0.2 ppm was established in the pipeworkcircuits around day 70.
Biofilms
Figure 5.10 illustrates biofilm coverage in the cold water circuits.
1.E-01
1.E+00
1.E+01
1.E+02
1.E+03
1.E+04
1.E+05
-70 -60 -50 -40 -30 -20 -10 0 10 20 30 40 50 60 70 80 90 100 110 120
Disinfection Time (Days)
Pla
te C
ou
nt
(cfu
/ml)
0
0.05
0.1
0.15
0.2
0.25
0.3
0.35
Ch
lori
ne
dio
xid
e p
pm
No Disinfection - Hard Water
Chlorine Dioxide - Hard Water
Chlorine Dioxide - Soft Water
ClO2 (DPD) - Hard Water
ClO2 (DPD) - Soft Water
Not detected
SECTION 5 RESULTS
28 Chlorine Dioxide Water Treatment ©BSRIA TN2/98
Figure 5.10Biofilm coverage in coldwater pipework circuitsduring disinfection
Prior to disinfection all three cold water circuits showed a low level ofbiofilm colonisation of the copper pipework surfaces.
This appears to suggest that the copper pipework continued to benaturally biocidal against the biofilm in all three rigs.
Figure 5.11 illustrates the number of legionella recovered from thebiofilm.
Figure 5.11Legionella recovered frombiofilm in cold waterpipework circuits duringdisinfection
Prior to disinfection legionella were recovered from the biofilm of allthree test rigs.
During disinfection no legionella were recovered from the chlorine dioxidetest rigs whilst some legionella continued to be recovered from the controlrig. This would suggest that chlorine dioxide had killed the legionellawithin the biofilm but the control rig legionella also reduced. The resultswere therefore not conclusive.
Figure 5.12 illustrates the number of heterotrophic bacteria recoveredfrom the biofilm.
0
2
4
6
8
10
12
14
-70 -60 -50 -40 -30 -20 -10 0 10 20 30 40 50 60 70 80 90 100 110 120
Disinfection Time (Days)
Per
cen
tag
e co
vera
ge
No Disinfection - Hard Water
Chlorine Dioxide - Hard Water
Chlorine Dioxide - Soft Water
1.E-01
1.E+00
1.E+01
1.E+02
1.E+03
1.E+04
-70 -60 -50 -40 -30 -20 -10 0 10 20 30 40 50 60 70 80 90 100 110 120
Disinfection Time (Days)
cfu
/cm
2
No Disinfection - Hard Water
Chlorine Dioxide - Hard Water
Chlorine Dioxide - Soft Water
Not detected
RESULTS SECTION 5
© BSRIA TN2/98 Chlorine Dioxide Water Treatment 29
Figure 5.12Heterotrophic bacteriarecovered @ 22°C frombiofilm in cold waterpipework circuit duringdisinfection
Prior to disinfection numbers of heterotrophic bacteria were generallyaround 102 cfu/cm2 in all three rigs.
During disinfection numbers reduced in all three rigs, initially because thebiofilm coverage was so low. As disinfection continued, heterotrophicbacteria were recovered at levels equivalent to infection. From day 92onwards however, no bacteria were recovered from the biofilm of the rigswith chlorine dioxide concentrations around 0.2 ppm to 0.3 ppm. Thiswould suggest that this concentration of chlorine dioxide had killed theheterotrophic bacteria in the biofilm and no further seeding of the water inthe pipework circuit was taking place. The planktonic results correlatewell with this finding. For Rig 1 bacteria continued to be recovered.
Chlorine dioxide
Chlorine dioxide sampling on the cold water circuit was undertaken at theend of the pipework circuit. This point was chosen because the coldwater circuit is effectively a dead leg when there is no draw off of water.These results would provide a good indication as to whether the chlorinedioxide had been distributed throughout the pipework circuit. Figure 5.13illustrates chlorine dioxide and total oxidant concentrations measured atthe end of the cold water pipework.
Figure 5.13Chlorine dioxide and totaloxidant concentrations incold water circuits (DPDmethod)
The graph shows that similar chlorine dioxide concentrations weremeasured in Rigs 2 and 3 cold water circuits but concentrations were
0
0.2
0.4
0.6
0.8
1
1.2
1.4
1.6
1.8
2
0 20 40 60 80 100 120
Disinfection Time (Days)
pp
m
T'Ox - DPD - R2
T'Ox - DPD - R3
ClO2 - DPD- R2
ClO2 - DPD - R3
1.E-01
1.E+00
1.E+01
1.E+02
1.E+03
1.E+04
-70 -60 -50 -40 -30 -20 -10 0 10 20 30 40 50 60 70 80 90 100 110 120
Disinfection Time (Days)
cfu
/ cm
2
No Disinfection - Hard Water
Chlorine Dioxide - Hard Water
Chlorine Dioxide - Soft Water
Not detected
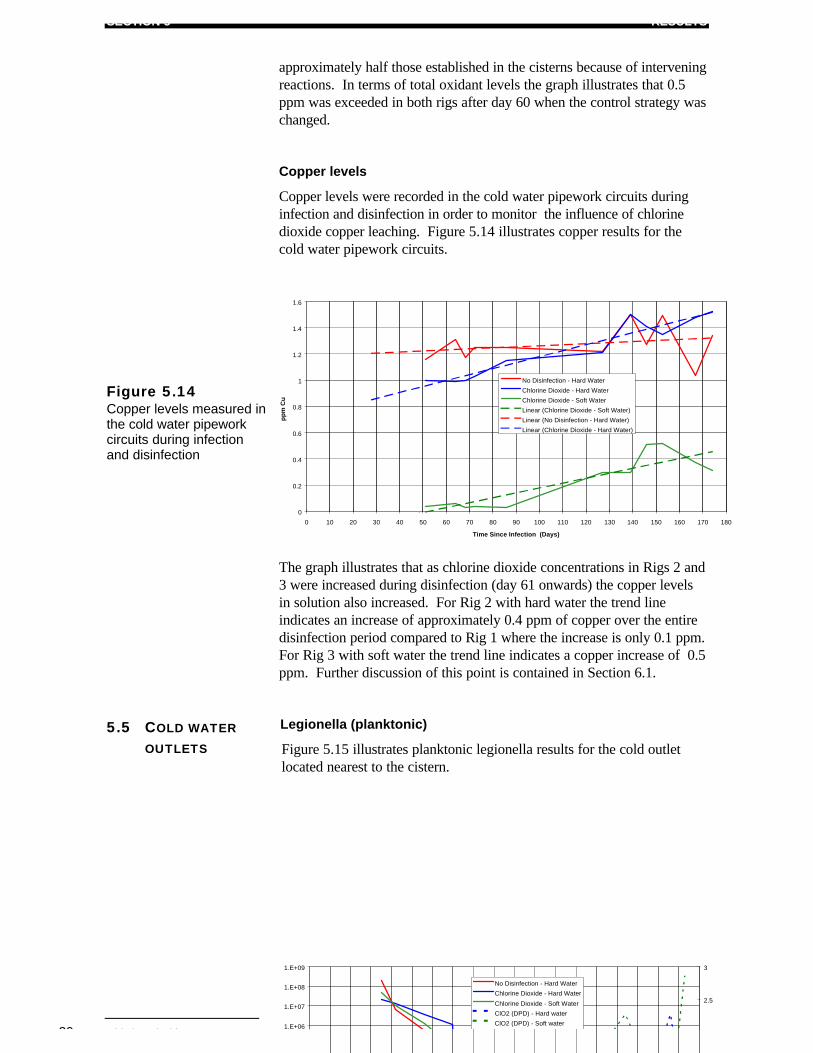
SECTION 5 RESULTS
30 Chlorine Dioxide Water Treatment ©BSRIA TN2/98
approximately half those established in the cisterns because of interveningreactions. In terms of total oxidant levels the graph illustrates that 0.5ppm was exceeded in both rigs after day 60 when the control strategy waschanged.
Copper levels
Copper levels were recorded in the cold water pipework circuits duringinfection and disinfection in order to monitor the influence of chlorinedioxide copper leaching. Figure 5.14 illustrates copper results for thecold water pipework circuits.
Figure 5.14Copper levels measured inthe cold water pipeworkcircuits during infectionand disinfection
The graph illustrates that as chlorine dioxide concentrations in Rigs 2 and3 were increased during disinfection (day 61 onwards) the copper levelsin solution also increased. For Rig 2 with hard water the trend lineindicates an increase of approximately 0.4 ppm of copper over the entiredisinfection period compared to Rig 1 where the increase is only 0.1 ppm.For Rig 3 with soft water the trend line indicates a copper increase of 0.5ppm. Further discussion of this point is contained in Section 6.1.
5.5 COLD WATEROUTLETS
Legionella (planktonic)
Figure 5.15 illustrates planktonic legionella results for the cold outletlocated nearest to the cistern.
0
0.2
0.4
0.6
0.8
1
1.2
1.4
1.6
0 10 20 30 40 50 60 70 80 90 100 110 120 130 140 150 160 170 180
Time Since Infection (Days)
pp
m C
u
No Disinfection - Hard Water
Chlorine Dioxide - Hard Water
Chlorine Dioxide - Soft Water
Linear (Chlorine Dioxide - Soft Water)
Linear (No Disinfection - Hard Water)
Linear (Chlorine Dioxide - Hard Water)
1.E+06
1.E+07
1.E+08
1.E+09
2.5
3
No Disinfection - Hard Water
Chlorine Dioxide - Hard Water
Chlorine Dioxide - Soft Water
ClO2 (DPD) - Hard water
ClO2 (DPD) - Soft water
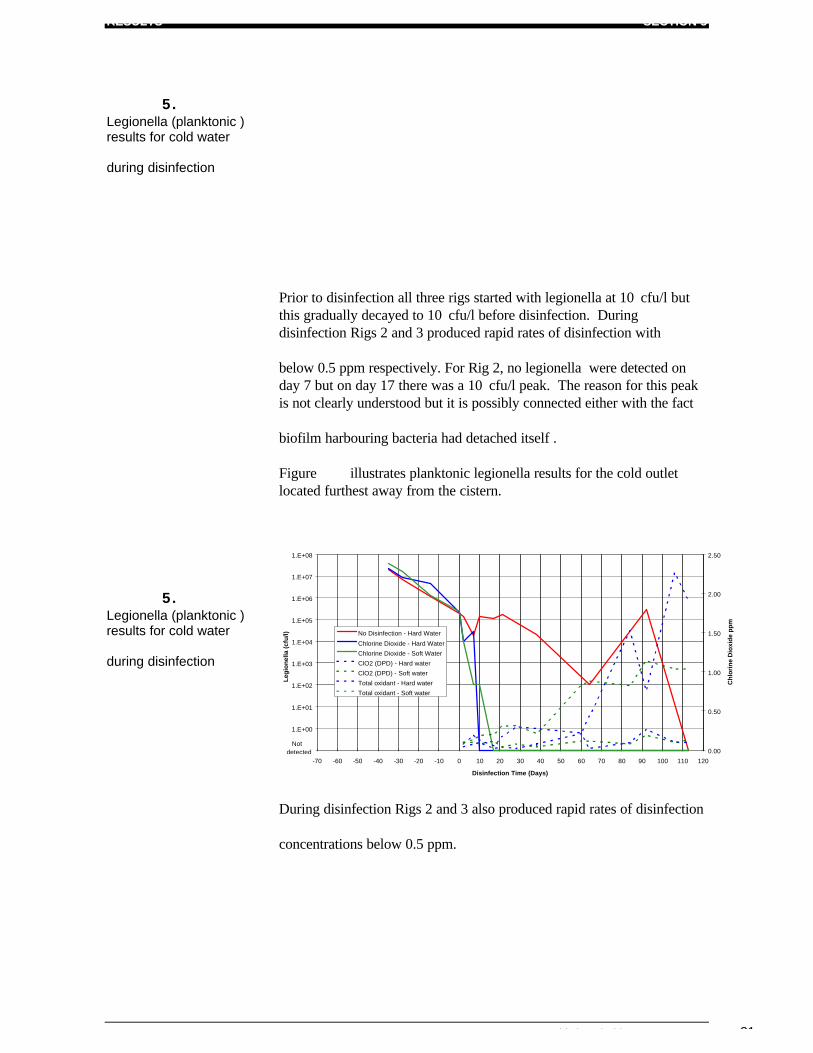
RESULTS SECTION 5
Chlorine Dioxide Water Treatment 31
5.Legionella (planktonic )results for cold water
during disinfection
Prior to disinfection all three rigs started with legionella at 10 cfu/l butthis gradually decayed to 10 cfu/l before disinfection. Duringdisinfection Rigs 2 and 3 produced rapid rates of disinfection with
below 0.5 ppm respectively. For Rig 2, no legionella were detected onday 7 but on day 17 there was a 10 cfu/l peak. The reason for this peakis not clearly understood but it is possibly connected either with the fact
biofilm harbouring bacteria had detached itself .
Figure illustrates planktonic legionella results for the cold outletlocated furthest away from the cistern.
5.Legionella (planktonic )results for cold water
during disinfection
During disinfection Rigs 2 and 3 also produced rapid rates of disinfection
concentrations below 0.5 ppm.
1.E-01
1.E+00
1.E+01
1.E+02
1.E+03
1.E+04
1.E+05
1.E+06
1.E+07
1.E+08
-70 -60 -50 -40 -30 -20 -10 0 10 20 30 40 50 60 70 80 90 100 110 120
Disinfection Time (Days)
Leg
ion
ella
(cf
u/l)
0.00
0.50
1.00
1.50
2.00
2.50
Ch
lori
ne
Dio
xid
e p
pm
No Disinfection - Hard Water
Chlorine Dioxide - Hard Water
Chlorine Dioxide - Soft Water
ClO2 (DPD) - Hard water
ClO2 (DPD) - Soft water
Total oxidant - Hard water
Total oxidant - Soft water
Not detected
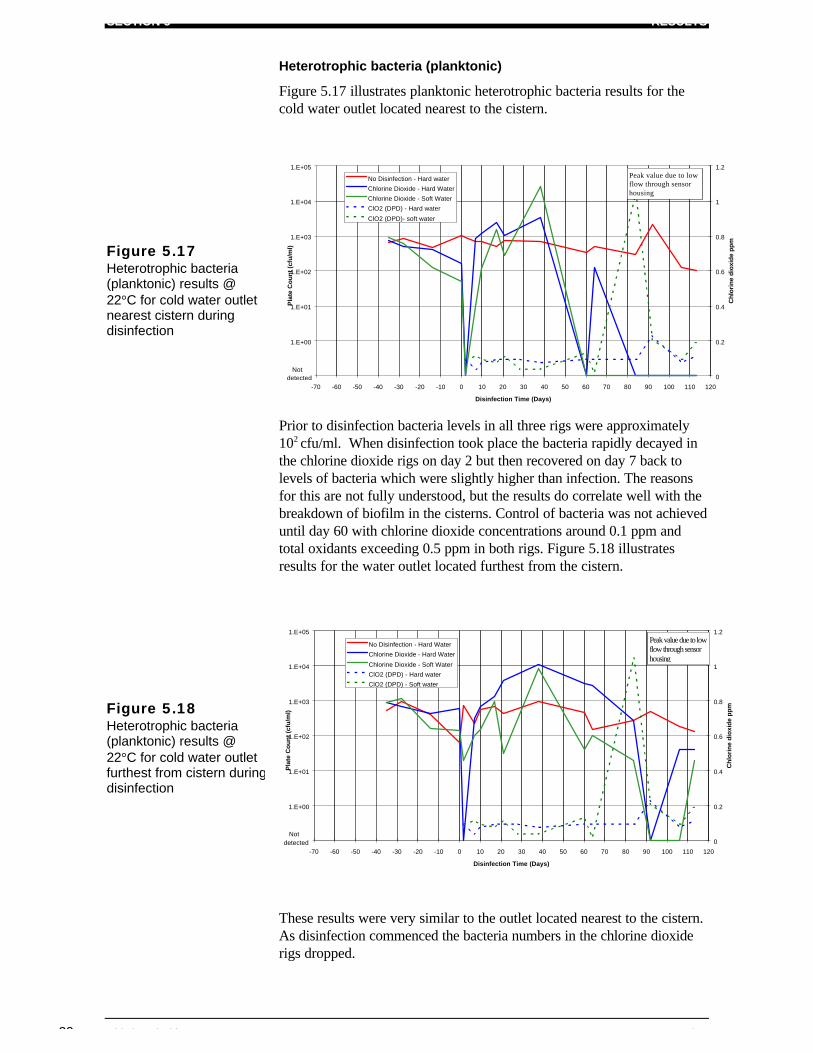
SECTION 5 RESULTS
32 Chlorine Dioxide Water Treatment ©BSRIA TN2/98
Heterotrophic bacteria (planktonic)
Figure 5.17 illustrates planktonic heterotrophic bacteria results for thecold water outlet located nearest to the cistern.
Figure 5.17Heterotrophic bacteria(planktonic) results @22°C for cold water outletnearest cistern duringdisinfection
Prior to disinfection bacteria levels in all three rigs were approximately102 cfu/ml. When disinfection took place the bacteria rapidly decayed inthe chlorine dioxide rigs on day 2 but then recovered on day 7 back tolevels of bacteria which were slightly higher than infection. The reasonsfor this are not fully understood, but the results do correlate well with thebreakdown of biofilm in the cisterns. Control of bacteria was not achieveduntil day 60 with chlorine dioxide concentrations around 0.1 ppm andtotal oxidants exceeding 0.5 ppm in both rigs. Figure 5.18 illustratesresults for the water outlet located furthest from the cistern.
Figure 5.18Heterotrophic bacteria(planktonic) results @22°C for cold water outletfurthest from cistern duringdisinfection
These results were very similar to the outlet located nearest to the cistern.As disinfection commenced the bacteria numbers in the chlorine dioxiderigs dropped.
1.E-01
1.E+00
1.E+01
1.E+02
1.E+03
1.E+04
1.E+05
-70 -60 -50 -40 -30 -20 -10 0 10 20 30 40 50 60 70 80 90 100 110 120
Disinfection Time (Days)
Pla
te C
ou
nt
(cfu
/ml)
0
0.2
0.4
0.6
0.8
1
1.2
Ch
lori
ne
dio
xid
e p
pm
No Disinfection - Hard water
Chlorine Dioxide - Hard Water
Chlorine Dioxide - Soft Water
ClO2 (DPD) - Hard water
ClO2 (DPD)- soft water
Not detected
Peak value due to lowflow through sensorhousing
1.E-01
1.E+00
1.E+01
1.E+02
1.E+03
1.E+04
1.E+05
-70 -60 -50 -40 -30 -20 -10 0 10 20 30 40 50 60 70 80 90 100 110 120
Disinfection Time (Days)
Pla
te C
ou
nt
(cfu
/ml)
0
0.2
0.4
0.6
0.8
1
1.2
Ch
lori
ne
dio
xid
e p
pm
No Disinfection - Hard Water
Chlorine Dioxide - Hard Water
Chlorine Dioxide - Soft Water
ClO2 (DPD) - Hard water
ClO2 (DPD) - Soft water
Not detected
Peak value due to lowflow through sensorhousing
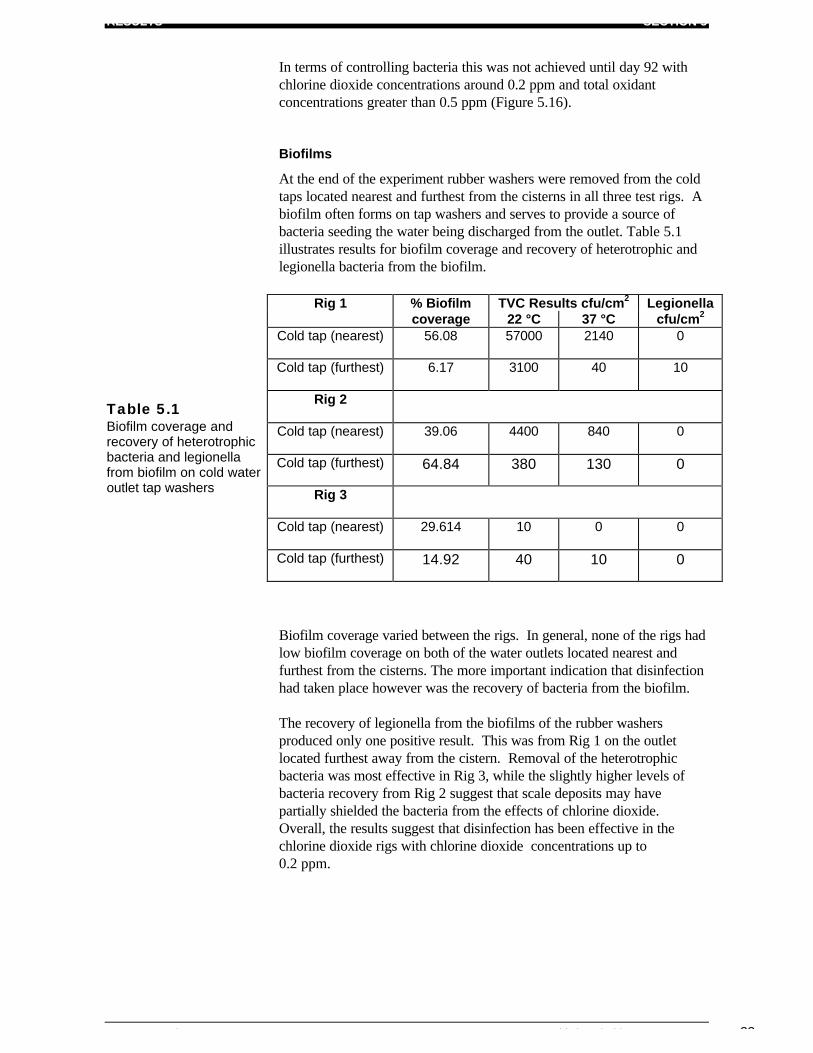
RESULTS SECTION 5
© BSRIA TN2/98 Chlorine Dioxide Water Treatment 33
In terms of controlling bacteria this was not achieved until day 92 withchlorine dioxide concentrations around 0.2 ppm and total oxidantconcentrations greater than 0.5 ppm (Figure 5.16).
Biofilms
At the end of the experiment rubber washers were removed from the coldtaps located nearest and furthest from the cisterns in all three test rigs. Abiofilm often forms on tap washers and serves to provide a source ofbacteria seeding the water being discharged from the outlet. Table 5.1illustrates results for biofilm coverage and recovery of heterotrophic andlegionella bacteria from the biofilm.
Table 5.1Biofilm coverage andrecovery of heterotrophicbacteria and legionellafrom biofilm on cold wateroutlet tap washers
Biofilm coverage varied between the rigs. In general, none of the rigs hadlow biofilm coverage on both of the water outlets located nearest andfurthest from the cisterns. The more important indication that disinfectionhad taken place however was the recovery of bacteria from the biofilm.
The recovery of legionella from the biofilms of the rubber washersproduced only one positive result. This was from Rig 1 on the outletlocated furthest away from the cistern. Removal of the heterotrophicbacteria was most effective in Rig 3, while the slightly higher levels ofbacteria recovery from Rig 2 suggest that scale deposits may havepartially shielded the bacteria from the effects of chlorine dioxide.Overall, the results suggest that disinfection has been effective in thechlorine dioxide rigs with chlorine dioxide concentrations up to0.2 ppm.
Rig 1 % Biofilm TVC Results cfu/cm2 Legionellacoverage 22 °C 37 °C cfu/cm2
Cold tap (nearest) 56.08 57000 2140 0
Cold tap (furthest) 6.17 3100 40 10
Rig 2
Cold tap (nearest) 39.06 4400 840 0
Cold tap (furthest) 64.84 380 130 0
Rig 3
Cold tap (nearest) 29.614 10 0 0
Cold tap (furthest) 14.92 40 10 0
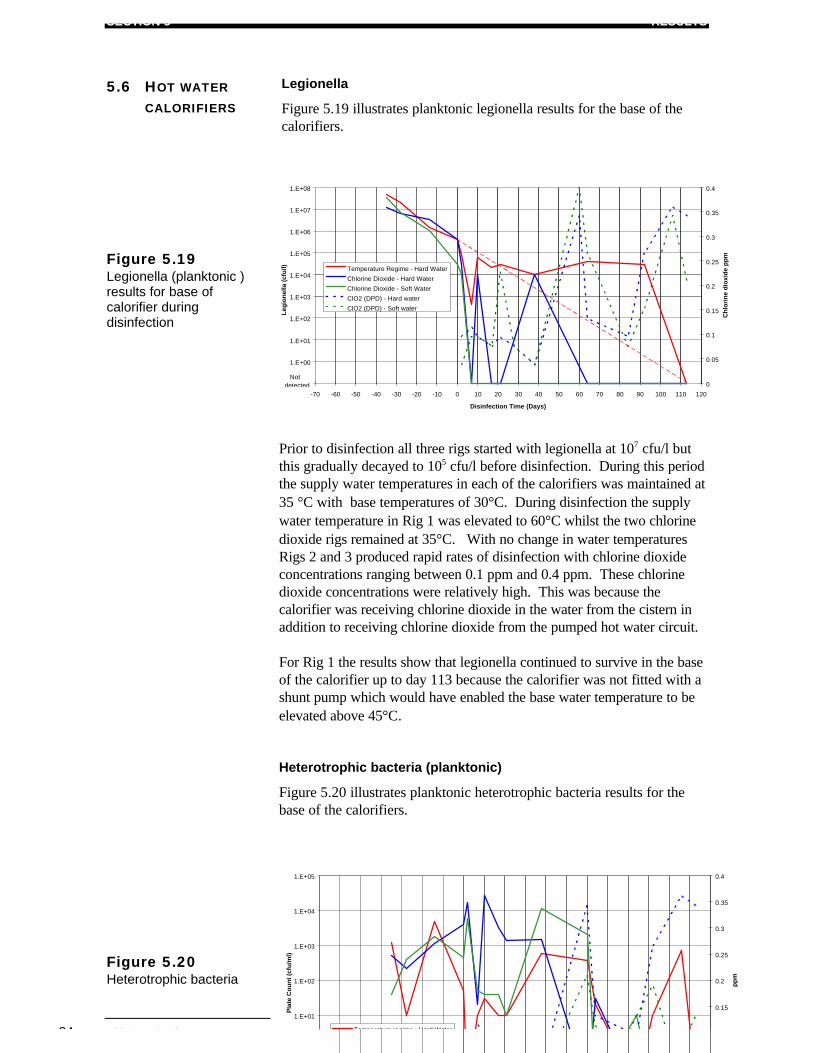
SECTION 5 RESULTS
34 Chlorine Dioxide Water Treatment ©BSRIA TN2/98
5.6 HOT WATERCALORIFIERS
Legionella
Figure 5.19 illustrates planktonic legionella results for the base of thecalorifiers.
Figure 5.19Legionella (planktonic )results for base ofcalorifier duringdisinfection
Prior to disinfection all three rigs started with legionella at 107 cfu/l butthis gradually decayed to 105 cfu/l before disinfection. During this periodthe supply water temperatures in each of the calorifiers was maintained at35 °C with base temperatures of 30°C. During disinfection the supplywater temperature in Rig 1 was elevated to 60°C whilst the two chlorinedioxide rigs remained at 35°C. With no change in water temperaturesRigs 2 and 3 produced rapid rates of disinfection with chlorine dioxideconcentrations ranging between 0.1 ppm and 0.4 ppm. These chlorinedioxide concentrations were relatively high. This was because thecalorifier was receiving chlorine dioxide in the water from the cistern inaddition to receiving chlorine dioxide from the pumped hot water circuit.
For Rig 1 the results show that legionella continued to survive in the baseof the calorifier up to day 113 because the calorifier was not fitted with ashunt pump which would have enabled the base water temperature to beelevated above 45°C.
Heterotrophic bacteria (planktonic)
Figure 5.20 illustrates planktonic heterotrophic bacteria results for thebase of the calorifiers.
Figure 5.20Heterotrophic bacteria
1.E+01
1.E+02
1.E+03
1.E+04
1.E+05
Pla
te C
ou
nt
(cfu
/ml)
0.15
0.2
0.25
0.3
0.35
0.4
pp
m
Temperature regime - Hard Water
1.E-01
1.E+00
1.E+01
1.E+02
1.E+03
1.E+04
1.E+05
1.E+06
1.E+07
1.E+08
-70 -60 -50 -40 -30 -20 -10 0 10 20 30 40 50 60 70 80 90 100 110 120
Disinfection Time (Days)
Leg
ion
ella
(cf
u/l)
0
0.05
0.1
0.15
0.2
0.25
0.3
0.35
0.4
Ch
lori
ne
dio
xid
e p
pm
Temperature Regime - Hard Water
Chlorine Dioxide - Hard Water
Chlorine Dioxide - Soft Water
ClO2 (DPD) - Hard water
ClO2 (DPD) - Soft water
Not detected
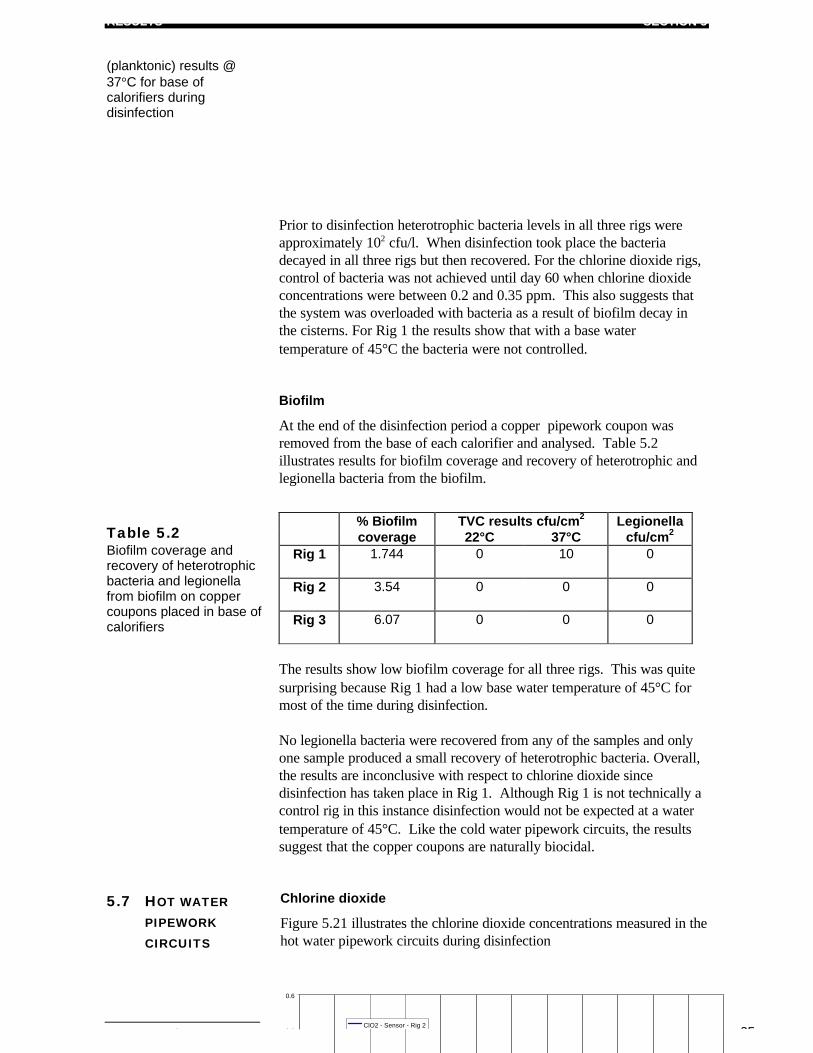
RESULTS SECTION 5
© BSRIA TN2/98 Chlorine Dioxide Water Treatment 35
(planktonic) results @37°C for base ofcalorifiers duringdisinfection
Prior to disinfection heterotrophic bacteria levels in all three rigs wereapproximately 102 cfu/l. When disinfection took place the bacteriadecayed in all three rigs but then recovered. For the chlorine dioxide rigs,control of bacteria was not achieved until day 60 when chlorine dioxideconcentrations were between 0.2 and 0.35 ppm. This also suggests thatthe system was overloaded with bacteria as a result of biofilm decay inthe cisterns. For Rig 1 the results show that with a base watertemperature of 45°C the bacteria were not controlled.
Biofilm
At the end of the disinfection period a copper pipework coupon wasremoved from the base of each calorifier and analysed. Table 5.2illustrates results for biofilm coverage and recovery of heterotrophic andlegionella bacteria from the biofilm.
Table 5.2Biofilm coverage andrecovery of heterotrophicbacteria and legionellafrom biofilm on coppercoupons placed in base ofcalorifiers
The results show low biofilm coverage for all three rigs. This was quitesurprising because Rig 1 had a low base water temperature of 45°C formost of the time during disinfection.
No legionella bacteria were recovered from any of the samples and onlyone sample produced a small recovery of heterotrophic bacteria. Overall,the results are inconclusive with respect to chlorine dioxide sincedisinfection has taken place in Rig 1. Although Rig 1 is not technically acontrol rig in this instance disinfection would not be expected at a watertemperature of 45°C. Like the cold water pipework circuits, the resultssuggest that the copper coupons are naturally biocidal.
5.7 HOT WATERPIPEWORKCIRCUITS
Chlorine dioxide
Figure 5.21 illustrates the chlorine dioxide concentrations measured in thehot water pipework circuits during disinfection
% Biofilm TVC results cfu/cm2 Legionellacoverage 22°C 37°C cfu/cm2
Rig 1 1.744 0 10 0
Rig 2 3.54 0 0 0
Rig 3 6.07 0 0 0
0.5
0.6
ClO2 - Sensor - Rig 2
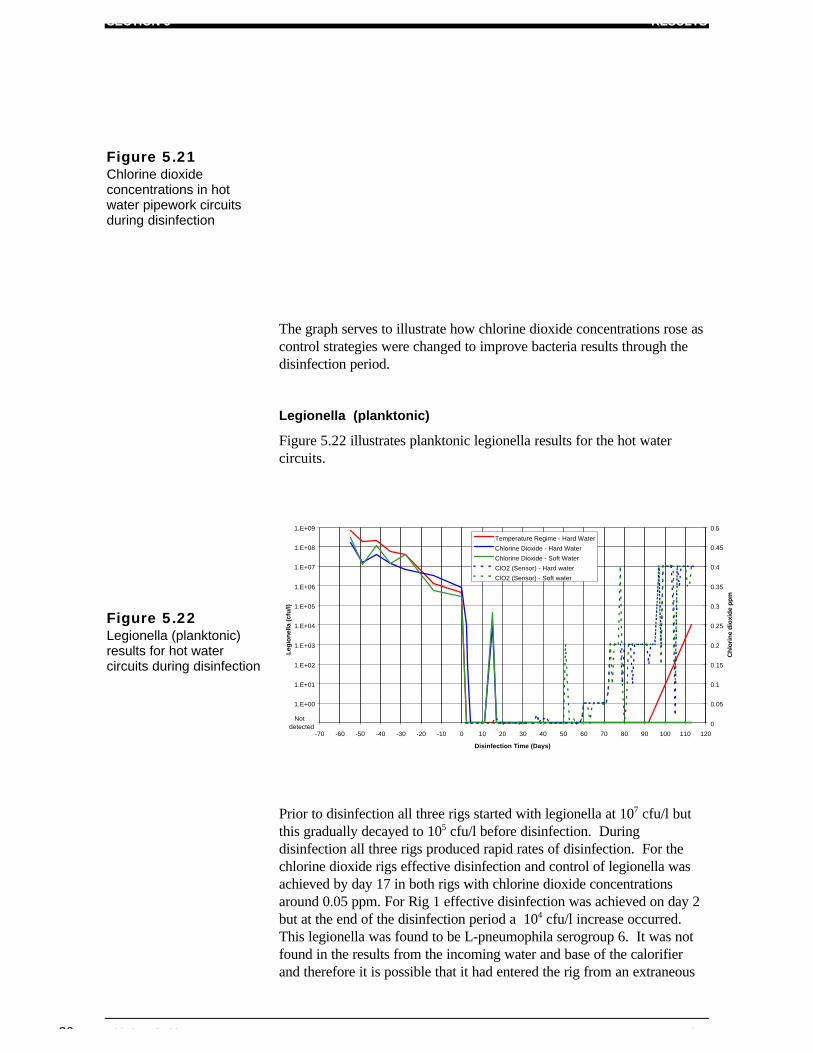
SECTION 5 RESULTS
36 Chlorine Dioxide Water Treatment ©BSRIA TN2/98
Figure 5.21Chlorine dioxideconcentrations in hotwater pipework circuitsduring disinfection
The graph serves to illustrate how chlorine dioxide concentrations rose ascontrol strategies were changed to improve bacteria results through thedisinfection period.
Legionella (planktonic)
Figure 5.22 illustrates planktonic legionella results for the hot watercircuits.
Figure 5.22Legionella (planktonic)results for hot watercircuits during disinfection
Prior to disinfection all three rigs started with legionella at 107 cfu/l butthis gradually decayed to 105 cfu/l before disinfection. Duringdisinfection all three rigs produced rapid rates of disinfection. For thechlorine dioxide rigs effective disinfection and control of legionella wasachieved by day 17 in both rigs with chlorine dioxide concentrationsaround 0.05 ppm. For Rig 1 effective disinfection was achieved on day 2but at the end of the disinfection period a 104 cfu/l increase occurred.This legionella was found to be L-pneumophila serogroup 6. It was notfound in the results from the incoming water and base of the calorifierand therefore it is possible that it had entered the rig from an extraneous
1.E-01
1.E+00
1.E+01
1.E+02
1.E+03
1.E+04
1.E+05
1.E+06
1.E+07
1.E+08
1.E+09
-70 -60 -50 -40 -30 -20 -10 0 10 20 30 40 50 60 70 80 90 100 110 120
Disinfection Time (Days)
Leg
ion
ella
(cf
u/l)
0
0.05
0.1
0.15
0.2
0.25
0.3
0.35
0.4
0.45
0.5
Ch
lori
ne
dio
xid
e p
pm
Temperature Regime - Hard Water
Chlorine Dioxide - Hard Water
Chlorine Dioxide - Soft Water
ClO2 (Sensor) - Hard water
ClO2 (Sensor) - Soft water
Not detected
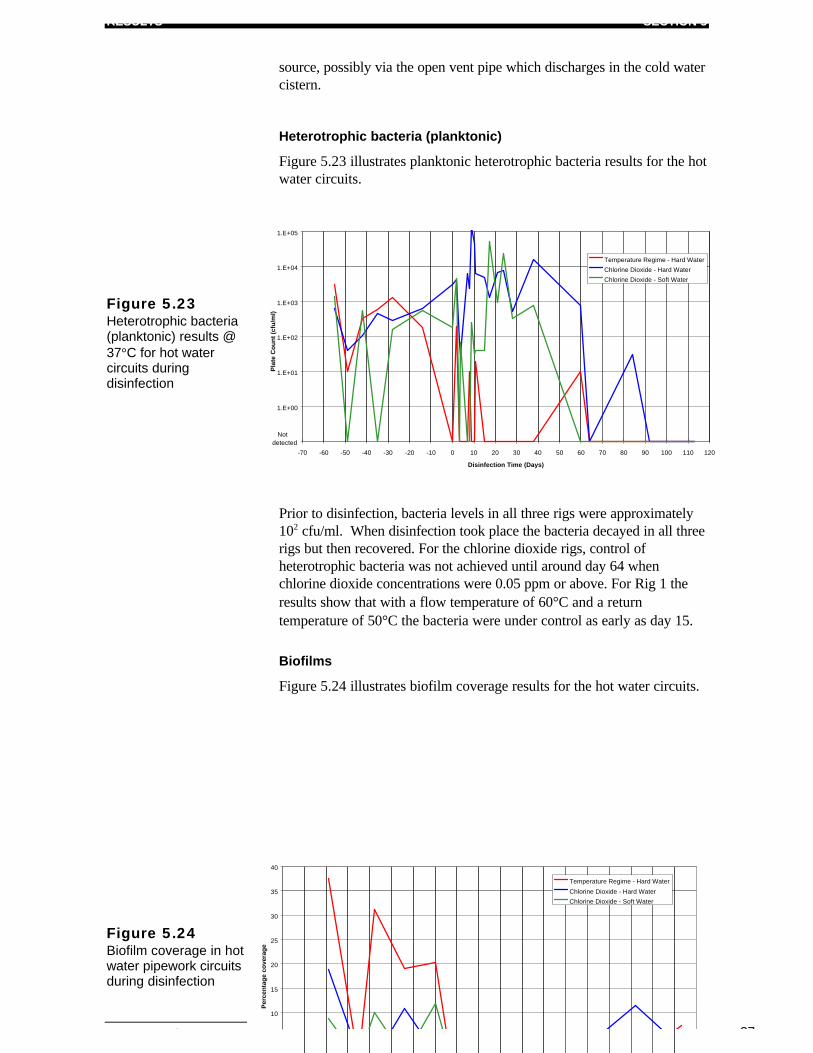
RESULTS SECTION 5
© BSRIA TN2/98 Chlorine Dioxide Water Treatment 37
source, possibly via the open vent pipe which discharges in the cold watercistern.
Heterotrophic bacteria (planktonic)
Figure 5.23 illustrates planktonic heterotrophic bacteria results for the hotwater circuits.
Figure 5.23Heterotrophic bacteria(planktonic) results @37°C for hot watercircuits duringdisinfection
Prior to disinfection, bacteria levels in all three rigs were approximately102 cfu/ml. When disinfection took place the bacteria decayed in all threerigs but then recovered. For the chlorine dioxide rigs, control ofheterotrophic bacteria was not achieved until around day 64 whenchlorine dioxide concentrations were 0.05 ppm or above. For Rig 1 theresults show that with a flow temperature of 60°C and a returntemperature of 50°C the bacteria were under control as early as day 15.
Biofilms
Figure 5.24 illustrates biofilm coverage results for the hot water circuits.
Figure 5.24Biofilm coverage in hotwater pipework circuitsduring disinfection
1.E-01
1.E+00
1.E+01
1.E+02
1.E+03
1.E+04
1.E+05
-70 -60 -50 -40 -30 -20 -10 0 10 20 30 40 50 60 70 80 90 100 110 120
Disinfection Time (Days)
Pla
te C
ou
nt
(cfu
/ml)
Temperature Regime - Hard Water
Chlorine Dioxide - Hard Water
Chlorine Dioxide - Soft Water
Not detected
10
15
20
25
30
35
40
Per
cen
tag
e co
vera
ge
Temperature Regime - Hard Water
Chlorine Dioxide - Hard Water
Chlorine Dioxide - Soft Water
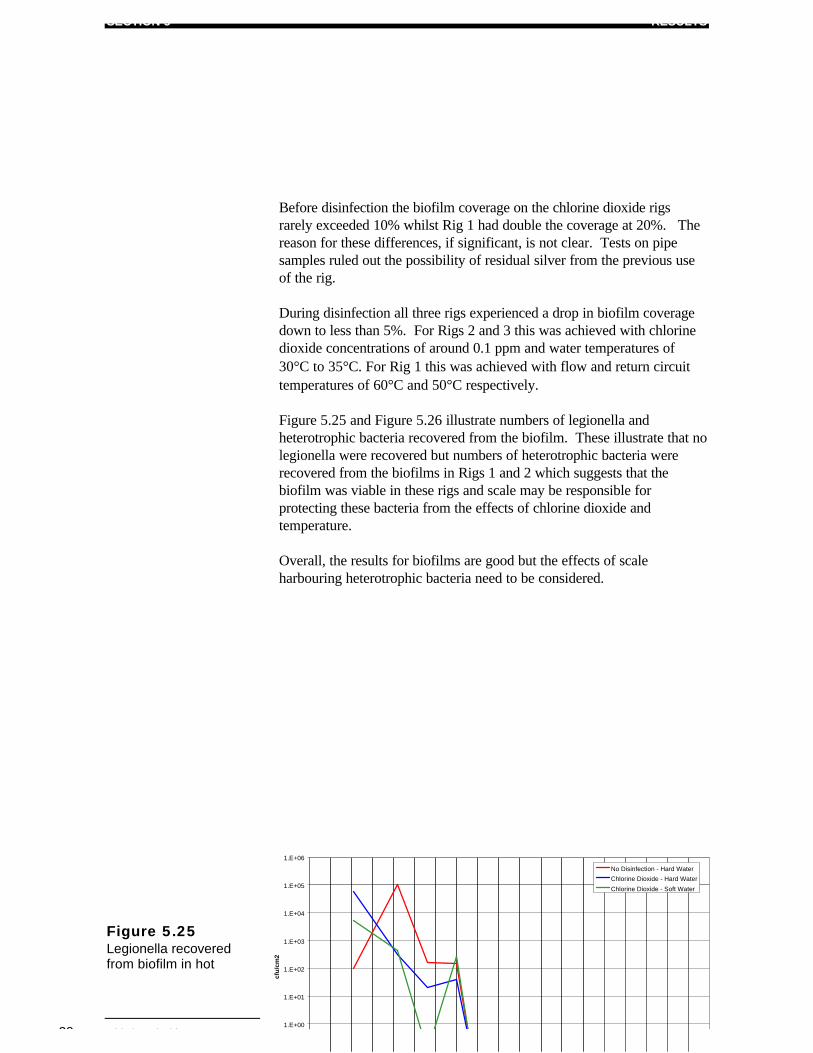
SECTION 5 RESULTS
38 Chlorine Dioxide Water Treatment ©BSRIA TN2/98
Before disinfection the biofilm coverage on the chlorine dioxide rigsrarely exceeded 10% whilst Rig 1 had double the coverage at 20%. Thereason for these differences, if significant, is not clear. Tests on pipesamples ruled out the possibility of residual silver from the previous useof the rig.
During disinfection all three rigs experienced a drop in biofilm coveragedown to less than 5%. For Rigs 2 and 3 this was achieved with chlorinedioxide concentrations of around 0.1 ppm and water temperatures of30°C to 35°C. For Rig 1 this was achieved with flow and return circuittemperatures of 60°C and 50°C respectively.
Figure 5.25 and Figure 5.26 illustrate numbers of legionella andheterotrophic bacteria recovered from the biofilm. These illustrate that nolegionella were recovered but numbers of heterotrophic bacteria wererecovered from the biofilms in Rigs 1 and 2 which suggests that thebiofilm was viable in these rigs and scale may be responsible forprotecting these bacteria from the effects of chlorine dioxide andtemperature.
Overall, the results for biofilms are good but the effects of scaleharbouring heterotrophic bacteria need to be considered.
Figure 5.25Legionella recoveredfrom biofilm in hot
1.E+00
1.E+01
1.E+02
1.E+03
1.E+04
1.E+05
1.E+06
cfu
/cm
2
No Disinfection - Hard Water
Chlorine Dioxide - Hard Water
Chlorine Dioxide - Soft Water
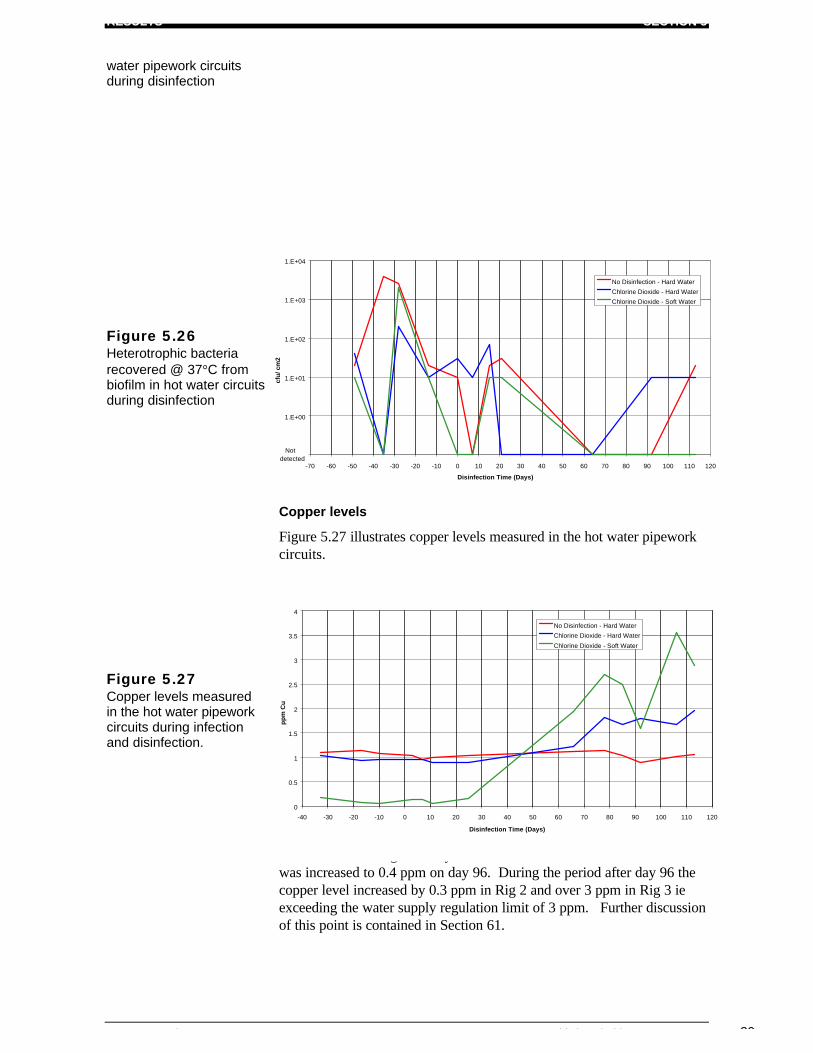
RESULTS SECTION 5
© BSRIA TN2/98 Chlorine Dioxide Water Treatment 39
1.E-01
1.E+00
1.E+01
1.E+02
1.E+03
1.E+04
-70 -60 -50 -40 -30 -20 -10 0 10 20 30 40 50 60 70 80 90 100 110 120
Disinfection Time (Days)
cfu
/ cm
2No Disinfection - Hard Water
Chlorine Dioxide - Hard Water
Chlorine Dioxide - Soft Water
Not detected
water pipework circuitsduring disinfection
Figure 5.26Heterotrophic bacteriarecovered @ 37°C frombiofilm in hot water circuitsduring disinfection
Copper levels
Figure 5.27 illustrates copper levels measured in the hot water pipeworkcircuits.
Figure 5.27Copper levels measuredin the hot water pipeworkcircuits during infectionand disinfection.
The graph shows that as chlorine dioxide concentrations in Rigs 2 and 3were increased during disinfection the copper levels in solution alsoincreased but not significantly until the chlorine dioxide concentrationwas increased to 0.4 ppm on day 96. During the period after day 96 thecopper level increased by 0.3 ppm in Rig 2 and over 3 ppm in Rig 3 ieexceeding the water supply regulation limit of 3 ppm. Further discussionof this point is contained in Section 61.
0
0.5
1
1.5
2
2.5
3
3.5
4
-40 -30 -20 -10 0 10 20 30 40 50 60 70 80 90 100 110 120
Disinfection Time (Days)
pp
m C
u
No Disinfection - Hard Water
Chlorine Dioxide - Hard Water
Chlorine Dioxide - Soft Water
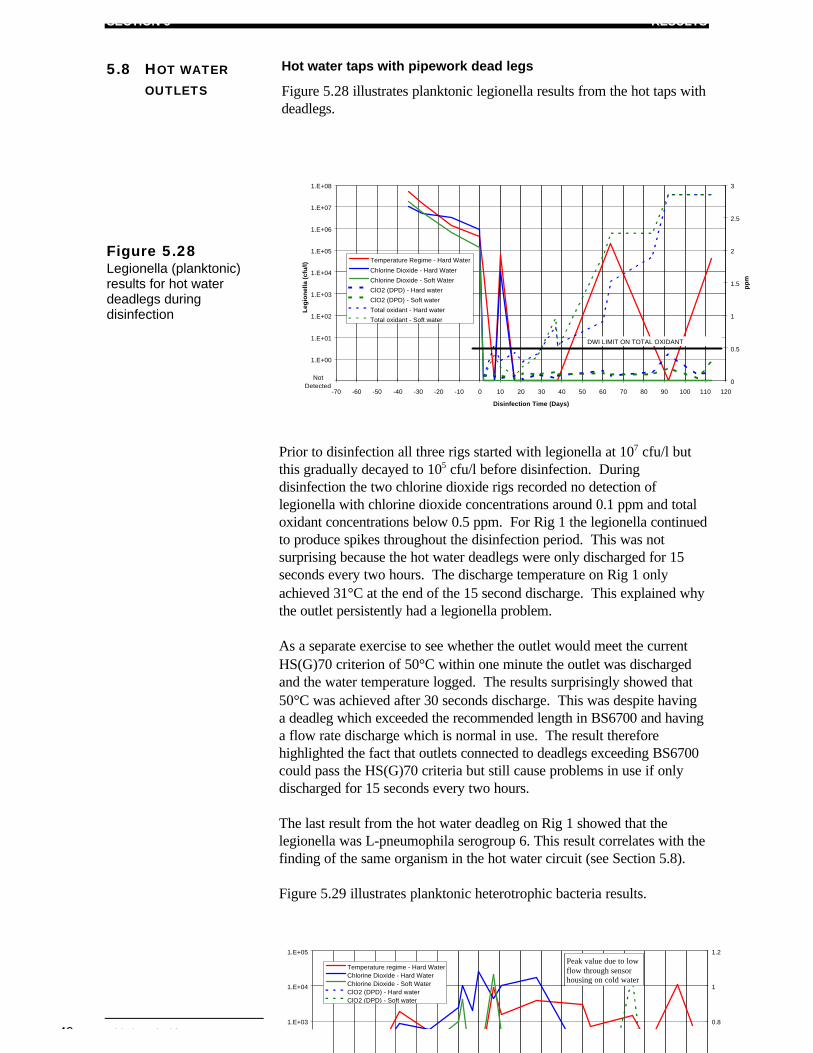
SECTION 5 RESULTS
40 Chlorine Dioxide Water Treatment ©BSRIA TN2/98
5.8 HOT WATEROUTLETS
Hot water taps with pipework dead legs
Figure 5.28 illustrates planktonic legionella results from the hot taps withdeadlegs.
Figure 5.28Legionella (planktonic)results for hot waterdeadlegs duringdisinfection
Prior to disinfection all three rigs started with legionella at 107 cfu/l butthis gradually decayed to 105 cfu/l before disinfection. Duringdisinfection the two chlorine dioxide rigs recorded no detection oflegionella with chlorine dioxide concentrations around 0.1 ppm and totaloxidant concentrations below 0.5 ppm. For Rig 1 the legionella continuedto produce spikes throughout the disinfection period. This was notsurprising because the hot water deadlegs were only discharged for 15seconds every two hours. The discharge temperature on Rig 1 onlyachieved 31°C at the end of the 15 second discharge. This explained whythe outlet persistently had a legionella problem.
As a separate exercise to see whether the outlet would meet the currentHS(G)70 criterion of 50°C within one minute the outlet was dischargedand the water temperature logged. The results surprisingly showed that50°C was achieved after 30 seconds discharge. This was despite havinga deadleg which exceeded the recommended length in BS6700 and havinga flow rate discharge which is normal in use. The result thereforehighlighted the fact that outlets connected to deadlegs exceeding BS6700could pass the HS(G)70 criteria but still cause problems in use if onlydischarged for 15 seconds every two hours.
The last result from the hot water deadleg on Rig 1 showed that thelegionella was L-pneumophila serogroup 6. This result correlates with thefinding of the same organism in the hot water circuit (see Section 5.8).
Figure 5.29 illustrates planktonic heterotrophic bacteria results.
1.E-01
1.E+00
1.E+01
1.E+02
1.E+03
1.E+04
1.E+05
1.E+06
1.E+07
1.E+08
-70 -60 -50 -40 -30 -20 -10 0 10 20 30 40 50 60 70 80 90 100 110 120
Disinfection Time (Days)
Leg
ion
ella
(cf
u/l)
0
0.5
1
1.5
2
2.5
3
pp
m
Temperature Regime - Hard Water
Chlorine Dioxide - Hard Water
Chlorine Dioxide - Soft Water
ClO2 (DPD) - Hard water
ClO2 (DPD) - Soft water
Total oxidant - Hard water
Total oxidant - Soft water
Not Detected
DWI LIMIT ON TOTAL OXIDANT
1.E+03
1.E+04
1.E+05
0.8
1
1.2
Temperature regime - Hard WaterChlorine Dioxide - Hard WaterChlorine Dioxide - Soft WaterClO2 (DPD) - Hard waterClO2 (DPD) - Soft water
Peak value due to lowflow through sensorhousing on cold water
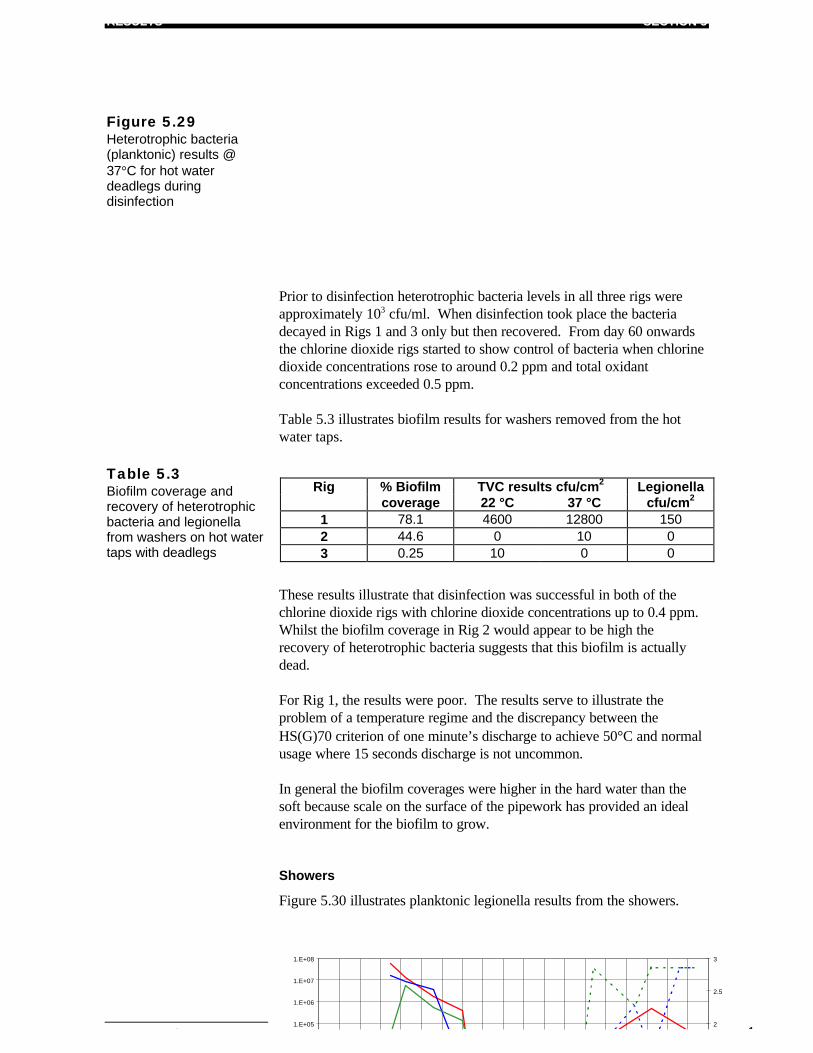
RESULTS SECTION 5
© BSRIA TN2/98 Chlorine Dioxide Water Treatment 41
Figure 5.29Heterotrophic bacteria(planktonic) results @37°C for hot waterdeadlegs duringdisinfection
Prior to disinfection heterotrophic bacteria levels in all three rigs wereapproximately 103 cfu/ml. When disinfection took place the bacteriadecayed in Rigs 1 and 3 only but then recovered. From day 60 onwardsthe chlorine dioxide rigs started to show control of bacteria when chlorinedioxide concentrations rose to around 0.2 ppm and total oxidantconcentrations exceeded 0.5 ppm.
Table 5.3 illustrates biofilm results for washers removed from the hotwater taps.
Table 5.3Biofilm coverage andrecovery of heterotrophicbacteria and legionellafrom washers on hot watertaps with deadlegs
These results illustrate that disinfection was successful in both of thechlorine dioxide rigs with chlorine dioxide concentrations up to 0.4 ppm.Whilst the biofilm coverage in Rig 2 would appear to be high therecovery of heterotrophic bacteria suggests that this biofilm is actuallydead.
For Rig 1, the results were poor. The results serve to illustrate theproblem of a temperature regime and the discrepancy between theHS(G)70 criterion of one minute’s discharge to achieve 50°C and normalusage where 15 seconds discharge is not uncommon.
In general the biofilm coverages were higher in the hard water than thesoft because scale on the surface of the pipework has provided an idealenvironment for the biofilm to grow.
Showers
Figure 5.30 illustrates planktonic legionella results from the showers.
1.E+05
1.E+06
1.E+07
1.E+08
2
2.5
3
Rig % Biofilm TVC results cfu/cm2 Legionellacoverage 22 °C 37 °C cfu/cm2
1 78.1 4600 12800 1502 44.6 0 10 03 0.25 10 0 0
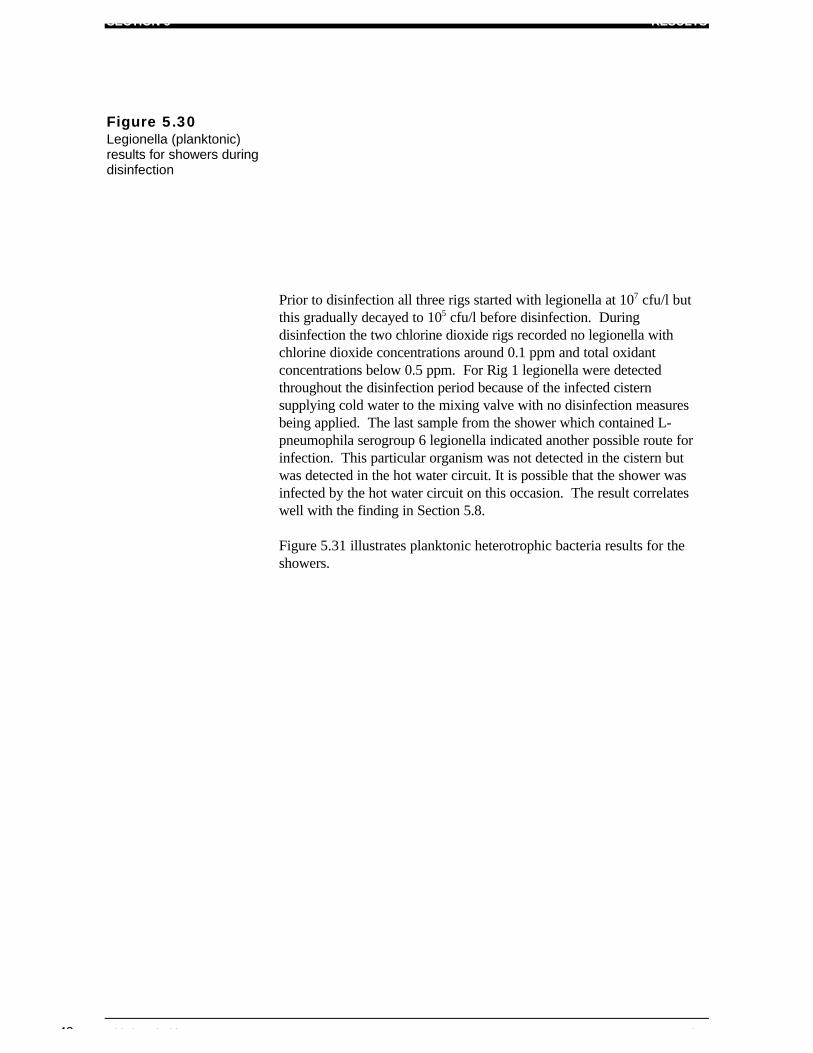
SECTION 5 RESULTS
42 Chlorine Dioxide Water Treatment ©BSRIA TN2/98
Figure 5.30Legionella (planktonic)results for showers duringdisinfection
Prior to disinfection all three rigs started with legionella at 107 cfu/l butthis gradually decayed to 105 cfu/l before disinfection. Duringdisinfection the two chlorine dioxide rigs recorded no legionella withchlorine dioxide concentrations around 0.1 ppm and total oxidantconcentrations below 0.5 ppm. For Rig 1 legionella were detectedthroughout the disinfection period because of the infected cisternsupplying cold water to the mixing valve with no disinfection measuresbeing applied. The last sample from the shower which contained L-pneumophila serogroup 6 legionella indicated another possible route forinfection. This particular organism was not detected in the cistern butwas detected in the hot water circuit. It is possible that the shower wasinfected by the hot water circuit on this occasion. The result correlateswell with the finding in Section 5.8.
Figure 5.31 illustrates planktonic heterotrophic bacteria results for theshowers.
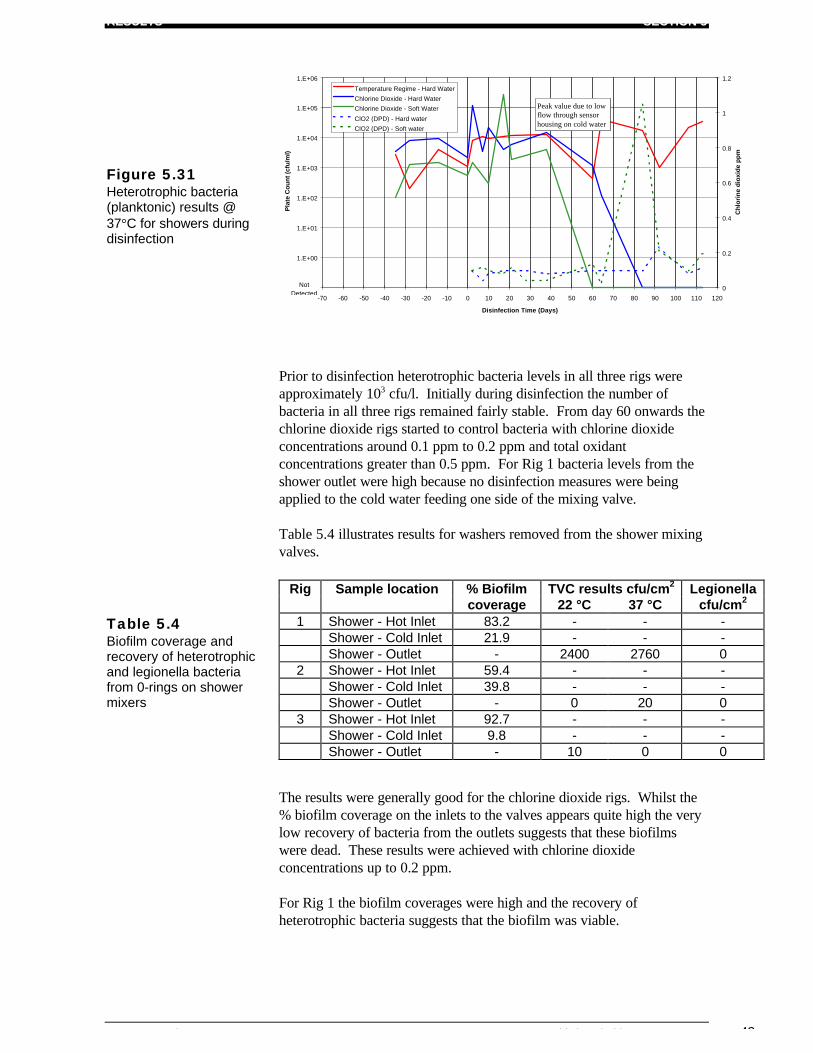
RESULTS SECTION 5
© BSRIA TN2/98 Chlorine Dioxide Water Treatment 43
Figure 5.31Heterotrophic bacteria(planktonic) results @37°C for showers duringdisinfection
Prior to disinfection heterotrophic bacteria levels in all three rigs wereapproximately 103 cfu/l. Initially during disinfection the number ofbacteria in all three rigs remained fairly stable. From day 60 onwards thechlorine dioxide rigs started to control bacteria with chlorine dioxideconcentrations around 0.1 ppm to 0.2 ppm and total oxidantconcentrations greater than 0.5 ppm. For Rig 1 bacteria levels from theshower outlet were high because no disinfection measures were beingapplied to the cold water feeding one side of the mixing valve.
Table 5.4 illustrates results for washers removed from the shower mixingvalves.
Table 5.4Biofilm coverage andrecovery of heterotrophicand legionella bacteriafrom 0-rings on showermixers
The results were generally good for the chlorine dioxide rigs. Whilst the% biofilm coverage on the inlets to the valves appears quite high the verylow recovery of bacteria from the outlets suggests that these biofilmswere dead. These results were achieved with chlorine dioxideconcentrations up to 0.2 ppm.
For Rig 1 the biofilm coverages were high and the recovery ofheterotrophic bacteria suggests that the biofilm was viable.
1.E-01
1.E+00
1.E+01
1.E+02
1.E+03
1.E+04
1.E+05
1.E+06
-70 -60 -50 -40 -30 -20 -10 0 10 20 30 40 50 60 70 80 90 100 110 120
Disinfection Time (Days)
Pla
te C
ou
nt
(cfu
/ml)
0
0.2
0.4
0.6
0.8
1
1.2
Ch
lori
ne
dio
xid
e p
pm
Temperature Regime - Hard Water
Chlorine Dioxide - Hard Water
Chlorine Dioxide - Soft Water
ClO2 (DPD) - Hard water
ClO2 (DPD) - Soft water
Not Detected
Peak value due to lowflow through sensorhousing on cold water
Rig Sample location % Biofilm TVC results cfu/cm2 Legionellacoverage 22 °C 37 °C cfu/cm2
1 Shower - Hot Inlet 83.2 - - -Shower - Cold Inlet 21.9 - - -Shower - Outlet - 2400 2760 0
2 Shower - Hot Inlet 59.4 - - -Shower - Cold Inlet 39.8 - - -Shower - Outlet - 0 20 0
3 Shower - Hot Inlet 92.7 - - -Shower - Cold Inlet 9.8 - - -Shower - Outlet - 10 0 0
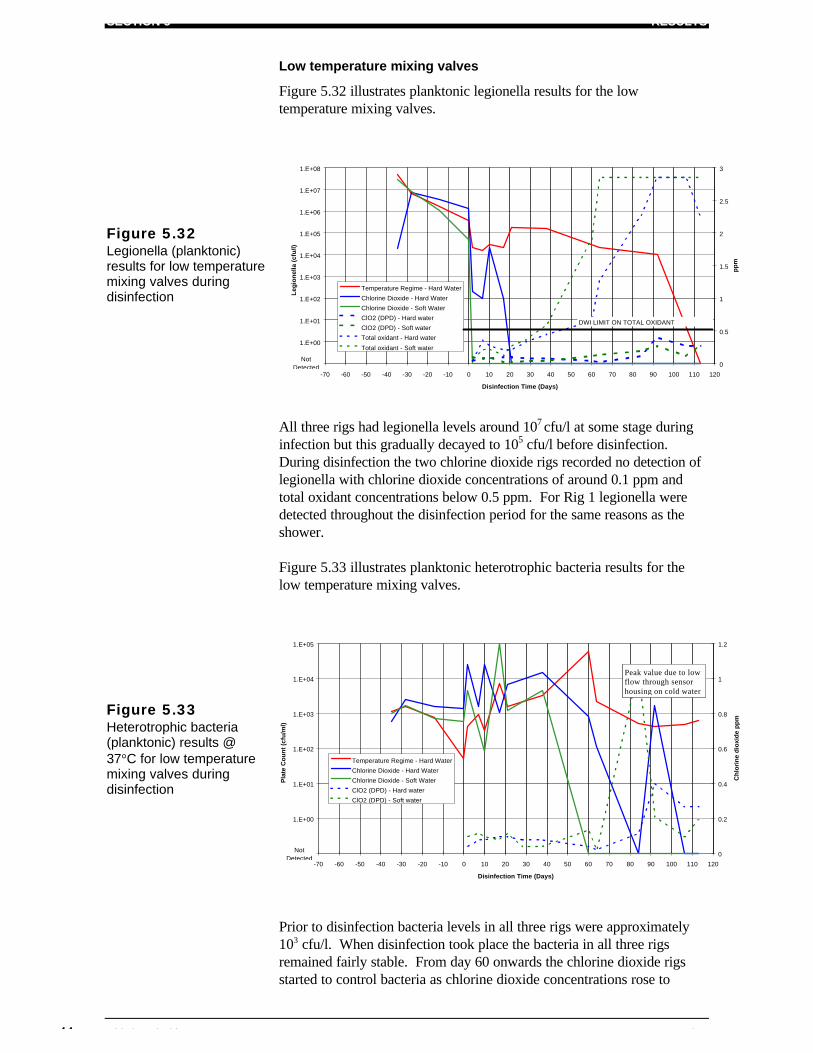
SECTION 5 RESULTS
44 Chlorine Dioxide Water Treatment ©BSRIA TN2/98
Low temperature mixing valves
Figure 5.32 illustrates planktonic legionella results for the lowtemperature mixing valves.
Figure 5.32Legionella (planktonic)results for low temperaturemixing valves duringdisinfection
All three rigs had legionella levels around 107 cfu/l at some stage duringinfection but this gradually decayed to 105 cfu/l before disinfection.During disinfection the two chlorine dioxide rigs recorded no detection oflegionella with chlorine dioxide concentrations of around 0.1 ppm andtotal oxidant concentrations below 0.5 ppm. For Rig 1 legionella weredetected throughout the disinfection period for the same reasons as theshower.
Figure 5.33 illustrates planktonic heterotrophic bacteria results for thelow temperature mixing valves.
Figure 5.33Heterotrophic bacteria(planktonic) results @37°C for low temperaturemixing valves duringdisinfection
Prior to disinfection bacteria levels in all three rigs were approximately103 cfu/l. When disinfection took place the bacteria in all three rigsremained fairly stable. From day 60 onwards the chlorine dioxide rigsstarted to control bacteria as chlorine dioxide concentrations rose to
1.E-01
1.E+00
1.E+01
1.E+02
1.E+03
1.E+04
1.E+05
1.E+06
1.E+07
1.E+08
-70 -60 -50 -40 -30 -20 -10 0 10 20 30 40 50 60 70 80 90 100 110 120
Disinfection Time (Days)
Leg
ion
ella
(cf
u/l)
0
0.5
1
1.5
2
2.5
3
pp
m
Temperature Regime - Hard Water
Chlorine Dioxide - Hard Water
Chlorine Dioxide - Soft Water
ClO2 (DPD) - Hard water
ClO2 (DPD) - Soft water
Total oxidant - Hard water
Total oxidant - Soft water
Not Detected
DWI LIMIT ON TOTAL OXIDANT
1.E-01
1.E+00
1.E+01
1.E+02
1.E+03
1.E+04
1.E+05
-70 -60 -50 -40 -30 -20 -10 0 10 20 30 40 50 60 70 80 90 100 110 120
Disinfection Time (Days)
Pla
te C
ou
nt
(cfu
/ml)
0
0.2
0.4
0.6
0.8
1
1.2
Ch
lori
ne
dio
xid
e p
pm
Temperature Regime - Hard Water
Chlorine Dioxide - Hard Water
Chlorine Dioxide - Soft Water
ClO2 (DPD) - Hard water
ClO2 (DPD) - Soft water
Not Detected
Peak value due to lowflow through sensorhousing on cold water
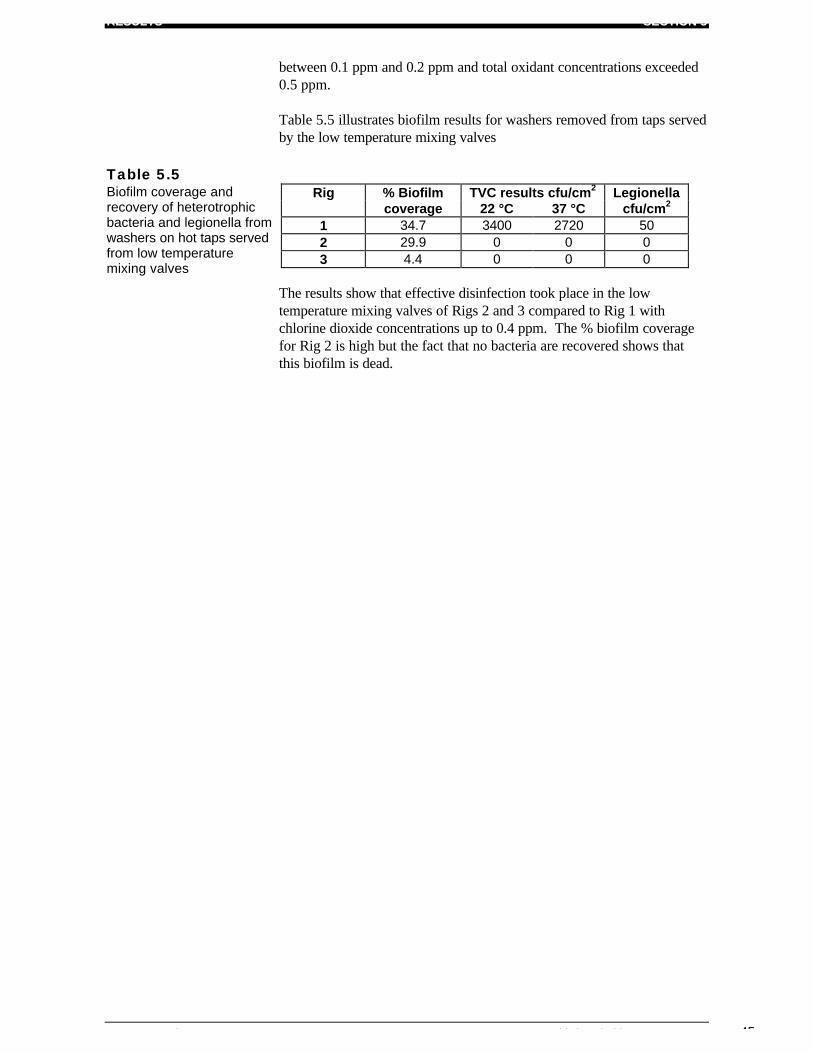
RESULTS SECTION 5
© BSRIA TN2/98 Chlorine Dioxide Water Treatment 45
between 0.1 ppm and 0.2 ppm and total oxidant concentrations exceeded0.5 ppm.
Table 5.5 illustrates biofilm results for washers removed from taps servedby the low temperature mixing valves
Table 5.5Biofilm coverage andrecovery of heterotrophicbacteria and legionella fromwashers on hot taps servedfrom low temperaturemixing valves
The results show that effective disinfection took place in the lowtemperature mixing valves of Rigs 2 and 3 compared to Rig 1 withchlorine dioxide concentrations up to 0.4 ppm. The % biofilm coveragefor Rig 2 is high but the fact that no bacteria are recovered shows thatthis biofilm is dead.
Rig % Biofilm TVC results cfu/cm2 Legionellacoverage 22 °C 37 °C cfu/cm2
1 34.7 3400 2720 502 29.9 0 0 03 4.4 0 0 0
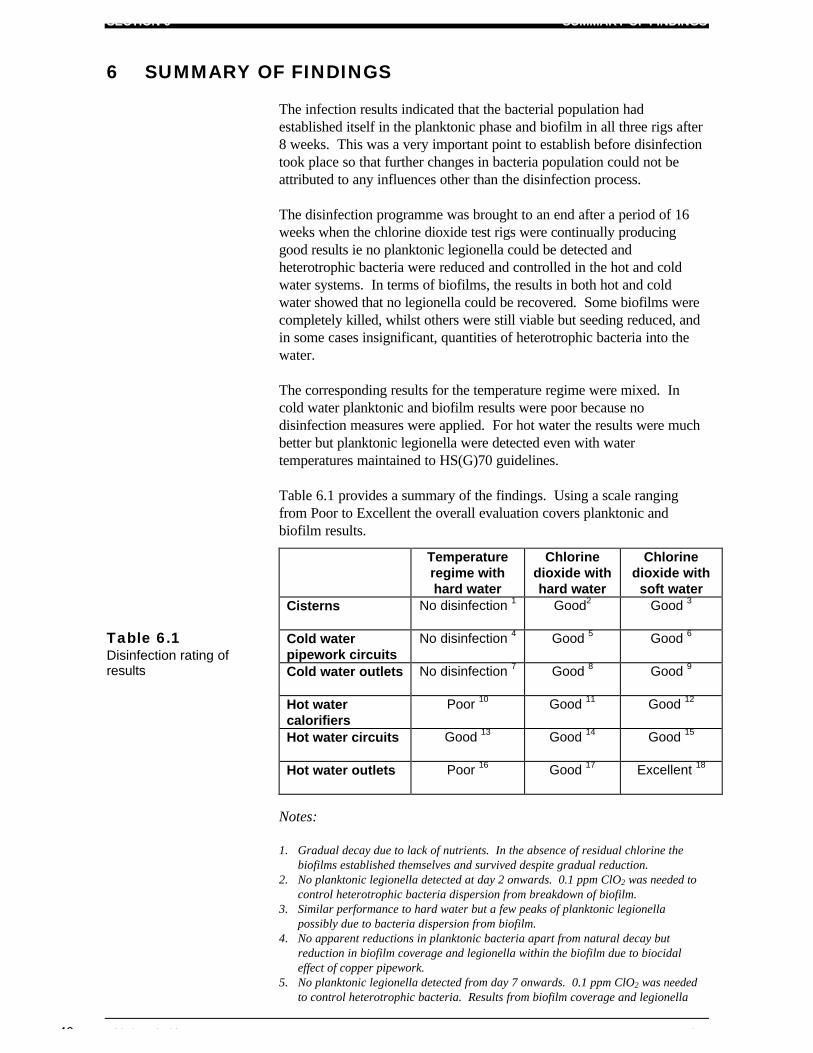
SECTION 6 SUMMARY OF FINDINGS
46 Chlorine Dioxide Water Treatment ©BSRIA TN2/98
6 SUMMARY OF FINDINGS
The infection results indicated that the bacterial population hadestablished itself in the planktonic phase and biofilm in all three rigs after8 weeks. This was a very important point to establish before disinfectiontook place so that further changes in bacteria population could not beattributed to any influences other than the disinfection process.
The disinfection programme was brought to an end after a period of 16weeks when the chlorine dioxide test rigs were continually producinggood results ie no planktonic legionella could be detected andheterotrophic bacteria were reduced and controlled in the hot and coldwater systems. In terms of biofilms, the results in both hot and coldwater showed that no legionella could be recovered. Some biofilms werecompletely killed, whilst others were still viable but seeding reduced, andin some cases insignificant, quantities of heterotrophic bacteria into thewater.
The corresponding results for the temperature regime were mixed. Incold water planktonic and biofilm results were poor because nodisinfection measures were applied. For hot water the results were muchbetter but planktonic legionella were detected even with watertemperatures maintained to HS(G)70 guidelines.
Table 6.1 provides a summary of the findings. Using a scale rangingfrom Poor to Excellent the overall evaluation covers planktonic andbiofilm results.
Table 6.1Disinfection rating ofresults
Notes: 1. Gradual decay due to lack of nutrients. In the absence of residual chlorine the
biofilms established themselves and survived despite gradual reduction.2. No planktonic legionella detected at day 2 onwards. 0.1 ppm ClO2 was needed to
control heterotrophic bacteria dispersion from breakdown of biofilm.3. Similar performance to hard water but a few peaks of planktonic legionella
possibly due to bacteria dispersion from biofilm.4. No apparent reductions in planktonic bacteria apart from natural decay but
reduction in biofilm coverage and legionella within the biofilm due to biocidaleffect of copper pipework.
5. No planktonic legionella detected from day 7 onwards. 0.1 ppm ClO2 was neededto control heterotrophic bacteria. Results from biofilm coverage and legionella
Temperatureregime withhard water
Chlorinedioxide withhard water
Chlorinedioxide with
soft waterCisterns No disinfection 1 Good2 Good 3
Cold waterpipework circuits
No disinfection 4 Good 5 Good 6
Cold water outlets No disinfection 7 Good 8 Good 9
Hot watercalorifiers
Poor 10 Good 11 Good 12
Hot water circuits Good 13 Good 14 Good 15
Hot water outlets Poor 16 Good 17 Excellent 18
SUMMARY OF FINDINGS SECTION 6
© BSRIA TN2/98 Chlorine Dioxide Water Treatment 47
within were not conclusive because of biocidal effect of copper pipework. Forheterotrophic bacteria within biofilm, no bacteria were detected from day 92onwards.
6. Similar performance to hard water but one peak of planktonic legionella on day 10possibly due to bacteria dispersion from biofilm. Results from biofilm coverageand legionella within were not conclusive because of biocidal effect of copperpipework. For heterotrophic bacteria within biofilm, no bacteria were detectedfrom day 92 onwards.
7. Gradual reduction of planktonic legionella due to natural decay only.8. Rapid rate of disinfection for planktonic legionella with ClO2 concentrations
around 0.1 ppm. For planktonic heterotrophic bacteria disinfection with 0.1 ppmClO2 was slow. Biofilm results were generally good but the scale in hard watermay have partially shielded the heterotrophic bacteria from the chlorine dioxide.
9. Rapid rate of disinfection for planktonic legionella with ClO2 concentrationsaround 0.1 ppm. For planktonic heterotrophic bacteria disinfection with 0.1 ppmClO2 was slow. Biofilm results were excellent.
10. No disinfection took place apart from natural decay because base watertemperature was 45°C.
11. Good disinfection of planktonic legionella but scale in hard water appears to havepartially shielded bacteria from the effects of the chlorine dioxide. Control ofplanktonic heterotrophic bacteria was difficult even with ClO2 between 0.1 and0.45 ppm.
12. No legionella detected from day 7 onwards. Control of planktonic heterotrophicbacteria was difficult even with ClO2 between 0.1 and 0.45 ppm.
13. Excellent rate of disinfection apart from last water sample which detectedserogroup 6 legionella that had possibly entered rig via the open vent.
14. Disinfection of planktonic legionella good but scale does appear to harbourbacteria from the effects of the chlorine dioxide.
15. Results better than hard water in terms of rate of disinfection and control ofplanktonic bacteria.
16. Despite meeting HS(G)70 temperature criteria the results for the hot water deadlegwere poor because the outlet was only discharged 15 seconds every two hours. Forthe other outlets results were poor because of the cold feed having no disinfectionmeasures applied.
17. Excellent results from planktonic and biofilm results. The only concerns were thecontrol of heterotrophic bacteria and biofilm coverage.
18. Control of planktonic heterotrophic bacteria and biofilm coverage better thanresults in hard water.
6.1 COPPER LEVELS All the circuits dosed with chlorine dioxide showed some increase inthe level of copper found in solution.
Any increase in copper levels was of interest for three reasons. Firstlycopper concentrations above 1000 µg/l (WHO aesthetic guideline) canpotentially cause staining of baths and showers, though there is noevidence that this has been a problem in actual installations. Secondly,copper concentrations above 3000 µg/l would contravene the WaterSupply (Water Quality) Regulations 1989. Thirdly, raised copper levelsmay be a sign of pipework corrosion.
There are thought to be four possible mechanisms for the increasedconcentrations of copper:
• The biofilm contained small quantities of copper and coppercompounds that were released into solution as the chlorine dioxidedisrupted the biofilm.
• Copper compounds in the surface deposits/scale coating the pipe weremobilised by the application of chlorine dioxide.
• The chlorine dioxide stripped off the protective deposits on the copperpipe leading to increased rates of conventional corrosion.
SECTION 6 SUMMARY OF FINDINGS
48 Chlorine Dioxide Water Treatment ©BSRIA TN2/98
• The chlorine dioxide attacked the copper pipework directly, releasingcorrosion products into solution.
The trial did not run for long enough to conclusively determine which ofthese mechanisms was most significant or whether the copper levelswould reach an equilibrium or indeed decrease. The major cause ofcorrosion failure of copper pipe in buildings is usually pitting corrosion.The duration of this trial was insufficient to determine whether thisproblem would be aggravated by chlorine dioxide. However, anyoxidising biocide (such as bromine or chlorine, as well as chlorinedioxide) has the potential to react with copper pipework, and mayincrease corrosion rates.
CONCLUSIONS SECTION 7
© BSRIA TN2/98 Chlorine Dioxide Water Treatment 49
7 CONCLUSIONS
7.1 CHLORINEDIOXIDE REGIME
Low concentrations of chlorine dioxide were effective in controllingplanktonic legionella bacteria. Where chlorine dioxide concentrationswere maintained at 0.1 ppm or above chlorine dioxide was shown toprovide effective disinfection and control of planktonic legionella in bothcold water systems and hot water systems with reduced watertemperatures as low as 30°C to 35°C.
For heterotrophic bacteria higher concentrations of chlorine dioxide wereneeded to produce effective disinfection and control in both cold and hotwater systems. For cold water systems chlorine dioxide concentrations of0.1 ppm to 0.2 ppm were shown to be effective whilst higherconcentrations up to 0.35 ppm were needed for the hot water system.
For biofilms chlorine dioxide concentrations around 0.1 ppm producedeffective disinfection of the biofilm in the GRP cisterns and the hot waterpipework circuit running at a reduced water temperature of 30°C to35°C. For hot and cold water outlets the final results from the washersshowed that chlorine dioxide concentrations of 0.4 ppm were effective inkilling biofilm. For cold water pipework and the base of hot watercalorifiers the biofilm results were inconclusive with respect to chlorinedioxide because copper is naturally biocidal.
Maintaining effective chlorine dioxide concentrations whilst keeping totaloxidant concentrations below 0.5 ppm was not a straightforward taskeven with a test rig which had identical water discharges each day. Oneof the main problems was the low turnover of water in the rig whichcaused the total oxidant levels to rise. Another problem was the methodof dosing chlorine dioxide according to a sensor in the system. Inindustry, these problems are less significant because typical watersystems have higher turnover rates and the chlorine dioxide wouldnormally be proportionally dosed according to the amount of waterentering the system.
In terms of chlorine dioxide usage, the results showed that more chlorinedioxide was used in the soft water than hard water systems to achieve thesame concentration. Furthermore, the results suggested that chlorinedioxide may be gassing off up the open vent of the hot water calorifiersbecause more chlorine dioxide was used in the hot water than cold in bothrigs. This suggests that excessively high calorifier temperatures shouldbe avoided.
To obtain effective control of bacteria it is important to distribute thechlorine dioxide throughout the system. In systems with low throughputsof water as experienced in the test rig this can be a problem if totaloxidant levels at outlets are to be controlled below 0.5 ppm.
In terms of measuring chlorine dioxide, the results suggest that lowchlorine dioxide concentrations experienced at water outlets were difficultto measure with the DPD test method. An easier and more appropriatecontrol measure (providing reasonable water throughput is achieved)might be total oxidant measured with the DPD or drop test.
SECTION 7 CONCLUSIONS
50 Chlorine Dioxide Water Treatment ©BSRIA TN2/98
Scale and bacteria play an important part in any water treatment regime.The results in hard water showed that consideration must be given tocontrolling scale if chlorine dioxide is to be fully effective againstheterotrophic bacteria in biofilms in a low level disinfection programme.
All the circuits dosed with chlorine dioxide showed some increase in thelevel of copper found in solution.
The trial did not run for long enough to conclusively determine whether thecopper levels would reach an equilibrium or indeed decrease. The majorcause of corrosion failure of copper pipe in buildings is usually pittingcorrosion and the trial duration was insufficient to determine whether thisproblem would be aggravated by chlorine dioxide. Any oxidising biocide(such as bromine or chlorine, as well as chlorine dioxide) has the potentialto react with copper pipework, and may increase corrosion rates. Howeverno problems of direct copper corrosion have been reported in industryassociated with the use of up to 0.5 mg/λ of chlorine dioxide for waterdisinfection.
7.2 TEMPERATUREREGIME
In cold water storage the results showed that in the absence of residualchlorine in the mains water, biofilms can establish themselves in glassreinforced plastic (GRP) cisterns built to bylaw 30 standards even whenthe temperature of the water is kept at or below 20°C.
Furthermore, the results showed that cold water cisterns can be a sourceof infection to the systems they serve, namely the hot water storagecalorifier, cold water pipework circuit and water outlets such as showersand low temperature mixing valves which receive water supplies fromboth of these sources.
For hot water circuits the results suggest that the maintenance of hotwater at 60°C flow and 50°C return does not provide complete protectionfrom legionella surviving. The hot water circuit has an open vent toatmosphere which stores cooler water. The results suggest that this wasthe potential source of contamination to the hot water circuit.
For hot water outlets the results were generally poor because the coldwater supply to the shower and low temperature mixing valve did nothave any disinfection measures applied and therefore served as a sourceof contamination. The results for the hot water deadleg highlighted theproblem of a temperature regime where normal usage of 15 seconds waterdischarge every two hours did not produce effective disinfection. Thedeadleg meets HS(G)70’s suggested test criteria of achieving 50°C at theoutlet within one minute of running. However, HS(G)70 also demandsthat a thorough risk assessment is carried out, which should reveal thatthe expected usage would not protect the outlet, preventing compliancewith HS(G)70.
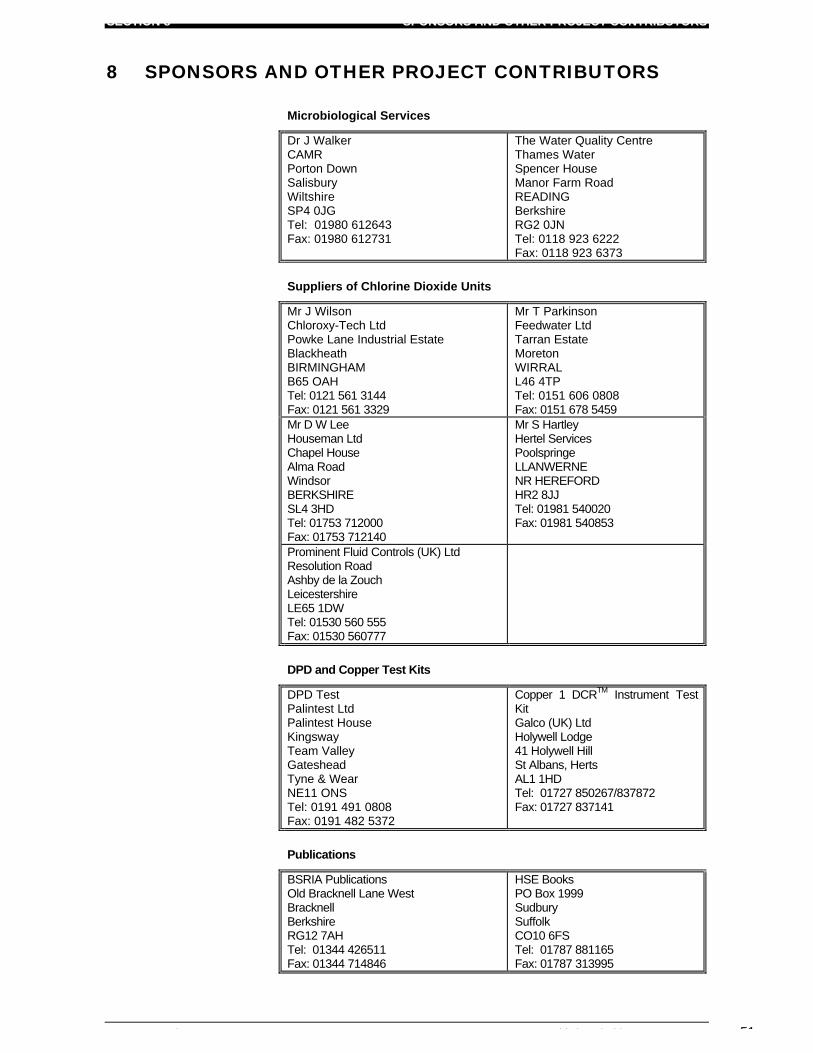
SECTION 8 SPONSORS AND OTHER PROJECT CONTRIBUTORS
© BSRIA TN2/98 Chlorine Dioxide Water Treatment 51
8 SPONSORS AND OTHER PROJECT CONTRIBUTORS
Microbiological Services
Dr J WalkerCAMRPorton DownSalisburyWiltshireSP4 0JGTel: 01980 612643Fax: 01980 612731
The Water Quality CentreThames WaterSpencer HouseManor Farm RoadREADINGBerkshireRG2 0JNTel: 0118 923 6222Fax: 0118 923 6373
Suppliers of Chlorine Dioxide Units
Mr J WilsonChloroxy-Tech LtdPowke Lane Industrial EstateBlackheathBIRMINGHAMB65 OAHTel: 0121 561 3144Fax: 0121 561 3329
Mr T ParkinsonFeedwater LtdTarran EstateMoretonWIRRALL46 4TPTel: 0151 606 0808Fax: 0151 678 5459
Mr D W LeeHouseman LtdChapel HouseAlma RoadWindsorBERKSHIRESL4 3HDTel: 01753 712000Fax: 01753 712140
Mr S HartleyHertel ServicesPoolspringeLLANWERNENR HEREFORDHR2 8JJTel: 01981 540020Fax: 01981 540853
Prominent Fluid Controls (UK) LtdResolution RoadAshby de la ZouchLeicestershireLE65 1DWTel: 01530 560 555Fax: 01530 560777
DPD and Copper Test Kits
DPD TestPalintest LtdPalintest HouseKingswayTeam ValleyGatesheadTyne & WearNE11 ONSTel: 0191 491 0808Fax: 0191 482 5372
Copper 1 DCRTM Instrument TestKitGalco (UK) LtdHolywell Lodge41 Holywell HillSt Albans, HertsAL1 1HDTel: 01727 850267/837872Fax: 01727 837141
Publications
BSRIA PublicationsOld Bracknell Lane WestBracknellBerkshireRG12 7AHTel: 01344 426511Fax: 01344 714846
HSE BooksPO Box 1999SudburySuffolkCO10 6FSTel: 01787 881165Fax: 01787 313995
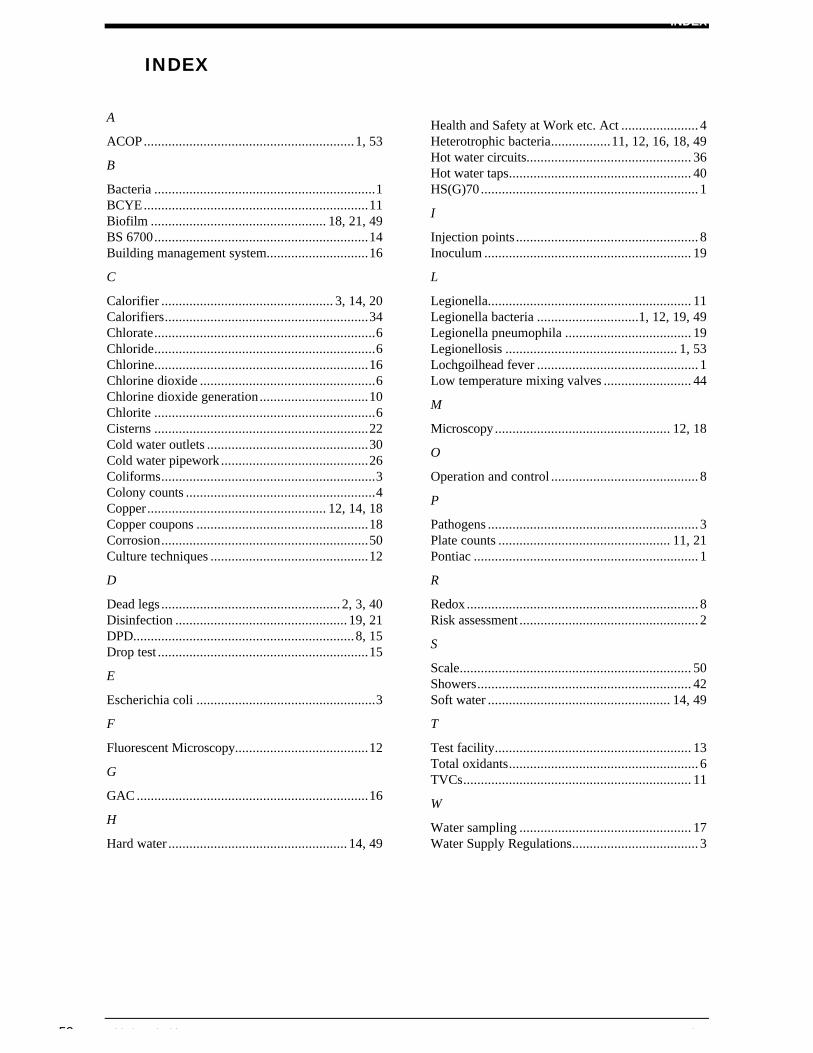
INDEX
52 Chlorine Dioxide Water Treatment ©BSRIA TN2/98
INDEX
A
ACOP............................................................1, 53
B
Bacteria ...............................................................1BCYE................................................................11Biofilm .................................................. 18, 21, 49BS 6700.............................................................14Building management system.............................16
C
Calorifier ................................................. 3, 14, 20Calorifiers..........................................................34Chlorate...............................................................6Chloride...............................................................6Chlorine.............................................................16Chlorine dioxide ..................................................6Chlorine dioxide generation...............................10Chlorite ...............................................................6Cisterns .............................................................22Cold water outlets ..............................................30Cold water pipework ..........................................26Coliforms.............................................................3Colony counts ......................................................4Copper................................................... 12, 14, 18Copper coupons .................................................18Corrosion...........................................................50Culture techniques .............................................12
D
Dead legs ................................................... 2, 3, 40Disinfection ................................................. 19, 21DPD...............................................................8, 15Drop test ............................................................15
E
Escherichia coli ...................................................3
F
Fluorescent Microscopy......................................12
G
GAC ..................................................................16
H
Hard water ................................................... 14, 49
Health and Safety at Work etc. Act ...................... 4Heterotrophic bacteria.................11, 12, 16, 18, 49Hot water circuits............................................... 36Hot water taps.................................................... 40HS(G)70 .............................................................. 1
I
Injection points .................................................... 8Inoculum ........................................................... 19
L
Legionella.......................................................... 11Legionella bacteria .............................1, 12, 19, 49Legionella pneumophila .................................... 19Legionellosis ................................................. 1, 53Lochgoilhead fever .............................................. 1Low temperature mixing valves ......................... 44
M
Microscopy.................................................. 12, 18
O
Operation and control .......................................... 8
P
Pathogens ............................................................ 3Plate counts ................................................. 11, 21Pontiac ................................................................ 1
R
Redox .................................................................. 8Risk assessment ................................................... 2
S
Scale.................................................................. 50Showers............................................................. 42Soft water .................................................... 14, 49
T
Test facility........................................................ 13Total oxidants...................................................... 6TVCs................................................................. 11
W
Water sampling ................................................. 17Water Supply Regulations.................................... 3
REFERENCES
© BSRIA TN2/98 Chlorine Dioxide Water Treatment 53
REFERENCES
1 PAVEY N L. Guide to Legionellosis, Temperature Measurements for Hot and Cold WaterServices. Application Guide AG 4/94. BSRIA. ISBN 0 86022 366 3.
2 PAVEY N L. Ionisation Water Treatment for Hot and Cold Water Services. Technical NoteTN 6/96. BSRIA. ISBN 0 86022 438 4.
3 The Health and Safety Commission. ACOP L8(rev) The Prevention or Control ofLegionellosis (Including Legionnaires’ Disease). HMSO ISBN 0 7176 0732 1.
4 The Health and Safety Executive. The Control of Legionellosis Including Legionnaires'Disease. Health and Safety Series Booklet. (HS(G)70). HSE. ISBN 0 11 882150 4.
5 The Water Supply (Water Quality) Regulations 1989 and Water Supply (Water Quality)(Amendment) Regulations 1991.
6 Water Research Centre. Water Supply Bylaws Guide (lst Edition). ISBN 0 902156 24 1.
7 BS6700: 1987. British Standard Specification for Design, Installation, Testing andMaintenance of Services Supplying Water for Domestic Use Within Buildings and TheirCurtilages.
8 NOSS C I. et al. Reactivity of Chlorine Dioxide with Nucleic Acids and Proteins. WaterChlorination: Environmental Impact and Health Effects, Vol 4 (R.L.Jolley et al, editors), AnnArbor Sci. Publ.; Ann Arbor, Mich. (1983).
9 OLIVIERI V P. et al. Mode of Action of Chlorine Dioxide on Selected Viruses. WaterChlorination: Environmental Impact and Health Effects, Vol 5 (R.L.Jolley et al, editors), AnnArbor Sci. Publ., Ann Arbor, Mich. (1985).
10 BERNARDE M A. et al. Kinetics and Mechanisms of Bacterial Disinfection by ChlorineDioxide. Appl. Microbiol; 15:257 (1967).
11 BERG J D. et al. Effect of Chlorine Dioxide on Selected Membrane Functions in E.coli. Jour.Appl. Bacteriol. (accepted for publication in 1986).
12 GHANDBARI E H. et al. Reactions of Chlorine and Chlorine Dioxide with Free Fatty Acids,Fatty Acid Esters, and Triglycerides. Water Chlorination: Environmental Impact and HealthEffects, Vol 4 (R.L.Jolley et al, editors), Ann Arbor Sci. Publ., Ann Arbor, Mich. (1983).
13 KEEVIL C W. WALKER J T. Normarski DIC Microscopy and Image Analysis of Biofilms.CAMR, Salisbury, Wiltshire.