Embed Size (px)
Citation preview

Chloramine Treatment & Management
NHWWA Operator Training Session
Presented by:
David G. Miller, P.E. Deputy Director, Water Supply & Treatment
Manchester Water Works [email protected]

Acknowledgements
NEWWA Disinfection Committee Professor Jim Malley, UNH Cynthia Klevens, NHDES Manchester Water Works Operators &
Laboratory Staff

References Alternative Disinfectants and Oxidants
Guidance Manual, USEPA, 1999
A Guide for the Implementation and Use of Chloramines, AwwaRF, 2004
Water Chlorination/Chloramination Practices and Principles (M20), AWWA, Latest Edition

Presentation Outline Why Use Chloramines? Pathogen Inactivation & Disinfection DBP Formation Control Chlorine & Chloramine Chemistry Chlorine & Ammonia Feed Methods Safety Considerations Managing the Chloramination Process Impact on other Treatment Processes

Why Use Chloramines? Secondary (residual) Disinfection
Reduce DBP risks to public health Less reactive with organics than free chlorine
therefore forms less THMs Monochloramine residual more stable and
lasts longer than free chlorine residual Monochloramine superior to free chlorine at
penetrating biofilm Less likely to have taste & odor complaints Normal dosage: 1.0 to 4.0 mg/L Minimum residual: 0.5 mg/L
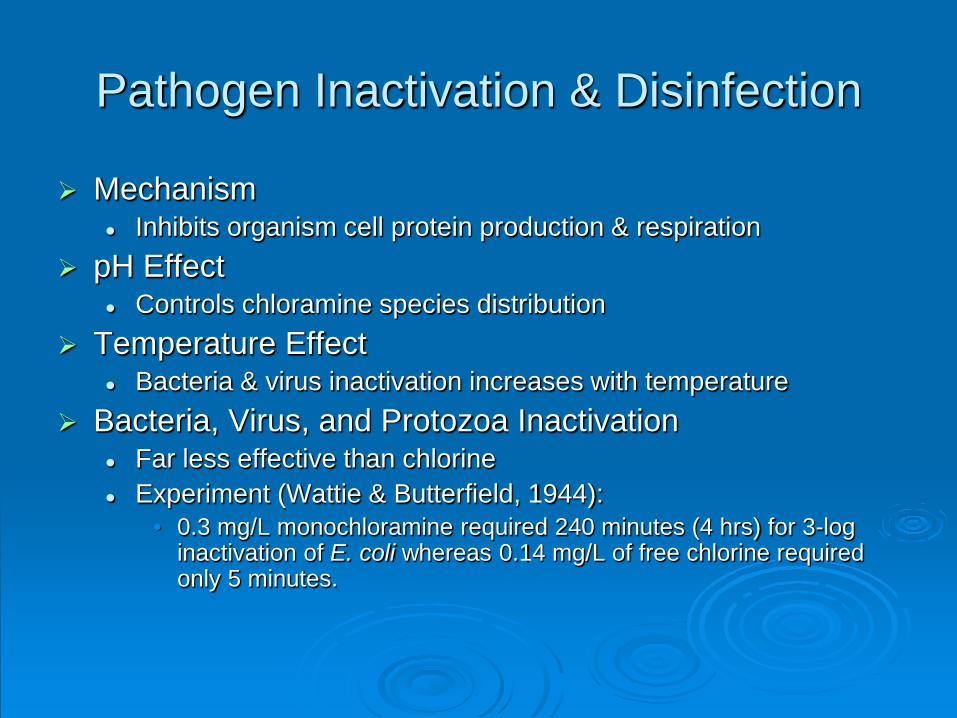
Pathogen Inactivation & Disinfection
Mechanism Inhibits organism cell protein production & respiration
pH Effect Controls chloramine species distribution
Temperature Effect Bacteria & virus inactivation increases with temperature
Bacteria, Virus, and Protozoa Inactivation Far less effective than chlorine Experiment (Wattie & Butterfield, 1944):
• 0.3 mg/L monochloramine required 240 minutes (4 hrs) for 3-log inactivation of E. coli whereas 0.14 mg/L of free chlorine required only 5 minutes.

DBP Formation Control Chloramines reduce levels of chlorinated &
halogenated by-products in treated water Impacted by:
Cl2:N ratio Point of ammonia addition relative to chlorine MIXING pH
Chloramines can produce (currently unregulated) by-products! Cyanogen chloride – gas, pungent/pepper odor, highly toxic NDMA – Highly toxic, suspected carcinogen. Forms when
nitrogen reacts with chlorine/chloramines

MWW TTHM’s Since 2000
Began Chloramination
SEP 2006
Began Chloramination

MWW HAA’s Since 2000
Began Chloramination
Began Chloramination

Chlorine/Chloramine Chemistry
When chlorine is added to water: Cl2 + H2O → HOCl + H+ + Cl- (Hydrolysis)
HOCl ↔ OCl- + H+ (Dissociation) Hypochlorous Hypochlorite acid ion

pH and Temperature effects

Chlorine/Chloramine Chemistry When ammonia is added after chlorine:
NH3 + HOCl → NH2Cl + H2O (monochloramine)
NH2Cl + HOCl → NHCl2 + H2O (dichloramine)
NHCl2 + HOCl → NCl3 + H2O (trichloramine)
These reactions are Cl2:N ratio and pH
dependent

Source: Wolfe et al. 1984
(1.0 mg/L ammonia-nitrogen; pH 7; temperature 25°C)
1 2 3 4 5 6 7 8 9 10 11 12 13
1
5
4
3
2
6
Monochloramine Di- and Tri - chloramines Free chlorine
3
Breakpoint
Tota
l Res
idua
l Chl
orin
e (m
g/L
)
Chlorine Dose (mg/L)
Theoretical Breakpoint Curve

Chloramine Speciation with pH
(2.5 mg/L chlorine; 0.5 mg/L ammonia-nitrogen; temperature 25°C; contact time 2 hours)
80
60
40
20
100
pH
Monochloramine
Trichloramine
Source: Palin 1950
3 5 6 4 7 8
Dichloramine

Generation of Chloramines
Monochloramine is the preferred species Provides a persistent residual Dichloramine & trichloramine produce
objectionable tastes & odors
3:1 to 5:1 ratio of Cl2:N produces monochloramine

Chlorine Feed Methods
Gaseous Chlorine 150lb or 1-ton cylinders “Chlorinator” Safety concerns
Sodium Hypochlorite Typically bulk purchased Fed directly into process stream
MIXING IS CRITICAL

Ammonia Feed Methods Anhydrous Ammonia (gas)
Portable cylinders or 1,000 gallon tanks Minimum working pressure of 250 psi “Ammoniator”
• self-contained modular unit w/PRV, flow meter & rate control valve
• Typically auto-paced Direct Feed Method: low process stream pressure Solution Feed Method: larger applications, high
process stream pressure
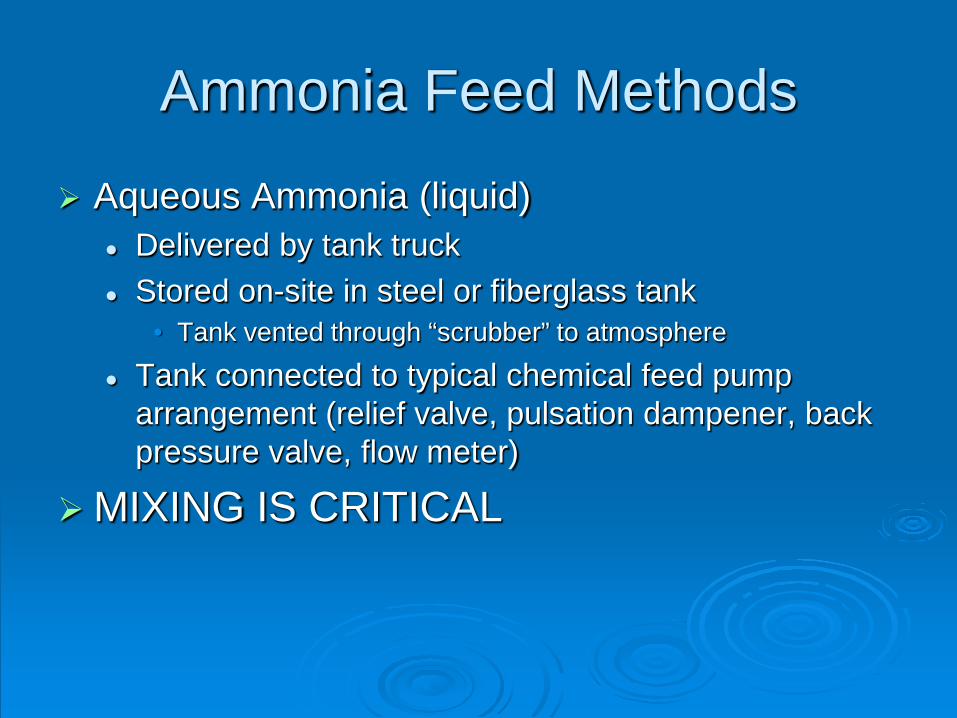
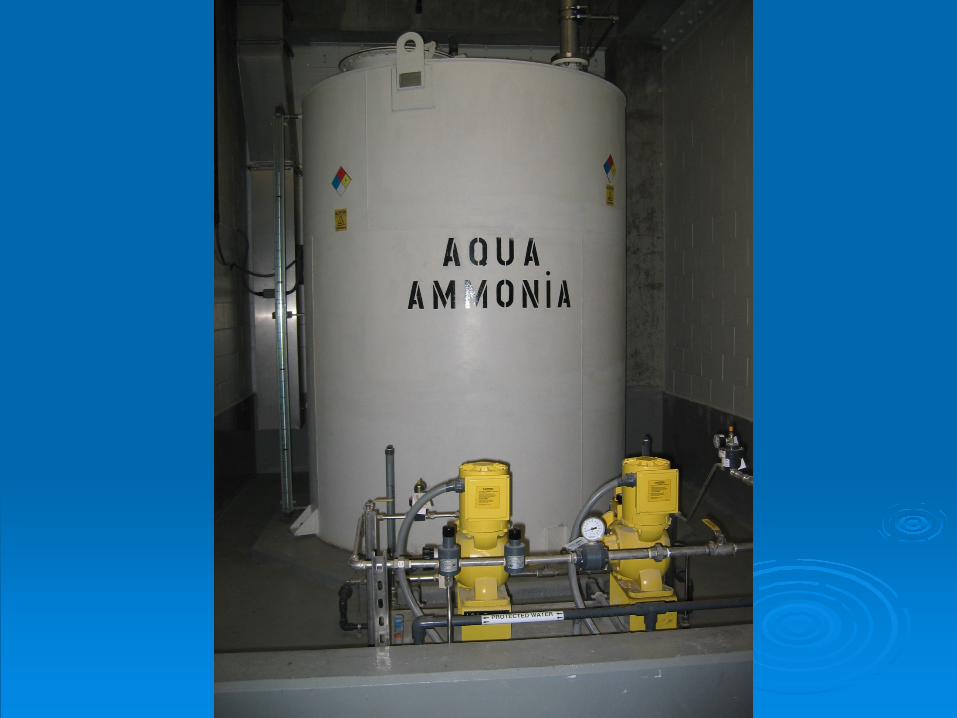
Ammonia Feed Methods Aqueous Ammonia (liquid)
Delivered by tank truck Stored on-site in steel or fiberglass tank
• Tank vented through “scrubber” to atmosphere Tank connected to typical chemical feed pump
arrangement (relief valve, pulsation dampener, back pressure valve, flow meter)
MIXING IS CRITICAL


Safety Considerations Never store chlorine gas & ammonia gas in
same room Room ventilation at high point (≥ 6 air exchanges per
minute) Vapor detection device/alarm Protect ammonia gas storage tanks from direct
sunlight and heat sources Review MSDS regularly and have available
appropriate personal protective gear


Sequence of Application
Ammonia then Chlorine Less likely to form objectionable taste and
odors Chlorine then Ammonia
Most common in drinking water industry Enables achievement of required CT for
inactivation of viruses and Giardia (germacidal effectiveness of chloramines 200 times less
than chlorine)

Managing the Chloramination Process
Manchester Water Works Disinfection Process:
Source > Pretreatment > OZONE > Filtration >
Clearwell > Distribution System Secondary/Residual Disinfectant
Primary Disinfectant
Chlorine Ammonia
Managing the Chloramination Process
How do we get this right? Establish a POE Total Chlorine Target
• Higher in warm water, lower in cold water • Residuals farthest from WTP tell the story!
Add chlorine MIX WELL! Measure free chlorine then add ammonia at
ratio approximately 4.5 : 1 MIX WELL again!
Monitor the process several ways

Managing the Chloramination Process
Process Analyzer: HACH 5500sc Ammonia Monochloramine Analyzer Directly measures Monochloramine and Total Ammonia Calculates Free Ammonia, Total Chlorine, Chlorine to Ammonia Ratio If OOS, operators use HACH SL1000 to check parameters

Managing the Chloramination Process
SCADA calculation Uses free chlorine residual and ammonia
dose to keep a running tally of chlorine to ammonia ratio based on:
• 2-hour running average • 8-hour running average
Daily Laboratory Confirmation Using lab bench readings of total chlorine,
monochloramine, free chlorine, & free ammonia

Managing the Chloramination Process
Free Ammonia is the key!
Target free ammonia between 0.05 and 0.1 mg/L

Source: Wolfe et al. 1984
(1.0 mg/L ammonia-nitrogen; pH 7; temperature 25°C)
1 2 3 4 5 6 7 8 9 10 11 12 13
1
5
4
3
2
6
Monochloramine Di- and Tri - chloramines Free chlorine
3
Breakpoint
Tota
l Res
idua
l Chl
orin
e (m
g/L
)
Chlorine Dose (mg/L)
Theoretical Breakpoint Curve

Impact on other Treatment Processes
Nitrification - Excess ammonia can provide nutrients for nitrifying bacteria in distribution system Ammonia-Nitrogen + nitrosomonas→ Nitrite + nitrobacter → Nitrate Can lead to loss of residual; decrease in pH, alkalinity, and DO; and
increase in bacterial growth Must closely monitor distribution system to detect signs of nitrification Control: Convert to free chlorine, increase chloramine residual,
increase ratio, adjust pH, system flushing, reduce water age.
Monochloramine addition upstream of filters reduces biological growth on media
Improper Cl2:N ratio control can lead to breakpoint reactions (loss of residual!)

Impact on other Treatment Processes
Switching to chloramines WILL change water quality conditions in the distribution system (especially ORP)
Need to monitor system pH; Cl2 to NH4-N Mass Ratio; Lead & Copper; Microbes; Ammonia; Nitrite & Nitrate
Washington, D.C. Disaster (In 2000 switched to chloramines without
understanding potential corrosion control impacts and failed to monitor key parameters in distribution system)

Some Take Home Messages Chloramines Reduce DBP Risks to Public Health Chloramines Reduce Microbial Regrowth and
Risk in Distribution Systems and in Hospitals Chloramines alone DO NOT cause Corrosion
Problems (failing to understand water chemistry impacts and monitor for signs of trouble certainly can)
The Decision to Switch to Chloramines Requires: An Experienced Team Effort Careful Planning Including Public Education Careful Implementation of Switching to Chloramines System Monitoring of Key Water Quality Parameters
{e.g., pH; Cl2 to NH4-N Mass Ratio; Lead and Copper; Microbes, Ammonia, Nitrite and Nitrate} is Needed

Questions?