Embed Size (px)
Citation preview
2009
Annual Report
1
CONTENTS PAGEFinancial Highlights 3Five-Year Financial Summary 4Board of Management 5Management Discussion and Analysis 6Report of the Directors 14Corporate Governance 17Independent Auditor’s Report 18Consolidated Income Statement 20Consolidated Statement of Comprehensive Income 21Statement of Comprehensive Income 22Consolidated Balance Sheet 23Balance Sheet 24Consolidated Statement of Changes in Equity 25Statement of Changes in Equity 26Consolidated Cash Flow Statement 27Notes to the Financial Statements
1. Principal activities 282. Summary of significant accounting policies 283. Critical accounting estimates and judgements in applying accounting policies 534. Financial risk management 555. Net interest income 1096. Net fees and commission income 1107. Net trading income 1108. Net gain on investments in securities 1119. Other operating income 11110. Net reversal/(charge) of impairment allowances 11111. Operating expenses 11212. Net gain from disposal of/fair value adjustments on investment properties 11313. Net loss from disposal of properties, plant and equipment 11314. Taxation 11315. Profit attributable to equity holders of the Bank 11416. Dividends 11417. Retirement benefit costs 11418. Share option schemes 11519. Directors’ and senior management’s emoluments 11720. Cash and balances with banks and other financial institutions 11821. Financial assets designated at fair value through profit or loss 11822. Derivative financial instruments 11923. Advances and other accounts 12424. Loan impairment allowances 12425. Investment in securities 12626. Investment in subsidiaries 13027. Investment properties 13128. Properties, plant and equipment 13229. Other assets 13530. Financial liabilities designated at fair value through profit or loss 13531. Deposits from customers 13632. Other accounts and provisions 13733. Deferred taxation 13834. Share capital 14035. Reserves 14036. Notes to consolidated cash flow statement 141
2
CONTENTS PAGE 37. Contingent liabilities and commitments 14238. Capital commitments 14239. Operating lease commitments 14340. Litigation 14341. Segmental reporting 14442. Loans to directors and officers 14743. Significant related party transactions 14744. Currency concentrations 14945. Cross-border claims 15046. Non-bank Mainland China exposures 15147. Ultimate holding Company 15148. Approval of financial statements 151 Branch Network 152
3
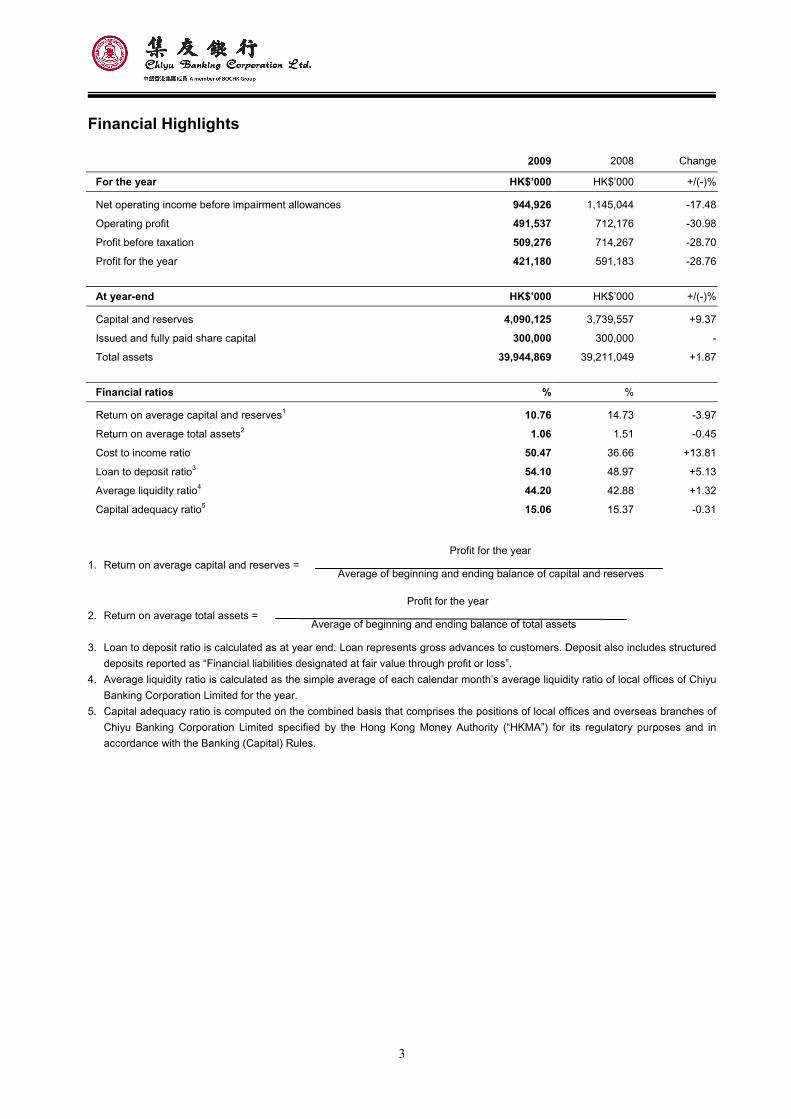
Financial Highlights
2009 2008 Change
For the year HK$’000 HK$’000 +/(-)%
Net operating income before impairment allowances 944,926 1,145,044 -17.48
Operating profit 491,537 712,176 -30.98
Profit before taxation 509,276 714,267 -28.70
Profit for the year 421,180 591,183 -28.76
At year-end HK$’000 HK$’000 +/(-)%
Capital and reserves 4,090,125 3,739,557 +9.37
Issued and fully paid share capital 300,000 300,000 -
Total assets 39,944,869 39,211,049 +1.87
Financial ratios % %
Return on average capital and reserves1 10.76 14.73 -3.97
Return on average total assets2 1.06 1.51 -0.45
Cost to income ratio 50.47 36.66 +13.81
Loan to deposit ratio3 54.10 48.97 +5.13
Average liquidity ratio4 44.20 42.88 +1.32
Capital adequacy ratio5 15.06 15.37 -0.31
Profit for the year 1. Return on average capital and reserves =
Average of beginning and ending balance of capital and reserves
Profit for the year 2. Return on average total assets =
Average of beginning and ending balance of total assets
3. Loan to deposit ratio is calculated as at year end. Loan represents gross advances to customers. Deposit also includes structured deposits reported as “Financial liabilities designated at fair value through profit or loss”.
4. Average liquidity ratio is calculated as the simple average of each calendar month’s average liquidity ratio of local offices of Chiyu Banking Corporation Limited for the year.
5. Capital adequacy ratio is computed on the combined basis that comprises the positions of local offices and overseas branches of Chiyu Banking Corporation Limited specified by the Hong Kong Money Authority (“HKMA”) for its regulatory purposes and in accordance with the Banking (Capital) Rules.
4
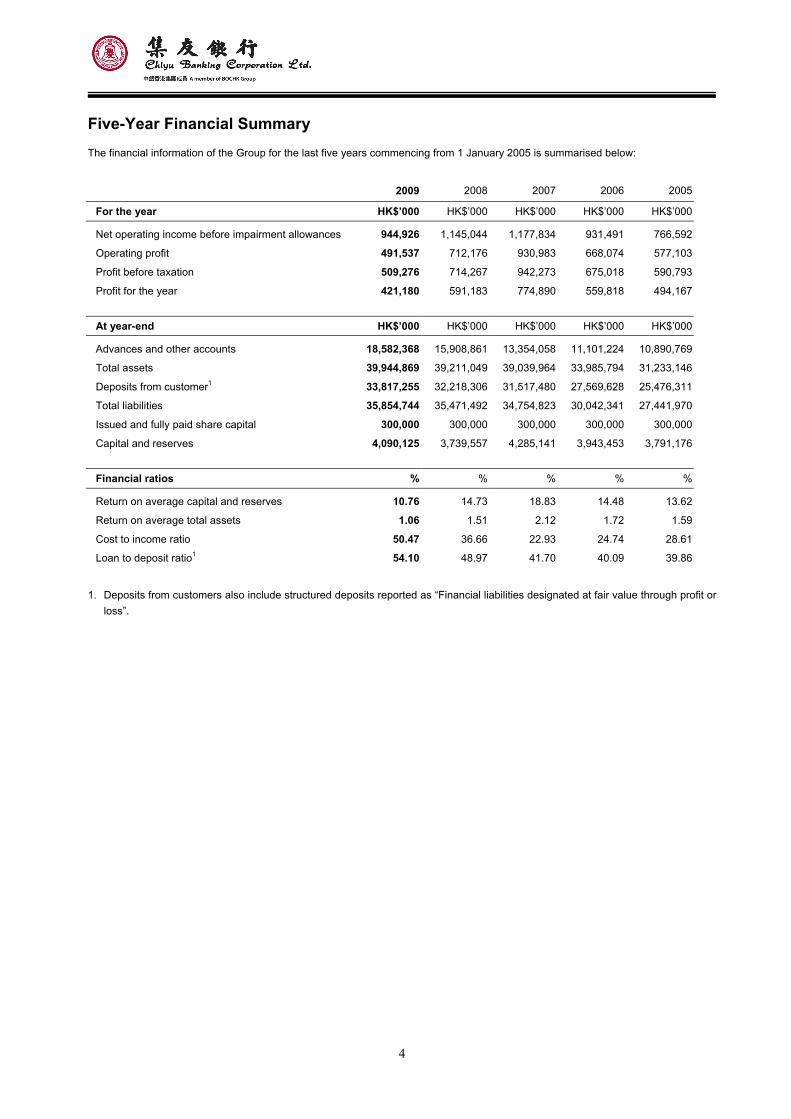
Five-Year Financial Summary The financial information of the Group for the last five years commencing from 1 January 2005 is summarised below:
2009 2008 2007 2006 2005
For the year HK$’000 HK$’000 HK$’000 HK$’000 HK$’000
Net operating income before impairment allowances 944,926 1,145,044 1,177,834 931,491 766,592
Operating profit 491,537 712,176 930,983 668,074 577,103
Profit before taxation 509,276 714,267 942,273 675,018 590,793
Profit for the year 421,180 591,183 774,890 559,818 494,167
At year-end HK$’000 HK$’000 HK$’000 HK$’000 HK$’000
Advances and other accounts 18,582,368 15,908,861 13,354,058 11,101,224 10,890,769
Total assets 39,944,869 39,211,049 39,039,964 33,985,794 31,233,146
Deposits from customer1 33,817,255 32,218,306 31,517,480 27,569,628 25,476,311
Total liabilities 35,854,744 35,471,492 34,754,823 30,042,341 27,441,970
Issued and fully paid share capital 300,000 300,000 300,000 300,000 300,000
Capital and reserves 4,090,125 3,739,557 4,285,141 3,943,453 3,791,176
Financial ratios % % % % %
Return on average capital and reserves 10.76 14.73 18.83 14.48 13.62
Return on average total assets 1.06 1.51 2.12 1.72 1.59
Cost to income ratio 50.47 36.66 22.93 24.74 28.61
Loan to deposit ratio1 54.10 48.97 41.70 40.09 39.86
1. Deposits from customers also include structured deposits reported as “Financial liabilities designated at fair value through profit or loss”.
5
Board of Management
Board of Management
Chief Executive Deputy General Manager Assistant General Manager
NG Man Kung CHAN Yiu Fai CHENG Pik Chuen
ZHANG Yu Dong CHAN Kin Hing
LAW King Chee
The Consultant of Board of Directors
TAN Khek Seng
6
Management Discussion and Analysis
Business Review
The financial turmoil was still exerting its influence on the global economy in the first half of 2009. The combination of notable downturn
in local GDP and decrease in foreign trade led to a weak demand in corporate lending. As the investment market remained uncertain,
transactions of fund and bond related products suffered a sharp drop. Net interest margin was significantly narrowed under the low
interest rate environment and the revenue of the banking sector was under pressure. Nevertheless, the sustained and rapid economic
development in Mainland China has boosted the growth of Hong Kong’s tourism-related businesses and domestic spending. Together
with the rescue measures imposed by governments worldwide, the economy began to rebound in the second half of the year. With
excessive capital inflows to Hong Kong, the stock and property markets regain their growth momentum and the banking industry is
again fueled with vitality amid the tough operating environment.
Responding to opportunities and challenges in the markets, the Group takes positive yet prudent strategies and fully utilizes its
competitive edge to expand traditional core businesses. On the one hand, through the participation of Hong Kong Special
Administrative Region (“HKSAR”)’s “SME Loan Guarantee Scheme”, we dedicate to provide our Small and Medium Enterprises
(“SME”) clients financing services, as well as a full range of cross-border business solutions as the Group strives to establish its
position as the ideal business partner of our clients who expand their businesses into Mainland China. On the other hand, through
upgrading the electronic banking service, we move a step forward to provide a more convenient and cost-effective channel for our
customers to execute banking transactions at anytime and anywhere, as well as to obtain real-time market information. The Group
offers competitive mortgage schemes and efficient stock-related trading services to fulfill our customers’ capital appreciation needs. To
cope with market and credit risk under the unstable economic environment, the Group has put efforts to strengthen its credit risk
control procedures; to enhance the analysis and selection of our investments in treasury products; to maintain high level of asset
liquidity as well as quality; and to improve cost management for a better utilization of resources.
The Group’s core businesses are to provide personal and corporate banking and other related financial services. With an all-rounded
Commercial Banking Centre and 24 branches in Hong Kong, together with 2 branches and 1 sub-branch (launched in Xiamen Jimei in
March 2009) in Mainland China, the Group has further enhanced its branch network to provide more efficient cross-border financial
services to our customers. In line with the Renminbi business agreement between Mainland China and Hong Kong, we devote to
provide personal and trade-related Reminibi services to our customers. Our Product Team strikes to develop and up-grade our
products to meet the quick changing needs. We emphasize on improving our Customer Relationship Team’s image and their
professionalism, so that they can provide tailored-made flexible solutions to satisfy our customers’ needs in a timely manner.
7
Management’s Discussion and Analysis (continued)
Financial Review
For 2009, the Group recorded a profit attributable to shareholders of HK$421,180,000, dropped by 28.76% from last year, mainly due
to the decrease of net interest income as a result of low market interest rate. The return on average shareholders’ funds and the return
on average total assets were 10.76% and 1.06%, respectively decreased by 3.97% and 0.45% against 2008.
Net interest income was HK$647,101,000, decreased by 21.78% as compared with 2008. Net interest margin was 1.70% or 55 basis
points lower than last year. Non-interest income was HK$297,825,000, dropped by 6.28% from last year. Operating expenses rose by
13.62% to HK$476,935,000, which included a provision of HK$174,636,000 in relation to Lehman Brothers related products,
representing an increase of 29.05% against last year. Should the effect of the expenses be excluded, the Group’s operating expenses
would have only increased by 6.27% while the cost-to-income ratio would have risen by 7.15% to 31.99% in 2009.
The Group has continued to apply vigilant credit risk management, the classified loans ratio maintained at a relatively low level of
0.12%. In 2009, net reversal of loan impairment allowances was HK$21,958,000, as compared with net charge of loan impairment
allowances of HK$11,332,000 last year.
As at 31 December 2009, the Group recorded an increase in the total consolidated assets by 1.87% to HK$39,944,869,000. Loans
and advances to customers rose by 15.97% to HK$18,296,796,000. Customer deposits also recorded an increase of 4.96% to
HK$33,817,255,000.
Prospect
In 2010, the Group is of the view that the global economy will continue to revive from the Financial Tsunami while instability still exists.
With the impact of Financial Tsunami gradually weakening, there will be more business opportunities in the banking sector in Hong
Kong, but the operating environment is still filled with uncertainties and challenges.
According to the Group’s business strategy “Base in Hong Kong; Penetrate into Mainland China; Tie with Overseas Chinese”, we are
devoted to provide flexible, efficient and tailor-made financial services to SME and comprehensive wealth management services to
personal customers. We will fully utilize our competitive advantages on traditional banking services and provide services differentiation
in order to further expand our scope of services to target customers. The Group will continue to develop its one-stop service platform in
Mainland China for better capturing of business opportunities in the region. At the same time, we are committed to maintaining good
corporate governance by allocating adequate resources to the aspects of risk management and internal control, as well as improving
operational efficiency and resources utilization.
The Group’s foundation remains solid and is ready for any challenges ahead. We would like to express our immense gratitude to the
shareholders and the Board of Directors for their guidance and support. To reciprocate our customers’ loyalty, we are devoted to
provide them with excellent and efficient services. Last but not least, we would like to show our appreciation to all of our employees for
their hard work and effort.
8
Management’s Discussion and Analysis (continued)
Risk Management
Overview
The Group believes that sound risk management is a key success factor for any organisation. In its daily operation, the Group attaches
a high degree of importance to risk management and emphasises that a balance must be struck between risk control and business
growth and development. The principal types of risk inherent in the Group’s businesses are reputation risk, legal and compliance risk,
strategic risk, credit risk, market risk, interest rate risk, liquidity risk and operational risk. The Group’s risk management objective is to
enhance shareholder value by maintaining risk exposures within acceptable limits.
Risk Management Governance Structure
The Group’s risk management governance structure is designed to cover the whole process of all businesses and ensure various risks
are properly managed and controlled in the course of conducting business. The Group has a sound risk management organisational
structure as well as comprehensive policies and procedures to identify measure, monitor and control various risks that may arise for
the organisation. These risk management policies and procedures are regularly reviewed and modified to reflect changes in markets
and business strategies. Various groups of risk takers assume their respective responsibilities for risk management.
The Board of Directors, representing the interests of shareholders, is the highest decision making authority of the Bank and has the
ultimate responsibility for risk management. The Board, with the assistance of its committees, has the primary responsibility for the
determination of risk management strategies and for ensuring that the Group has an effective risk management system to implement
these risk management strategies. Risk Management Committee (“RC”), a standing committee established by the Board of Directors,
is responsible for overseeing the Group’s various types of risks, reviewing and approving high level risk related policies and overseeing
their implementation, reviewing significant or high risk exposures or transactions and exercising its power of veto if it believes that the
transaction shall not proceed. Audit Committee (“AC”) assists the Board in fulfilling its role on overseeing internal control system.
To achieve the Group’s risk management goals, the Group has established a centralised risk management structure that involves the
following elements:
• a corporate governance structure to provide active oversight and participation by the Board of Directors, committees and senior
management;
• reporting lines that are independent of the Group’s Business Units;
• uniform risk management policies, procedures and limits by which the Group identifies, measures, monitors and controls
inherent risks;
• improved risk measurement, monitoring and management information systems to support business activities and risk
management; and
• clearly defined risk management responsibilities and accountability.
The Group faces the same types of inherent business risks and adopts consistent risk management strategies and policies as its
immediate holding company, Bank of China (Hong Kong) Limited (“BOCHK”). The Group executes its risk management strategy
independently and functionally reports to BOCHK on a regular basis.
9
Management’s Discussion and Analysis (continued)
Risk Management (continued)
Reputation Risk Management
Reputation risk is the risk that negative publicity regarding the Group’s business practices, whether genuine or not, will cause a
potential decline in the customer base or lead to costly litigation or revenue erosion. Reputation risk is inherent in every aspect of
business operation and covers a wide spectrum of issues.
In order to mitigate reputation risk, the Group has formulated and duly followed its Reputation Risk Management Policy. The policy
aims to prevent and manage reputation risk proactively at an early stage when an incident occurs. The system entails continuous
monitoring of external reputation risk incidents and published failures of risk incidents in the financial industry.
Legal and Compliance Risk Management
Legal risk is the risk that unenforceable contracts, lawsuits or adverse judgments may disrupt or otherwise negatively affect the
operation or financial condition of the Group. Compliance risk is the risk of penalty arising from any failure to comply with relevant
regulations governing the conduct of businesses in specific countries. By establishing and maintaining appropriate policies and
procedures, the Compliance Section is responsible for proactively identifying and managing these risks.
Strategic Risk Management
Strategic risk generally refers to the risks that may induce immediate or future negative impact on the financial and market positions of
the Group because of poor strategic decisions, improper implementation of strategies and lack of response to the market. The Group
has developed a Strategic Risk Management Policy that clearly defines the management and oversight of such risks.
10
Management’s Discussion and Analysis (continued)
Risk Management (continued)
Credit Risk Management
Credit risk is the risk that a customer or counterparty will be unable to or unwilling to meet a commitment it has entered into. Credit Risk
Management Division (“CMD”) provides centralised management of credit risk within the Group. Different credit approval and control
procedures are adopted according to the level of risk associated with the customer or transaction. Corporate credit applications and
retail credit transactions, including residential mortgage loans and personal loans are independently reviewed and objectively
assessed by risk management units.
The Group’s internal loan grading system divides loans into 5 categories with reference to HKMA’s guidelines. CMD provides regular
credit management information reports and ad hoc reports to members of Executive Committee (“EC”), RC, AC and Board of
Directors.
Market Risk Management
Market risk is the risk of loss that results form movements in the market rates and prices. The Group’s market risk arises from
customer-related business. The Group’s market risk in trading book arises from customer-related business. The risk includes potential
losses arising from changes in foreign exchange and interest rates as well as equities and commodities prices. On the other hand, the
major market risk in banking book arises from the group’s investment portfolio. The risk includes potential losses arising from changes
in market parameters such as credit, liquidity, and interest rate risk. These positions are subject to monthly mark-to-market valuation.
Market risk is managed within the risk limits approved by the RC. The overall risk limits are divided into sub-limits by reference to
different risk factors, including interest rate, foreign exchange rate, commodity price and equity price. CMD, Finance Division and
Settlement Section are responsible for the regularly oversight of the Group’s market risk to ensure that overall and individual market
risks are within the Group’s risk tolerance. Risk exposures are monitored on a regular basis to ensure that they are within established
risk limits.
The Group has met the “de minimis” criteria set out in the Maintenance of Adequate Capital Against Market Risk guideline issued by
the HKMA. As a result, the Group considers that the market risk arising from its trading book is not material and no further qualitative
or quantitative disclosure is made of market risk in these accounts.
11
Management’s Discussion and Analysis (continued)
Risk Management (continued)
Interest Rate Risk Management
The Group’s interest rate risk exposures are mainly structural. The major types of interest rate risk from structural positions are:
repricing risk – mismatches in the maturity or repricing periods of assets and liabilities
basis risk – different pricing basis for different transactions so that yield on assets and cost of liabilities may change by different
amounts within the same repricing period
The Group’s Asset and Liability Management Committee (“ALCO”) maintains oversight of interest rate risk and RC sanctions the
interest rate risk management policies formulated by ALCO. The interest rate risk is identified and measured on a regular basis.
The Treasury Division manages the interest rate risk according to the established policies. The Finance Division closely monitors the
related risks and the results are reported to RC and ALCO regularly.
Gap analysis is one of the tools used to measure the Group’s exposure to repricing risk. This provides the Group with a static view of
the maturity and repricing characteristics of its balance sheet positions. The Group uses interest rate derivatives to hedge its interest
rate exposures and in most cases, plain vanilla interest rate swaps are used.
Sensitivities of earnings and economic value to interest rate changes (Earnings at Risk and Economic Value at Risk) are assessed
through hypothetical interest rate shock of 200 basis points across the yield curve on both sides. Earnings at Risk and Economic
Value at Risk are controlled respectively within an approved percentage of the projected net interest income for the year and the latest
capital base as sanctioned by RC. The results are reported to ALCO and RC on a regular basis.
The impact of basis risk is gauged by the projected change in net interest income under scenarios of imperfect correlation in the
adjustment of the rates earned and paid on different instruments. Ratios of assets to liabilities with similar pricing basis are established
to monitor such risk.
12
Management’s Discussion and Analysis (continued)
Risk Management (continued)
Liquidity Risk Management
The aim of liquidity management is to enable the Group, even under adverse market conditions, to meet all its maturing repayment
obligations on time and to fund all of its asset growth and strategic opportunities without forced liquidation of its assets at short notice.
The Group funds its operations principally by accepting deposits from retail and corporate depositors. In addition, the Group may issue
certificates of deposit to secure long-term funds. Funding may also be secured through adjusting the asset mix in the Group’s
investment portfolio. The Group uses the majority of funds raised to extend loans, to purchase debt securities or to conduct interbank
placements.
The Group monitors the liquidity risks using cash flow analysis and by examining deposit stability, concentration risk, mismatch ratios,
loan-to-deposit ratio and liquidity profile of the investment portfolio. The primary objective of the Group’s asset and liability
management strategy is to achieve optimal return while ensuring adequate levels of liquidity and capital within an effective risk control
framework and ALCO is responsible for establishing these policy directives (including the liquidity contingency plan), and RC sanctions
the liquidity management policies. The Treasury Department manages the liquidity risk according to the established policies. The
Finance Division monitors the Group’s liquidity risks and reports to the management and ALCO regularly.
Operational Risk Management
Operational risk relates to the risk of loss resulting from inadequate or failed internal processes, people and systems, or from external
events. Strategic Planning and Control Department (“SCD”) oversees the entire operational risk management framework of the
Group.
The Group has put in place an effective internal control process which requires the establishment of detailed policies and control
procedures for all the key activities. Proper segregation of duties and independent authorisation are the fundamental principles
followed by the Group. Business line management is responsible for managing and reporting operational risks specific to their
business units by identifying, assessing and controlling the risks inherent in their business processes, activities and products. These
are followed by periodic monitoring and ongoing review of changes by SCD. SCD formulates corporate-level policies and procedures
concerning operational risk management which are approved by RC. SCD evaluates the operational risk profile, records operational
risk data and reports operational risk issues to RC and senior management.
Business continuity plans are in place to support business operations in the event of emergency or disaster. Adequate backup
facilities are maintained and periodic drills are conducted. The Group also arranges insurance cover to reduce potential losses in
respect of operational risk.
13
Management’s Discussion and Analysis (continued)
Risk Management (continued)
Capital Management
The major objective of capital management is to maximise total shareholders’ return while maintaining a capital adequacy position
commensurate with the Group’s overall risk profile. The Group periodically reviews its capital structure and adjusts the capital mix
where appropriate to achieve the targeted weighted average cost of capital. ALCO monitors the Group’s capital adequacy. The
Group has complied with all the statutory capital standards for all the periods.
To comply with HKMA’s requirements as stated in the Supervisory Policy Manual “Supervisory Review Process”, the Group has
implemented its internal capital adequacy assessment process (“ICAAP”). Using the statutory minimum capital adequacy ratio
(“CAR”), 8%, as a starting point, extra capital (capital add-on) needed to cover the risks not captured under Pillar I was assessed.
Scorecard methodology has been used to evaluate the Group‘s risk profile in order to assess the capital add-on and determine the
minimum CAR. An Operating CAR Range has also been established which incorporates the need for future business growth and
efficiency of capital utilisation.
Stress Testing
The Group supplements the analysis of various types of risks with stress testing. Stress testing is a risk management tool for
estimating the Group’s risk exposures under stressed conditions arising from extreme but plausible market or macroeconomic
movements. These tests are conducted on a regular basis and ALCO monitors the results against limits approved by RC. Stress test
results are also reported to the Board and RC regularly.
14
Report of the Directors The Directors are pleased to present their report together with the audited consolidated financial statements of Chiyu Banking
Corporation Limited (hereinafter referred to as the “Bank”) and its subsidiaries (together with the Bank hereinafter referred to as the
“Group”) for the year ended 31 December 2009.
Principal Activities
The principal activities of the Group are the provision of banking and related financial services. An analysis of the Group’s performance
for the year by business segments is set out in Note 41 to the financial statements.
Results and Appropriations
The results of the Group for the year are set out in the consolidated income statement on page 20.
The Board declared a first interim dividend of HK$48.50 per ordinary share, totaling HK$145,500,000 on 31 December 2009.
Reserves
Details of movements in the reserves of the Group and the Bank are set out in the consolidated statement of changes in equity and
statement of changes in equity on page 25 and 26 respectively.
Properties, Plant and Equipment
Details of movements in properties, plant and equipment of the Group and the Bank are set out in Note 28 to the financial statements.
Share Capital
Details of the share capital of the Group and the Bank are set out in the Note 34 to the financial statements.
15
Report of the Directors (continued) Directors The Directors of the Bank during the year and up to date of this report are:
Chairman He Guangbei #
Vice Chairman Ng Leung Sing #
Ng Man Kung
Directors Chan Yiu Fai
Chen Zhong Xin #
Cheung Wai Hing *
Chiu Ming Wah #
Liu Yanfen #
Mao Xiaowei #
Ouyang Jian#
Tan Wan Chye #
To Chi Wing #
Woo Chia Wei *
Yu Kwok Chun *
# Non-executive Directors
* Independent non-executive Directors
In accordance with Article 99 of the Bank’s Articles of Association, Mr. Chiu Ming Wah and Mr. Tan Wan Chye retire at the forthcoming
annual general meeting and, being eligible, offer themselves for re-election.
Directors’ Interests Pursuant to written resolutions of all the shareholders of the Bank’s intermediate holding company, BOC Hong Kong (Holdings)
Limited (“BOCHKHL”), passed on 10 July 2002, BOCHKHL has approved and adopted two share option schemes, namely, the Share
Option Scheme and the Sharesave Plan. No options have been granted by BOCHKHL pursuant to the Share Option Scheme or the
Sharesave Plan during the year.
On 5 July 2002, Mr. He Guangbei, Mr. Ng Leung Sing, Mr. Ng Man Kung, Mr. Chiu Ming Wah, Mr. Mao Xiaowei, Mr. Chan Yiu Fai and
Mr. To Chi Wing were granted option by BOC Hong Kong (BVI) Limited (“BOC (BVI)”), the immediate holding company of BOCHKHL,
pursuant to a Pre-listing Share Option Scheme to purchase from BOC (BVI) existing issued shares of BOCHKHL at a price of HK$8.5
per share. These options have a vesting period of four years from 25 July 2002 with a valid exercise period of ten years. Messrs. Ng
Man Kung and Chan Yiu Fai exercised the options to purchase an aggregate of 723,000 shares of BOCHKHL during the year.
16
Report of the Directors (continued) Directors’ Interests (continued) Save as disclosed above, at no time during the year was the Bank, its subsidiaries, its fellow subsidiaries or its holding company a
party to any arrangements to enable the directors to acquire benefits by means of the acquisition of shares in, or debentures of the
Bank or at any other body corporate.
No contracts of significance, in relation to the Group’s business to which the Bank, its holding companies, or any of its subsidiaries or
fellow subsidiaries was a party and in which a Director had a material interest, whether directly or indirectly, subsisted at the end of the
year or at any time during the year. Management Contracts No contracts concerning the management or administration of the whole or any substantial part of the business of the Bank were
entered into or existed during the year.
Compliance with the Banking (Disclosure) Rules The financial statements for the year ended 31 December 2009 comply with the requirements set out in the Banking (Disclosure)
Rules under the Banking Ordinance.
Auditor The financial statements have been audited by PricewaterhouseCoopers. A resolution for their re-appointment as auditor for the
ensuing year will be proposed at the forthcoming annual general meeting.
On behalf of the Board
HE Guangbei
Chairman
Hong Kong, 10 March 2010
17
Corporate Governance
The Group has complied with the HKMA’s guidelines set out in the Supervisory Policy Manual CG-1 “Corporate Governance of Locally
Incorporated Authorised Institutions”.
In order to focus on the strategic and material issues that have significant impact on the Group’s operation, financial performance, risk
management and long-term development, three committees have been established under the Board of Directors to oversee the major
areas of the Group. The details of the committees are given below.
Executive Committee (“EC”) The EC has been delegated with authorities from the Board to handle matters which require the Board’s review, but arise between
board meetings. Its responsibilities include:
- approving policies, implementation plans and management measures to effect the group-wide development strategies and
business plans approved by the Board; - reviewing the implementation progress of the strategies and business plans; - recommending strategic proposals to the Board for its consideration and approval; and - approving the Group’s rules and regulations according to the policies imposed by the supervisory authorities and the holding
companies. The members of EC are Mr. Ng Man Kung (Chairman), Mr. Chan Yiu Fai and Mr. To Chi Wing. All are Directors of the Bank.
Audit Committee (“AC”) The AC assists the Board in overseeing the auditing activities of the Group and monitoring compliance with approved policies and
procedures, so that the effectiveness of financial reporting process and internal control systems of the Group can be assured. Its
responsibilities include:
- reviewing and monitoring the effectiveness of the internal control systems, the controls over financial risks and the procedures of
financial reporting and auditing; - assessing independently the effectiveness and efficiency of financial reporting system and its controlling mechanism, and the
sufficiency of operating policies and system; and - monitoring the operation of the Group to ensure the Group is running in compliance with the relevant rules and regulations. The members of AC are Mr. Chiu Ming Wah (Chairman), Mr. Cheung Wai Hing , Ms. Liu Yanfen, Mr. Tan Wan Chye and Mr. Woo Chia
Wei. All are non-executive Directors of the Bank.
Risk Management Committee (“RC”) The RC assists the Board in overseeing the risk management of the Group, formulating the Group’s risk management strategies,
policies and procedures, and monitoring the implementation of those strategies, policies and procedures. Its responsibilities include:
- assisting the Board to measure and monitor the risk exposures of the Group; - recommending appropriate risk management strategies to the Board; and - formulating risk management related policies such as risk management policies and authorities and duties delegation policies in
accordance with the requirements set by the Board. The members of the RC are Mr. Mao Xiaowei (Chairman), Mr. Ng Leung Sing, Mr. Ng Man Kung, Mr. To Chi Wing and Mr. Yu Kwok
Chun. All are Directors of the Bank.
18
Independent Auditor’s Report To the shareholders of Chiyu Banking Corporation Limited (incorporated in Hong Kong with limited liability)
We have audited the consolidated financial statements of Chiyu Banking Corporation Limited (the “Bank”) and its subsidiaries
(together, the “Group”) set out on pages 20 to 151, which comprise the consolidated and company balance sheets as at 31
December 2009, and the consolidated income statement, the consolidated and company statements of comprehensive income, the
consolidated and company statements of changes in equity and the consolidated cash flow statement for the year then ended, and a
summary of significant accounting policies and other explanatory notes.
Directors’ responsibility for the financial statements
The directors of the Bank are responsible for the preparation and the true and fair presentation of these consolidated financial
statements in accordance with Hong Kong Financial Reporting Standards issued by the Hong Kong Institute of Certified Public
Accountants, and the Hong Kong Companies Ordinance. This responsibility includes designing, implementing and maintaining internal
control relevant to the preparation and the true and fair presentation of financial statements that are free from material misstatement,
whether due to fraud or error; selecting and applying appropriate accounting policies; and making accounting estimates that are
reasonable in the circumstances.
Auditor’s responsibility
Our responsibility is to express an opinion on these consolidated financial statements based on our audit and to report our opinion
solely to you, as a body, in accordance with section 141 of the Hong Kong Companies Ordinance and for no other purpose. We do not
assume responsibility towards or accept liability to any other person for the contents of this report.
We conducted our audit in accordance with Hong Kong Standards on Auditing issued by the Hong Kong Institute of Certified Public
Accountants. Those standards require that we comply with ethical requirements and plan and perform the audit to obtain reasonable
assurance as to whether the financial statements are free from material misstatement.
An audit involves performing procedures to obtain audit evidence about the amounts and disclosures in the financial statements. The
procedures selected depend on the auditor’s judgment, including the assessment of the risks of material misstatement of the financial
statements, whether due to fraud or error. In making those risk assessments, the auditor considers internal control relevant to the
entity’s preparation and true and fair presentation of the financial statements in order to design audit procedures that are appropriate in
the circumstances, but not for the purpose of expressing an opinion on the effectiveness of the entity’s internal control. An audit also
includes evaluating the appropriateness of accounting policies used and the reasonableness of accounting estimates made by the
directors, as well as evaluating the overall presentation of the financial statements.
We believe that the audit evidence we have obtained is sufficient and appropriate to provide a basis for our audit opinion.
19
Independent Auditor’s Report (continued) Opinion
In our opinion, the consolidated financial statements give a true and fair view of the state of affairs of the Bank and of the Group
as at 31 December 2009 and of the Group’s profit and cash flows for the year then ended in accordance with Hong Kong
Financial Reporting Standards and have been properly prepared in accordance with the Hong Kong Companies Ordinance.
PricewaterhouseCoopers Certified Public Accountants
Hong Kong, 10 March 2010
20
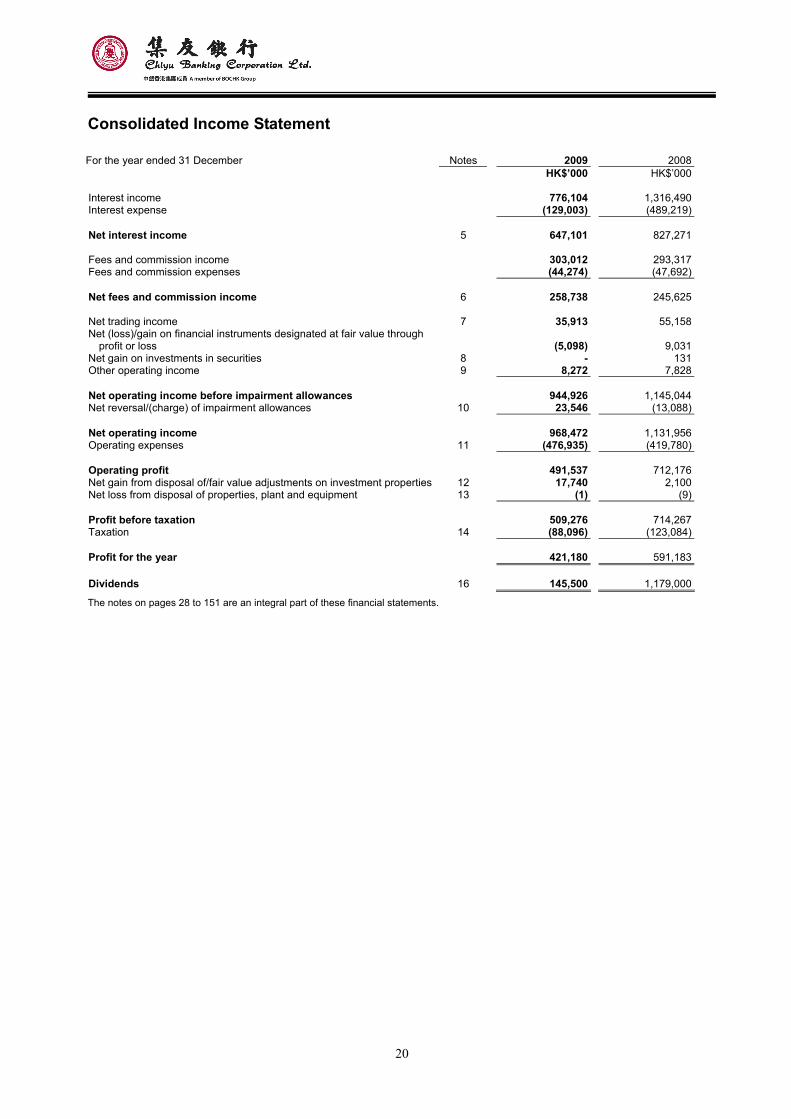
Consolidated Income Statement For the year ended 31 December Notes 2009 2008
HK$’000 HK$’000
Interest income 776,104 1,316,490Interest expense (129,003) (489,219) Net interest income 5 647,101 827,271 Fees and commission income 303,012 293,317Fees and commission expenses (44,274) (47,692) Net fees and commission income 6 258,738 245,625 Net trading income 7 35,913 55,158Net (loss)/gain on financial instruments designated at fair value through
profit or loss
(5,098) 9,031Net gain on investments in securities 8 - 131Other operating income 9 8,272 7,828 Net operating income before impairment allowances 944,926 1,145,044Net reversal/(charge) of impairment allowances 10 23,546 (13,088) Net operating income 968,472 1,131,956Operating expenses 11 (476,935) (419,780) Operating profit 491,537 712,176Net gain from disposal of/fair value adjustments on investment properties 12 17,740 2,100Net loss from disposal of properties, plant and equipment 13 (1) (9) Profit before taxation 509,276 714,267Taxation 14 (88,096) (123,084) Profit for the year 421,180 591,183 Dividends 16 145,500 1,179,000
The notes on pages 28 to 151 are an integral part of these financial statements.
21
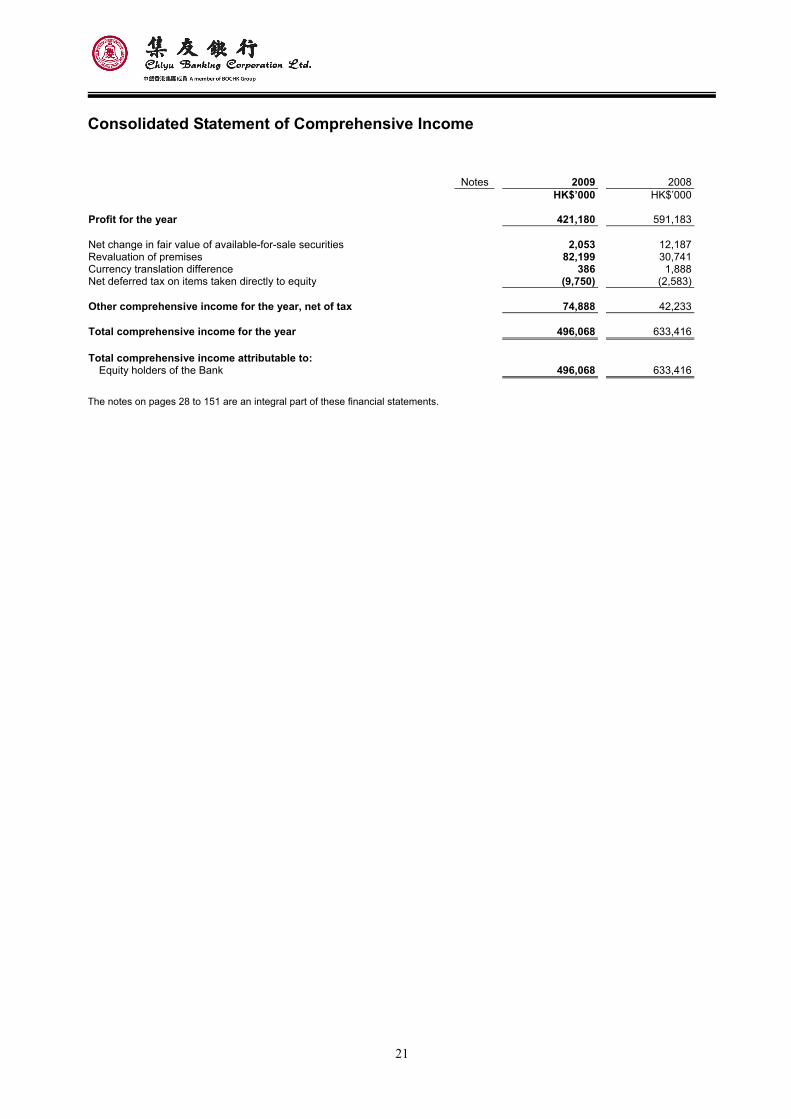
Consolidated Statement of Comprehensive Income
Notes 2009 2008
HK$’000 HK$’000
Profit for the year 421,180 591,183 Net change in fair value of available-for-sale securities 2,053 12,187Revaluation of premises 82,199 30,741Currency translation difference 386 1,888Net deferred tax on items taken directly to equity (9,750) (2,583) Other comprehensive income for the year, net of tax 74,888 42,233 Total comprehensive income for the year 496,068 633,416 Total comprehensive income attributable to:
Equity holders of the Bank 496,068 633,416 The notes on pages 28 to 151 are an integral part of these financial statements.
22
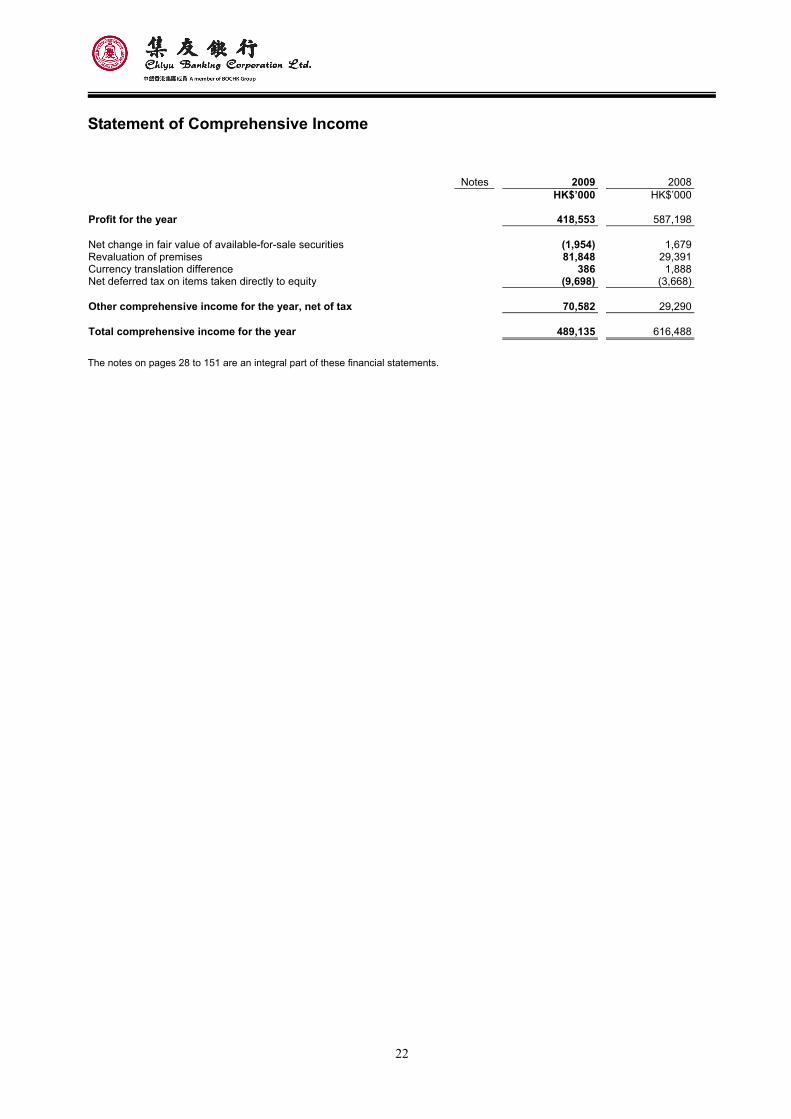
Statement of Comprehensive Income
Notes 2009 2008
HK$’000 HK$’000
Profit for the year 418,553 587,198 Net change in fair value of available-for-sale securities (1,954) 1,679Revaluation of premises 81,848 29,391Currency translation difference 386 1,888Net deferred tax on items taken directly to equity (9,698) (3,668) Other comprehensive income for the year, net of tax 70,582 29,290 Total comprehensive income for the year 489,135 616,488 The notes on pages 28 to 151 are an integral part of these financial statements.
23
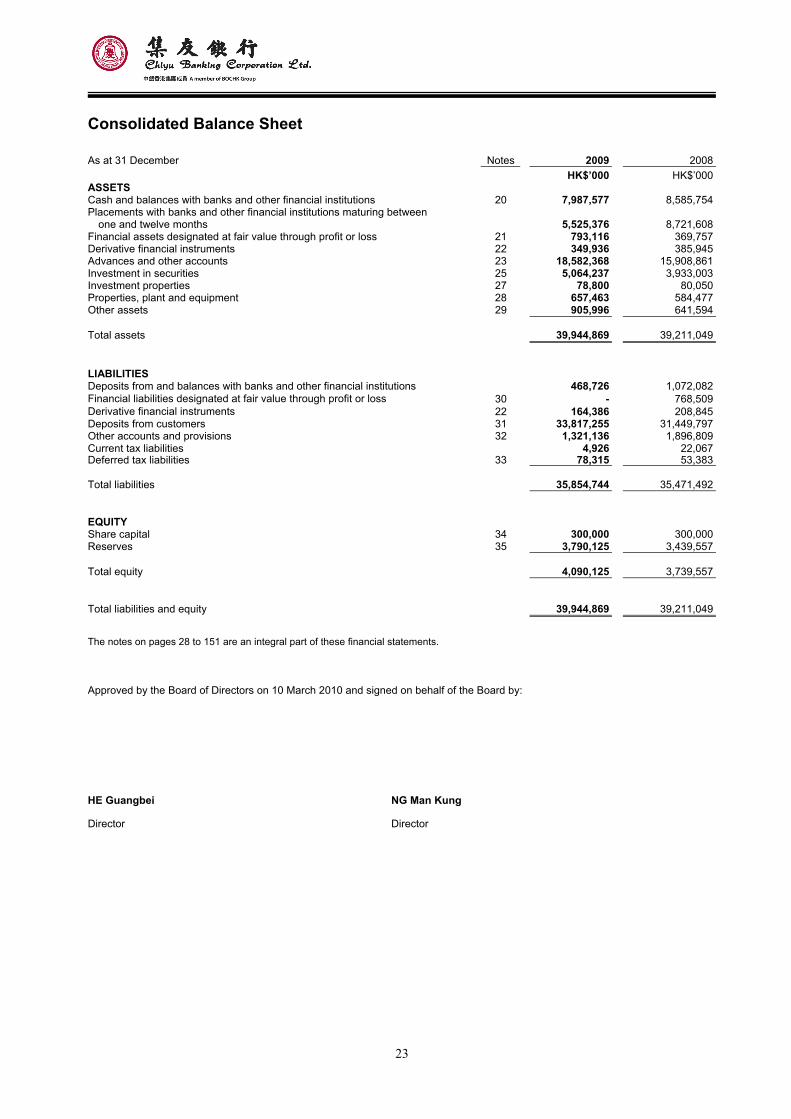
Consolidated Balance Sheet As at 31 December Notes 2009 2008 HK$’000 HK$’000ASSETS Cash and balances with banks and other financial institutions 20 7,987,577 8,585,754Placements with banks and other financial institutions maturing between
one and twelve months 5,525,376 8,721,608Financial assets designated at fair value through profit or loss 21 793,116 369,757Derivative financial instruments 22 349,936 385,945Advances and other accounts 23 18,582,368 15,908,861Investment in securities 25 5,064,237 3,933,003Investment properties 27 78,800 80,050Properties, plant and equipment 28 657,463 584,477Other assets 29 905,996 641,594 Total assets 39,944,869 39,211,049 LIABILITIES Deposits from and balances with banks and other financial institutions 468,726 1,072,082Financial liabilities designated at fair value through profit or loss 30 - 768,509Derivative financial instruments 22 164,386 208,845Deposits from customers 31 33,817,255 31,449,797Other accounts and provisions 32 1,321,136 1,896,809Current tax liabilities 4,926 22,067Deferred tax liabilities 33 78,315 53,383 Total liabilities 35,854,744 35,471,492 EQUITY Share capital 34 300,000 300,000Reserves 35 3,790,125 3,439,557 Total equity 4,090,125 3,739,557 Total liabilities and equity 39,944,869 39,211,049
The notes on pages 28 to 151 are an integral part of these financial statements. Approved by the Board of Directors on 10 March 2010 and signed on behalf of the Board by:
HE Guangbei NG Man Kung
Director Director
24
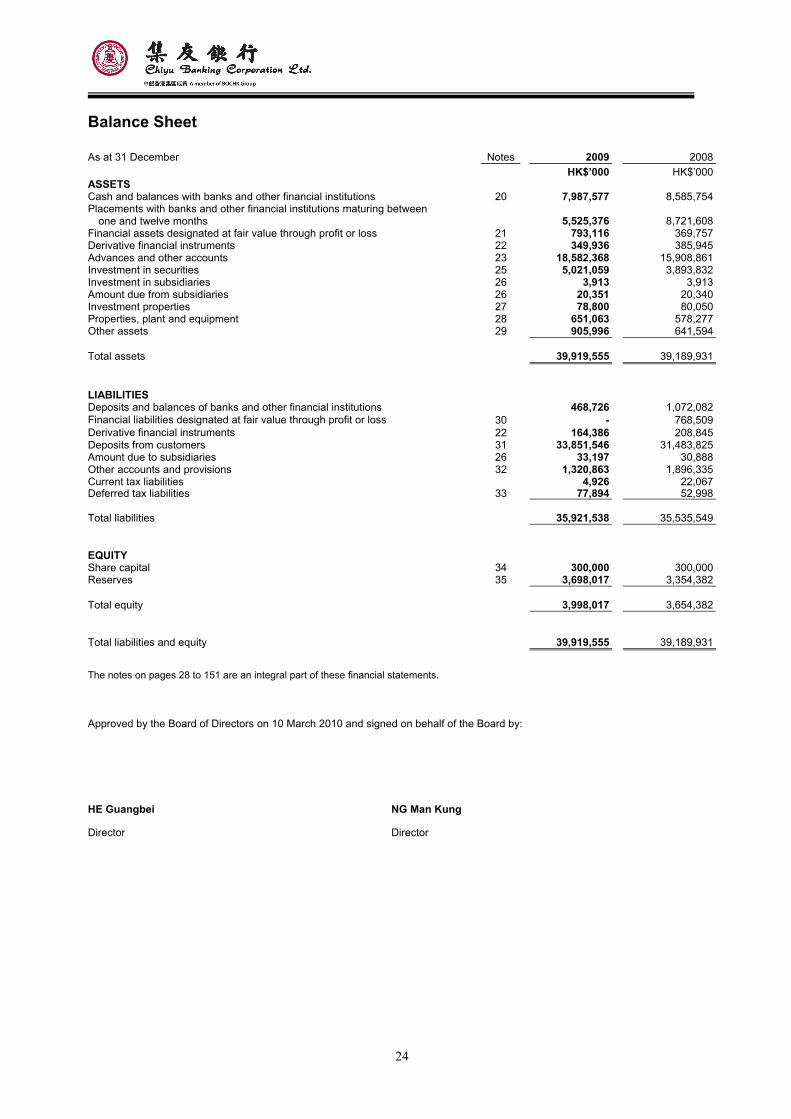
Balance Sheet As at 31 December Notes 2009 2008 HK$’000 HK$’000ASSETS Cash and balances with banks and other financial institutions 20 7,987,577 8,585,754Placements with banks and other financial institutions maturing between
one and twelve months 5,525,376 8,721,608Financial assets designated at fair value through profit or loss 21 793,116 369,757Derivative financial instruments 22 349,936 385,945Advances and other accounts 23 18,582,368 15,908,861Investment in securities 25 5,021,059 3,893,832Investment in subsidiaries 26 3,913 3,913Amount due from subsidiaries 26 20,351 20,340Investment properties 27 78,800 80,050Properties, plant and equipment 28 651,063 578,277Other assets 29 905,996 641,594 Total assets 39,919,555 39,189,931 LIABILITIES Deposits and balances of banks and other financial institutions 468,726 1,072,082Financial liabilities designated at fair value through profit or loss 30 - 768,509Derivative financial instruments 22 164,386 208,845Deposits from customers 31 33,851,546 31,483,825Amount due to subsidiaries 26 33,197 30,888Other accounts and provisions 32 1,320,863 1,896,335Current tax liabilities 4,926 22,067Deferred tax liabilities 33 77,894 52,998 Total liabilities 35,921,538 35,535,549 EQUITY Share capital 34 300,000 300,000Reserves 35 3,698,017 3,354,382 Total equity 3,998,017 3,654,382 Total liabilities and equity 39,919,555 39,189,931
The notes on pages 28 to 151 are an integral part of these financial statements.
Approved by the Board of Directors on 10 March 2010 and signed on behalf of the Board by:
HE Guangbei NG Man Kung
Director Director
25
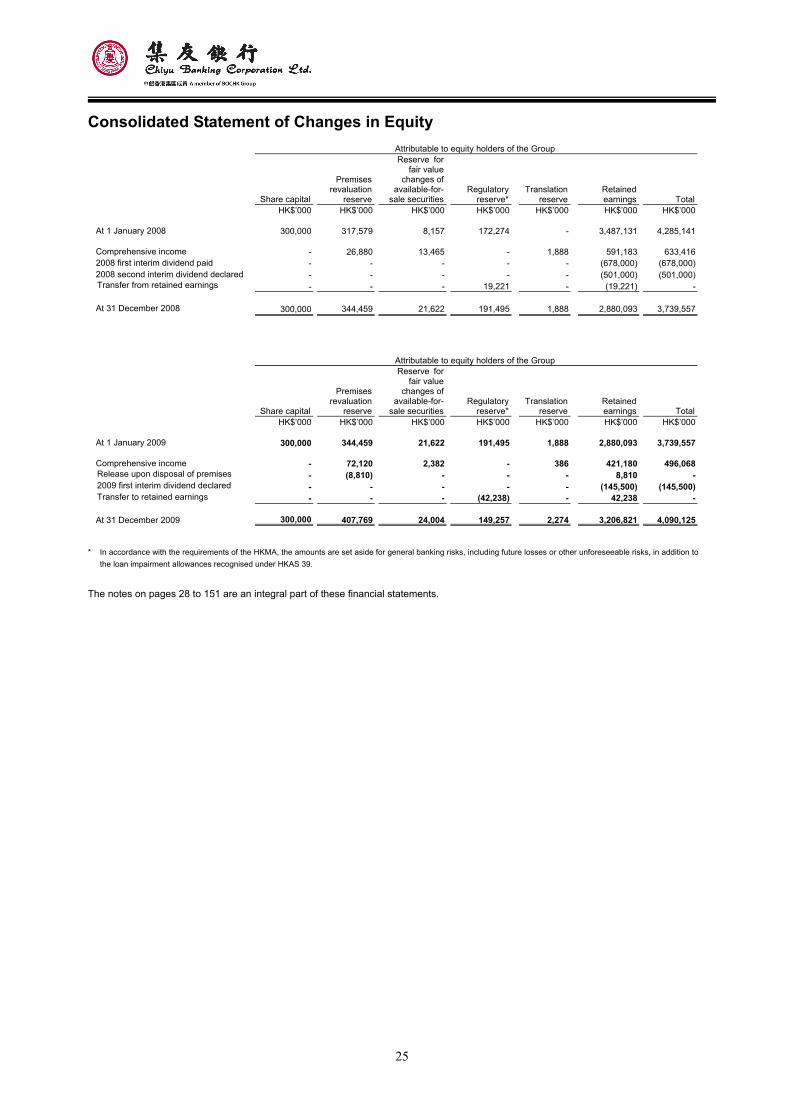
Consolidated Statement of Changes in Equity
* In accordance with the requirements of the HKMA, the amounts are set aside for general banking risks, including future losses or other unforeseeable risks, in addition to
the loan impairment allowances recognised under HKAS 39. The notes on pages 28 to 151 are an integral part of these financial statements.
Attributable to equity holders of the Group
Share capital
Premises revaluation
reserve
Reserve forfair value
changes of available-for-
sale securitiesRegulatory
reserve*
Translation reserve
Retained earnings Total
HK$’000 HK$’000 HK$’000 HK$’000 HK$’000 HK$’000 HK$’000 At 1 January 2008 300,000 317,579 8,157 172,274 - 3,487,131 4,285,141 Comprehensive income - 26,880 13,465 - 1,888 591,183 633,4162008 first interim dividend paid - - - - - (678,000) (678,000)2008 second interim dividend declared - - - - - (501,000) (501,000)Transfer from retained earnings - - - 19,221 - (19,221) - At 31 December 2008 300,000 344,459 21,622 191,495 1,888 2,880,093 3,739,557
Attributable to equity holders of the Group
Share capital
Premises revaluation
reserve
Reserve forfair value
changes of available-for-
sale securitiesRegulatory
reserve*
Translation reserve
Retained earnings Total
HK$’000 HK$’000 HK$’000 HK$’000 HK$’000 HK$’000 HK$’000 At 1 January 2009 300,000 344,459 21,622 191,495 1,888 2,880,093 3,739,557 Comprehensive income - 72,120 2,382 - 386 421,180 496,068Release upon disposal of premises - (8,810) - - - 8,810 -2009 first interim dividend declared - - - - - (145,500) (145,500)Transfer to retained earnings - - - (42,238) - 42,238 - At 31 December 2009 300,000 407,769 24,004 149,257 2,274 3,206,821 4,090,125
26
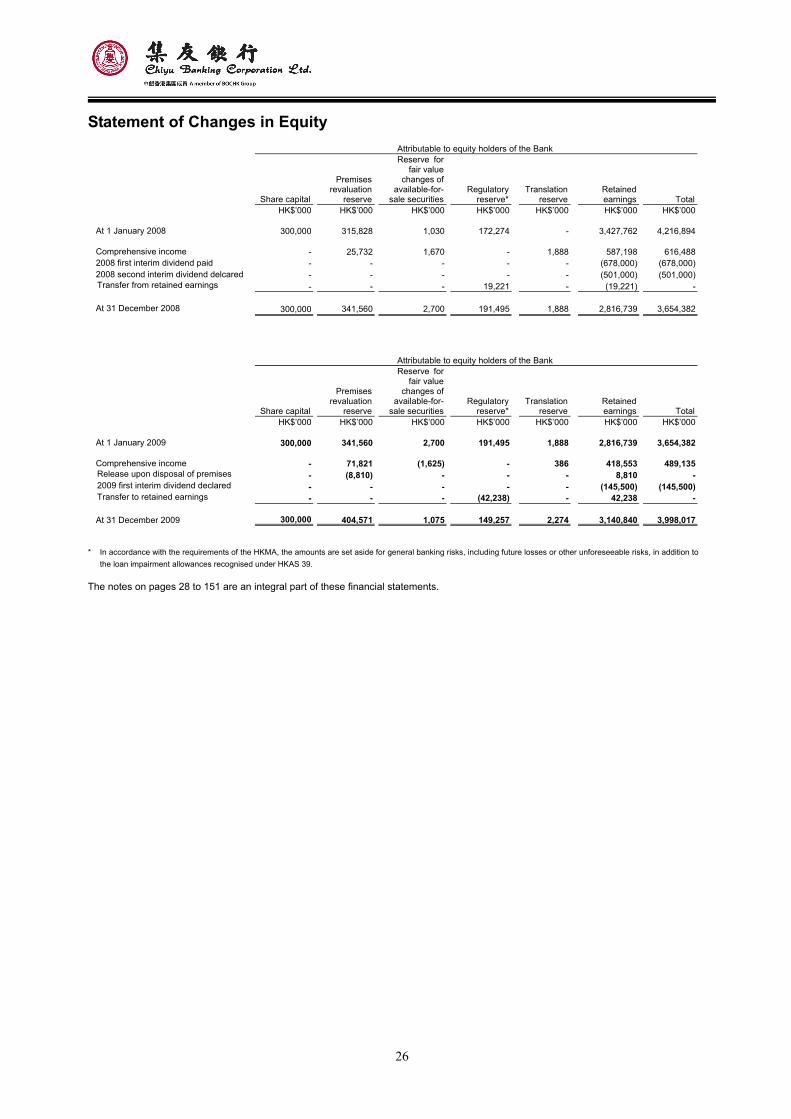
Statement of Changes in Equity
* In accordance with the requirements of the HKMA, the amounts are set aside for general banking risks, including future losses or other unforeseeable risks, in addition to
the loan impairment allowances recognised under HKAS 39. The notes on pages 28 to 151 are an integral part of these financial statements.
Attributable to equity holders of the Bank
Share capital
Premises revaluation
reserve
Reserve forfair value
changes of available-for-
sale securitiesRegulatory
reserve*
Translation reserve
Retained earnings Total
HK$’000 HK$’000 HK$’000 HK$’000 HK$’000 HK$’000 HK$’000 At 1 January 2008 300,000 315,828 1,030 172,274 - 3,427,762 4,216,894 Comprehensive income - 25,732 1,670 - 1,888 587,198 616,4882008 first interim dividend paid - - - - - (678,000) (678,000)2008 second interim dividend delcared - - - - - (501,000) (501,000)Transfer from retained earnings - - - 19,221 - (19,221) - At 31 December 2008 300,000 341,560 2,700 191,495 1,888 2,816,739 3,654,382
Attributable to equity holders of the Bank
Share capital
Premises revaluation
reserve
Reserve forfair value
changes of available-for-
sale securitiesRegulatory
reserve*
Translation reserve
Retained earnings Total
HK$’000 HK$’000 HK$’000 HK$’000 HK$’000 HK$’000 HK$’000 At 1 January 2009 300,000 341,560 2,700 191,495 1,888 2,816,739 3,654,382 Comprehensive income - 71,821 (1,625) - 386 418,553 489,135Release upon disposal of premises - (8,810) - - - 8,810 -2009 first interim dividend declared - - - - - (145,500) (145,500)Transfer to retained earnings - - - (42,238) - 42,238 - At 31 December 2009 300,000 404,571 1,075 149,257 2,274 3,140,840 3,998,017
27
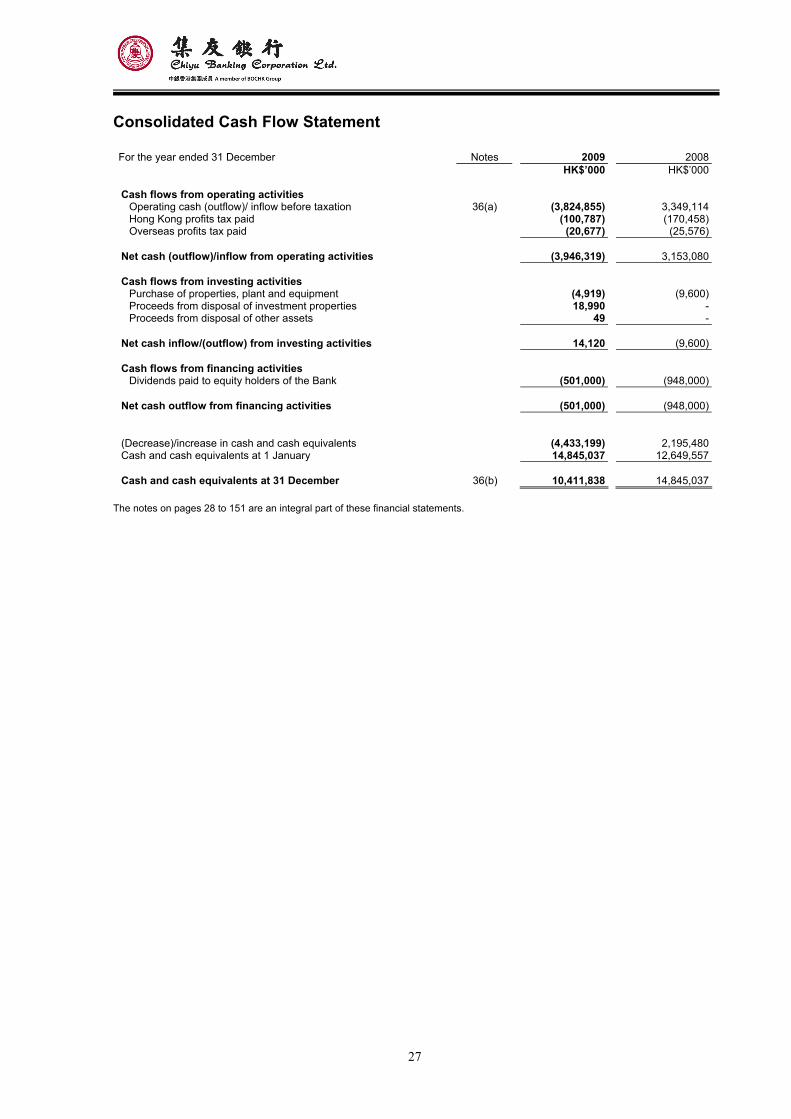
Consolidated Cash Flow Statement
For the year ended 31 December Notes 2009 2008
HK$’000 HK$’000
Cash flows from operating activities Operating cash (outflow)/ inflow before taxation 36(a) (3,824,855) 3,349,114Hong Kong profits tax paid (100,787) (170,458)Overseas profits tax paid (20,677) (25,576)
Net cash (outflow)/inflow from operating activities (3,946,319) 3,153,080 Cash flows from investing activities
Purchase of properties, plant and equipment (4,919) (9,600)Proceeds from disposal of investment properties 18,990 -Proceeds from disposal of other assets 49 -
Net cash inflow/(outflow) from investing activities 14,120 (9,600) Cash flows from financing activities
Dividends paid to equity holders of the Bank (501,000) (948,000)
Net cash outflow from financing activities (501,000) (948,000) (Decrease)/increase in cash and cash equivalents (4,433,199) 2,195,480Cash and cash equivalents at 1 January 14,845,037 12,649,557 Cash and cash equivalents at 31 December 36(b) 10,411,838 14,845,037
The notes on pages 28 to 151 are an integral part of these financial statements.
28
Notes to the Financial Statements
1. Principal activities
The Group is principally engaged in the provision of banking and related financial services in Hong Kong.
The Bank is a limited liability company incorporated in Hong Kong. The address of its registered office is No.78 Des Vouex
Road, Central, Hong Kong.
2. Summary of significant accounting policies
The principal accounting policies applied in the preparation of these consolidated financial statements are set out below.
These policies have been consistently applied to all the years presented, unless otherwise stated.
2.1 Basis of preparation
The consolidated financial statements of the Group have been prepared in accordance with Hong Kong
Financial Reporting Standards (HKFRSs is a collective term which includes all applicable individual Hong Kong
Financial Reporting Standards, HKASs and Interpretations) issued by the HKICPA and the requirements of the
Hong Kong Companies Ordinance.
The consolidated financial statements have been prepared under the historical cost convention, as modified by
the revaluation of available-for-sale securities, financial assets and financial liabilities (including derivative
financial instruments) at fair value through profit or loss, investment properties which are carried at fair value
and premises which are carried at fair value or revalued amount less accumulated depreciation and
accumulated impairment losses.
The preparation of financial statements in conformity with HKFRSs requires the use of certain critical
accounting estimates. It also requires management to exercise its judgement in the process of applying the
Group’s accounting policies. The areas involving a higher degree of judgement or complexity, or areas where
assumptions and estimates are significant to the consolidated financial statements are disclosed in Note 3.
29
Notes to the Financial Statements (continued)
2. Summary of significant accounting policies (continued)
2.1 Basis of preparation (continued)
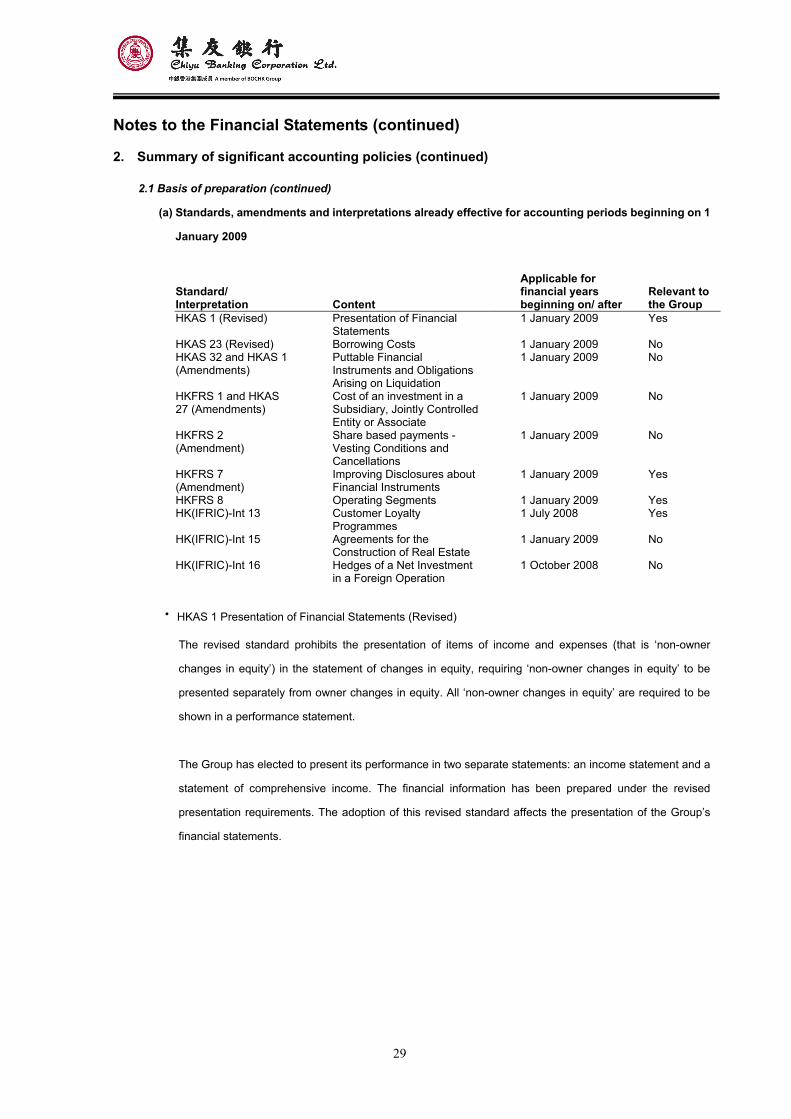
(a) Standards, amendments and interpretations already effective for accounting periods beginning on 1
January 2009
Standard/ Interpretation Content
Applicable for financial years beginning on/ after
Relevant to the Group
HKAS 1 (Revised) Presentation of Financial Statements
1 January 2009 Yes
HKAS 23 (Revised) Borrowing Costs 1 January 2009 No HKAS 32 and HKAS 1 (Amendments)
Puttable Financial Instruments and Obligations Arising on Liquidation
1 January 2009 No
HKFRS 1 and HKAS 27 (Amendments)
Cost of an investment in a Subsidiary, Jointly Controlled Entity or Associate
1 January 2009 No
HKFRS 2 (Amendment)
Share based payments - Vesting Conditions and Cancellations
1 January 2009 No
HKFRS 7 (Amendment)
Improving Disclosures about Financial Instruments
1 January 2009 Yes
HKFRS 8 Operating Segments 1 January 2009 Yes HK(IFRIC)-Int 13 Customer Loyalty
Programmes 1 July 2008 Yes
HK(IFRIC)-Int 15 Agreements for the Construction of Real Estate
1 January 2009 No
HK(IFRIC)-Int 16 Hedges of a Net Investment in a Foreign Operation
1 October 2008 No
⋅ HKAS 1 Presentation of Financial Statements (Revised)
The revised standard prohibits the presentation of items of income and expenses (that is ‘non-owner
changes in equity’) in the statement of changes in equity, requiring ‘non-owner changes in equity’ to be
presented separately from owner changes in equity. All ‘non-owner changes in equity’ are required to be
shown in a performance statement.
The Group has elected to present its performance in two separate statements: an income statement and a
statement of comprehensive income. The financial information has been prepared under the revised
presentation requirements. The adoption of this revised standard affects the presentation of the Group’s
financial statements.
30
Notes to the Financial Statements (continued)
2. Summary of significant accounting policies (continued)
2.1 Basis of preparation (continued)
(a) Standards, amendments and interpretations already effective for accounting periods beginning on 1
January 2009 (continued)
⋅ HKFRS 7 Financial Instruments: Disclosures (Amendment)
The amendment increases the disclosure requirements about fair value measurement and reinforces
existing principles for disclosure about liquidity risk. The amendment introduces a three-level hierarchy for
fair value measurement disclosures and requires some specific quantitative disclosures for financial
instruments on the lowest level in the hierarchy. It is not required to provide comparative disclosures in the
first year of application. The adoption of the amendment does not have an impact on the financial position
or the comprehensive income of the Group.
⋅ HKFRS 8 Operating Segments
HKFRS 8 replaces HKAS 14 ‘Segment Reporting’. It requires a ‘management approach’ under which
segment information, that reflects the operating result of segments reviewed regularly by the management
for operation decisions making, resources allocation and performance assessment, is presented on the
same basis and in the same manner as that used for internal reporting to the management. The adoption of
HKFRS 8 makes no change in the number of reportable segments presented.
⋅ HK(IFRIC)-Int 13 Customer Loyalty Programmes
HK(IFRIC)-Int 13 clarifies that when an entity provides customers with incentives to buy goods or services
under a customer loyalty programme (for example, customers accumulate loyalty points to redeem free or
discounted products or service), the fair value of the consideration received or receivable in respect of the
initial sale shall be allocated between the award credits and the other components of the sale or service. As
the interpretation does not have a significant impact on the Group’s results of operations and financial
position, no restatement of prior year figure has been made.
31
Notes to the Financial Statements (continued)
2. Summary of significant accounting policies (continued)
2.1 Basis of preparation (continued)
(b) Standards, amendments and interpretations issued that are not yet effective and have not been
early adopted by the Group in 2009
The following standards, amendments and interpretations have been issued and are mandatory for
accounting periods beginning on or after 1 July 2009:
Standard/ Interpretation Content
Applicable for financial years beginning on/ after
Relevant tothe Group
HKAS 27 (Revised) Consolidated and Separate Financial Statements
1 July 2009 Yes
HKAS 32 (Amendment)
Classification of Rights Issues 1 February 2010 No
HKAS 39 (Amendment)
Financial Instruments: Recognition and Measurement - Eligible Hedged Items
1 July 2009 No
HKFRS 1 (Revised) First-time Adoption of HKFRS 1 July 2009 No HKFRS 2 (Amendment)
Group Cash-settled Share-based Payment Transactions
1 January 2010 No
HKFRS 3 (Revised) Business Combinations 1 July 2009 Yes HKFRS 9 Financial Instruments Part 1:
Classification and Measurement1 January 2013 Yes
HK(IFRIC)-Int 17 Distributions of Non-cash Assets to Owners
1 July 2009 No
HK(IFRIC)-Int 18 Transfers of assets from customers
1 July 2009 No
HK(IFRIC)-Int 19 Extinguishing Financial Liabilities with Equity Instruments
1 July 2010 No
⋅ HKAS 27 Consolidated and Separate Financial Statements (Revised)
The revised standard requires changes in a parent’s ownership interest in a subsidiary that do not result
in the loss of control are accounted for within other comprehensive income. The standard also specifies
the accounting when control is lost. Any remaining interest in the entity is re-measured to fair value and
a gain or loss is recognised in income statement. The Group will apply HKAS 27 (Revised)
prospectively from 1 January 2010.
⋅ HKFRS 3 Business Combinations (Revised)
The revised standard continues to apply the acquisition method to business combinations, with some
significant changes. For example, all payments to purchase a business are to be recorded at fair value
at the acquisition date, with contingent payments classified as debt subsequently re-measured through
the consolidated income statement. All acquisition-related costs should be expensed. The Group will
apply HKFRS 3 (Revised) prospectively to all business combinations (other than common control
combination) acquired on or after 1 January 2010.
32
Notes to the Financial Statements (continued)
2. Summary of significant accounting policies (continued)
2.1 Basis of preparation (continued)
(b) Standards, amendments and interpretations issued that are not yet effective and have not been
early adopted by the Group in 2009 (continued)
⋅ HKFRS 9 Financial Instruments Part 1: Classification and Measurement
HKFRS 9 was issued in November 2009 and replaces those parts of HKAS 39 relating to the
classification and measurement of financial assets. Key features are as follows:
Financial assets are required to be classified into one of the below two measurement categories: those
to be measured subsequently at fair value or those to be measured subsequently at amortised cost.
Classification is to be made on transition, and subsequently on initial recognition. The classification
depends on the entity’s business model for managing its financial instruments and the contractual cash
flow characteristics of the instrument.
A financial instrument is subsequently measured at amortised cost only if it is a debt instrument and
both the objective of the entity’s business model is to hold the asset to collect the contractual cash flows,
and the asset’s contractual cash flows represent only unleveraged payments of principal and interest
are met. All other debt instruments are to be measured at fair value through profit or loss.
All equity instruments are to be measured subsequently at fair value. Equity instrument that are held for
trading will be measured at fair value through profit or loss. For all other equity investments, an
irrevocable election can be made on a share-by-share basis at initial recognition, to recognise
unrealised and realised fair value gains and losses through other comprehensive income rather than
income statement. Once elected to be recognized through other comprehensive income, there will be
no recycling of fair value gains and losses to income statement. Dividends are to be presented in
income statement, as long as they represent a return on investment.
While adoption of HKFRS 9 is mandatory from 1 January 2013, earlier adoption is permitted. The Group
is considering the impact of the standard on the consolidated financial statements and the timing of its
application.
33
Notes to the Financial Statements (continued)
2. Summary of significant accounting policies (continued)
2.1 Basis of preparation (continued)
(c) Improvements to HKFRS
‘Improvements to HKFRS’ contains numerous amendments to HKFRS which the HKICPA consider
non-urgent but necessary. It comprises amendments that result in accounting changes for presentation,
recognition or measurement purpose as well as terminology or editorial amendments related to a variety of
individual HKFRS. Most of the amendments are effective for annual periods beginning on or after 1 January
2009 or 1 January 2010 respectively, with earlier application permitted. No material changes to accounting
policies are expected as a result of these amendments.
(d) Standard issued that is not yet effective but has been early adopted by the Group in 2009
The following revised standard has been early partially adopted by the Group retrospectively.
Standard/ Interpretation Content
Applicable for Financial years beginning on/ after
Relevant to the Group
HKAS 24 (Revised) Related Party Disclosures 1 January 2011 Yes
⋅ HKAS 24 Related Party Disclosures (Revised)
The revised standard was issued in November 2009. In 2009, the Group partially adopted the revised
HKAS 24 –Related Party Disclosures as permitted in its transition provisions. The Group applied the
partial exemption in HKAS 24 (Revised) regarding disclosure requirements for government-related
entities. According to the previous version of HKAS 24, the Group was required to disclose transactions
with the government and other government related-entities. The amendment introduces an exemption
from certain disclosure requirements of HKAS 24 for transactions between government-related entities
and the government, and all other government-related entities. The Group has early adopted the partial
exemption and has applied this retrospectively. The early application does not have any effect on the
Group’s operating results, financial position or comprehensive income but has an impact on disclosure.
The related party disclosures have been changed accordingly.
The remainder of the revised standard amending the definition of related parties will be applied in the
annual period beginning 1 January 2011 and will not have any impact on the Group.
Except for the early partial adoption of HKAS24 (Revised), the Group has not early adopted other new or
amended accounting standards or interpretations in 2009.
34
Notes to the Financial Statements (continued)
2. Summary of significant accounting policies (continued)
2.2 Consolidation
The consolidated financial statements include the financial statements of the Bank and all of its subsidiaries
made up to 31 December.
Subsidiaries
Subsidiaries are all entities (including special purpose entities) over which the Group controls the composition
of the Board of Directors, controls more than half of the voting power, holds more than half of the issued capital
or by any other means that entitle the Group to govern the financial and operating policies of the entities. The
existence and effect of potential voting rights that are currently exercisable or convertible are considered when
assessing whether the Group controls another entity. Subsidiaries are fully consolidated from the date on which
control is transferred to the Group. They are de-consolidated from the date that control ceases.
The purchase method of accounting is used to account for the acquisition of subsidiaries by the Group not
under common control. The cost of such an acquisition is measured as the fair value of the assets given, equity
instruments issued and liabilities incurred or assumed as of the date of exchange, plus costs directly
attributable to the acquisition. Identifiable assets (including intangible assets) acquired and liabilities and
contingent liabilities assumed in a business combination are measured initially at their fair values as of the
acquisition date, irrespective of the extent of any non-controlling interest. The excess of the cost of acquisition
over the fair value of the Group’s share of the identifiable net assets acquired is recorded as goodwill. If the
cost of acquisition is less than the fair value of the Group’s share of the identifiable net assets of the
subsidiary acquired, the difference is recognised directly in the consolidated income statement.
Inter-company transactions, balances and unrealised gains on transactions between group companies are
eliminated; unrealised losses are also eliminated unless the transaction provides evidence of impairment of the
assets transferred. Where necessary, accounting policies of subsidiaries have been changed to ensure
consistency with the policies adopted by the Group.
In the Bank’s balance sheet the investments in subsidiaries are stated at cost less allowance for impairment
losses. The results of subsidiaries are accounted for by the Bank on the basis of dividends received and
receivable.
The gain or loss on the disposal of a subsidiary represents the difference between: (a) the proceeds of the sale
and, (b) the Group’s share of its net assets including goodwill on acquisition net of any accumulated impairment
loss and any related accumulated foreign currency translation difference.
35
Notes to the Financial Statements (continued)
2. Summary of significant accounting policies (continued)
2.3 Segmental reporting
The operating result of segments are reported in a manner consistent with the internal reporting provided to the
Board of Management, which is the chief operating decision maker of the Group, that allocates resources and
assesses the performance of operating segments. Income and expenses directly associated with each
segment are included in determining business segment performance.
2.4 Foreign currency translation
Items included in the financial statements of each of the Group’s entities are measured using the currency of
the primary economic environment in which the entity operates (the “functional currency”). The consolidated
financial statements are presented in Hong Kong dollars, which is the Bank’s functional and presentation
currency.
Foreign exchange gains and losses resulting from the settlement of foreign currency transactions using the
exchange rates prevailing at the dates of the transactions and monetary assets and liabilities denominated in
foreign currencies translated at the rate of exchange at the balance sheet date are recognised directly in the
income statement.
Changes in the fair value of monetary securities denominated in foreign currency classified as
available-for-sale are analysed between translation differences resulting from changes in the amortised cost of
the securities and other changes in the carrying amount of the securities. Translation differences related to
changes in the amortised cost are recognised in the income statement, and other changes in the carrying
amount are recognised in other comprehensive income.
Translation differences on non-monetary items, such as equities held at fair value through profit or loss, are
reported as part of the fair value gain or loss. Translation differences on non-monetary financial assets such as
equities classified as available-for-sale are included in the available-for-sale reserve in equity.
36
Notes to the Financial Statements (continued)
2. Summary of significant accounting policies (continued)
2.4 Foreign currency translation (continued)
The results and financial position of all the Group entities that have a functional currency different from Hong
Kong dollars are translated into Hong Kong dollars as follows:
• assets and liabilities are translated at the closing rate at the balance sheet date;
• income and expenses are translated at average exchange rates; and
• all resulting exchange differences are recognised in the currency translation reserve in equity through other
comprehensive income.
On consolidation, exchange differences arising from the translation of the net investment in foreign entities,
and of borrowings and other currency instruments designated as hedges of such investments are taken to
other comprehensive income. When a foreign entity is sold, such exchange differences are recognised in the
income statement, as part of the gain or loss on sale.
2.5 Derivative financial instruments
Derivatives are initially recognised at fair value on the date the derivative contract is entered into and are
subsequently re-measured at fair value. Fair values are obtained from quoted market prices in active markets,
including recent market transactions, and through the use of valuation techniques, including discounted cash
flow models and options pricing models, as appropriate. All derivatives are carried as assets when fair value is
positive and as liabilities when fair value is negative.
The best evidence of the fair value of a derivative at initial recognition is the transaction price (i.e., the fair value
of the consideration given or received).
Certain derivatives embedded in other financial instruments, such as the conversion option in a convertible
bond, are treated as separate derivatives when their economic characteristics and risks are not closely related
to those of the host contract and the host contract is not carried at fair value through profit or loss. These
embedded derivatives are measured at fair value with changes in fair value recognised in the income
statement.
Derivatives are categorised as held for trading and changes in their fair value are recognised immediately in the
income statement unless they are designated as hedges and are effective hedging instruments, then they are
subject to measurement under the hedge accounting requirements.
37
Notes to the Financial Statements (continued)
2. Summary of significant accounting policies (continued)
2.6 Offsetting financial instruments
Financial assets and liabilities are offset and the net amount reported in the balance sheet when there is a
legally enforceable right to set off the recognised amounts and there is an intention to settle on a net basis, or
realise the asset and settle the liability simultaneously.
2.7 Interest income and expense and fees and commission income and expense
Interest income and expense are recognised in the income statement for all financial assets and financial
liabilities using the effective interest method.
The effective interest method is a method of calculating the amortised cost of a financial asset or a financial
liability and of allocating the interest income or interest expense over the relevant period. The effective interest
rate is the rate that exactly discounts estimated future cash payments or receipts through the expected life of
the financial instrument or, when appropriate, a shorter period to the net carrying amount of the financial asset
or financial liability. When calculating the effective interest rate, the Group estimates cash flows considering all
contractual terms of the financial instrument (e.g. prepayment options or incentives relating to residential
mortgage loans) but does not consider future credit losses. The calculation includes fees, premiums or
discounts and basis points paid or received between parties to the contract, and directly attributable origination
fees and costs which represent an integral part of the effective yield are amortised as interest income or
expense over the expected life of the financial instrument.
38
Notes to the Financial Statements (continued)
2. Summary of significant accounting policies (continued)
2.7 Interest income and expense and fees and commission income and expense (continued)
Once a financial asset or a group of similar financial assets has been written down as a result of an impairment
loss, interest income is recognised on the written down value using the rate of interest used to discount the
future cash flows for the purpose of measuring the impairment loss. Subsequent unwinding of the discount
allowance is recognised as interest income.
Fees and commissions that are not an integral part of the effective yield are recognised on an accrual basis
ratably over the period when the related service has been provided, such as administrative fee, asset
management fee and custody services fee. Loan syndication fees are recognised as revenue when the related
syndication arrangement has been completed and the Group has retained no part of the loan package for itself
or has retained a part at the same effective interest rate as that of other participants.
2.8 Financial assets
The Group classifies its financial assets into the following categories: financial assets at fair value through
profit or loss; loans and receivables; held-to-maturity investments and available-for-sale financial assets.
Management determines the classification of investments at initial recognition. The classification depends on
the purpose for which the financial assets were held. All financial assets are recognised initially at fair value.
Except for financial assets carried at fair value through profit or loss, all transaction costs of financial assets are
included in their amortised costs.
(1) Financial assets at fair value through profit or loss
This category has two sub-categories: financial assets held for trading, and those designated at fair value
through profit or loss at inception.
A financial asset which has been acquired or incurred principally for the purpose of selling in the short term
or is part of a portfolio of identified financial instruments that are managed together and for which there is
evidence of a recent actual pattern of short-term profit-taking is classified as held-for-trading. Derivatives
are also classified as held for trading unless they are designated as effective hedges.
39
Notes to the Financial Statements (continued)
2. Summary of significant accounting policies (continued)
2.8 Financial assets (continued)
(1) Financial assets at fair value through profit or loss (continued)
A financial asset, other than one held for trading, will be designated as a financial asset at fair value through
profit or loss, if it meets the criteria set out below, and is so designated by management:
• eliminates or significantly reduces a measurement or recognition inconsistency (sometimes referred to
as ‘an accounting mismatch’) that would otherwise arise from measuring the financial assets or
recognising the gains and losses on them on different bases; or
• applies to a group of financial assets, financial liabilities or both that is managed and its performance is
evaluated on a fair value basis, in accordance with a documented risk management or investment
strategy, and information about the group is provided internally on that basis to the key management; or
• relates to financial assets containing one or more embedded derivative that significantly modifies the
cash flow resulting from those financial assets.
These assets are recognised initially at fair value, with transaction costs taken directly to the consolidated
income statement, and are subsequently re-measured at fair value.
Gains and losses from changes in the fair value of such assets (excluding the interest component) are
reported in net trading income or net gain/loss on financial instruments designated at fair value through
profit or loss. The interest component is reported as part of interest income. Dividends on equity
instruments of this category are recognised in the consolidated income statement when the Group’s right to
receive payment is established.
(2) Loans and receivables
Loans and receivables are non-derivative financial assets with fixed or determinable payments that are not
quoted in an active market, including placements with and advances to banks and other financial
institutions, investment debt securities without an active market and loans and advances to customers.
They arise when the Group provides money, goods or services directly to a debtor with no intention of
trading the receivable. They are initially recorded at fair value plus any directly attributable transaction costs
and are subsequently measured at amortised cost using the effective interest rate method less allowances
for impairment losses.
40
Notes to the Financial Statements (continued)
2. Summary of significant accounting policies (continued)
2.8 Financial assets (continued)
(3) Held-to-maturity
Financial assets classified as held-to-maturity are those traded in active markets, with fixed or determinable
payments and fixed maturities that the Group’s management has both the positive intention and the ability
to hold to maturity. Were the Group to sell other than an insignificant amount of held-to-maturity assets, the
entire category would be tainted and reclassified as available-for-sale. They are initially recorded at fair
value plus any directly attributable transaction costs, and are subsequently measured at amortised cost
using the effective interest method less allowances for impairment losses.
(4) Available-for-sale
Financial assets classified as available-for-sale are those that are either designated as such or are not
classified in any of the other categories. They are intended to be held for an indefinite period of time, which
may be sold in response to needs for liquidity or changes in interest rates, exchange rates or equity prices.
Available-for-sale financial assets are initially recorded at fair value plus any directly attributable transaction
costs, and are subsequently measured at fair value. Unrealised gains and losses arising from changes in
the fair value of investments are recognised directly in other comprehensive income, until the financial asset
is disposed of or impaired at which time the cumulative gain or loss previously recognised in equity should
be transferred to the consolidated income statement. However, interest which includes the amortisation of
premium and discount is calculated using the effective interest method and is recognised in the
consolidated income statement. Dividends on equity instruments classified as available-for-sale are
recognised in the consolidated income statement when the Group’s right to receive payment is established.
2.9 Financial liabilities
The Group classifies its financial liabilities under the following categories: trading liabilities, financial liabilities
designated at fair value through profit or loss, deposits, debt securities in issue, subordinated liabilities, and
other liabilities. All financial liabilities are classified at inception and recognised initially at fair value.
(1) Trading liabilities
A financial liability is classified as held for trading if it is incurred principally for the purpose of repurchasing
in the short term. Derivatives are also classified as held for trading unless they are designated as effective
hedges. It is measured at fair value and any gains and losses from changes in fair value are recognised in
the income statement.
41
Notes to the Financial Statements (continued)
2. Summary of significant accounting policies (continued)
2.9 Financial liabilities (continued)
(2) Financial liabilities designated at fair value through profit or loss
A financial liability can be designated at fair value through profit or loss if it is so designated at inception.
Financial liabilities so designated include certain certificates of deposit issued and certain deposits received
from customers that are embedded with derivatives. A financial liability is typically so designated if it meets
the following criteria:
• eliminates or significantly reduces a measurement or recognition inconsistency (sometimes referred to
as ‘an accounting mismatch’) that would otherwise arise from measuring the financial liabilities or
recognising the gains and losses on them on different bases; or
• applies to a group of financial assets, financial liabilities or both that is managed and its performance is
evaluated on a fair value basis, in accordance with a documented risk management or investment
strategy, and information about the group is provided internally on that basis to the key management; or
• relates to financial liabilities containing one or more embedded derivative that significantly modifies the
cash flow resulting from those financial liabilities.
Financial liabilities designated at fair value through profit or loss are measured at fair value and any gains
and losses from changes in fair value are recognised in the income statement.
(3) Deposits and other liabilities
Deposits and other liabilities are carried at amortised cost or at cost. Any difference (if available) between
proceeds net of transaction costs and the redemption value is recognised in the income statement over the
period using the effective interest method.
2.10 Recognition and de-recognition of financial instruments
Purchases and sales of financial assets at fair value through profit or loss, available-for-sale and
held-to-maturity are recognised on the trade date, the date on which the Group purchases or sells the assets.
Loans and receivables (except investment securities without an active market) are recognised when cash is
advanced to the borrowers. Financial assets are derecognised when the rights to receive cash flows from the
financial assets have expired or where the Group has transferred substantially all risks and rewards of
ownership.
42
Notes to the Financial Statements (continued)
2. Summary of significant accounting policies (continued)
2.10 Recognition and de-recognition of financial instruments (continued)
Trading liabilities, financial liabilities designated at fair value through profit or loss and debt securities in issue
are recognised on the trade date. Deposits other than trading liabilities are recognised when money is
received from customers, other liabilities are recognised when such obligations arise. Financial liabilities are
de-recognised from the balance sheet when and only when the obligation specified in the contract is
discharged, cancelled or expired. If the Group purchases its own debt, it is removed from the balance sheet,
and the difference between the carrying amount of a liability and the consideration paid is included in net
trading income.
Securities and bills sold to a counter-party with an obligation to repurchase at a pre-determined price on a
specified future date under a repurchase agreement are referred to as Repos. Securities and bills purchased
from a counter-party with an obligation to re-sell to the counter-party at a pre-determined price on a specified
future date under a resale agreement are referred to as Reverse repos.
Repos or securities lending are initially recorded as due to banks, placements from banks and other financial
institutions, as appropriate, at the actual amount of cash received from the counter-party. The financial assets
used to collateralise repurchase agreements are recorded as investment securities or financial assets at fair
value through profit or loss. Reverse repos or securities borrowing are initially recorded in the balance sheet
as cash and due from banks or placements with banks and other financial institutions, as appropriate, at the
actual amount of cash paid to the counter-party. The financial assets received as collateral under reverse
repurchase agreements are not recorded on the balance sheet. The difference between sale and repurchase
price is recognised as interest income or interest expense over the life of the agreements using the effective
interest method.
2.11 Determination of fair value of financial instruments
The fair values of financial assets and financial liabilities that are quoted in active markets are based on
current bid prices and current ask prices respectively. If the market for financial assets and financial liabilities
is not active (such as unlisted securities), the Group establishes fair value by using valuation techniques.
These include the use of recent arm’s length transactions, discounted cash flow analysis, option pricing
models and other valuation techniques commonly used by market participants.
43
Notes to the Financial Statements (continued)
2. Summary of significant accounting policies (continued)
2.12 Impairment of financial assets
The Group assesses as of each balance sheet date whether there is objective evidence that a financial asset
or group of financial assets is impaired. A financial asset or a group of financial assets is impaired and
impairment losses are incurred if, and only if, there is objective evidence of impairment as a result of one or
more events that occurred after the initial recognition of the asset (a “loss event”) and that loss event (or
events) has an impact on the estimated future cash flows of the financial asset or group of financial assets
that can be reliably estimated. Objective evidence that a financial asset or group of assets may be impaired
includes observable data that comes to the attention of the Group about the following probable loss events:
(i) significant financial difficulty of the issuer or obligor;
(ii) a breach of contract, such as a default or delinquency in interest or principal payment;
(iii) the Group granting to the borrower, for economic or legal reasons relating to the borrower’s financial
difficulty, a concession that the lender would not otherwise consider;
(iv) it becoming probable that the borrower will enter into bankruptcy or other financial reorganisation;
(v) the disappearance of an active market or downgrading below investment grade level for that financial
asset because of financial difficulties; or
(vi) observable data indicating that there is a measurable decrease in the estimated future cash flows from a
group of financial assets since the initial recognition of those assets, although the decrease cannot yet be
identified with the individual financial assets in the group, including:
• adverse changes in the payment status of borrowers in the group; or
• national or local economic conditions that correlate with defaults on the assets in the group.
(1) Assets carried at amortised cost
The Group first assesses whether objective evidence of impairment exists individually for financial assets
that are individually significant. If the Group determines that no objective evidence of impairment exists for
an individually assessed financial asset, it includes the asset in a group of financial assets with similar
credit risk characteristics and collectively assesses them for impairment together with all other financial
assets that are not individually significant or for which impairment has not yet been identified. Assets that
are individually assessed for impairment and for which an impairment loss is or continues to be
recognised are not included in a collective assessment of impairment.
44
Notes to the Financial Statements (continued)
2. Summary of significant accounting policies (continued)
2.12 Impairment of financial assets (continued)
(1) Assets carried at amortised cost (continued)
If there is objective evidence that an impairment loss on loans and receivables or held-to-maturity
investments has been incurred, the amount of the loss is measured as the difference between the asset’s
carrying amount and the present value of estimated future cash flows (excluding future credit losses that
have not been incurred) discounted at the financial asset’s original effective interest rate. The carrying
amount of the asset is reduced through the use of an allowance account and the amount of the loss is
recognised in the income statement. If a loan or held-to-maturity investment has a variable interest rate,
the discount rate for measuring any impairment loss is the current effective interest rate determined under
the contract. As a practical expedient, the Group may measure impairment on the basis of an instrument’s
fair value using an observable market price.
The calculation of the present value of the estimated future cash flows of a collateralised financial asset
reflects the cash flows that may result from foreclosure less costs for obtaining and selling the collateral.
For the purposes of a collective assessment of impairment, financial assets are grouped on the basis of
similar and relevant credit risk characteristics. Those characteristics are relevant to the estimation of
future cash flows for groups of such assets by being indicative of the debtors’ ability to pay all amounts
due according to the contractual terms of the assets being evaluated.
Future cash flows in a group of financial assets that are collectively evaluated for impairment are
estimated on the basis of the contractual cash flows of the assets in the group and historical loss
experience for assets with credit risk characteristics similar to those in the group. Historical loss
experience is adjusted on the basis of current observable data to reflect the effects of current conditions
that did not affect the period on which the historical loss experience is based and to remove the effects of
conditions in the historical period that do not exist currently.
When a loan is uncollectible, it is written off against the related allowance for impairment losses. Such
loans are written off after all the necessary procedures have been completed and the amount of the loss
has been determined. Subsequent recoveries of amounts previously written off decrease the amount of
impairment losses in the income statement.
45
Notes to the Financial Statements (continued)
2. Summary of significant accounting policies (continued)
2.12 Impairment of financial assets (continued)
(1) Assets carried at amortised cost (continued)
If, in a subsequent period, the amount of allowance for impairment losses decreases and the decrease
can be related objectively to an event occurring after the impairment loss was recognised (such as an
improvement in the debtor’s credit rating), the previously recognised impairment loss is reversed by
adjusting the allowance account. The amount of the reversal is recognised in the income statement.
Loans whose terms have been renegotiated with substantial difference in the terms are no longer
considered to be past due but are treated as new loans.
(2) Assets classified as available-for-sale
If evidence of impairment exists for available-for-sale financial assets, the cumulative losses, measured
as the difference between the acquisition cost or amortised cost and the current fair value, less any
impairment loss on that financial asset previously recognised in the income statement, is removed from
equity and recognised in the income statement. In the case of equity investments classified as
available-for-sale, a significant or prolonged decline in the fair value of the security below its cost is
considered in determining whether the assets are impaired. If, in a subsequent period, the fair value of a
debt instrument classified as available-for-sale increases and the increase can be objectively related to an
event occurring after the impairment loss was recognised in the income statement, the impairment loss is
reversed through the income statement. With respect to equity instruments, further fair value changes are
recognised in the reserve for fair value change of available-for-sale securities through other
comprehensive income.
2.13 Impairment of investment in subsidiaries and non-financial assets
Assets that have an indefinite useful life or are not yet available for use are not subject to amortisation, but are
tested annually for impairment. Assets that are subject to amortisation are reviewed for impairment whenever
events or changes in circumstances indicate that the carrying amount may not be recoverable. An impairment
loss is recognised for the amount by which the asset’s carrying amount exceeds its recoverable amount. The
recoverable amount is the higher of an asset’s fair value less costs to sell and value in use. For the purposes
of assessing impairment, assets are grouped at the lowest levels for which there are separately identifiable
cash flows (cash generating units). Assets that suffered impairment are reviewed for possible reversal of the
impairment at each reporting date.
46
Notes to the Financial Statements (continued)
2. Summary of significant accounting policies (continued)
2.14 Financial guarantee contracts
Financial guarantee contracts are contracts that require the issuer to make specified payments to reimburse
the holder for a loss it incurs because a specified debtor fails to make payments when due, in accordance
with the terms of a contract between the holder and the debtor.
Financial guarantees are initially recognised as financial liabilities and reported under “Other accounts and
provisions” in the financial statements at fair value on the date the guarantee was given. Subsequent to initial
recognition, the Group’s liabilities under such guarantees are measured at the higher of (i) the amount
determined in accordance with HKAS 37 Provisions, Contingent Liabilities and Contingent Assets and (ii) the
amount initially recognised less, where appropriate, cumulative amortisation recognised over the life of the
guarantee on a straight-line basis. Any changes in the liability relating to financial guarantees are taken to the
income statement.
2.15 Premises, equipment, fixtures and fittings
Premises comprise primarily branches and offices. Premises are shown at fair value based on periodic, but at
least annually, valuations by external independent valuers less subsequent depreciation. Any accumulated
depreciation at the date of revaluation is eliminated against the gross carrying amount of the asset and the net
amount is restated to the revalued amount of the asset. In the intervening periods, the directors review the
carrying amount of premises, by reference to the open market value of similar properties, and adjustments are
made when there has been a material change. All equipment, fixtures and fittings are stated at historical cost
less accumulated depreciation and impairment. Historical cost includes expenditures that are directly
attributable to the acquisition and installation of the items.
Subsequent costs are included in an asset’s carrying amount or are recognised as a separate asset, as
appropriate, only when it is probable that future economic benefits associated with the item will flow to the
Group and the cost of the item can be measured reliably. The item is stated at cost less impairment until it
begins to generate economic benefits, then the item is subsequently measured according to the
measurement basis of its respective assets class. All other repairs and maintenance costs are charged to the
income statement during the financial period in which they are incurred.
47
Notes to the Financial Statements (continued)
2. Summary of significant accounting policies (continued)
2.15 Premises, equipment, fixtures and fittings (continued)
Increases in the carrying amount arising on revaluation of premises are credited to the premises revaluation
reserve through other comprehensive income. Decreases that offset previous increases of the same
individual asset are charged against premises revaluation reserve in equity; all other decreases are expensed
in the income statement. Any subsequent increases are credited to the income statement up to the amount
previously debited, and then to the premises revaluation reserve. Upon disposal of premises, the relevant
portion of the premises revaluation reserve realised in respect of previous valuations is released and
transferred from the premises revaluation reserve to retained earnings.
Depreciation is calculated on the straight-line method to write down the cost or revalued amount of such
assets over their estimated useful lives as follows:
• Premises Over the remaining period of lease
• Equipment, fixtures and fittings 3-15 years
The useful lives of assets are reviewed, and adjusted if appropriate, as of each balance sheet date.
At each balance sheet date, both internal and external sources of information are considered to determine
whether there is any indication that premises, equipment, fixtures and fittings are impaired. If any such
indication exists, the recoverable amount of the asset is estimated and where relevant, an impairment loss is
recognised to reduce the asset to its recoverable amount. Such impairment loss is recognised in the income
statement except where the asset is carried at valuation and the impairment loss does not exceed the
revaluation surplus for that same asset, in which case it is treated as a revaluation decrease. The recoverable
amount is the higher of the asset’s fair value less costs to sell and value in use. Impairment loss is reversed
through the premises revaluation reserve or income statement as appropriate.
Gains and losses on disposals are determined by comparing proceeds with carrying amount, relevant taxes
and expenses. These are included in the income statement.
48
Notes to the Financial Statements (continued)
2. Summary of significant accounting policies (continued)
2.16 Investment properties
Properties that are held for long-term rental yields or for capital appreciation or both, and that are not occupied
by the companies in the Group, are classified as investment properties. Properties leased out within group
companies are classified as investment properties in individual companies’ financial statements and as
premises in consolidated financial statements. Land held under operating lease is classified and accounted for
as investment property when the rest of the definition of investment property is met. The operating lease is
accounted for as if it is a finance lease.
Investment properties are recognised initially at cost, including related transaction costs. After initial
recognition, investment properties are measured at fair value assessed by professional valuers on the basis of
open market value. If this information is not available, alternative valuation methods are used such as recent
prices on less active markets or discounted cash flow projections. These valuations are performed in
accordance with the guidance issued by the International Valuation Standards Committee.
Subsequent expenditure is charged to the asset’s carrying amount only when it is probable that future
economic benefits associated with the item will flow to the Group and the cost of the item can be measured
reliably. The item is stated at cost less impairment and is included in the carrying amount of investment
properties. Once the item begins to generate economic benefits, it is then measured at fair value. All other
repairs and maintenance costs are expensed in the income statement during the financial period in which they
are incurred.
Any changes in fair value are reported directly in the income statement. Deferred income tax is provided on
revaluation surpluses of investment properties in accordance with HK(SIC)-Int 21 “Income Taxes –
Recovery of Revalued Non-Depreciable Assets” on HKAS 12 “Income Taxes”.
If an investment property becomes owner-occupied, it is reclassified as premises, and its fair value at the date
of reclassification becomes its cost for accounting purposes. If an item of premises becomes an investment
property because its use has changed, any difference resulting between the carrying amount and the fair
value of this item at the date of transfer is recognised in other comprehensive income as a revaluation of
premises under HKAS 16 “Property, Plant and Equipment”. However, if a fair value gain reverses a previous
revaluation loss or impairment loss, the gain is recognised in the income statement up to the amount
previously debited.
49
Notes to the Financial Statements (continued)
2. Summary of significant accounting policies (continued)
2.17 Leases
(1) Operating leases
Leases in which a significant portion of the risks and rewards of ownership are retained by the lessor are
classified as operating leases. The total payments made under operating leases (net of any incentives
received from the lessor) which include land use rights with payments that are separately identifiable at
inception of the lease are charged to the income statement on a straight-line basis over the period of the
lease.
When an operating lease is terminated before the lease period has expired, any payment required to be
made to the lessor by way of penalty is recognised as an expense in the period in which termination takes
place.
Where the Group is a lessor, the land and buildings subject to the operating lease are accounted for as
investment properties. Rental income from operating leases is recognised on a straight-line basis over the
lease term.
(2) Finance leases on properties
Where the land and buildings elements of leasehold properties held for own use can be split reliably at
inception of the lease, leasehold land and land use rights are recognised as operating leases if they have
indefinite economic lives. The up-front prepayments made or other costs incurred for acquiring the
leasehold land and land use rights are expensed in the income statement on a straight-line basis over the
period of the lease. Where there is impairment of the up-front prepayments, the impairment is expensed in
the income statement immediately. Where the land and buildings cannot be split reliably at inception of the
lease, the land and buildings elements will continue to be treated as finance leases and measured at fair
value.
Separate measurements of the land and buildings elements are not required when the Group’s interest in
both land and buildings is classified as investment properties as if they are finance leases and are
measured at fair value.
2.18 Cash and cash equivalents
For the purposes of the consolidated cash flow statement, cash and cash equivalents comprise balances with
original maturity less than three months from the date of acquisition, including cash, balances with banks and
other financial institutions, short-term bills and notes classified as investment securities and certificates of
deposit.
50
Notes to the Financial Statements (continued)
2. Summary of significant accounting policies (continued)
2.19 Provisions
Provisions are recognised when the Group has a present legal or constructive obligation as a result of past
events, it is probable that an outflow of resources embodying economic benefits will be required to settle the
obligation, and a reliable estimate of the amount of the obligation can be made.
2.20 Employee benefits
(1) Retirement benefit costs
The Group contributes to defined contribution retirement schemes under either recognised ORSO
schemes or MPF schemes that are available to the Group’s employees. Contributions to the schemes by
the Group and employees are calculated as a percentage of employees’ basic salaries for the ORSO
schemes and in accordance with the MPF rules for MPF schemes. The retirement benefit scheme costs
are charged to the income statement as incurred and represent contributions payable by the Group to the
schemes. Contributions made by the Group that are forfeited by those employees who leave the ORSO
scheme prior to the full vesting of their entitlement to the contributions are used by the Group to reduce the
existing level of contributions or to meet its expenses under the trust deed of the ORSO schemes.
The assets of the schemes are held in independently-administered funds separate from those of the
Group.
(2) Leave entitlements
Employee entitlements to annual leave and sick leave are recognised when they accrue to employees. A
provision is made for the estimated liability for unused annual leave and the amount of sick leave expected
to be paid as a result of services rendered by employees up to the balance sheet date.
Compensated absences other than sick leave and special approved annual leaves are non-accumulating;
they lapse if the current period’s entitlement is not used in full. Except unexpired annual leaves, they do
not entitle employees to a cash payment for unused entitlement on leaving the Group. Such compensated
absences are recognised when the absences occur.
(3) Bonus plans
The expected cost of bonus payments are recognised as a liability when the Group has a present legal or
constructive obligation as a result of services rendered by employees and a reliable estimate of the
obligation can be made. Liabilities for bonus plans are expected to be settled within twelve months and
are measured at the amounts expected to be paid when they are settled.
51
Notes to the Financial Statements (continued)
2. Summary of significant accounting policies (continued)
2.21 Current and deferred income taxes
Tax expenses for the period comprises current and deferred tax. Tax is recognised in the income statement,
except to the extent that it relates to items recognised directly in other comprehensive income. In this case,
the tax is also recognised in other comprehensive income within the corresponding item.
Income tax payable on profits, based on the applicable tax law enacted or substantially enacted at the
balance sheet date in each jurisdiction where the Company and the subsidiaries and associates operate and
generate taxable income, is recognised as a current income tax expense in the period in which profits arise.
Deferred income tax is provided in full, using the balance sheet liability method, on temporary differences
arising between the tax bases of assets and liabilities and their carrying amounts in the consolidated financial
statements. Deferred income tax is determined using tax rates and laws that have been enacted or
substantially enacted by the balance sheet date and are expected to apply when the related deferred income
tax asset is realised or the deferred income tax liability is settled.
The principal temporary differences arise from asset impairment provisions, depreciation of property and
equipment, revaluation of certain assets including available-for-sale securities and properties, and tax losses
carried forward. However, the deferred income tax is not recognised if it arises from initial recognition of an
asset or liability in a transaction other than a business combination that at the time of the transaction affects
neither accounting nor taxable profit or loss.
Deferred income tax liabilities are provided in full on all taxable temporary differences and deferred income
tax assets are recognised to the extent that it is probable that future taxable profit will be available against
which the temporary differences can be utilised.
Deferred income tax is charged or credited in the income statement except for deferred income tax relating to
fair value re-measurement of available-for-sale investments and revaluation of premises which are charged or
credited to other comprehensive income, in which case the deferred income tax is also credited or charged to
other comprehensive income and is subsequently recognised in the income statement together with the
realisation of the deferred gain and loss.
52
Notes to the Financial Statements (continued)
2. Summary of significant accounting policies (continued)
2.22 Repossessed assets
Repossessed assets are initially recognised at the lower of their fair value less costs to sell and the amortised
cost of the related outstanding loans on the date of repossession, and the related loans and advances
together with the related impairment allowances are derecognised from the balance sheet. Subsequently,
repossessed assets are measured at the lower of their cost and fair values less costs to sell and are reported
as ‘non-current assets held for sale’ included in ‘Other assets’.
2.23 Fiduciary activities
The Group commonly acts as a trustee, or in other fiduciary capacities, that result in its holding or managing
assets on behalf of individuals, trusts and other institutions. These assets and any gains or losses arising
thereon are excluded from these financial statements, as they are not assets of the Group.
2.24 Contingent liabilities and contingent assets
A contingent liability is a possible obligation that arises from past events and whose existence will only be
confirmed by the occurrence or non-occurrence of one or more uncertain future events not wholly within the
control of the Group. It can also be a present obligation arising from past events that is not recognised
because it is not probable that an outflow of economic resources will be required or the amount of obligation
cannot be measured reliably.
A contingent liability is not recognised as a provision but is disclosed in the notes to the financial statements.
When a change in the probability of an outflow occurs so that outflow is probable, it will then be recognised as
a provision.
A contingent asset is a possible asset that arises from past events and whose existence will be confirmed
only by the occurrence or non-occurrence of one or more uncertain events not wholly within the control of the
Group.
Contingent assets are not recognised but are disclosed in the notes to the financial statements when an
inflow of economic benefits is probable. When the inflow is virtually certain, it will be recognised as an asset.
2.25 Related parties
For the purposes of these financial statements, a party is considered to be related to the Group if the Group
has the ability, directly and indirectly through one or more intermediaries, to control the party or exercise
significant influence over the party in making financial and operating decisions, or vice versa, or where the
Group and the party are subject to common control. Related parties may be individuals or entities.
53
Notes to the Financial Statements (continued)
3. Critical accounting estimates and judgements in applying accounting policies
The Group makes estimates and assumptions that affect the reported amounts of assets and liabilities within the
next financial year. Estimates and judgements are continually evaluated and are based on historical experience
and other factors, including expectations of future events that are believed to be reasonable under the
circumstances. Areas susceptible to changes in essential estimates and judgements, which affect the carrying
amount of assets and liabilities, are set out below. The effect of changes to either the key assumptions or other
estimation uncertainties will be presented below if it is practicable to determine. It is possible that actual results
may require material adjustments to the estimates referred to below.
3.1 Impairment allowances on loans and advances
The Group reviews its loan portfolios to assess impairment at least on a quarterly basis. In determining
whether an impairment loss should be recorded in the income statement, the Group makes judgements as to
whether there is any observable data indicating that there is a measurable decrease in the estimated future
cash flows from a portfolio of loans and advances before the decrease can be identified with an individual loan
in that portfolio. This evidence may include observable data indicating that there has been an adverse change
in the payment status of borrowers in a group (e.g. payment delinquency or default), or economic conditions
that correlate with defaults on assets in the group. Management uses estimates based on historical loss
experience for assets with credit risk characteristics and objective evidence of impairment similar to those in
the portfolio when estimating expected future cash flows. The methodology and assumptions used for
estimating both the amount and timing of future cash flows are reviewed regularly to reduce any differences
between loss estimates and actual loss experience.
3.2 Impairment of held-to-maturity and available-for-sale investments
The Group reviews its held-to-maturity and available-for-sale investment portfolios to assess impairment at l
east on a quarterly basis. In determining whether any of these investments is impaired, risk characteristics and
performance such as external credit rating, market price etc will be assessed. The Group makes estimates on
the default rate and loss severity of each investment with reference to market performance of the portfolios,
current payment status of the issuers or performance of the underlying assets, or economic conditions that
correlate with defaults on the collateralised assets.
54
Notes to the Financial Statements (continued)
3. Critical accounting estimates and judgements in applying accounting policies (continued)
3.3 Fair values of derivatives financial instruments
The fair values of derivatives financial instruments that are not quoted in active markets are determined by
using valuation techniques. Valuation techniques used include discounted cash flows analysis and models with
built-in functions available in externally acquired financial analysis or risk management systems widely used by
the industry. To the extent practical, the models use only observable data.
3.4 Held-to-maturity investments
The Group follows the guidance of HKAS 39 in classifying certain non-derivative financial assets with fixed or
determinable payments and fixed maturity as held-to-maturity. This classification requires significant
judgement. In making this judgement, the Group evaluates its intention and ability to hold such investments to
maturity. If the Group fails to hold these investments to maturity other than for specific circumstances defined
in HKAS 39, such as selling an insignificant amount close to maturity, it will be required to reclassify the entire
portfolio of assets as available-for-sale. The investments would then be measured at fair value and not
amortised cost.
3.5 Provision
The Group uses judgement to assess whether the Group has a present legal or constructive obligation as a
result of past events at each balance sheet date, and judgement is used to determine if it is probable that an
outflow of resources embodying economic benefits will be required to settle the obligation, and to determine a
reliable estimate of the amount of the obligation.
On 22 July 2009, the Group agreed with the Securities and Futures Commission, the HKMA and fifteen other
distributing banks to make an offer to eligible customers to repurchase their holdings in all outstanding Lehman
Brothers minibonds (“Minibonds”) subscribed through the Group (“the Repurchase Scheme”).
In determining the Group’s charge to the income statement in respect of the Minibonds, the Group took into account
the estimated aggregate amount paid and payable under the Repurchase Scheme and the voluntary offer, the
provision made prior to the date of the Repurchase Scheme and the amount recoverable from the Minibonds.
The amount recoverable from the Minibonds is uncertain and dependent on a number of factors including resolution of
certain legal matters, which may result in a wide range of recovery outcomes. The Group has made an assessment
of the amount recoverable taking into account such uncertainties. The final amount recovered by the Group could be
different from the assessment and may result in a significant credit being recognised in the income statement in the
period when it is realised.
55
Notes to the Financial Statements (continued)
4. Financial risk management
The Group is exposed to financial risks as a result of engaging in a variety of business activities. The principal financial
risks are credit risk, market risk (including currency risk and interest rate risk) and liquidity risk. This note summarises the
Group’s exposures to these risks, as well as its objectives, policies and processes for managing and the methods used to
measure these risks.
Financial risk management framework
The Group’s management governance structure is designed to cover all business processes and ensure various risks
are properly managed and controlled in the course of conducting business. The Group has a robust risk management
organisational structure with a comprehensive set of policies and procedures to identify, measure, monitor and control
various risks that may arise. These risk management policies and procedures are regularly reviewed and modified to
reflect changes in markets and business strategies. Various groups of risk takers assume their respective responsibilities
for risk management.
The Board of Directors, representing the interests of shareholders, is the highest decision making authority of the Group
and has the ultimate responsibility for risk management. The Board, with the assistance of the RC, has the primary
responsibility for the formulation of risk management strategies and for ensuring that the Group has an effective risk
management system to implement these strategies.
The RC, a standing committee established by the Board of Directors, is responsible for overseeing the Group’s various
types of risks, reviewing and approving high-level risk-related policies and overseeing their implementation, reviewing
significant or high risk exposures or transactions and exercising its power of veto if it considers that any transaction
should not proceed.
The Chief Executive (“CE”) is responsible for managing the Group’s various types of risks, approving detailed risk
management policies, and approving material risk exposures or transactions within his authority delegated by the Board
of Directors. The Head of Strategic Planning and Control Department (“SCD”) assists the CE in fulfilling his
responsibilities for the day-to-day management of risks. The Head of SCD is responsible for initiating new risk
management strategies, projects and measures that will enable the Group to better monitor and manage new risk issues
or areas that may arise from time to time from new businesses, products and changes in the operating environment. He
may also take appropriate initiatives in response to regulatory changes. The Head of SCD is also responsible for
reviewing material risk exposures or transactions within his delegated authority and exercising his power of veto if he
believes that any transaction should not proceed.
56
Notes to the Financial Statements (continued)
4. Financial risk management (continued)
Financial risk management framework (continued)
Various units of the Group have their respective risk management responsibilities. Business units act as the first line of
defence while risk management units, which are independent from the business units, are responsible for the day-to-day
management of different kinds of risks. Risk management units have the primary responsibilities for drafting, reviewing
and updating various risk management policies and procedures.
The Group has put in place appropriate internal control systems, including establishment of an organisation structure that
sets adequately clear lines of authority and responsibility for monitoring compliance with policies, procedures and limits.
Proper reporting lines also provide sufficient independence of the control functions from the business areas, as well as
adequate segregation of duties throughout the organisation which helps to promote an appropriate internal control
environment.
Product development
To ensure effective risk assessment and monitoring, the Group developed a comprehensive product development and
management framework, which clearly defines the roles and responsibilities of all related units, and the proper risk
assessment procedures for the product development process.
In accordance with the strategic objectives set by the Management, the respective product management units are
responsible for formulating business and product development plans which are aligned with the Group’s overall
strategies. Credit Risk Management Division (“CMD”), Compliance Section, Audit Division and Finance Division etc. are
accountable for risk assessment and review.
Apart from product development, the respective business units shall work closely with relevant risk evaluating
departments to identify and assess all the related risks. Based on the consideration of segregation of duties, risk
evaluating departments shall conduct independent review on risk management procedures and assessment results.
Products can only be launched after the risk management procedures are fulfilled and endorsed by all risk evaluating
departments.
57
Notes to the Financial Statements (continued)
4. Financial risk management (continued)
4.1 Credit Risk
Credit risk is the risk that a customer or counterparty will be unable to or unwilling to meet its obligation under a
contract. It arises principally from lending, trade finance, treasury business, and covers inter-bank transactions,
foreign exchange and derivative transactions as well as investments in bonds and securities.
Credit risk management framework
The Group has formulated a comprehensive set of credit risk management policies and procedures, and appropriate
credit risk limits to manage and control credit risk that may arise. These policies, procedures and credit risk limits
are regularly reviewed to cope with changes in market conditions and business strategies.
The Group’s organisation structure establishes a clear set of authority and responsibility for monitoring compliance
with policies, procedures and limits.
The Head of SCD is responsible for the management of credit risk and for the formulation of all credit policies and
procedures. Various units of the Group have their respective credit risk management responsibilities. Business
units act as the first line of defense while risk management units, which are independent from the business units, are
responsible for the day-to-day management of credit risks. CMD has the primary responsibility for drafting, reviewing
and updating credit risk management policies and procedures.
The Board of Directors delegates credit approval authority to the CE. The CE can further delegate to the
subordinates within his limit authorised by the Board of Directors. The Group sets the limits of credit approval
authority according to the transactions’ nature, customers’/counterparties’ creditworthiness, the level of transaction
risk, and the size of the credit exposure.
Credit risk measurement and control
In view of the rapidly changing market conditions, the Group has been continuously revisiting its lending strategies
and conducting rigorous reviews on the concerned portfolios.
Loans and advances
Different credit approval and control procedures are adopted according to the level of risk associated with the
customer, counterparty or transaction. Corporate and financial institution credit applications are independently
reviewed, objectively assessed and monitored by risk management units and credit rating models/scorecards are
used in the process of credit approval whenever they are applicable. A credit scoring system is used to process retail
credit transactions, including residential mortgage loans and personal loans.
58
Notes to the Financial Statements (continued)
4. Financial risk management (continued)
4.1 Credit Risk (continued)
Credit risk measurement and control (continued)
Loans and advances (continued)
CMD provides regular credit management information reports and ad hoc reports to the Board of Management, RC
and Board of Directors to facilitate their continuous monitoring of credit risk.
The Group identifies credit concentration risk by industry, geography, customer and counterparty risk, The Group
monitors changes to counterparties credit risk, quality of credit portfolio and risk concentrations, and reports regularly
to the Group’s management.
The Group’s internal loan grading system divides loans into 5 categories with reference to HKMA’s guidelines.
“Pass” represents loans where the borrower is current in meeting its repayment obligations and full repayment of
interest and principal is not in doubt.
“Special Mention” represents loans where the borrowers are experiencing difficulties which may threaten the Group’s
position. Ultimate loss is not expected at this stage but could occur if adverse conditions persist.
“Substandard” represents loans where the borrower displays a definable weakness that is likely to jeopardise
repayment.
“Doubtful” represents loans where collection in full is improbable and the Group expects to sustain a loss of principal
and/or interest, taking into account the net realisable value of the collateral.
“Loss” represents loans which are considered uncollectible after all collection options (such as the realisation of
collateral or the institution of legal proceedings) have been exhausted.
Debt securities and derivatives
For investment in debt securities, the external credit rating and assessment on credit quality of the underlying assets
are used for managing the credit risk involved. Credit limits are established on a customer and security issuer basis.
For derivatives, the Group sets customer limits to manage the credit risk involved and follows the same approval and
control processes as loans and advances. On-going monitoring procedures are established.
Settlement risk arises mainly from foreign exchange transactions with counterparties and also from derivatives in any
situation where a payment in cash, securities or equities is made in the expectation of a corresponding receipt in cash,
securities or equities. Daily settlement limits are established for each counterparty or customer to cover all settlement
risk arising from the Group’s market transactions on any single day.
59
Notes to the Financial Statements (continued)
4. Financial risk management (continued)
4.1 Credit Risk (continued)
Collateral held as security and other credit enhancements
The valuation and management of collateral have been documented in the policy covering acceptance criteria,
validity of collateral, loan-to-value ratio, haircut ratio, valuation and insurance, etc. The collateral is revalued on a
regular basis, though the frequency and the method used varies with the type of collateral involved and the nature
and the risk of the underlying credit. The Group has established a mechanism to update the value of its main type of
collateral, real properties, with the use of public indices on a portfolio basis. Collateral is insured with the Group as the
beneficiary. In the personal sector, the main types of collateral are real properties, cash deposits, securities and
investment funds. In the commercial and industrial sector, the main types of collateral are real properties, securities,
receivables, cash deposits and machinery.
For loans guaranteed by a third party guarantor, the Group will assess the guarantor’s financial condition, credit
history and ability to meet obligations.
As at 31 December 2009 and 2008, the Group did not hold any collateral permitted to sell or re-pledge in the absence
of default by the borrower.
Credit exposures
Maximum exposures to credit risk before collateral held or other credit enhancements of the Group are summarised
as follows:
2009 2008 HK$’000 HK$’000
Credit risk exposures relating to on-balance sheet assets are as follows: Balances with banks and other financial institutions 7,987,577 8,585,754Placements with banks and other financial institutions maturing between 1 and 12 months
5,525,376 8,721,608
Financial assets designated at fair value through profit or loss - debt securities 793,116 369,757Derivative financial instruments 349,936 385,945Advances and other accounts 18,582,368 15,908,861Investment in securities - debt securities - available-for-sale 1,088,402 287,385- debt securities - held-to-maturity 3,930,474 3,526,676- debt securities - loans and receivables 9 77,645Other assets 905,996 641,594
Credit risk exposures relating to off-balance sheet items are as follows: Letters of guarantee issued 1,487,757 925,729Loan commitment and other credit related liabilities 3,697,393 3,763,460
44,348,404 43,194,414
60
Notes to the Financial Statements (continued)
4. Financial risk management (continued)
4.1 Credit Risk (continued)
Credit exposures (continued)
The above tables represent a worst case scenario of credit risk exposure to the Group at 31 December 2009 and
2008, without taking account of any collateral held, master netting agreements or other credit enhancements attached.
For on-balance sheet assets, the exposures set out above are based on net carrying amounts. For letters of
guarantee issued, the maximum exposure to credit risk is the maximum amount that the Group could be required to
pay if the guarantees are called upon. For loan commitment and other credit related liabilities that are irrevocable over
the life of the respective facilities or revocable in the event of a significant adverse change, the maximum exposure to
credit risk is disclosed as the full amount of the committed facilities.
Gross loans and advances
Gross loans and advances before loan impairment allowances are summarised by product type as follows:
2009 2008 HK$’000 HK$’000
Advances to customers Personal
- Mortgages 3,166,469 2,763,231- Others 1,608,619 1,487,617
Corporate - Commercial loans 12,642,436 10,702,963- Trade finance 879,272 823,293
18,296,796 15,777,104 Trade bills 338,534 203,238 Total 18,635,330 15,980,342
Advances with a specific repayment date are classified as overdue when the principal or interest is past due and
remains unpaid. Advances repayable by regular instalments are classified as overdue when an instalment payment is
past due and remains unpaid. Advances repayable on demand are classified as overdue either when a demand for
repayment has been served on the borrower but repayment has not been made in accordance with the instruction or
when the advances have remained continuously outside the approved limit that was advised to the borrower.
A financial asset is impaired and impairment losses are incurred if, and only if, there is objective evidence of
impairment as a result of one or more events that occurred and that loss event(s) has an impact on the estimated
future cash flows of the financial asset that can be reliably estimated.
If there is objective evidence that an impairment loss on loans has been incurred, the amount of loss is measured as
the difference between the carrying amount and the present value of estimated future cash flows generated by the
financial asset. Objective evidence that a financial asset is impaired includes observable data that comes to the
attention of the holder of the asset about the loss events.
61
Notes to the Financial Statements (continued)
4. Financial risk management (continued)
4.1 Credit Risk (continued)
Gross loans and advances (continued)
The criteria that the Group uses to determine that there is objective evidence of an impairment loss include:
- Significant financial difficulty incurred by the borrower;
- A breach of contract, such as a default or delinquency in interest or principal payment;
- For economic or legal reasons related to the borrower’s financial difficulty, the Group has granted to the borrower a
concession that it would not otherwise consider;
- Probable that the borrower will become bankrupt or undergo other financial reorganisation; or
- Other observable data indicating that there is a measurable decrease in the estimated future cash flows from such
loans and advances.
(a) Advances neither overdue nor impaired
Advances that were neither overdue nor impaired are analysed by internal credit grades as follows:
2009
Pass
Special mention
Sub-Standard or below Total
HK$’000 HK$’000 HK$’000 HK$’000 Advances to customers Personal
- Mortgages 3,120,875 20,707 4,280 3,145,862- Others 1,547,825 54,857 395 1,603,077
Corporate - Commercial loans 12,226,482 287,719 1,574 12,515,775- Trade finance 781,027 93,083 - 874,110
17,676,209 456,366 6,249 18,138,824 Trade bills 321,955 16,579 - 338,534 Total 17,998,164 472,945 6,249 18,477,358
2008
Pass
Special mention
Sub-Standard or below Total
HK$’000 HK$’000 HK$’000 HK$’000 Advances to customers Personal
- Mortgages 2,715,581 14,170 2,809 2,732,560- Others 1,424,976 37,651 12 1,462,639
Corporate - Commercial loans 10,044,260 571,424 - 10,615,684- Trade finance 755,058 48,600 - 803,658
14,939,875 671,845 2,821 15,614,541 Trade bills 137,793 65,445 - 203,238 Total 15,077,668 737,290 2,821 15,817,779
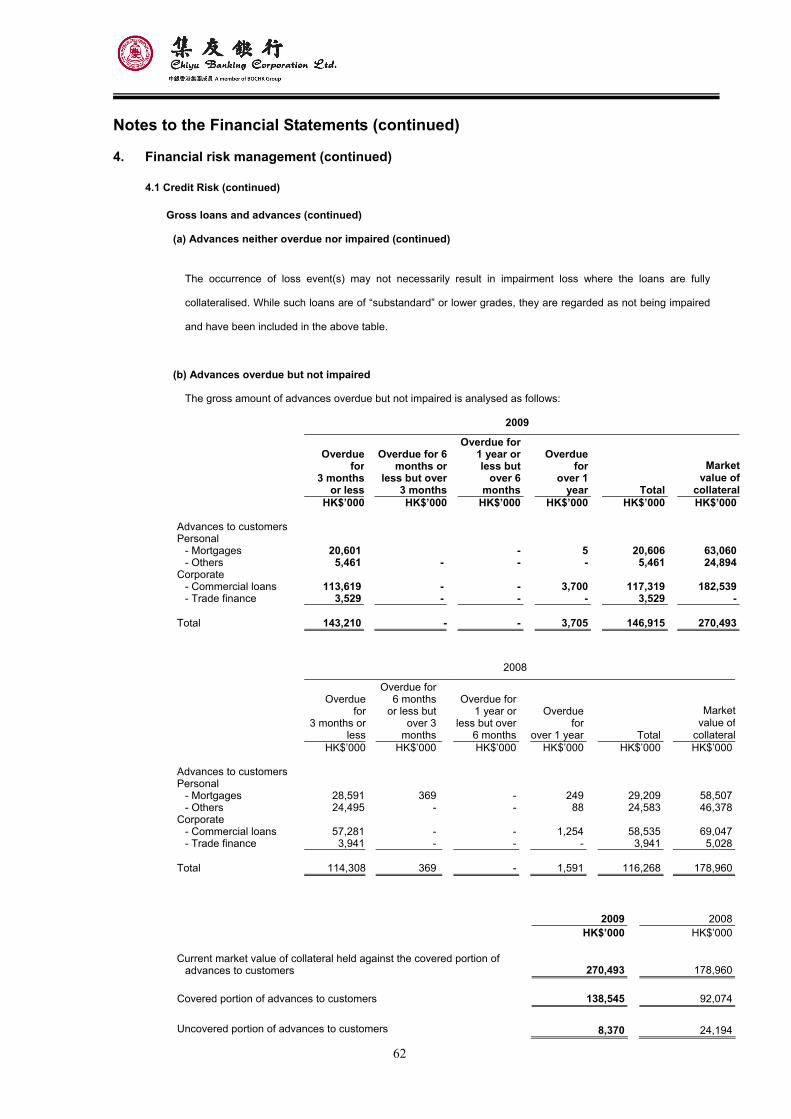
62
Notes to the Financial Statements (continued)
4. Financial risk management (continued)
4.1 Credit Risk (continued)
Gross loans and advances (continued)
(a) Advances neither overdue nor impaired (continued)
The occurrence of loss event(s) may not necessarily result in impairment loss where the loans are fully
collateralised. While such loans are of “substandard” or lower grades, they are regarded as not being impaired
and have been included in the above table.
(b) Advances overdue but not impaired
The gross amount of advances overdue but not impaired is analysed as follows:
2009
Overdue
for3 months
or less
Overdue for 6 months or
less but over 3 months
Overdue for 1 year or less but
over 6 months
Overdue for
over 1 year Total
Market value of
collateral HK$’000 HK$’000 HK$’000 HK$’000 HK$’000 HK$’000
Advances to customers Personal
- Mortgages 20,601 - 5 20,606 63,060- Others 5,461 - - - 5,461 24,894
Corporate - Commercial loans 113,619 - - 3,700 117,319 182,539- Trade finance 3,529 - - - 3,529 -
Total 143,210 - - 3,705 146,915 270,493
2008
Overdue
for3 months or
less
Overdue for6 months
or less but over 3
months
Overdue for 1 year or
less but over 6 months
Overdue for
over 1 year Total
Market value of
collateral HK$’000 HK$’000 HK$’000 HK$’000 HK$’000 HK$’000
Advances to customers Personal
- Mortgages 28,591 369 - 249 29,209 58,507- Others 24,495 - - 88 24,583 46,378
Corporate - Commercial loans 57,281 - - 1,254 58,535 69,047- Trade finance 3,941 - - - 3,941 5,028
Total 114,308 369 - 1,591 116,268 178,960
2009 2008 HK$’000 HK$’000
Current market value of collateral held against the covered portion of
advances to customers 270,493 178,960 Covered portion of advances to customers 138,545 92,074 Uncovered portion of advances to customers 8,370 24,194
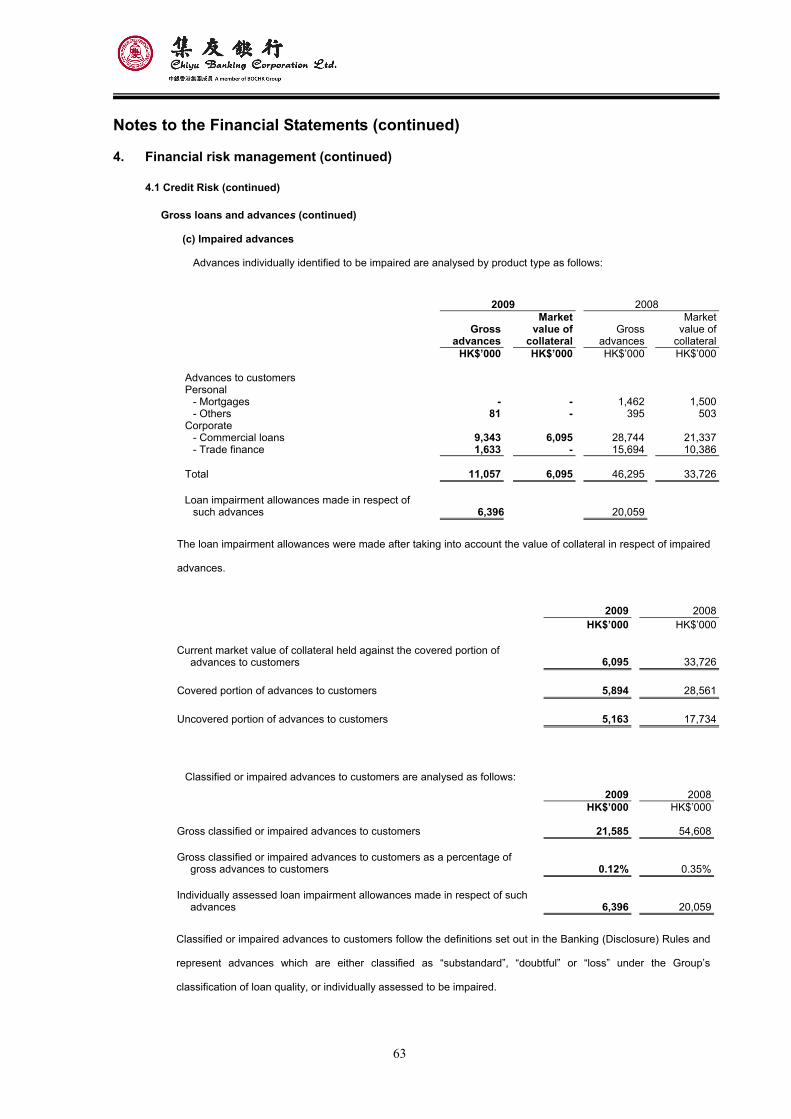
63
Notes to the Financial Statements (continued)
4. Financial risk management (continued)
4.1 Credit Risk (continued)
Gross loans and advances (continued)
(c) Impaired advances
Advances individually identified to be impaired are analysed by product type as follows:
2009 2008
Grossadvances
Market value of
collateral Gross
advances
Marketvalue of
collateral HK$’000 HK$’000 HK$’000 HK$’000 Advances to customers Personal
- Mortgages - - 1,462 1,500- Others 81 - 395 503
Corporate - Commercial loans 9,343 6,095 28,744 21,337- Trade finance 1,633 - 15,694 10,386
Total 11,057 6,095 46,295 33,726 Loan impairment allowances made in respect of
such advances 6,396 20,059
The loan impairment allowances were made after taking into account the value of collateral in respect of impaired
advances.
2009 2008 HK$’000 HK$’000
Current market value of collateral held against the covered portion of
advances to customers 6,095 33,726 Covered portion of advances to customers 5,894 28,561 Uncovered portion of advances to customers 5,163 17,734
Classified or impaired advances to customers are analysed as follows:
2009 2008HK$’000 HK$’000
Gross classified or impaired advances to customers 21,585 54,608 Gross classified or impaired advances to customers as a percentage of
gross advances to customers 0.12% 0.35% Individually assessed loan impairment allowances made in respect of such
advances 6,396 20,059
Classified or impaired advances to customers follow the definitions set out in the Banking (Disclosure) Rules and
represent advances which are either classified as “substandard”, “doubtful” or “loss” under the Group’s
classification of loan quality, or individually assessed to be impaired.
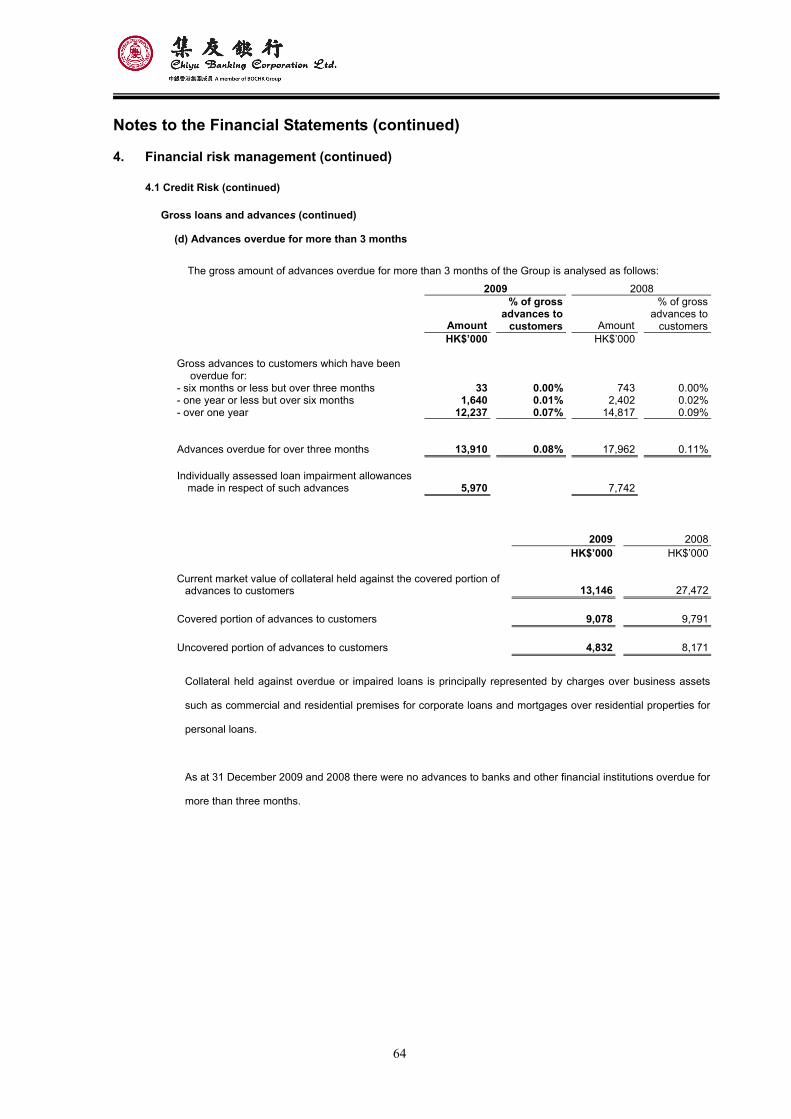
64
Notes to the Financial Statements (continued)
4. Financial risk management (continued)
4.1 Credit Risk (continued)
Gross loans and advances (continued)
(d) Advances overdue for more than 3 months
The gross amount of advances overdue for more than 3 months of the Group is analysed as follows:
2009 2008
Amount
% of gross advances to
customers Amount
% of gross advances to
customers HK$’000 HK$’000 Gross advances to customers which have been
overdue for:
- six months or less but over three months 33 0.00% 743 0.00%- one year or less but over six months 1,640 0.01% 2,402 0.02%- over one year 12,237 0.07% 14,817 0.09%
Advances overdue for over three months 13,910 0.08% 17,962 0.11% Individually assessed loan impairment allowances
made in respect of such advances 5,970 7,742
2009 2008 HK$’000 HK$’000
Current market value of collateral held against the covered portion of
advances to customers 13,146 27,472 Covered portion of advances to customers 9,078 9,791 Uncovered portion of advances to customers 4,832 8,171
Collateral held against overdue or impaired loans is principally represented by charges over business assets
such as commercial and residential premises for corporate loans and mortgages over residential properties for
personal loans.
As at 31 December 2009 and 2008 there were no advances to banks and other financial institutions overdue for
more than three months.
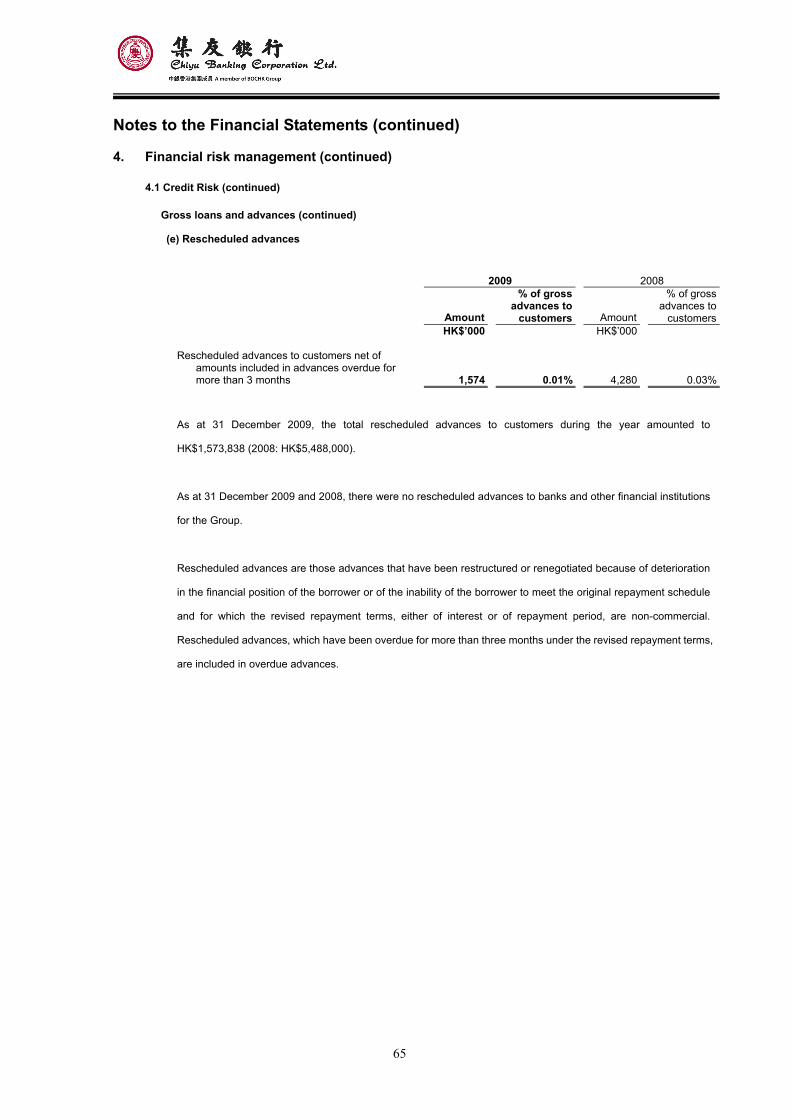
65
Notes to the Financial Statements (continued)
4. Financial risk management (continued)
4.1 Credit Risk (continued)
Gross loans and advances (continued)
(e) Rescheduled advances
2009 2008
Amount
% of gross advances to
customers
Amount
% of gross advances to
customers HK$’000 HK$’000 Rescheduled advances to customers net of
amounts included in advances overdue for more than 3 months 1,574
0.01%
4,280
0.03%
As at 31 December 2009, the total rescheduled advances to customers during the year amounted to
HK$1,573,838 (2008: HK$5,488,000).
As at 31 December 2009 and 2008, there were no rescheduled advances to banks and other financial institutions
for the Group.
Rescheduled advances are those advances that have been restructured or renegotiated because of deterioration
in the financial position of the borrower or of the inability of the borrower to meet the original repayment schedule
and for which the revised repayment terms, either of interest or of repayment period, are non-commercial.
Rescheduled advances, which have been overdue for more than three months under the revised repayment terms,
are included in overdue advances.
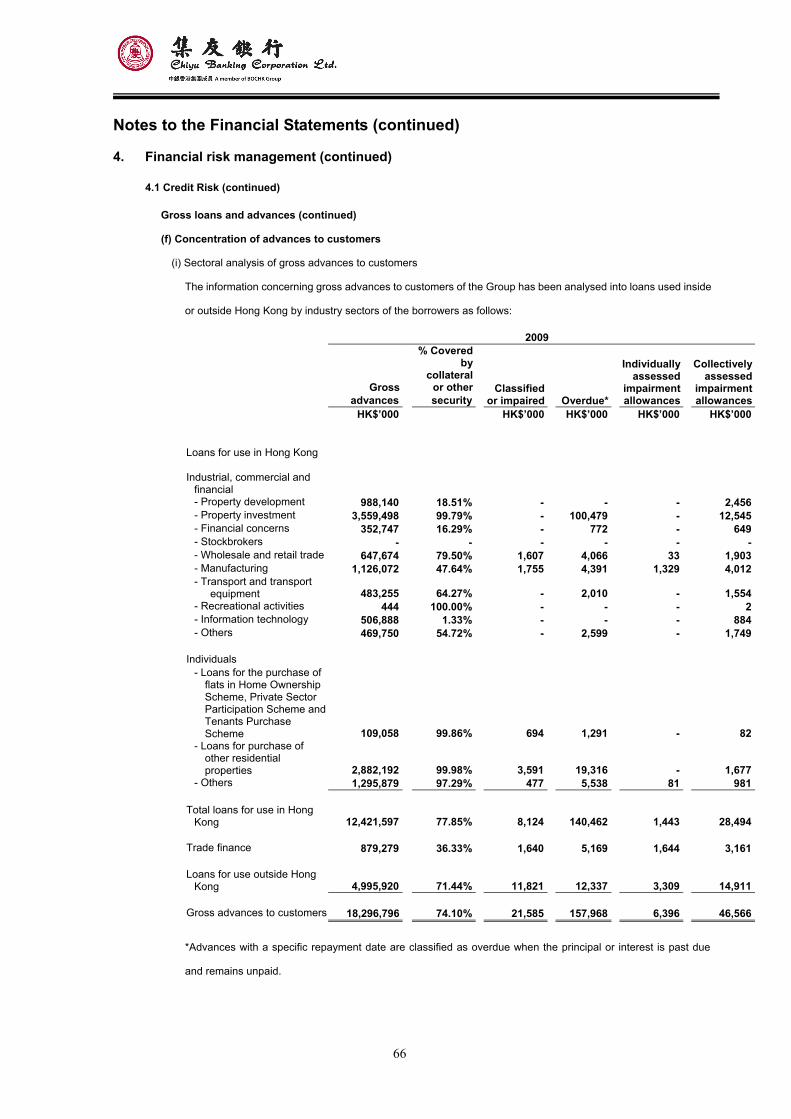
66
Notes to the Financial Statements (continued)
4. Financial risk management (continued)
4.1 Credit Risk (continued)
Gross loans and advances (continued)
(f) Concentration of advances to customers
(i) Sectoral analysis of gross advances to customers
The information concerning gross advances to customers of the Group has been analysed into loans used inside
or outside Hong Kong by industry sectors of the borrowers as follows:
2009
Grossadvances
% Coveredby
collateralor othersecurity
Classifiedor impaired Overdue*
Individuallyassessed
impairment allowances
Collectivelyassessed
impairment allowances
HK$’000 HK$’000 HK$’000 HK$’000 HK$’000
Loans for use in Hong Kong
Industrial, commercial and
financial - Property development 988,140 18.51% - - - 2,456- Property investment 3,559,498 99.79% - 100,479 - 12,545- Financial concerns 352,747 16.29% - 772 - 649- Stockbrokers - - - - - -- Wholesale and retail trade 647,674 79.50% 1,607 4,066 33 1,903- Manufacturing 1,126,072 47.64% 1,755 4,391 1,329 4,012- Transport and transport
equipment 483,255 64.27% - 2,010 - 1,554- Recreational activities 444 100.00% - - - 2- Information technology 506,888 1.33% - - - 884- Others 469,750 54.72% - 2,599 - 1,749
Individuals
- Loans for the purchase of flats in Home Ownership Scheme, Private Sector Participation Scheme and Tenants Purchase Scheme 109,058 99.86% 694 1,291 - 82
- Loans for purchase of other residential properties 2,882,192 99.98% 3,591 19,316 - 1,677
- Others 1,295,879 97.29% 477 5,538 81 981 Total loans for use in Hong
Kong 12,421,597 77.85% 8,124 140,462 1,443 28,494 Trade finance 879,279 36.33% 1,640 5,169 1,644 3,161
Loans for use outside Hong
Kong 4,995,920 71.44% 11,821 12,337 3,309 14,911 Gross advances to customers 18,296,796 74.10% 21,585 157,968 6,396 46,566
*Advances with a specific repayment date are classified as overdue when the principal or interest is past due
and remains unpaid.
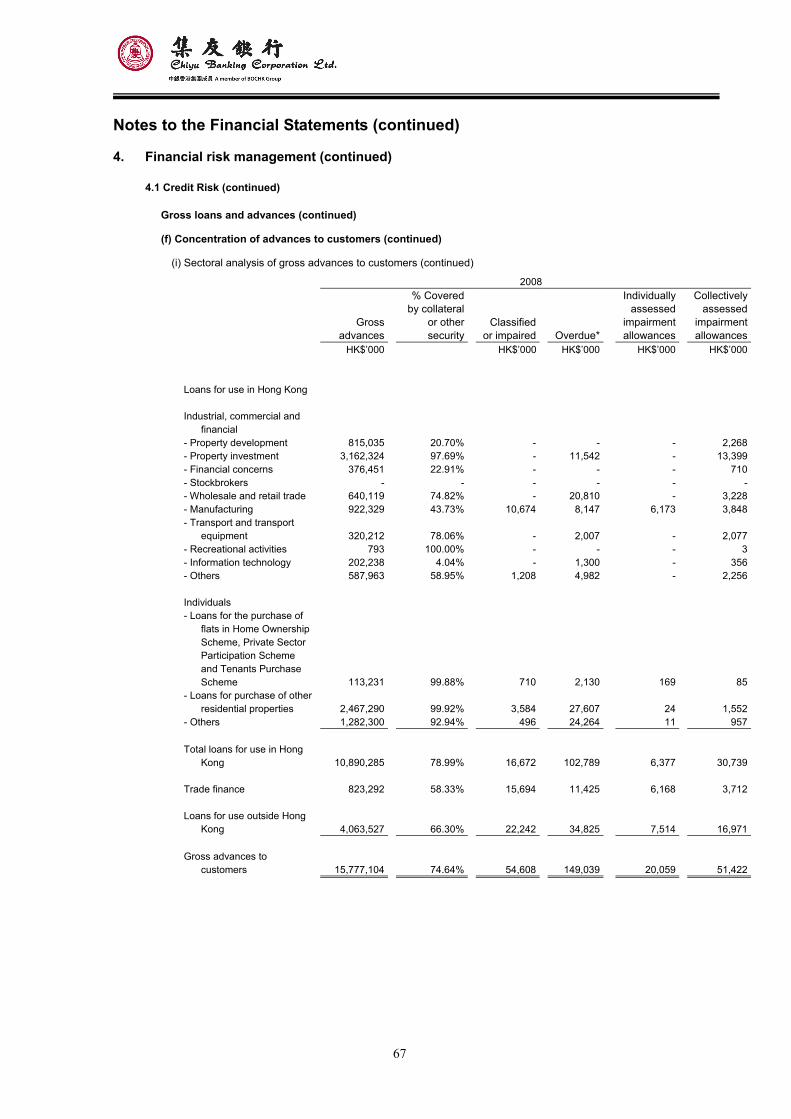
67
Notes to the Financial Statements (continued)
4. Financial risk management (continued)
4.1 Credit Risk (continued)
Gross loans and advances (continued)
(f) Concentration of advances to customers (continued)
(i) Sectoral analysis of gross advances to customers (continued)
2008
Grossadvances
% Coveredby collateral
or othersecurity
Classifiedor impaired Overdue*
Individuallyassessed
impairment allowances
Collectivelyassessed
impairment allowances
HK$’000 HK$’000 HK$’000 HK$’000 HK$’000 Loans for use in Hong Kong Industrial, commercial and
financial - Property development 815,035 20.70% - - - 2,268- Property investment 3,162,324 97.69% - 11,542 - 13,399- Financial concerns 376,451 22.91% - - - 710- Stockbrokers - - - - - -- Wholesale and retail trade 640,119 74.82% - 20,810 - 3,228- Manufacturing 922,329 43.73% 10,674 8,147 6,173 3,848- Transport and transport
equipment 320,212 78.06% - 2,007 - 2,077- Recreational activities 793 100.00% - - - 3- Information technology 202,238 4.04% - 1,300 - 356- Others 587,963 58.95% 1,208 4,982 - 2,256 Individuals - Loans for the purchase of
flats in Home Ownership Scheme, Private Sector Participation Scheme and Tenants Purchase Scheme 113,231 99.88% 710 2,130 169 85
- Loans for purchase of other residential properties 2,467,290 99.92% 3,584 27,607 24 1,552
- Others 1,282,300 92.94% 496 24,264 11 957 Total loans for use in Hong
Kong 10,890,285 78.99% 16,672 102,789 6,377 30,739 Trade finance 823,292 58.33% 15,694 11,425 6,168 3,712 Loans for use outside Hong
Kong 4,063,527 66.30% 22,242 34,825 7,514 16,971 Gross advances to
customers 15,777,104 74.64% 54,608 149,039 20,059 51,422
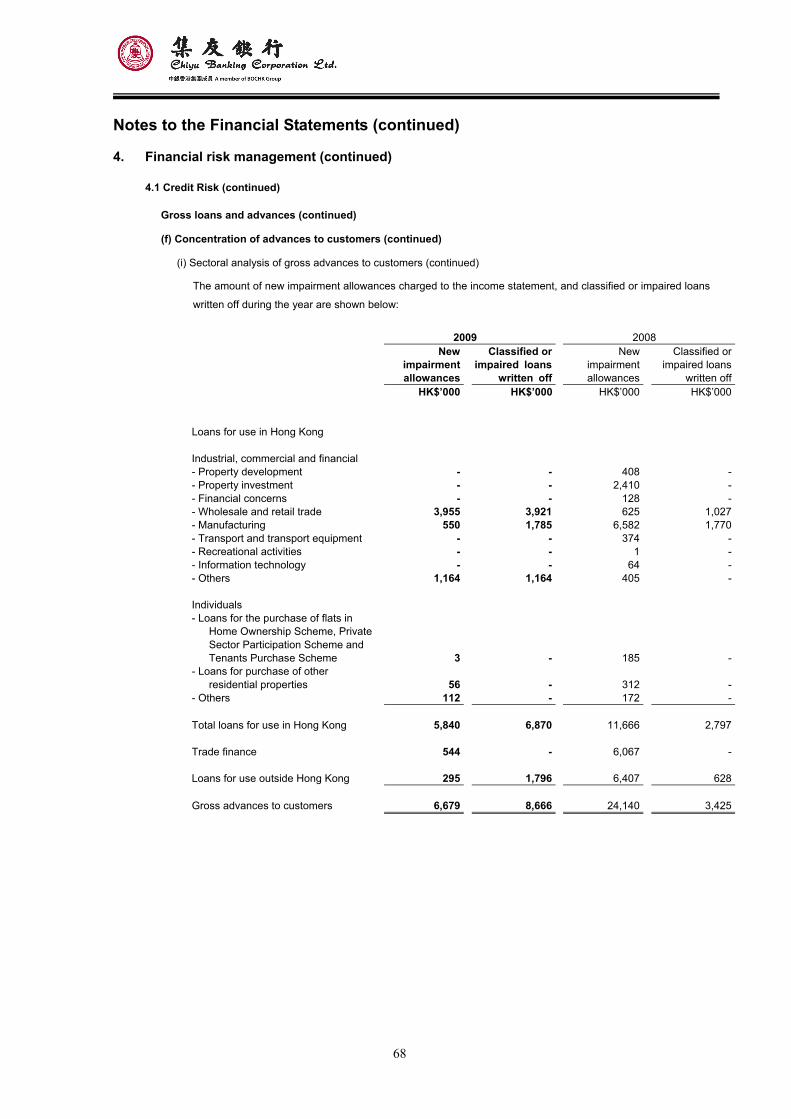
68
Notes to the Financial Statements (continued)
4. Financial risk management (continued)
4.1 Credit Risk (continued)
Gross loans and advances (continued)
(f) Concentration of advances to customers (continued)
(i) Sectoral analysis of gross advances to customers (continued)
The amount of new impairment allowances charged to the income statement, and classified or impaired loans
written off during the year are shown below:
2009 2008 New
impairmentallowances
Classified orimpaired loans
written off
New impairment allowances
Classified orimpaired loans
written off HK$’000 HK$’000 HK$’000 HK$’000 Loans for use in Hong Kong Industrial, commercial and financial - Property development - - 408 -- Property investment - - 2,410 -- Financial concerns - - 128 -- Wholesale and retail trade 3,955 3,921 625 1,027- Manufacturing 550 1,785 6,582 1,770- Transport and transport equipment - - 374 -- Recreational activities - - 1 -- Information technology - - 64 -- Others 1,164 1,164 405 - Individuals - Loans for the purchase of flats in
Home Ownership Scheme, Private Sector Participation Scheme and Tenants Purchase Scheme 3 - 185 -
- Loans for purchase of other residential properties 56 - 312 -
- Others 112 - 172 - Total loans for use in Hong Kong 5,840 6,870 11,666 2,797 Trade finance 544 - 6,067 - Loans for use outside Hong Kong 295 1,796 6,407 628 Gross advances to customers 6,679 8,666 24,140 3,425
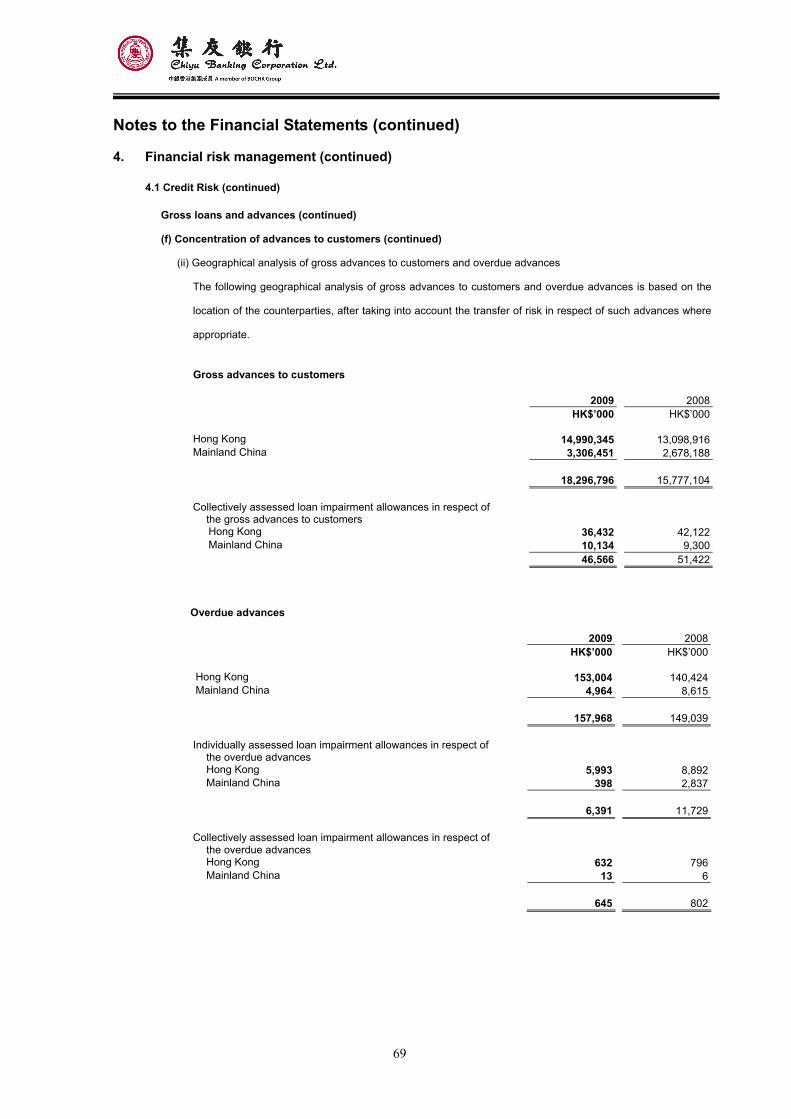
69
Notes to the Financial Statements (continued)
4. Financial risk management (continued)
4.1 Credit Risk (continued)
Gross loans and advances (continued)
(f) Concentration of advances to customers (continued)
(ii) Geographical analysis of gross advances to customers and overdue advances
The following geographical analysis of gross advances to customers and overdue advances is based on the
location of the counterparties, after taking into account the transfer of risk in respect of such advances where
appropriate.
Gross advances to customers
2009 2008 HK$’000 HK$’000 Hong Kong 14,990,345 13,098,916Mainland China 3,306,451 2,678,188
18,296,796 15,777,104 Collectively assessed loan impairment allowances in respect of
the gross advances to customers
Hong Kong 36,432 42,122Mainland China 10,134 9,300
46,566 51,422
Overdue advances
2009 2008 HK$’000 HK$’000
Hong Kong 153,004 140,424Mainland China 4,964 8,615
157,968 149,039
Individually assessed loan impairment allowances in respect of the overdue advances
Hong Kong 5,993 8,892Mainland China 398 2,837
6,391 11,729
Collectively assessed loan impairment allowances in respect of the overdue advances
Hong Kong 632 796Mainland China 13 6
645 802
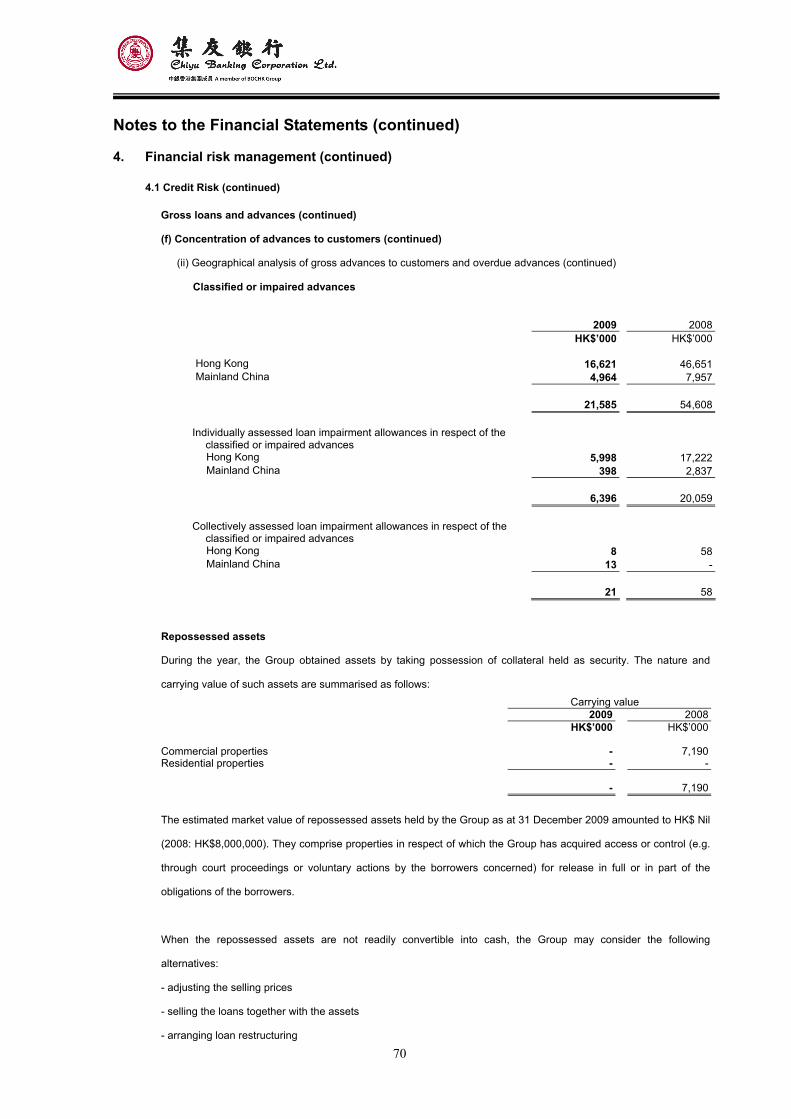
70
Notes to the Financial Statements (continued)
4. Financial risk management (continued)
4.1 Credit Risk (continued)
Gross loans and advances (continued)
(f) Concentration of advances to customers (continued)
(ii) Geographical analysis of gross advances to customers and overdue advances (continued)
Classified or impaired advances
2009 2008 HK$’000 HK$’000
Hong Kong 16,621 46,651Mainland China 4,964 7,957
21,585 54,608
Individually assessed loan impairment allowances in respect of the classified or impaired advances
Hong Kong 5,998 17,222Mainland China 398 2,837
6,396 20,059
Collectively assessed loan impairment allowances in respect of the classified or impaired advances
Hong Kong 8 58Mainland China 13 -
21 58
Repossessed assets
During the year, the Group obtained assets by taking possession of collateral held as security. The nature and
carrying value of such assets are summarised as follows:
Carrying value 2009 2008 HK$’000 HK$’000
Commercial properties - 7,190Residential properties - - - 7,190
The estimated market value of repossessed assets held by the Group as at 31 December 2009 amounted to HK$ Nil
(2008: HK$8,000,000). They comprise properties in respect of which the Group has acquired access or control (e.g.
through court proceedings or voluntary actions by the borrowers concerned) for release in full or in part of the
obligations of the borrowers.
When the repossessed assets are not readily convertible into cash, the Group may consider the following
alternatives:
- adjusting the selling prices
- selling the loans together with the assets
- arranging loan restructuring
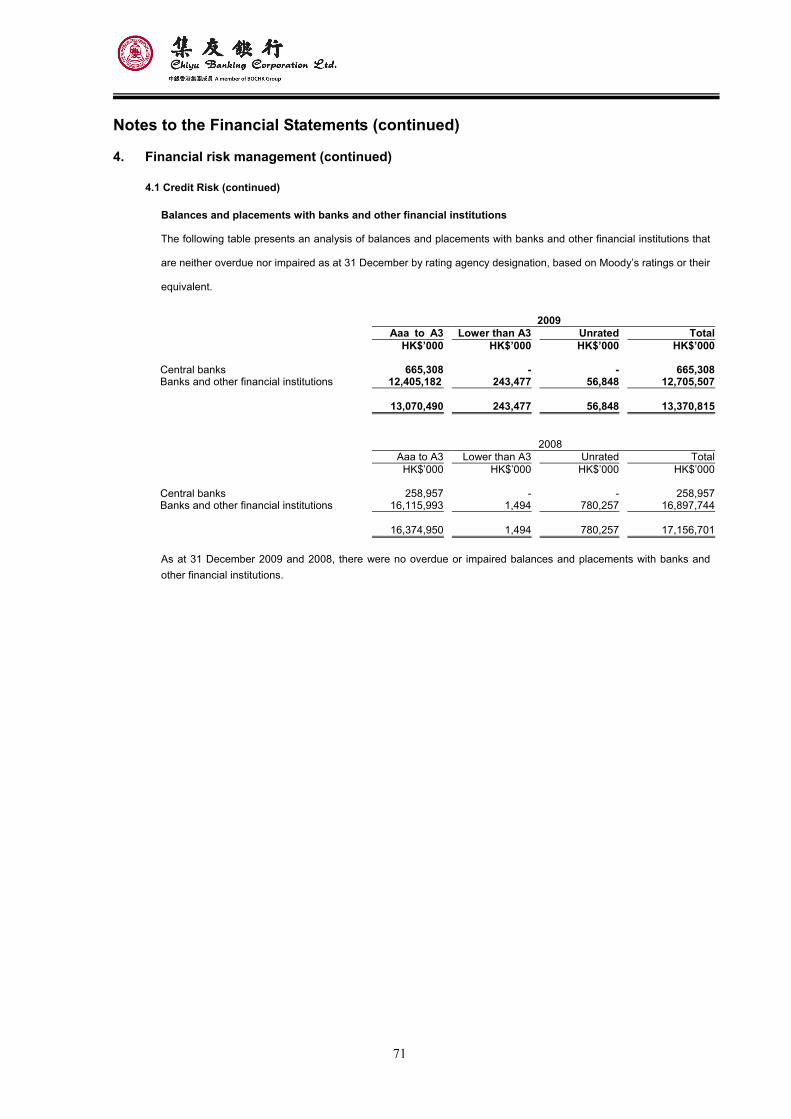
71
Notes to the Financial Statements (continued)
4. Financial risk management (continued)
4.1 Credit Risk (continued)
Balances and placements with banks and other financial institutions
The following table presents an analysis of balances and placements with banks and other financial institutions that
are neither overdue nor impaired as at 31 December by rating agency designation, based on Moody’s ratings or their
equivalent.
2009 Aaa to A3 Lower than A3 Unrated Total
HK$’000 HK$’000 HK$’000 HK$’000 Central banks 665,308 - - 665,308Banks and other financial institutions 12,405,182 243,477 56,848 12,705,507 13,070,490 243,477 56,848 13,370,815 2008 Aaa to A3 Lower than A3 Unrated Total HK$’000 HK$’000 HK$’000 HK$’000 Central banks 258,957 - - 258,957Banks and other financial institutions 16,115,993 1,494 780,257 16,897,744
16,374,950 1,494 780,257 17,156,701 As at 31 December 2009 and 2008, there were no overdue or impaired balances and placements with banks and other financial institutions.
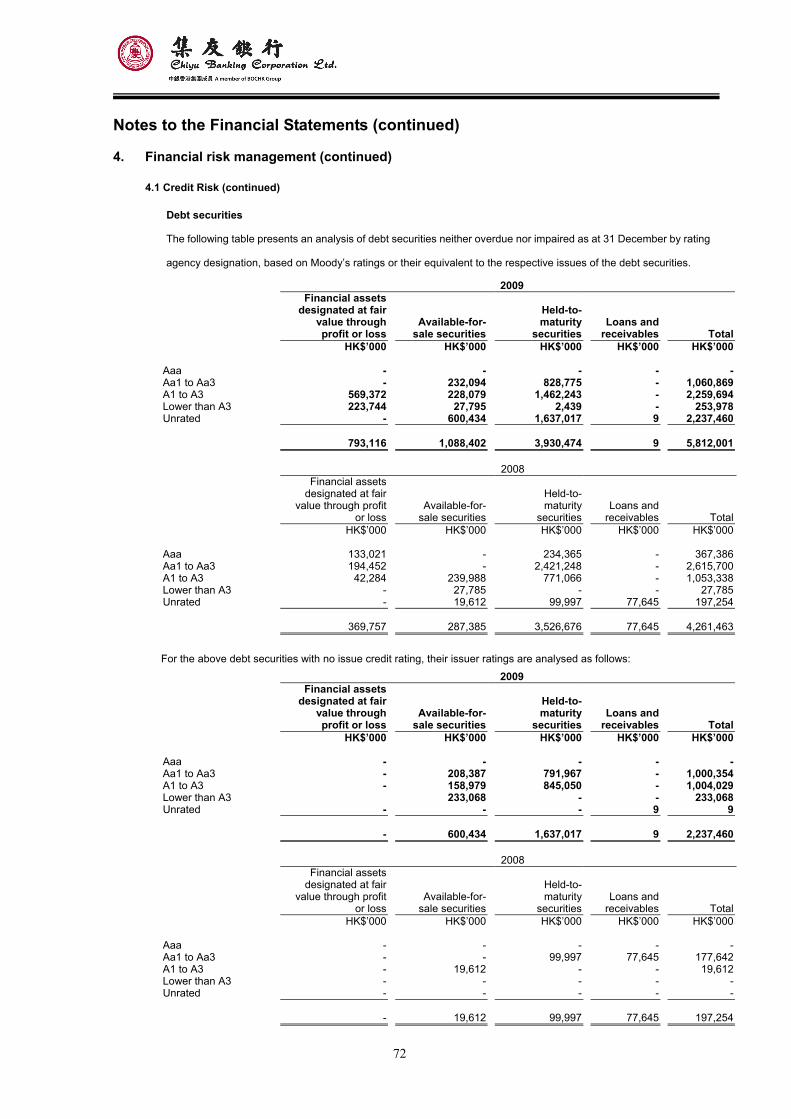
72
Notes to the Financial Statements (continued)
4. Financial risk management (continued)
4.1 Credit Risk (continued)
Debt securities
The following table presents an analysis of debt securities neither overdue nor impaired as at 31 December by rating
agency designation, based on Moody’s ratings or their equivalent to the respective issues of the debt securities.
2009
Financial assets designated at fair
value through profit or loss
Available-for-sale securities
Held-to- maturity
securities Loans and
receivables Total HK$’000 HK$’000 HK$’000 HK$’000 HK$’000 Aaa - - - - -Aa1 to Aa3 - 232,094 828,775 - 1,060,869 A1 to A3 569,372 228,079 1,462,243 - 2,259,694 Lower than A3 223,744 27,795 2,439 - 253,978 Unrated - 600,434 1,637,017 9 2,237,460 793,116 1,088,402 3,930,474 9 5,812,001 2008
Financial assets designated at fair
value through profit or loss
Available-for-sale securities
Held-to- maturity
securities Loans and
receivables Total HK$’000 HK$’000 HK$’000 HK$’000 HK$’000 Aaa 133,021 - 234,365 - 367,386Aa1 to Aa3 194,452 - 2,421,248 - 2,615,700A1 to A3 42,284 239,988 771,066 - 1,053,338Lower than A3 - 27,785 - - 27,785Unrated - 19,612 99,997 77,645 197,254 369,757 287,385 3,526,676 77,645 4,261,463
For the above debt securities with no issue credit rating, their issuer ratings are analysed as follows:
2009
Financial assets designated at fair
value through profit or loss
Available-for-sale securities
Held-to- maturity
securities Loans and
receivables Total HK$’000 HK$’000 HK$’000 HK$’000 HK$’000 Aaa - - - - -Aa1 to Aa3 - 208,387 791,967 - 1,000,354 A1 to A3 - 158,979 845,050 - 1,004,029 Lower than A3 233,068 - - 233,068 Unrated - - - 9 9 - 600,434 1,637,017 9 2,237,460 2008
Financial assets designated at fair
value through profit or loss
Available-for-sale securities
Held-to- maturity
securities Loans and
receivables Total HK$’000 HK$’000 HK$’000 HK$’000 HK$’000 Aaa - - - - -Aa1 to Aa3 - - 99,997 77,645 177,642A1 to A3 - 19,612 - - 19,612Lower than A3 - - - - -Unrated - - - - - - 19,612 99,997 77,645 197,254
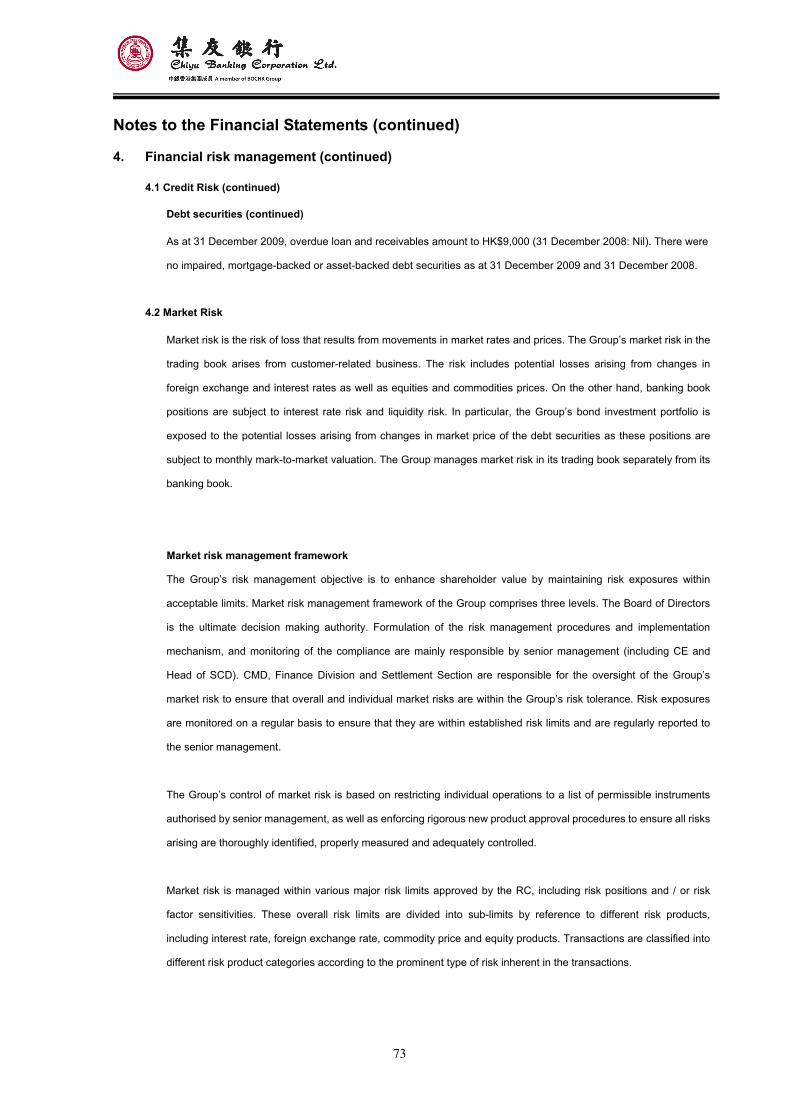
73
Notes to the Financial Statements (continued)
4. Financial risk management (continued)
4.1 Credit Risk (continued)
Debt securities (continued)
As at 31 December 2009, overdue loan and receivables amount to HK$9,000 (31 December 2008: Nil). There were
no impaired, mortgage-backed or asset-backed debt securities as at 31 December 2009 and 31 December 2008.
4.2 Market Risk
Market risk is the risk of loss that results from movements in market rates and prices. The Group’s market risk in the
trading book arises from customer-related business. The risk includes potential losses arising from changes in
foreign exchange and interest rates as well as equities and commodities prices. On the other hand, banking book
positions are subject to interest rate risk and liquidity risk. In particular, the Group’s bond investment portfolio is
exposed to the potential losses arising from changes in market price of the debt securities as these positions are
subject to monthly mark-to-market valuation. The Group manages market risk in its trading book separately from its
banking book.
Market risk management framework
The Group’s risk management objective is to enhance shareholder value by maintaining risk exposures within
acceptable limits. Market risk management framework of the Group comprises three levels. The Board of Directors
is the ultimate decision making authority. Formulation of the risk management procedures and implementation
mechanism, and monitoring of the compliance are mainly responsible by senior management (including CE and
Head of SCD). CMD, Finance Division and Settlement Section are responsible for the oversight of the Group’s
market risk to ensure that overall and individual market risks are within the Group’s risk tolerance. Risk exposures
are monitored on a regular basis to ensure that they are within established risk limits and are regularly reported to
the senior management.
The Group’s control of market risk is based on restricting individual operations to a list of permissible instruments
authorised by senior management, as well as enforcing rigorous new product approval procedures to ensure all risks
arising are thoroughly identified, properly measured and adequately controlled.
Market risk is managed within various major risk limits approved by the RC, including risk positions and / or risk
factor sensitivities. These overall risk limits are divided into sub-limits by reference to different risk products,
including interest rate, foreign exchange rate, commodity price and equity products. Transactions are classified into
different risk product categories according to the prominent type of risk inherent in the transactions.
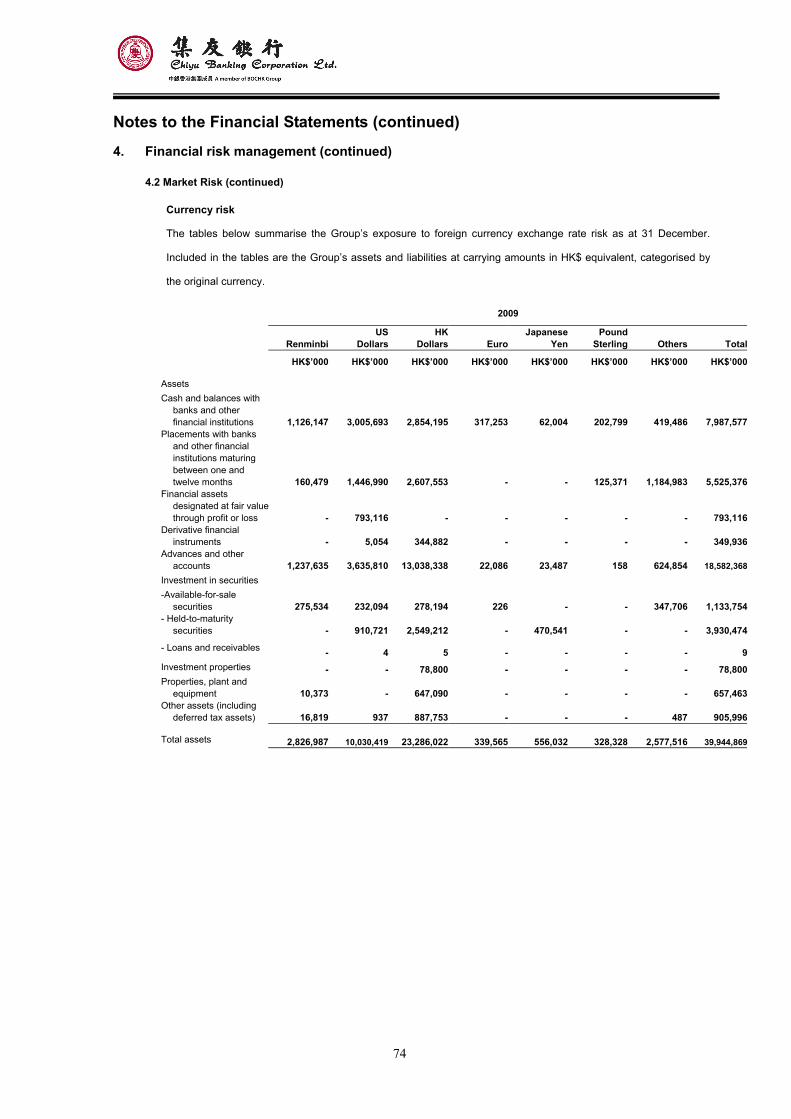
74
Notes to the Financial Statements (continued)
4. Financial risk management (continued)
4.2 Market Risk (continued)
Currency risk The tables below summarise the Group’s exposure to foreign currency exchange rate risk as at 31 December.
Included in the tables are the Group’s assets and liabilities at carrying amounts in HK$ equivalent, categorised by
the original currency.
2009
RenminbiUS
DollarsHK
Dollars EuroJapanese
YenPound
Sterling Others Total HK$’000 HK$’000 HK$’000 HK$’000 HK$’000 HK$’000 HK$’000 HK$’000
Assets Cash and balances with
banks and other financial institutions 1,126,147 3,005,693 2,854,195 317,253 62,004 202,799 419,486 7,987,577
Placements with banks and other financial institutions maturing between one and twelve months 160,479 1,446,990 2,607,553 - - 125,371 1,184,983 5,525,376
Financial assets designated at fair valuethrough profit or loss - 793,116 - - - - - 793,116
Derivative financial instruments - 5,054 344,882 - - - - 349,936
Advances and other accounts 1,237,635 3,635,810 13,038,338 22,086 23,487 158 624,854 18,582,368
Investment in securities -Available-for-sale
securities 275,534 232,094 278,194 226 - - 347,706 1,133,754- Held-to-maturity
securities - 910,721 2,549,212 - 470,541 - - 3,930,474
- Loans and receivables - 4 5 - - - - 9Investment properties - - 78,800 - - - - 78,800Properties, plant and
equipment 10,373 - 647,090 - - - - 657,463Other assets (including
deferred tax assets) 16,819 937 887,753 - - - 487 905,996
Total assets 2,826,987 10,030,419 23,286,022 339,565 556,032 328,328 2,577,516 39,944,869
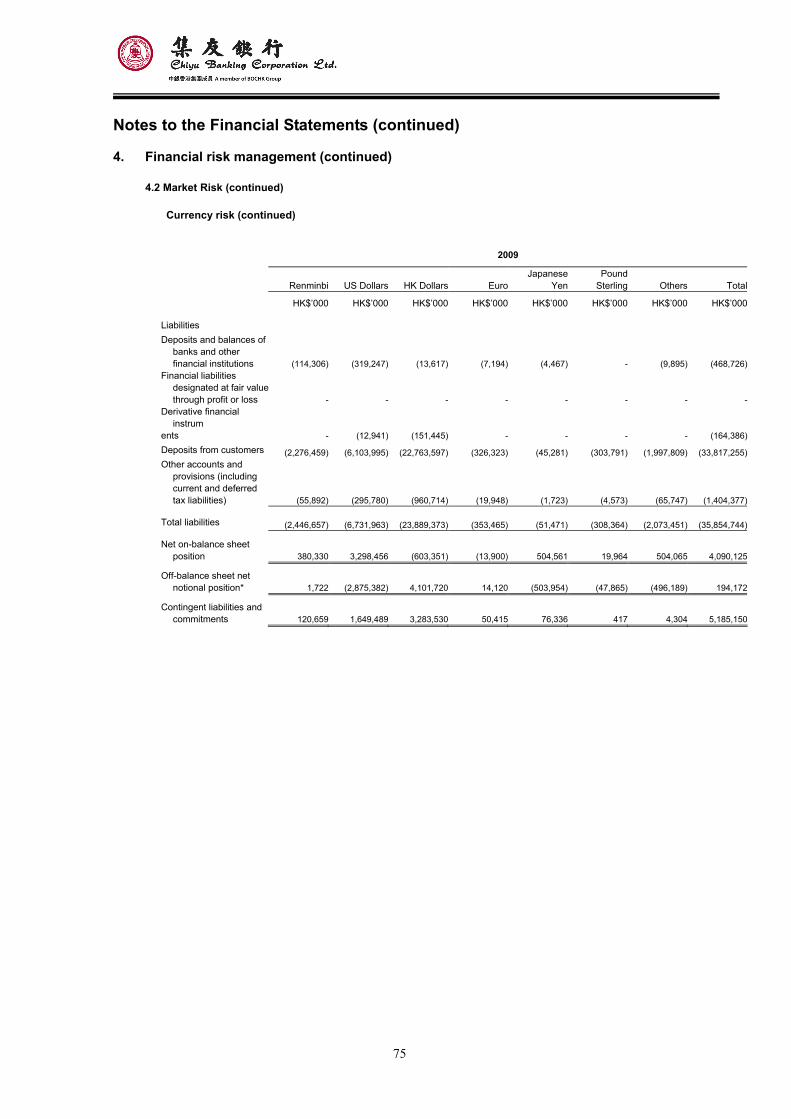
75
Notes to the Financial Statements (continued)
4. Financial risk management (continued)
4.2 Market Risk (continued)
Currency risk (continued)
2009
Renminbi US Dollars HK Dollars EuroJapanese
YenPound
Sterling Others Total HK$’000 HK$’000 HK$’000 HK$’000 HK$’000 HK$’000 HK$’000 HK$’000
Liabilities Deposits and balances of
banks and other financial institutions (114,306) (319,247) (13,617) (7,194) (4,467) - (9,895) (468,726)
Financial liabilities designated at fair valuethrough profit or loss - - - - - - - -
Derivative financial instrum
ents - (12,941) (151,445) - - - - (164,386)
Deposits from customers (2,276,459) (6,103,995) (22,763,597) (326,323) (45,281) (303,791) (1,997,809) (33,817,255)Other accounts and
provisions (including current and deferred tax liabilities) (55,892) (295,780) (960,714) (19,948) (1,723) (4,573) (65,747) (1,404,377)
Total liabilities (2,446,657) (6,731,963) (23,889,373) (353,465) (51,471) (308,364) (2,073,451) (35,854,744)
Net on-balance sheet position 380,330 3,298,456 (603,351) (13,900) 504,561 19,964 504,065 4,090,125
Off-balance sheet net notional position* 1,722 (2,875,382) 4,101,720 14,120 (503,954) (47,865) (496,189) 194,172
Contingent liabilities and commitments 120,659 1,649,489 3,283,530 50,415 76,336 417 4,304 5,185,150
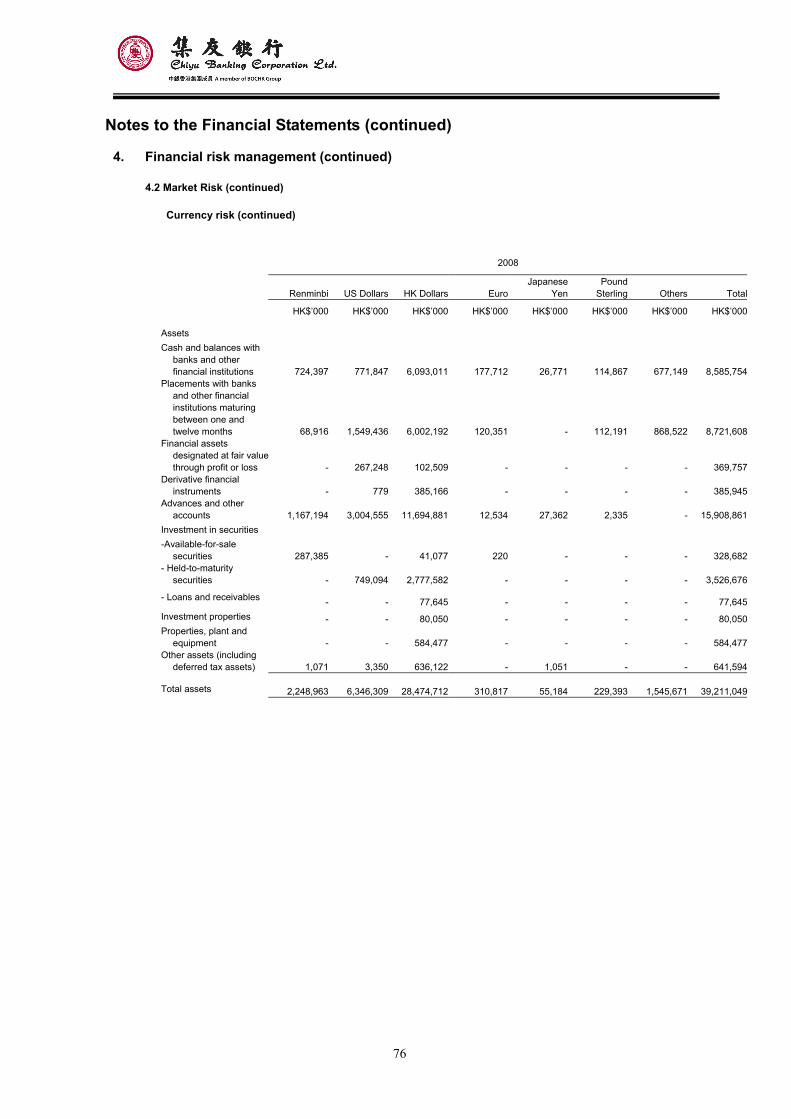
76
Notes to the Financial Statements (continued)
4. Financial risk management (continued)
4.2 Market Risk (continued)
Currency risk (continued)
2008
Renminbi US Dollars HK Dollars EuroJapanese
YenPound
Sterling Others Total HK$’000 HK$’000 HK$’000 HK$’000 HK$’000 HK$’000 HK$’000 HK$’000
Assets Cash and balances with
banks and other financial institutions 724,397 771,847 6,093,011 177,712 26,771 114,867 677,149 8,585,754
Placements with banks and other financial institutions maturing between one and twelve months 68,916 1,549,436 6,002,192 120,351 - 112,191 868,522 8,721,608
Financial assets designated at fair valuethrough profit or loss - 267,248 102,509 - - - - 369,757
Derivative financial instruments - 779 385,166 - - - - 385,945
Advances and other accounts 1,167,194 3,004,555 11,694,881 12,534 27,362 2,335 - 15,908,861
Investment in securities -Available-for-sale
securities 287,385 - 41,077 220 - - - 328,682- Held-to-maturity
securities - 749,094 2,777,582 - - - - 3,526,676
- Loans and receivables - - 77,645 - - - - 77,645Investment properties - - 80,050 - - - - 80,050Properties, plant and
equipment - - 584,477 - - - - 584,477Other assets (including
deferred tax assets) 1,071 3,350 636,122 - 1,051 - - 641,594
Total assets 2,248,963 6,346,309 28,474,712 310,817 55,184 229,393 1,545,671 39,211,049
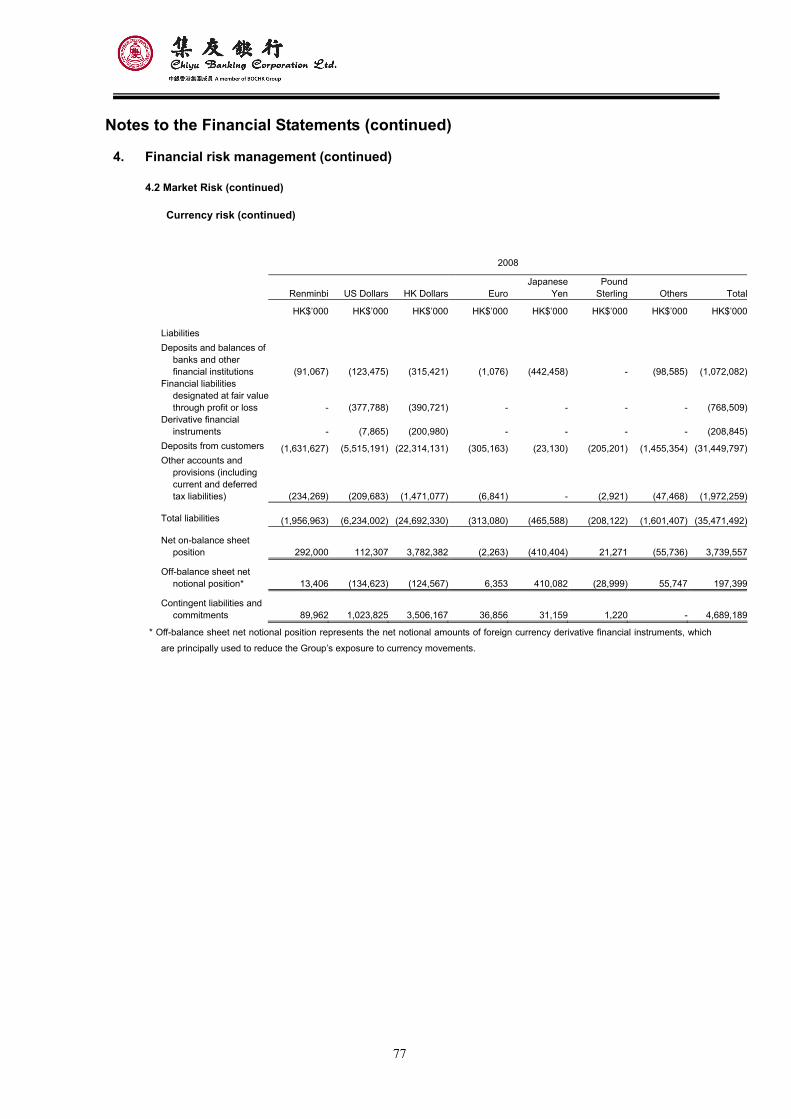
77
Notes to the Financial Statements (continued)
4. Financial risk management (continued)
4.2 Market Risk (continued)
Currency risk (continued)
2008
Renminbi US Dollars HK Dollars EuroJapanese
YenPound
Sterling Others Total HK$’000 HK$’000 HK$’000 HK$’000 HK$’000 HK$’000 HK$’000 HK$’000
Liabilities Deposits and balances of
banks and other financial institutions (91,067) (123,475) (315,421) (1,076) (442,458) - (98,585) (1,072,082)
Financial liabilities designated at fair valuethrough profit or loss - (377,788) (390,721) - - - - (768,509)
Derivative financial instruments - (7,865) (200,980) - - - - (208,845)
Deposits from customers (1,631,627) (5,515,191) (22,314,131) (305,163) (23,130) (205,201) (1,455,354) (31,449,797)Other accounts and
provisions (including current and deferred tax liabilities) (234,269) (209,683) (1,471,077) (6,841) - (2,921) (47,468) (1,972,259)
Total liabilities (1,956,963) (6,234,002) (24,692,330) (313,080) (465,588) (208,122) (1,601,407) (35,471,492)
Net on-balance sheet position 292,000 112,307 3,782,382 (2,263) (410,404) 21,271 (55,736) 3,739,557
Off-balance sheet net notional position* 13,406 (134,623) (124,567) 6,353 410,082 (28,999) 55,747 197,399
Contingent liabilities and commitments 89,962 1,023,825 3,506,167 36,856 31,159 1,220 - 4,689,189
* Off-balance sheet net notional position represents the net notional amounts of foreign currency derivative financial instruments, which
are principally used to reduce the Group’s exposure to currency movements.
78
Notes to the Financial Statements (continued)
4. Financial risk management (continued)
4.2 Market Risk (continued)
Interest rate risk
The Group’s interest rate risk exposures are mainly structural. The major types of interest rate risk from structural
positions are:
- repricing risk – mismatches in the maturity or repricing periods of assets and liabilities
- basis risk – different pricing basis for different transactions so that yield on assets and cost of liabilities may
change by different amounts within the same repricing period
- yield curve risk – non-parallel shifts in the yield curve, e.g. steepening or flattening yield curves, causing adverse
effects on net interest income or economic value
- option risk – exercise of the options embedded in assets, liabilities and Off-Balance Sheet inducing a change in
the cash flows of assets and liabilities
The Group has formulated an "Interest Rate Risk Management Policy" which sets out the framework and the
methodologies to identify, measure, monitor and control interest rate risk.
Both the members of the Asset and Liability Management Committee (“ALCO”) and RC are responsible for interest
rate risk management. ALCO maintains oversight of interest rate risk and reviews the policies, guidelines and limits
proposed by Finance Division. RC sanctions the interest rate risk management policies formulated by ALCO. The
interest rate risk is identified and measured on a daily basis. The Treasury Division manages the interest rate risk
according to the established policies. The Finance Division closely monitors the related risks according to
approved limits and reports the results to ALCO regularly.
Gap analysis is one of the tools used to measure the Group’s exposure to repricing risk. As the risk is complicated
by having optionality embedded in certain products, behavioural assumptions are made to reflect more accurately
the interest rate risk exposures. This gap analysis provides the Group with a static view of the maturity and
repricing characteristics of its balance sheet positions. The Group uses interest rate derivatives to hedge its interest
rate exposures and in most cases, plain vanilla interest rate swaps are used.
Sensitivities of earnings and economic value to interest rate changes (Earnings at Risk and Economic Value at Risk)
are assessed through a hypothetical interest rate shock of 200 basis points across the yield curve on both sides.
Earnings at Risk and Economic Value at Risk are controlled respectively within an approved percentage of the
projected net interest income for the year and the latest capital base as sanctioned by RC. The results are reported
to ALCO and RC on a regular basis. Apart from the hypothetical scenario, business-as-usual (“BAU”) scenario has
been established based on a simpler and more reasonable principle. It generates results of the impact on earnings
and economic value under interest rate change assuming constant strategic business development and customer
behaviour.
79
Notes to the Financial Statements (continued)
4. Financial risk management (continued)
4.2 Market Risk (continued)
Interest rate risk (continued)
The impact of basis risk is gauged by the projected change in net interest income under scenarios of imperfect
correlation in the adjustment of the rates earned and paid on different instruments. Ratios of assets to liabilities with
similar pricing basis are established to monitor such risk.
Stress test on yield curve risk is performed to assess the impact on earnings and economic value due to the
steepening or flattening of the yield curve. The impact of optionality of demand and savings deposits and
prepayment of mortgage loans is also assessed under different stress test scenarios.
The interest rate risk exposures in the Group are controlled through the use of limits :
1. Earnings at Risk limit.
2. Economic Value at Risk limit.
3. Interest Rate Mismatch Gap limits.
Before launching a new product or business, relevant departments are required to go through a risk assessment
process, which include assessment of underlying interest rate risk and consideration of the adequacy of current risk
management mechanism. Any material impact on interest rate risk noted during the risk assessment process will be
reported to the Head of SCD.
80
Notes to the Financial Statements (continued)
4. Financial risk management (continued)
4.2 Market Risk (continued)
Interest rate risk (continued)
The tables below summarise the Group’s exposure to interest rate risk as at 31 December. Included in the tables are
the Group’s assets and liabilities at carrying amounts, categorised by the earlier of contractual repricing or maturity
dates.
2009
Up to 1 month
1-3 months
3-12 months
1-5years
Over 5 years
Non-interest bearing Total
HK$’000 HK$’000 HK$’000 HK$’000 HK$’000 HK$’000 HK$’000
Assets Cash and balances with banks and
other financial institutions 7,341,290 --
- - 646,287 7,987,577Placements with banks and other
financial institutions maturing between one and twelve months - 3,775,781 1,749,595 - - - 5,525,376
Financial assets designated at fair value through profit or loss - - - 526,187 266,929 - 793,116
Derivative financial instruments - - - - 349,936 349,936Advances and other accounts 15,134,791 2,709,807 705,912 24,375 7,483 - 18,582,368Investment in securities
- Available-for-sale securities 139,320 673,548 182,726 92,808 - 45,352 1,133,754- Held-to-maturity securities 696,787 2,072,561 998,509 162,617 - - 3,930,474- Loans and receivables - - - - - 9 9Investment properties - - - - - 78,800 78,800Properties, plant and equipment - - - - - 657,463 657,463Other assets (including deferred tax
assets) - - - - - 905,996 905,996
Total assets 23,312,188 9,231,697 3,636,742 805,987 274,412 2,683,843 39,944,869
Liabilities Deposits and balances of banks and
other financial institutions (237,305) (114,306) - - - (117,115) (468,726)Financial liabilities designated at fair
value through profit or loss - - - - - - -Derivative financial instruments - - - - - (164,386) (164,386)Deposits from customers (25,691,917) (4,267,882) (2,353,052) (33,625) - (1,470,779) (33,817,255)Other accounts and provisions
(including current and deferred tax liabilities) (455,475) - - - - (948,902) (1,404,377)
Total liabilities (26,384,697) (4,382,188) (2,353,052) (33,625) - (2,701,182) (35,854,744)
Interest sensitivity gap (3,072,509) 4,849,509 1,283,690 772,362 274,412 (17,339) 4,090,125
81
Notes to the Financial Statements (continued)
4. Financial risk management (continued)
4.2 Market Risk (continued)
Interest rate risk (continued)
2008
Up to 1 month
1-3 months
3-12 months
1-5years
Over 5 years
Non-interest bearing Total
HK$’000 HK$’000 HK$’000 HK$’000 HK$’000 HK$’000 HK$’000 Assets Cash and balances with banks and
other financial institutions 8,178,523 - - - - 407,231 8,585,754Placements with banks and other
financial institutions maturing between one and twelve months - 8,660,344 61,264 - - - 8,721,608
Financial assets designated at fair value through profit or loss 224,964 - 102,509 42,284 - - 369,757
Derivative financial instruments - - - - - 385,945 385,945Advances and other accounts 13,715,466 1,904,819 257,250 16,286 15,040 - 15,908,861Investment in securities
- Available-for-sale securities - - 69,686 217,699 - 41,297 328,682- Held-to-maturity securities 328,308 1,922,598 423,262 852,508 - - 3,526,676- Loans and receivables - 77,645 - - - - 77,645Investment properties - - - - - 80,050 80,050Properties, plant and equipment - - - - - 584,477 584,477Other assets (including deferred
tax assets) - - - - - 641,594 641,594
Total assets 22,447,261 12,565,406 913,971 1,128,777 15,040 2,140,594 39,211,049
Liabilities Deposits and balances of banks
and other financial institutions (631,106) (35,028) - - - (405,948) (1,072,082)Financial liabilities designated at
fair value through profit or loss (215,925) (409,496) (143,088) - - - (768,509)Derivative financial instruments - - - - - (208,845) (208,845)Deposits from customers (21,669,699) (7,250,469) (1,411,314) (33,223) - (1,085,092) (31,449,797)Other accounts and provisions
(including current and deferred tax liabilities) (542,539) - - - - (1,429,720) (1,972,259)
Total liabilities (23,059,269) (7,694,993) (1,554,402) (33,223) - (3,129,605) (35,471,492)
Interest sensitivity gap (612,008) 4,870,413 (640,431) 1,095,554 15,040 (989,011) (3,739,557)
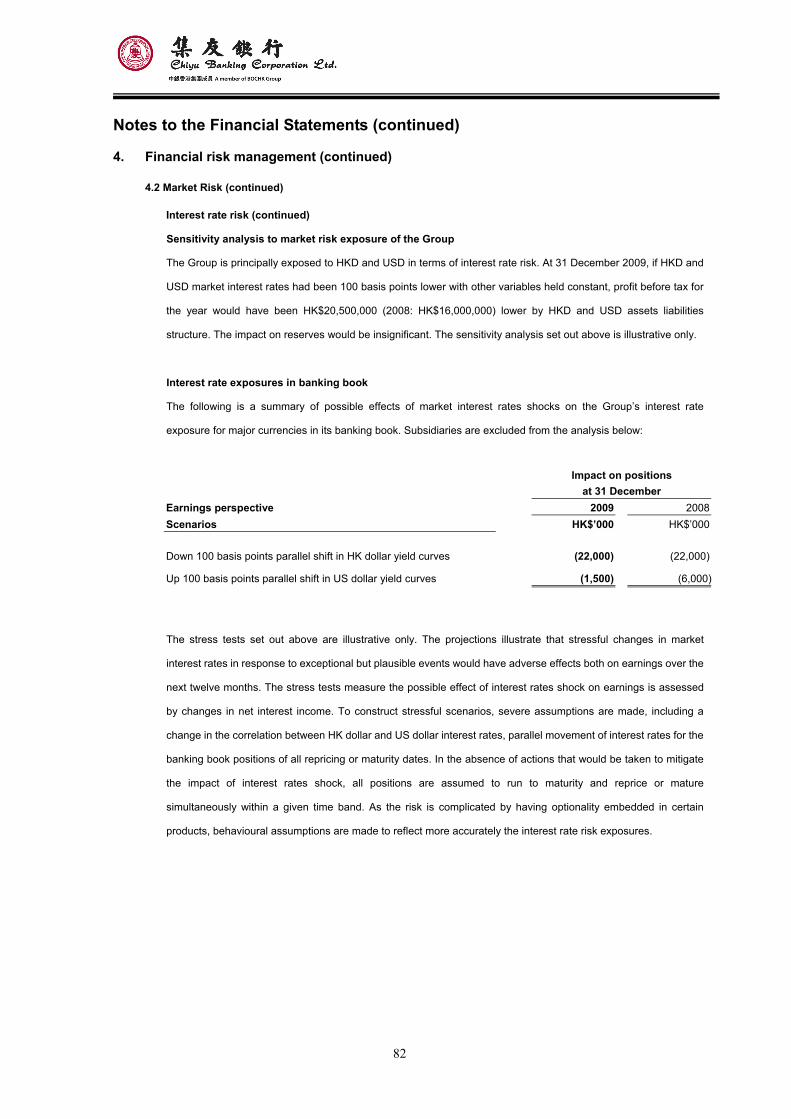
82
Notes to the Financial Statements (continued)
4. Financial risk management (continued)
4.2 Market Risk (continued)
Interest rate risk (continued)
Sensitivity analysis to market risk exposure of the Group
The Group is principally exposed to HKD and USD in terms of interest rate risk. At 31 December 2009, if HKD and
USD market interest rates had been 100 basis points lower with other variables held constant, profit before tax for
the year would have been HK$20,500,000 (2008: HK$16,000,000) lower by HKD and USD assets liabilities
structure. The impact on reserves would be insignificant. The sensitivity analysis set out above is illustrative only.
Interest rate exposures in banking book
The following is a summary of possible effects of market interest rates shocks on the Group’s interest rate
exposure for major currencies in its banking book. Subsidiaries are excluded from the analysis below:
Impact on positions
at 31 December Earnings perspective 2009 2008 Scenarios HK$’000 HK$’000
Down 100 basis points parallel shift in HK dollar yield curves (22,000) (22,000)
Up 100 basis points parallel shift in US dollar yield curves (1,500) (6,000)
The stress tests set out above are illustrative only. The projections illustrate that stressful changes in market
interest rates in response to exceptional but plausible events would have adverse effects both on earnings over the
next twelve months. The stress tests measure the possible effect of interest rates shock on earnings is assessed
by changes in net interest income. To construct stressful scenarios, severe assumptions are made, including a
change in the correlation between HK dollar and US dollar interest rates, parallel movement of interest rates for the
banking book positions of all repricing or maturity dates. In the absence of actions that would be taken to mitigate
the impact of interest rates shock, all positions are assumed to run to maturity and reprice or mature
simultaneously within a given time band. As the risk is complicated by having optionality embedded in certain
products, behavioural assumptions are made to reflect more accurately the interest rate risk exposures.
83
Notes to the Financial Statements (continued)
4. Financial risk management (continued)
4.2 Market risk (continued)
Foreign exchange risk
Sensitivity analysis to market risk exposure of the Group (continued)
At 31 December 2009, if HKD had weakened/strengthened by 1% against USD with all other variable held constant,
the profit before taxation for the year would have been HK$4,231,000 higher/lower, mainly as a result of foreign
exchange gain/loss on translation of USD denominated financial assets larger than foreign exchange loss/gain on
translation of USD denominated financial liabilities. If HKD had weakened/strengthened by 5% against CNY with all
other variable held constant, the profit before taxation for the year would have been HK$19,103,000 higher/lower,
mainly as a result of foreign exchange gain/loss on translation of CNY denominated financial assets larger than
foreign exchange loss/gain on translation of CNY denominated financial liabilities.
At 31 December 2008, if HKD had weakened/strengthened by 1% against USD with all other variable held constant,
the profit before taxation for the year would have been HK$223,000 lower/higher, mainly as a result of foreign
exchange gain/loss on translation of USD denominated financial assets lesser than foreign exchange loss/gain on
translation of USD denominated financial liabilities. If HKD had weakened/strengthened by 5% against CNY with all
other variable held constant, the profit before taxation for the year would have been HK$15,270,000 higher/lower,
mainly as a result of foreign exchange gain/loss on translation of CNY denominated financial assets larger than
foreign exchange loss/gain on translation of CNY denominated financial liabilities.
84
Notes to the Financial Statements (continued)
4. Financial risk management (continued)
4.3 Liquidity Risk
Liquidity risk is the risk that the Group may not be able to fund increases in assets or meet obligations as they fall due
without incurring unacceptable losses.
Liquidity risk management framework
The liquidity risk management framework of the Group comprises three levels. The Board of Directors and the RC
are the ultimate decision making authority and are responsible for approving the liquidity management policy and
assure the compliance with regulatory requirements. The senior management (including CE, Head of SCD and the
Asset and Liability Management Committee) are responsible for the formulation of the liquidity management policy
and procedures and monitoring of their implementation. The Treasury Division, assisted by other functional
departments, including the Finance Division, is responsible for daily management of liquidity to monitor the liquidity
risk and provide regular reports to the management and local regulatory bodies.
The Group has developed a robust liquidity risk management mechanism, by maintaining an appropriate size of
highly-liquefiable assets and proper liability structure, enabling the Group to meet, even under adverse market
conditions, all its obligations as they fall due, and to fund all its asset growth and strategic opportunities without
forced liquidation of its assets at short notice.
At present, the Group has set up three Key Risk Indicators, which are 1-month liquidity ratio, 1-month mismatch ratio
and loan-to-deposit ratio. The indicators mentioned are used as the major tools in the identification, measurement,
monitoring and control of the liquidity risk on regular basis by setting limits, assessing and monitoring the ratios.
Besides, the Group also monitors deposit stability, concentration of deposits from large depositors and liquidity
profile of the investment portfolio.
85
Notes to the Financial Statements (continued)
4. Financial risk management (continued)
4.3 Liquidity Risk (continued)
Liquidity risk management framework (continued)
The related risk management process includes:
- Perform cash-flow projections under normal and stressed scenarios, using the net mismatch gap between assets
and liabilities to estimate the prospective net funding requirements;
- Set limits on mismatch ratio to control the size of the cumulative net mismatch positions;
- Maintain strong liquidity ratios to comply with both internal and external regulatory requirements;
- Maintain a diversified liability base to ensure sufficient funding sources;
- Maintain a proper level of highly liquid assets to serve as a liquidity buffer for emergency needs;
- Monitor the structure and stability of the deposit portfolio;
- Assess the ability to borrow from the inter-bank money market to avoid over-reliance on the money market for
funding;
- Maintain a proper contingency plan, which includes setting early warning signals (including internal indicators and
market indicators) with timely monitoring procedures and establishing a management reporting system and
contingency procedures.
Before launching a new product or business, relevant departments are required to go through a risk assessment
process, which includes assessment of underlying liquidity risk and consideration of the adequacy of the current risk
management mechanism. Any material impact on liquidity risk noted during the risk assessment process will be
reported to the Head of SCD.
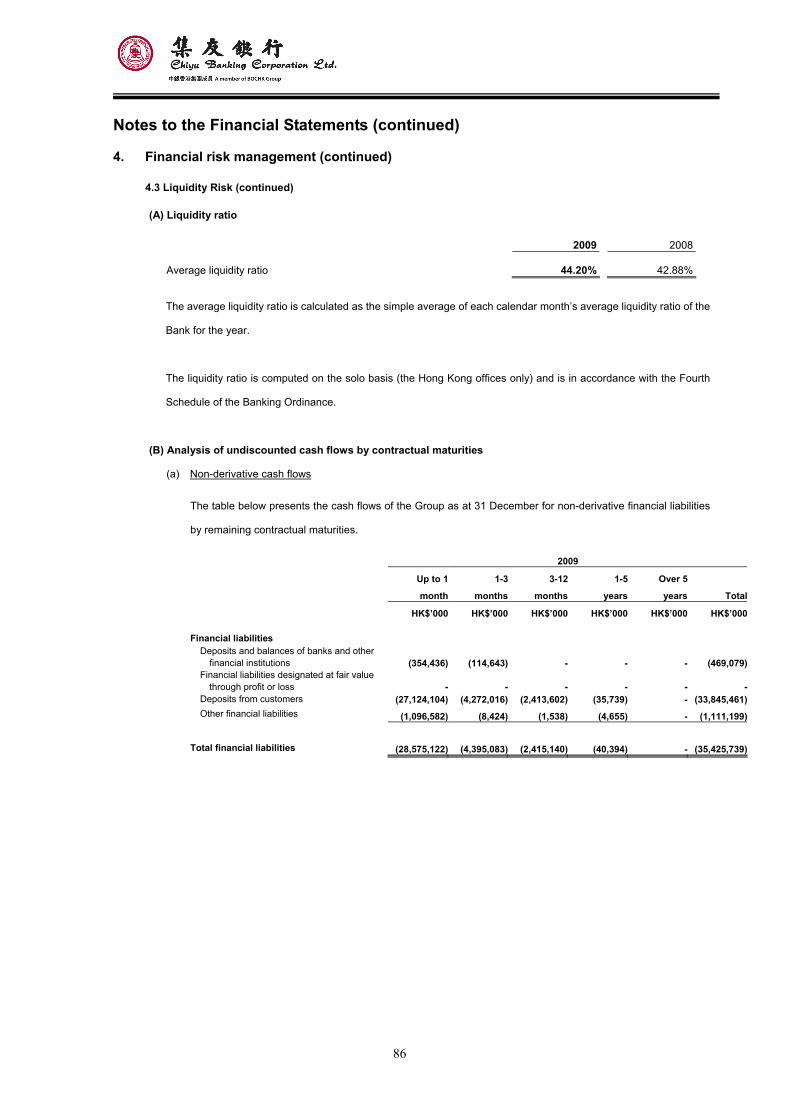
86
Notes to the Financial Statements (continued)
4. Financial risk management (continued)
4.3 Liquidity Risk (continued)
(A) Liquidity ratio 2009 2008
Average liquidity ratio 44.20% 42.88%
The average liquidity ratio is calculated as the simple average of each calendar month’s average liquidity ratio of the
Bank for the year.
The liquidity ratio is computed on the solo basis (the Hong Kong offices only) and is in accordance with the Fourth
Schedule of the Banking Ordinance.
(B) Analysis of undiscounted cash flows by contractual maturities
(a) Non-derivative cash flows
The table below presents the cash flows of the Group as at 31 December for non-derivative financial liabilities
by remaining contractual maturities.
2009 Up to 1 1-3 3-12 1-5 Over 5
month months months years years Total HK$’000 HK$’000 HK$’000 HK$’000 HK$’000 HK$’000
Financial liabilities
Deposits and balances of banks and other financial institutions (354,436) (114,643) - - - (469,079)
Financial liabilities designated at fair value through profit or loss - - - - - -
Deposits from customers (27,124,104) (4,272,016) (2,413,602) (35,739) - (33,845,461)Other financial liabilities (1,096,582) (8,424) (1,538) (4,655) - (1,111,199)
Total financial liabilities (28,575,122) (4,395,083) (2,415,140) (40,394) - (35,425,739)
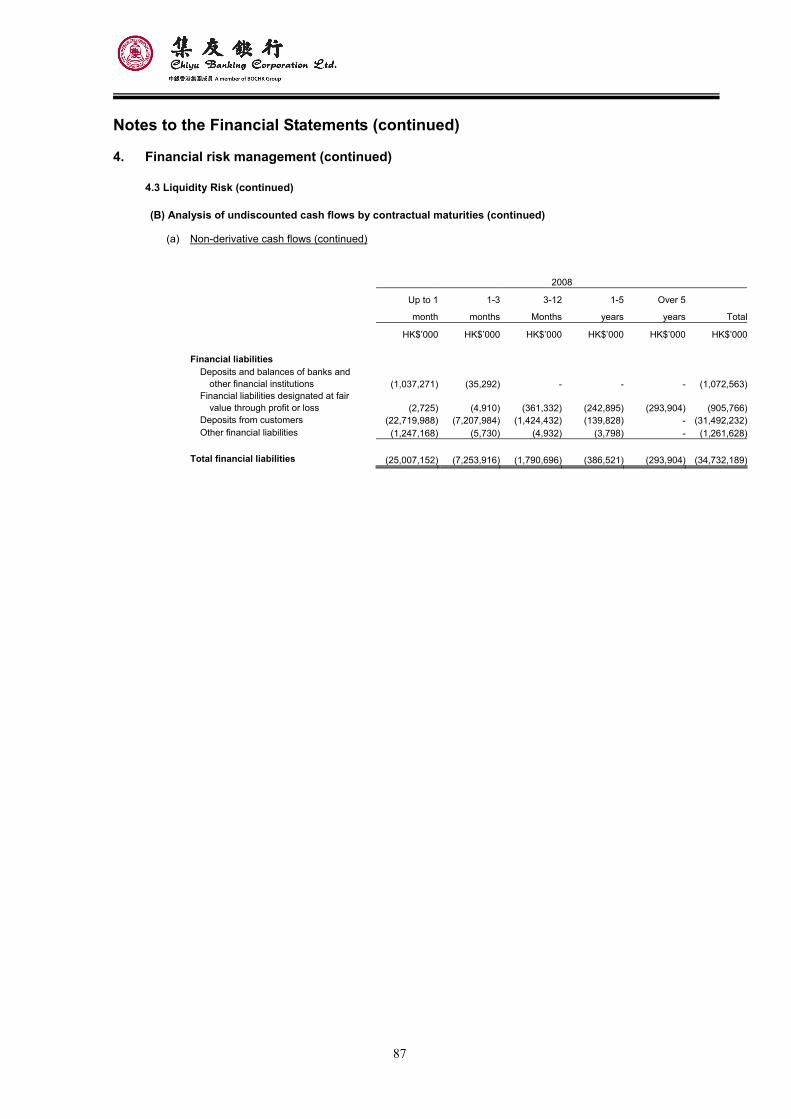
87
Notes to the Financial Statements (continued)
4. Financial risk management (continued)
4.3 Liquidity Risk (continued)
(B) Analysis of undiscounted cash flows by contractual maturities (continued)
(a) Non-derivative cash flows (continued)
2008 Up to 1 1-3 3-12 1-5 Over 5
month months Months years years Total HK$’000 HK$’000 HK$’000 HK$’000 HK$’000 HK$’000
Financial liabilities
Deposits and balances of banks and other financial institutions (1,037,271) (35,292) - - - (1,072,563)
Financial liabilities designated at fair value through profit or loss (2,725) (4,910) (361,332) (242,895) (293,904) (905,766)
Deposits from customers (22,719,988) (7,207,984) (1,424,432) (139,828) - (31,492,232)Other financial liabilities (1,247,168) (5,730) (4,932) (3,798) - (1,261,628)
Total financial liabilities (25,007,152) (7,253,916) (1,790,696) (386,521) (293,904) (34,732,189)
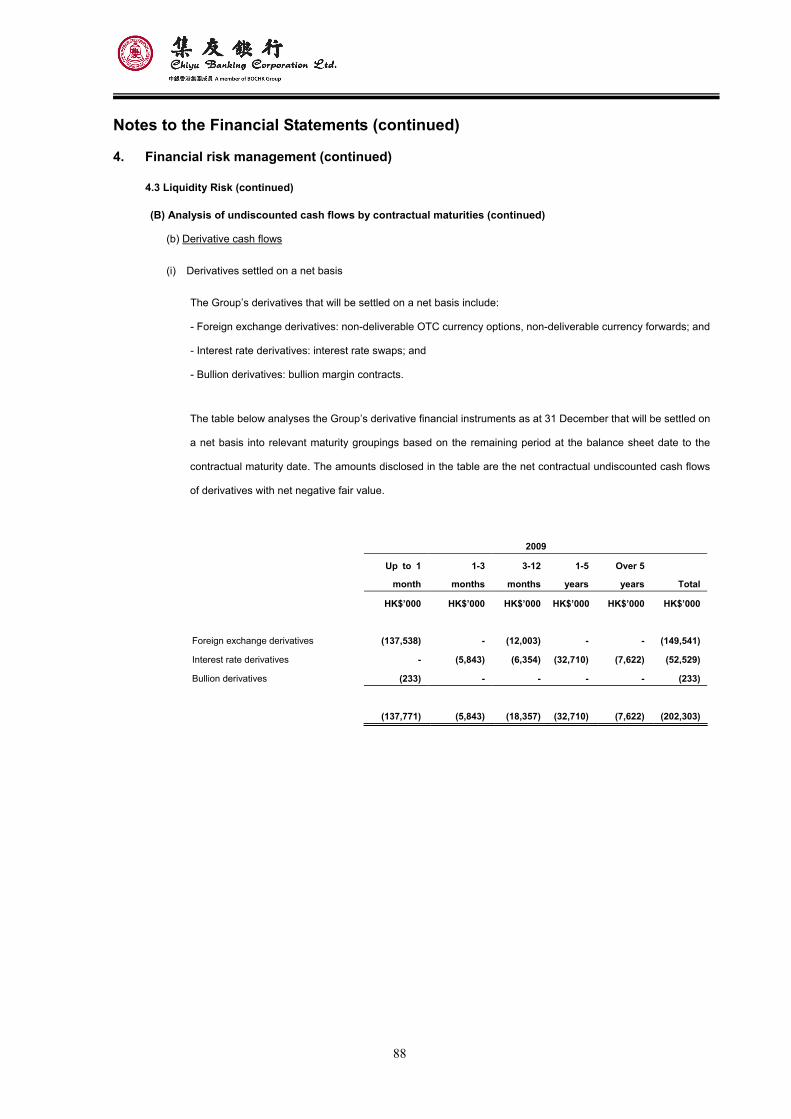
88
Notes to the Financial Statements (continued)
4. Financial risk management (continued)
4.3 Liquidity Risk (continued)
(B) Analysis of undiscounted cash flows by contractual maturities (continued)
(b) Derivative cash flows
(i) Derivatives settled on a net basis
The Group’s derivatives that will be settled on a net basis include:
- Foreign exchange derivatives: non-deliverable OTC currency options, non-deliverable currency forwards; and
- Interest rate derivatives: interest rate swaps; and
- Bullion derivatives: bullion margin contracts.
The table below analyses the Group’s derivative financial instruments as at 31 December that will be settled on
a net basis into relevant maturity groupings based on the remaining period at the balance sheet date to the
contractual maturity date. The amounts disclosed in the table are the net contractual undiscounted cash flows
of derivatives with net negative fair value.
2009
Up to 1 1-3 3-12 1-5 Over 5
month months months years years Total
HK$’000 HK$’000 HK$’000 HK$’000 HK$’000 HK$’000
Foreign exchange derivatives (137,538) - (12,003) - - (149,541)
Interest rate derivatives - (5,843) (6,354) (32,710) (7,622) (52,529)
Bullion derivatives (233) - - - - (233)
(137,771) (5,843) (18,357) (32,710) (7,622) (202,303)
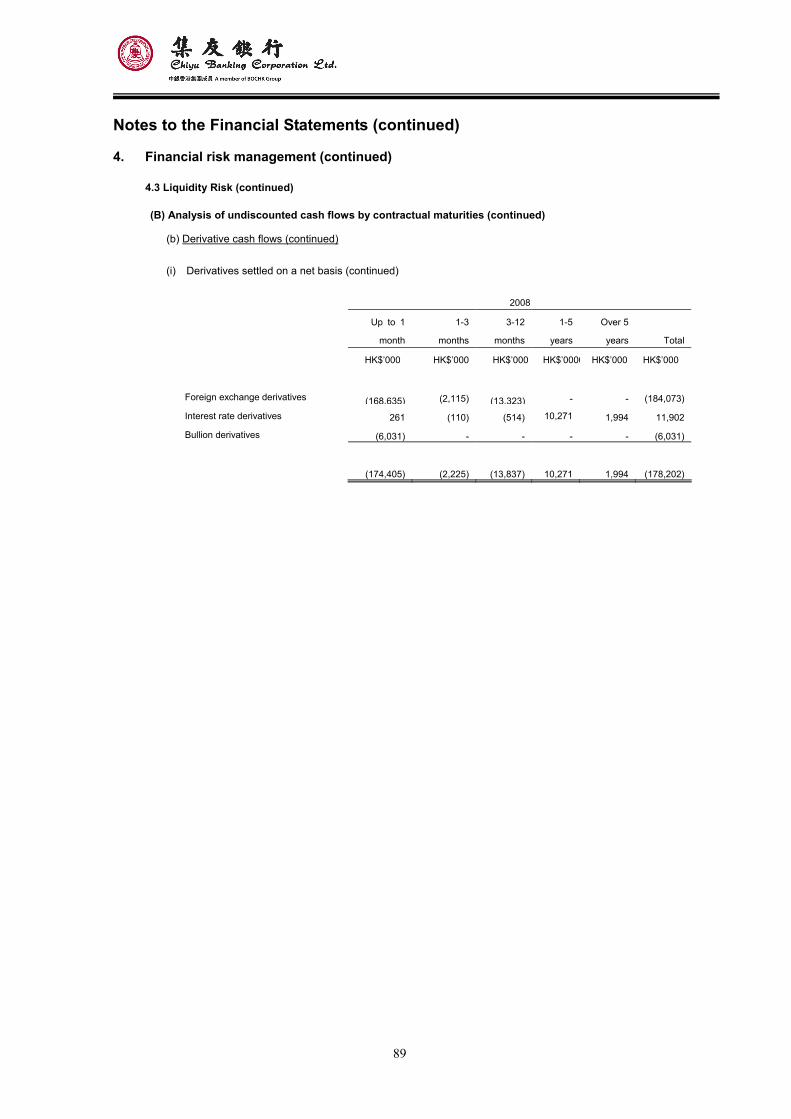
89
Notes to the Financial Statements (continued)
4. Financial risk management (continued)
4.3 Liquidity Risk (continued)
(B) Analysis of undiscounted cash flows by contractual maturities (continued)
(b) Derivative cash flows (continued)
(i) Derivatives settled on a net basis (continued)
2008
Up to 1 1-3 3-12 1-5 Over 5
month months months years years Total
HK$’000 HK$’000 HK$’000 HK$’0000 HK$’000 HK$’000
Foreign exchange derivatives
(168,635) (2,115) (13,323) - - (184,073)
Interest rate derivatives 261 (110) (514) 10,271 1,994 11,902
Bullion derivatives (6,031) - - - - (6,031)
(174,405) (2,225) (13,837) 10,271 1,994 (178,202)
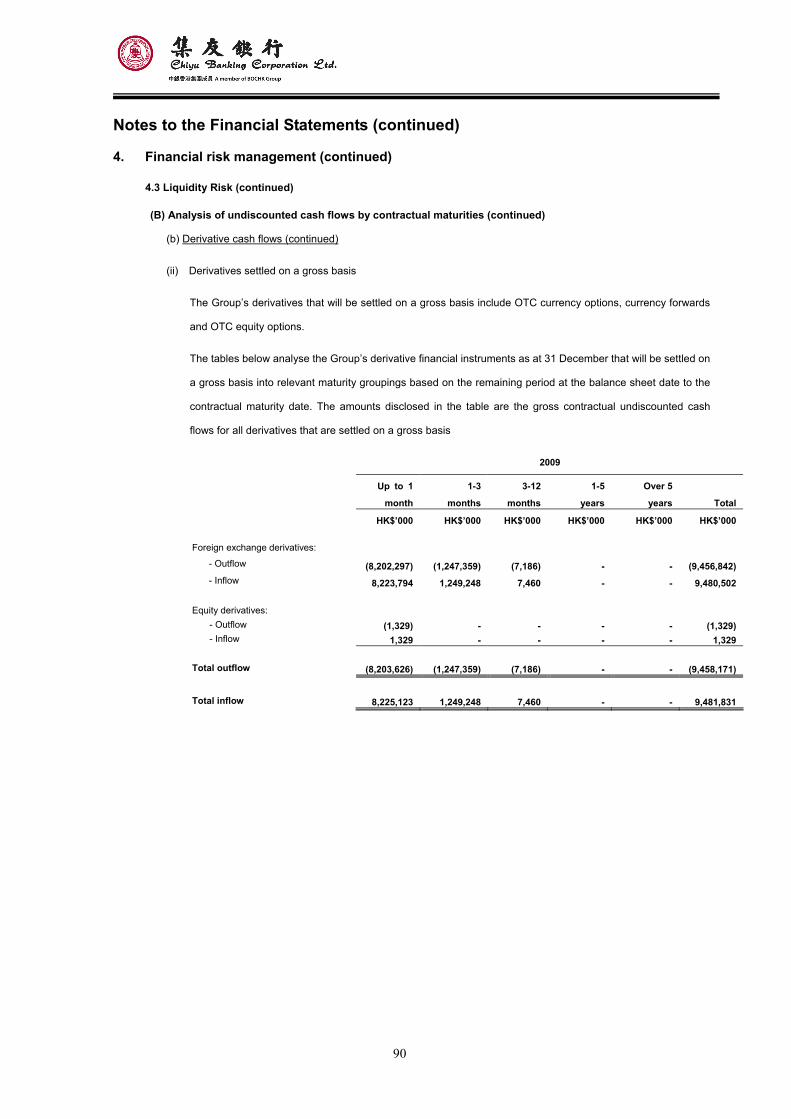
90
Notes to the Financial Statements (continued)
4. Financial risk management (continued)
4.3 Liquidity Risk (continued)
(B) Analysis of undiscounted cash flows by contractual maturities (continued)
(b) Derivative cash flows (continued)
(ii) Derivatives settled on a gross basis
The Group’s derivatives that will be settled on a gross basis include OTC currency options, currency forwards
and OTC equity options.
The tables below analyse the Group’s derivative financial instruments as at 31 December that will be settled on
a gross basis into relevant maturity groupings based on the remaining period at the balance sheet date to the
contractual maturity date. The amounts disclosed in the table are the gross contractual undiscounted cash
flows for all derivatives that are settled on a gross basis
2009
Up to 1 1-3 3-12 1-5 Over 5 month months months years years Total HK$’000 HK$’000 HK$’000 HK$’000 HK$’000 HK$’000
Foreign exchange derivatives: - Outflow (8,202,297) (1,247,359) (7,186) - - (9,456,842)- Inflow 8,223,794 1,249,248 7,460 - - 9,480,502
Equity derivatives:
- Outflow (1,329) - - - - (1,329)- Inflow 1,329 - - - - 1,329
Total outflow (8,203,626) (1,247,359) (7,186) - - (9,458,171)
Total inflow 8,225,123 1,249,248 7,460 - - 9,481,831
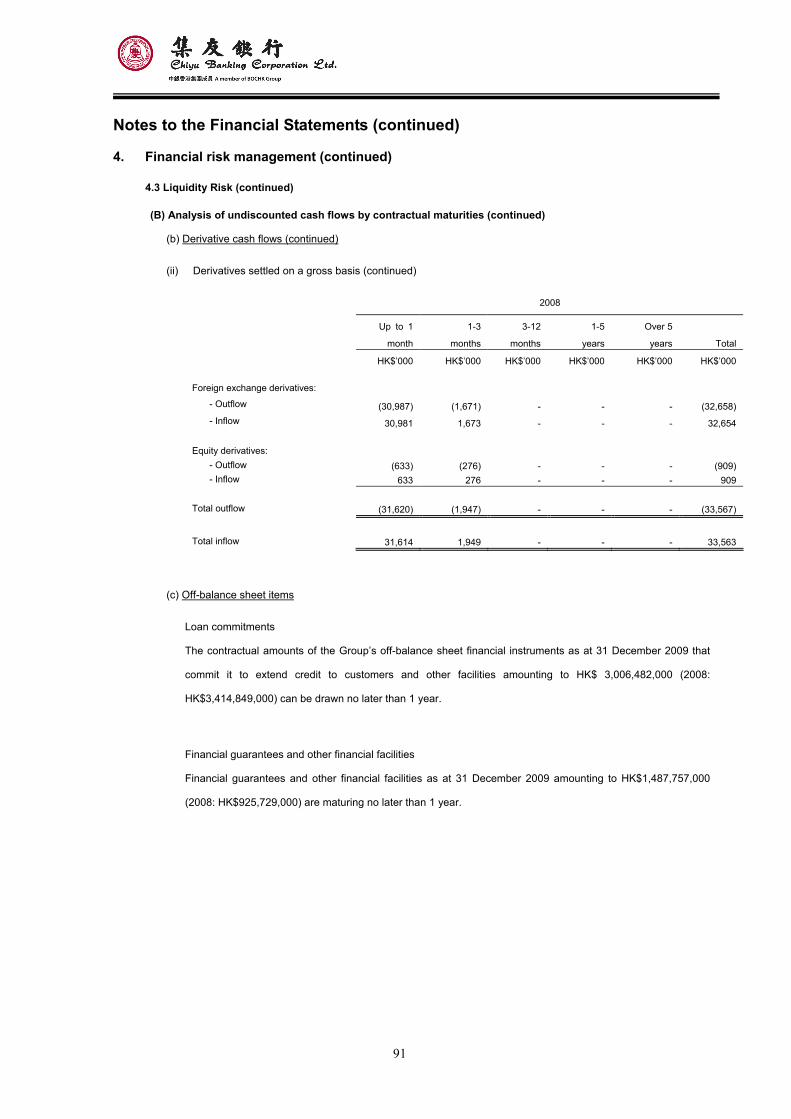
91
Notes to the Financial Statements (continued)
4. Financial risk management (continued)
4.3 Liquidity Risk (continued)
(B) Analysis of undiscounted cash flows by contractual maturities (continued)
(b) Derivative cash flows (continued)
(ii) Derivatives settled on a gross basis (continued)
2008
Up to 1 1-3 3-12 1-5 Over 5 month months months years years Total HK$’000 HK$’000 HK$’000 HK$’000 HK$’000 HK$’000
Foreign exchange derivatives: - Outflow (30,987) (1,671) - - - (32,658)- Inflow 30,981 1,673 - - - 32,654
Equity derivatives:
- Outflow (633) (276) - - - (909)- Inflow 633 276 - - - 909
Total outflow (31,620) (1,947) - - - (33,567)
Total inflow 31,614 1,949 - - - 33,563
(c) Off-balance sheet items
Loan commitments
The contractual amounts of the Group’s off-balance sheet financial instruments as at 31 December 2009 that
commit it to extend credit to customers and other facilities amounting to HK$ 3,006,482,000 (2008:
HK$3,414,849,000) can be drawn no later than 1 year.
Financial guarantees and other financial facilities
Financial guarantees and other financial facilities as at 31 December 2009 amounting to HK$1,487,757,000
(2008: HK$925,729,000) are maturing no later than 1 year.
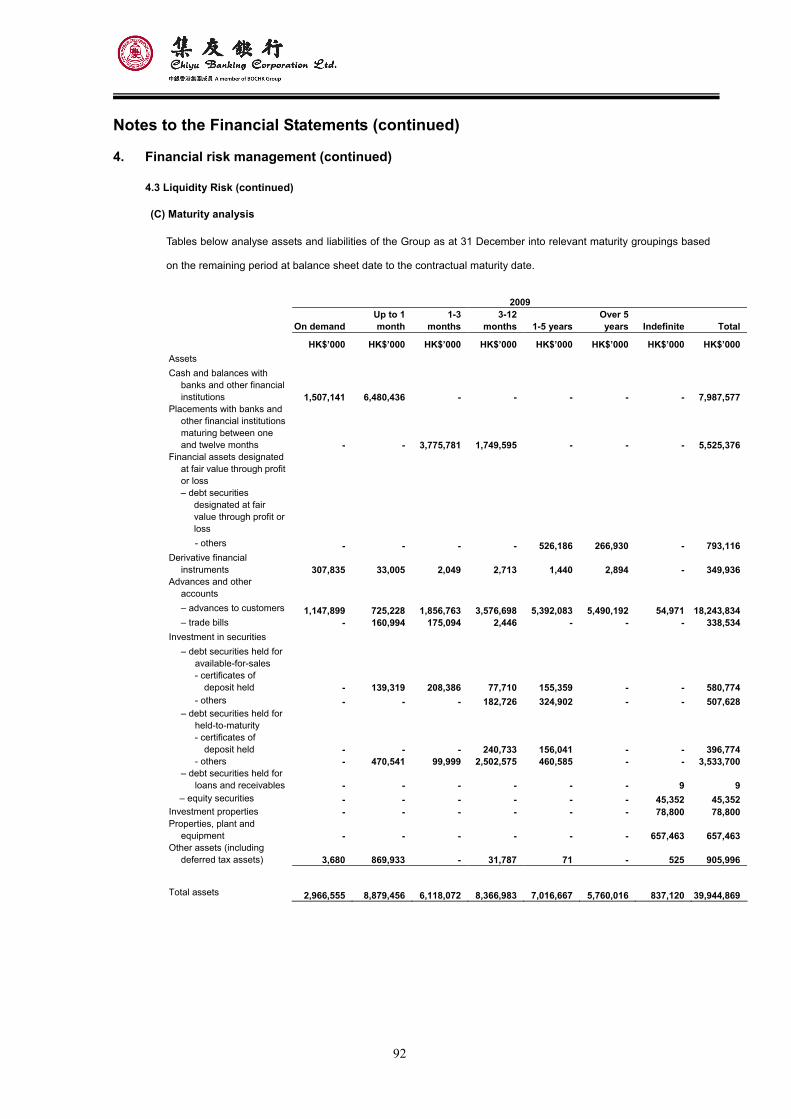
92
Notes to the Financial Statements (continued)
4. Financial risk management (continued)
4.3 Liquidity Risk (continued)
(C) Maturity analysis
Tables below analyse assets and liabilities of the Group as at 31 December into relevant maturity groupings based
on the remaining period at balance sheet date to the contractual maturity date.
2009
On demandUp to 1 month
1-3 months
3-12 months 1-5 years
Over 5 years Indefinite Total
HK$’000 HK$’000 HK$’000 HK$’000 HK$’000 HK$’000 HK$’000 HK$’000Assets Cash and balances with
banks and other financial institutions 1,507,141 6,480,436 - - - - - 7,987,577
Placements with banks and other financial institutions maturing between one and twelve months - - 3,775,781 1,749,595 - - - 5,525,376
Financial assets designated at fair value through profit or loss – debt securities
designated at fair value through profit or loss - others - - - - 526,186 266,930 - 793,116
Derivative financial instruments 307,835 33,005 2,049 2,713 1,440 2,894 - 349,936
Advances and other accounts – advances to customers 1,147,899 725,228 1,856,763 3,576,698 5,392,083 5,490,192 54,971 18,243,834– trade bills - 160,994 175,094 2,446 - - - 338,534
Investment in securities – debt securities held for
available-for-sales - certificates of
deposit held - 139,319 208,386 77,710 155,359 - - 580,774- others - - - 182,726 324,902 - - 507,628
– debt securities held for held-to-maturity - certificates of
deposit held - - - 240,733 156,041 - - 396,774- others - 470,541 99,999 2,502,575 460,585 - - 3,533,700
– debt securities held for loans and receivables - - - - - - 9 9
– equity securities - - - - - - 45,352 45,352Investment properties - - - - - - 78,800 78,800Properties, plant and
equipment - - - - - - 657,463 657,463Other assets (including
deferred tax assets) 3,680 869,933 - 31,787 71 - 525 905,996
Total assets 2,966,555 8,879,456 6,118,072 8,366,983 7,016,667 5,760,016 837,120 39,944,869
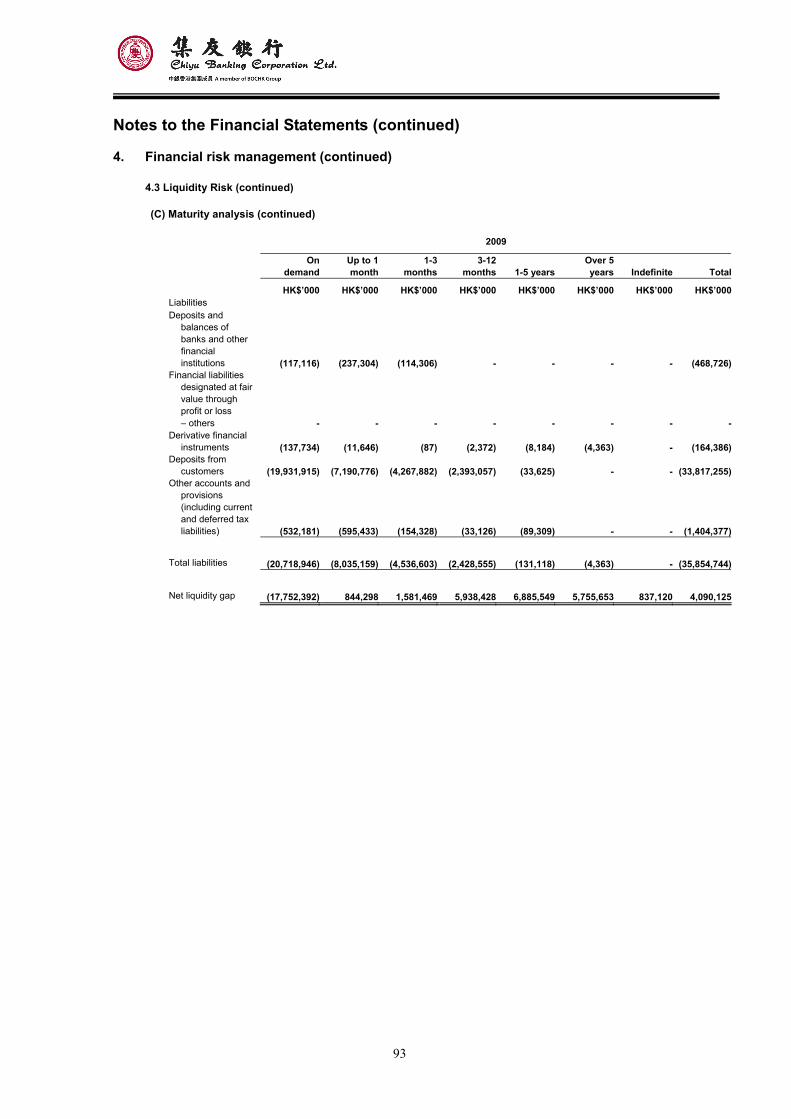
93
Notes to the Financial Statements (continued)
4. Financial risk management (continued)
4.3 Liquidity Risk (continued)
(C) Maturity analysis (continued)
2009
On demand
Up to 1month
1-3 months
3-12months 1-5 years
Over 5years Indefinite Total
HK$’000 HK$’000 HK$’000 HK$’000 HK$’000 HK$’000 HK$’000 HK$’000Liabilities Deposits and
balances of banks and other financial institutions (117,116) (237,304) (114,306) - - - - (468,726)
Financial liabilities designated at fair value through profit or loss – others - - - - - - - -
Derivative financial instruments (137,734) (11,646) (87) (2,372) (8,184) (4,363) - (164,386)
Deposits from customers (19,931,915) (7,190,776) (4,267,882) (2,393,057) (33,625) - - (33,817,255)
Other accounts and provisions (including current and deferred tax liabilities) (532,181) (595,433) (154,328) (33,126) (89,309) - - (1,404,377)
Total liabilities (20,718,946) (8,035,159) (4,536,603) (2,428,555) (131,118) (4,363) - (35,854,744)
Net liquidity gap (17,752,392) 844,298 1,581,469 5,938,428 6,885,549 5,755,653 837,120 4,090,125
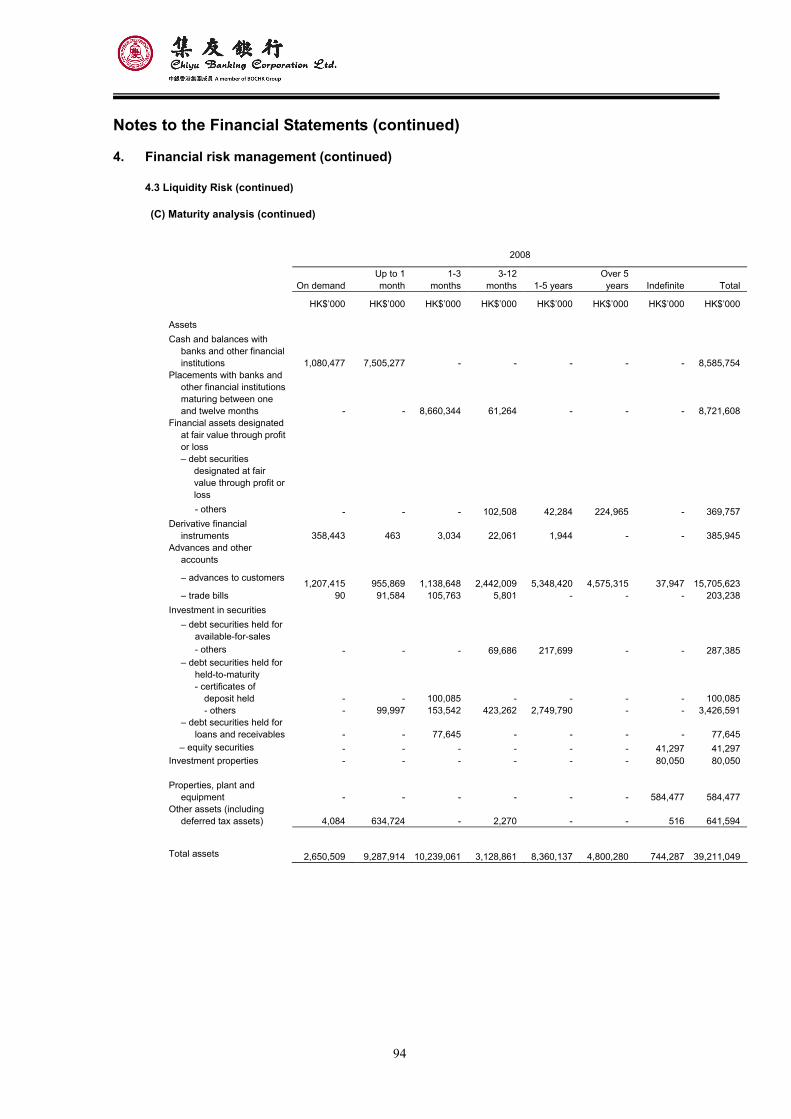
94
Notes to the Financial Statements (continued)
4. Financial risk management (continued)
4.3 Liquidity Risk (continued)
(C) Maturity analysis (continued)
2008
On demandUp to 1 month
1-3 months
3-12 months 1-5 years
Over 5 years Indefinite Total
HK$’000 HK$’000 HK$’000 HK$’000 HK$’000 HK$’000 HK$’000 HK$’000
Assets Cash and balances with
banks and other financial institutions 1,080,477 7,505,277 - - - - - 8,585,754
Placements with banks and other financial institutions maturing between one and twelve months - - 8,660,344 61,264 - - - 8,721,608
Financial assets designated at fair value through profit or loss – debt securities
designated at fair value through profit or loss - others - - - 102,508 42,284 224,965 - 369,757
Derivative financial instruments 358,443 463 3,034 22,061 1,944 - - 385,945
Advances and other accounts
– advances to customers 1,207,415
955,869 1,138,648 2,442,009 5,348,420 4,575,315 37,947 15,705,623– trade bills 90 91,584 105,763 5,801 - - - 203,238
Investment in securities – debt securities held for
available-for-sales - others - - - 69,686 217,699 - - 287,385
– debt securities held for held-to-maturity - certificates of
deposit held - - 100,085 - - - - 100,085- others - 99,997 153,542 423,262 2,749,790 - - 3,426,591
– debt securities held for loans and receivables - - 77,645 - - - - 77,645
– equity securities - - - - - - 41,297 41,297Investment properties - - - - - - 80,050 80,050
Properties, plant and
equipment - - - - - - 584,477 584,477Other assets (including
deferred tax assets) 4,084 634,724 - 2,270 - - 516 641,594
Total assets 2,650,509 9,287,914 10,239,061 3,128,861 8,360,137 4,800,280 744,287 39,211,049
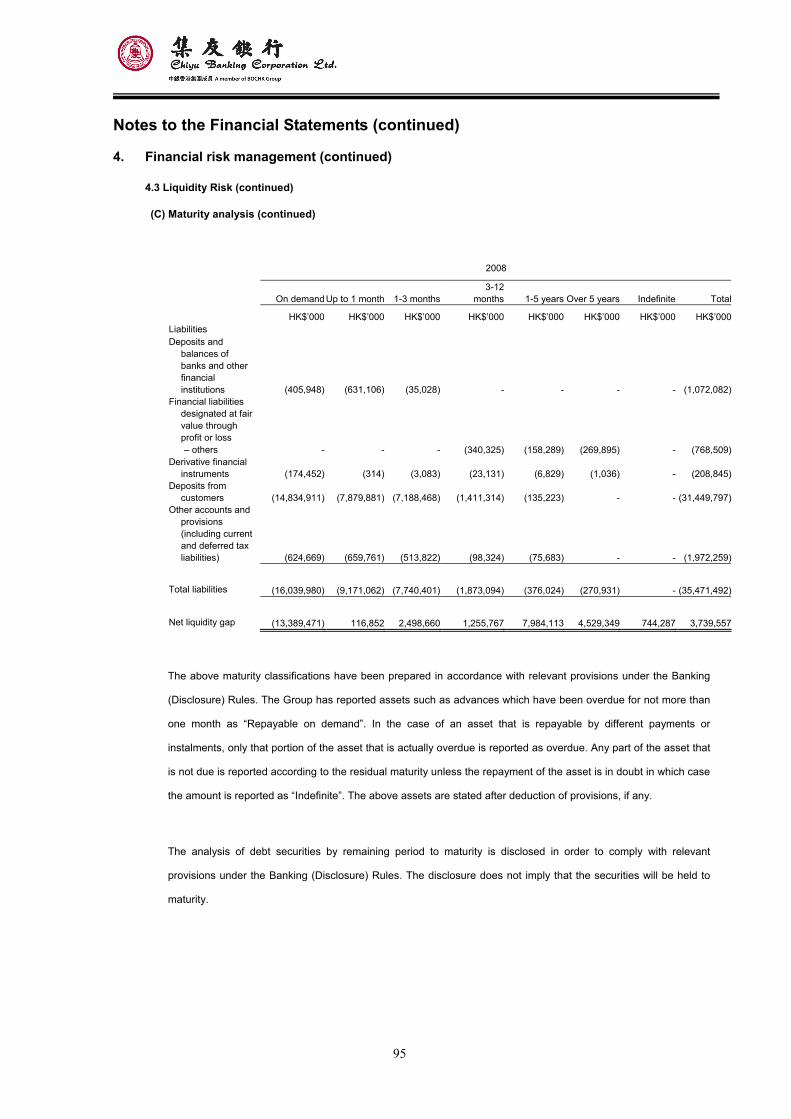
95
Notes to the Financial Statements (continued)
4. Financial risk management (continued)
4.3 Liquidity Risk (continued)
(C) Maturity analysis (continued)
2008
On demandUp to 1 month 1-3 months3-12
months 1-5 years Over 5 years Indefinite Total HK$’000 HK$’000 HK$’000 HK$’000 HK$’000 HK$’000 HK$’000 HK$’000Liabilities Deposits and
balances of banks and other financial institutions (405,948) (631,106) (35,028) - - - - (1,072,082)
Financial liabilities designated at fair value through profit or loss – others - - - (340,325) (158,289) (269,895) - (768,509)
Derivative financial instruments (174,452) (314) (3,083) (23,131) (6,829) (1,036) - (208,845)
Deposits from customers (14,834,911) (7,879,881) (7,188,468) (1,411,314) (135,223) - - (31,449,797)
Other accounts and provisions (including current and deferred tax liabilities) (624,669) (659,761) (513,822) (98,324) (75,683) - - (1,972,259)
Total liabilities (16,039,980) (9,171,062) (7,740,401) (1,873,094) (376,024) (270,931) - (35,471,492)
Net liquidity gap (13,389,471) 116,852 2,498,660 1,255,767 7,984,113 4,529,349 744,287 3,739,557
The above maturity classifications have been prepared in accordance with relevant provisions under the Banking
(Disclosure) Rules. The Group has reported assets such as advances which have been overdue for not more than
one month as “Repayable on demand”. In the case of an asset that is repayable by different payments or
instalments, only that portion of the asset that is actually overdue is reported as overdue. Any part of the asset that
is not due is reported according to the residual maturity unless the repayment of the asset is in doubt in which case
the amount is reported as “Indefinite”. The above assets are stated after deduction of provisions, if any.
The analysis of debt securities by remaining period to maturity is disclosed in order to comply with relevant
provisions under the Banking (Disclosure) Rules. The disclosure does not imply that the securities will be held to
maturity.
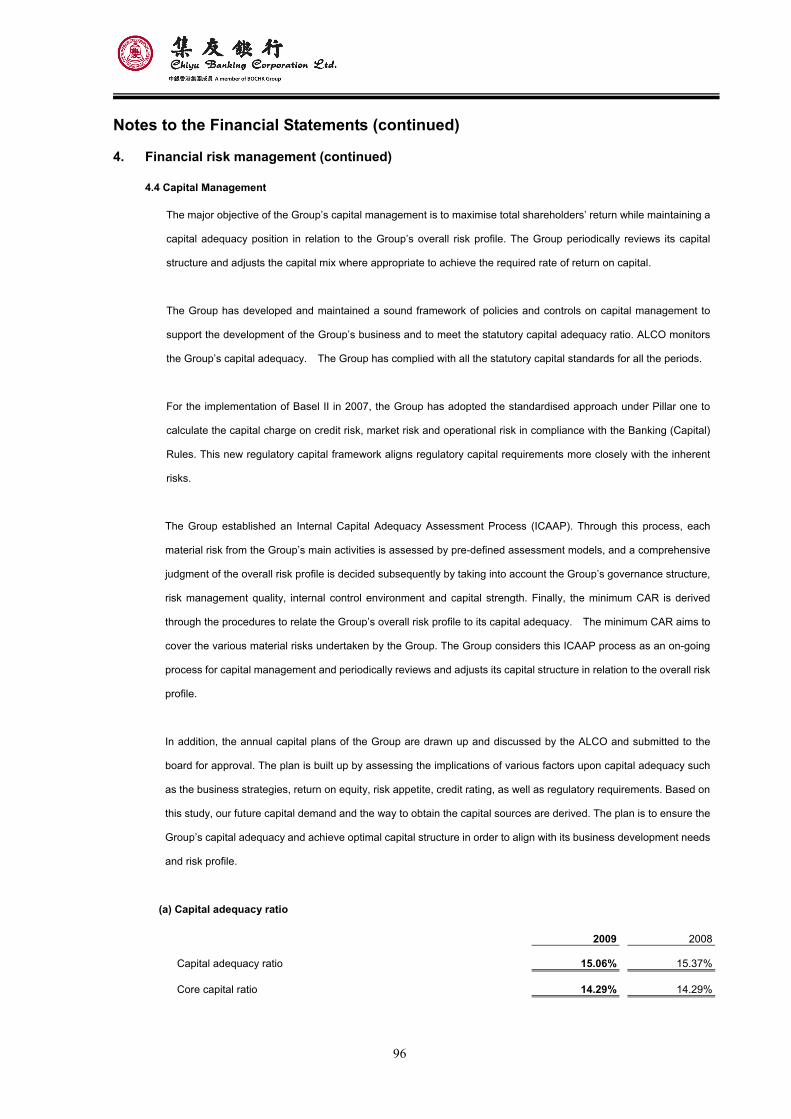
96
Notes to the Financial Statements (continued)
4. Financial risk management (continued)
4.4 Capital Management
The major objective of the Group’s capital management is to maximise total shareholders’ return while maintaining a
capital adequacy position in relation to the Group’s overall risk profile. The Group periodically reviews its capital
structure and adjusts the capital mix where appropriate to achieve the required rate of return on capital.
The Group has developed and maintained a sound framework of policies and controls on capital management to
support the development of the Group’s business and to meet the statutory capital adequacy ratio. ALCO monitors
the Group’s capital adequacy. The Group has complied with all the statutory capital standards for all the periods.
For the implementation of Basel II in 2007, the Group has adopted the standardised approach under Pillar one to
calculate the capital charge on credit risk, market risk and operational risk in compliance with the Banking (Capital)
Rules. This new regulatory capital framework aligns regulatory capital requirements more closely with the inherent
risks.
The Group established an Internal Capital Adequacy Assessment Process (ICAAP). Through this process, each
material risk from the Group’s main activities is assessed by pre-defined assessment models, and a comprehensive
judgment of the overall risk profile is decided subsequently by taking into account the Group’s governance structure,
risk management quality, internal control environment and capital strength. Finally, the minimum CAR is derived
through the procedures to relate the Group’s overall risk profile to its capital adequacy. The minimum CAR aims to
cover the various material risks undertaken by the Group. The Group considers this ICAAP process as an on-going
process for capital management and periodically reviews and adjusts its capital structure in relation to the overall risk
profile.
In addition, the annual capital plans of the Group are drawn up and discussed by the ALCO and submitted to the
board for approval. The plan is built up by assessing the implications of various factors upon capital adequacy such
as the business strategies, return on equity, risk appetite, credit rating, as well as regulatory requirements. Based on
this study, our future capital demand and the way to obtain the capital sources are derived. The plan is to ensure the
Group’s capital adequacy and achieve optimal capital structure in order to align with its business development needs
and risk profile.
(a) Capital adequacy ratio 2009 2008
Capital adequacy ratio 15.06% 15.37% Core capital ratio 14.29% 14.29%
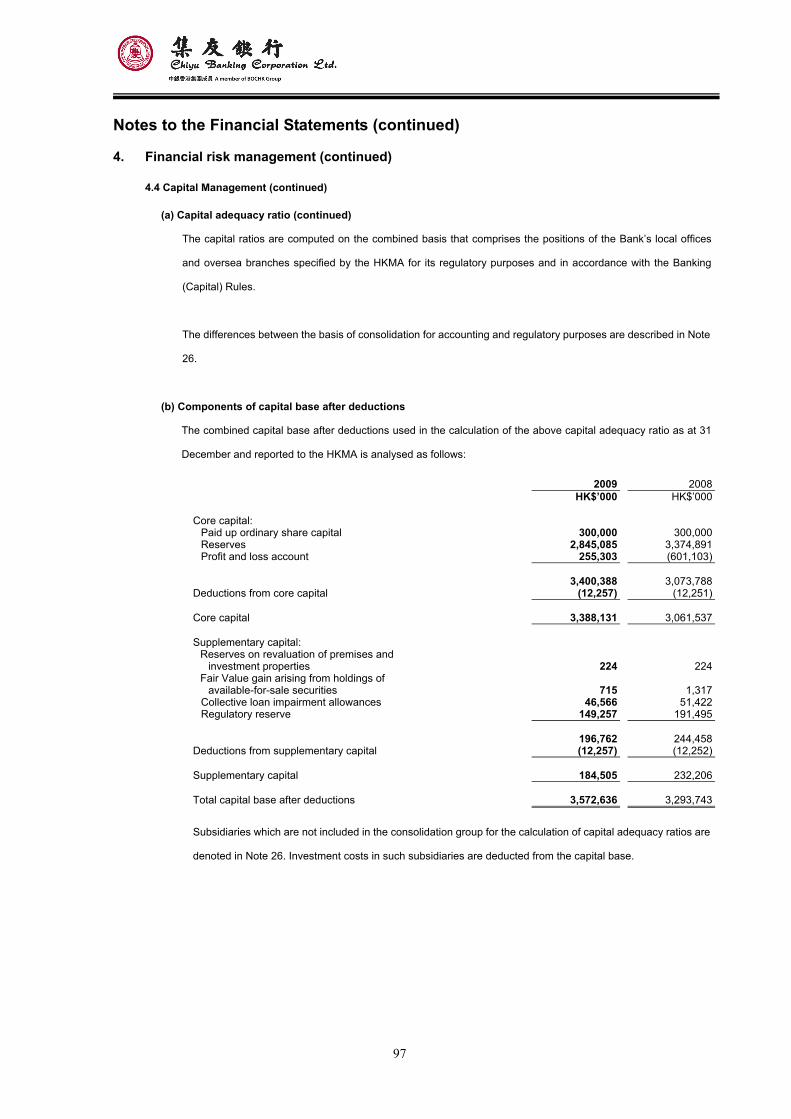
97
Notes to the Financial Statements (continued)
4. Financial risk management (continued)
4.4 Capital Management (continued)
(a) Capital adequacy ratio (continued)
The capital ratios are computed on the combined basis that comprises the positions of the Bank’s local offices
and oversea branches specified by the HKMA for its regulatory purposes and in accordance with the Banking
(Capital) Rules.
The differences between the basis of consolidation for accounting and regulatory purposes are described in Note
26.
(b) Components of capital base after deductions
The combined capital base after deductions used in the calculation of the above capital adequacy ratio as at 31
December and reported to the HKMA is analysed as follows:
2009 2008 HK$’000 HK$’000 Core capital:
Paid up ordinary share capital 300,000 300,000Reserves 2,845,085 3,374,891Profit and loss account 255,303 (601,103)
3,400,388 3,073,788
Deductions from core capital (12,257) (12,251) Core capital 3,388,131 3,061,537 Supplementary capital:
Reserves on revaluation of premises and investment properties
224 224
Fair Value gain arising from holdings of available-for-sale securities
715 1,317
Collective loan impairment allowances 46,566 51,422Regulatory reserve 149,257 191,495
196,762 244,458Deductions from supplementary capital (12,257) (12,252) Supplementary capital 184,505 232,206 Total capital base after deductions 3,572,636 3,293,743
Subsidiaries which are not included in the consolidation group for the calculation of capital adequacy ratios are
denoted in Note 26. Investment costs in such subsidiaries are deducted from the capital base.
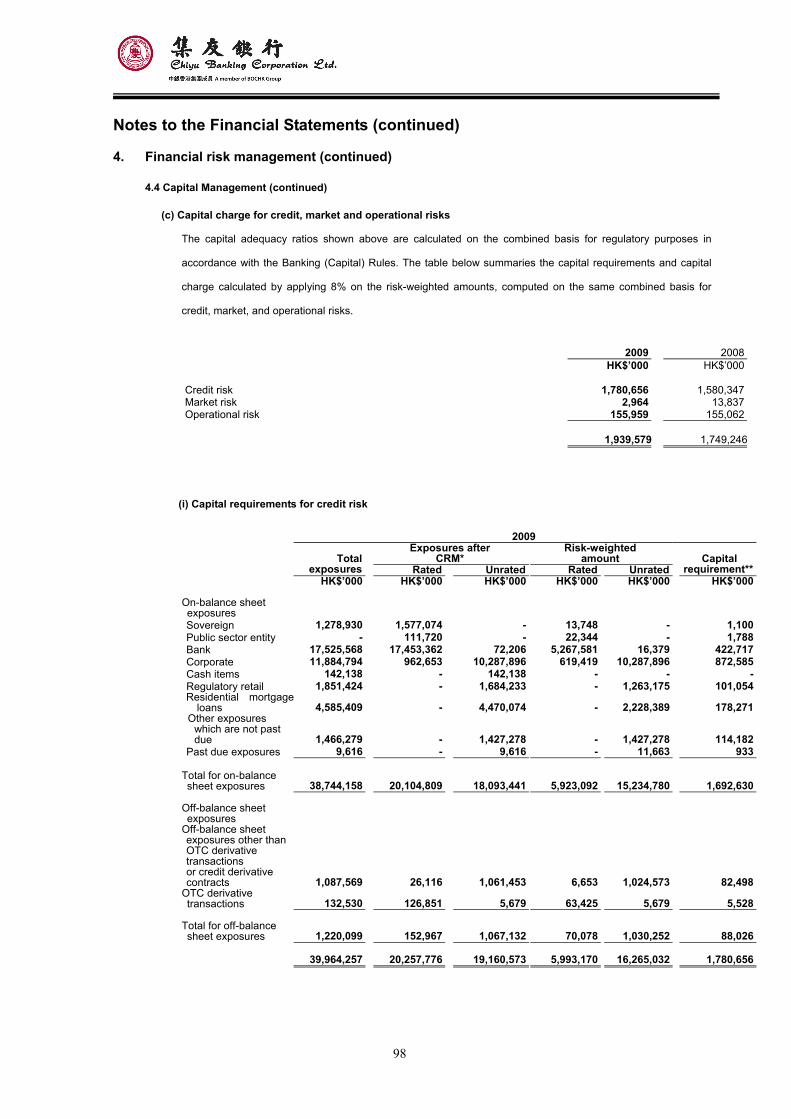
98
Notes to the Financial Statements (continued)
4. Financial risk management (continued)
4.4 Capital Management (continued)
(c) Capital charge for credit, market and operational risks
The capital adequacy ratios shown above are calculated on the combined basis for regulatory purposes in
accordance with the Banking (Capital) Rules. The table below summaries the capital requirements and capital
charge calculated by applying 8% on the risk-weighted amounts, computed on the same combined basis for
credit, market, and operational risks.
2009 2008 HK$’000 HK$’000 Credit risk 1,780,656 1,580,347Market risk 2,964 13,837Operational risk 155,959 155,062 1,939,579 1,749,246
(i) Capital requirements for credit risk
2009
Exposures after
CRM* Risk-weighted
amount
Totalexposures Rated Unrated Rated Unrated
Capital requirement**
HK$’000 HK$’000 HK$’000 HK$’000 HK$’000 HK$’000 On-balance sheet
exposures
Sovereign 1,278,930 1,577,074 - 13,748 - 1,100 Public sector entity - 111,720 - 22,344 - 1,788 Bank 17,525,568 17,453,362 72,206 5,267,581 16,379 422,717 Corporate 11,884,794 962,653 10,287,896 619,419 10,287,896 872,585 Cash items 142,138 - 142,138 - - - Regulatory retail 1,851,424 - 1,684,233 - 1,263,175 101,054 Residential mortgage
loans 4,585,409 - 4,470,074 - 2,228,389 178,271 Other exposures
which are not past due 1,466,279 - 1,427,278 - 1,427,278 114,182
Past due exposures 9,616 - 9,616 - 11,663 933 Total for on-balance
sheet exposures 38,744,158 20,104,809 18,093,441 5,923,092
15,234,780 1,692,630 Off-balance sheet
exposures
Off-balance sheet exposures other than OTC derivative transactions or credit derivative contracts 1,087,569 26,116 1,061,453 6,653 1,024,573 82,498
OTC derivative transactions 132,530 126,851 5,679 63,425 5,679 5,528
Total for off-balance
sheet exposures 1,220,099 152,967 1,067,132 70,078
1,030,252 88,026 39,964,257 20,257,776 19,160,573 5,993,170 16,265,032 1,780,656
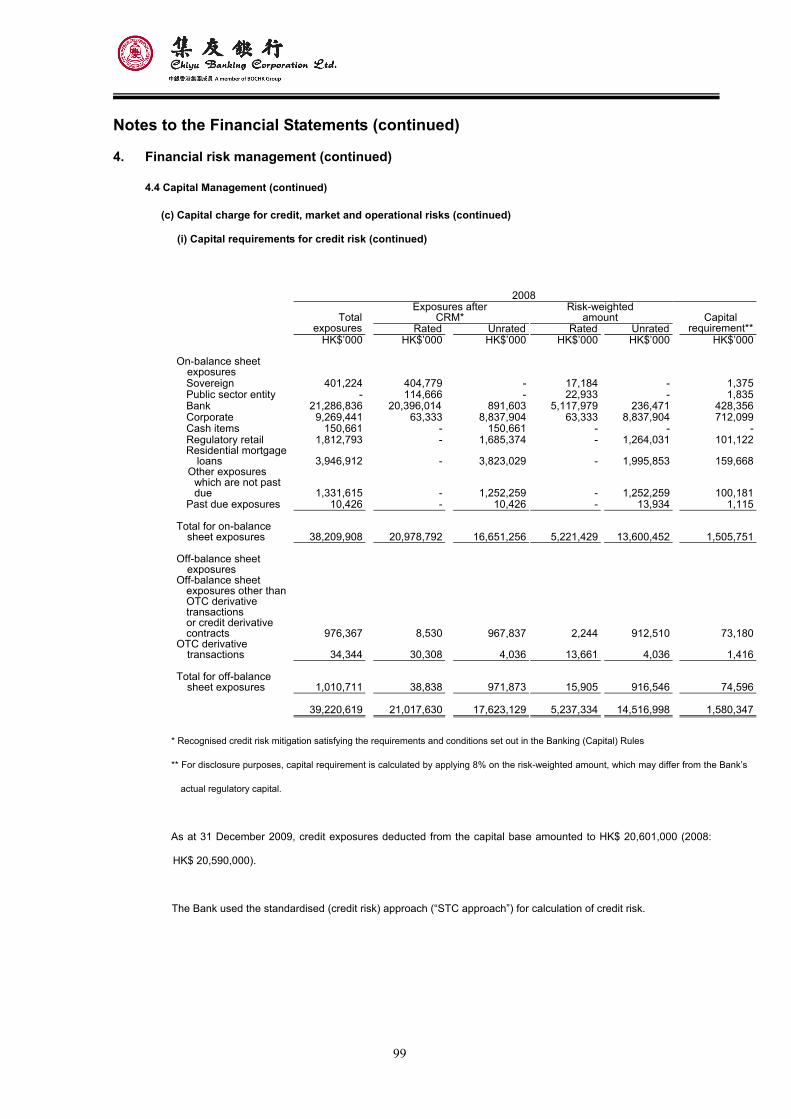
99
Notes to the Financial Statements (continued)
4. Financial risk management (continued)
4.4 Capital Management (continued)
(c) Capital charge for credit, market and operational risks (continued)
(i) Capital requirements for credit risk (continued)
2008
Exposures after
CRM* Risk-weighted
amount
Totalexposures Rated Unrated Rated Unrated
Capital requirement**
HK$’000 HK$’000 HK$’000 HK$’000 HK$’000 HK$’000 On-balance sheet
exposures
Sovereign 401,224 404,779 - 17,184 - 1,375 Public sector entity - 114,666 - 22,933 - 1,835 Bank 21,286,836 20,396,014 891,603 5,117,979 236,471 428,356 Corporate 9,269,441 63,333 8,837,904 63,333 8,837,904 712,099 Cash items 150,661 - 150,661 - - - Regulatory retail 1,812,793 - 1,685,374 - 1,264,031 101,122 Residential mortgage
loans 3,946,912 - 3,823,029 - 1,995,853 159,668 Other exposures
which are not past due 1,331,615 - 1,252,259 - 1,252,259 100,181
Past due exposures 10,426 - 10,426 - 13,934 1,115 Total for on-balance
sheet exposures 38,209,908 20,978,792 16,651,256 5,221,429 13,600,452 1,505,751 Off-balance sheet
exposures Off-balance sheet
exposures other than OTC derivative transactions or credit derivative contracts 976,367 8,530 967,837 2,244 912,510 73,180
OTC derivative transactions 34,344 30,308 4,036 13,661 4,036 1,416
Total for off-balance
sheet exposures 1,010,711 38,838 971,873 15,905 916,546 74,596 39,220,619 21,017,630 17,623,129 5,237,334 14,516,998 1,580,347
* Recognised credit risk mitigation satisfying the requirements and conditions set out in the Banking (Capital) Rules
** For disclosure purposes, capital requirement is calculated by applying 8% on the risk-weighted amount, which may differ from the Bank’s
actual regulatory capital.
As at 31 December 2009, credit exposures deducted from the capital base amounted to HK$ 20,601,000 (2008:
HK$ 20,590,000).
The Bank used the standardised (credit risk) approach (“STC approach”) for calculation of credit risk.
100
Notes to the Financial Statements (continued)
4. Financial risk management (continued)
4.4 Capital Management (continued)
(c) Capital charge for credit, market and operational risks (continued)
(i) Capital requirements for credit risk (continued)
The External credit assessment institutions (“ECAI”) recognised by the Group includes Standard & Poor’s,
Moody’s and Fitch. The Group adopted external rating based approach to determine the risk weight of the
following classes of exposures, including those of securitisation exposures:
- Sovereign
- Public sector entity
- Multilateral development bank
- Bank
- Securities firm
- Corporate
The process the Bank used to map ECAI issuer ratings to exposures booked in the banking book is a process
prescribed in Part 4 of the Banking (Capital) Rules.
Counterparty credit risk exposures
The Group’s counterparty credit risk arising from over-the-counter (“OTC”) derivative transactions, repo-style
transactions both in trading and banking book is subject to the same risk management framework as above
mentioned. The Group established credit limit through formal credit approval procedures to control the
pre-settlement credit risk arising from derivatives transactions and settlement limit to control the settlement
risk arising from foreign exchange-related transactions in both the trading book and banking book. The
Group monitors the risk exposure due to fluctuations in the market value by determining the current exposure
value of the transactions. Exceptions or excesses are timely and closely identified and monitored by credit
risk management units.
As the Group has not implemented capital allocation policy, there is no internal capital assigned for
counterparty credit exposures.
The Group established prudent eligibility criteria and haircut policy of debt securities being pledged as
collateral for repo-style transactions.
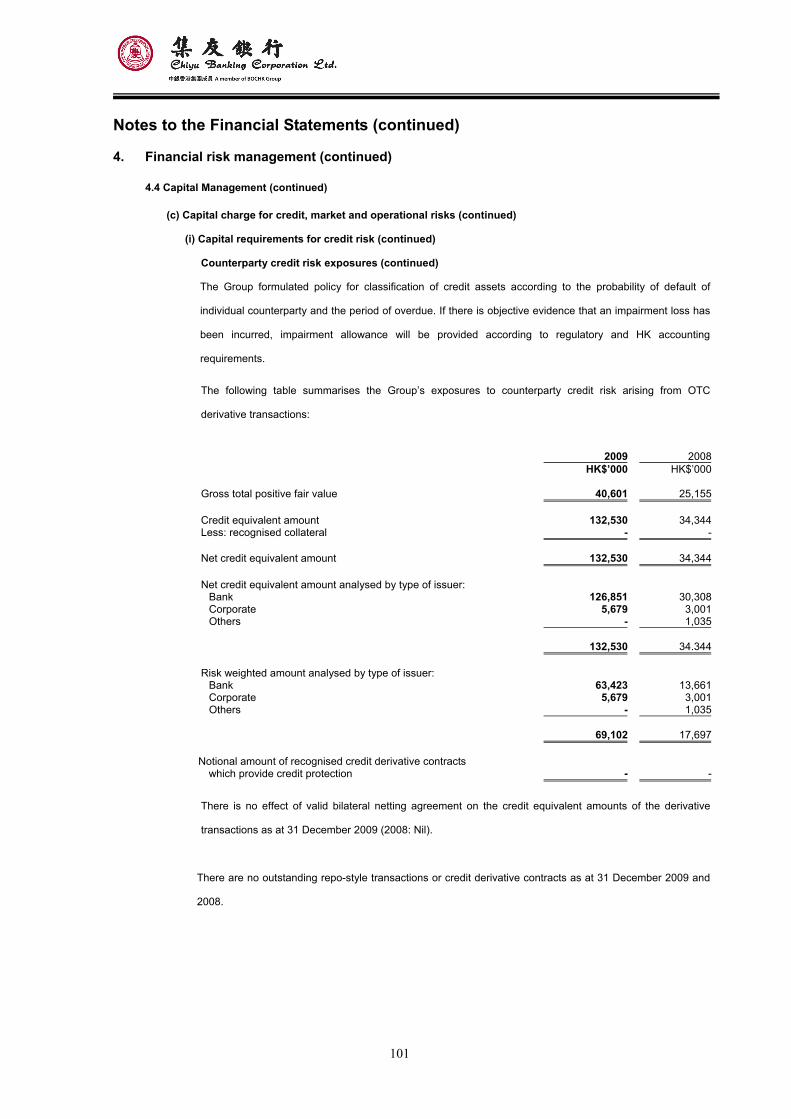
101
Notes to the Financial Statements (continued)
4. Financial risk management (continued)
4.4 Capital Management (continued)
(c) Capital charge for credit, market and operational risks (continued)
(i) Capital requirements for credit risk (continued)
Counterparty credit risk exposures (continued)
The Group formulated policy for classification of credit assets according to the probability of default of
individual counterparty and the period of overdue. If there is objective evidence that an impairment loss has
been incurred, impairment allowance will be provided according to regulatory and HK accounting
requirements.
The following table summarises the Group’s exposures to counterparty credit risk arising from OTC
derivative transactions:
2009 2008
HK$’000 HK$’000 Gross total positive fair value 40,601 25,155
Credit equivalent amount 132,530 34,344Less: recognised collateral - - Net credit equivalent amount 132,530 34,344
Net credit equivalent amount analysed by type of issuer:
Bank 126,851 30,308Corporate 5,679 3,001Others - 1,035
132,530 34.344
Risk weighted amount analysed by type of issuer:
Bank 63,423 13,661Corporate 5,679 3,001Others - 1,035
69,102 17,697
Notional amount of recognised credit derivative contracts
which provide credit protection
- -
There is no effect of valid bilateral netting agreement on the credit equivalent amounts of the derivative
transactions as at 31 December 2009 (2008: Nil).
There are no outstanding repo-style transactions or credit derivative contracts as at 31 December 2009 and
2008.
102
Notes to the Financial Statements (continued)
4. Financial risk management (continued)
4.4 Capital Management (continued)
(c) Capital charge for credit, market and operational risks (continued)
(i) Capital requirements for credit risk (continued)
Credit risk mitigation
For those collaterals recognised under capital management, the Group has well-defined policies and
procedures for collateral valuation and management which is compliant with the operational requirements for
recognised collateral for credit risk mitigation stated in Banking (Capital) Rules.
The main types of recognised collaterals include cash deposit, gold bullion, debt securities, equities and funds
for non past-due exposures. In addition, real property collateral is also recognised for past due exposures.
Those collaterals taken by the Group are compliant with the comprehensive approach in its treatment of
recognised collateral for credit risk mitigation in capital calculation as mentioned in the Banking (Capital)
Rules.
According to the Banking (Capital) Rules, the recognised guarantees for credit risk mitigation under STC
approach includes the guarantee given by sovereign, public sector entity, multilateral development bank, bank,
securities firm with a lower risk weights than the counterparty; or corporate with external credit rating A- or
above.
The concentration risk management for collaterals is embedded in the collateral management policy, including
stress testing. To cope with the requirement under Pillar two, we have adopted a scorecard methodology to
assess our credit concentration risk and consider whether add-on capital charge is needed to cover this risk.
Up to the date of report, the Group has not used any recognised credit derivative contracts, on- or off-balance
sheet recognised netting for credit risk mitigation yet.
103
Notes to the Financial Statements (continued)
4. Financial risk management (continued)
4.4 Capital Management (continued)
(c) Capital charge for credit, market and operational risks (continued)
(i) Capital requirements for credit risk (continued)
Credit risk mitigation (continued)
Exposures, other than those arising from OTC derivative transactions and repo-style transactions, covered by
recognised credit risk mitigation are analysed as follows:
2009 2008 Covered by
recognisedcollateral
Covered byrecognisedguarantees
Covered by recognised
collateral
Covered byrecognisedguarantees
HK$’000 HK$’000 HK$’000 HK$’000
On-balance sheet exposures Corporate 419,847 227,554 367,825 1,470Regulatory retail 82,096 71,939 122,946 3,382Residential mortgage loans 4,964 110,371 9,733 114,150Other exposures which are not past due 39,001 - 79,356 -Past due exposures 5,520 1 3,409 -
Off-balance sheet exposures 66,470 19,300 97,322 6,735 617,898 429,165 680,591 125,737
Asset securitisation
The Bank has not acted as an originating institution in respect of securitisation transactions during the year.
(ii) Capital charge for market risk
2009 2008
HK$’000 HK$’000 Interest rate exposures 732 297Foreign exchange exposures 2,232 13,540 2,964 13,837
The Bank used the standardised (market risk) approach (“STM approach”) for calculation of market risk.
The Bank’s positions covered by STM approach are as follows:
2009 2008 Long Short Long Short HK$’000 HK$’000 HK$’000 HK$’000 Interest rate exposures 973,716 974,075 750,220 750,747Foreign exchange exposures (Net) 27,901 - 169,256 - 1,001,617 974,075 919,476 750,747
104
Notes to the Financial Statements (continued)
4. Financial risk management (continued)
4.4 Capital Management (continued)
(c) Capital charge for credit, market and operational risks (continued)
(ii) Capital charge for market risk (continued)
Equity exposures in banking book
Equity holdings in other entities are accounted for in accordance with the underlying intentions of holdings,
at the outset of the acquisition of the respective equity exposures. Bookings for the equity holdings taken
for relationship and strategic reasons will be separated from the bookings for equity holdings taken for other
reasons (including the reason of capital appreciation).
Gains or losses related to equity exposures are summarised below:
2009 2008
HK$’000 HK$’000 Realised gains from sales or liquidations - - Unrealised gains on revaluation recognized in reserves but not through profit or loss
1,589
1,546
Unrealised gains included in supplementary capital 715 696
(iii) Capital charge for operational risk
2009 2008
HK$’000 HK$’000
Capital charge for operational risk 155,959 155,062
The Bank used the standardised (operational risk) approach (“STO approach”) for calculation of operational
risk.
105
Notes to the Financial Statements (continued)
4. Financial risk management (continued)
4.5 Fair values of financial assets and liabilities
(a) Financial instruments not measured at fair value
Fair value estimates are made at a specific point in time based on relevant market information and information
about various financial instruments. The following methods and assumptions have been used to estimate the fair
value of each class of financial instrument as far as practicable.
Balances with banks and other financial institutions and Trade bills
The maturities of these financial assets and liabilities are within one year and the carrying value approximates
fair value.
Advances to customers, banks and other financial institutions
Substantially all the advances to customers, banks and other financial institutions are on floating rate terms, bear
interest at prevailing market interest rates and their carrying value approximates fair value.
Held-to-maturity securities and loans and receivables
Fair value for held-to-maturity securities and loans and receivables is based on market prices or broker/dealer
price quotations. Where this information is not available, fair value has been estimated using quoted market
prices for securities with similar credit, maturity and yield characteristics.
The carrying value and fair value of held-to-maturity securities as at 31 December 2009 amounted to
HK$3,930,474,000 (2008: HK$3,526,676,000) and HK$3,929,751,000 (2008: HK$3,428,705,000) respectively;
both the carrying value and fair value of loans and receivables as at 31 December 2009 amounted to HK$9,000
(2008: HK$77,645,000 and HK$91,617,000 respectively).
Deposits from customers
Substantially all the deposits from customers mature within one year from balance sheet date and their carrying
value approximates fair value.
106
Notes to the Financial Statements (continued)
4. Financial risk management (continued)
4.5 Fair values of financial assets and liabilities (continued)
(b) Financial instruments measured at fair value
Financial instruments measured at fair value are classified into following three levels:
– Level 1: Quoted prices (unadjusted) in active markets for identical assets or liabilities including spot derivative
contracts.
– Level 2: Valuation technique using inputs other than quoted prices included within level 1 that are observable
for the asset or liability, either directly or indirectly. This level includes the majority of the OTC
derivative contracts and issued structured deposit.
– Level 3: Valuation technique using inputs for the asset or liability that is not based on observable market data
(unobservable inputs). This level includes equity investment and debt instruments with significant
unobservable components.
The Group use valuation techniques or broker/dealer quotations to determine the fair value of financial
instruments when unable to obtain the open market quotation.
The main parameters used in valuation techniques for financial instruments held by the Group include bond
prices, interest rates, foreign exchange rates, equity and stock prices, counterparty credit spreads and others,
which are all observable and obtainable from open market.
For certain illiquid debt securities and unlisted private equity held by the Group, management obtains valuation
quotations from counterparties. The fair value of these financial instruments may be based on unobservable
inputs which may have significant impact on the valuation of these financial instruments, and therefore, these
instruments have been classified by the Group as level 3. The Group has established internal procedures to
control and limit the Group’s exposure to such financial instruments.
There have been no significant transfers between level 1 and 2 during the year 2009.
107
Notes to the Financial Statements (continued)
4. Financial risk management (continued)
4.5 Fair values of financial assets and liabilities (continued)
(b) Financial instruments measured at fair value (continued)
(i) Fair value hierarchy
2009 Level 1 Level 2 Level 3 Total HK$’000 HK$’000 HK$’000 HK$’000Financial assets Financial assets designated at fair value
through profit or loss - Debt securities - 793,116 - 793,116
Derivative financial instruments 307,966 41,970 - 349,936Available-for-sale securities - -
- Debt securities - 507,628 580,774 1,088,402- Equity securities - 45,352 45,352 307,966 1,342,714 626,126 2,276,806
Financial liabilities
Financial liabilities designated at fair value through profit or loss - - - -
Derivative financial instruments (137,786) (26,600) - (164,386)
(137,786) (26,600) - (164,386)
108
Notes to the Financial Statements (continued)
4. Financial risk management (continued)
4.5 Fair values of financial assets and liabilities (continued)
(b) Financial instruments measured at fair value (continued)
(ii) Reconciliation of Level 3 items
2009 Financial assets
Financial assets
designated atfair value
through profit or loss
Available-for-sale securities
Debt
securitiesDebt
securities
Equity securities
Total
HK$’000 HK$’000 HK$’000 HK$’000 At 1 January 2009 224,965 - 41,297 266,262Total gains/(losses)
- Profit or loss 17,786 - - 17,786 - Other comprehensive income - (1,083) 4,055 2,972Purchases - 581,858 - 581,858Sales (242,751) - - (242,751)At 31 December 2009 - 580,775 45,352 626,127
Total gains/(losses) for the year included in profit or loss for assets
held as at 31 December 2009 - - ` - -
Gains or losses included in profit or loss for the year as well as gains or losses relating to assets held as at 31
December 2009 are presented in “Net trading income” or “Net gain/(loss) on financial instruments designated
at fair value through profit or loss” depending on the category of the related financial asset.
109
Notes to the Financial Statements (continued)
5. Net interest income
2009 2008 HK$’000 HK$’000 Interest income Cash and due from banks and other financial institutions 171,829 469,709Advances to customers 486,954 636,414Listed investments 24,558 3,796Unlisted investments 86,056 190,220Others 6,707 16,351
776,104 1,316,490 Interest expense Due to banks, customers and other financial institutions (127,879) (476,761)Debt securities in issue - (4,742)Others (1,124) (7,716)
(129,003) (489,219) Net interest income 647,101 827,271
Included within interest income is HK$359,000 (2008: HK$464,000) of interest with respect to income recognised on
advances classified as impaired for the year ended 31 December 2009.
Included within interest income and interest expense are HK$755,428,000 (2008: HK$1,287,318,000) and
HK$120,827,000 (2008: HK$468,804,000) for financial assets and financial liabilities that are not recognised at fair value
through profit or loss respectively.
With effect from 1 January 2009, interest income and expense for interest rate derivatives held for trading have been
reclassified from “Net interest income” to “Net trading income”. The impact on the respective line items is not
material in either 2009 or 2008 and such comparative figures have not been restated.
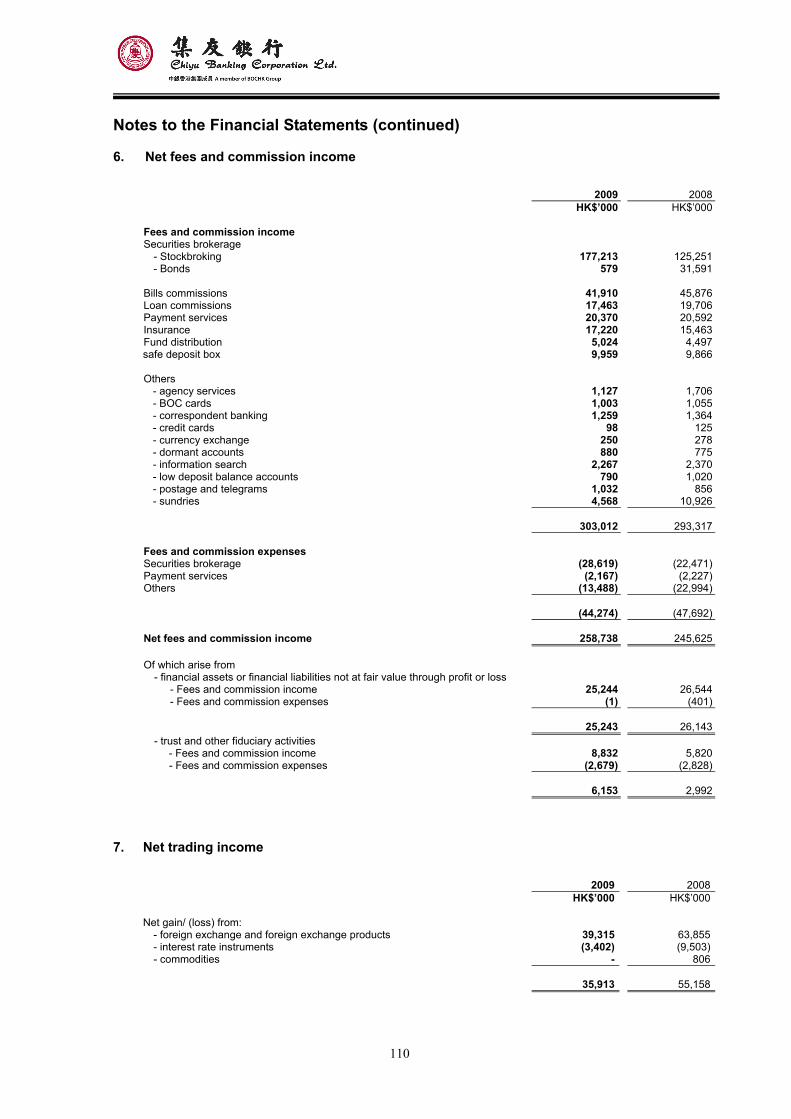
110
Notes to the Financial Statements (continued)
6. Net fees and commission income
2009 2008
HK$’000 HK$’000
Fees and commission income Securities brokerage
- Stockbroking 177,213 125,251- Bonds 579 31,591
Bills commissions 41,910 45,876Loan commissions 17,463 19,706Payment services 20,370 20,592Insurance 17,220 15,463Fund distribution 5,024 4,497safe deposit box 9,959 9,866 Others
- agency services 1,127 1,706- BOC cards 1,003 1,055- correspondent banking 1,259 1,364- credit cards 98 125- currency exchange 250 278- dormant accounts 880 775- information search 2,267 2,370- low deposit balance accounts 790 1,020- postage and telegrams 1,032 856- sundries 4,568 10,926
303,012 293,317
Fees and commission expenses Securities brokerage (28,619) (22,471)Payment services (2,167) (2,227)Others (13,488) (22,994) (44,274) (47,692) Net fees and commission income 258,738 245,625 Of which arise from
- financial assets or financial liabilities not at fair value through profit or loss - Fees and commission income 25,244 26,544- Fees and commission expenses (1) (401)
25,243 26,143- trust and other fiduciary activities
- Fees and commission income 8,832 5,820- Fees and commission expenses (2,679) (2,828)
6,153 2,992
7. Net trading income
2009 2008 HK$’000 HK$’000 Net gain/ (loss) from:
- foreign exchange and foreign exchange products 39,315 63,855- interest rate instruments (3,402) (9,503)- commodities - 806
35,913 55,158
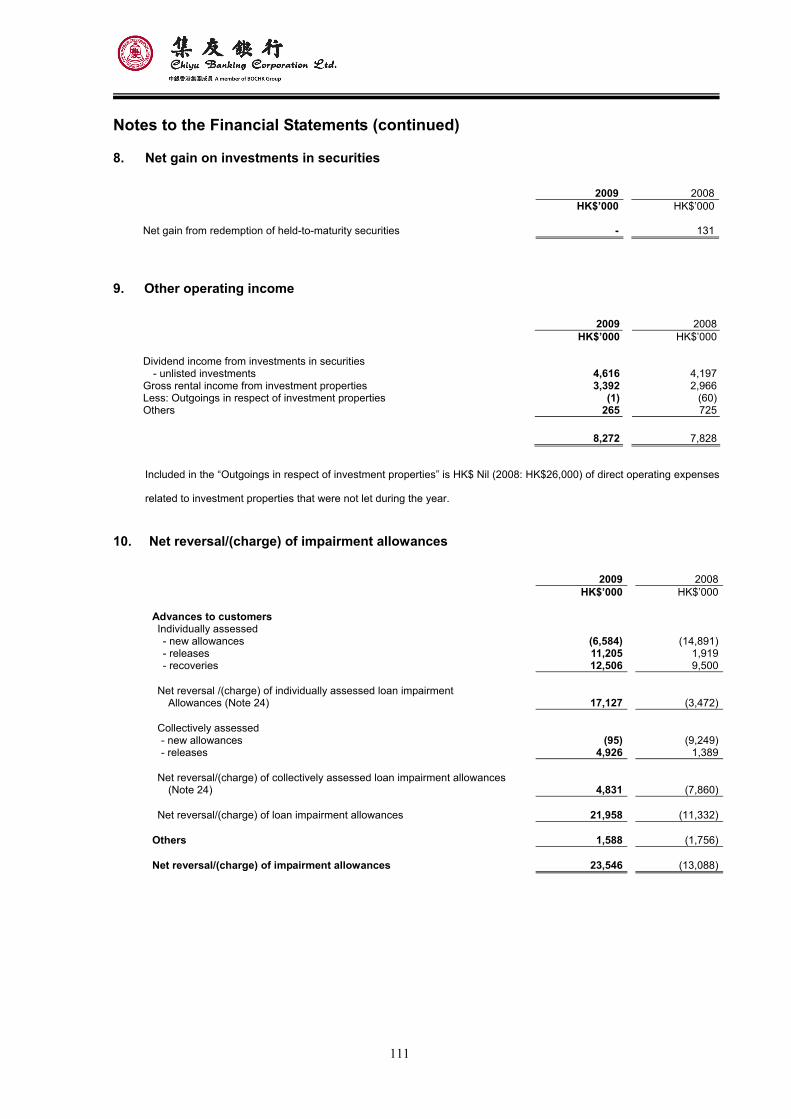
111
Notes to the Financial Statements (continued)
8. Net gain on investments in securities 2009 2008 HK$’000 HK$’000 Net gain from redemption of held-to-maturity securities - 131
9. Other operating income 2009 2008 HK$’000 HK$’000 Dividend income from investments in securities
- unlisted investments 4,616 4,197Gross rental income from investment properties 3,392 2,966Less: Outgoings in respect of investment properties (1) (60)Others 265 725
8,272 7,828
Included in the “Outgoings in respect of investment properties” is HK$ Nil (2008: HK$26,000) of direct operating expenses
related to investment properties that were not let during the year.
10. Net reversal/(charge) of impairment allowances
2009 2008 HK$’000 HK$’000 Advances to customers Individually assessed - new allowances (6,584) (14,891)- releases 11,205 1,919- recoveries 12,506 9,500
Net reversal /(charge) of individually assessed loan impairment
Allowances (Note 24) 17,127 (3,472)
Collectively assessed - new allowances (95) (9,249)- releases 4,926 1,389
Net reversal/(charge) of collectively assessed loan impairment allowances (Note 24) 4,831 (7,860)
Net reversal/(charge) of loan impairment allowances 21,958 (11,332)
Others 1,588 (1,756) Net reversal/(charge) of impairment allowances 23,546 (13,088)
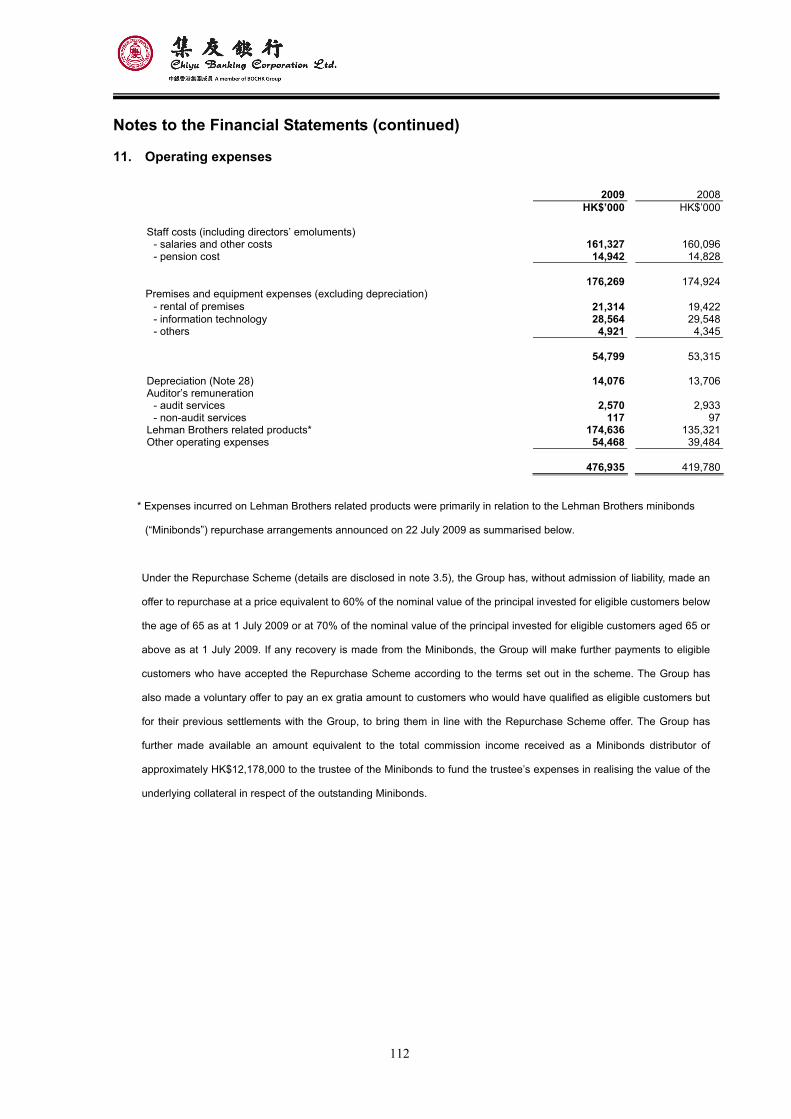
112
Notes to the Financial Statements (continued)
11. Operating expenses
2009 2008 HK$’000 HK$’000
Staff costs (including directors’ emoluments) - salaries and other costs 161,327 160,096- pension cost 14,942 14,828
176,269 174,924Premises and equipment expenses (excluding depreciation)
- rental of premises 21,314 19,422- information technology 28,564 29,548- others 4,921 4,345
54,799 53,315 Depreciation (Note 28) 14,076 13,706Auditor’s remuneration
- audit services 2,570 2,933- non-audit services 117 97
Lehman Brothers related products* 174,636 135,321Other operating expenses 54,468 39,484
476,935 419,780
* Expenses incurred on Lehman Brothers related products were primarily in relation to the Lehman Brothers minibonds
(“Minibonds”) repurchase arrangements announced on 22 July 2009 as summarised below.
Under the Repurchase Scheme (details are disclosed in note 3.5), the Group has, without admission of liability, made an
offer to repurchase at a price equivalent to 60% of the nominal value of the principal invested for eligible customers below
the age of 65 as at 1 July 2009 or at 70% of the nominal value of the principal invested for eligible customers aged 65 or
above as at 1 July 2009. If any recovery is made from the Minibonds, the Group will make further payments to eligible
customers who have accepted the Repurchase Scheme according to the terms set out in the scheme. The Group has
also made a voluntary offer to pay an ex gratia amount to customers who would have qualified as eligible customers but
for their previous settlements with the Group, to bring them in line with the Repurchase Scheme offer. The Group has
further made available an amount equivalent to the total commission income received as a Minibonds distributor of
approximately HK$12,178,000 to the trustee of the Minibonds to fund the trustee’s expenses in realising the value of the
underlying collateral in respect of the outstanding Minibonds.
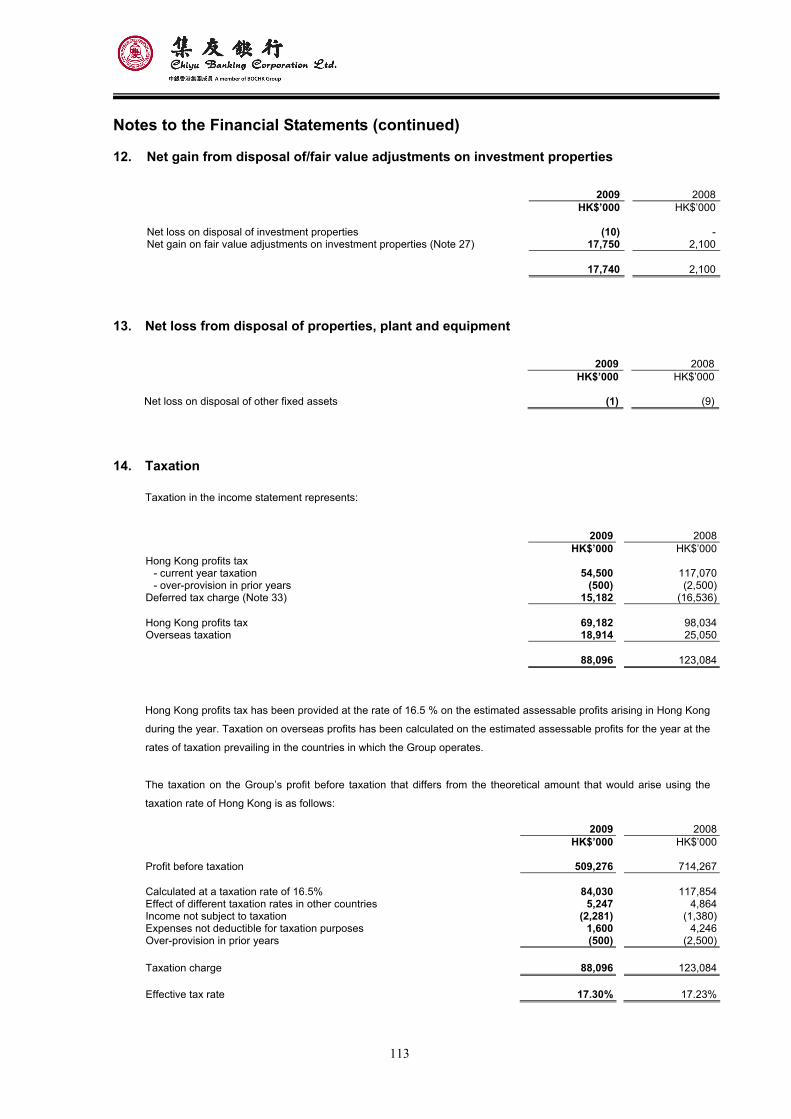
113
Notes to the Financial Statements (continued)
12. Net gain from disposal of/fair value adjustments on investment properties
2009 2008 HK$’000 HK$’000
Net loss on disposal of investment properties (10) -Net gain on fair value adjustments on investment properties (Note 27) 17,750 2,100
17,740 2,100
13. Net loss from disposal of properties, plant and equipment
2009 2008 HK$’000 HK$’000 Net loss on disposal of other fixed assets (1) (9)
14. Taxation
Taxation in the income statement represents:
2009 2008 HK$’000 HK$’000Hong Kong profits tax
- current year taxation 54,500 117,070- over-provision in prior years (500) (2,500)
Deferred tax charge (Note 33) 15,182 (16,536) Hong Kong profits tax 69,182 98,034Overseas taxation 18,914 25,050 88,096 123,084
Hong Kong profits tax has been provided at the rate of 16.5 % on the estimated assessable profits arising in Hong Kong
during the year. Taxation on overseas profits has been calculated on the estimated assessable profits for the year at the
rates of taxation prevailing in the countries in which the Group operates.
The taxation on the Group’s profit before taxation that differs from the theoretical amount that would arise using the
taxation rate of Hong Kong is as follows: 2009 2008
HK$’000 HK$’000
Profit before taxation 509,276 714,267 Calculated at a taxation rate of 16.5% 84,030 117,854Effect of different taxation rates in other countries 5,247 4,864Income not subject to taxation (2,281) (1,380)Expenses not deductible for taxation purposes 1,600 4,246Over-provision in prior years (500) (2,500)
Taxation charge 88,096 123,084 Effective tax rate 17.30% 17.23%
114
Notes to the Financial Statements (continued)
15. Profit attributable to equity holders of the Bank
The profit of the Bank for the year ended 31 December 2009 attributable to equity holders of the Bank and dealt with in
the financial statements of the Bank amounted to HK$418,553,000 (2008: HK$587,198,000).
16. Dividends
2009 2008 Per share Total Per share Total HK$ HK$’000 HK$ HK$’000 First interim dividend paid - - 226.00 678,000First interim dividend declared 48.50 145,500 - -Second interim dividend declared - - 167.00 501,000 48.50 145,500 393.00 1,179,000
At a meeting held on 31 December 2009, the Board declared a first interim dividend of HK$48.50 per ordinary share for
2009 amounting to HK$145,500,000.
17. Retirement benefit costs
The principal defined contribution schemes for the Group’s employees are ORSO schemes exempted under the MPF
Schemes Ordinance and the BOC-Prudential Easy Choice MPF Scheme. Under the ORSO schemes, employees make
monthly contributions to the ORSO schemes equal to 5% of their basic salaries, while the employer makes monthly
contributions equal to 5% to 15% of the employees’ monthly basic salaries, depending on years of service. The
employees are entitled to receive 100% of the employer’s contributions upon termination of employment after completing
20 years of service, or at a scale ranging from 20% to 95% for employees who have completed between 3 to 20 years of
service, on conditions of retirement, early retirement, permanent incapacity and ill-health or termination of employment
other than summary dismissal.
With the implementation of the MPF Schemes Ordinance on 1 December 2000, the Group also participates in the
BOC-Prudential Easy Choice MPF Scheme, of which the trustee is BOCI-Prudential Trustee and the investment manager
is BOCI-Prudential Manager, which are related parties of the Bank.
The Group’s total contributions made to the ORSO schemes for the year ended 31 December 2009 amounted to
approximately HK$11,514,000 (2008: approximately HK$11,715,000), after a deduction of forfeited contributions of
approximately HK$530,000 (2008: approximately HK$618,000). For the MPF Scheme, the Group contributed
approximately HK$1,554,000 (2008: approximately HK$1,457,000) for the year ended 31 December 2009.
115
Notes to the Financial Statements (continued)
18. Share option schemes
(a) Share Option Scheme and Sharesave Plan
The principal terms of the Share Option Scheme and the Sharesave Plan were approved and adopted by written
resolutions of all the shareholders of the Bank’s intermediate holding company, BOCHKHL, dated 10 July 2002.
The purpose of the Share Option Scheme is to provide the participants with the opportunity to acquire proprietary
interests in BOCHKHL. The Board of BOCHKHL (the “BOCHKHL Board”) may, in its absolute discretion, offer to
grant options under the Share Option Scheme to any person as the BOCHKHL Board may select. The subscription
price for the shares shall be determined on the date of grant by the BOCHKHL Board as an amount per share
calculated on the basis of established rules. An option may be exercised in whole or in part at any time after the
date prescribed by the BOCHKHL Board and from time to time as specified in the offer and on or before the
termination date prescribed by the BOCHKHL Board.
The purpose of the Sharesave Plan is to encourage broad-based employee ownership of the shares of BOCHKHL.
The amount of the monthly contribution under the savings contract to be made in connection with an option shall be
the amount which the relevant eligible employee is willing to contribute, which amount shall not be less than 1%
and not more than 10% of the eligible employee’s monthly salary as at the date of application or such other
maximum or minimum amounts as permitted by the BOCHKHL Board. When an option is exercised during an
exercise period, it may be exercised in whole or in part.
No options were granted pursuant to the Share Option Scheme or the Sharesave Plan during the year 2009 (2008:
Nil).
(b) Pre-Listing Share Option Scheme
On 5 July 2002, several directors of the Group were granted options by BOC Hong Kong (BVI) Limited (“BOC
(BVI)”), the immediate holding company of BOCHKHL, pursuant to a Pre-Listing Share Option Scheme to purchase
from BOC (BVI) an aggregate of 3,652,800 existing issued shares of BOCHKHL. The Group has taken advantage
of the transitional provisions set out in paragraph 53 of HKFRS 2 under which the new recognition and
measurement policies have not been applied to all options granted to employees on or before 7 November 2002.
116
Notes to the Financial Statements (continued)
18. Share option schemes (continued)
(b) Pre-Listing Share Option Scheme (continued)
Details of the share options outstanding as at 31 December 2009 are disclosed as follows:
Total number of share options to Directors of the
Group
AverageExercise price
(HK$ per share) At 1 January 2009 778,900 Less: Share options exercised during the year (723,000) 8.5 At 31 December 2009 55,900
Exercisable at 31 December 2009 55,900
Total number of share options to
Directors of the Group
AverageExercise price
(HK$ per share) At 1 January 2008 934,300 Less: Share options exercised during the year (155,400) 8.5 At 31 December 2008 778,900
Exercisable at 31 December 2008 778,900
Share options were exercised on a regular basis throughout the year, the weighted average share price during the
year was HK$16.80 (2008: HK$15.81).
The options granted under this scheme can be exercised at HK$8.50 per share in respect of the option price of
HK$1.00. These options have a vesting period of four years from the date on which dealings in the shares
commenced on the Stock Exchange with a valid exercise period of ten years. No offer to grant any options under
the Pre-Listing Share Option Scheme will be made on or after the date on which dealings in the shares commenced
on the Stock Exchange.
117
Notes to the Financial Statements (continued)
19. Directors’ and senior management’s emoluments
Directors’ emoluments
Details of the emoluments paid to or receivable by the directors of the Bank in respect of their services rendered for the
Bank and managing the subsidiaries within the Group during the year are as follows:
2009 2008 HK$’000 HK$’000 Fees 1,800 2,780 Other emoluments - basic salaries and allowances 3,417 3,047 - discretionary bonuses - 1,781 - others (including pension contributions) 514 475 5,731 8,083
Fees of HK$450,000 (2008: HK$660,000) were paid to the Independent Non-Executive Directors during the year.
In July 2002, options were granted to several Directors of the Group by BOC (BVI), the immediate holding company of
BOCHKHL under the Pre-Listing Share Option Scheme as set out in Note 18(b). Full details of the scheme are stated in
Note 18. During the year, certain options were exercised, but no benefits arising from the granting of these share options
were included in the Directors’ emoluments disclosed above or recognised in the income statement.
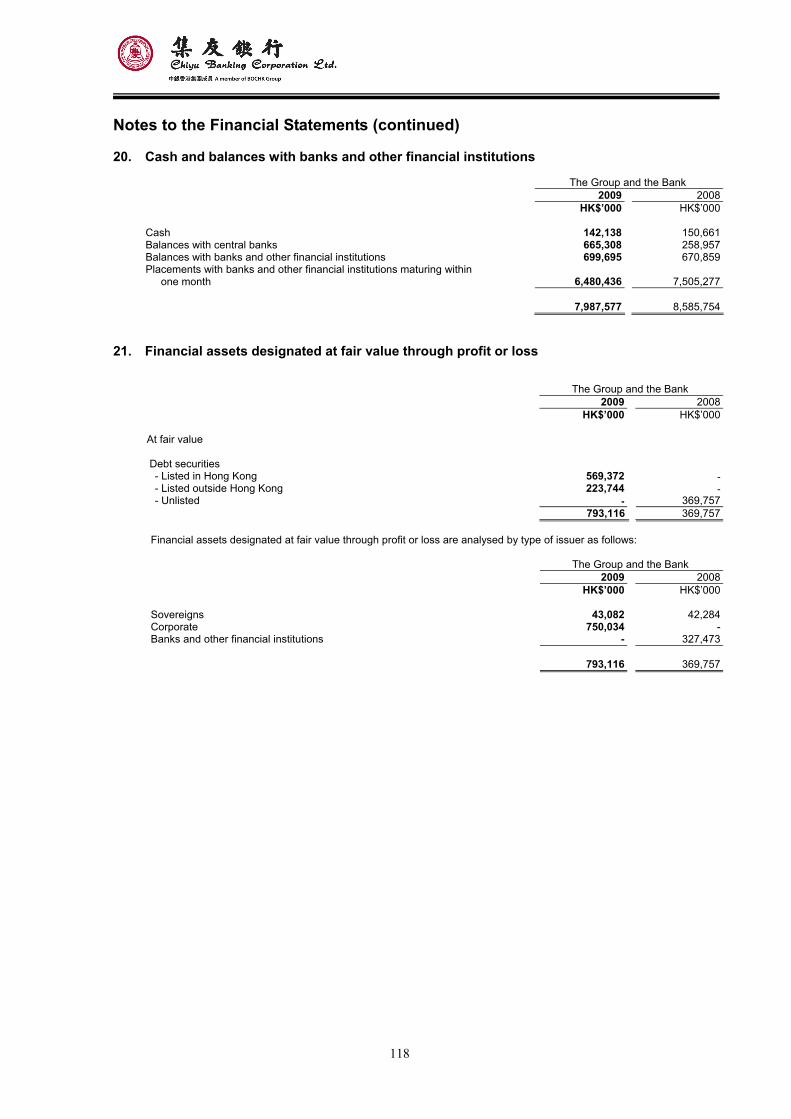
118
Notes to the Financial Statements (continued)
20. Cash and balances with banks and other financial institutions
The Group and the Bank 2009 2008 HK$’000 HK$’000 Cash 142,138 150,661Balances with central banks 665,308 258,957Balances with banks and other financial institutions 699,695 670,859Placements with banks and other financial institutions maturing within
one month 6,480,436 7,505,277 7,987,577 8,585,754
21. Financial assets designated at fair value through profit or loss
The Group and the Bank
2009 2008 HK$’000 HK$’000
At fair value Debt securities - Listed in Hong Kong 569,372 -- Listed outside Hong Kong 223,744 -- Unlisted - 369,757 793,116 369,757
Financial assets designated at fair value through profit or loss are analysed by type of issuer as follows:
The Group and the Bank
2009 2008 HK$’000 HK$’000 Sovereigns 43,082 42,284Corporate 750,034 -Banks and other financial institutions - 327,473
793,116 369,757
119
Notes to the Financial Statements (continued)
22. Derivative financial instruments
The Group enters into the following equity, foreign exchange, interest rate and bullion related derivative financial
instruments for trading and risk management purposes:
Currency forwards represent commitments to purchase and sell foreign currency on a future date.
Currency and interest rate swaps are commitments to exchange one set of cash flows for another. Swaps result in an
exchange of currencies or interest rates (for example, fixed rate for floating rate) or a combination of all these (i.e.
cross-currency interest rate swaps). Except for certain currency swap contracts, no exchange of principal takes place.
Foreign currency, interest rate and equity options are contractual agreements under which the seller (writer) grants the
purchaser (holder) the right, but not the obligation, either to buy (a call option) or sell (a put option) at or by a set date or
during a set period, a specific amount of the financial instrument at a predetermined price. In consideration for the
assumption of foreign exchange and interest rate risk, the seller receives a premium from the purchaser. Options are
negotiated over-the-counter (“OTC”) between the Group and its counterparty or traded through the stock exchange (for
example, exchange-traded stock option).
The contract/notional amounts and fair values of derivative financial instruments held by the Group are set out in the
following tables. The contract/notional amounts of these instruments indicate the volume of transactions outstanding at
the balance sheet dates and certain of them provide a basis for comparison with fair value instruments recognised on the
consolidated balance sheet. However, they do not necessarily indicate the amounts of future cash flows involved or the
current fair values of the instruments and, therefore, do not indicate the Group’s exposure to credit or market risks. The
derivative financial instruments become favourable (assets) or unfavourable (liabilities) as a result of fluctuations in
market interest rates, foreign exchange rates or equity prices relative to their terms. The aggregate fair values of
derivative financial instruments assets and liabilities can fluctuate significantly from time to time.
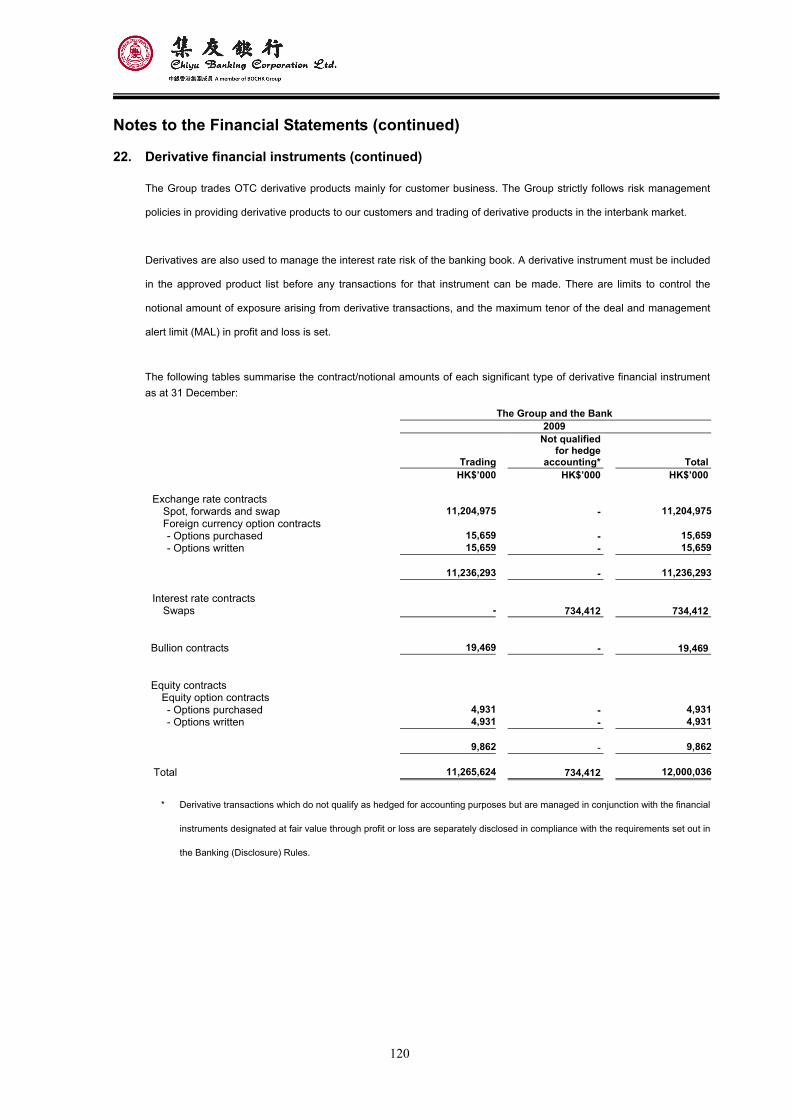
120
Notes to the Financial Statements (continued)
22. Derivative financial instruments (continued)
The Group trades OTC derivative products mainly for customer business. The Group strictly follows risk management
policies in providing derivative products to our customers and trading of derivative products in the interbank market.
Derivatives are also used to manage the interest rate risk of the banking book. A derivative instrument must be included
in the approved product list before any transactions for that instrument can be made. There are limits to control the
notional amount of exposure arising from derivative transactions, and the maximum tenor of the deal and management
alert limit (MAL) in profit and loss is set.
The following tables summarise the contract/notional amounts of each significant type of derivative financial instrument as at 31 December:
The Group and the Bank 2009
Trading
Not qualified for hedge
accounting* Total HK$’000 HK$’000 HK$’000 Exchange rate contracts Spot, forwards and swap 11,204,975 - 11,204,975 Foreign currency option contracts
- Options purchased 15,659 - 15,659- Options written 15,659 - 15,659
11,236,293 - 11,236,293 Interest rate contracts
Swaps - 734,412 734,412
Bullion contracts 19,469 - 19,469 Equity contracts
Equity option contracts - Options purchased 4,931 - 4,931- Options written 4,931 - 4,931
9,862 - 9,862 Total 11,265,624 734,412 12,000,036
* Derivative transactions which do not qualify as hedged for accounting purposes but are managed in conjunction with the financial
instruments designated at fair value through profit or loss are separately disclosed in compliance with the requirements set out in
the Banking (Disclosure) Rules.
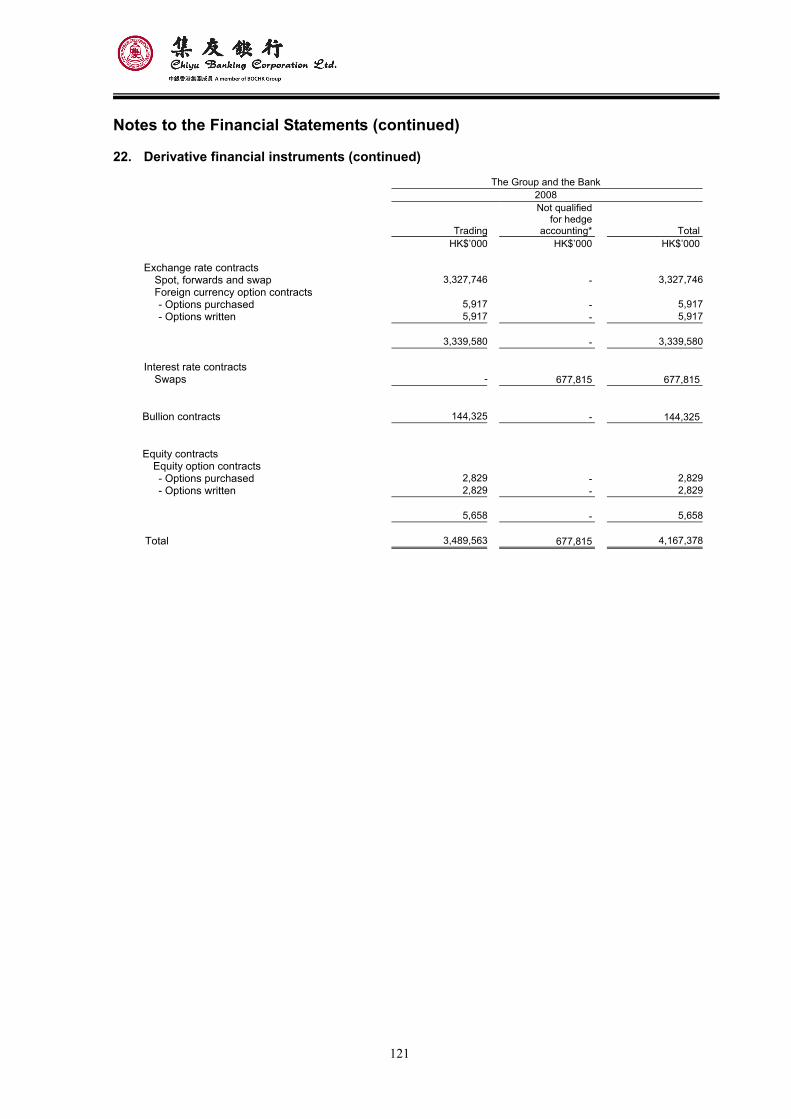
121
Notes to the Financial Statements (continued)
22. Derivative financial instruments (continued)
The Group and the Bank 2008
Trading
Not qualified for hedge
accounting* Total HK$’000 HK$’000 HK$’000 Exchange rate contracts Spot, forwards and swap 3,327,746 - 3,327,746 Foreign currency option contracts
- Options purchased 5,917 - 5,917- Options written 5,917 - 5,917
3,339,580 - 3,339,580 Interest rate contracts
Swaps - 677,815 677,815
Bullion contracts 144,325 - 144,325 Equity contracts
Equity option contracts - Options purchased 2,829 - 2,829- Options written 2,829 - 2,829
5,658 - 5,658 Total 3,489,563 677,815 4,167,378
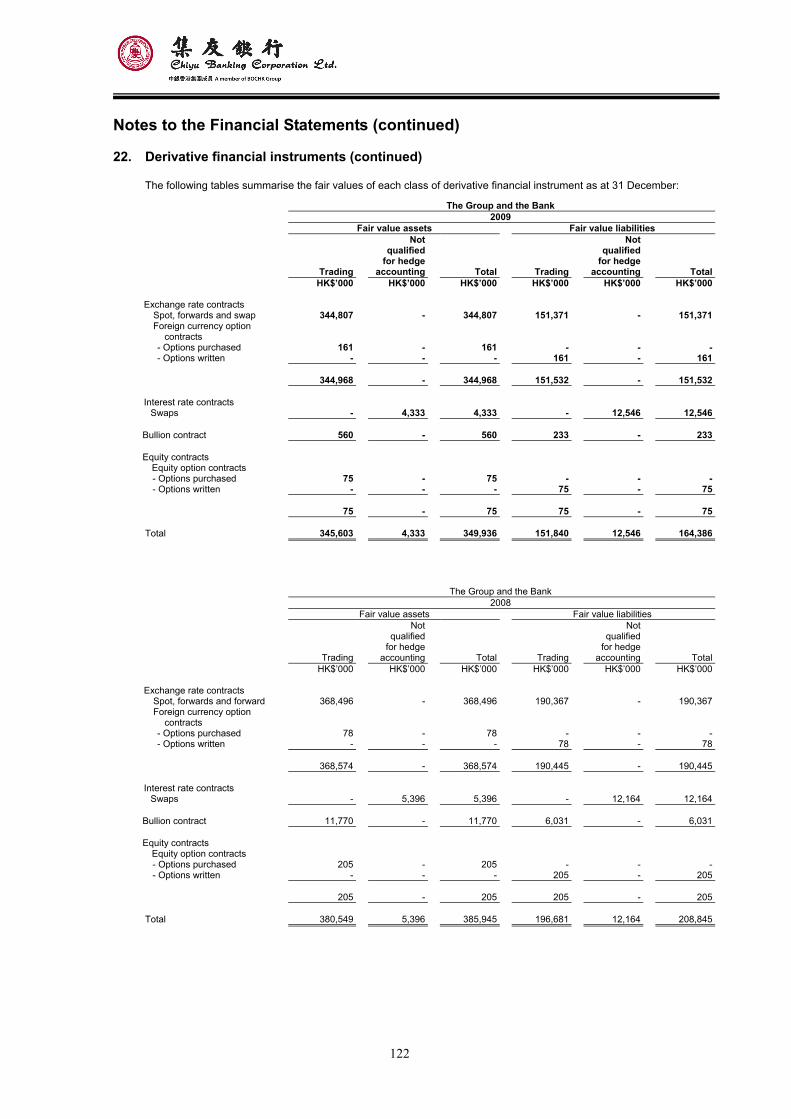
122
Notes to the Financial Statements (continued)
22. Derivative financial instruments (continued)
The following tables summarise the fair values of each class of derivative financial instrument as at 31 December:
The Group and the Bank 2009 Fair value assets Fair value liabilities
Trading
Notqualified
for hedgeaccounting Total Trading
Not qualified
for hedge accounting Total
HK$’000 HK$’000 HK$’000 HK$’000 HK$’000 HK$’000 Exchange rate contracts Spot, forwards and swap 344,807 - 344,807 151,371 - 151,371 Foreign currency option
contracts
- Options purchased 161 - 161 - - -- Options written - - - 161 - 161
344,968 - 344,968 151,532 - 151,532 Interest rate contracts
Swaps - 4,333 4,333 - 12,546 12,546 Bullion contract 560 - 560 233 - 233 Equity contracts
Equity option contracts - Options purchased 75 - 75 - - -- Options written - - - 75 - 75
75 - 75 75 - 75 Total 345,603 4,333 349,936 151,840 12,546 164,386
The Group and the Bank 2008 Fair value assets Fair value liabilities
Trading
Notqualified
for hedgeaccounting Total Trading
Not qualified
for hedge accounting Total
HK$’000 HK$’000 HK$’000 HK$’000 HK$’000 HK$’000 Exchange rate contracts Spot, forwards and forward 368,496 - 368,496 190,367 - 190,367 Foreign currency option
contracts
- Options purchased 78 - 78 - - -- Options written - - - 78 - 78
368,574 - 368,574 190,445 - 190,445 Interest rate contracts
Swaps - 5,396 5,396 - 12,164 12,164 Bullion contract 11,770 - 11,770 6,031 - 6,031 Equity contracts
Equity option contracts - Options purchased 205 - 205 - - -- Options written - - - 205 - 205
205 - 205 205 - 205 Total 380,549 5,396 385,945 196,681 12,164 208,845
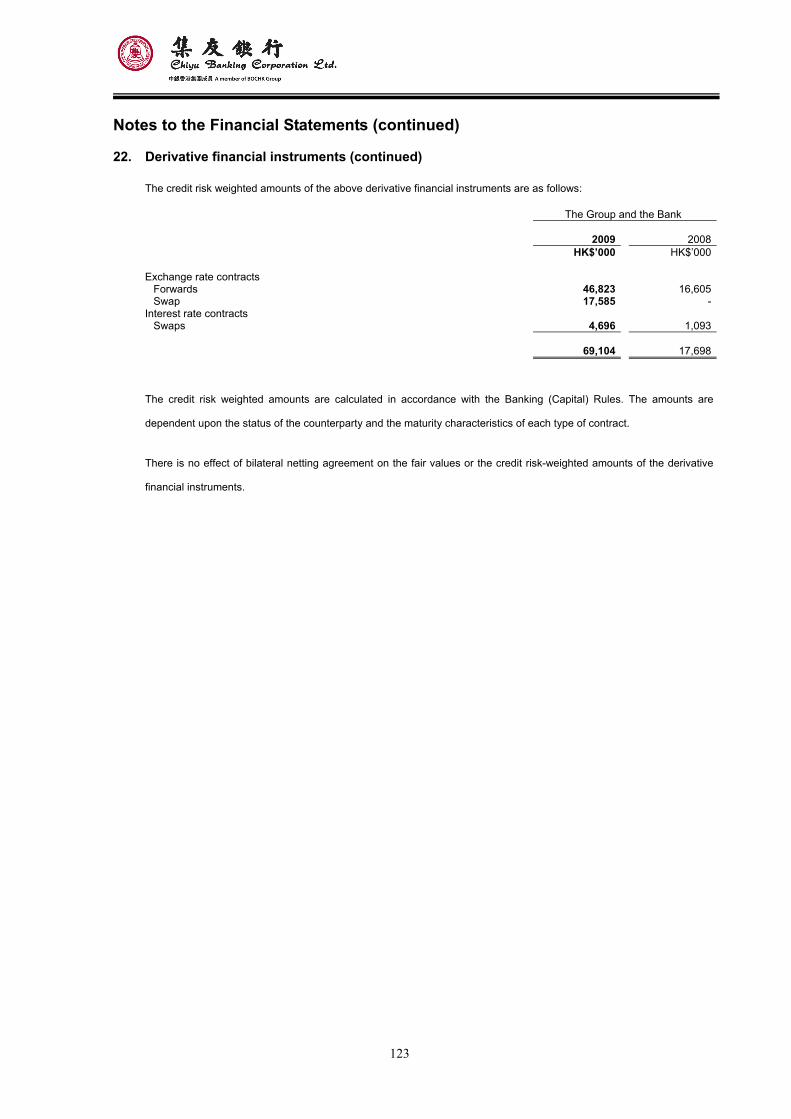
123
Notes to the Financial Statements (continued)
22. Derivative financial instruments (continued)
The credit risk weighted amounts of the above derivative financial instruments are as follows:
The Group and the Bank 2009 2008
HK$’000 HK$’000 Exchange rate contracts
Forwards 46,823 16,605Swap 17,585 -
Interest rate contracts Swaps 4,696 1,093
69,104 17,698
The credit risk weighted amounts are calculated in accordance with the Banking (Capital) Rules. The amounts are
dependent upon the status of the counterparty and the maturity characteristics of each type of contract.
There is no effect of bilateral netting agreement on the fair values or the credit risk-weighted amounts of the derivative
financial instruments.
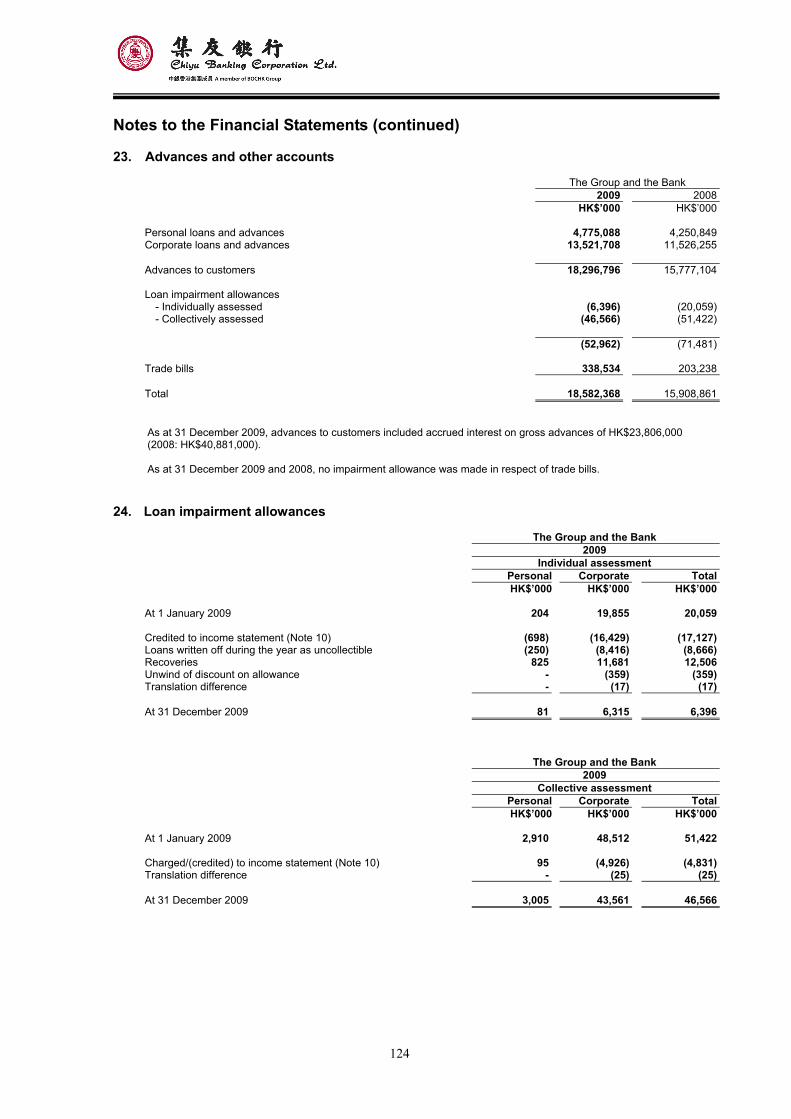
124
Notes to the Financial Statements (continued)
23. Advances and other accounts
The Group and the Bank 2009 2008 HK$’000 HK$’000 Personal loans and advances 4,775,088 4,250,849Corporate loans and advances 13,521,708 11,526,255 Advances to customers 18,296,796 15,777,104 Loan impairment allowances
- Individually assessed (6,396) (20,059)- Collectively assessed (46,566) (51,422)
(52,962) (71,481) Trade bills 338,534 203,238 Total 18,582,368 15,908,861 As at 31 December 2009, advances to customers included accrued interest on gross advances of HK$23,806,000 (2008: HK$40,881,000). As at 31 December 2009 and 2008, no impairment allowance was made in respect of trade bills.
24. Loan impairment allowances
The Group and the Bank 2009 Individual assessment Personal Corporate Total HK$’000 HK$’000 HK$’000 At 1 January 2009 204 19,855 20,059
Credited to income statement (Note 10) (698) (16,429) (17,127)Loans written off during the year as uncollectible (250) (8,416) (8,666)Recoveries 825 11,681 12,506Unwind of discount on allowance - (359) (359)Translation difference - (17) (17) At 31 December 2009 81 6,315 6,396
The Group and the Bank 2009 Collective assessment Personal Corporate Total HK$’000 HK$’000 HK$’000 At 1 January 2009 2,910 48,512 51,422
Charged/(credited) to income statement (Note 10) 95 (4,926) (4,831)Translation difference - (25) (25) At 31 December 2009 3,005 43,561 46,566
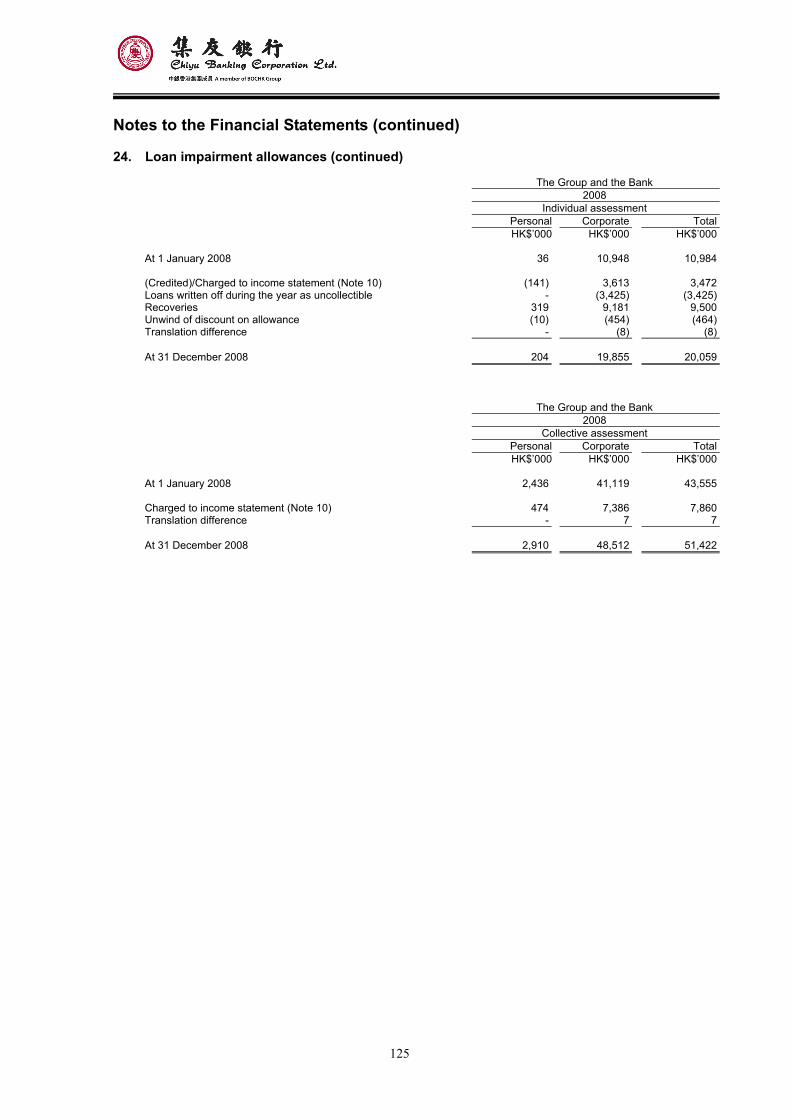
125
Notes to the Financial Statements (continued)
24. Loan impairment allowances (continued)
The Group and the Bank 2008 Individual assessment Personal Corporate Total HK$’000 HK$’000 HK$’000 At 1 January 2008 36 10,948 10,984
(Credited)/Charged to income statement (Note 10) (141) 3,613 3,472Loans written off during the year as uncollectible - (3,425) (3,425)Recoveries 319 9,181 9,500Unwind of discount on allowance (10) (454) (464)Translation difference - (8) (8) At 31 December 2008 204 19,855 20,059
The Group and the Bank 2008 Collective assessment Personal Corporate Total HK$’000 HK$’000 HK$’000 At 1 January 2008 2,436 41,119 43,555
Charged to income statement (Note 10) 474 7,386 7,860Translation difference - 7 7 At 31 December 2008 2,910 48,512 51,422
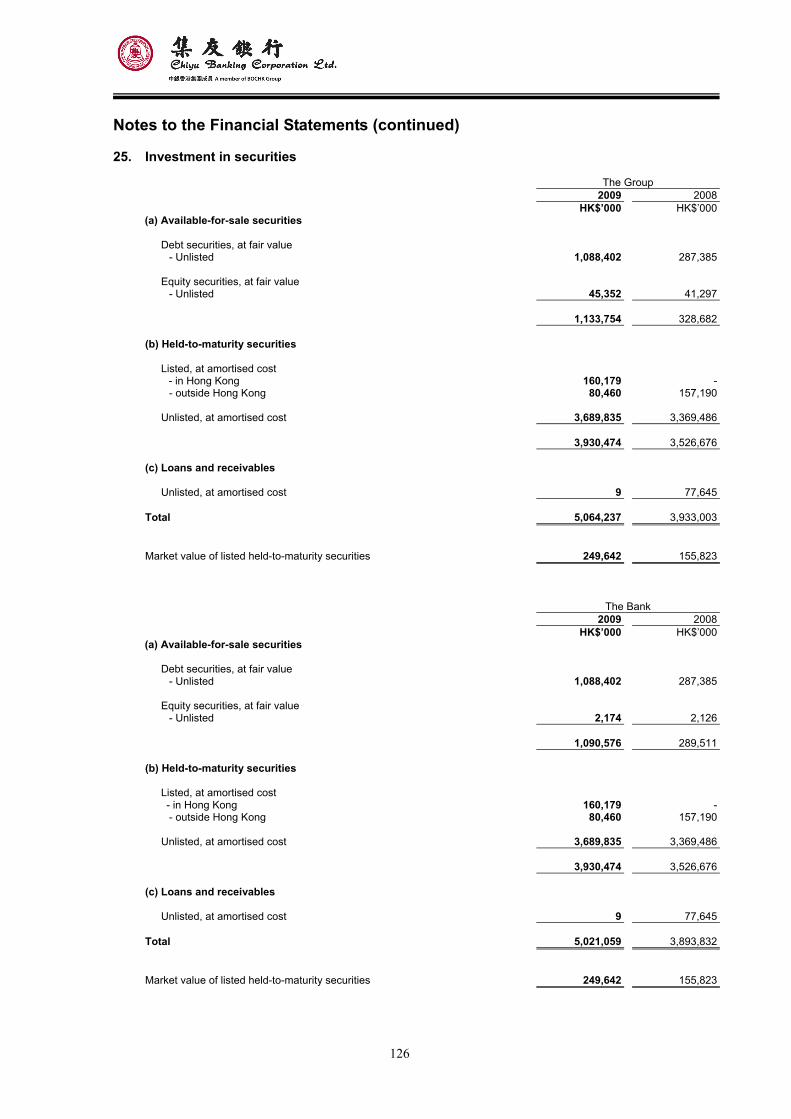
126
Notes to the Financial Statements (continued)
25. Investment in securities
The Group 2009 2008 HK$’000 HK$’000
(a) Available-for-sale securities
Debt securities, at fair value - Unlisted 1,088,402 287,385
Equity securities, at fair value
- Unlisted 45,352 41,297 1,133,754 328,682
(b) Held-to-maturity securities
Listed, at amortised cost - in Hong Kong 160,179 -- outside Hong Kong 80,460 157,190
Unlisted, at amortised cost 3,689,835 3,369,486
3,930,474 3,526,676 (c) Loans and receivables
Unlisted, at amortised cost 9 77,645 Total 5,064,237 3,933,003 Market value of listed held-to-maturity securities 249,642 155,823
The Bank 2009 2008 HK$’000 HK$’000(a) Available-for-sale securities
Debt securities, at fair value - Unlisted 1,088,402 287,385
Equity securities, at fair value
- Unlisted 2,174 2,126 1,090,576 289,511
(b) Held-to-maturity securities
Listed, at amortised cost - in Hong Kong 160,179 -- outside Hong Kong 80,460 157,190
Unlisted, at amortised cost 3,689,835 3,369,486 3,930,474 3,526,676 (c) Loans and receivables
Unlisted, at amortised cost 9 77,645 Total 5,021,059 3,893,832 Market value of listed held-to-maturity securities 249,642 155,823
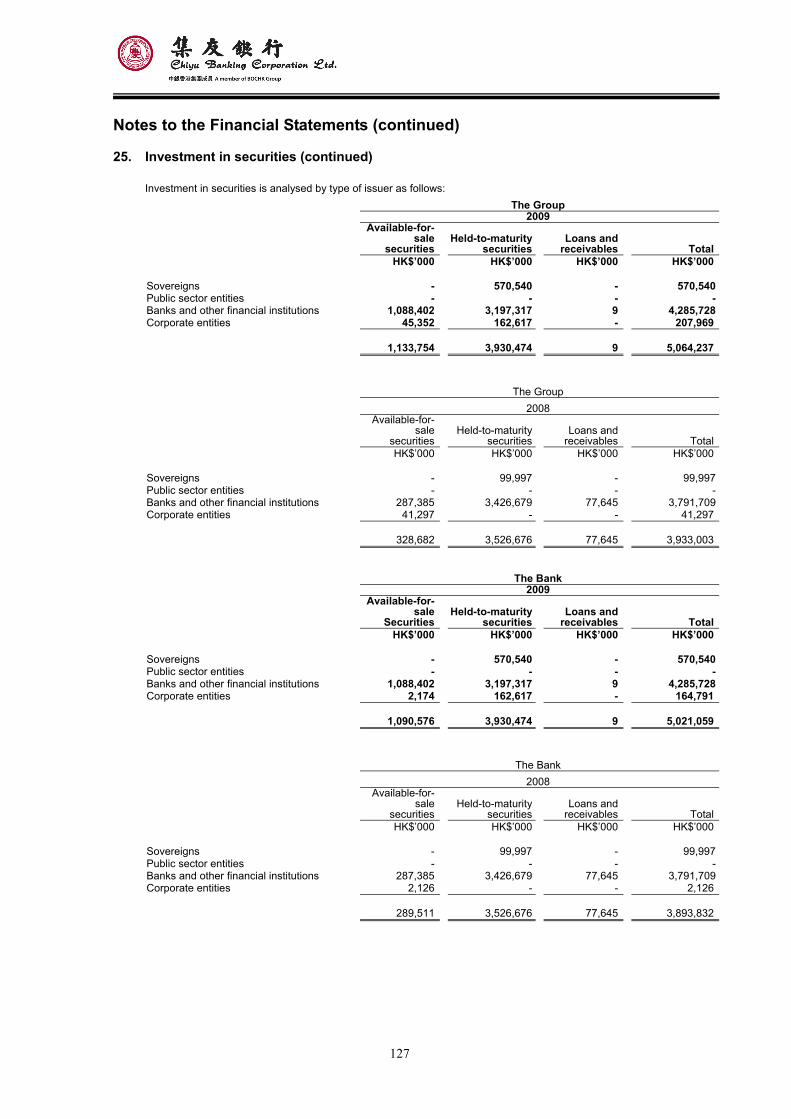
127
Notes to the Financial Statements (continued)
25. Investment in securities (continued)
Investment in securities is analysed by type of issuer as follows: The Group 2009
Available-for-
salesecurities
Held-to-maturitysecurities
Loans and receivables Total
HK$’000 HK$’000 HK$’000 HK$’000 Sovereigns - 570,540 - 570,540Public sector entities - - - -Banks and other financial institutions 1,088,402 3,197,317 9 4,285,728Corporate entities 45,352 162,617 - 207,969 1,133,754 3,930,474 9 5,064,237
The Group 2008
Available-for-
salesecurities
Held-to-maturitysecurities
Loans and receivables Total
HK$’000 HK$’000 HK$’000 HK$’000 Sovereigns - 99,997 - 99,997Public sector entities - - - -Banks and other financial institutions 287,385 3,426,679 77,645 3,791,709Corporate entities 41,297 - - 41,297 328,682 3,526,676 77,645 3,933,003
The Bank 2009
Available-for-
saleSecurities
Held-to-maturitysecurities
Loans and receivables Total
HK$’000 HK$’000 HK$’000 HK$’000 Sovereigns - 570,540 - 570,540Public sector entities - - - -Banks and other financial institutions 1,088,402 3,197,317 9 4,285,728Corporate entities 2,174 162,617 - 164,791 1,090,576 3,930,474 9 5,021,059
The Bank 2008
Available-for-
salesecurities
Held-to-maturitysecurities
Loans and receivables Total
HK$’000 HK$’000 HK$’000 HK$’000 Sovereigns - 99,997 - 99,997Public sector entities - - - -Banks and other financial institutions 287,385 3,426,679 77,645 3,791,709Corporate entities 2,126 - - 2,126 289,511 3,526,676 77,645 3,893,832
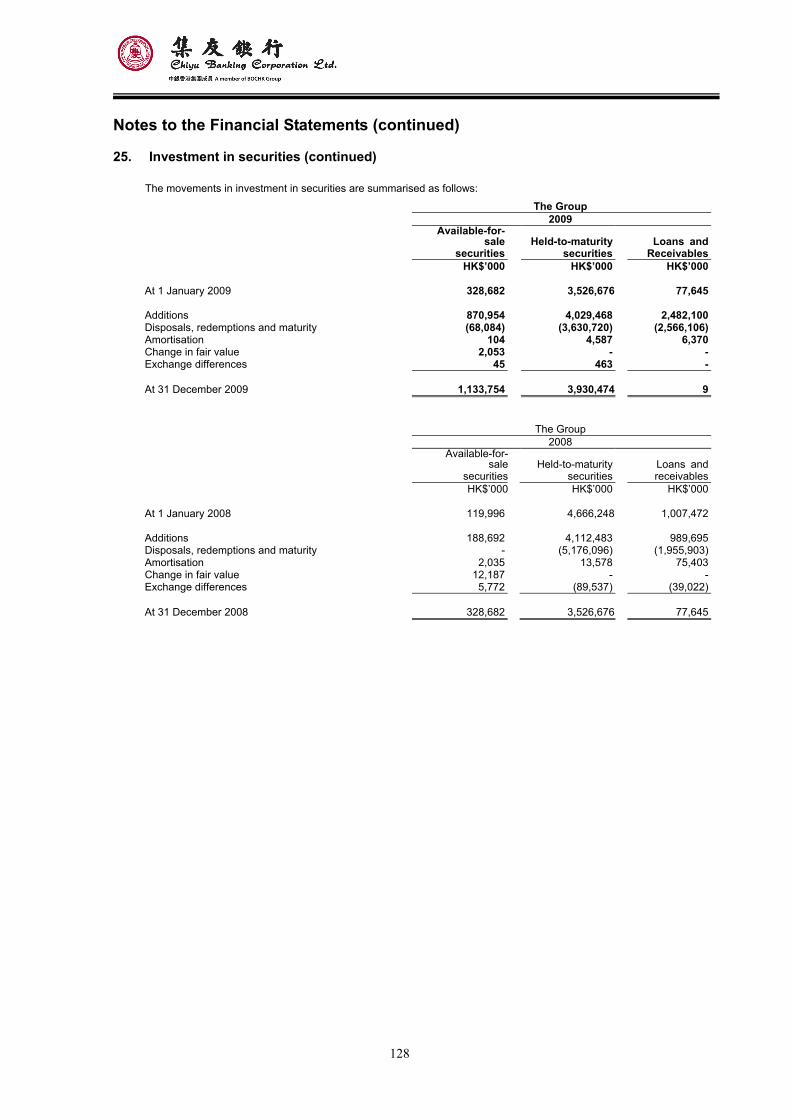
128
Notes to the Financial Statements (continued)
25. Investment in securities (continued)
The movements in investment in securities are summarised as follows:
The Group 2009
Available-for-
salesecurities
Held-to-maturity securities
Loans andReceivables
HK$’000 HK$’000 HK$’000 At 1 January 2009 328,682 3,526,676 77,645
Additions 870,954 4,029,468 2,482,100Disposals, redemptions and maturity (68,084) (3,630,720) (2,566,106)Amortisation 104 4,587 6,370Change in fair value 2,053 - -Exchange differences 45 463 - At 31 December 2009 1,133,754 3,930,474 9
The Group 2008
Available-for-
salesecurities
Held-to-maturity securities
Loans andreceivables
HK$’000 HK$’000 HK$’000 At 1 January 2008 119,996 4,666,248 1,007,472
Additions 188,692 4,112,483 989,695Disposals, redemptions and maturity - (5,176,096) (1,955,903)Amortisation 2,035 13,578 75,403Change in fair value 12,187 - -Exchange differences 5,772 (89,537) (39,022) At 31 December 2008 328,682 3,526,676 77,645
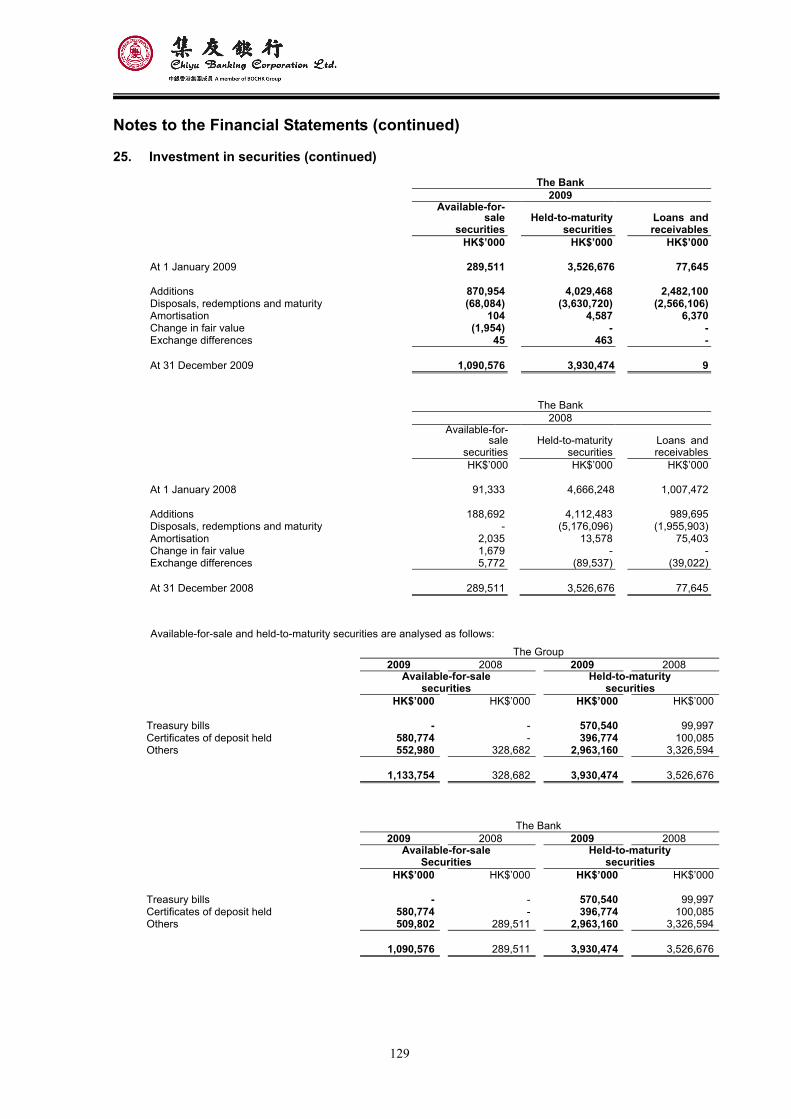
129
Notes to the Financial Statements (continued)
25. Investment in securities (continued)
The Bank 2009
Available-for-
salesecurities
Held-to-maturity securities
Loans andreceivables
HK$’000 HK$’000 HK$’000 At 1 January 2009 289,511 3,526,676 77,645
Additions 870,954 4,029,468 2,482,100Disposals, redemptions and maturity (68,084) (3,630,720) (2,566,106)Amortisation 104 4,587 6,370Change in fair value (1,954) - -Exchange differences 45 463 -
At 31 December 2009 1,090,576 3,930,474 9
The Bank 2008
Available-for-
salesecurities
Held-to-maturity securities
Loans andreceivables
HK$’000 HK$’000 HK$’000 At 1 January 2008 91,333 4,666,248 1,007,472
Additions 188,692 4,112,483 989,695Disposals, redemptions and maturity - (5,176,096) (1,955,903)Amortisation 2,035 13,578 75,403Change in fair value 1,679 - -Exchange differences 5,772 (89,537) (39,022)
At 31 December 2008 289,511 3,526,676 77,645
Available-for-sale and held-to-maturity securities are analysed as follows:
The Group 2009 2008 2009 2008
Available-for-sale securities
Held-to-maturity securities
HK$’000 HK$’000 HK$’000 HK$’000 Treasury bills - - 570,540 99,997Certificates of deposit held 580,774 - 396,774 100,085Others 552,980 328,682 2,963,160 3,326,594 1,133,754 328,682 3,930,474 3,526,676
The Bank 2009 2008 2009 2008
Available-for-sale Securities
Held-to-maturity securities
HK$’000 HK$’000 HK$’000 HK$’000 Treasury bills - - 570,540 99,997Certificates of deposit held 580,774 - 396,774 100,085Others 509,802 289,511 2,963,160 3,326,594 1,090,576 289,511 3,930,474 3,526,676
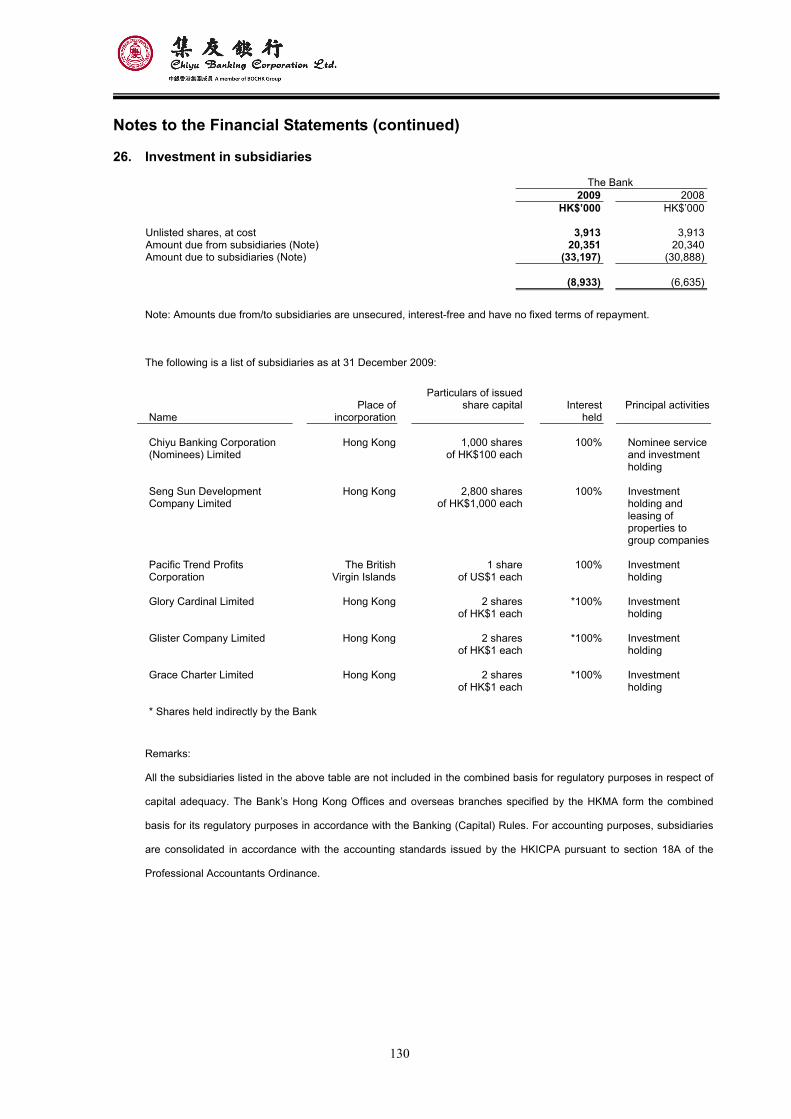
130
Notes to the Financial Statements (continued)
26. Investment in subsidiaries
The Bank 2009 2008 HK$’000 HK$’000
Unlisted shares, at cost 3,913 3,913Amount due from subsidiaries (Note) 20,351 20,340Amount due to subsidiaries (Note) (33,197) (30,888) (8,933) (6,635)
Note: Amounts due from/to subsidiaries are unsecured, interest-free and have no fixed terms of repayment.
The following is a list of subsidiaries as at 31 December 2009:
Name
Place of
incorporation
Particulars of issued share capital
Interest
held
Principal activities
Chiyu Banking Corporation (Nominees) Limited
Hong Kong 1,000 shares of HK$100 each
100% Nominee service and investment holding
Seng Sun Development Company Limited
Hong Kong 2,800 shares of HK$1,000 each
100% Investment holding and leasing of properties to group companies
Pacific Trend Profits Corporation
The BritishVirgin Islands
1 share of US$1 each
100% Investment holding
Glory Cardinal Limited Hong Kong 2 shares
of HK$1 each*100%
Investment
holding Glister Company Limited Hong Kong 2 shares
of HK$1 each*100%
Investment
holding Grace Charter Limited Hong Kong 2 shares
of HK$1 each*100%
Investment
holding * Shares held indirectly by the Bank
Remarks:
All the subsidiaries listed in the above table are not included in the combined basis for regulatory purposes in respect of
capital adequacy. The Bank’s Hong Kong Offices and overseas branches specified by the HKMA form the combined
basis for its regulatory purposes in accordance with the Banking (Capital) Rules. For accounting purposes, subsidiaries
are consolidated in accordance with the accounting standards issued by the HKICPA pursuant to section 18A of the
Professional Accountants Ordinance.
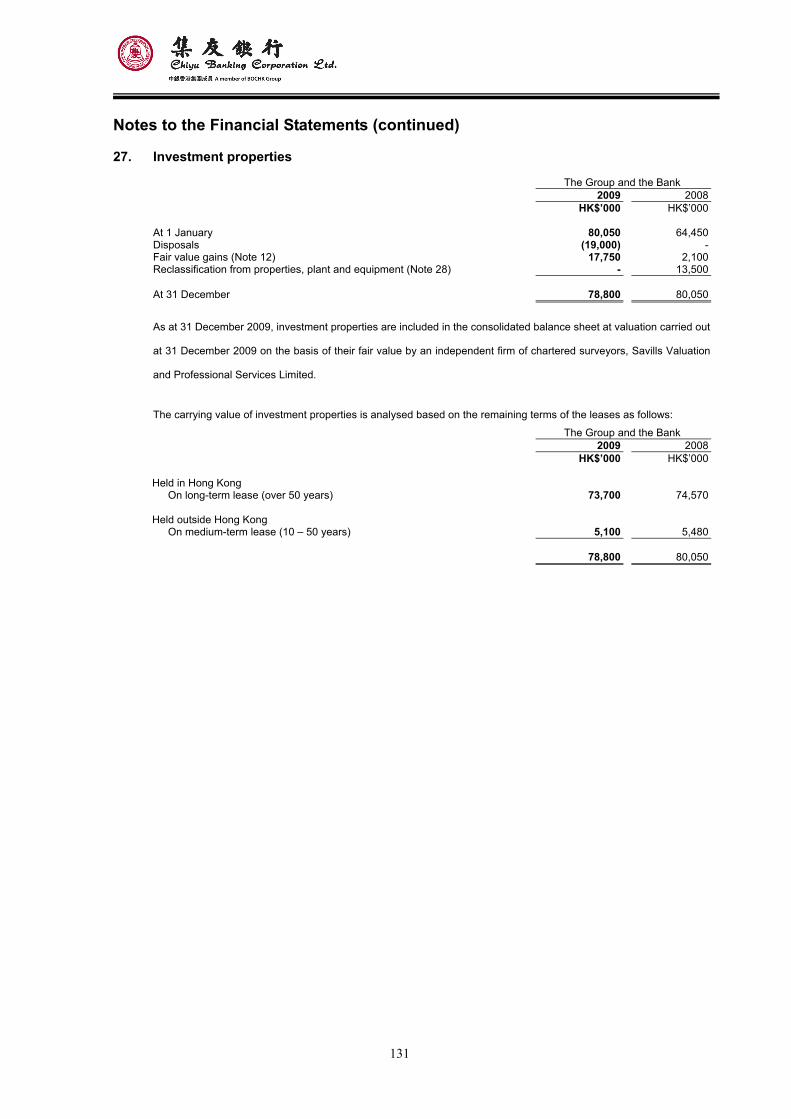
131
Notes to the Financial Statements (continued)
27. Investment properties
The Group and the Bank 2009 2008 HK$’000 HK$’000
At 1 January 80,050 64,450Disposals (19,000) -Fair value gains (Note 12) 17,750 2,100Reclassification from properties, plant and equipment (Note 28) - 13,500 At 31 December 78,800 80,050
As at 31 December 2009, investment properties are included in the consolidated balance sheet at valuation carried out
at 31 December 2009 on the basis of their fair value by an independent firm of chartered surveyors, Savills Valuation
and Professional Services Limited.
The carrying value of investment properties is analysed based on the remaining terms of the leases as follows:
The Group and the Bank 2009 2008 HK$’000 HK$’000 Held in Hong Kong
On long-term lease (over 50 years) 73,700 74,570
Held outside Hong Kong On medium-term lease (10 – 50 years) 5,100 5,480
78,800 80,050
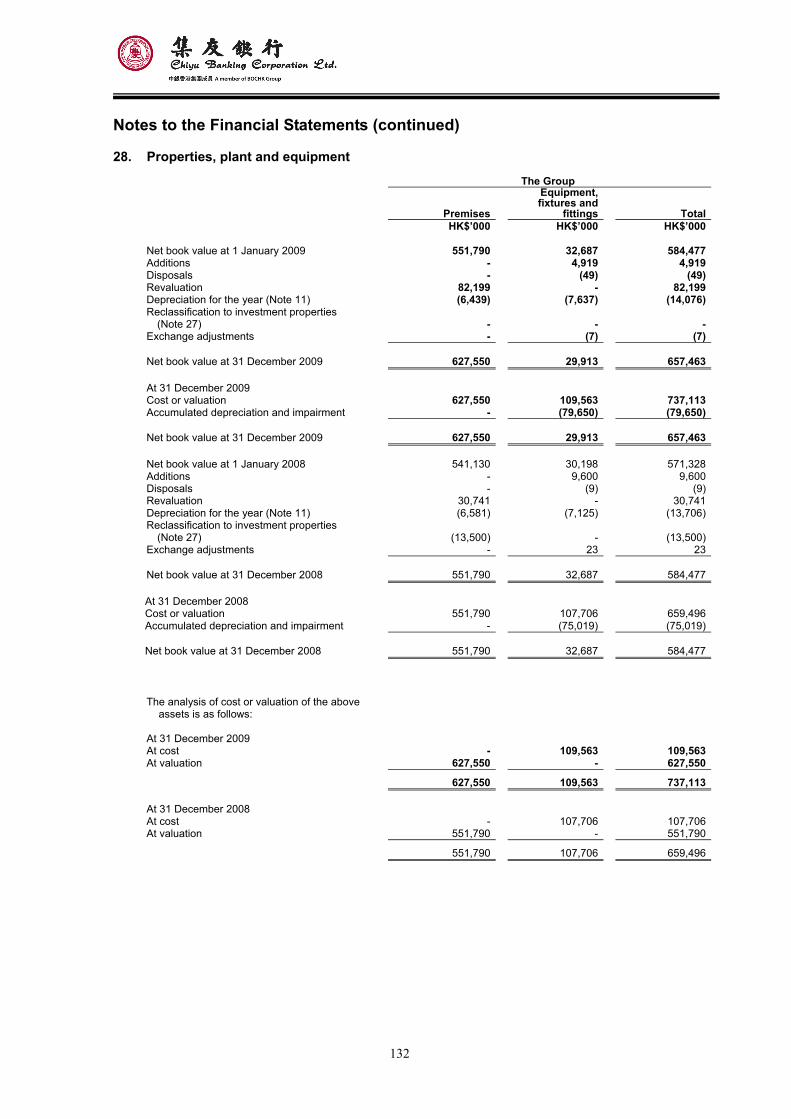
132
Notes to the Financial Statements (continued)
28. Properties, plant and equipment
The Group
Premises
Equipment, fixtures and
fittings Total HK$’000 HK$’000 HK$’000 Net book value at 1 January 2009 551,790 32,687 584,477Additions - 4,919 4,919Disposals - (49) (49)Revaluation 82,199 - 82,199Depreciation for the year (Note 11) (6,439) (7,637) (14,076)Reclassification to investment properties
(Note 27) - - -Exchange adjustments - (7) (7) Net book value at 31 December 2009 627,550 29,913 657,463 At 31 December 2009 Cost or valuation 627,550 109,563 737,113Accumulated depreciation and impairment - (79,650) (79,650) Net book value at 31 December 2009 627,550 29,913 657,463 Net book value at 1 January 2008 541,130 30,198 571,328Additions - 9,600 9,600Disposals - (9) (9)Revaluation 30,741 - 30,741Depreciation for the year (Note 11) (6,581) (7,125) (13,706)Reclassification to investment properties (Note 27) (13,500) - (13,500)
Exchange adjustments - 23 23 Net book value at 31 December 2008 551,790 32,687 584,477 At 31 December 2008 Cost or valuation 551,790 107,706 659,496Accumulated depreciation and impairment - (75,019) (75,019) Net book value at 31 December 2008 551,790 32,687 584,477 The analysis of cost or valuation of the above
assets is as follows: At 31 December 2009 At cost - 109,563 109,563At valuation 627,550 - 627,550 627,550 109,563 737,113 At 31 December 2008 At cost - 107,706 107,706At valuation 551,790 - 551,790 551,790 107,706 659,496
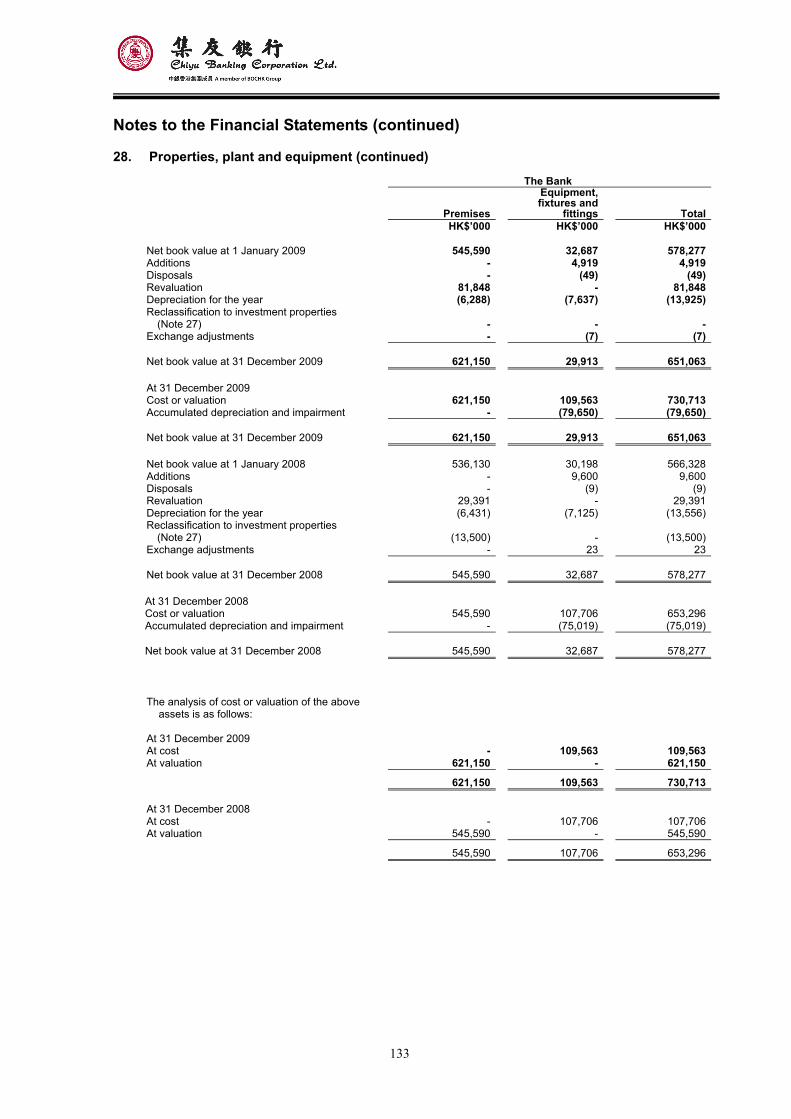
133
Notes to the Financial Statements (continued)
28. Properties, plant and equipment (continued)
The Bank
Premises
Equipment, fixtures and
fittings Total HK$’000 HK$’000 HK$’000 Net book value at 1 January 2009 545,590 32,687 578,277Additions - 4,919 4,919Disposals - (49) (49)Revaluation 81,848 - 81,848Depreciation for the year (6,288) (7,637) (13,925)Reclassification to investment properties (Note 27) - - -
Exchange adjustments - (7) (7) Net book value at 31 December 2009 621,150 29,913 651,063 At 31 December 2009 Cost or valuation 621,150 109,563 730,713Accumulated depreciation and impairment - (79,650) (79,650) Net book value at 31 December 2009 621,150 29,913 651,063 Net book value at 1 January 2008 536,130 30,198 566,328Additions - 9,600 9,600Disposals - (9) (9)Revaluation 29,391 - 29,391Depreciation for the year (6,431) (7,125) (13,556)Reclassification to investment properties
(Note 27) (13,500) - (13,500)Exchange adjustments - 23 23 Net book value at 31 December 2008 545,590 32,687 578,277 At 31 December 2008 Cost or valuation 545,590 107,706 653,296Accumulated depreciation and impairment - (75,019) (75,019) Net book value at 31 December 2008 545,590 32,687 578,277 The analysis of cost or valuation of the above
assets is as follows: At 31 December 2009 At cost - 109,563 109,563At valuation 621,150 - 621,150 621,150 109,563 730,713 At 31 December 2008 At cost - 107,706 107,706At valuation 545,590 - 545,590 545,590 107,706 653,296
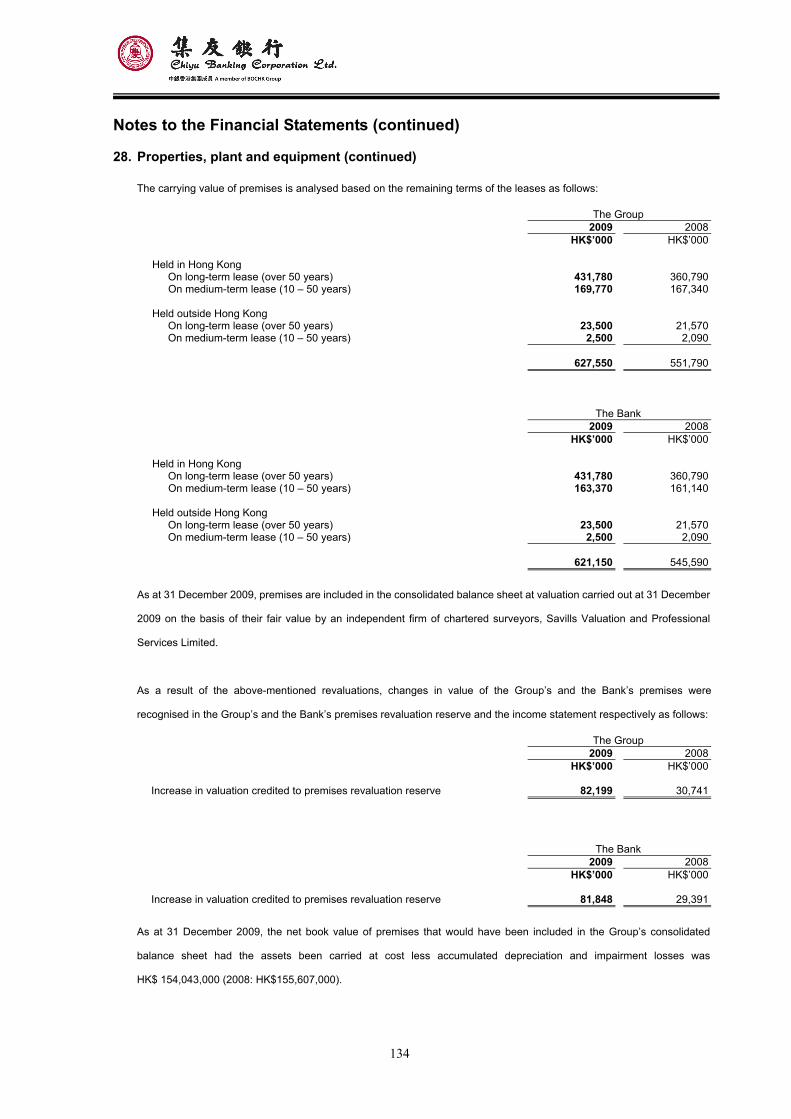
134
Notes to the Financial Statements (continued)
28. Properties, plant and equipment (continued)
The carrying value of premises is analysed based on the remaining terms of the leases as follows:
The Group 2009 2008 HK$’000 HK$’000 Held in Hong Kong
On long-term lease (over 50 years) 431,780 360,790On medium-term lease (10 – 50 years) 169,770 167,340
Held outside Hong Kong On long-term lease (over 50 years) 23,500 21,570On medium-term lease (10 – 50 years) 2,500 2,090
627,550 551,790
The Bank 2009 2008 HK$’000 HK$’000 Held in Hong Kong
On long-term lease (over 50 years) 431,780 360,790On medium-term lease (10 – 50 years) 163,370 161,140
Held outside Hong Kong On long-term lease (over 50 years) 23,500 21,570On medium-term lease (10 – 50 years) 2,500 2,090
621,150 545,590
As at 31 December 2009, premises are included in the consolidated balance sheet at valuation carried out at 31 December
2009 on the basis of their fair value by an independent firm of chartered surveyors, Savills Valuation and Professional
Services Limited.
As a result of the above-mentioned revaluations, changes in value of the Group’s and the Bank’s premises were
recognised in the Group’s and the Bank’s premises revaluation reserve and the income statement respectively as follows:
The Group 2009 2008 HK$’000 HK$’000 Increase in valuation credited to premises revaluation reserve 82,199 30,741
The Bank 2009 2008 HK$’000 HK$’000 Increase in valuation credited to premises revaluation reserve 81,848 29,391
As at 31 December 2009, the net book value of premises that would have been included in the Group’s consolidated
balance sheet had the assets been carried at cost less accumulated depreciation and impairment losses was
HK$ 154,043,000 (2008: HK$155,607,000).
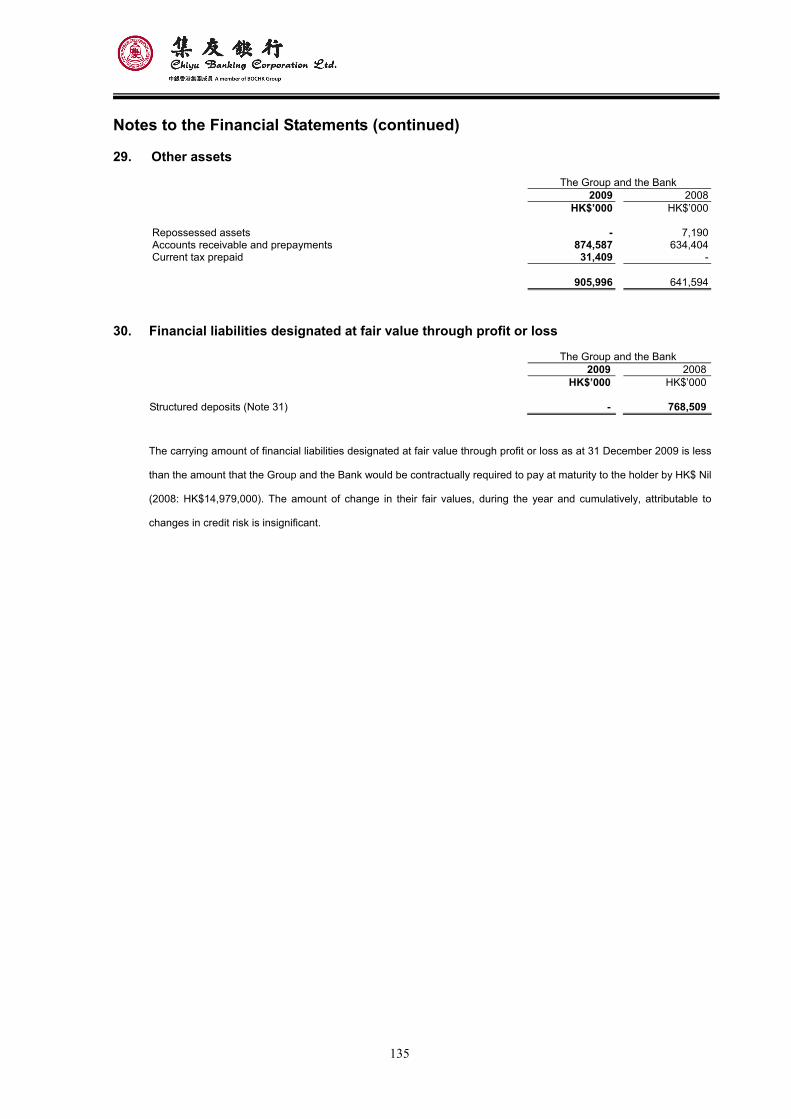
135
Notes to the Financial Statements (continued)
29. Other assets
The Group and the Bank 2009 2008 HK$’000 HK$’000 Repossessed assets - 7,190Accounts receivable and prepayments 874,587 634,404Current tax prepaid 31,409 - 905,996 641,594
30. Financial liabilities designated at fair value through profit or loss
The Group and the Bank 2009 2008 HK$’000 HK$’000 Structured deposits (Note 31) - 768,509
The carrying amount of financial liabilities designated at fair value through profit or loss as at 31 December 2009 is less
than the amount that the Group and the Bank would be contractually required to pay at maturity to the holder by HK$ Nil
(2008: HK$14,979,000). The amount of change in their fair values, during the year and cumulatively, attributable to
changes in credit risk is insignificant.
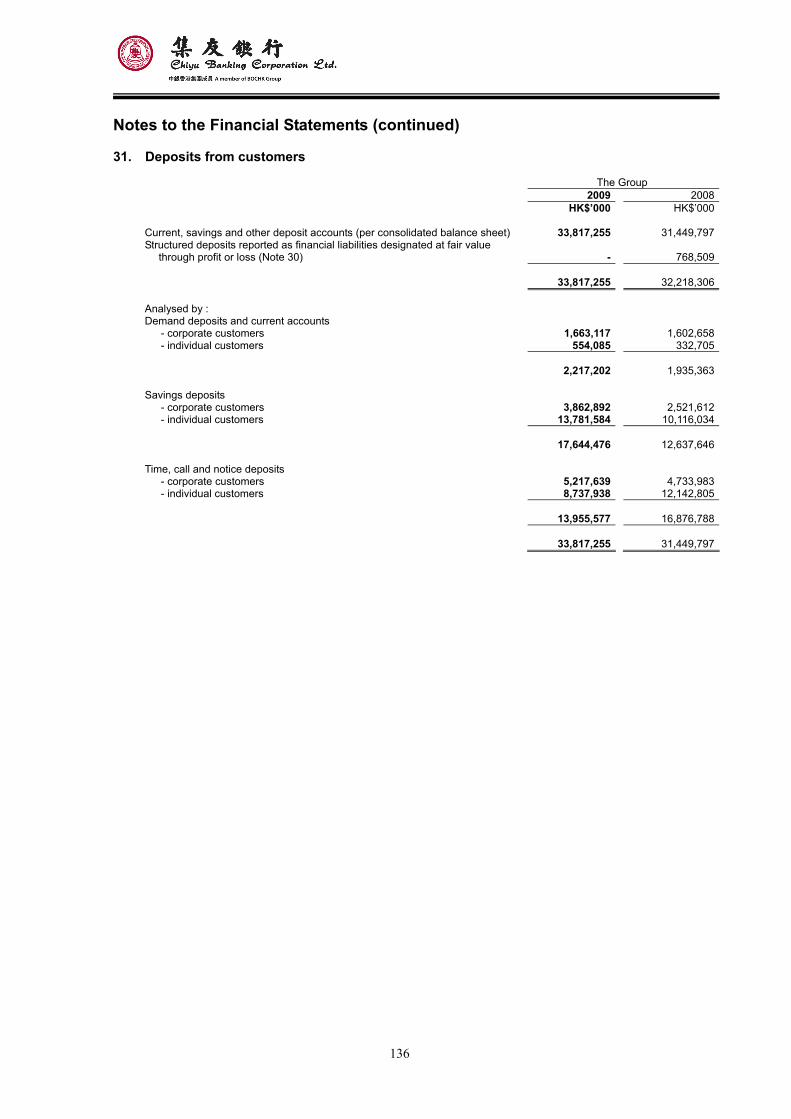
136
Notes to the Financial Statements (continued)
31. Deposits from customers
The Group 2009 2008 HK$’000 HK$’000 Current, savings and other deposit accounts (per consolidated balance sheet) 33,817,255 31,449,797Structured deposits reported as financial liabilities designated at fair value
through profit or loss (Note 30) - 768,509 33,817,255 32,218,306 Analysed by : Demand deposits and current accounts - corporate customers 1,663,117 1,602,658 - individual customers 554,085 332,705 2,217,202 1,935,363 Savings deposits - corporate customers 3,862,892 2,521,612 - individual customers 13,781,584 10,116,034 17,644,476 12,637,646 Time, call and notice deposits - corporate customers 5,217,639 4,733,983 - individual customers 8,737,938 12,142,805
13,955,577 16,876,788 33,817,255 31,449,797
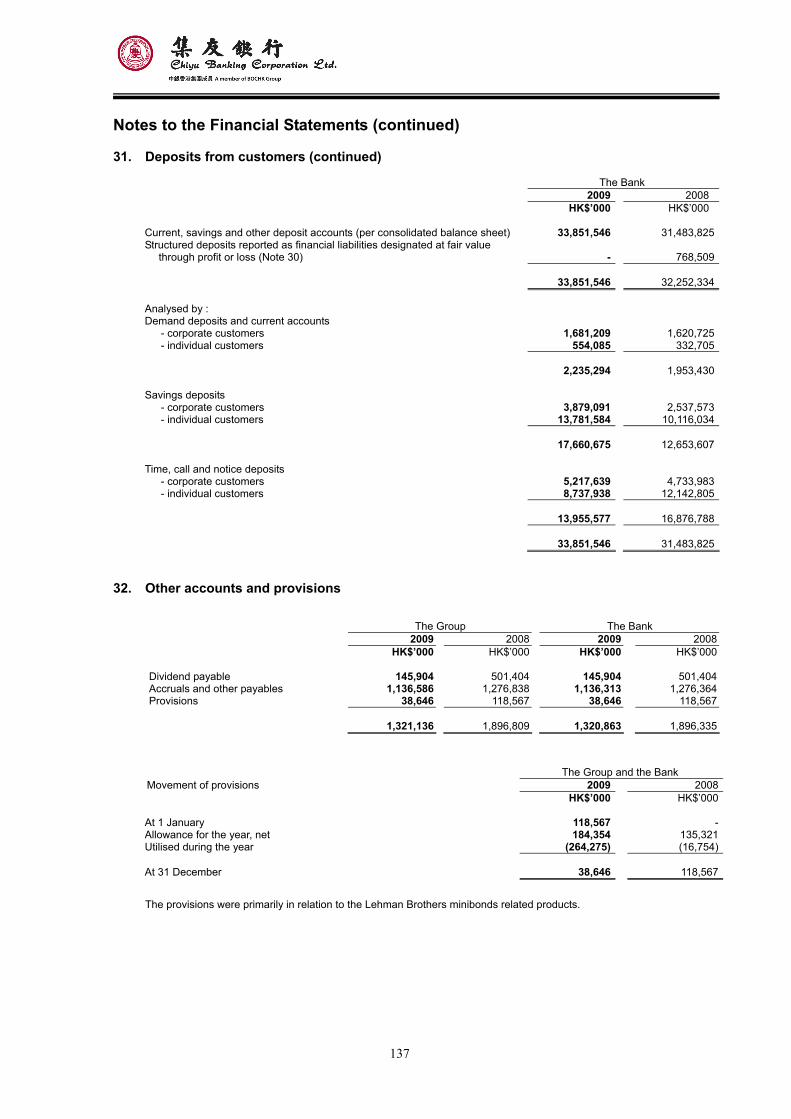
137
Notes to the Financial Statements (continued)
31. Deposits from customers (continued)
The Bank 2009 2008 HK$’000 HK$’000 Current, savings and other deposit accounts (per consolidated balance sheet) 33,851,546 31,483,825Structured deposits reported as financial liabilities designated at fair value
through profit or loss (Note 30) - 768,509 33,851,546 32,252,334 Analysed by : Demand deposits and current accounts - corporate customers 1,681,209 1,620,725 - individual customers 554,085 332,705 2,235,294 1,953,430 Savings deposits - corporate customers 3,879,091 2,537,573 - individual customers 13,781,584 10,116,034 17,660,675 12,653,607 Time, call and notice deposits - corporate customers 5,217,639 4,733,983 - individual customers 8,737,938 12,142,805
13,955,577 16,876,788 33,851,546 31,483,825
32. Other accounts and provisions
The Group The Bank 2009 2008 2009 2008 HK$’000 HK$’000 HK$’000 HK$’000 Dividend payable 145,904 501,404 145,904 501,404Accruals and other payables 1,136,586 1,276,838 1,136,313 1,276,364Provisions 38,646 118,567 38,646 118,567 1,321,136 1,896,809 1,320,863 1,896,335
The Group and the Bank Movement of provisions 2009 2008 HK$’000 HK$’000 At 1 January 118,567 -Allowance for the year, net 184,354 135,321Utilised during the year (264,275) (16,754) At 31 December 38,646 118,567 The provisions were primarily in relation to the Lehman Brothers minibonds related products.
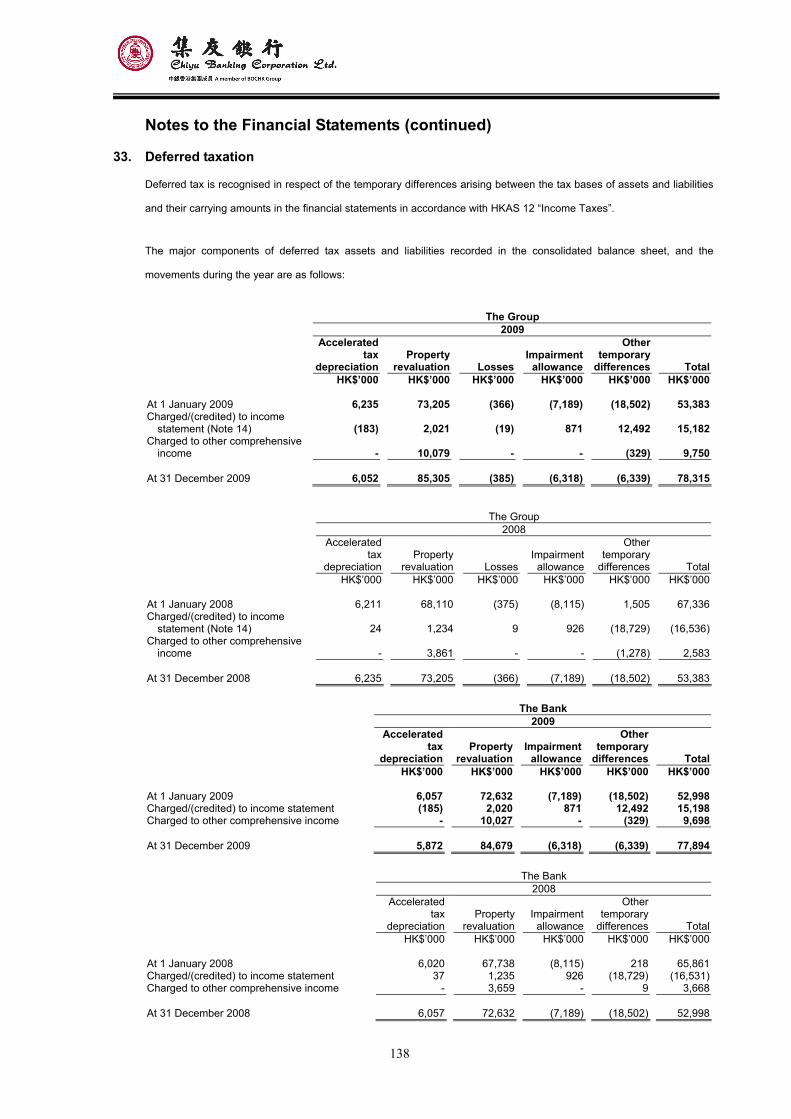
138
Notes to the Financial Statements (continued)
33. Deferred taxation
Deferred tax is recognised in respect of the temporary differences arising between the tax bases of assets and liabilities
and their carrying amounts in the financial statements in accordance with HKAS 12 “Income Taxes”.
The major components of deferred tax assets and liabilities recorded in the consolidated balance sheet, and the
movements during the year are as follows:
The Group 2009
Accelerated
tax depreciation
Propertyrevaluation Losses
Impairment allowance
Other temporary
differences Total HK$’000 HK$’000 HK$’000 HK$’000 HK$’000 HK$’000
At 1 January 2009 6,235 73,205 (366) (7,189) (18,502) 53,383Charged/(credited) to income
statement (Note 14) (183) 2,021 (19) 871
12,492 15,182Charged to other comprehensive
income - 10,079 - -
(329) 9,750 At 31 December 2009 6,052 85,305 (385) (6,318) (6,339) 78,315
The Group 2008
Accelerated
tax depreciation
Propertyrevaluation Losses
Impairment allowance
Other temporary
differences Total HK$’000 HK$’000 HK$’000 HK$’000 HK$’000 HK$’000
At 1 January 2008 6,211 68,110 (375) (8,115) 1,505 67,336Charged/(credited) to income
statement (Note 14) 24 1,234 9 926
(18,729) (16,536)Charged to other comprehensive
income - 3,861 - -
(1,278) 2,583 At 31 December 2008 6,235 73,205 (366) (7,189) (18,502) 53,383
The Bank 2009
Accelerated
tax depreciation
Propertyrevaluation
Impairment allowance
Other temporary
differences Total HK$’000 HK$’000 HK$’000 HK$’000 HK$’000
At 1 January 2009 6,057 72,632 (7,189) (18,502) 52,998Charged/(credited) to income statement (185) 2,020 871 12,492 15,198Charged to other comprehensive income - 10,027 - (329) 9,698 At 31 December 2009 5,872 84,679 (6,318) (6,339) 77,894
The Bank 2008
Accelerated
tax depreciation
Propertyrevaluation
Impairment allowance
Other temporary
differences Total HK$’000 HK$’000 HK$’000 HK$’000 HK$’000
At 1 January 2008 6,020 67,738 (8,115) 218 65,861Charged/(credited) to income statement 37 1,235 926 (18,729) (16,531)Charged to other comprehensive income - 3,659 - 9 3,668 At 31 December 2008 6,057 72,632 (7,189) (18,502) 52,998
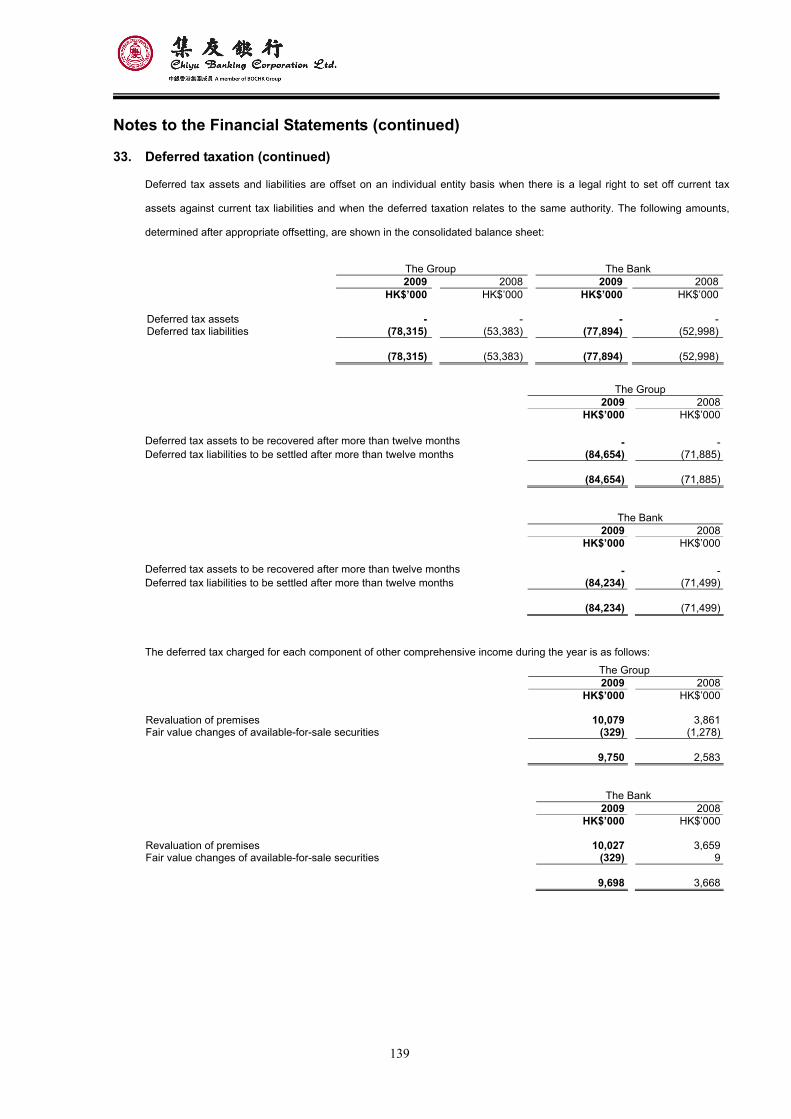
139
Notes to the Financial Statements (continued)
33. Deferred taxation (continued)
Deferred tax assets and liabilities are offset on an individual entity basis when there is a legal right to set off current tax
assets against current tax liabilities and when the deferred taxation relates to the same authority. The following amounts,
determined after appropriate offsetting, are shown in the consolidated balance sheet:
The Group The Bank 2009 2008 2009 2008 HK$’000 HK$’000 HK$’000 HK$’000 Deferred tax assets - - - -Deferred tax liabilities (78,315) (53,383) (77,894) (52,998) (78,315) (53,383) (77,894) (52,998)
The Group 2009 2008 HK$’000 HK$’000
Deferred tax assets to be recovered after more than twelve months - -Deferred tax liabilities to be settled after more than twelve months (84,654) (71,885)
(84,654) (71,885)
The Bank 2009 2008 HK$’000 HK$’000
Deferred tax assets to be recovered after more than twelve months - -Deferred tax liabilities to be settled after more than twelve months (84,234) (71,499)
(84,234) (71,499)
The deferred tax charged for each component of other comprehensive income during the year is as follows:
The Group 2009 2008
HK$’000 HK$’000 Revaluation of premises 10,079 3,861Fair value changes of available-for-sale securities (329) (1,278) 9,750 2,583
The Bank 2009 2008
HK$’000 HK$’000 Revaluation of premises 10,027 3,659Fair value changes of available-for-sale securities (329) 9 9,698 3,668
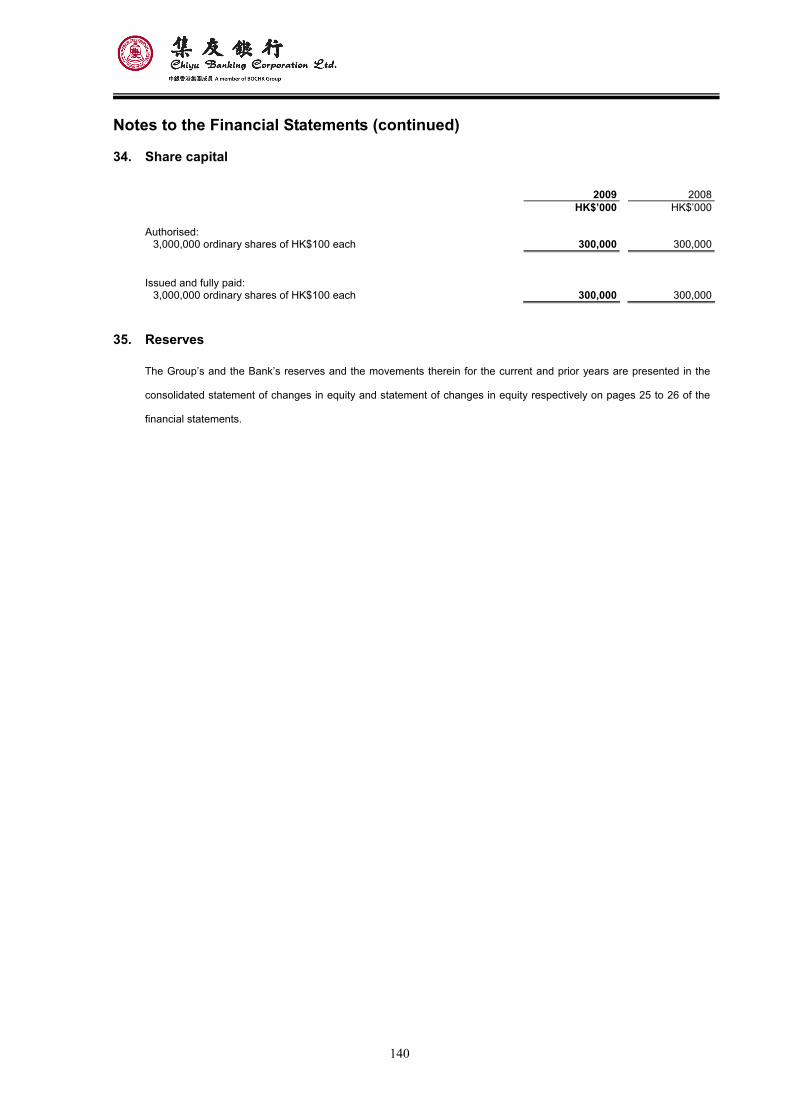
140
Notes to the Financial Statements (continued)
34. Share capital
2009 2008 HK$’000 HK$’000 Authorised:
3,000,000 ordinary shares of HK$100 each 300,000 300,000 Issued and fully paid:
3,000,000 ordinary shares of HK$100 each 300,000 300,000
35. Reserves
The Group’s and the Bank’s reserves and the movements therein for the current and prior years are presented in the
consolidated statement of changes in equity and statement of changes in equity respectively on pages 25 to 26 of the
financial statements.
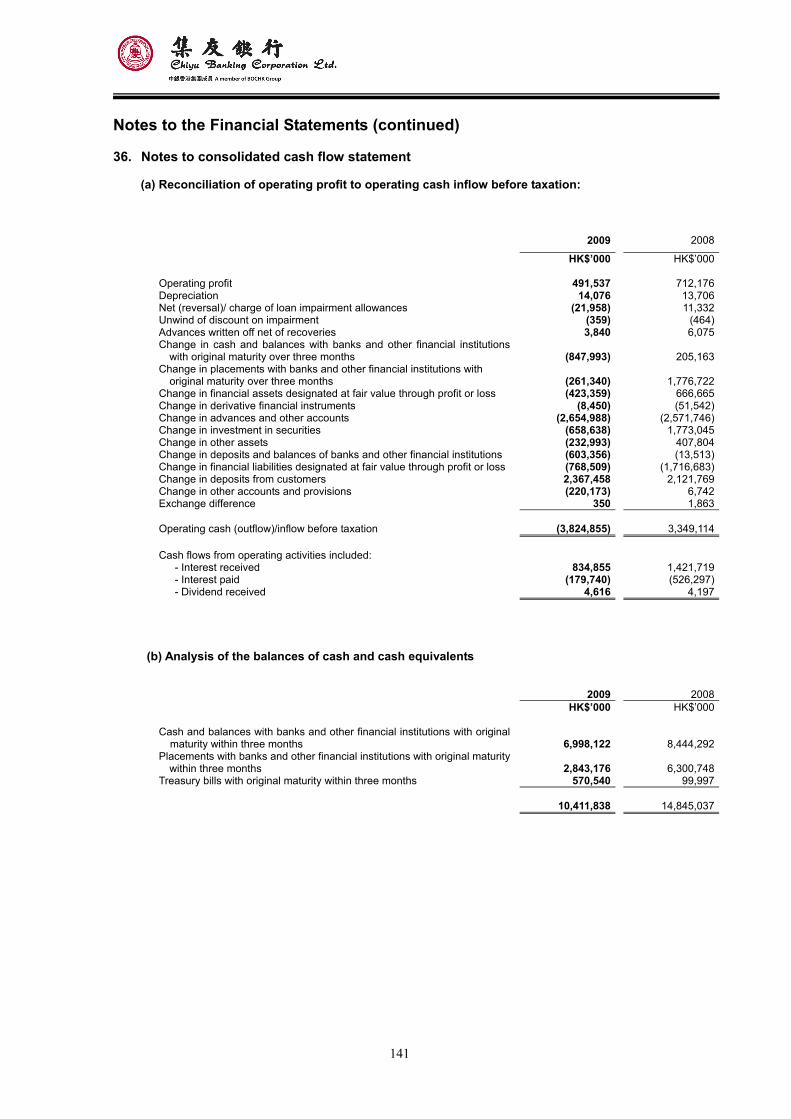
141
Notes to the Financial Statements (continued)
36. Notes to consolidated cash flow statement
(a) Reconciliation of operating profit to operating cash inflow before taxation:
2009 2008
HK$’000 HK$’000
Operating profit 491,537 712,176Depreciation 14,076 13,706Net (reversal)/ charge of loan impairment allowances (21,958) 11,332Unwind of discount on impairment (359) (464)Advances written off net of recoveries 3,840 6,075Change in cash and balances with banks and other financial institutions
with original maturity over three months (847,993) 205,163Change in placements with banks and other financial institutions with original maturity over three months (261,340) 1,776,722Change in financial assets designated at fair value through profit or loss (423,359) 666,665Change in derivative financial instruments (8,450) (51,542)Change in advances and other accounts (2,654,988) (2,571,746)Change in investment in securities (658,638) 1,773,045Change in other assets (232,993) 407,804Change in deposits and balances of banks and other financial institutions (603,356) (13,513)Change in financial liabilities designated at fair value through profit or loss (768,509) (1,716,683)Change in deposits from customers 2,367,458 2,121,769Change in other accounts and provisions (220,173) 6,742Exchange difference 350 1,863 Operating cash (outflow)/inflow before taxation (3,824,855) 3,349,114
Cash flows from operating activities included:
- Interest received 834,855 1,421,719- Interest paid (179,740) (526,297)- Dividend received 4,616 4,197
(b) Analysis of the balances of cash and cash equivalents
2009 2008 HK$’000 HK$’000
Cash and balances with banks and other financial institutions with original maturity within three months 6,998,122 8,444,292
Placements with banks and other financial institutions with original maturity within three months 2,843,176 6,300,748
Treasury bills with original maturity within three months 570,540 99,997 10,411,838 14,845,037
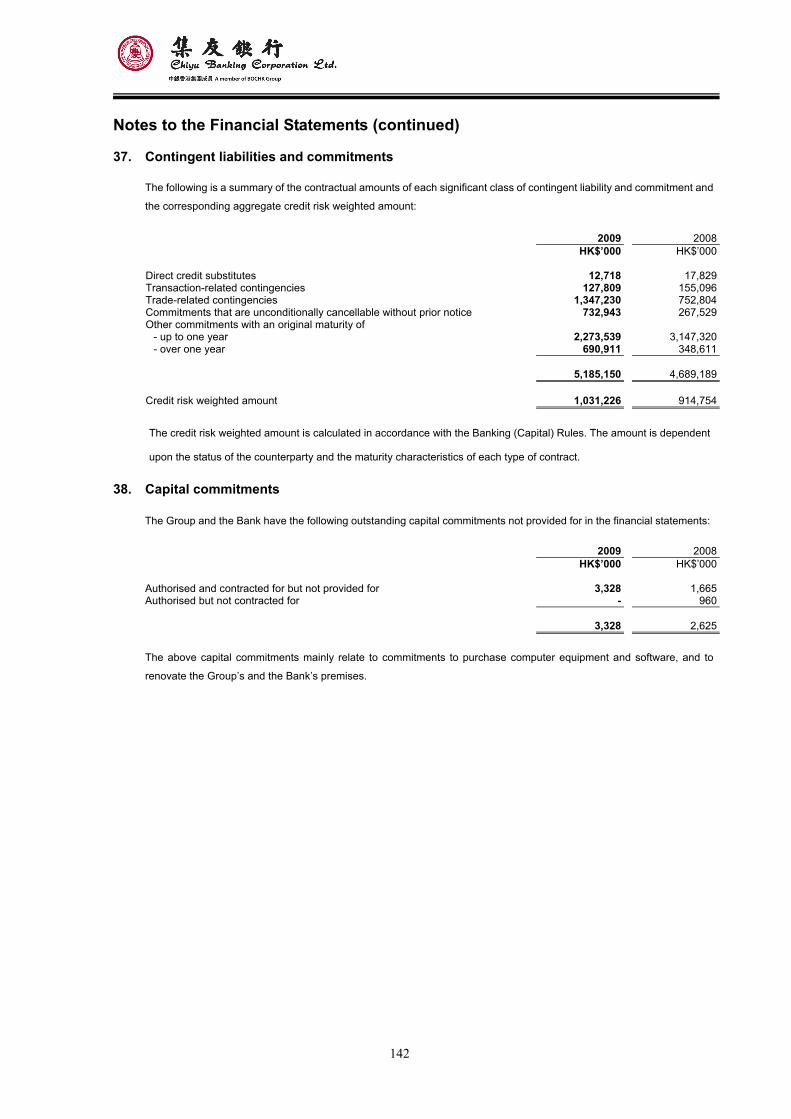
142
Notes to the Financial Statements (continued)
37. Contingent liabilities and commitments
The following is a summary of the contractual amounts of each significant class of contingent liability and commitment and
the corresponding aggregate credit risk weighted amount:
2009 2008
HK$’000 HK$’000 Direct credit substitutes 12,718 17,829Transaction-related contingencies 127,809 155,096Trade-related contingencies 1,347,230 752,804Commitments that are unconditionally cancellable without prior notice 732,943 267,529Other commitments with an original maturity of
- up to one year 2,273,539 3,147,320- over one year 690,911 348,611
5,185,150 4,689,189
Credit risk weighted amount 1,031,226 914,754
The credit risk weighted amount is calculated in accordance with the Banking (Capital) Rules. The amount is dependent
upon the status of the counterparty and the maturity characteristics of each type of contract.
38. Capital commitments
The Group and the Bank have the following outstanding capital commitments not provided for in the financial statements: 2009 2008
HK$’000 HK$’000 Authorised and contracted for but not provided for 3,328 1,665Authorised but not contracted for - 960 3,328 2,625 The above capital commitments mainly relate to commitments to purchase computer equipment and software, and to
renovate the Group’s and the Bank’s premises.
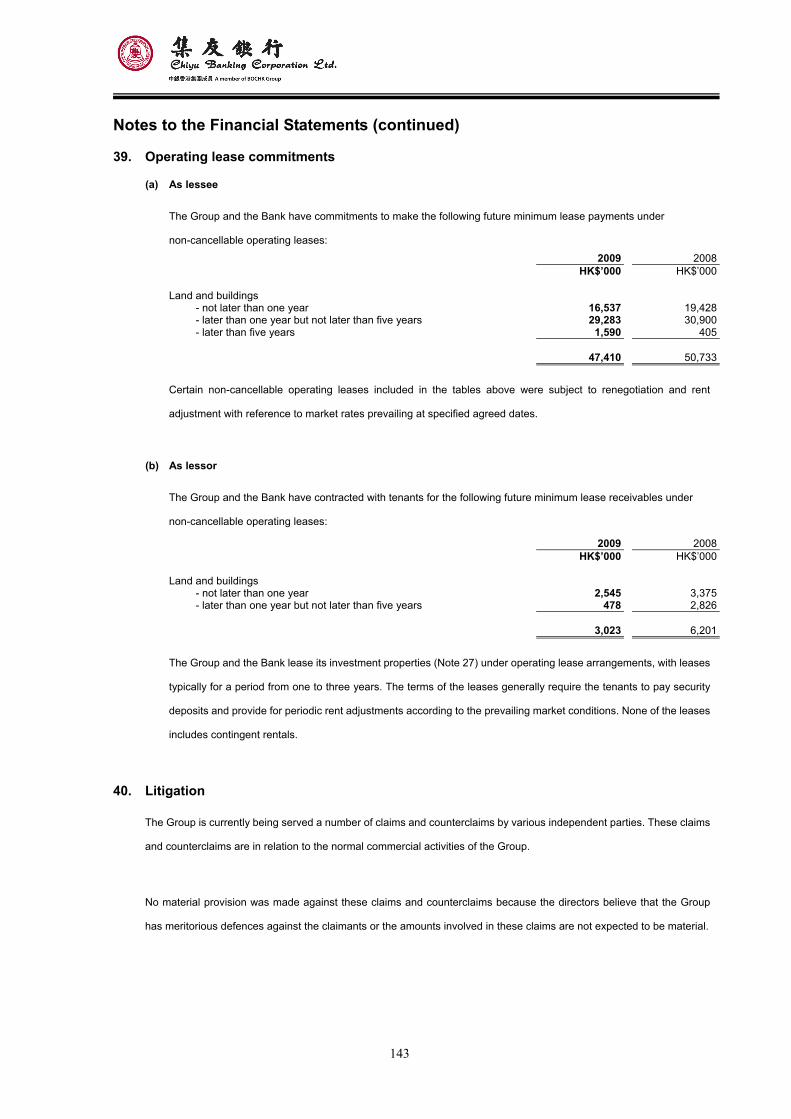
143
Notes to the Financial Statements (continued)
39. Operating lease commitments
(a) As lessee
The Group and the Bank have commitments to make the following future minimum lease payments under
non-cancellable operating leases:
2009 2008 HK$’000 HK$’000 Land and buildings - not later than one year 16,537 19,428 - later than one year but not later than five years 29,283 30,900 - later than five years 1,590 405 47,410 50,733
Certain non-cancellable operating leases included in the tables above were subject to renegotiation and rent
adjustment with reference to market rates prevailing at specified agreed dates.
(b) As lessor
The Group and the Bank have contracted with tenants for the following future minimum lease receivables under
non-cancellable operating leases: 2009 2008
HK$’000 HK$’000 Land and buildings - not later than one year 2,545 3,375 - later than one year but not later than five years 478 2,826 3,023 6,201
The Group and the Bank lease its investment properties (Note 27) under operating lease arrangements, with leases
typically for a period from one to three years. The terms of the leases generally require the tenants to pay security
deposits and provide for periodic rent adjustments according to the prevailing market conditions. None of the leases
includes contingent rentals.
40. Litigation
The Group is currently being served a number of claims and counterclaims by various independent parties. These claims
and counterclaims are in relation to the normal commercial activities of the Group.
No material provision was made against these claims and counterclaims because the directors believe that the Group
has meritorious defences against the claimants or the amounts involved in these claims are not expected to be material.
144
Notes to the Financial Statements (continued)
41. Segmental reporting
The Group has adopted the new HKFRS 8 “Operating Segments” effective this year. After assessing the internal
financial reporting process, it was concluded that the original segments classification has already complied with the new
standard.
The Group engages in many businesses in several regions. For segmental reporting purposes, information is solely
provided in respect of business segments. Geographical segment information is not presented because over 90% of
the Group’s revenues and profits before tax and assets are derived from Hong Kong.
Information about four business segments is provided in segmental reporting. They are Personal Banking, Corporate
Banking, Treasury and Investment Activities. The classification of the Group’s operating segments is based on customer
segment and product type.
Both Personal Banking and Corporate Banking segments provide general banking services. Personal Banking serves
individual customers while Corporate Banking deals with non individual customers. The Treasury segment is
responsible for managing the capital, liquidity, and the interest rate and foreign exchange positions of the Group in
addition to proprietary trades. Investment Activities include the Group’s holdings of premises, investment properties and
equity investments. “Others” refers to those items related to the Group as a whole but independent of the other four
business segments.
Revenues, expenses, assets and liabilities of any business segment mainly include items directly attributable to the
segment. In relation to occupation of the Group’s premises, rentals are internally charged on market rates according to
the areas occupied. For management overheads, allocations are made on reasonable bases. Inter-segment funding is
charged according to the internal funds transfer pricing mechanism of the Group.
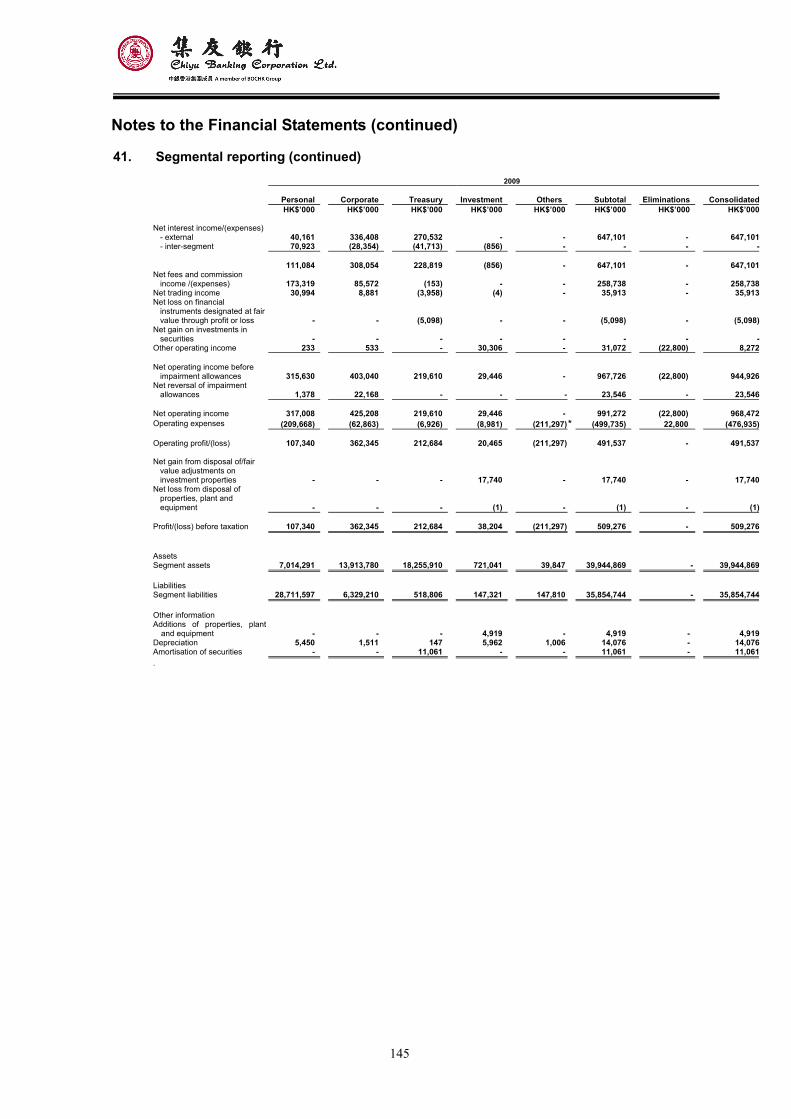
145
Notes to the Financial Statements (continued)
41. Segmental reporting (continued) 2009
Personal Corporate Treasury Investment
Others
Subtotal Eliminations Consolidated HK$’000 HK$’000 HK$’000 HK$’000 HK$’000 HK$’000 HK$’000 HK$’000
Net interest income/(expenses)
- external 40,161 336,408 270,532 - - 647,101 - 647,101- inter-segment 70,923 (28,354) (41,713) (856) - - - -
111,084 308,054 228,819 (856) - 647,101 - 647,101Net fees and commission
income /(expenses) 173,319 85,572 (153) - - 258,738 - 258,738Net trading income 30,994 8,881 (3,958) (4) - 35,913 - 35,913Net loss on financial
instruments designated at fair value through profit or loss - - (5,098) - - (5,098) - (5,098)
Net gain on investments in securities - - - - - - - -
Other operating income 233 533 - 30,306 - 31,072 (22,800) 8,272 Net operating income before
impairment allowances 315,630 403,040 219,610 29,446 - 967,726 (22,800) 944,926Net reversal of impairment
allowances 1,378 22,168 - - - 23,546 - 23,546 Net operating income 317,008 425,208 219,610 29,446 - 991,272 (22,800) 968,472Operating expenses (209,668) (62,863) (6,926) (8,981) (211,297) * (499,735) 22,800 (476,935) Operating profit/(loss) 107,340 362,345 212,684 20,465 (211,297) 491,537 - 491,537 Net gain from disposal of/fair
value adjustments on investment properties - - - 17,740 - 17,740 - 17,740
Net loss from disposal of properties, plant and equipment - - - (1) - (1) - (1)
Profit/(loss) before taxation 107,340 362,345 212,684 38,204 (211,297) 509,276 - 509,276 Assets Segment assets 7,014,291 13,913,780 18,255,910 721,041 39,847 39,944,869 - 39,944,869 Liabilities Segment liabilities 28,711,597 6,329,210 518,806 147,321 147,810 35,854,744 - 35,854,744 Other information Additions of properties, plant
and equipment - - - 4,919 - 4,919 - 4,919Depreciation 5,450 1,511 147 5,962 1,006 14,076 - 14,076Amortisation of securities - - 11,061 - - 11,061 - 11,061.
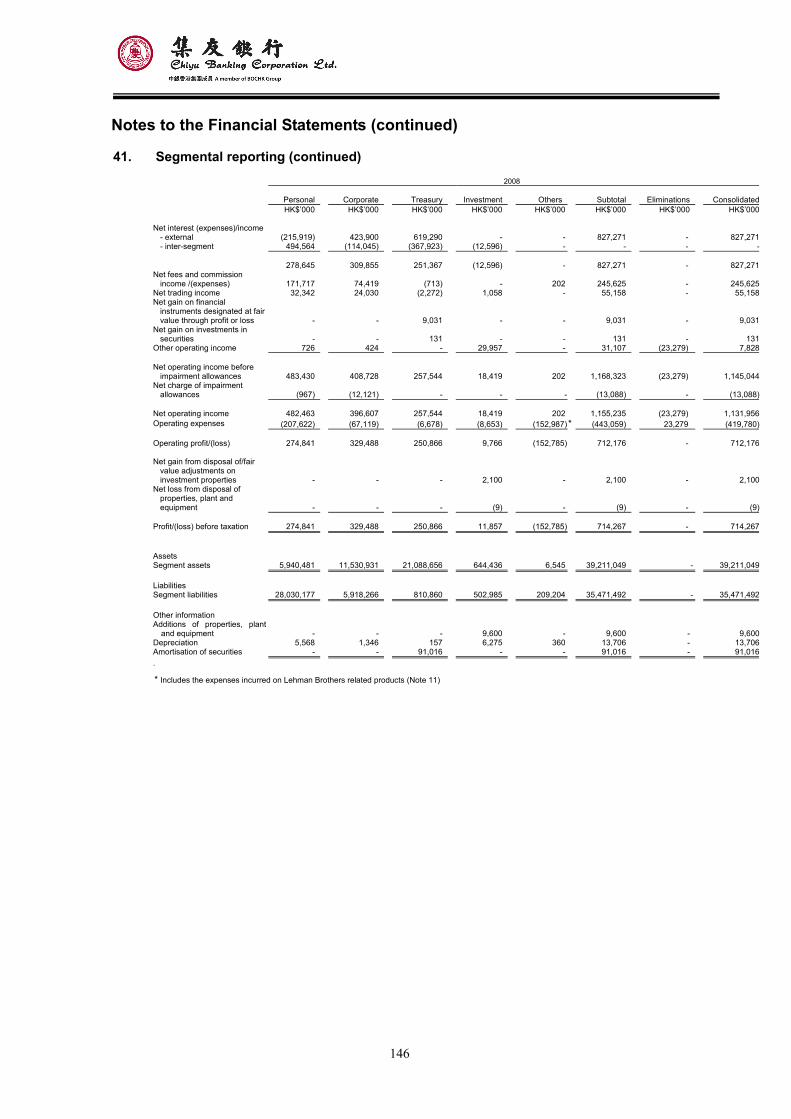
146
Notes to the Financial Statements (continued)
41. Segmental reporting (continued) 2008
Personal Corporate Treasury Investment
Others
Subtotal Eliminations Consolidated HK$’000 HK$’000 HK$’000 HK$’000 HK$’000 HK$’000 HK$’000 HK$’000
Net interest (expenses)/income
- external (215,919) 423,900 619,290 - - 827,271 - 827,271- inter-segment 494,564 (114,045) (367,923) (12,596) - - - -
278,645 309,855 251,367 (12,596) - 827,271 - 827,271Net fees and commission
income /(expenses) 171,717 74,419 (713) - 202 245,625 - 245,625Net trading income 32,342 24,030 (2,272) 1,058 - 55,158 - 55,158Net gain on financial
instruments designated at fair value through profit or loss - - 9,031 - - 9,031 - 9,031
Net gain on investments in securities - - 131 - - 131 - 131
Other operating income 726 424 - 29,957 - 31,107 (23,279) 7,828 Net operating income before
impairment allowances 483,430 408,728 257,544 18,419 202 1,168,323 (23,279) 1,145,044Net charge of impairment
allowances (967) (12,121) - - - (13,088) - (13,088) Net operating income 482,463 396,607 257,544 18,419 202 1,155,235 (23,279) 1,131,956Operating expenses (207,622) (67,119) (6,678) (8,653) (152,987) * (443,059) 23,279 (419,780) Operating profit/(loss) 274,841 329,488 250,866 9,766 (152,785) 712,176 - 712,176 Net gain from disposal of/fair
value adjustments on investment properties - - - 2,100 - 2,100 - 2,100
Net loss from disposal of properties, plant and equipment - - - (9) - (9) - (9)
Profit/(loss) before taxation 274,841 329,488 250,866 11,857 (152,785) 714,267 - 714,267 Assets Segment assets 5,940,481 11,530,931 21,088,656 644,436 6,545 39,211,049 - 39,211,049 Liabilities Segment liabilities 28,030,177 5,918,266 810,860 502,985 209,204 35,471,492 - 35,471,492 Other information Additions of properties, plant
and equipment - - - 9,600 - 9,600 - 9,600Depreciation 5,568 1,346 157 6,275 360 13,706 - 13,706Amortisation of securities - - 91,016 - - 91,016 - 91,016.
* Includes the expenses incurred on Lehman Brothers related products (Note 11)
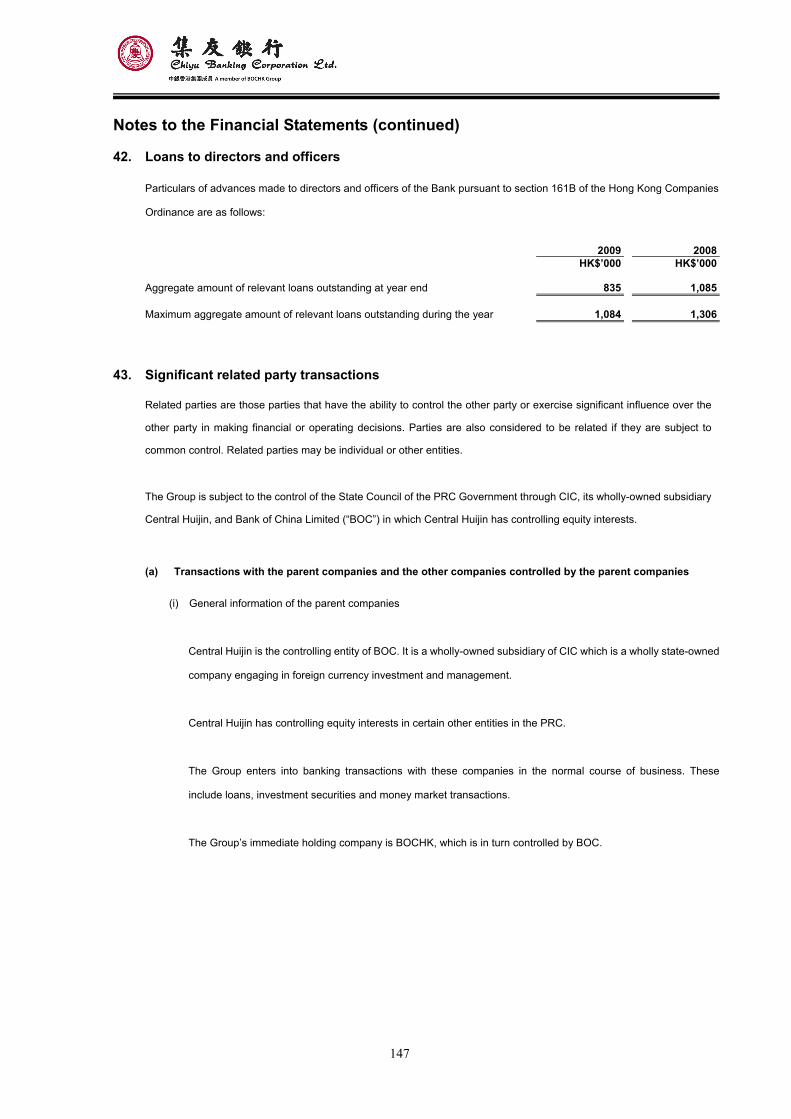
147
Notes to the Financial Statements (continued)
42. Loans to directors and officers
Particulars of advances made to directors and officers of the Bank pursuant to section 161B of the Hong Kong Companies
Ordinance are as follows:
2009 2008
HK$’000 HK$’000 Aggregate amount of relevant loans outstanding at year end 835 1,085 Maximum aggregate amount of relevant loans outstanding during the year 1,084 1,306
43. Significant related party transactions
Related parties are those parties that have the ability to control the other party or exercise significant influence over the
other party in making financial or operating decisions. Parties are also considered to be related if they are subject to
common control. Related parties may be individual or other entities.
The Group is subject to the control of the State Council of the PRC Government through CIC, its wholly-owned subsidiary
Central Huijin, and Bank of China Limited (“BOC”) in which Central Huijin has controlling equity interests.
(a) Transactions with the parent companies and the other companies controlled by the parent companies
(i) General information of the parent companies
Central Huijin is the controlling entity of BOC. It is a wholly-owned subsidiary of CIC which is a wholly state-owned
company engaging in foreign currency investment and management.
Central Huijin has controlling equity interests in certain other entities in the PRC.
The Group enters into banking transactions with these companies in the normal course of business. These
include loans, investment securities and money market transactions.
The Group’s immediate holding company is BOCHK, which is in turn controlled by BOC.
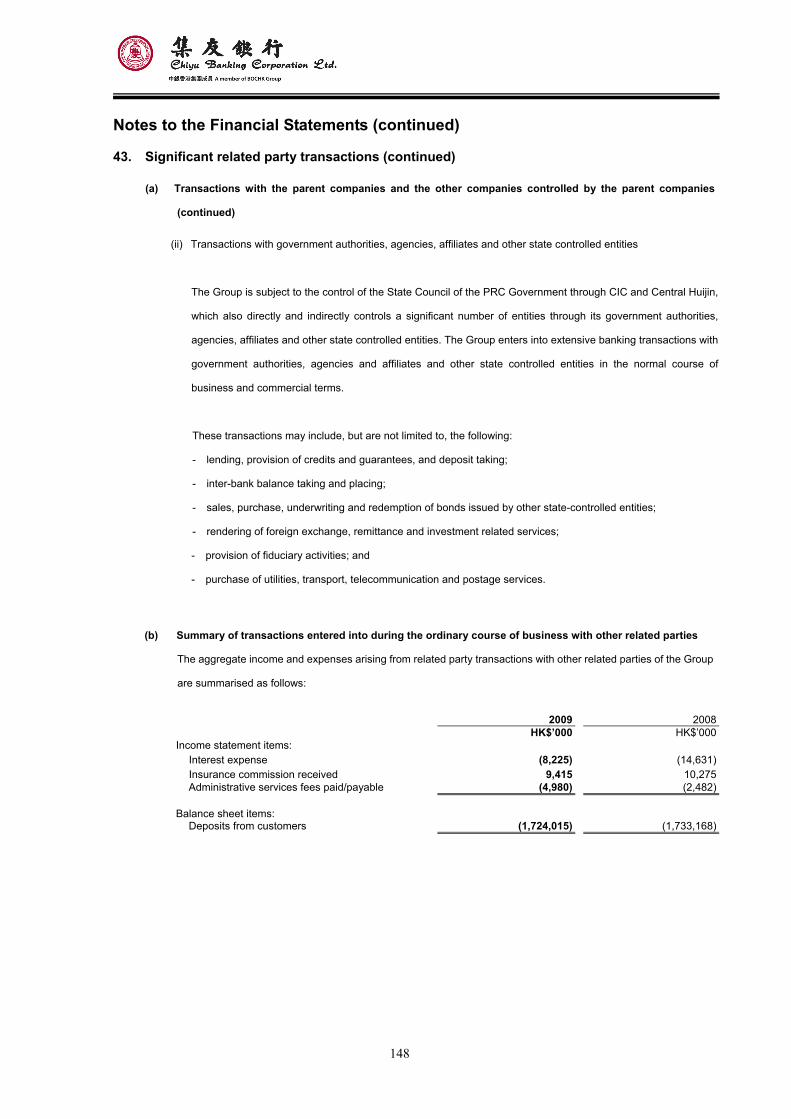
148
Notes to the Financial Statements (continued)
43. Significant related party transactions (continued)
(a) Transactions with the parent companies and the other companies controlled by the parent companies
(continued)
(ii) Transactions with government authorities, agencies, affiliates and other state controlled entities
The Group is subject to the control of the State Council of the PRC Government through CIC and Central Huijin,
which also directly and indirectly controls a significant number of entities through its government authorities,
agencies, affiliates and other state controlled entities. The Group enters into extensive banking transactions with
government authorities, agencies and affiliates and other state controlled entities in the normal course of
business and commercial terms.
These transactions may include, but are not limited to, the following:
- lending, provision of credits and guarantees, and deposit taking;
- inter-bank balance taking and placing;
- sales, purchase, underwriting and redemption of bonds issued by other state-controlled entities;
- rendering of foreign exchange, remittance and investment related services;
- provision of fiduciary activities; and
- purchase of utilities, transport, telecommunication and postage services.
(b) Summary of transactions entered into during the ordinary course of business with other related parties
The aggregate income and expenses arising from related party transactions with other related parties of the Group
are summarised as follows:
2009 2008 HK$’000 HK$’000Income statement items:
Interest expense (8,225) (14,631)Insurance commission received 9,415 10,275Administrative services fees paid/payable (4,980) (2,482)
Balance sheet items:
Deposits from customers (1,724,015) (1,733,168)
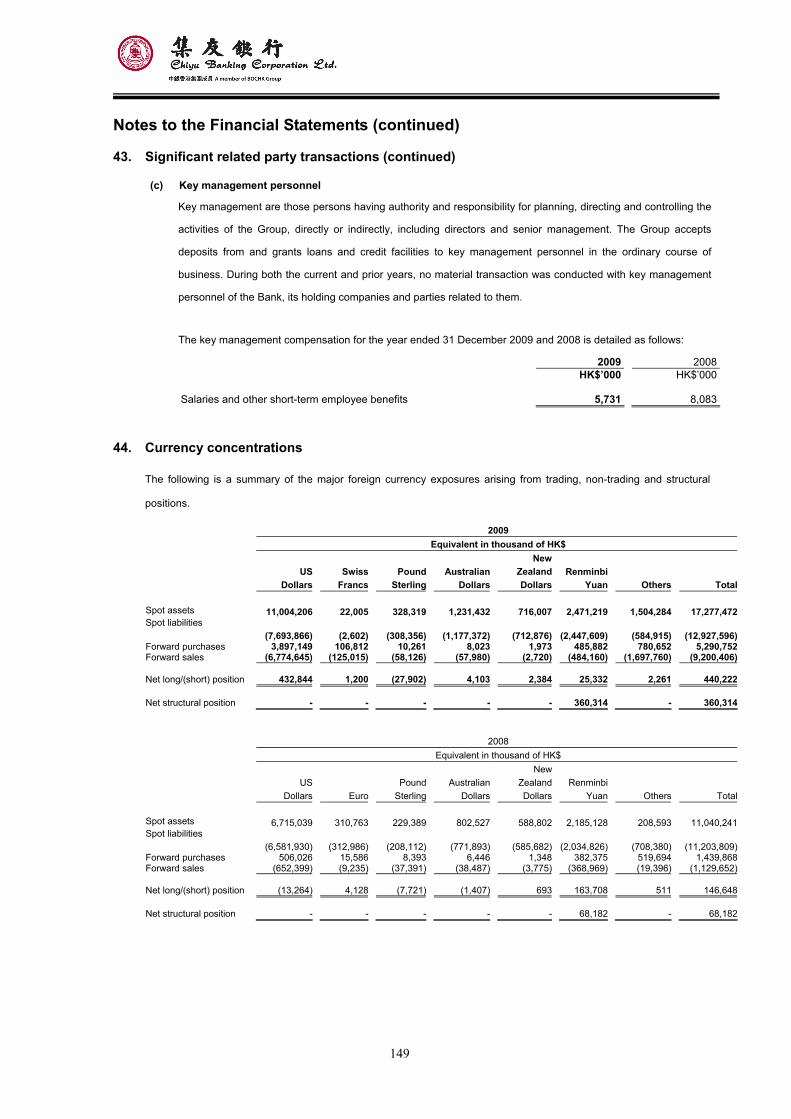
149
Notes to the Financial Statements (continued)
43. Significant related party transactions (continued)
(c) Key management personnel
Key management are those persons having authority and responsibility for planning, directing and controlling the
activities of the Group, directly or indirectly, including directors and senior management. The Group accepts
deposits from and grants loans and credit facilities to key management personnel in the ordinary course of
business. During both the current and prior years, no material transaction was conducted with key management
personnel of the Bank, its holding companies and parties related to them.
The key management compensation for the year ended 31 December 2009 and 2008 is detailed as follows:
2009 2008 HK$’000 HK$’000 Salaries and other short-term employee benefits 5,731 8,083
44. Currency concentrations
The following is a summary of the major foreign currency exposures arising from trading, non-trading and structural
positions.
2009 Equivalent in thousand of HK$
US Swiss Pound AustralianNew
Zealand Renminbi Dollars Francs Sterling Dollars Dollars Yuan Others Total
Spot assets 11,004,206 22,005 328,319 1,231,432 716,007 2,471,219 1,504,284 17,277,472Spot liabilities
(7,693,866) (2,602) (308,356) (1,177,372) (712,876) (2,447,609) (584,915) (12,927,596)Forward purchases 3,897,149 106,812 10,261 8,023 1,973 485,882 780,652 5,290,752Forward sales (6,774,645) (125,015) (58,126) (57,980) (2,720) (484,160) (1,697,760) (9,200,406)
Net long/(short) position 432,844 1,200 (27,902) 4,103 2,384 25,332 2,261 440,222
Net structural position - - - - - 360,314 - 360,314
2008 Equivalent in thousand of HK$
US Pound AustralianNew
Zealand Renminbi Dollars Euro Sterling Dollars Dollars Yuan Others Total
Spot assets 6,715,039 310,763 229,389 802,527 588,802 2,185,128 208,593 11,040,241Spot liabilities
(6,581,930) (312,986) (208,112) (771,893) (585,682) (2,034,826) (708,380) (11,203,809)Forward purchases 506,026 15,586 8,393 6,446 1,348 382,375 519,694 1,439,868Forward sales (652,399) (9,235) (37,391) (38,487) (3,775) (368,969) (19,396) (1,129,652)
Net long/(short) position (13,264) 4,128 (7,721) (1,407) 693 163,708 511 146,648
Net structural position - - - - - 68,182 - 68,182
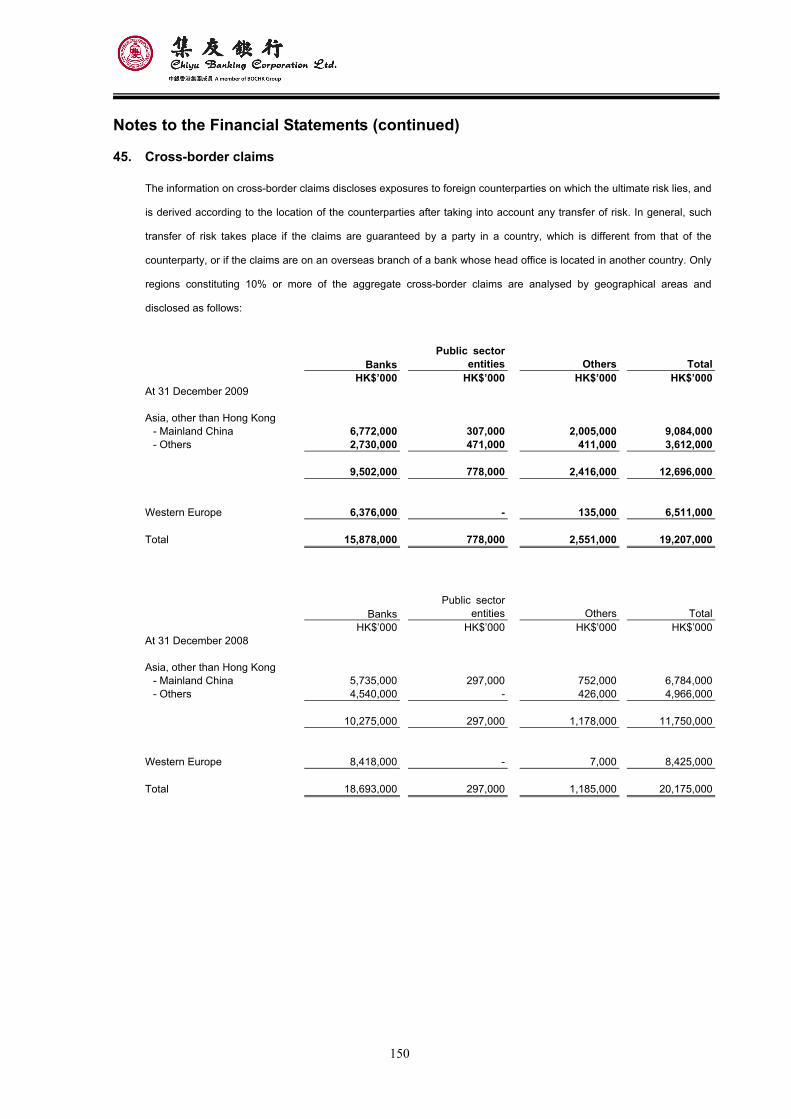
150
Notes to the Financial Statements (continued)
45. Cross-border claims
The information on cross-border claims discloses exposures to foreign counterparties on which the ultimate risk lies, and
is derived according to the location of the counterparties after taking into account any transfer of risk. In general, such
transfer of risk takes place if the claims are guaranteed by a party in a country, which is different from that of the
counterparty, or if the claims are on an overseas branch of a bank whose head office is located in another country. Only
regions constituting 10% or more of the aggregate cross-border claims are analysed by geographical areas and
disclosed as follows:
BanksPublic sector
entities Others
Total HK$’000 HK$’000 HK$’000 HK$’000 At 31 December 2009 Asia, other than Hong Kong - Mainland China 6,772,000 307,000 2,005,000 9,084,000 - Others 2,730,000 471,000 411,000 3,612,000 9,502,000 778,000 2,416,000 12,696,000 Western Europe 6,376,000 - 135,000 6,511,000 Total 15,878,000 778,000 2,551,000 19,207,000
BanksPublic sector
entities Others
Total HK$’000 HK$’000 HK$’000 HK$’000 At 31 December 2008 Asia, other than Hong Kong - Mainland China 5,735,000 297,000 752,000 6,784,000 - Others 4,540,000 - 426,000 4,966,000 10,275,000 297,000 1,178,000 11,750,000 Western Europe 8,418,000 - 7,000 8,425,000 Total 18,693,000 297,000 1,185,000 20,175,000
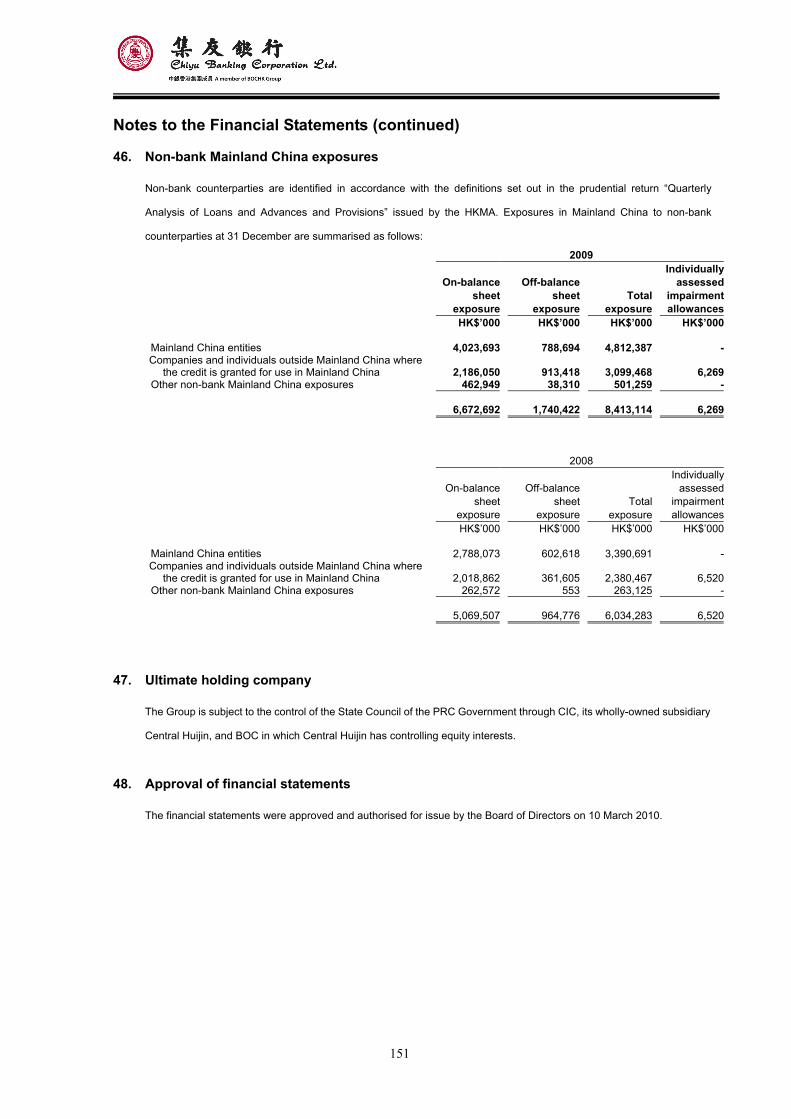
151
Notes to the Financial Statements (continued)
46. Non-bank Mainland China exposures
Non-bank counterparties are identified in accordance with the definitions set out in the prudential return “Quarterly
Analysis of Loans and Advances and Provisions” issued by the HKMA. Exposures in Mainland China to non-bank
counterparties at 31 December are summarised as follows:
2009
On-balancesheet
exposure
Off-balancesheet
exposureTotal
exposure
Individuallyassessed
impairmentallowances
HK$’000 HK$’000 HK$’000 HK$’000
Mainland China entities 4,023,693 788,694 4,812,387 -Companies and individuals outside Mainland China where
the credit is granted for use in Mainland China 2,186,050 913,418 3,099,468 6,269Other non-bank Mainland China exposures 462,949 38,310 501,259 -
6,672,692 1,740,422 8,413,114 6,269
2008
On-balancesheet
exposure
Off-balancesheet
exposureTotal
exposure
Individuallyassessed
impairmentallowances
HK$’000 HK$’000 HK$’000 HK$’000
Mainland China entities 2,788,073 602,618 3,390,691 -Companies and individuals outside Mainland China where
the credit is granted for use in Mainland China 2,018,862 361,605 2,380,467 6,520Other non-bank Mainland China exposures 262,572 553 263,125 -
5,069,507 964,776 6,034,283 6,520
47. Ultimate holding company
The Group is subject to the control of the State Council of the PRC Government through CIC, its wholly-owned subsidiary
Central Huijin, and BOC in which Central Huijin has controlling equity interests.
48. Approval of financial statements
The financial statements were approved and authorised for issue by the Board of Directors on 10 March 2010.
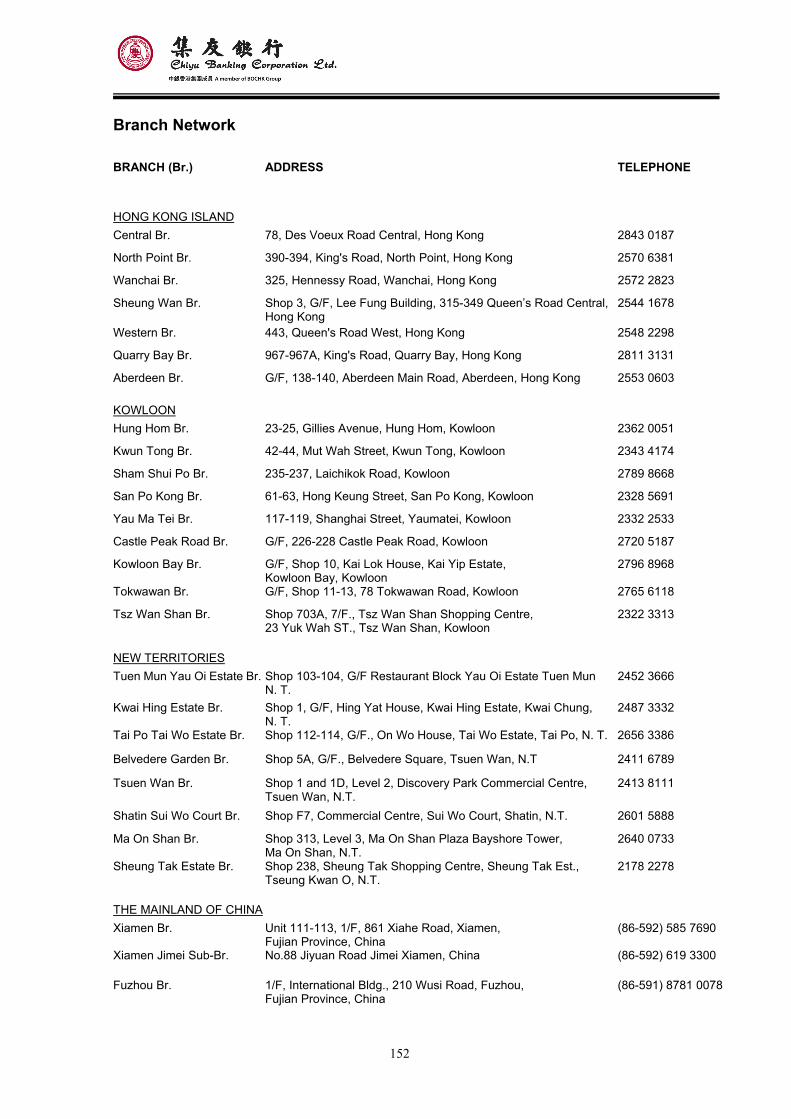
152
Branch Network BRANCH (Br.) ADDRESS TELEPHONE
HONG KONG ISLAND Central Br. 78, Des Voeux Road Central, Hong Kong 2843 0187
North Point Br. 390-394, King's Road, North Point, Hong Kong 2570 6381
Wanchai Br. 325, Hennessy Road, Wanchai, Hong Kong 2572 2823
Sheung Wan Br. Shop 3, G/F, Lee Fung Building, 315-349 Queen’s Road Central, Hong Kong
2544 1678
Western Br. 443, Queen's Road West, Hong Kong 2548 2298
Quarry Bay Br. 967-967A, King's Road, Quarry Bay, Hong Kong 2811 3131
Aberdeen Br. G/F, 138-140, Aberdeen Main Road, Aberdeen, Hong Kong 2553 0603
KOWLOON Hung Hom Br. 23-25, Gillies Avenue, Hung Hom, Kowloon 2362 0051
Kwun Tong Br. 42-44, Mut Wah Street, Kwun Tong, Kowloon 2343 4174
Sham Shui Po Br. 235-237, Laichikok Road, Kowloon 2789 8668
San Po Kong Br. 61-63, Hong Keung Street, San Po Kong, Kowloon 2328 5691
Yau Ma Tei Br. 117-119, Shanghai Street, Yaumatei, Kowloon 2332 2533
Castle Peak Road Br. G/F, 226-228 Castle Peak Road, Kowloon 2720 5187
Kowloon Bay Br. G/F, Shop 10, Kai Lok House, Kai Yip Estate, Kowloon Bay, Kowloon
2796 8968
Tokwawan Br. G/F, Shop 11-13, 78 Tokwawan Road, Kowloon 2765 6118
Tsz Wan Shan Br. Shop 703A, 7/F., Tsz Wan Shan Shopping Centre, 23 Yuk Wah ST., Tsz Wan Shan, Kowloon
2322 3313
NEW TERRITORIES Tuen Mun Yau Oi Estate Br. Shop 103-104, G/F Restaurant Block Yau Oi Estate Tuen Mun
N. T. 2452 3666
Kwai Hing Estate Br. Shop 1, G/F, Hing Yat House, Kwai Hing Estate, Kwai Chung, N. T.
2487 3332
Tai Po Tai Wo Estate Br. Shop 112-114, G/F., On Wo House, Tai Wo Estate, Tai Po, N. T. 2656 3386
Belvedere Garden Br. Shop 5A, G/F., Belvedere Square, Tsuen Wan, N.T 2411 6789
Tsuen Wan Br. Shop 1 and 1D, Level 2, Discovery Park Commercial Centre, Tsuen Wan, N.T.
2413 8111
Shatin Sui Wo Court Br. Shop F7, Commercial Centre, Sui Wo Court, Shatin, N.T. 2601 5888
Ma On Shan Br. Shop 313, Level 3, Ma On Shan Plaza Bayshore Tower, Ma On Shan, N.T.
2640 0733
Sheung Tak Estate Br. Shop 238, Sheung Tak Shopping Centre, Sheung Tak Est., Tseung Kwan O, N.T.
2178 2278
THE MAINLAND OF CHINA Xiamen Br. Unit 111-113, 1/F, 861 Xiahe Road, Xiamen,
Fujian Province, China(86-592) 585 7690
Xiamen Jimei Sub-Br. No.88 Jiyuan Road Jimei Xiamen, China (86-592) 619 3300
Fuzhou Br. 1/F, International Bldg., 210 Wusi Road, Fuzhou, Fujian Province, China
(86-591) 8781 0078