Embed Size (px)
Citation preview
EUKARYOTIC CELL, July 2009, p. 1038–1050 Vol. 8, No. 71535-9778/09/$08.00�0 doi:10.1128/EC.00079-09Copyright © 2009, American Society for Microbiology. All Rights Reserved.
Chitin in Diatoms and Its Association with the Cell Wall�†Colleen A. Durkin,1 Thomas Mock,2 and E. Virginia Armbrust1*
School of Oceanography, University of Washington, Box 357940, Seattle, Washington 98195,1 and School of Environmental Sciences,University of East Anglia, Norwich NR4 7TJ, United Kingdom2
Received 8 March 2009/Accepted 24 April 2009
Chitin is a globally abundant polymer widely distributed throughout eukaryotes that has been well charac-terized in only a few lineages. Diatoms are members of the eukaryotic lineage of stramenopiles. Of thehundreds of diatom genera, two produce long fibers of chitin that extrude through their cell walls of silica. Weidentify and describe here genes encoding putative chitin synthases in a variety of additional diatom genera,indicating that the ability to produce chitin is more widespread and likely plays a more central role in diatombiology than previously considered. Diatom chitin synthases fall into four phylogenetic clades. Protein domainpredictions and differential gene expression patterns provide evidence that chitin synthases have multiplefunctions within a diatom cell. Thalassiosira pseudonana possesses six genes encoding three types of chitinsynthases. Transcript abundance of the gene encoding one of these chitin synthase types increases when cellsresume division after short-term silicic acid starvation and during short-term limitation by silicic acid or iron,two nutrient conditions connected in the environment and known to affect the cell wall. During long-term silicicacid starvation transcript abundance of this gene and one additional chitin synthase gene increased at thesame time a chitin-binding lectin localized to the girdle band region of the cell wall. Together, these resultssuggest that the ability to produce chitin is more widespread in diatoms than previously thought and that asubset of the chitin produced by diatoms is associated with the cell wall.
Chitin is the most abundant polymer in the ocean and thesecond most abundant polymer on earth, exceeded only bycellulose (see, for example, references 1, 16, and 27). Thepervasiveness of chitin is attributed to its use by diverse eu-karyotic organisms, including fungi, insects, mollusks, crusta-ceans, algae, and protists. These diverged lineages commonlyuse chitin to strengthen their cell walls or skeletons. Chitinsynthase is used by all chitin-producing organisms to generatethe �-(134)-linked N-acetylglucosamine polymers. The uni-versality of this enzyme suggests an ancient eukaryotic origin(54). Chitin synthases are identified by the conserved aminoacid motifs QXXEY, EDR, QXRRW, and additional lineagespecific motifs that together are responsible for substrate spec-ificity and reaction catalysis (38, 54). Chitin synthases are em-bedded across the cell membrane, and it is at the membranejunction that N-acetylglucosamine monomers are added to agrowing polymer while it is transported across the membrane(55). While maintaining these general features, chitin syn-thases have also diverged and diversified within and betweeneukaryotic lineages. These enzymes have been most extensivelystudied within fungi where sequence phylogenies identify twomajor divisions of chitin synthases, with additional classeswithin these divisions. Phylogenetically distinct chitin synthasesproduce chitin at different cellular locations and for differentbiological functions (52). Thus, an individual organism oftencontains multiple types of chitin synthases.
Diatoms are known chitin producers that are of significant
ecological importance. Globally, these unicellular algae areresponsible for ca. 20% of annual primary production (13, 45)and support the most biologically productive regions of theocean. Evolutionarily distinct from plants and metazoans, di-atoms are members of the stramenopiles, a major eukaryoticlineage that includes plant pathogens, flagellates, and brownmacroalgae. The most distinctive characteristic of diatoms isthe nanopatterned silica cell wall, which is composed of twohalves (thecae) connected by hooplike silica structures calledgirdle bands. Diatom cell wall formation and eventual disso-lution controls the biogeochemical cycling of silicon in theocean, and because it is required for growth, silicon availabilityaffects carbon and other nutrient cycles (8). The formation ofthese intricate inorganic nanostructures has been studied in-tensively due to potential applications in nanotechnology thatrequire controlled synthesis of microscopic structures (4, 47).These topics have motivated more detailed analysis of thebiological mechanisms controlling cell wall formation (24) andmolecules associated with the silica (14, 30, 31, 62). The centricdiatom Thalassiosira pseudonana has emerged as a powerfulmodel for understanding silica biomineralization because ofthe availability of the whole genome sequence (2).
Thalassiosira and Cyclotella are the two diatom generaknown to produce chitin (34). Both are members of the orderThalassiosirales, which falls within the multipolar diatoms(class Mediophyceae). Interestingly, this class is evolutionarilyintermediate to the more ancient centric diatoms (class Cosci-nodiscophyceae) and the more derived pennate diatoms (classBacillariophyceae) (36) (see inset in Fig. 1). Thalassiosira andCyclotella both produce long thin chitin fibers that extend fromthe theca through specialized pores within the silica known asfultoportulae (21, 28, 53). The chitin fibers are arranged in anunusual highly crystalline beta configuration, in which all poly-mers lie parallel to one another and are not associated with
* Corresponding author. Mailing address: School of Oceanography,University of Washington, P.O. Box 357940, Seattle, WA 98195.Phone: (206) 616-1783. Fax: (206) 685-6651. E-mail: [email protected].
† Supplemental material for this article may be found at http://ec.asm.org/.
� Published ahead of print on 8 May 2009.
1038
on August 19, 2018 by guest
http://ec.asm.org/
Dow
nloaded from
other molecules (9, 35, 61). Specialized vesicles targeted to aninvaginated membrane just below the fultoportulae have beenidentified and were proposed to carry the molecular and chem-ical machinery necessary for chitin synthesis, which likely in-cludes the chitin synthases (20). In T. weissflogii, chitin syn-thases are estimated to generate 700,000 N-acetylglucosaminelinkages s�1 �m of specialized membrane�2 (20).
Analysis of the whole-genome sequences for T. pseudonana(2) and the pennate diatom Phaeodactylum tricornutum (3)suggests a previously unsuspected and complex role for chitin-related processes in diatoms. All genes necessary for chitinsynthesis were found in T. pseudonana, as well as P. tricornu-tum, despite the fact that P. tricornutum does not producechitin fibers. Both diatoms appear to encode multiple chitinsynthases; moreover, T. pseudonana possesses more than 20
genes that encode putative chitin-degrading chitinases andmore than 20 genes that encode putative proteins with chitin-binding domains. Two of the putative chitin-binding proteinsin T. pseudonana localize to the girdle band region of the cellwall, a region not previously suspected to contain chitin (6).The genes encoding these chitin-binding proteins, named p150and p150-like, are highly expressed when cells are grown in thepresence of high concentrations of copper or when cells arestarved of silicic acid or iron, conditions that all result inabnormally elongated theca (6, 40). We recently identified 84genes upregulated when cells were deprived of iron or silicicacid; many of these coregulated genes encode proteins knownto be involved in cell wall processes (40). Surprisingly, a geneencoding a chitin synthase was among this subset of upregu-lated genes, suggesting that chitin may play a role in diatom
FIG. 1. Maximum-likelihood phylogenetic tree of translated diatom chitin synthase gene sequences. Sequences amplified by CODEHOPprimers are followed by numerical identifiers 1 through 10, while sequences identified from genomes are followed by their protein ID number. Theoutgroup S. cerevisiae chitin synthase 3 (NCBI accession no. P29465) was used to root the tree. Bootstrap values are indicated at nodes. A scalebar indicates the number of amino acid changes. The inset shows a simplified phylogeny of diatom evolution adapted from data from Medlin andKaczmarska (36), and genera listed in the inset correspond to those present in the gene tree.
VOL. 8, 2009 CHITIN IN DIATOMS 1039
on August 19, 2018 by guest
http://ec.asm.org/
Dow
nloaded from
cell wall processes. Additional support for this possibilitycomes from a recent analysis of the organic composition of T.pseudonana cell walls using solid-state nuclear magnetic reso-nance (62). That study identified chitin as the main carbohy-drate component embedded within the silica cell walls, al-though the authors attributed this presence to contaminatingchitin fibers.
The genetic complexity of chitin-related genes in T. pseudo-nana, the identification of potential chitin synthases in P. tri-cornutum, and the unexpected expression pattern of one chitinsynthase gene in T. pseudonana suggests a more complex roleof chitin synthesis in diatoms than was previously thought. Wedescribe here our characterization of diatom chitin synthasegenes through comparative genetics and physiological experi-mentation in order to better understand the evolution, func-tion, and ecological consequences of chitin synthesis in dia-toms.
MATERIALS AND METHODS
In silico analyses. Putative chitin synthase genes were identified in the T.pseudonana and P. tricornutum genomes by combining automated gene predic-tions (www.doe.jgi.gov) and homology of predicted proteins to known chitinsynthases in the NCBI nonredundant database based on nBLAST and pBLASTtools (ncbi.nlm.nih.gov/blast/blast.cgi). BLAST identification of chitin synthaseswas considered significant when the e values were �10�15 and when a majorityof identified homologs were annotated as chitin synthases. Domain structures ofchitin synthases were analyzed by Interpro (ebi.ac.uk/InterProScan/), Prodom(prodom.prabi.fr/prodom/current/html/form.php), the NCBI Conserved DomainDatabase (ncbi.nlm.nih.gov/Structure/cdd/wrpsb.cgi), and TMHMM (cbs.dtu.dk/services/TMHMM-2.0/). Domain predictions were considered significant whenthe e values were �10�5.
Phytoplankton cultures and experimental setup. An isolate of T. punctigeraand T. rotula was provided by P. von Dassow (64) and an isolate of Ditylumbrightwellii was provided by J. Koester; both isolates were collected from PugetSound, WA. An isolate of Pseudo-nitzschia multiseries from the North Atlanticwas provided by S. Bates and C. Leger. All other phytoplankton isolates (Table1) were purchased from the Provasoli-Guillard National Center for Culture ofMarine Phytoplankton (CCMP [ccmp.bigelow.org]). Cultures were maintainedexponentially at 100 to 200 �mol of photons m�2 s�1 in 250 to 500 ml off/2-amended seawater (17, 18) that had been filtered through a 0.45-�m-pore-size polycarbonate filter (Millipore).
Silicic acid starvation and recovery were monitored on both short and longtime scales. Short-term recovery from silicic acid starvation was analyzed by firstgrowing triplicate cultures in Aquil medium (50) under continuous light at 100�mol of photons m�2 s�1 and constant bubbling with sterile air until the middleof the exponential growth phase. In a manner similar to those described byHildebrand et al. (22), cells were harvested by centrifugation at 4,500 � g for 15min, washed once with, and inoculated into Aquil medium without silicic acid ata final concentration of 0.6 � 106 cells ml�1. At 48 h, silicic acid was added to thecultures at a final concentration of 200 �M, and the cultures were monitored foran additional 8 h as they recovered from silicic acid starvation and resumed celldivision. Long-term responses to silicic acid starvation were monitored in trip-licate cultures transferred from exponential growth in fully amended f medium(17) into f medium with low silicic acid (0.067 �M) at 175 to 275 �mol of photonsm�2 s�1. Changes in chlorophyll a fluorescence over time were measured with afluorometer (Turner), and cell concentrations were determined with an InFluxcell sorter flow cytometer (Cytopeia) equipped with a 488-nm laser. An aliquotof 2-�m fluorescent bead stock (Polysciences) of known concentration was addedto 1 ml of culture, and the particles were counted together. Photosyntheticcapacity (Fv/Fm) was determined with a PhytoPAM fluorometer (Walz). Toconfirm that cell division had ceased due to silicic acid starvation, a final concen-tration of 214 �M silicic acid was added to a 50-ml aliquot of each triplicateculture, and the relative fluorescence was monitored for a day. Aliquots of the culturemedia on day 4 were also filtered through a 0.2-�m-pore-size filter and analyzedfor dissolved silicic acid content by using the molybdate method (5). A pulse ofsilicic acid similar to the short-term experiment (214 �M) was added to the silicicacid-starved cultures after 6 days in stationary phase, and the response of thecells was monitored 24 and 48 h later. Samples were collected from both types ofexperiments for quantitative reverse transcriptase PCR (qRT-PCR) by filteringbetween 200 and 1,000 ml of culture onto four 2-�m-pore-size polycarbonatefilters (Millipore) (see below). Filtered cells were also collected from previouslydescribed experiments (40) with nutrient-replete cultures and short-term (�1day) silicic acid-, iron-, and nitrate-limited cultures.
DNA and RNA extraction and cDNA synthesis. DNA was extracted with aplant DNA extraction kit (Qiagen) from exponentially maintained cultures (Ta-ble 1) that had been concentrated and frozen onto 0.45-�m-pore-size polycar-bonate filters (Millipore). RNA was extracted with the plant RNA isolationreagent (Invitrogen) from frozen cells on 2-�m-pore-size polycarbonate filters.Contaminating DNA was eliminated by incubating the isolated RNA with DNaseI (Ambion) at 37°C for 1 to 2 h; DNA-free RNA was purified with an RNeasyMiniElute cleanup kit (Qiagen). cDNA was synthesized from 2 �g of purifiedRNA with a Superscript III first-strand synthesis system for RT-PCR (Invitro-gen). The 20 �l of cDNA was subsequently diluted with water to 100 �l. Onemicroliter of RNA was used in PCRs (see below) to ensure that all contaminatingDNA had been eliminated.
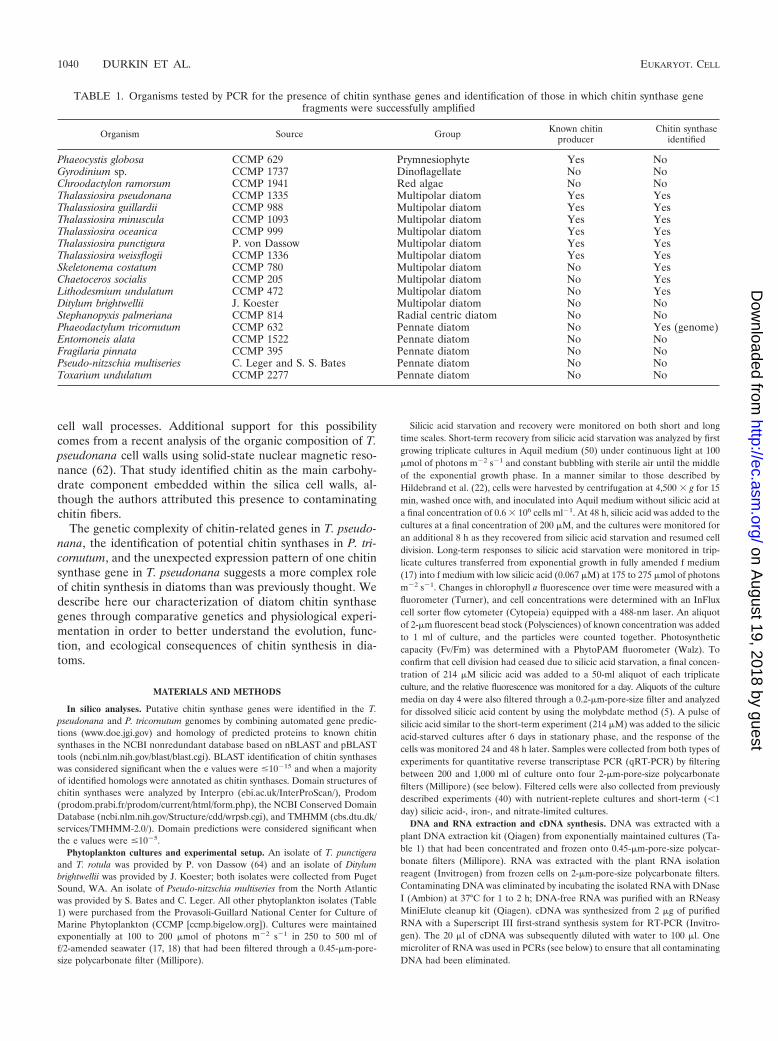
TABLE 1. Organisms tested by PCR for the presence of chitin synthase genes and identification of those in which chitin synthase genefragments were successfully amplified
Organism Source Group Known chitinproducer
Chitin synthaseidentified
Phaeocystis globosa CCMP 629 Prymnesiophyte Yes NoGyrodinium sp. CCMP 1737 Dinoflagellate No NoChroodactylon ramorsum CCMP 1941 Red algae No NoThalassiosira pseudonana CCMP 1335 Multipolar diatom Yes YesThalassiosira guillardii CCMP 988 Multipolar diatom Yes YesThalassiosira minuscula CCMP 1093 Multipolar diatom Yes YesThalassiosira oceanica CCMP 999 Multipolar diatom Yes YesThalassiosira punctigura P. von Dassow Multipolar diatom Yes YesThalassiosira weissflogii CCMP 1336 Multipolar diatom Yes YesSkeletonema costatum CCMP 780 Multipolar diatom No YesChaetoceros socialis CCMP 205 Multipolar diatom No YesLithodesmium undulatum CCMP 472 Multipolar diatom No YesDitylum brightwellii J. Koester Multipolar diatom No NoStephanopyxis palmeriana CCMP 814 Radial centric diatom No NoPhaeodactylum tricornutum CCMP 632 Pennate diatom No Yes (genome)Entomoneis alata CCMP 1522 Pennate diatom No NoFragilaria pinnata CCMP 395 Pennate diatom No NoPseudo-nitzschia multiseries C. Leger and S. S. Bates Pennate diatom No NoToxarium undulatum CCMP 2277 Pennate diatom No No
1040 DURKIN ET AL. EUKARYOT. CELL
on August 19, 2018 by guest
http://ec.asm.org/
Dow
nloaded from

Determination of full-length gene sequences. Full-length sequence of the T.pseudonana chitin synthase cDNAs was determined by DNA sequencing ofPCR-generated fragments using a total of 40 primers (not listed) designed acrossthe entire length of the modeled gene sequences (www.doe.jgi.gov), and openreading frames that appeared to extend up or downstream of gene models. PCRsconsisted of 1 �l of cDNA, 1 �l of 10� Taq buffer, 3.125 mM MgCl2, 0.7 U ofTaq (Promega and Gene Choice), 0.4 mM deoxynucleoside triphosphates, and0.5 �M concentrations of forward and reverse primers. Amplifications consistedof a denaturation at 94°C for 2 min, followed by 30 cycles of 94°C for 10 s,treatment at between 55 and 62°C for 30 s, depending on annealing temperatureof the primer set, and then 72°C for 90 s. Amplified fragments were separated onan agarose gel, and fragments of the appropriate size were cut out of the gel andextracted with the QiaQuick gel extraction kit (Qiagen). Between 50 and 100 ngof purified PCR product was cycle sequenced with DYEnamic ET dye terminatorcycle sequencing kit (GE Healthcare Biosciences Corp.) and analyzed on aMegaBACE 1000 (GE Healthcare Biosciences Corp.). Rapid amplification ofcDNA ends (RACE) was performed with First Choice RLM-RACE kit (Am-bion) to identify the 5� and 3� ends of the gene encoding protein 7305. TheRACE primers are listed in Table 2. All sequences were analyzed and aligned inSequencher version 4.6 and compared to the T. pseudonana genome withBLAST.
Gene expression. Transcript abundances in T. pseudonana were determined byqRT-PCR. Primers (Table 2) were designed to amplify a 100- to 250-bp fragmentfor four reference genes encoding the actin-like protein (protein identification[protein ID] 269504), actin (protein ID 25772), 40S rRNA (protein ID 31084),and beta tubulin (protein ID 31569). Primers were also designed to amplify a100-bp fragment from genes encoding three chitin synthases (protein IDs 7305,6575, and 4368) and two genes encoding girdle band-associated chitin-bindingproteins p150 and p150-like (protein IDs 12594 and 26041). Triplicate qRT-PCRs included 2 �l of cDNA; 0.8 �M concentrations of forward and reverseprimers; and 10, 20, or 25 �l of iQ Supermix (Bio-Rad, Richmond, CA) in a 20-,40-, or 50-�l reaction volume. Amplifications were carried out in an iCycler(Bio-Rad) and consisted of an initial denaturation at 95°C for 3 min; followed by45 cycles of 95°C for 10 s, 60°C for 30 s, and 72°C for 50 s; followed by a stepwiseincrease in melting temperature to verify the presence of a single melt peakfluorescent signal. Threshold cycle (CT) values were calculated with iCyclersoftware, and the PCR amplification curves were imported into LinReg (51) tocalculate the amplification efficiency. Efficiency calculations were based on at
least four points, and only values with an R of �0.998 and an efficiency between1.7 and 2.2 were considered. Efficiencies calculated from all qRT-PCRs for asingle primer set were averaged to yield a single efficiency for use in expressioncalculations. These averages were between 1.92 and 1.98 determined from be-tween 34 and 187 separate PCRs, depending on the gene. Relative transcriptabundance was calculated by the equation Eref
CT ref/EtargetCT target, where Eref is
the reference gene efficiency, Etarget is the target gene efficiency, CT ref is the CT
of the reference gene, and CT target is the CT of the target gene (49). Relativetranscript abundances measured in triplicate cultures entering silicic acid, iron,or nitrate limitation were compared to the control condition by using a Studentt test. Relative transcript abundances in triplicate cultures in the hours aftersilicic acid replenishment or the days of growth in silicic acid-depleted mediawere log transformed, and time points were compared by using an analysis ofvariance test (� � 0.05) in SPSS version 16. Time points with significant differ-ences were identified by using a Tukey test (66).
Phylogenetic analysis. CLUSTAL W (63) was used to align translated T.pseudonana chitin synthase genes with fungal chitin synthase protein sequences(GenBank numbers O13353, P29465, P30573, Q01285, P78611, and O13394) andPCR primers (Table 2) were designed by using CODEHOP (52a). Primers weredesigned to target the region encoding conserved chitin synthase motifsG(X)4(Y/F)R and SWG and spanned the sequence encoding EDR andQRRRW residues, which define the enzyme (38, 43, 54). Reactions included 1 to25 ng of DNA, 0.5 �M concentrations of forward and reverse primers, 1 �l of10� buffer, 3.125 mM MgCl2, 0.4 mM deoxynucleoside triphosphates, and 0.7 Uof Taq polymerase (Promega and Gene Choice). Amplifications consisted of aninitial denaturation of 95°C for 2 min, followed in turn by 30 cycles of 94°C for10 s, 55 or 60°C for 30 s, and 72°C for 2 min. Amplified DNA fragments wereseparated and purified from an agarose gel as described above, ligated into theTOPO vector (Invitrogen), and used to transform Escherichia coli TOP 10 cells.Plasmids from 3 to 10 positive transformants were amplified with TempliPhi (GEHealthcare Biosciences Corp.) and sequenced with M13 forward and reverseprimers as described above. Resulting DNA sequences were analyzed in Se-quencher and aligned with CLUSTAL W. Positive identification of fragmentscorresponding to chitin synthase genes were based on the presence of the se-quence that encoded EDR and QRRRW motifs. Sequences that differed bythree or more nucleotides were considered distinct. A maximum-likelihood treewas calculated in proml in the PHYLIP software package (12) based on thealignment of all translated sequence fragments amplified with CODEHOP prim-
TABLE 2. Oligonucleotide primers used for amplifying chitin synthase gene fragments in phytoplankton and cDNA fragments from variousgenes in T. pseudonana
Method Directiona Gene target/protein ID Sequence (5�–3�)
CODEHOP F Chitin synthase/general TGCGTCACATGTTTGCCAGGAtgyttcwsgatgtaR Chitin synthase/general CGAACGAGTCTCACCCCAAGAraartcrtc
5�RACE R-inner Chitin synthase/7305 TCTCGCAGTGTTGTTGCTCTR-outer Chitin synthase/7305 GCGATAGCGTTCTTCTTCCA
3�RACE F Chitin synthase/7305 TGCCGGTGTTTTACTTCCTT
qRT-PCR F Chitin synthase/6575 GTAGAAGTTTGGTAGAGAGAR Chitin synthase/6575 ACTATTTGCTCGGACAGAAAF Chitin synthase/7305 GGTGTGCAGTTGGTGGTGTTR Chitin synthase/7305 CGCAGCAACCTTACGAGTCTF Chitin synthase/4368 TACGACCAGCAGTAGTACAAR Chitin synthase/4368 ACTCACTTTCATCATCACTAF Actin-like/269504 CTCCCAATCCTGGCAATAGAR Actin-like/269504 CGAAACCTATCCACGACGTTF p150-like/12594 GCGATTACAATGCTCCCACTR p150-like/12594 GTGAAGAGAACGCTTGGGTAF p150/26041 GTTGCTCAAAGTTCGGCTTCR p150/26041 TCGGTTGTTCCACACCTGTAF Actin/25772 ACCAACTGGGACGACATGGAGAAAR Actin/25772 TGTGGGTAACACCATCTCCCGAATF 40S S11/31084 CCAAAGACCATCGAAGGAGAR 40S S11/31084 GACACGGACGAGGGTTTCTF Beta tubulin/31569 GCCTTTGATGCCAAGAACATR Beta tubulin/31569 GATGGATGCCTTGAGGTTGT
a F, forward; R, reverse.
VOL. 8, 2009 CHITIN IN DIATOMS 1041
on August 19, 2018 by guest
http://ec.asm.org/
Dow
nloaded from

ers, T. pseudonana and P. tricornutum sequences, with Saccharomyces cerevisiaechitin synthase 3 (P29465) as an outgroup. Sequence alignment was anchored bythe EDR, QRRRW, and SWG motifs. Regions corresponding to amino acids1007 to 1073 in T. pseudonana 7305, amino acids 573 to 770 in P. tricornutum37908, and amino acids 1012 to 1078 in S. cerevisiae P29465 were eliminated dueto the uncertainty of alignment in this region. The resulting alignment was 111amino acids long, and bootstrap values were calculated from the construction of1,000 trees.
Localizing and quantifying chitin and silica deposition. Silica deposition wasdetermined by incubating 50-ml aliquots of cultures with 0.5 �M 2-(4-pyridyl)-5{[4-(2-dimethylaminoethyl-aminocarbamoyl)-methoxy]phenyl}oxazole(PDMPO; Invitrogen) for 12 to 14 h in the same light and temperature condi-tions as the experimental conditions (56). Cells were analyzed with an Influx cellsorter flow cytometer (Cytopeia) equipped with a 355-nm UV laser. Fluorescentemission was detected at 460 nm (50-nm band-pass). Internal standards of 3-�mUV beads (Spherotech) were used for calibration. Epifluorescence was alsovisualized with an i80 microscope (Nikon) after excitation at 300 to 400 nm andemission detected with a 420-nm long-pass filter (Chroma). Potential chitinlocalization was determined by incubating cells with 4 �g of fluorescein isothio-cyanate-labeled wheat germ agglutinin (FITC-WGA; Sigma) for 15 to 30 min.Cells were centrifuged at 15,000 � g for 5 min and resuspended in 1 ml of f/2media or phosphate-buffered saline buffer (137 mM NaCl, 2.7 mM KCl, 10.4 mMNa2HPO4, 1.8 mM KH2PO4) to remove unbound FITC-WGA. The resultingfluorescent signal was quantified by flow cytometry after excitation with a 488-nmlaser, and 2-�m yellow-green beads (Polysciences) were used as internal stan-dards. Emission was detected at 530 nm (40 nm band-pass). Localization ofFITC-WGA binding was visualized by fluorescence microscopy with a 500- to570-nm wavelength filter (Chroma) after excitation at 455 to 500 nm. Compet-itive binding experiments with chitotriose and N-acetylglucosamine (41, 48) wereused to determine whether the FITC-WGA bound specifically to chitin in T.pseudonana. First, 4 �g of FITC-WGA was incubated with 1 �g to 2.4 mg ofchitotriose in 100 �l of water for 3 h, followed by a 30-min incubation with 100�l of cell culture at 106 cells ml�1. Excess FITC-WGA was washed from thecells as described above, and the amount of FITC-WGA bound to cells wasquantified by flow cytometry and microscopy. Afterward, similar incubationswere conducted with 1 �g to 9.6 mg of N-acetylglucosamine as the competitivebinding substrate. Flow cytometry signal comparisons were calculated in MatLabby using a two-sided Kolmogorov-Smirnov test with a 95% confidence interval.Modes were determined by creating a histogram of the 65,000 possible fluores-cent intensities detected by the flow cytometer with a bin size of 200. If adistribution had two modes the average of the two numbers was used. Distribu-tions were visualized by using FlowJo (Tree Star, Inc.).
Exponentially growing and silicic acid starved T. pseudonana cells were alsoincubated with FITC-labeled chitin-binding probe (FITC-chb) purified fromBacillus circulans (New England Biolabs) by pelleting the cells in a centrifuge at15,000 � g for 10 min, resuspending them in 500 �l of TBS (0.05 M Tris base,0.15 M NaCl), and then incubating them with 1 �l of FITC-chb for at least 3 h.The cells were washed, and FITC-chb localization was visualized as describedabove. Cells were also stained with 10 �g of calcofluor white (Sigma) for 30 minand visualized after excitation at 300 to 400 nm and emission detected with a420-nm long-pass filter (Chroma). Additional diatom species T. punctigera, T.rotula, and S. costatum were also silicic acid starved and stained with FITC-WGAas described above.
Genetic sequences. Chitin synthase sequence fragments amplified fromCODEHOP primers were deposited in the NCBI database under the followingaccession numbers: C. socialis (FJ544943 to FJ544945), L. undulatum (FJ544946and FJ544947), S. costatum (FJ544948 to FJ544952), T. guillardii (FJ544953 toFJ544960), T. minuscula (FJ544961 to FJ544965), T. oceanica (FJ544966 toFJ544974), T. punctigera (FJ544975 to FJ544977), and T. wiessfloggii (FJ550076to FJ550085).
RESULTS
In silico and phylogenetic analyses of putative chitin syn-thases in diatoms. Automated annotation of the T. pseudo-nana whole genome sequence identified six genes that encodedputative chitin synthases (Table 3) based on detection of thechitin synthase active site domain with the conserved aminoacid motifs EDR, QRRRW, and SWG. Full-length sequencesand intron locations of the identified genes were confirmedthrough a combination of cDNA sequencing and RACE. The
six T. pseudonana genes are located on three chromosomes.Chitin synthase genes occur as inverted repeats once on chro-mosome 4 and again on chromosome 7. Because the genes inboth inverted repeats are identical to each other, it was notpossible to determine whether retrieved cDNA sequences cor-responded to both members of a repeat. Automated genemodel predictions from version 3 of the T. pseudonana ge-nome were consistent with transcribed regions confirmed bycDNA sequencing and RACE, except modeled protein ID4368 incorrectly predicted a short exon at the 3� end.
Automated annotation of P. tricornutum whole genome se-quence identified two genes that encoded putative chitin syn-thases (Table 3) that also contained the chitin synthase active-site domain with conserved amino acid motifs, despite the factthat this diatom is not known to produce chitin. The genemodel for one chitin synthase (ID 44759) displayed expressedsequence tag (EST) support without additional open readingframes detected either upstream or downstream of the mod-eled gene and was therefore assumed to be accurate. Thesecond gene (ID 37908) lacked EST support but displayed61% nucleotide sequence identity and 57% translated nucleo-tide identity to the gene encoding 44759.
PCR products from the active site region of chitin synthasegenes were successfully amplified from a variety of multipolarspecies including the known chitin fiber producers T. oceanica,T. punctigura, T. minuscula, T. guillardii, and T. weissflogii, aswell as species not known to produce fibers, including Skel-etonema costatum, Chaetoceros socialis, and Lithodesmium un-dulatum. PCR products were not successfully amplified fromthe other examined phytoplankton (Table 1). Phylogeneticanalyses grouped the diatom chitin synthases into three cladeswith bootstrap support of 96, 71, and 100; a fourth potentialclade has weaker bootstrap support of 45 (Fig. 1). The two P.tricornutum sequences formed a clade, identified here as cladeD. The multipolar diatom sequences were distributed amongthree clades, identified here as clades A, B, and C. Each ofthese three clades contained sequences from multiple species.Moreover, most examined multipolar species encoded proteinsthat fell into more than one clade. Although clone librarieswere not sequenced to saturation, it is of interest to note that
TABLE 3. Genomic characteristics of chitin synthase genesdiscovered in the T. pseudonana and P. tricornutum genomes
Genome andprotein ID
Nucleotides(bp)
Intronlength(bp)
Chromosomelocationa
Confirmationmethod
T. pseudonana6575 4,408 96, 99 6 cDNA sequencing7305 3,887 143 7 (IR) cDNA sequencing
and RACE7306 3,887 143 7 (IR) cDNA sequencing4368 4,374 None 4 cDNA sequencing4413 3,012 None 4 (IR) cDNA sequencing4414 3,012 None 4 (IR) cDNA sequencing
P. tricornutum44759 2,806 91 5 EST coverage37908 2,875 73 14 Similarity to
44759
a IR, inverted repeat.
1042 DURKIN ET AL. EUKARYOT. CELL
on August 19, 2018 by guest
http://ec.asm.org/
Dow
nloaded from
only species possessing fultoportula encoded proteins associ-ated with clade A sequences.
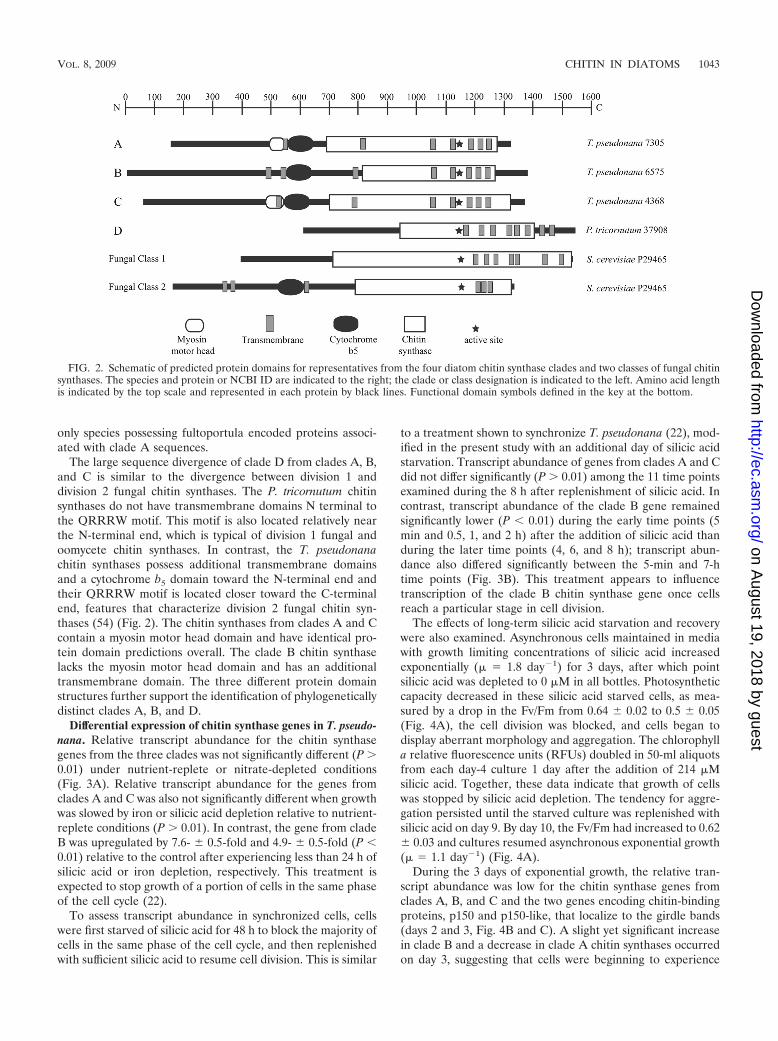
The large sequence divergence of clade D from clades A, B,and C is similar to the divergence between division 1 anddivision 2 fungal chitin synthases. The P. tricornutum chitinsynthases do not have transmembrane domains N terminal tothe QRRRW motif. This motif is also located relatively nearthe N-terminal end, which is typical of division 1 fungal andoomycete chitin synthases. In contrast, the T. pseudonanachitin synthases possess additional transmembrane domainsand a cytochrome b5 domain toward the N-terminal end andtheir QRRRW motif is located closer toward the C-terminalend, features that characterize division 2 fungal chitin syn-thases (54) (Fig. 2). The chitin synthases from clades A and Ccontain a myosin motor head domain and have identical pro-tein domain predictions overall. The clade B chitin synthaselacks the myosin motor head domain and has an additionaltransmembrane domain. The three different protein domainstructures further support the identification of phylogeneticallydistinct clades A, B, and D.
Differential expression of chitin synthase genes in T. pseudo-nana. Relative transcript abundance for the chitin synthasegenes from the three clades was not significantly different (P 0.01) under nutrient-replete or nitrate-depleted conditions(Fig. 3A). Relative transcript abundance for the genes fromclades A and C was also not significantly different when growthwas slowed by iron or silicic acid depletion relative to nutrient-replete conditions (P 0.01). In contrast, the gene from cladeB was upregulated by 7.6- 0.5-fold and 4.9- 0.5-fold (P �0.01) relative to the control after experiencing less than 24 h ofsilicic acid or iron depletion, respectively. This treatment isexpected to stop growth of a portion of cells in the same phaseof the cell cycle (22).
To assess transcript abundance in synchronized cells, cellswere first starved of silicic acid for 48 h to block the majority ofcells in the same phase of the cell cycle, and then replenishedwith sufficient silicic acid to resume cell division. This is similar
to a treatment shown to synchronize T. pseudonana (22), mod-ified in the present study with an additional day of silicic acidstarvation. Transcript abundance of genes from clades A and Cdid not differ significantly (P 0.01) among the 11 time pointsexamined during the 8 h after replenishment of silicic acid. Incontrast, transcript abundance of the clade B gene remainedsignificantly lower (P � 0.01) during the early time points (5min and 0.5, 1, and 2 h) after the addition of silicic acid thanduring the later time points (4, 6, and 8 h); transcript abun-dance also differed significantly between the 5-min and 7-htime points (Fig. 3B). This treatment appears to influencetranscription of the clade B chitin synthase gene once cellsreach a particular stage in cell division.
The effects of long-term silicic acid starvation and recoverywere also examined. Asynchronous cells maintained in mediawith growth limiting concentrations of silicic acid increasedexponentially (� � 1.8 day�1) for 3 days, after which pointsilicic acid was depleted to 0 �M in all bottles. Photosyntheticcapacity decreased in these silicic acid starved cells, as mea-sured by a drop in the Fv/Fm from 0.64 0.02 to 0.5 0.05(Fig. 4A), the cell division was blocked, and cells began todisplay aberrant morphology and aggregation. The chlorophylla relative fluorescence units (RFUs) doubled in 50-ml aliquotsfrom each day-4 culture 1 day after the addition of 214 �Msilicic acid. Together, these data indicate that growth of cellswas stopped by silicic acid depletion. The tendency for aggre-gation persisted until the starved culture was replenished withsilicic acid on day 9. By day 10, the Fv/Fm had increased to 0.62 0.03 and cultures resumed asynchronous exponential growth(� � 1.1 day�1) (Fig. 4A).
During the 3 days of exponential growth, the relative tran-script abundance was low for the chitin synthase genes fromclades A, B, and C and the two genes encoding chitin-bindingproteins, p150 and p150-like, that localize to the girdle bands(days 2 and 3, Fig. 4B and C). A slight yet significant increasein clade B and a decrease in clade A chitin synthases occurredon day 3, suggesting that cells were beginning to experience
FIG. 2. Schematic of predicted protein domains for representatives from the four diatom chitin synthase clades and two classes of fungal chitinsynthases. The species and protein or NCBI ID are indicated to the right; the clade or class designation is indicated to the left. Amino acid lengthis indicated by the top scale and represented in each protein by black lines. Functional domain symbols defined in the key at the bottom.
VOL. 8, 2009 CHITIN IN DIATOMS 1043
on August 19, 2018 by guest
http://ec.asm.org/
Dow
nloaded from
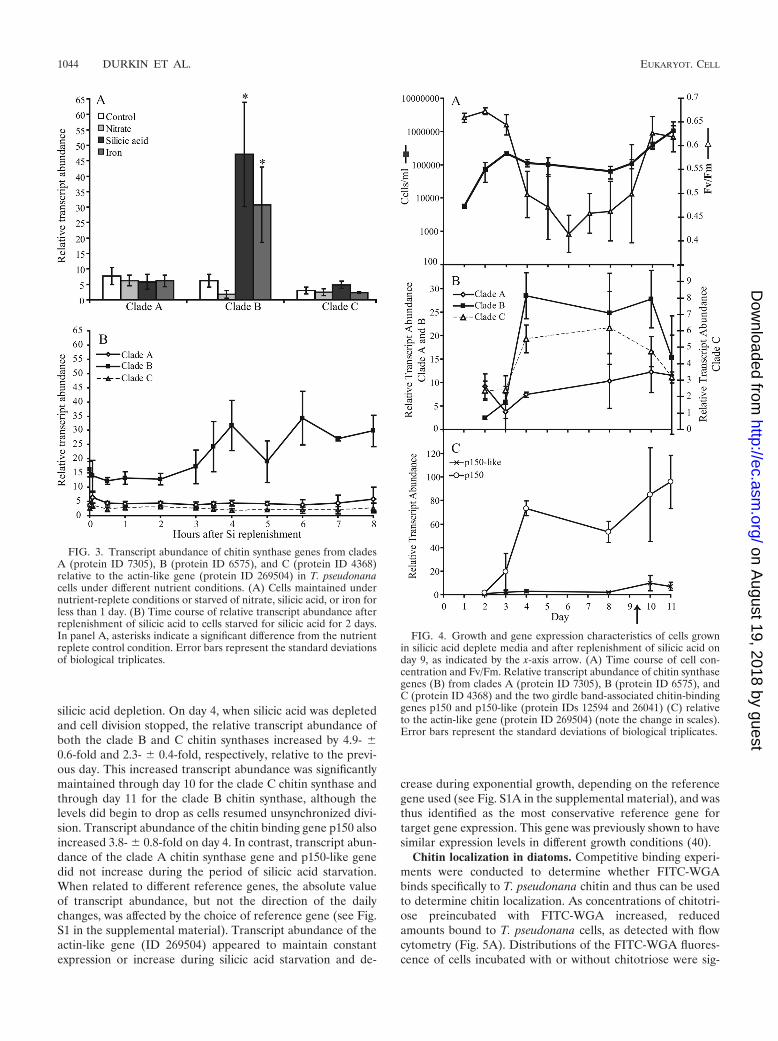
silicic acid depletion. On day 4, when silicic acid was depletedand cell division stopped, the relative transcript abundance ofboth the clade B and C chitin synthases increased by 4.9- 0.6-fold and 2.3- 0.4-fold, respectively, relative to the previ-ous day. This increased transcript abundance was significantlymaintained through day 10 for the clade C chitin synthase andthrough day 11 for the clade B chitin synthase, although thelevels did begin to drop as cells resumed unsynchronized divi-sion. Transcript abundance of the chitin binding gene p150 alsoincreased 3.8- 0.8-fold on day 4. In contrast, transcript abun-dance of the clade A chitin synthase gene and p150-like genedid not increase during the period of silicic acid starvation.When related to different reference genes, the absolute valueof transcript abundance, but not the direction of the dailychanges, was affected by the choice of reference gene (see Fig.S1 in the supplemental material). Transcript abundance of theactin-like gene (ID 269504) appeared to maintain constantexpression or increase during silicic acid starvation and de-
crease during exponential growth, depending on the referencegene used (see Fig. S1A in the supplemental material), and wasthus identified as the most conservative reference gene fortarget gene expression. This gene was previously shown to havesimilar expression levels in different growth conditions (40).
Chitin localization in diatoms. Competitive binding experi-ments were conducted to determine whether FITC-WGAbinds specifically to T. pseudonana chitin and thus can be usedto determine chitin localization. As concentrations of chitotri-ose preincubated with FITC-WGA increased, reducedamounts bound to T. pseudonana cells, as detected with flowcytometry (Fig. 5A). Distributions of the FITC-WGA fluores-cence of cells incubated with or without chitotriose were sig-
FIG. 3. Transcript abundance of chitin synthase genes from cladesA (protein ID 7305), B (protein ID 6575), and C (protein ID 4368)relative to the actin-like gene (protein ID 269504) in T. pseudonanacells under different nutrient conditions. (A) Cells maintained undernutrient-replete conditions or starved of nitrate, silicic acid, or iron forless than 1 day. (B) Time course of relative transcript abundance afterreplenishment of silicic acid to cells starved for silicic acid for 2 days.In panel A, asterisks indicate a significant difference from the nutrientreplete control condition. Error bars represent the standard deviationsof biological triplicates.
FIG. 4. Growth and gene expression characteristics of cells grownin silicic acid deplete media and after replenishment of silicic acid onday 9, as indicated by the x-axis arrow. (A) Time course of cell con-centration and Fv/Fm. Relative transcript abundance of chitin synthasegenes (B) from clades A (protein ID 7305), B (protein ID 6575), andC (protein ID 4368) and the two girdle band-associated chitin-bindinggenes p150 and p150-like (protein IDs 12594 and 26041) (C) relativeto the actin-like gene (protein ID 269504) (note the change in scales).Error bars represent the standard deviations of biological triplicates.
1044 DURKIN ET AL. EUKARYOT. CELL
on August 19, 2018 by guest
http://ec.asm.org/
Dow
nloaded from
nificantly different (P � 0.05) at every concentration, and themode consistently decreased as chitotriose concentrations in-creased, to a final mode 70% less than noncompetitively boundcells. In contrast, the fluorescence distributions of FITC-WGA-bound cells with or without N-acetylglucosamine werenot significantly different (P 0.05) until concentrations of 22mM were reached and the mode values varied by no more than5% (Fig. 5B). These results suggested that the FITC-WGAbound specifically to T. pseudonana chitin.
The impact of silicic acid starvation and recovery on silicadeposition and chitin localization were examined by stainingcells with FITC-WGA and PDMPO, a stain that incorporatesinto newly deposited silica (56). During the transition of T.pseudonana from exponential growth to silicic acid depletion,silica deposition and chitin exposure on the cell wall wereinversely correlated. Exponentially growing cells had a rela-tively narrow distribution of high intensity (mode � 135 5RFUs) PDMPO staining as detected with flow cytometry (Fig.6A). Epifluorescence microscopy confirmed that these expo-nentially growing cells were depositing silica at valves andgirdle bands (Fig. 6B and C). In contrast, the FITC-WGAfluorescence of exponentially growing cells was slightly higher(mode � 66 4 RFUs) than unstained cells (mode � 46 2);FITC-WGA staining of cells was not detectable with epifluo-rescence microscopy. As cells entered silicic acid depletion onday 4 (Fig. 4A), the distribution of PDMPO fluorescencebroadened, with more cells displaying lower intensity fluores-cence, and the average mode decreased by 35% (Fig. 6A).Microscopic examination of cells indicated that many still de-posited silica at the girdle bands but not the valves. Modefluorescence of FITC-WGA per cell increased on day 4 by35%. Microscopy revealed lectin localization around the girdlebands (Fig. 6C). The PDMPO fluorescent intensity per cellcontinued to decrease until the average mode was 1% of theoriginal intensity on day 5, and no staining of cells was ob-served (Fig. 6C). The distribution of FITC-WGA fluorescenceshifted to a higher intensity, with the highest average mode onday 9 being about twice the original intensity. Most cells hadFITC-WGA bound to the girdle-band region. These cells alsohad an elongated and bent phenotype. This was particularlyevident in the highest-fluorescing cells, where this exposedbent joint between the two thecae appeared to be larger (Fig.6C). No binding of FITC-WGA was seen at the chitin fibers.After silicic acid replenishment on day 9, the mode of PDMPOfluorescence increased significantly (119 5 RFUs) and themode of FITC-WGA fluorescence decreased significantly(72 1 RFUs) (P � 0.01).
To confirm the localization of chitin at the girdle bands,additional fluorescent chitin binding probes were used to labelboth exponentially growing and silicic acid-starved T. pseudo-nana cultures. Cells were incubated with FITC-WGA, cal-cofluor white, and the commercially available chitin-bindingprotein derived from bacteria, FITC-chb. All three stains lo-
FIG. 5. Distributions of fluorescence intensities from T. pseudo-nana cells bound with FITC-WGA in the presence of a competitivebinding substrate. (A) Cells bound with FITC-WGA preincubated withincreasing concentrations of chitiotriose; (B) cells bound with FITC-WGA preincubated with increasing concentrations of N-acetylglu-cosamine. The concentrations of the competitive binding substrate areindicated in each panel. Thick black lines represent the fluorescence of
cells in the presence of the competitive substrate, and thin gray linesrepresent the fluorescence of cells bound with FITC-WGA without acompetitive substrate. Asterisks indicate a significant difference be-tween distributions.
VOL. 8, 2009 CHITIN IN DIATOMS 1045
on August 19, 2018 by guest
http://ec.asm.org/
Dow
nloaded from
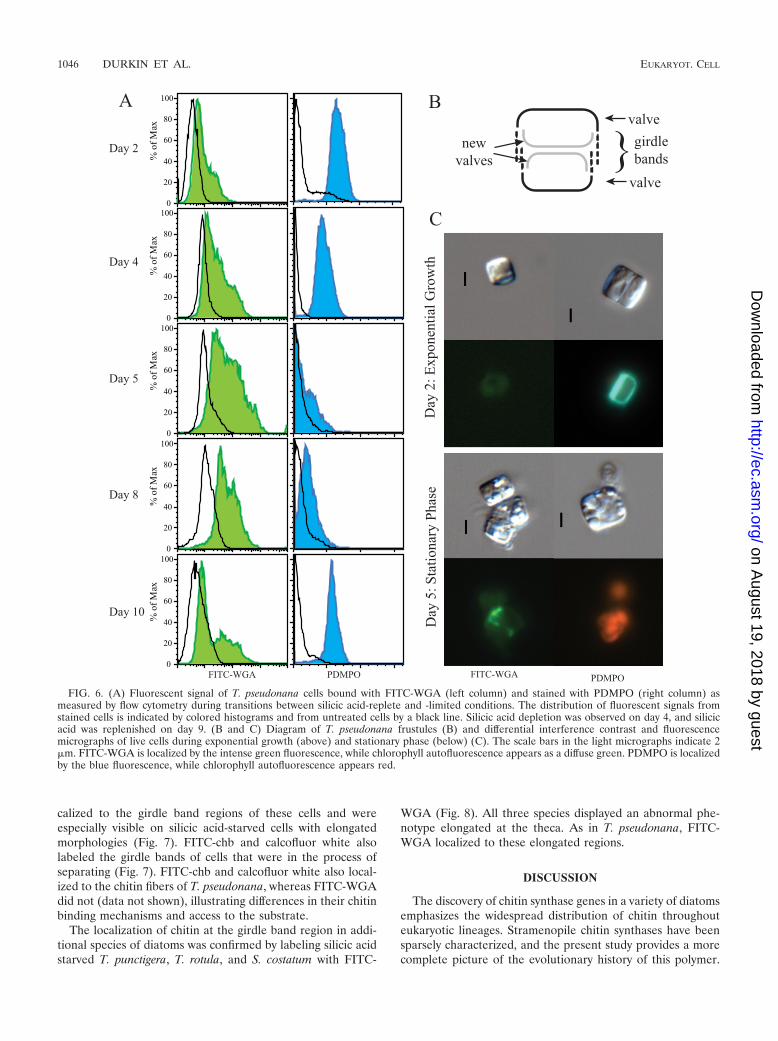
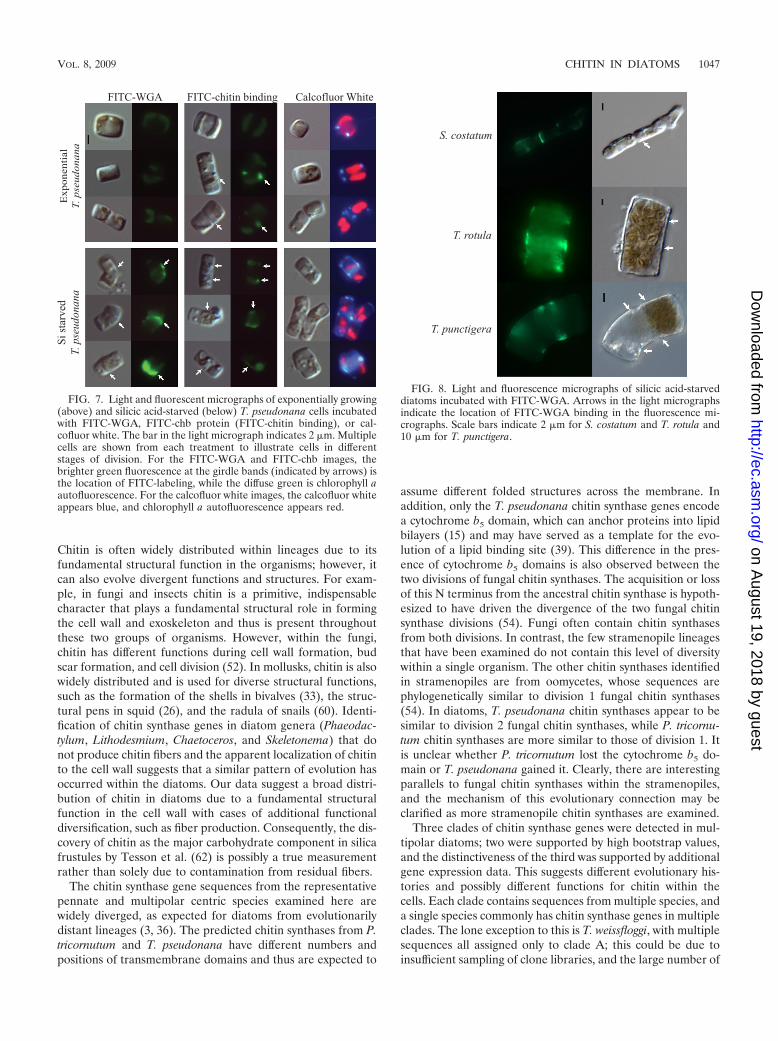
calized to the girdle band regions of these cells and wereespecially visible on silicic acid-starved cells with elongatedmorphologies (Fig. 7). FITC-chb and calcofluor white alsolabeled the girdle bands of cells that were in the process ofseparating (Fig. 7). FITC-chb and calcofluor white also local-ized to the chitin fibers of T. pseudonana, whereas FITC-WGAdid not (data not shown), illustrating differences in their chitinbinding mechanisms and access to the substrate.
The localization of chitin at the girdle band region in addi-tional species of diatoms was confirmed by labeling silicic acidstarved T. punctigera, T. rotula, and S. costatum with FITC-
WGA (Fig. 8). All three species displayed an abnormal phe-notype elongated at the theca. As in T. pseudonana, FITC-WGA localized to these elongated regions.
DISCUSSION
The discovery of chitin synthase genes in a variety of diatomsemphasizes the widespread distribution of chitin throughouteukaryotic lineages. Stramenopile chitin synthases have beensparsely characterized, and the present study provides a morecomplete picture of the evolutionary history of this polymer.
FIG. 6. (A) Fluorescent signal of T. pseudonana cells bound with FITC-WGA (left column) and stained with PDMPO (right column) asmeasured by flow cytometry during transitions between silicic acid-replete and -limited conditions. The distribution of fluorescent signals fromstained cells is indicated by colored histograms and from untreated cells by a black line. Silicic acid depletion was observed on day 4, and silicicacid was replenished on day 9. (B and C) Diagram of T. pseudonana frustules (B) and differential interference contrast and fluorescencemicrographs of live cells during exponential growth (above) and stationary phase (below) (C). The scale bars in the light micrographs indicate 2�m. FITC-WGA is localized by the intense green fluorescence, while chlorophyll autofluorescence appears as a diffuse green. PDMPO is localizedby the blue fluorescence, while chlorophyll autofluorescence appears red.
1046 DURKIN ET AL. EUKARYOT. CELL
on August 19, 2018 by guest
http://ec.asm.org/
Dow
nloaded from
Chitin is often widely distributed within lineages due to itsfundamental structural function in the organisms; however, itcan also evolve divergent functions and structures. For exam-ple, in fungi and insects chitin is a primitive, indispensablecharacter that plays a fundamental structural role in formingthe cell wall and exoskeleton and thus is present throughoutthese two groups of organisms. However, within the fungi,chitin has different functions during cell wall formation, budscar formation, and cell division (52). In mollusks, chitin is alsowidely distributed and is used for diverse structural functions,such as the formation of the shells in bivalves (33), the struc-tural pens in squid (26), and the radula of snails (60). Identi-fication of chitin synthase genes in diatom genera (Phaeodac-tylum, Lithodesmium, Chaetoceros, and Skeletonema) that donot produce chitin fibers and the apparent localization of chitinto the cell wall suggests that a similar pattern of evolution hasoccurred within the diatoms. Our data suggest a broad distri-bution of chitin in diatoms due to a fundamental structuralfunction in the cell wall with cases of additional functionaldiversification, such as fiber production. Consequently, the dis-covery of chitin as the major carbohydrate component in silicafrustules by Tesson et al. (62) is possibly a true measurementrather than solely due to contamination from residual fibers.
The chitin synthase gene sequences from the representativepennate and multipolar centric species examined here arewidely diverged, as expected for diatoms from evolutionarilydistant lineages (3, 36). The predicted chitin synthases from P.tricornutum and T. pseudonana have different numbers andpositions of transmembrane domains and thus are expected to
assume different folded structures across the membrane. Inaddition, only the T. pseudonana chitin synthase genes encodea cytochrome b5 domain, which can anchor proteins into lipidbilayers (15) and may have served as a template for the evo-lution of a lipid binding site (39). This difference in the pres-ence of cytochrome b5 domains is also observed between thetwo divisions of fungal chitin synthases. The acquisition or lossof this N terminus from the ancestral chitin synthase is hypoth-esized to have driven the divergence of the two fungal chitinsynthase divisions (54). Fungi often contain chitin synthasesfrom both divisions. In contrast, the few stramenopile lineagesthat have been examined do not contain this level of diversitywithin a single organism. The other chitin synthases identifiedin stramenopiles are from oomycetes, whose sequences arephylogenetically similar to division 1 fungal chitin synthases(54). In diatoms, T. pseudonana chitin synthases appear to besimilar to division 2 fungal chitin synthases, while P. tricornu-tum chitin synthases are more similar to those of division 1. Itis unclear whether P. tricornutum lost the cytochrome b5 do-main or T. pseudonana gained it. Clearly, there are interestingparallels to fungal chitin synthases within the stramenopiles,and the mechanism of this evolutionary connection may beclarified as more stramenopile chitin synthases are examined.
Three clades of chitin synthase genes were detected in mul-tipolar diatoms; two were supported by high bootstrap values,and the distinctiveness of the third was supported by additionalgene expression data. This suggests different evolutionary his-tories and possibly different functions for chitin within thecells. Each clade contains sequences from multiple species, anda single species commonly has chitin synthase genes in multipleclades. The lone exception to this is T. weissfloggi, with multiplesequences all assigned only to clade A; this could be due toinsufficient sampling of clone libraries, and the large number of
FIG. 8. Light and fluorescence micrographs of silicic acid-starveddiatoms incubated with FITC-WGA. Arrows in the light micrographsindicate the location of FITC-WGA binding in the fluorescence mi-crographs. Scale bars indicate 2 �m for S. costatum and T. rotula and10 �m for T. punctigera.
FIG. 7. Light and fluorescent micrographs of exponentially growing(above) and silicic acid-starved (below) T. pseudonana cells incubatedwith FITC-WGA, FITC-chb protein (FITC-chitin binding), or cal-cofluor white. The bar in the light micrograph indicates 2 �m. Multiplecells are shown from each treatment to illustrate cells in differentstages of division. For the FITC-WGA and FITC-chb images, thebrighter green fluorescence at the girdle bands (indicated by arrows) isthe location of FITC-labeling, while the diffuse green is chlorophyll aautofluorescence. For the calcofluor white images, the calcofluor whiteappears blue, and chlorophyll a autofluorescence appears red.
VOL. 8, 2009 CHITIN IN DIATOMS 1047
on August 19, 2018 by guest
http://ec.asm.org/
Dow
nloaded from
copies may be related to the large genome size of this strain(64). Clades B and C contain gene fragments from all success-fully tested genera, including the chitin-producing Thalassio-sira species and the non-chitin-fiber-producing C. socialis, L.undulatum, and S. costatum. Representatives from these twogene clades were likely present in the common ancestor priorto the evolution of the chitin-fiber-producing species. Interest-ingly, the encoded proteins from these two clades in T. pseudo-nana appear to utilize different modes of intracellular trans-port: the clade C protein possesses a myosin motor headdomain N-terminal to the cytochrome b5 domain, whereas theclade B protein lacks this domain. Clade A sequences aredominated by members of the genus Thalassiosira. The singleexception is a gene fragment from Skeletonema costatum. Thisgenus is derived from Thalassiosira (28) and also has fultopor-tula, the specialized pores in the silica wall through whichchitin fibers emerge. However, rather than chitin fibers extend-ing from the fultoportula, the S. costatum silica structures in-stead remain fused between divided cells and create distinctivechains of cells. Now, only species with fultoportula containclade A chitin synthases. Therefore, clade A gene products arelikely associated with the fultoportula structures, including thesynthesis of the long chitin fibers. The clade A chitin synthasealso possesses a myosin motor head domain in a similar loca-tion as the protein from clade C, suggesting a similar evolu-tionary history for these two gene families.
Support for functional differences between chitin synthasesalso comes from the differential transcription of genes in T.pseudonana cells exposed to different nutrient conditions. Rel-ative transcript abundance of the clade B gene is particularlysensitive to short-term depletion of either silicic acid or iron.These conditions resulted in an increased transcript abundanceof this clade B gene but not of the clade A or C genes. Co-regulation of transcript abundance by silicic acid and iron de-pletion has been linked to cell wall processes (40). Transcriptabundance of only the clade B gene varied depending on theamount of time elapsed since synchronized cells resumed di-vision after short-term silicic acid starvation (22), suggestingthat the clade B gene may have a role during a particular partof the cell cycle and particularly under silicic acid and ironstresses. When cells were submitted to longer-term silicic acidstarvation, a response from both the clade B and clade C chitinsynthases was detected, but the clade C response was of a muchsmaller magnitude. This gene may also be related to cell wallprocesses, although it appears to have less sensitivity to chang-ing silicic acid conditions. Interestingly, similar differences intranscription level was found for the two genes encoding gir-dle-band associated chitin-binding proteins both in the presentstudy and others (7). None of the tested conditions affected thetranscript abundance of the clade A chitin synthase, suggestingthat it is not directly related to these cell wall processes.
The chitin-specific lectin WGA was used to correlate clade Band C transcript abundance with chitin synthesis. The lectinbound to the girdle band region of cells. WGA can bind tomultiple substrates, so its specificity for chitin on the cell wasconfirmed both by competitive binding experiments and bysimilar localization patterns using two additional chitin-bind-ing probes with different binding mechanisms and access to thebinding substrate. Interestingly, the lectin was not visiblybound to the chitin fibers extruded from the fultoportula. This
might be due to the pure beta configuration of the fiber poly-mers, whose highly crystalline parallel arrangement may not beaccessible to the lectin-binding sites. In contrast, both thechitin-binding probe and calcofluor white were visible on boththe girdle-bands and the fultoportula chitin fibers, indicating amore general binding mechanism that does not exclude specificforms of chitin. When cells experienced silicic acid depletionand longer-term starvation, transcript abundance increased forthe clade B and C chitin synthases and for a gene encoding achitin-binding protein, p150, previously localized to cell wallgirdle bands (6). The increase in transcripts corresponded tothe increase in WGA binding at the girdle bands, which sug-gests that the clade B and C proteins are related to synthesis ofchitin at the girdle bands in times of cell wall stress. The cladeB gene also appears to be transcribed during normal progres-sion through the cell cycle. The relative amount of transcriptabundance of the clade B gene depended on length of expo-sure to silicic acid starvation and/or amount of time sincerecovery from different degrees of silicic acid starvation, eventsknown to influence cell cycle progression (22). Further exper-iments are needed to determine the exact relation betweenchitin synthesis and cell cycle progression. However, both thechitin binding probe and calcofluor white localized to the gir-dle band region of exponentially growing cells preparing toseparate after completing division. This supports a connectionbetween chitin synthesis with the cell cycle and suggests thatchitin synthesis is enhanced in stressed cells unable to precip-itate silica and divide.
The identification of chitin synthase genes in a wide varietyof diatoms and the localization of chitin at the girdle bands ofT. pseudonana suggests the possibility that this use for chitinmay be more widespread in diatoms. Silicic acid-starved T.punctigera, T. rotula, and S. costatum were labeled with WGA,and similar localization patterns were identified. The associa-tion of chitin with the cell wall should be considered in otherdiatom species; however, more detailed analysis within eachlineage is needed.
Chitin appears to be intimately connected with silica pro-cesses because of its relationship to the cell wall, and thisconnection is illustrated in several ways. The distinctive fulto-portula that serve as pores through the silica cell wall appear tohave formed specifically to extrude chitin fibers (24), implyingthat this structure likely coevolved with the ability to producechitin fibers at this cellular location, perhaps with the evolutionof the clade A chitin synthase genes. Interestingly, chitin andsilica have also evolved to form structures of similar functions.Diatoms can be found as solitary cells or in chains dependingon the species. Either chitin fibers or silica spines can extendout from the cell to increase drag in the water and also formthe connections between chains of cells. The evolution of ei-ther chitin or silica connections between cells may result fromthe different costs associated with production of rigid silicaspines versus flexible chitin fibers; for example, rigid chainsexperience larger shear flow compared to flexible chains, whichhas the potential to increase their encounter rate with otherparticles and nutrients (29). The discovery of chitin at thegirdle band region reveals another connection between chitinand silica. Our results suggest that chitin is localized to thegirdle band region as a normal function of cell division and alsounder conditions when the cells are unable to precipitate ad-
1048 DURKIN ET AL. EUKARYOT. CELL
on August 19, 2018 by guest
http://ec.asm.org/
Dow
nloaded from
ditional silica. This stress-induced localization of chitin aroundthe girdle band region is associated with cells that are elon-gated and bent and that tend to aggregate and sink. The po-tential interactions between silica and chitin likely reflect thenecessary coordination of the organic and inorganic compo-nents of a functional cell wall.
Chitin synthase is proposed to have been present in a prim-itive eukaryote because of its widespread distribution through-out the eukaryotic tree of life (54). Thus, it seems probable thatthe ability to synthesize chitin was present in diatom ancestorsas they evolved the ability to generate cell walls of silica. How-ever, further work is needed to investigate whether chitin syn-thases can be identified in the more primitive centric lineage ora sister group to diatoms. Perhaps chitin has been maintainedas an essential component of the cell wall, and it is only duringtimes of cell wall stress or certain stages of the cell cycle that itcan be detected through lectin binding at specialized locations.The use of chitin as a matrix for the precipitation of inorganicstructures is a common strategy in eukaryotes (10, 11, 65), andthe potential for chitin-silica structures specifically has beendemonstrated in vitro (46). It is intriguing to speculate whetherdirect interactions between silica and chitin occur in diatoms;however, the current understanding of diatom silica precipita-tion is that it occurs in an acidic vesicle and does not rely onchitin (30–32). Interestingly, a recent microscopy-based studyhas shown that an uncharacterized organic matrix of fibersforms the core of the girdle bands onto which the silica struc-ture is formed (23). Our data indicate a role for chitin in thecell wall, and future microscopy-based studies are needed toclarify that role. Chitin may be a component of the cell wallthat is linked to silica but functionally separate. For example,chitin, rather than silica, may be used for more flexible com-ponents of the cell wall during the cell division cycle. Similarly,the apparently larger quantities of chitin detected at the girdlebands during silicic acid starvation may serve as a replacementcell wall material during conditions in which silica cannot bedeposited. Notably, the increased synthesis of chitin at girdlebands in stressful conditions is reminiscent of chitinous cystformation, a survival strategy used by other protists (42).
The relationship between silica and chitin has ecologicalimplications for both diatoms and the global ocean. Chitin isthe most abundant polymer in the ocean and serves as anenormous reservoir of organic carbon and nitrogen. Diatomshave traditionally been excluded from considerations of chitinproduction (27, 59). Our work suggests that diatoms are likelylarger contributors to this organic reservoir than previouslythought. Chitin is an attractive source of nutrients for microbes(37, 44), and the deposition of chitin at diatom girdle bands hasthe potential to facilitate diatom-microbe interactions (19, 25).The morphology of cell wall-stressed, chitin-producing cells isalso of ecological importance. These cells are elongated andbent with a tendency to aggregate, which causes them to sink.If these processes observed in a laboratory translate to post-bloom environmental conditions, it suggests that production ofchitin on the cell wall is enhanced when growth is no longerpossible, followed by sinking out of the surface layer. Sinking isproposed to be a survival strategy for cells in hostile surfaceenvironments and enables them to persist at depth until up-welling brings them back into favorable conditions (58). Thus,the deposition of chitin around the cell as it sinks to less hostile
conditions may be a component of a survival strategy to persistthrough fluctuating ocean conditions. In addition, if cells sinkbelow the mixing depth, sinking becomes a mechanism topump carbon and other nutrients to the deep ocean (57).
ACKNOWLEDGMENTS
This study was supported by a Gordon and Betty Moore FoundationMarine Microbiology Investigator Award to E.V.A.
We thank Rhonda Morales, Julie Koester, and Thomas Connolly forhelp with flow cytometry analysis; Ellen O. Lin and Audrey Djunaedifor help with sequencing; and Tiffany Truong for help with the RNAextraction and qRT-PCR. We also thank Julie Koester, MicaelaParker, and Nils Kroger for helpful comments and recommendations.
REFERENCES
1. Aluwihare, L. I., D. J. Repeta, S. Pantoja, and C. G. Johnson. 2005. Twochemically distinct pools of organic nitrogen accumulate in the ocean. Sci-ence 308:1007–1010.
2. Armbrust, E. V., J. A. Berges, C. Bowler, B. R. Green, D. Martinez, N. H.Putnam, S. G. Zhou, A. E. Allen, K. E. Apt, M. Bechner, M. A. Brzezinski,B. K. Chaal, A. Chiovitti, A. K. Davis, M. S. Demarest, J. C. Detter, T.Glavina, D. Goodstein, M. Z. Hadi, U. Hellsten, M. Hildebrand, B. D.Jenkins, J. Jurka, V. V. Kapitonov, N. Kroger, W. W. Y. Lau, T. W. Lane,F. W. Larimer, J. C. Lippmeier, S. Lucas, M. Medina, A. Montsant, M.Obornik, M. S. Parker, B. Palenik, G. J. Pazour, P. M. Richardson, T. A.Rynearson, M. A. Saito, D. C. Schwartz, K. Thamatrakoln, K. Valentin, A.Vardi, F. P. Wilkerson, and D. S. Rokhsar. 2004. The genome of the diatomThalassiosira pseudonana: ecology, evolution, and metabolism. Science 306:79–86.
3. Bowler, C., A. E. Allen, J. H. Badger, J. Grimwood, K. Jabbari, A. Kuo, U.Maheswari, C. Martens, F. Maumus, R. P. Otillar, E. Rayko, A. Salamov, K.Vandepoele, B. Beszteri, A. Gruber, M. Heijde, M. Katinka, T. Mock, K.Valentin, F. Verret, J. A. Berges, C. Brownlee, J.-P. Cadoret, A. Chiovitti,C. J. Choi, S. Coesel, A. De Martino, J. C. Detter, C. Durkin, A. Falciatore,J. Fournet, M. Haruta, M. J. J. Huysman, B. D. Jenkins, K. Jiroutova, R. E.Jorgensen, Y. Joubert, A. Kaplan, N. Kroger, P. G. Kroth, J. La Roche, E.Lindquist, M. Lommer, V. Martin-Jezequel, P. J. Lopez, S. Lucas, M. Man-gogna, K. McGinnis, L. K. Medlin, A. Montsant, M.-P. O.-L. Secq, C.Napoli, M. Obornik, M. S. Parker, J.-L. Petit, B. M. Porcel, N. Poulsen, M.Robison, L. Rychlewski, T. A. Rynearson, J. Schmutz, H. Shapiro, M. Siaut,M. Stanley, M. R. Sussman, A. R. Taylor, A. Vardi, P. von Dassow, W.Vyverman, A. Willis, L. S. Wyrwicz, D. S. Rokhsar, J. Weissenbach, E. V.Armbrust, B. R. Green, Y. Van de Peer, and I. V. Grigoriev. 2008. ThePhaeodactylum genome reveals the evolutionary history of diatom genomes.Nature 456:239–244.
4. Brott, L. L., R. R. Naik, D. J. Pikas, S. M. Kirkpatrick, D. W. Tomlin, P. W.Whitlock, S. J. Clarson, and M. O. Stone. 2001. Ultrafast holographic nano-patterning of biocatalytically formed silica. Nature 413:291–293.
5. Brzezinski, M. A., and D. M. Nelson. 1986. A solvent-extraction method forthe colorimetric determination of nanomolar concentrations of silicic acid inseawater. Mar. Chem. 19:139–151.
6. Davis, A. K., M. Hildebrand, and B. Palenik. 2005. A stress-induced proteinassociated with the girdle band region of the diatom Thalassiosira pseudo-nana (Bacillariophyta). J. Phycol. 41:577–589.
7. Davis, A. K., M. Hildebrand, and B. Palenik. 2006. Gene expression inducedby copper stress in the diatom Thalassiosira pseudonana. Eukaryot. Cell5:1157–1168.
8. Dugdale, R. C., F. P. Wilkerson, and H. J. Minas. 1995. The role of a silicatepump in driving new production. Deep-Sea Res. I Oceanogr. Res. Papers42:697–719.
9. Dweltz, N. E., J. R. Colvin, and A. G. McInnes. 1968. Studies on chitan(�-(1-4)-linked 2-acetamido-2-deoxy-D-glucan) fibers of the diatom Thalas-siosira fluviatilis Hustedt. 3. Structure of chitan from X-ray diffraction andelectron microscope observations. Can. J. Chem. 46:1513–1521.
10. Ehrlich, H., M. Krautter, T. Hanke, P. Simon, C. Knieb, S. Heinemann, andH. Worch. 2007. First evidence of the presence of chitin in skeletons ofmarine sponges. II. Glass sponges (Hexactinellida: Porifera). J. Exp. Zool. BMol. Dev. Evol. 308B:473–483.
11. Falini, G., S. Albeck, S. Weiner, and L. Addadi. 1996. Control of arago-nite or calcite polymorphism by mollusk shell macromolecules. Science271:67–69.
12. Felsenstein, J. 1989. PHYLIP: phylogeny inference package (version 3.2).Cladistics 5:164–166.
13. Field, C. B., M. J. Behrenfeld, J. T. Randerson, and P. Falkowski. 1998.Primary production of the biosphere: integrating terrestrial and oceaniccomponents. Science 281:237–240.
14. Frigeri, L. G., T. R. Radabaugh, P. A. Haynes, and M. Hildebrand. 2006.Identification of proteins from a cell wall fraction of the diatom Thalassiosira
VOL. 8, 2009 CHITIN IN DIATOMS 1049
on August 19, 2018 by guest
http://ec.asm.org/
Dow
nloaded from

pseudonana: insights into silica structure formation. Mol. Cell. Proteomics5:182–193.
15. George, S. K., L. Najera, R. P. Sandoval, C. Countryman, R. W. Davis, andG. M. Ihler. 1989. The hydrophobic domain of cytochrome B5 is capable ofanchoring �-galactosidase in Escherichia coli membranes. J. Bacteriol. 171:4569–4576.
16. Gooday, G. W. 1990. The ecology of chitin degradation, p. 387–429. In K. C.Marshall (ed.), Advances in microbial ecology, vol. 11. Plenum Press, Inc.,New York, NY.
17. Guillard, R. R., and J. H. Ryther. 1962. Studies of marine planktonic dia-toms. 1. Cyclotella nana Hustedt, and Detonula confervacea (Cleve) Gran.Can. J. Microbiol. 8:229.
18. Guillard, R. R. L. 1975. Culture of phytoplankton for feeding marine inver-tebrates, p. 26–60. In W. L. Smith and M. H. Chanley (ed.), Culture ofmarine invertebrate animals. Plenum Press, Inc., New York, NY.
19. Haines, K. C., and R. R. L. Guillard. 1974. Growth of vitamin B12-requiringmarine diatoms in mixed laboratory cultures with vitamin B12-producingmarine bacteria. J. Phycol. 10:245–252.
20. Herth, W. 1979. Site of beta-chitin fibril formation in centric diatoms. 2.Chitin-forming cytoplasmic structures. J. Ultrastruct. Res. 68:16–27.
21. Herth, W., and E. Schnepf. 1982. Chitin-fibril formation in algae, p. 184–206.In R. M. Brown (ed.), Cellulose and other natural polymer systems. PlenumPress, Inc., New York, NY.
22. Hildebrand, M., L. G. Frigeri, and A. K. Davis. 2007. Synchronized growthof Thalassiosira pseudonana (Bacillariophyceae) provides novel insights intocell wall synthesis processes in relation to the cell cycle. J. Phycol. 43:730–740.
23. Hildebrand, M., S. Kim, D. Shi, K. Scott, and S. Subramaniam. 2009. 3Dimaging of diatoms with ion-abrasion scanning electron microscopy. J.Struct. Biol. 166:316–328.
24. Hildebrand, M., E. York, J. I. Kelz, A. K. Davis, L. G. Frigeri, D. P. Allison,and M. J. Doktycz. 2006. Nanoscale control of silica morphology and three-dimensional structure during diatom cell wall formation. J. Materials Res.21:2689–2698.
25. Hunken, M., J. Harder, and G. O. Kirst. 2008. Epiphytic bacteria on theAntarctic ice diatom Amphiprora kufferathii Manguin cleave hydrogen per-oxide produced during algal photosynthesis. Plant Biol. 10:519–526.
26. Hunt, S., and A. E. Sherief. 1990. A periodic structure in the “pen” chitin ofthe squid Loligo vulgaris. Tissue Cell 22:191–197.
27. Jeuniaux, C., and M. F. Vossfoucart. 1991. Chitin biomass and production inthe marine environment. Biochem. Syst. Ecol. 19:347–356.
28. Kaczmarska, I., M. Beaton, A. C. Benoit, and L. K. Medlin. 2005. Molecularphylogeny of selected members of the order Thalassiosirales (Bacillariophyta)and evolution of the fultoportula. J. Phycol. 42:121–138.
29. Karp-Boss, L., and P. A. Jumars. 1998. Motion of diatom chains in steadyshear flow. Limnol. Oceanogr. 43:1767–1773.
30. Kroger, N., R. Deutzmann, C. Bergsdorf, and M. Sumper. 2000. Species-specific polyamines from diatoms control silica morphology. Proc. Natl.Acad. Sci. USA 97:14133–14138.
31. Kroger, N., R. Deutzmann, and M. Sumper. 1999. Polycationic peptides fromdiatom biosilica that direct silica nanosphere formation. Science 286:1129–1132.
32. Kroger, N., S. Lorenz, E. Brunner, and M. Sumper. 2002. Self-assembly ofhighly phosphorylated silaffins and their function in biosilica morphogenesis.Science 298:584–586.
33. Levi-Kalisman, Y., G. Falini, L. Addadi, and S. Weiner. 2001. Structure ofthe nacreous organic matrix of a bivalve mollusk shell examined in thehydrated state using cryo-TEM. J. Struct. Biol. 135:8–17.
34. McLachlan, J., and J. S. Craigie. 1966. Chitan fibres in Cyclotella cryptica andgrowth of C. cryptica and Thalassiosira fluviatilis, p. 511–517. In H. Barnes(ed.), Some contemporary studies in marine science. George Allen andUnwin Ltd., London, England.
35. McLachlan, J., A. G. McInnes, and M. Falk. 1965. Studies on chitan (chitin-poly-n-acetylglucosamine) fibers of diatom Thalassiosira fluviatilis Hustedt.1. Production and isolation of chitan fibers. Can. J. Bot. 43:707.
36. Medlin, L. K., and I. Kaczmarska. 2004. Evolution of the diatoms. V.Morphological and cytological support for the major clades and a taxonomicrevision. Phycologia 43:245–270.
37. Meibom, K. L., X. B. B. Li, A. T. Nielsen, C. Y. Wu, S. Roseman, and G. K.Schoolnik. 2004. The Vibrio cholerae chitin utilization program. Proc. Natl.Acad. Sci. USA 101:2524–2529.
38. Merzendorfer, H. 2006. Insect chitin synthases: a review. J. Comp. Physiol. BBiochem. Syst. Environ. Physiol. 176:1–15.
39. Mifsud, W., and A. Bateman. 2002. Membrane-bound progesterone recep-tors contain a cytochrome b5-like ligand-binding domain. Genome Biol.3:RESEARCH0068.
40. Mock, T., M. P. Samanta, V. Iverson, C. Berthiaume, M. Robison, K. Hol-termann, C. Durkin, S. S. BonDurant, K. Richmond, M. Rodesch, T. Kallas,E. L. Huttlin, F. Cerrina, M. R. Sussmann, and E. V. Armbrust. 2008.
Whole-genome expression profiling of the marine diatom Thalassiosirapseudonana identifies genes involved in silicon bioprocesses. Proc. Natl.Acad. Sci. USA 105:1579–1584.
41. Montgomery, M. T., N. A. Welschmeyer, and D. L. Kirchman. 1990. A simpleassay for chitin: application to sediment trap samples from the sub-ArcticPacific. Mar. Ecol. Prog. Ser. 64:301–308.
42. Mulisch, M. 1993. Chitin in protistan organisms: distribution, synthesis, anddeposition. Eur. J. Protistol. 29:1–18.
43. Nagahashi, S., M. Sudoh, N. Ono, R. Sawada, E. Yamaguchi, Y. Uchida, T.Mio, M. Takagi, M. Arisawa, and H. Yamadaokabe. 1995. Characterizationof chitin synthase 2 of Saccharomyces cerevisiae: implication of two highlyconserved domains as possible catalytic sites. J. Biol. Chem. 270:13961–13967.
44. Nalin, D. R., V. Daya, A. Reid, M. M. Levine, and L. Cisneros. 1979.Adsorption and growth of Vibrio cholerae on chitin. Infect. Immun. 25:768–770.
45. Nelson, D. M., P. Treguer, M. A. Brzezinski, A. Leynaert, and B. Queguiner.1995. Production and dissolution of biogenic silica in the ocean: revisedglobal estimates, comparison with regional data and relationship to biogenicsedimentation. Global Biogeochem. Cycles 9:359–372.
46. Ogasawara, W., W. Shenton, S. A. Davis, and S. Mann. 2000. Templatemineralization of ordered macroporous chitin-silica composites using acuttlebone-derived organic matrix. Chem. Materials 12:2835.
47. Parkinson, J., and R. Gordon. 1999. Beyond micromachining: the potentialof diatoms. Trends Biotechnol. 17:190–196.
48. Peters, W., and I. Latka. 1997. Wheat germ agglutinin-gold labeling, p.33–40. In R. A. A. Muzzarelli and M. G. Peters (ed.), Chitin handbook.European Chitin Society, Grottammare, Italy.
49. Pfaffl, M. W. 2001. A new mathematical model for relative quantification inreal-time RT-PCR. Nucleic Acids Res 29:e45.
50. Price, N. M., G. I. Harrison, J. G. Herring, R. J. Hudson, P. M. V. Nirel, B.Palenik, and A. F. M. Moorman. 1988/89. Preparation and chemistry of theartificial algal culture medium Aquil. Biol. Oceanogr. 6:443–461.
51. Ramakers, C., J. M. Ruijter, R. H. L. Deprez, and A. F. M. Moorman. 2003.Assumption-free analysis of quantitative real-time polymerase chain reaction(PCR) data. Neurosci. Lett. 339:62–66.
52. Roncero, C. 2002. The genetic complexity of chitin synthesis in fungi. Curr.Genet. 41:367–378.
52a.Rose, T. M., E. R. Schultz, J. G. Henikoff, S. Pietrokovski, C. M. McCallum,and S. Henikoff. 1998. Consensus-degenerate hybrid oligonucleotide primersfor amplification of distantly related sequences. Nucleic Acids Res. 26:1628–1635.
53. Round, F. E., R. M. Crawford, and D. G. Mann. 1990. The diatoms: biologyand morphology of the genera. Cambridge University Press, Cambridge,England.
54. Ruiz-Herrera, J., J. M. Gonzalez-Prieto, and R. Ruiz-Medrano. 2002. Evo-lution and phylogenetic relationships of chitin synthases from yeasts andfungi. FEMS Yeast Res. 1:247–256.
55. Saxena, I. M., R. M. Brown, M. Fevre, R. A. Geremia, and B. Henrissat.1995. Multidomain architecture of �-glycosyltransferases: implications formechanism. J. Bacteriol. 177:1419–1424.
56. Shimizu, K., Y. Del Amo, M. A. Brzezinski, G. D. Stucky, and D. E. Morse.2001. A novel fluorescent silica tracer for biological silicification studies.Chem. Biol. 8:1051–1060.
57. Smetacek, V. 1999. Diatoms and the ocean carbon cycle. Protist 150:25–32.58. Smetacek, V. S. 1985. Role of sinking in diatom life-history cycles: ecological,
evolutionary, and geological significance. Mar. Biol. 84:239–251.59. Smucker, R. A. 1991. Chitin primary production. Biochem. Syst. Ecol. 19:
357–369.60. Sollas, I. B. J. 1907. Memoirs: the molluscan radula: its chemical composi-
tion, and some points in its development. Q. J. Microsc. Sci. s2-51:115–136.61. Sugiyama, J., C. Boisset, M. Hashimoto, and T. Watanabe. 1999. Molecular
directionality of beta-chitin biosynthesis. J. Mol. Biol. 286:247–255.62. Tesson, B., S. Masse, G. Laurent, J. Maquet, J. Livage, V. Martin-Jezequel,
and T. Coradin. 2008. Contribution of multi-nuclear solid state NMR to thecharacterization of the Thalassiosira pseudonana diatom cell wall. Anal.Bioanal. Chem. 390:1889–1898.
63. Thompson, J. D., D. G. Higgins, and T. J. Gibson. 1994. CLUSTAL W:improving the sensitivity of progressive multiple sequence alignment throughsequence weighting, position-specific gap penalties and weight matrix choice.Nucleic Acids Res. 22:4673–4680.
64. von Dassow, P., T. W. Petersen, V. A. Chepurnov, and E. V. Armbrust. 2008.Inter- and intraspecific relationships between nuclear DNA content and cellsize in selected members of the centric diatom genus Thalassiosira (Bacilla-riophyceae). J. Phycol. 44:335–349.
65. Wainwright, S. A. 1963. Skeletal organization in coral, Pocillopora damicor-nis. Q. J. Microsc. Sci. 104:169–171.
66. Zar, J. H. 1996. Biostatistical analysis. Prentice Hall, Upper Saddle River, NJ.
1050 DURKIN ET AL. EUKARYOT. CELL
on August 19, 2018 by guest
http://ec.asm.org/
Dow
nloaded from


![BnlDEGllADABLE lPOLYHEltS AND SUSTAINAlLE POLYMlltS … · some fungai cell walls [3]. Structurally, chitin is a linear homo-polysaccharide Structurally, chitin is a linear homo-polysaccharide](https://img.pdfslide.us/doc/110x75/5c8f8bc509d3f2a2628c6e49/bnldeglladable-lpolyhelts-and-sustainalle-polymllts-some-fungai-cell-walls-3.jpg)