Embed Size (px)
Citation preview

Chirundu Water Supply and Sanitation: Feasibility Report
CRIDF Project name: Chirundu Water Supply and Sanitation
CRIDF Project #: FP23-001
CRIDF Deliverable #: D02/OVI10
Version: Final
Date: 9 June 2016

Chirundu WSS Feasibility Report Page 2 of 209
Quality Assurance Checklist
In preparing this document CRIDF can confirm that it has followed CRIDF’s internal general procedures,
including appropriate CRIDF generic scope of work and that it has undergone appropriate quality assurance
(QA) and quality control (QC) procedures as detailed in CRIDF’s QA manual. Furthermore, CRIDF can
confirm the applicable specific internal process and procedures have been followed including:
CRIDF’s Cost Benefit Assessments (CBAs) guideline have been applied as appropriate;
CRIDF’s Gender Equality and Social Inclusion (GESI) guidelines have been applied as appropriate;
CRIDF’s Climate vulnerability mapping methodology has been applied as appropriate;
CRIDF’s Climate Change Risk Assessment (CCRA) protocol have been applied as appropriate;
CRIDF’s Procurement guidelines have been followed as appropriate;
CRIDF’s Screens as appropriate.
Lead
Author(s)
Stuart Seath CRIDF
QA’d:
Stuart Seath CRIDF
QC’d:
Tinashe
Mutoredzanwa
CRIDF
Approved:
Charles Reeve
Date:
9/06.2016
Date:
9/6/2016
Date:
9/6/2016
Date:
12/06/2016
Disclaimer
The British Government’s Department for International Development (DFID)
financed this work as part of the United Kingdom’s aid programme. However, the
views and recommendations contained in this report are those of the consultant,
and DFID is not responsible for, or bound by the recommendations made.
Chirundu WSS Feasibility Report Page 3 of 209
Contents
List of Acronyms .......................................................................................................................................... 10
Executive Summary ..................................................................................................................................... 13
Introduction ................................................................................................................................................... 18
Project Location ........................................................................................................................................ 19
Social Assessment ....................................................................................................................................... 20
Introduction ........................................................................................................................................ 20
Project Area Description.............................................................................................................................. 20
Project Area Settlement Pattern .................................................................................................................. 21
Land Tenure System and Ownership .......................................................................................................... 21
Employment and Income Generating Opportunities ................................................................................... 22
Infrastructure and Social Services .............................................................................................................. 22
Existing Water Supply and Sanitation ......................................................................................................... 23
Perceptions of Existing Water Supply Facilities and Services .................................................................... 26
Perceptions of Existing Sanitation Facilities and Services .......................................................................... 27
Public Perceptions of the Proposed Interventions ...................................................................................... 28
Socio-Economic Impacts of the Proposed Project ...................................................................................... 30
Gender Equality and Social Inclusion (GESI) ............................................................................................. 31
Community Engagement for the Proposed Project ..................................................................................... 39
Population ........................................................................................................................................ 40
Technical Assessment ................................................................................................................................. 42
Introduction ........................................................................................................................................ 42
Existing Water Supply and Sanitation Infrastructure ................................................................................... 42
Water Demand ........................................................................................................................................ 44
Water Resources Assessment .................................................................................................................... 46
Water Supply System design ...................................................................................................................... 55
Sewerage and Sanitation Design ................................................................................................................ 64
Climate Change Risk Assessment (CCRA) ................................................................................................ 67
Climate Vulnerability Mapping and Tool Indicators ..................................................................................... 67

Chirundu WSS Feasibility Report Page 4 of 209
Implementation Costs .................................................................................................................................. 73
Conclusions and recommendations ............................................................................................................ 78
Environmental Assessment ........................................................................................................................ 79
The Surrounding Community ...................................................................................................................... 79
The Water Supply Infrastructure ................................................................................................................. 79
The Sanitation Infrastructure ....................................................................................................................... 81
The Biological and Geophysical Environment ............................................................................................ 81
The Applicable Policy Framework and Legislation ..................................................................................... 89
The Institutional and Regulatory Framework .............................................................................................. 91
The Regulatory and Legislative Framework................................................................................................ 93
Identification of Potential Environmental and Social Impacts ................................................................... 100
Mitigation for Negative Impacts ................................................................................................................. 103
Impact Assessment Matrix ........................................................................................................................ 105
Challenges and Anticipated Impacts ......................................................................................................... 118
Recommendations .................................................................................................................................... 119
Financial and Economic Assessment ...................................................................................................... 122
Introduction ...................................................................................................................................... 122
Methodology ...................................................................................................................................... 122
Key CBA Assumptions .............................................................................................................................. 123
Options Appraisal ...................................................................................................................................... 126
Financial Appraisal .................................................................................................................................... 128
Economic Appraisal ................................................................................................................................... 136
Sustainability Analysis ............................................................................................................................... 148
Conclusions and Recommendations ......................................................................................................... 149
Institutional Assessment ........................................................................................................................... 150
Introduction ...................................................................................................................................... 150
Legal and Policy Context........................................................................................................................... 150
Institutional Arrangements......................................................................................................................... 153
Overview of the Lusaka Water and Sewerage Company ......................................................................... 158
Risk Assessment ........................................................................................................................................ 185

Chirundu WSS Feasibility Report Page 5 of 209
Conclusions and Recommendations ....................................................................................................... 188
Annex A - GESI Tables ............................................................................................................................... 191
Annex B – Existing Infrastructure ............................................................................................................ 192
Annex C – CCRA Tables and Explanation Notes .................................................................................... 193
Annex D – CBA Assumptions ................................................................................................................... 194
Annex E – Key Informant Interview (Meeting Notes/Record) ................................................................. 195
Annex F – Institutional Tables................................................................................................................... 208

Chirundu WSS Feasibility Report Page 6 of 209
List of Figures
Figure 1 Location of Chirundu District and Town .......................................................................................... 19
Figure 2 Wash basins in the Passengers Terminal Ablution Block ............................................................... 24
Figure 3 Chirundu District Council Ablution Block ......................................................................................... 24
Figure 4 Kiosk in a High Density Area ........................................................................................................... 25
Figure 5 Existing Water Infrastructure ........................................................................................................... 43
Figure 6 Metered connections ....................................................................................................................... 44
Figure 7 Onsite Sanitation ............................................................................................................................. 44
Figure 8 The Lusitu River as seen from the Lusitu Bridge in March 2016 .................................................... 47
Figure 9 Chirundu DNI zones ........................................................................................................................ 59
Figure 10 Proposed Ring Main Layout .......................................................................................................... 60
Figure 11 Improved VIP Latrines ................................................................................................................... 65
Figure 12 Proposed layout of ablution block ................................................................................................. 65
Figure 13 Proposed Sewer and Sanitation Interventions .............................................................................. 66
Figure 14 Chirundu Town Settlements and Main Roads .............................................................................. 79
Figure 15 The location of the Floating pontoon Abstraction point ................................................................. 80
Figure 16 Annual precipitation for Chirundu District from 1994- 2010 .......................................................... 82
Figure 17 The view of the Zambezi River as seen in Chirundu .................................................................... 83
Figure 18 Hydrogeological map of Chirundu ................................................................................................. 83
Figure 19 Chirundu Vegetation Cover ........................................................................................................... 84
Figure 20 The vegetation along the Zambezi River and near the abstraction .............................................. 85
Figure 21 The Mungagane trees leaves and bark......................................................................................... 86
Figure 22 Paradise Flycatcher and bark Red-eyed dove .............................................................................. 87
Figure 23 Tawny-flanked Prinia and Pied Crow ............................................................................................ 87
Figure 24 Little Bee-eater and Crowned Hornbill .......................................................................................... 88
Figure 25 Location of Forests and National Game Parks ............................................................................. 88
Figure 26 Encroachment of water utility lines by housing structures .......................................................... 119
Figure 27 Unplanned road network encroaching on the water supply network .......................................... 119
Figure 28 International Traffic at Busy Chirundu Border ............................................................................. 120

Chirundu WSS Feasibility Report Page 7 of 209
Figure 29: Location of Chirundu ................................................................................................................... 144
Figure 30 Institutional Landscape for Water Services in Zambia ................................................................ 154
Figure 31 Area covered by Water and Sanitation Utilities in Zambia .......................................................... 155
Figure 32 Dissolution of LWSC Board ......................................................................................................... 161
Figure 33 Approved Tariff Schedule for LWSC for 2016 ............................................................................. 165
Figure 34 Operation and Maintenance Costs .............................................................................................. 166
Figure 35 Overview of Decentralised Operational Delivery Structure ......................................................... 169
Figure 36 LWSC Organogram ..................................................................................................................... 175
Figure 37 Kafue Branch Organogram ......................................................................................................... 177
List of Tables
Table 1 Population Estimates for Chirundu ................................................................................................... 41
Table 2 Water Demand Estimate for Chirundu ............................................................................................. 45
Table 3 Water quality in the Kariba Dam at LHA ........................................................................................... 50
Table 4 Mean annual flows for the year 2000 and Scenarios in 2050 .......................................................... 53
Table 5 Proposed interventions ..................................................................................................................... 55
Table 6 Water design criteria......................................................................................................................... 56
Table 7 DNI Zone Description and Components........................................................................................... 59
Table 8 Chirundu Peak Water Demand by DNI zone for year 2036 ............................................................. 60
Table 9 Summary of Water Supply Technical Considerations ...................................................................... 62
Table 10 Chirundu WSS - Climate Vulnerability Indicators (from website) ................................................... 68
Table 11 Chirundu WSS - Climate Vulnerability Indicators (From CRIDF Assessment Report) .................. 68
Table 12 Chirundu WSS - Climate projections for project area .................................................................... 69
Table 13 Chirundu WSS - Climate Risk Matrix ............................................................................................. 71
Table 14 Estimated Project Implementation Cost ......................................................................................... 73
Table 15 Planned Implementation Phases .................................................................................................... 75
Table 16 Total Preliminary Implementation Costs - All Phases of Works ..................................................... 76
Table 17 Estimated Costs Short Term (Phase 1) – Water Supply ................................................................ 76
Table 18 Estimated Costs Short Term (Phase 1) – Sanitation ..................................................................... 76

Chirundu WSS Feasibility Report Page 8 of 209
Table 19 Estimated Costs Medium Term (Phase 2) – Water Supply............................................................ 77
Table 20 Estimated Costs Medium Term (Phase 2) – Sanitation ................................................................. 77
Table 21 Estimated Costs Long Term (Phase 3) – Water Supply ................................................................ 78
Table 22 Common Bird species .................................................................................................................... 87
Table 23 Commercial Utilities in Zambia, 2015 ............................................................................................. 92
Table 24 Mitigation of Negative Impacts ..................................................................................................... 103
Table 25 Qualitative Likelihood Rating ........................................................................................................ 108
Table 26 Environmental Risk Rating ........................................................................................................... 108
Table 27 Analysis of Residual Risk – Construction Phase ......................................................................... 110
Table 28 Analysis of Residual Risk – Operational Phase ........................................................................... 115
Table 29 Evaluation matrix for potential environmental impacts ................................................................. 117
Table 30 Financial assumptions .................................................................................................................. 123
Table 31 Revenue generating assumptions ................................................................................................ 123
Table 32 Project phasing ............................................................................................................................. 125
Table 33 Economic assumptions................................................................................................................. 126
Table 34 Population and household projections for Chirundu Border Town ............................................... 127
Table 35 Water supply capital investment requirements (GBP) ................................................................. 129
Table 36 Capital and O&M cost phasing (GBP) .......................................................................................... 130
Table 37 Daily water consumption per household classification type ......................................................... 131
Table 38 Projected incremental revenue from water tariffs (GBP) .............................................................. 133
Table 39 Financial Appraisal Results .......................................................................................................... 134
Table 40 Project funding scenarios ............................................................................................................. 135
Table 41 Sensitivity Analysis – Cost Parameters (GBP) ............................................................................. 136
Table 42 Economic O&M costs ................................................................................................................... 138
Table 43 Economic costs ............................................................................................................................ 138
Table 44 Health savings (GBP) ................................................................................................................... 140
Table 45 Time Savings (GBP) ..................................................................................................................... 143
Table 46 Economic Appraisal Results ......................................................................................................... 145
Table 47 Economic Sensitivity Analysis – Time and Health (GBP, 10% SDR) .......................................... 146
Table 48 Performance against the Strategic Plan ....................................................................................... 163

Chirundu WSS Feasibility Report Page 9 of 209
Table 49 Human Resource Allocations per District ..................................................................................... 170
Table 50 Kafue Branch Staff Complement .................................................................................................. 176
Table 51 Identified project risks and mitigation measures .......................................................................... 185
Table 52 Planned Implementation Phases .................................................................................................. 188
Table 53 Total Preliminary Implementation Costs - All Phases of Works ................................................... 189

Chirundu WSS Feasibility Report Page 10 of 209
List of Acronyms
Acronym Long-Form
AfDB African Development Bank
CDC Chirundu District Council
COMESA Common Market for East and Southern Africa
CRIDF Climate Resilient Infrastructure Development Facility
CSO Central Statistics Office
CU Commercial Utilities
DOF Department of Fisheries
DPPH Department of Physical Planning and Housing
ECZ Environmental Council of Zambia (now ZEMA)
EIA Environmental Impact Assessment
EMP Environmental Management Plan
EPB Environmental Project Brief
ERB Energy Regulation Board
ESIS Environmental and Social Impact Statement
ET Evapotranspiration
FDC Flow Duration Curve
FGD Focused Group Discussion
IDP Integrated Development Plan
GESI Gender, Equality and Social Inclusion
GHS Green House Gases
GI Galvanised Iron

Chirundu WSS Feasibility Report Page 11 of 209
Acronym Long-Form
GIZ Deutsche Gesellschaft für Internationale Zusammenarbeit GmbH
GMA Game Management Area
GWP Global Warming Potential
GW Global Warming
GRZ Government of the Republic of Zambia
HDPE High Density Polypropylene
IAP Interested and Affected Party
KII Key Informant Interview
KfW Kreditanstalt für Wiederaufbau
km Kilometre
LHA Lake Harvest Aquaculture
LWSC Lusaka Water and Sewerage Company
MAL Ministry of Agriculture and Livestock
MLGH Ministry of Local Government and Housing
MMMD Ministry of Mines and Mineral Development
MWS Ministry of Works and Supply
NEP National Energy Policy
NRW Non-Revenue Water
NWASCO National Water Supply and Sanitation Council
O&M Operation and Maintenance
OBC Outline Business Case
REC Regional Economic Community

Chirundu WSS Feasibility Report Page 12 of 209
Acronym Long-Form
SACU Southern African Customs Union
SADC Southern African Development Community
SWSC Southern Water and Sewage Company
USD United States Dollar
VIP Ventilated Improved Pit latrines
WARMA Water Resources Management Authority
WASH Water, Sanitation and Hygiene
WHO World Health Organisation
WSS Water Supply and Sanitation
WTP Willingness To Pay
WWG Water Watch Groups
ZMW Zambian Kwacha
ZRB Zambezi River Basin

Chirundu WSS Feasibility Report Page 13 of 209
Executive Summary
Access to reliable and safe water supply and sanitation facilities at border towns in the SADC region has
emerged as a major challenge that requires urgent action to ensure continued activities at these strategic
centres. The Climate Resilient Infrastructure Development Facility (CRIDF), DFID’s innovative water
infrastructure programme for southern Africa, has to date proceeded with studies in 5 of the 12 Zambian border
towns (Kazungula, Mwami (Chipata), Chanida, Siavonga and Chirundu).
The CRIDF interventions provide the entry point and platform for CRIDF to engage with, support and influence
key SADC interventions, river basin organisations and national stakeholders. It is envisaged that through
CRIDF, the inhabitants of the SADC region will benefit from climate-resilient water infrastructure thereby
enhancing sustainability and cooperation amongst the stakeholder.
This report is a summary of the feasibility study undertaken to provide improvements to the existing water
supply and sanitation infrastructure at the Chirundu Border Post on the Zambian side of the border. The
Chirundu border serves as a crossing point between Zambia and Zimbabwe, which has experienced high
growth, especially after the construction of the second bridge across Zambezi River, completed in 2002.
Chirundu is an important international border for the north south corridor linking a large number of countries in
eastern and southern Africa. The transport corridor linking South Africa to its northern countries is the busiest
regional transit transport link in eastern and southern Africa, carrying 5.8 million tons of cross-border traffic. The
corridor extends over the territories of three regional and economic groups, COMESA, SADC and SACU.
The high volume of traffic has brought commercial opportunities to Chirundu, while at the same time placing the
existing services under pressure. The pressure on services has increased the risk of waterborne diseases in
Chirundu and the possibility of cross border infection. This is exacerbated by the high HIV infection rate that is
experience in Chirundu, partially due to the high transient cross border population that spends time in Chirundu
while completing the cross border formalities.
Chirundu residents clearly expressed their dissatisfaction with the current water supply and sanitation services
as provided by the LWSC. Residents re-emphasised the need for adequate water supply and sanitation as they
felt the high temperatures and low rainfall in the area has already compromised their quality of life.
No clear town planning has been completed for Chirundu, which is complicated by the ongoing negotiations to
obtain a larger town boundary by obtaining a portion of surround customary land. It is critical that the planning
of the town be undertaken, with the input from LWSC with regard to most efficient method of servicing the entire
town.
The Feasibility Study has identified the capacity of the bulk infrastructure, including Water Treatment Plant, bulk
distribution and storage, as the main water supply constraints that need to be addressed. A phased approach is
recommended to optimise the available capital and match the population growth. The proposed implementation
phases is shown in the following table, however the phases would need to be prioritised with available funding.
Furthermore the Medium and Long Term planning horizon needs to be implemented based on actual population
growth.

Chirundu WSS Feasibility Report Page 14 of 209
Planned Implementation Phases
Phases Planning
Horizon (Year) Main areas of intervention Implementation plan
Phase 1 Short Term
(2021)
Upgrade intake pontoon
Upgrade of treatment plant to 2ML/d
Upgrade pumping system, pumps and
pumping mains
Upgrade bulk main pipelines
Introduce bulk meters
Increase storage to 2ML/day
Construct new and refurbish existing
ablution facilities
Design and construction
before 2021.
Phase 2 Medium Term
(2026)
Upgrade treatment plant to 6Ml/d (double
from 2ML/day)
Increase storage to 6ML/day (12hr)
Upgrade secondary distribution network
within DNI zones
Refurbish sewer system and connect high
water consumption users
Design and construction
before 2026 – to be
confirmed based on actual
population growth.
Phase 3 Long Term
(2036)
Expand secondary distribution network
with increase in population
Design and construction
before 2036 – to be
confirmed based on actual
population growth.
The estimated capital investment is shown in the table below. The estimated intervention for Chirundu Water
Supply and Sanitation is GP£5,514,100 (excluding any VAT or taxes).
Total Preliminary Implementation Costs - All Phases of Works
Total Capital investment 2016-2036
Item No. Item Description Amount
US$
Amount
GB£
1 Short Term (Phase 1) – Water Supply 2,335,000 1,604,500
2 Short Term (Phase 1) – Sanitation 75,000 51,500
3 Medium Term (Phase 2) – Water Supply 2,388,600 1,641,300
4 Medium Term (Phase 2) - Sewer and Sanitation 3,029,400 2,081,600
5 Long Term (Phase 3) – Water Supply
196,700 135,200
Total
8,024,700 5,514,100

Chirundu WSS Feasibility Report Page 15 of 209
The project brings a number of high resilience benefits to the project recipients especially in relation to
governance and livelihoods, gender and health. The review also identified a number of risks in relation to the
associated infrastructure and risk-mitigating actions which if implemented will improve the resilience of the
project itself to climate change risks.
The project is not expected to have significant environmental impact, as it is mainly within the urban area, which
is already severely degraded. The intake may require special attention, as it is based in a lush riverine
environment, close to a forest area. A detailed environmental assessment will be required, in accordance with
the Environmental Management Act. Furthermore a number of permits will possibly be required before any
construction project can be contemplated.
The project could actually be used to enhance certain environmental challenges, like improved sanitation in
Chirundu, i.e. making Chirundu an open defecation free zone.
There is an overwhelming economic justification for the project, as indicated by the quantitative results of the
economic appraisal in conjunction with the qualitative benefits arguments. In the short term the provision of
WASH infrastructure is fundamental to basic human needs; in the medium and longer term, WASH
infrastructure will be catalytic to economic development at a local (community) level, as well as for Zambia and
the SADC region. The project is expected to result in significant improvements to the health of Chirundu
residents, as well as border patrons, along with time savings and ecological improvements, all of which indicate
that the project should be implemented.
The project alone however is not commercially viable – the revenue generated by the project is not sufficient to
cover the investment cost over the project life. This is neither surprising nor uncommon for water and sanitation
projects of this scale, given that such projects are fundamentally providing a public good. Traditional financing is
therefore not appropriate to this project; long term developmental/concessional loans, grant or subsidised
funding are required to cover the capital investment.
The financial appraisal indicates that the project is operationally sustainable. Annual revenues generated
exceed the annual operation and maintenance requirements of the infrastructure over the project life. Domestic
demand, O&M costs, and water supply coverage are however critical to the operational sustainability of the
infrastructure. As such, should these parameters vary significantly over time; LWSC must adjust the phased
investments as appropriate.
The following table summarises the findings from the Financial and Economic Assessment.
CBA Results
Capital investment Budget £5,514,146
Beneficiaries
Direct beneficiary households 3,774
Indirect beneficiary households 255,500 truck drivers per year, 204,400 other border patrons per

Chirundu WSS Feasibility Report Page 16 of 209
CBA Results
year.
The indirect beneficiary population includes the significant
transitory population passing through Chirundu. As the project
infrastructure includes ablution facilities for this population, they
are included as indirect beneficiary households.
Assumed number of people per household 5.1
Analysis timeframe 20 years
Financial appraisal performance indicators (5.3% Discount Rate)
Financial Net Present Value (FNPV) -£3.8 million
Financial Internal Rate of Return (FIRR) -13%
Financial Benefit Cost Ratio (FBCR) 0.32
Economic appraisal performance indicators
(3.5% SDR) (10% SDR)
Economic Net Present Value (ENPV) £7.6 million £2.7 million
Economic Rate of Return (ERR) 24% 24%
Economic Benefit-Cost Ratio (EBCR) 2.21 2.52
Sustainability
In isolation, the project is not financially viable due to its capital cost and would require grant funding. However,
the project has strong operational sustainability, suggesting that should a grant be sourced, the scheme will be
able to generate sufficient revenues to cover its on-going operations and maintenance.
The average monthly spend for a rural household in Chirundu is equal to GBP 3 per month for high cost
households (based on an average monthly water consumption of 11m3
and an associated tariff of GBP 0.25).
For communal access households, the average monthly spend is GBP 0.5, based on an average monthly use of
2m3. Using the average monthly wage in the agriculture of GBP 40 (600 ZMW), communal access households
will spend roughly 1% of their household budget, assuming that only one household member works. For high-
cost households, this equates to roughly 7% of their monthly wage, assuming only one member of the
household works. At the current assumed income levels, the tariffs appear to be affordable for both rural and
high cost households.
Chirundu WSS Feasibility Report Page 17 of 209
CBA Results
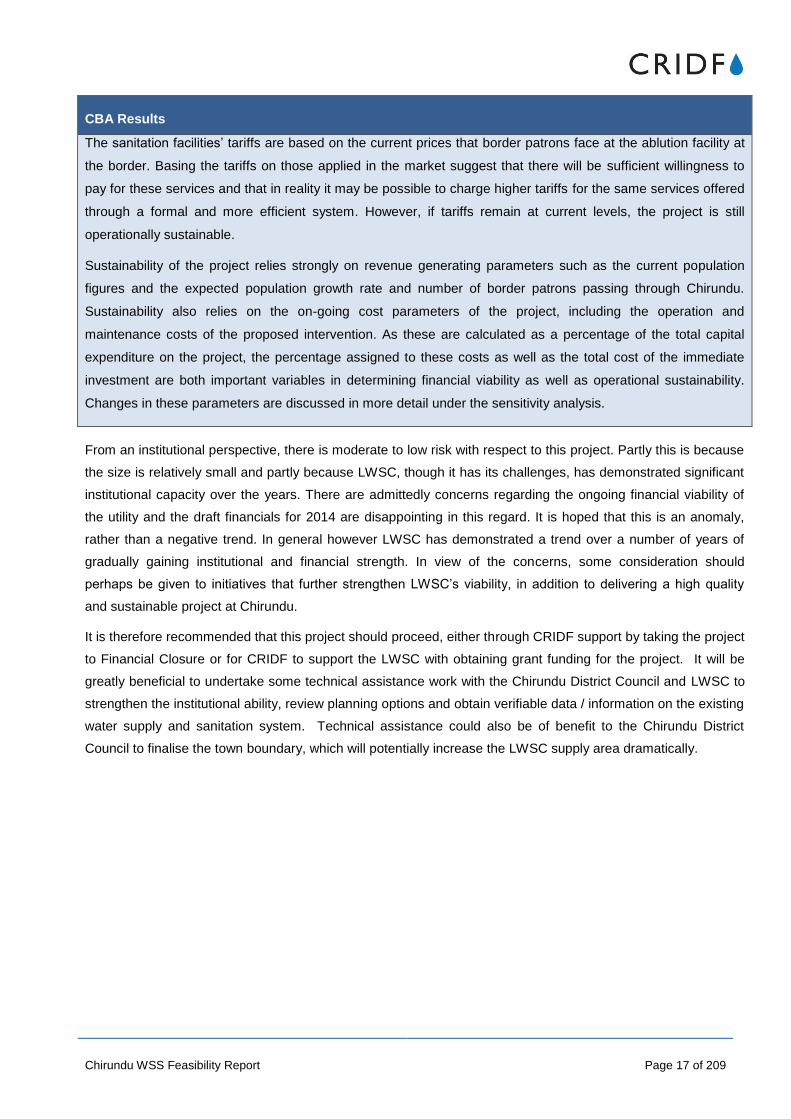
The sanitation facilities’ tariffs are based on the current prices that border patrons face at the ablution facility at
the border. Basing the tariffs on those applied in the market suggest that there will be sufficient willingness to
pay for these services and that in reality it may be possible to charge higher tariffs for the same services offered
through a formal and more efficient system. However, if tariffs remain at current levels, the project is still
operationally sustainable.
Sustainability of the project relies strongly on revenue generating parameters such as the current population
figures and the expected population growth rate and number of border patrons passing through Chirundu.
Sustainability also relies on the on-going cost parameters of the project, including the operation and
maintenance costs of the proposed intervention. As these are calculated as a percentage of the total capital
expenditure on the project, the percentage assigned to these costs as well as the total cost of the immediate
investment are both important variables in determining financial viability as well as operational sustainability.
Changes in these parameters are discussed in more detail under the sensitivity analysis.
From an institutional perspective, there is moderate to low risk with respect to this project. Partly this is because
the size is relatively small and partly because LWSC, though it has its challenges, has demonstrated significant
institutional capacity over the years. There are admittedly concerns regarding the ongoing financial viability of
the utility and the draft financials for 2014 are disappointing in this regard. It is hoped that this is an anomaly,
rather than a negative trend. In general however LWSC has demonstrated a trend over a number of years of
gradually gaining institutional and financial strength. In view of the concerns, some consideration should
perhaps be given to initiatives that further strengthen LWSC’s viability, in addition to delivering a high quality
and sustainable project at Chirundu.
It is therefore recommended that this project should proceed, either through CRIDF support by taking the project
to Financial Closure or for CRIDF to support the LWSC with obtaining grant funding for the project. It will be
greatly beneficial to undertake some technical assistance work with the Chirundu District Council and LWSC to
strengthen the institutional ability, review planning options and obtain verifiable data / information on the existing
water supply and sanitation system. Technical assistance could also be of benefit to the Chirundu District
Council to finalise the town boundary, which will potentially increase the LWSC supply area dramatically.

Chirundu WSS Feasibility Report Page 18 of 209
Introduction
Access to reliable and safe water supply and sanitation facilities at border towns in the SADC region has
emerged as a major challenge that requires urgent action to ensure continued activities at these strategic
centres. The 12 Towns Water and Sanitation Project, first identified in studies by the Gesellschaft fur
Internationale Zusammenarbeit GmbH (GIZ) seven years ago, aims to provide sustainable and equitable access
to safe water and adequate sanitation to a prioritised 12 border towns in Zambia.
The Climate Resilient Infrastructure Development Facility (CRIDF) is DFID’s innovative water infrastructure
programme for southern Africa. Working to deliver sustainable small-scale infrastructure across 11 SADC
countries, the demand-driven programme focuses on water services, water resource management, and water
for livelihoods, fostering sustainable development of the region’s water resources and addressing the water,
food and energy nexus.
Such interventions provide the entry point and platform for CRIDF to engage with, support and influence key
SADC interventions, river basin organisations and national stakeholders. Activities are selected according to a
set of CRIDF principles to ensure that investments align with strategic objectives that have been developed
specifically for each SADC river basin.
It is envisaged that through CRIDF, the inhabitants of the SADC region will benefit from climate-resilient water
infrastructure thereby substantially enhancing sustainability on one hand and also benefit from enhanced
cooperation amongst the stakeholders countries on the other. The programme is also expected to contribute to
the ultimate goal of peaceful, climate-resilient and sustainable planning and management of shared waters in
SADC, which will generate benefits for the poor both in the short and long run.
This report is a summary of the feasibility study undertaken to provide improvements to the existing water
supply and sanitation infrastructure at the Chirundu Border Post on the Zambian side of the border. The
Chirundu border serves as a crossing point between Zambia and Zimbabwe, which has experienced high
growth, especially after the construction of the second bridge across Zambezi River, completed in 2002.
The Lusaka Water and Sewerage Company (LWSC) is mandated to provide water and sanitation services in
Chirundu.
The Feasibility Study report follows on from the scoping mission that was conducted for various Zambian border
towns in 20131.
1 CRIDF, '12 Towns Water and Sanitation (Pre-Feasibility), 2013

Chirundu WSS Feasibility Report Page 19 of 209
Project Location
The Chirundu Border Post is located in the Lusaka Province of Zambia, at geographic co-ordinate 16°2'5.67"S
and 28°51'2.58"E, on the boundary between the Republic of Zambia and Zimbabwe. Chirundu is about 140 km
south east of Lusaka. Chirundu is the District Capital of the Chirundu District. Figure 1 shows the location of
Chirundu border post in relation to the Lusaka Province and Zambia.
Figure 1 Location of Chirundu District and Town
The report is divided into the following key sections:
Section 1 – Introduction (this section)
Section 2 – Social Assessment, including Gender, Equality and Social Inclusion (GESI)
Section 3 – Technical Assessment, including Climate Change Risk Assessment (CCRA)
Section 4 – Environmental Assessment
Section 5 – Financial and Economic Assessment
Section 6 – Institutional Assessment
Section 7 – Risk Assessment
Section 8 – Conclusions and Recommendations
Chirundu

Chirundu WSS Feasibility Report Page 20 of 209
Social Assessment
Introduction
A key component of developing a water supply and sanitation project in Zambia, is the social assessment,
which establishes full stakeholder engagement. The social assessment obtains the involvement of the relevant
government agencies, local authorities, Non-Governmental Organisations (NGO), local leadership, and
consumers in the area of project influence to obtain understanding of the current situation and buy-in for the
proposed project.
CRIDF acknowledges that early engagement provides valuable opportunity to influence public perceptions and
set a positive tone with stakeholders, despite the many uncertainties and unknowns. It is also an opportunity to
help generate ideas and alternative solutions on early design questions.
This section of the Feasibility Study presents a brief socio economic and gender assessment profile of the
Chirundu border town as regards, settlement patterns, sources of livelihood, access to services, water security
and employment opportunities. The report reveals public perception of the existing and proposed water supply
and sanitation services. It also presents some of the predicted project related social impacts and associated
mitigation measures to ensure social sustainability.
This second concludes with recommended community engagement in the management of proposed project
interventions.
The socio economic and gender assessment fieldwork was undertaken during the months of April and May
2016. It contains information obtained through literature review, Focused Group Discussion (FGDs) and inter
personnel interviews with public and private sector personnel and residents (see Key Informant Interviews in
Annex E).
Project Area Description
Chirundu was officially declared a district under Lusaka Province in January 2012. At present the district has a
well-established district administration with the presence of a district council, other government, private and non-
government organisations. The district is approximately 140 km south east of Lusaka, on the banks of the
Zambezi River. The border area (One-Stop Border Post between Zambia and Zimbabwe) forms a large part of
the urban centre. It is the busiest border post linking Zambia to its COMESA trading partners, Zimbabwe
directly, and South Africa, Lesotho, Swaziland and Mozambique through Zimbabwe.

Chirundu WSS Feasibility Report Page 21 of 209
Project Area Settlement Pattern
Like many other border towns in Zambia the Chirundu border area2 consists of three distinct built up areas,
which include:
The administrative and commercial area, including government offices, the border port and business
establishments,
Residential areas, categorised as low, medium and high density areas, and
Customary land, beyond the formal residential areas are villages in the peripheral located on customary
land.
According to the 2010 Central Statistical Office (CSO) census, Chirundu district had a total population of 47,971
people. The entire district falls under Siavonga constituency, which politically is composed of six Wards. The
project area falls under the Chirundu Ward with an approximate population of 14,864 (7,132 males and 7,732
females) and 3,025 households.
The project area is confined to the urban centre where Lusaka Water and Sewerage Company (LWSC) is
mandated to provide services. However, the district administration has plans of expanding the urban
boundaries, which would result in an increased service area for the commercial utility.
The Chirundu population consists of:
Government employees from government institutions such as the Ministries of Finance (through the
Zambia Revenue Authority (ZRA)), Education, Health, Home Affairs, Community Development and
Social Welfare, Transport and Communication, Works and Supply.
Statutory entities like, the Road development Agency (RDA), Roads, Traffic Safety Agency (RTSA),
Zambia Bureau of Standards (ZABS), LWSC and the Chirundu District Council (CDC).
Private companies such as banks, cell phone providers and transportation logistic companies.
Regional organisations, including the Common Market for East and Southern Africa (COMESA).
Entrepreneurs, traders and persons in transit, and
Residents from adjoining areas and villages.
Land Tenure System and Ownership
Given the district status, the border area is under the CDC planning jurisdiction and the council is in the process
of acquiring additional land from the traditional leadership. After acquiring additional land, it is expected that the
urban centre will be about four times larger than the current size. Thereafter, the LWSC would provide services
within the extent of the local authority’s planning mandate and land acquisition would not be a barrier in the
project.
2 Chirundu border area also serves as the Chirundu district urban centre.
Chirundu WSS Feasibility Report Page 22 of 209
Employment and Income Generating Opportunities
Existing economic activities offer a relatively stable income for the border community. Therefore individuals
including vulnerable women, youths and other groups already engaged in different activities would have to
operate at optimal levels in response with the demand. The main economic activities in the project area can be
categorised under either formal employment, business and trading ventures or small holder farming activities.
Formal employment
There are a significant number of residents employed in formal public and private institutions and organisations
that are based in Chirundu. These form a majority of residents living in low and medium density residential
areas.
Business and Trading Ventures
Local residents and migrants from different parts of the district and Zambia that have settled in the area, have
taken advantage of the business opportunities created by the border post activities and travelling public. Most
enterprises include forwarding and clearing agencies, restaurants, retail shops and stores, bars, salons and
barbershops, taxi drivers, hawkers, money changers, casual labour assisting travellers. There are a significant
number of transit traders engaged in cross border trading from Zambia, Zimbabwe and ultimately South Africa.
Smallholder farming activities
Agriculture and farming is a major activity amongst residents residing in the high density and adjoining villages.
Due to the climatic conditions of the area, agricultural activities are mainly confined to crop production along the
Zambezi and Kafue Rivers and rearing of livestock. Goat rearing is quite common as sales goats fetch higher
prices in nearby urban centres like Kafue and Lusaka. Other crops grown include vegetables and citrus.
Commercial farmers within the district owning banana plantations and cotton fields offer seasonal employment
to some residents. The two rivers also provide an opportunity for fishing activities specifically amongst residents
in the high density and adjoining villages.
Infrastructure and Social Services
This section provides information on infrastructure and services including, health, education and energy
available in the project area, while water supply and sanitation as the focus of the project is covered in a later
section.
Health
The project area is served by the Mtendere Mission Hospital owned and operated by the Catholic Church
(diocese of Monze). The facility also serves as a referral hospital for the entire Siavonga constituency and
caters for non-Zambians mainly Zimbabweans and other nationalities in transit. The hospital offers an extensive
range of in-patient and out-patient diagnostic and treatment services including laboratory, ultrasonography,

Chirundu WSS Feasibility Report Page 23 of 209
endoscopy, radiology, operating theater, dental care, mother and child health, public health services and
pharmacy.
As a border town, Chirundu sustains a highly variant population, due to the high border crossing transient
population. The movement of the transient population is one of the major causes of HIV infection in the area.
In recognition of this the hospital implemented an HIV and AIDS care and prevention programme in 1999, as a
response to the AIDS illness and its multiple social economic effects in the community. Other common
ailments include high cases of malaria, non-bloody diarrhea, respiratory infections and bilharzia. The hospital
charges fees for admission care and other specialized services such as surgery.
Education
Chirundu border area has one primary school and a secondary school. According to the new Chirundu District
Profile report 2014, education is one area of high investment opportunity. The majority of the parents who can
afford boarding schools, have enrolled their children in other districts.
Energy
The border area is connected to the national grid and nearly all administrative, commercial and dwelling housing
units are connected. Other sources of energy include use of firewood and charcoal for cooking and candles and
batteries for lighting.
Existing Water Supply and Sanitation
The Lusaka Water and Sewerage Company (LWSC) supplies water to the Chirundu border area including the
entire urban area. The company provides water through two main water supply systems, namely piped house
and yard connections and communal water points. The majority of the commercial and administrative area and
households rely on LWSC water supply, although it was observed that institutions such as the Mtendere
hospital, the secondary school and some individuals have developed their own private water systems.
Water Supply and Sanitation Services for Truckers and other Travellers
As part of the One Stop Border Post infrastructure, water and sanitation facilities for truckers and other travellers
have been provided within the enclosed border area. ZRA owns the infrastructure and management of the
facilities lies with the same. Water supply services were, however handed over to the commercial utility, LWSC.
In the passenger terminal the ablution blocks are equipped with toilets and wash hand basins only (see Figure
2), while the commercial terminals also include showers. A cleaning company (known as Scenario Cleaners)
contracted by ZRA manages the passenger terminal ablution block.

Chirundu WSS Feasibility Report Page 24 of 209
Figure 2 Wash basins in the Passengers Terminal Ablution Block
The entire border area is connected to the LWSC water reticulation system and therefore are affected by water
supply disruptions, which are experienced in the Chirundu urban area. During periods of disruption, CDC
delivers water to the border area as a matter of priority.
Water Supply and Sanitation Services to Other Commercial Areas
CDC owns a public ablution block consisting of two flush toilets and four showers for male and female users.
This ablution block caters for entrepreneurs conducting business around the border area, traders selling
merchandise at the main market and also travellers utilising the council bus station. The CDC ablution block is
in a deplorable state with non-functioning toilets and missing fixtures. The block is located at a vantage point in
close proximity to the main road and the border area – see Figure 3.
Figure 3 Chirundu District Council Ablution Block

Chirundu WSS Feasibility Report Page 25 of 209
The council also owns and manages public ablution blocks with water borne sewer system at the main bus
station and main local market. The fee-paying toilet at the bus station is in good condition whilst the one at the
market is closed due to lack and erratic water supplies. During the visit the market was in the process of
commissioning a borehole equipped with a hand pump.
Water Supply and Sanitation Services for Households
Households have the following water supply and sanitation facilities.
House and yard connections
The LWSC has a total of 928 house and 60 commercial connections. These service areas are supplied with
water up to the house or business premises. Most of the businesses, low and medium density housing areas
have extended the connections into the buildings, whilst a limited number of dwelling units in the high-density
areas have yard connections. The current meter coverage is about 45% of the connections, whilst the rest is on
fixed charges.
Communal Water Points
The company provides water to communal water points through kiosks (refer Figure 4). There are a total of 9
kiosks located in the high-density residential area. These are managed by water vendors who are contracted by
the company. All the nine vendors are women and operate kiosks from 6:00 to 18:00 hours every day of the
week. The vendor is paid a commission of 40% of the total water sales. Communal water point users pay a
water user charge of 25 ngwee ($ 0.24) for 20 litres of water. 20 litre container used for cooking oil packing is
typically used as a measure in Zambia.
Figure 4 Kiosk in a High Density Area

Chirundu WSS Feasibility Report Page 26 of 209
Private water supply and sanitation systems
As earlier mentioned some institutions, entrepreneurs and individuals have developed their own water systems
through the use of water from either boreholes or from the Zambezi River. Due to availability of water, typically
such premises have water borne sanitation systems using septic tanks.
Since LWSC does not provide sewerage services, the entire area operates on-site sanitation provided by
developers. From observations and discussions majority of the sanitation facilities found in housing areas were
using ordinary pit latrines. A number of Ventilated Improved Pit latrines (VIPs) and flush toilets using septic
tanks were reported.
Perceptions of Existing Water Supply Facilities and Services
During the FGDs and other interpersonal interviews, respondents expressed varying levels of satisfaction with
the water supply and sanitation services provided by the LWSC, other developers and themselves. Their
perceptions are categorised into broad themes of quantity, quality, reliability, tariffs, distance and technology.
Quantity
In general residents residing in the originally planned low and medium density areas had a positive perception
of the quantity of water supplies. Those living further away from the planned area and in high-density areas
experienced low pressure and intermittent supply. Residents using communal water points reported that they
had no problems of quantity in the past but have over time experienced low pressure due to the high number of
house connections.
Quality
As regards quality, respondents expressed trust in the LWSC and were certain that they received treated water.
However, they observed that the water had a brownish colour and had some solids particularly in the rainy
season. Those who draw water from private households with boreholes complained of a metallic taste and
gastric problems. Further during times of water deficit, residents were forced to utilise extremely unsafe water
from the Zambezi River.
Reliability
All respondents interviewed presented a negative perception of water supply reliability. The LWSC was viewed
to be unreliable and unable to meet the needs of not only the travelling public but of the entire resident
population. Women expressed dissatisfaction in the unscheduled disruptions, which cause stress amongst
users. Women with house connections from medium cost reported that on a typical day water would be
available for 6 hours from 23:00 to 5:00 hours. Those from high-density areas complained that at times water
would only be available from 23:00 to 1:00 hour. As has been observed water would usually not be available in
the day time and most households resort to either paying for casual labour to draw from private premises with
private water systems or from the Zambezi River. The fees ranged from ZMW 5 to 10 per 210 litres drum

Chirundu WSS Feasibility Report Page 27 of 209
depending on the demand. Residents revealed that they have experienced the worst water shortages in the
recent year due to power outages.
Distance
Residents drawing from kiosks were the only ones expected to provide perceptions on the distance to the water
sources and those who utilise alternative water sources in times of deficit. It was observed that the 9 kiosks
were evenly spread out within reasonable distance. The only households that complained of distance were
those that were newly built as the settlements are expanding outward. As reported by LWSC some of the
households served were outside the council planning area.
Water Tariffs
The tariffs were viewed as being fair and residents were willing to pay for water. This was confirmed by the
LWSC who revealed that they had an overwhelming 80% payment rate. Residents drawing water from kiosks
ware on a pre-paid system and did not complain of the tariffs. The major grievance of most residents especially
the marketers was not the prices of water but the lack of reliable water supplies.
Water Facilities
Respondents utilising house connections reported to be contented with their infrastructure. Those drawing from
kiosks were relatively fulfilled although they would prefer to have house or yard connections. Some of the
challenges of communal water points included reliance on the vendor who understandably has to close the
kiosk in order to attend to household chores. Therefore operations of the kiosk were largely dependent on water
availability and commitment of the Vendor. Other challenges such as queuing up and drawing water at midnight
and in the early hours of the morning were experienced in instances of water shortages. Nevertheless residents
were satisfied with the service as the tariffs were affordable.
Perceptions of Existing Sanitation Facilities and Services
Flush Toilets
The flush toilets at the border area were perceived to be adequate and relatively clean although there is an
average of 1,000 to 1,200 passing through the border every day. A Scenario Cleaners employee explained that
the facilities were adequate and the only problem was ensuring a high level standard of cleanliness. This was
because there were challenges of water supply from time to time. Storage water tanks installed were damaged
and the company was using drums. It was reported that CDC had the responsibility of ensuring that there is
water at all times.
The ablution block at the market served the market and other clients adequately, and its closure has led to
deteriorating sanitary conditions around the market. Marketers and farmers who sleep over at the market utilise
unfinished buildings, inconvenience nearby households or practice open defecation behind stalls and bushes.

Chirundu WSS Feasibility Report Page 28 of 209
Flush toilet technology in households is perceived to be the best option. However the major criticism was the
non-functionality due to lack of water. These have become pouring - flush toilets and most households have
resorted to constructing pit latrines as a backup.
Ventilated Pit latrines
VIPs were mainly utilised by institutions and a few households. These were viewed to be a better option in
situations where water supply was inadequate. Though VIPs were perceived to have a longer lifespan in
comparison to ordinary unlined pit latrines, the only problem was the lack of sludge emptying services in the
area.
Ordinary Pit latrines
Ordinary unlined pit latrines were highly prevalent both in commercial and residential areas. It was observed
that these latrines were not only found in high density but even in the low and medium density areas.
Respondents perceived this technology as the worst technology contributing to unsanitary conditions in the
project area. They complained of the inconvenience of digging pits around the premises. This was a serious
problem for those with smaller plots. Due to the terrain of Chirundu it was difficulty to dig pits and a number
collapsed in the rainy season. Other complaints included odours, and flies.
Public Perceptions of the Proposed Interventions
The LWSC is clearly not able to meet the current water supply demand due to inadequate water production
capacity, which includes abstraction, filter, transmission line and storage reservoir capacity. Additionally, the
distribution network is not servicing the full customer base. The Chirundu border community is growing very
rapidly due to enhanced status of “one stop border facility”. The location is characterised by long queues and
waiting times for trucks due to large traffic volumes. This translates into prolonged stay of travelling population
who would require water supply and sanitation services. Although the border area is served by a proper water
supply and sanitation service, this area is closed around 22:00 hours, leaving overnight travellers to utilise other
public water supply and sanitation services. As mentioned alternative sanitation facilities provided by the
Chirundu district council are limited and in a poor condition.
Therefore and future intervention in Chirundu should provide support to increase the potable water production
and supply capacity, as well as rehabilitation of the council ablution blocks to cater for truckers and travellers.
Water Supply Improvements
Using stakeholder and consumer perception, the technical assessment proposes to develop a ring main
network, comprising a ring mains allowing for improved coverage of supply to Chirundu. Water kiosks would be
constructed to cover all the residential areas, although the number and location would be determined and
finalised after consultation with stakeholders at the detailed design stage.

Chirundu WSS Feasibility Report Page 29 of 209
Sanitation Improvements
The technical assessment proposes the construction of public ablution facilities for use by travellers crossing the
border and at high foot traffic areas like the local market. The ablution block would consist of toilets, shower and
laundry facilities, which will be separate for males and females. Sewage treatment would be by means of a
septic tank, designed to be emptied every 3 years. The sludge would be discharged into sewage ponds located
at the nearest town with sewage treatment facilities. In future, these facilities could be connected to the existing
sewer network system, which would need to be refurbished, which could include a faecal sludge handling
facility.
The low to medium income residents would be encouraged to use on-site treatment solutions, while
construction of VIP latrines for the low income communities would be considered on condition of affordability.
The existing non-functional sewerage treatment plant would in future be redeveloped to full operation to receive
and treat wastewater from the operations of a conventional sewerage system conveying sewerage from the
border post and surrounding commercial area. A small bore sewerage system from other high volume water
consumers (lodges, hotels, businesses, homeowners) can be incorporated into the existing system. All the
wastewater would then be conveyed to the refurbished oxidation ponds.
Public Perceptions of the Proposed Water Supply Technology
The proposed support of enhanced production capacity would result in increased and more reliable water
supplies. Both men and women felt that the current Zambezi river water resources were adequate and in close
proximity. They discouraged the use of ground water, which from experience had an undesirable metallic taste.
Majority of stakeholders interviewed preferred house connections, which provided privacy and ease. Kiosks
were viewed to be pro poor servicing those that were unable to pay for house and yard connections. Kiosks
were suitable as they had a designated vendor responsible for collection of fees, cleaning the surroundings and
maintaining order. There was a demand for more kiosks to service new areas. Residents maintained that the
LWSC should continue to allow residents who have the ability, to pay for house connections. The projection for
future water needs and technology should therefore be made on the basis of yard / household connection,
rather than communal water points.
Public Perceptions of the Proposed SanitationTechnology
Residents interviewed lamented over the state of the Council managed facilities near the border and at the main
local market. Marketers revealed that the problem was due to inadequate water supplies and management of
the facilities. They proposed that both facilities should be placed under contract management. They felt that the
private sector should be given a build operate lease so that the facilities are modernised.
The most preferred sanitation technology for households was the water borne sewerage system. Residents of
Chirundu are from different parts of the country, and majority of those in formal employment have been exposed
to water borne systems. Public and other private sector employees expressed the need for what they termed

Chirundu WSS Feasibility Report Page 30 of 209
‘modern’ facilities that would change the face of Chirundu given that it was an international entry point and had
gained a district status.
Further the Council personnel indicated that the current border and residential area would eventually become
the Central business District (CBD) of the district. They therefore recommended that the sewage treatment plant
should be commissioned and made operational. They however realised that payment for the improved service
would increase.
It was further recommended that those that would not be able to afford to pay for sewer connection would be
encouraged to construct VIPs. In order to ensure environmentally friendly and hygienic sanitation facilities, in
the absence of operational water borne sewerage system, residents could be coerced to construct VIPs through
formulation of Council By Laws.
Socio-Economic Impacts of the Proposed Project
Typical water and sanitation projects inevitably produce both positive and negative impacts. The direct socio-
economic benefits of the project include the net results of improved livelihoods through health improvements,
increased productivity, and improved community resilience to climate change. Indirect effects include a positive
impact on tourism in Chirundu due to healthier and more resilient communities. Other positive impacts include
modernised sanitation infrastructure and potential for greening the area that would improve the aesthetic
environment of the area. Some of the critical impacts with accompanying enhancement and mitigation
measures are as follows:
Positive impacts
Improved Health
Improvements in water supply production and treatment infrastructure translate into increased quantity and
quality. Higher quantities of water will enable household members to improve cleanliness and hygiene, which
results in reduced water borne disease. In relation to quality, communities will be assured of safe, quality water,
as the company would treat sufficient volumes to meet demand and conduct periodic quality analysis. Evidence
of improved health shall be monitored through health indicators at the nearest health facilities.
Increased Productivity
Improved health will have a positive impact on productivity in whichever occupation one is involved in, as there
will be less absenteeism from tasks. Higher quantities of reliable water will enable residents to engage in
economic productivity tasks such as backyard gardening, block making, managing restaurants and hair salons
more efficiently. These enterprises assist households to earn incomes that are used for other household
requirements.
Time saving
This is particularly important for households that draw water from kiosks where time is spent on queuing up and
waking up at awkward hours. Reliable water supplies will result in time savings, as women will be able to draw

Chirundu WSS Feasibility Report Page 31 of 209
water at reasonable times and use the time saved for other household and other productivity activities. Women
involved in enterprises outside the home are usually disrupted by erratic water supplies as they give priority to
water thereby delaying or abandoning their productivity activities. This results in reduced household incomes.
Increased Population
Increase in population will result in both positive and negative impacts. A combination of improved water supply
and trade will attract more business people, tourists and settlers to the area. This will create demand for water,
but more revenue for LWSC. The increased revenue provides an opportunity for LWSC to expand the system
as the population increases.
Negative Impacts
Water wastage
There is a likelihood of water wastage in households through leakage and inefficient practices such as watering
lawns, car washing, leaking taps and so on. There is also a possibility of water loses through the main
reticulation system. These losses can be mitigated by installing meters in each premise including kiosks. This
measure should be coupled with customer sensitisation on demand management. Promoting water use
efficiency would benefit the company, as they would generate adequate revenue to cover operational costs for
them to deliver a good service.
Vandalism
Chirundu is likely to emerge as one of the fastest growing districts in Lusaka Province, as it is a transit area that
has been elevated to a district. More people from different parts of the Zambia and other countries will flock to
the area, taking with them other urban vices, such as theft and vandalism that would impact negatively on trade,
and local residents. In relation to water supply, vandalism impacts negatively on the provision of safe water due
to contamination of water through infiltration and breakdowns. The Company should therefore be alert and use
vandal proof materials. Vandalism can also be minimised through community sensitisation.
Generation of solid waste
Management of solid waste is cardinal as indiscriminate disposal increases chances of contamination of water
in the event of leakages. The mandate of waste collection and disposal lies with the local authority within their
planning jurisdiction. In this light Chirundu council should establish a sustainable waste collection, and ban the
current waste disposal practice of using pits and burning that is undesirable for an area that is frequented by
tourists and other travelers.
Gender Equality and Social Inclusion (GESI)
This section summarises the Gender Equality and Social inclusion (GESI) issues, with a specific focus on the
following elements:
Chirundu WSS Feasibility Report Page 32 of 209
Outlining community development issues including employment and income generating opportunities
and the water and sanitation needs of women, girls and the vulnerable;
Description of the expected changes in the quality of life to women, girls and the vulnerable including
the poor as a result of the project activities.
Review of the inclusive nature of the project outcomes and how the benefits would accrue to the
beneficiaries.
Information provided in this section was obtained through field Focus Group Discussions (FGDs) with women,
girls and men in Chirundu border area. Supplementary information was also obtained from secondary sources
(see Key Informant Interviews in Annex E).
Policy, Legal and Institutional Framework for GESI in Zambia
There are a number of national legislative and policy frameworks that promote GESI in the delivery of water and
sanitation services to the Zambian population, both in rural and urban areas. Of significance in the context of
this project are the Constitution of the Republic of Zambia, the National Water Policy, The National Water
Supply and Sanitation Act, and the Gender Policy.
The Constitution of the Republic of Zambia
The overriding guidance document is the Constitution of the Republic of Zambia which guarantees equal
opportunities of women and men in the development process, where every person has the right to a reasonable
standard of sanitation. Furthermore, any law, culture, custom or tradition that undermines the dignity, welfare,
interest or status of women or men is prohibited. This is in addition to the National Cultural Policy that ensures
that traditions and customs do not discriminate against women.
The National Water Policy of 2010
The National Water Policy gives recognition to the fact that management and development of water resources
from the lowest to highest decision making levels requires effective participation by both men and women. It
acknowledges that women play a vital role in the provision, management and safeguarding of water, therefore it
is imperative that women take proactive decisions on how these resources can be developed and managed. In
order to operationalize these statements to a practical level, the Policy has made provisions that implementing
agencies formulating strategies and implementing programmes and projects have to enforce. These include:
Accelerating the representation of women at all levels and in all spheres of water resource
management;
Ensuring gender balance by defining the key roles played by women, men, and children so that there is
no gender discrimination in the ownership, management and sharing of benefits of various water
schemes operated by communities in particular;
Gender mainstreaming in water sector programmes to be articulated with the full involvement of
women; and
Appropriate and gender sensitive technology to be introduced.
Chirundu WSS Feasibility Report Page 33 of 209
The National Gender Policy
The Zambian government formulated the National Gender Policy in 2000, which addresses the need to build
and strengthen national capacity for advocating and mainstreaming gender in the developmental process.
Under the guidance of the Ministry of Gender and Child Development, all government ministries have appointed
and trained gender focal persons from headquarters through the province to the district levels. Therefore the
working context of CRIDF projects it is expected that all respective districts under which the border areas fall,
must have Gender Focal Persons.
The National Water and Sanitation Act no. 28 of 1997
The Act establishes the National Water Supply and Sanitation Council (NWASCO) and defines its functions to
provide for the establishment, by the local authorities, of water supply and sanitation Commercial Utilities (CUs).
These CUs are mandated to provide efficient and sustainable supply of water and sanitation under the
regulation of NWASCO. It is by this Act that that NWASCO is mandated to provide guidelines to CUs on how
they can provide efficient services. At present the regulator has instructed all the CUs to formulate and
implement gender and HIV and AIDS strategies to ensure gender equality and pro poor service provision. At the
same time NWASCO has established Water Watch Groups (WWGs) comprising consumers from respective
service areas.
Given that water supply and sanitation services for Chirundu shall be developed and managed by Lusaka Water
and Sewerage Company (LWSC), it is expected that they shall take cognisant of the policy, legal and
institutional framework in addition to recommendations made in this report on how to strengthen GESI
integration in their activities.
Other Policy
Other gender equality guiding references include the Southern African Development Community (SADC)
Gender Protocol Barometer.
GESI issues at Chirundu Border Area
Distribution of roles and responsibilities Amongst Males and Females
Economic activities in Chirundu offer a relatively stable income for the border community. Therefore individuals
including vulnerable women, youths and other groups, already engaged in different activities, would have to
operate at optimal levels in response to the demand.
Discussions with women revealed that although public workers in formal employment inhabit the area there
were fewer formally employed females. The majority of the population was entrepreneurs involved in trading
(equal number of men and women) and clearing goods at the border (male dominated). It was further revealed
that more men than women were involved in business that involved travelling to distant places. Most married
women were housewives engaged in trading from their homes or at the market.
Further it was observed that women from rural areas were involved in selling vegetables whilst the men sold
small animals. Those involved in farming were confined to the Zambezi and Kafue Rivers, which offered an
opportunity for vegetable cultivation and fishing. In general nearly each household had an active member
engaged in a variety of income generating activities.

Chirundu WSS Feasibility Report Page 34 of 209
Vulnerability of residents
There are three main incapacitating situations that expose the Chirundu residents to hardships, which are
climatic conditions, the HIV and AIDS pandemic and inadequate water supply and sanitation.
Chirundu area lies in a livelihood zone that receives less than 700 mm annual rainfall and is prone to periodic
hazards, including drought and accompanying high temperatures. Due to the low potential for agricultural
activities in the developing urban area, the unskilled labour force is mainly engaged in trading as their major
source of income. Further there are minimal formal employment opportunities as a result the educated younger
people migrate to nearby towns such as Kafue and Lusaka.
As a border town, Chirundu sustains a highly irregular and transient population, which is one of the major
reasons for high HIV infection rates in the area. A number of studies have been conducted to identify measures
of curbing the high infection incidence. In response the Mtendere Mission Hospital and NGOs such as Tasintha,
and Corridors of Hope have implemented HIV and AIDS programmes. Nevertheless, the population is highly
vulnerable to HIV infection due to the overnight travelers and the economic hardships faced by the general
public in Zambia.
Chirundu area experiences high temperatures that create a requirement for reliable safe drinking water. This is
in addition to water for maintaining high hygiene standards. This is particularly critical for women and girls who
require water for Menstrual Hygiene Management and ensuring cleanliness amongst household members and
activities. The lack of managed sewerage services by the LWSC and non-existent enforcement of sanitation
principles by the Chirundu District Council (CDC), has exacerbated the unacceptable sanitary conditions in the
area. This exposes the entire population to water borne diseases such as cholera, typhoid and dysentery.
Existing Support Programmes for Women
Three GESI FGDs were held with the following groups:
Six women's clubs, attended by the woman's club chairperson
The market committee, attended by 6 male and 6 female entrepreneurs.
Women representing the border area low, medium and high-density areas.
The Community Development officers from the Ministry of Community Development and Social Welfare
(MCDSW) mobilized women for the FGDs.
The MCDSW works with vulnerable and incapacitated households both in the rural and urban areas. In
Chirundu town the Department of Community Development has facilitated the formation of a total of 27 women’s
clubs. The club members have been trained in various disciplines such as entrepreneurship and financial
management, saving and investments, leadership, mother and childcare and other topics as requested by the
women. A primary activity undertaken by women in the project area is the savings and loan scheme.
Group savings are a positive and empowering activity, which women are using to solve households adversities.
Some women used savings to improve their housing units, and as capital for either initiating or boosting different

Chirundu WSS Feasibility Report Page 35 of 209
types of enterprises. Some of the popular enterprises that women are undertaking include, selling vegetables,
cross border trading of marketable goods, poultry and livestock rearing, tailoring, hair dressing and taxi
businesses.
The department also manages vocational skills training for the youth. These are trained in crafts such as
welding, blacksmiths, plumbing, bricklaying, carpentry, tailoring and so on.
Associated Gender Equality Social Inclusion Challenges
The existing water supply and sanitation situation has given rise to a number of GESI specific challenges.
Unreliable Water supply
Whilst the water quantity is not a noted as major problem, women and other residents lamented over unreliable
water supplies. They attributed the problem to LWSC’s limited production capacity, because the supply from the
Zambezi River, which is in close proximity, has adequate water throughout the year.
The erratic water availability causes stress amongst women who at most times have to wake up at awkward
hours to draw water. Women drawing water from kiosks complained of the risk of rape and mugging, which they
are exposed to as they are forced to draw water in the middle of the night. The emotional drain of waiting and
expecting water makes women complacent to undertake productivity activities. Women proposed that the
LWSC should maintain a consistent schedule of supply, to allow them to store adequate water. Preferably
disruptions should occur at night and permit residents to rest.
Prolonged Time Spent on Water
Although the nine available kiosks are evenly spread out within the settlement, the increase in population and
construction activities has contributed to congestion at the kiosks. This is compounded by the vendor’s timetable
of closure, which at times is not regulated. Women complained of the time and emotional strain spent on
ensuring that the household had adequate water supplies. This diverts women’s attention from other household
chores and productive activities.
Further when water is available vendors dictate the times and this disturbs the rhythm of women’s work and rest
schedules. Women however showed concern for the vendor's long work hours. A reliable system would provide
the vendors with adequate time for rest and other necessary chores.
Long Distances to Water Points
The long distances to the kiosks were mainly experienced by residents residing in new housing areas that were
not initially part of the population planned for. These areas will have to be supplied with additional kiosk or
house connections in the event of urban area expansion. Another set of residents exposed to long distances are
those residing further away from the Zambezi River. The river is usually used as an alternative source of water

Chirundu WSS Feasibility Report Page 36 of 209
for other uses in times of serious water deficits. In such eventualities some women and children spend almost
an hour to and from the Zambezi River.
Revenue Spent on Water Supplies
Some households particularly those with adequate income have devised ways of overcoming the problem of
queuing up and fetching water from private households by paying private water vendors. Marketers who use
bulk water such as women managing saloons and restaurants particularly reported that they resort to buying
water from water vendors. This increases expenditure on water as the prices charged vary in accordance with
the demand. This impacts on the revenues earned as more money is spent on inputs. Further poorer women
who are unable to buy water have to abandon their productive work and draw water themselves. This impacts
on the revenues earned and imposes a burden on women.
Exposure to Accidents and other Risks
The Zambezi River is the major alternative source of water in times of water deficits in the project area. It was
reported that women, men and children are exposed to crocodile attacks as the river is infested with crocodiles.
Respondents including the CDC personnel confirmed that fatalities had been reported from time to time.
Increased burden of drawing water for sanitation
Some houses have water borne sanitary facilities whose functionality is dependent on adequate water supplies.
The major complaint amongst household members without private boreholes is that these facilities have
become ‘pour and flush’ toilets. The other problem associated with pour and flush systems is the need for
constant water supply that was not feasible with the current water supply services. The lack of adequate water
supplies in the household has created a burden on women and other female members who have to ensure
adequate water for all domestic uses including ‘water for sanitation’.
Unfavourable Sanitation Technology
The Chirundu project area residents are highly aware of the dangers of poor sanitation. Women therefore
complained of the inappropriateness of the ordinary pit latrines, although these are widely used in the project
area. Pit latrines present a number of nuisances including contamination of ground water, odours, flies and a
major source of water borne disease. Further, households with smaller plots complained of inadequate space
for digging latrines from time to time.
Social exclusion of Different Social Groups
Furthermore, improved and ordinary latrines are built with squat holes. Specific members of households such as
pregnant women, the aged, the sick and children are faced with challenges when using squat holes due to their
physiology. Therefore, selection of sanitation technology should be based on the needs and usability of special
social groups in the households.
Chirundu WSS Feasibility Report Page 37 of 209
Threat of Defilement and Rape amongst Female Members
Due to the closure of the local market ablution block, marketers and other transient vendors utilise unfinished
buildings, practice open defecation behind stalls or seek services form nearby households. Allowing strangers in
the homestead exposes the household to thefts and risk of defilement of female household members. Provision
of water supply and sanitary facilities at the market would eliminate this risk.
Poor sanitary conditions at the Market
Women expressed great dissatisfaction with regards sanitary conditions at the market. Their main concern was
that majority of the women spent their time operating their income generating activities at the market. Further
the market is a critical place where foodstuffs are sold and prepared in the case of restaurants. Therefore
adequate sanitation, which includes both liquid and solid disposal, should be of high priority to all concerned
stakeholders. Closure of the ablution block has led to deteriorating sanitary conditions that exposes the
community to health risks, thereby increasing their health bills and reduces productivity.
Expected Positive Changes in the Quality of Life
The Project is expected to produce specific outputs that will result into specific GESI outcomes that will impact
the lives of women, girls and the poor.
Increased Safe Water Supply
Expansion and rehabilitation of the current water supply infrastructure will translate into increased quantit ies of
water. There would be adequate water to service existing and additional houses under construction. Women in
these houses will be relieved of the burden of fetching water from unsafe water sources such as the Zambezi
River.
Further adequate safe water supply would contribute to improved hygiene and ultimately on the health of
household members.
Improved water supply and sanitation for the travelling community
Rehabilitation of CDC public facilities will greatly improve the sanitary conditions at the market where majority of
resident and travelling females conduct their businesses. Marketers will be able to dedicate their time to their
enterprises and gain more incomes. Availability of sanitary facilities is particularly important for travelling women
and girls who have special needs.
The threat of insecurity in nearby households will be eliminated providing a sense of safety and peace in
households. This enables household members to live in harmony and have the freedom to engage in their
various activities without fear.
Chirundu WSS Feasibility Report Page 38 of 209
Wealth Creation Opportunity
Increased water quantities will contribute to productivity, as residents would be able to engage in ventures that
they cannot undertake due to inadequate water supplies. Some of the activities that women felt could be
conducted easily included poultry, gardening and block making for men. At present men were unable to
generate revenues from block making due to erratic water supplies. Although water can be drawn from the
Zambezi, Chirundu is hilly and it is quite tedious to draw bulk water supplies.
In additional health personnel felt that adequate water supplies would promote initiation of greening projects that
would contribute to the aesthetics of the area thereby attracting potential investors.
Recommended Actions for GESI
In order to ensure GESI is incorporated into the project, the following actions are recommended for the different
stages of project development and implementation.
Project design stage
During feasibility the views of women over their preferred technology were solicited. As regards water supply
infrastructure all the women preferred house and yard connections as opposed to communal water points. In
order to cater for the poor, kiosks were also the most preferred infrastructure. Therefore project implementers
should provide residents with an opportunity to have house and yard connections, with kiosks provided as a
transitional solution to yard and household connections.
Sites for kiosks
Project implementers should be aware of the factors to consider when siting kiosks. Some of the issues to
consider include not locating Kiosks in close proximity to bars, markets, bus stations and other congested public
places. They should be located in sites that would provide safety, privacy and dignity to women as they draw
water.
Support for Sanitation
Although the Project is mainly focussed on supporting sanitation for the travelling community, some form of
support can be mobilised for household sanitation. In Zambia sanitation is regarded as a household issue
however, developing partners have involved the private sector in financing sanitation through micro finance.
Residents interviewed expressed willingness to obtain loans with minimal interest. Notably, they were
concerned over the exclusion of household sanitation which was equally important and the major cause of water
borne disease. Assistance to the local authorities to negotiate for a sanitation micro financing facility should be
considered as part of technical assistance. This will allow household sanitation improvement that is fully
integrated in the project.
Local authorities should be encouraged to formulate sanitation by–laws that will coerce households to adopt
improved, appropriate and safe sanitation facilities.

Chirundu WSS Feasibility Report Page 39 of 209
Management of Communal Water Points
The LWSC is already utilising a kiosk system, which is well accepted by residents. The company should
consider piloting pre-paid meters in Chirundu, which have been extensively tested in Lusaka. Pre-paid systems
reduce dependence on water vendors who are not well paid and spend 7 days a week at the kiosk, which is
more time than would be worked by a LWSC permanent employee. This is particularly important as the female
vendors employed complained of low earnings compared with the amount of time spent at the kiosk. The
Vendors are also not entitled to any LWSC accumulative benefits. It is recommended that LWSC should review
the working conditions to make them more favourable or consider employing the Vendors on a permanent
basis.
Pre-paid systems would withdraw the women water vendors from a productive paying activity, even if with low
payment. This should therefore be considered prior to implementation of a pre-paid system.
GESI Summary Tables
The GESI assessment is summarised within the tables attached in Annex A:
Annex A1: GESI Analytical Checklist
Annex A2: GESI Action Plan
Annex A3: GESI Rating Operations Table
The table presented in Annex A3 is the CRIDF GESI Rating Tool, which for the Chirundu WSS project scores 9
out of 12, which places the project in the 'encouraging' category.
Community Engagement for the Proposed Project
LWSC is in possession of a licence to provide water supply and sanitation services in Lusaka Province until
2021. Therefore the company should use well established approaches in delivering water in different contexts -
commercial, low, medium, and high density residential areas, and rural areas.
Management of Individual piped reticulation
In areas where individual house connections are provided the company should ensure that all the connections
are metered as fixed rates currently in use lead to wastage of water. The company is already responsible for
maintenance of main lines and any maintenance after the meter within the premises are individual’s
responsibility. However, leakages after the meter should be detected and monitored to avoid contamination.
Management of Communal Water Points
The LWSC is already utilising a kiosk system, which is well accepted by residents. The company should
investigate the option of using pre-paid meters tested in Lusaka. Pre-paid systems reduce dependence on
vendors who are lowly paid and spend 7 days a week at the kiosk.

Chirundu WSS Feasibility Report Page 40 of 209
Operation and Management the Council Public of Water Supply and Sanitary Facilities
Once the ablution blocks are rehabilitated, the management of the facility by a private sanitation company
should be considered. The private company would be responsible for operation and maintenance of the facility.
Services should be provided at a fee and these fees should be used to maintain the facility. Residents observed
that the CDC did not have the capacity to manage public sanitation facilities. Alternatively the responsibility for
the management of the communal ablution facilities should be transferred to LWSC.
Population
One of the complexities regarding confirmation of the population is the definition of the LWSC supply area in
terms of the Chirundu Town boundary, which is still in slight doubt due to surrounding customary land. This is
further complicated by the recent establishment of the Chirundu District Council, which used to be part of the
Siavonga District Council (and similarly the water utility used to be Southern Water and Sewerage Company).
Since the Chirundu District Council did not exist at the time of the Census 2010, where relevant, the population
growth will be compared to Siavonga District Council. This is compounded by the uncertainty of the future
development plans for the town.
LWSC estimates the number of households in Chirundu Town is about 2,500 (2013 estimate), with 6 people per
household, which equates to about 15,000.
The Census 2010 data for Chirundu Town provides a population of 14,834 people in the urban area. This
indicates that the LWSC population estimate for 2013 is lower than the census data. Therefore there is some
doubt regarding the exact population in Chirundu Town. For the purposes of the Feasibility Study the census
population data will be used.
Two District Councils that border Chirundu District, Siavonga and Kafue, have growth rates of 4.4% and 4.2%
respectively. Since it can be expected that the Chirundu District will have similar growth characteristics, the
figure for Siavonga (4.4%) has been used to determine future population. This population growth is higher than
the Zambia average growth rate of 2.8%, but this is justified due to a number of significant changes in Chirundu
Town that has already and will continue to contribute to future growth. Three key factors in particular have
contributed to this increase:
The construction of a ‘one-stop’ border facility with Zimbabwe has seen an increase in the number of
passenger and goods transports passing through the border and a corresponding increase in the
number of local residents serving border patrons.
The establishment of Chirundu as an independent district has required the creation of local district
offices, with a significant number of government officials moving to the town to take up positions.
Given its proximity to national protected wildlife areas, Chirundu is increasingly being seen as a good
tourist destination, particularly as the area becomes more developed.

Chirundu WSS Feasibility Report Page 41 of 209
Along with the new district status come significant plans for development of land, which has made Chirundu an
attractive destination for investment, particularly given its short distance to Lusaka and relative low cost of land.3
The last point is particularly important in the context of the CRIDF project: land use plans for new district
developments are currently being finalised and include provision for, among others, mixed-income residential
use, schools and churches, and light industrial use. The planned area to be developed is around 600 ha in
size.4 While the timeline for these developments is not yet known, they are expected to result in further, large
increases to the local population.
The population figures drawn from the 2010 census were before the town became a ‘one-stop’ border post and
before Chirundu district was created. Both of these occurrences have according to the LWSC and District
Council representatives, resulted in a rapid increase in Chirundu’s population over the past few years.
Table 1 provides the population estimate for Chirundu Urban Area. LWSC has 928 connections in Chirundu,
which they estimate is about 45% of the households within their mandated area. This would equate to a total
household number of 2,062 houses – or a population of 10,517 people (using the 2010 Census people per
household of 5.1). Comparing this population estimate, with the estimate in Table 1, it can be concluded that
the Chirundu urban area from the Census includes some customary land. However, because it is expected that
in the near future the LWSC supply area will be increased to incorporate a large number of additional people
from the customary land or peri-urban areas around Chirundu Town, it is recommended that the population
estimate is adequate for initial water supply and sanitation interventions in Chirundu.
LWSC and the Chirundu District Council should monitor the actual population growth and plan for
implementation of the required infrastructure in shortly before reaching the previous phase design population.
Table 1 Population Estimates for Chirundu
Unit 2010* 2016 2021 2026 2036
Chirundu urban areas No. 14,864 19,246 23,869 29,604 45,535
Households No. 2,915 3,774 4,680 5,805 8,928
Source: CRIDF (2016); Zambia Census 2010*
3 Interview with CDO
4 Difficulties in obtaining approval from local chiefs has resulted in this number potentially being reduced in the short term.

Chirundu WSS Feasibility Report Page 42 of 209
Technical Assessment
Introduction
The findings of the Social Assessment have identified a number of issues that need to be addressed in
Chirundu border town. These can be summarized as follows:
The current system is not able to meet the current water supply demand due to inadequate water
production capacity, which includes abstraction, filter, transmission line and storage reservoir capacity.
The distribution network is not servicing the full customer base. The Chirundu border community is
growing very rapidly due to enhanced status of “one stop border facility”.
The transient travelling population require improved water supply and sanitation services. The sanitation
facilities provided by the Chirundu district council are time limited and in a poor condition.
The existing sewerage system is not operational, but could be incorporated into the future sanitation
technology mix.
In order to mitigate the lack of capacity of the system the following interventions are proposed:
Rehabilitate raw water pipeline from abstraction pontoon
Upgrade the treatment capacity.
Increase storage capacity
Increase booster pump capacity (pumps and pipes)
Upgrade bulk pipelines
Introduce bulk metering
Increase distribution network significantly
Refurbish the sewer system and connect high consumption water users
It was observed that water production and treatment could be improved using (and upgrading) the existing water
supply assets.
Based on the requirements for improved water supply and sanitation in Chirundu, the technical assessment will
review the existing water supply and sanitation infrastructure, estimated water demand, water resource options,
the water treatment infrastructure, the distribution system and sewerage management.
Existing Water Supply and Sanitation Infrastructure
Water Supply Infrastructure
The existing water supply system in Chirundu is of a conventional design suitable for a small urban community.
The LWSC was able to provide the pipe network superimposed on a Google Earth map, although the map only
shows bulk pipelines, with much of the small diameter pipes not included. The provided mapping is shown in
Figure 5.

Chirundu WSS Feasibility Report Page 43 of 209
It is recommended that a complete and calibrated network model be setup as part of the detailed design,
including provision of record drawings.
Figure 5 Existing Water Infrastructure
The water supply system comprises of the following basic components:
Main Treatment Train:
o A floating intake on the Zambezi River and raw water pumping main.
o A Water Treatment Plant
o Pump station
o An 80 m³ over Head (Backwash) Tank at the Water Treatment Plant (WTP).
ZRA Treatment Train:
o A floating intake on the Zambezi River and raw water pumping main.
o A Water Treatment Plant, comprising settling tank and filters at different locations
o Pump station
A gravity fed distribution system supplying of the treated water to the border and another 50 m³
Overhead tank within the town.
Metered household standpipe connections (Figure 6)
9 No. Water kiosks
ZRA Overhead tank and distribution network
The Apollo Borehole System (minor system)
Privately owned boreholes
A full description of the existing water supply system is provided in Annex B.

Chirundu WSS Feasibility Report Page 44 of 209
Figure 6 Metered connections
Sanitation Infrastructure
There is no existing public sewerage system, although there are abandoned sewer oxidation ponds and three
sewer pump stations. No detail was available of the pipeline routes.
Therefore the Chirundu population use on-site sanitation solutions, pit latrines (Figure 7) of varying levels of
improvement and a small number of septic tanks, with the practice of open defecation still prevalent.
Figure 7 Onsite Sanitation
In addition to the privately owned system, the Chirundu District Council owns two communal ablution blocks,
one along the main road towards the border post and the other close to the market. The one at the market has
been closed. The ZRA also operates two ablution blocks within the One-Stop Border Post area, one with
showers, toilets and wash hand basins, while the other only has toilets and wash hand basins.
A full description of the existing sanitation system is provided in Annex B.
Water Demand
LWSC indicates that they are currently supplying approximately 2,000 m³/d to Chirundu consumers (1,400 m³/d
from Chirundu Main Plant – although only half of this volume is treated and 600 m³/d from the ex-ZRA system,
therefore total treated volume of water that can be supplied to Chirundu is estimated as 1,300 m³/d).
Considering the reported 2,062 houses (928 connections with 45% connection coverage) currently supplied by
LWSC and 60 commercial connections, it is difficult to reconcile this volume of water produced to the
consumption. This could be due to:

Chirundu WSS Feasibility Report Page 45 of 209
Large water losses in the system
There are more consumers obtaining water from the LWSC system, either legally or illegally.
There are a number of high consumption users, e.g. the one-stop border post, which should be
taken into account separately in the water demand.
Unfortunately the current supply system has insufficient bulk metering and the percentage of metered
consumers is estimated at only 45%. For this reason a water balance across the system cannot be done and
identifying the non-revenue sources is currently not possible.
In an attempt to balance the water demand the following assumptions have been made:
The water loss in the system is 50%
The split between High Cost, Middle Cost, Low Cost, Low Cost (Kiosk) is 30%, 30%, 25%, and 15%
respectively.
The average water use per High Cost, Middle Cost, Low Cost, Low Cost (Kiosk), is 150, 100, 40
and 25 l/person per day.
The balance of the water is used by Institutional and Commercial users.
Based on these assumptions, and using the LWSC population estimate for 2016 and thereafter the Census
2010 population estimate from Table 2 (assuming that by 2021 the entire Chirundu Town will be supplied by
LWSC), the Water Demand for Chirundu has been estimated.
Table 2 Water Demand Estimate for Chirundu
% Housing
Type
Per Person
Demand 2016 2021 2026 2036
l/person/day m³/d m³/d m³/d m³/d
High cost 30 150 473 1074 1332 2,049
Medium cost 30 100 316 140 888 1,366
Low cost (formal) 25 40 105 239 296 455
Low cost (kiosk) 15 25 39 90 111 171
Total 100 933 1,543 2,627 4,041
Commercial / Institutional 67 110 187 288
Total Supply 1,000 1,653 2,815 4,330
System Water Loss 50% 35% 20% 15%
Total Treatment 2,000 2,543 3,518 4,980
The current treatment capacity is about 1,300 m³/d; therefore an upgrade is necessary to meet even the existing
demand. At the same time as increasing the treatment capacity, it is recommended to improve the bulk
metering and the reduction of the system water losses. This will provide information to LWSC to enable them to
do better planning of the future requirements of the Chirundu Water Supply System.

Chirundu WSS Feasibility Report Page 46 of 209
Water Resources Assessment
Introduction
This section presents the findings of the rapid water resources assessment study for the Chirundu Border Town.
The objectives of the study were to:
Conduct a rapid water resources assessment (quantity and quality for both surface and
groundwater) to determine sustainable source of water for the project;
Recommend mitigation measures for the water pollution if it exists;
Determine the current and projected future climate and water vulnerability of the project site
including the specific climate impacts and recommend strategies that will reduce the identified
vulnerability and increase the resilience of the beneficiaries;
Assess any water use entitlements required to ensure regulatory compliance – including permits or
general authorizations needed for abstraction.
Chirundu Border Town has historically depended on the Zambezi River as the main water source. The water is
supplied by the Lusaka Water and Sewerage Company (LWSC) which operates two conventional water
treatment plants located both downstream and upstream of Chirundu.
In principle, there are two other surface water bodies that could supply water to the Chirundu Border Town and
these are the Lusitu River, located about 12 km south of the border town as well as the Kafue River which is
located north of the Chirundu Border Town. Furthermore, water could also be supplied from the ground water
aquifers.
Water Availability
The Chirundu border town is on the banks of the Zambezi River. The Zambezi watershed has a total catchment
area of approximately 1.37 million km² and covers eight different southern African countries. Rainfall within the
Zambezi Basin plays a major role in the water availability in the basin. The Kafue River and the Lusitu River are
tributaries of the Zambezi River. There are also a number of streams rising from the mountains between Lusitu
area settlement and Chirundu Border Town. These streams are predominantly ephemeral in nature,
discharging into the Lusitu, Kafue or Zambezi Rivers.
Rainfall Pattern
At a regional scale, Chirundu Border Town falls within the Zambezi River Basin, which receives a mean annual
rainfall of 950 mm or 1,300 km3 of water
5. Rainfall variability from year to year is considerable in the region and
this leads to big differences in total run-off from year to year, estimates varying from some 500 km3 in the
wettest years to only 100 km3.
5 Mott MacDonald. 2007. Integrated Water Resources Management Strategy for the Zambezi River Basin, Gaborone

Chirundu WSS Feasibility Report Page 47 of 209
On the local scale, the annual rainfall is less than 800 mm/yr. The mean annual rainfall recorded at Chirundu
station was 678 mm, and that at Kariba station (59 km south) was 767 mm6. High evapo-transpiration is
dominant in the area. Monthly evapo-transpiration (ETo) exceeds rainfall in all but three months (Dec-Feb) of
the year, and exceeds the effective rainfall in these three months6.
The Lusitu River
The Lusitu River is located some 12 km south of the Chirundu Border Town in the Lusitu settlement area. The
Lusitu River like most of the streams in the area is dry for the most part of the year. This is supported by GRZ 7
that observed that the majority of the streams in the Lusitu Settlement area are dry most of the year except for
the Kafue and Zambezi Rivers which border the district.
In addition, the decision by the Government to abstract water from the Zambezi River for the Lusitu Irrigation
Scheme instead of the Lusitu River further augments the variability of the water in the Lusitu River. The
Government is implementing the Lusitu Irrigation Scheme consisting of pump stations, irrigation equipment,
reservoirs and irrigation fields to be developed on 210 ha of land targeting smallholder farmers (individual farm
plots of 1 ha or less); small-scale commercial farmers (farm plots of between one and five hectares), and large
plots of at least 60 ha each under centre-pivot irrigation operated by a private company that will eventually be
wholly owned by the community6. Figure 8 shows the dry river bed of the Lusitu River.
Figure 8 The Lusitu River as seen from the Lusitu Bridge in March 2016
6 GRZ. 2015. Environmental and Social Impact Assessment: Irrigation Scheme in Lusitu in Chirundu District, Ministry of
Agriculture and Livestock, Lusaka 7 GRZ. 2010. Resettlement Policy Framework: Final Draft, Ministry of Agriculture and Cooperatives, Lusaka

Chirundu WSS Feasibility Report Page 48 of 209
Source: CRIDF (2016)
GRZ estimated the annual water requirement for the Lisutu Irrigation scheme to be 3,212,000 m3. This annual
water requirement for the Scheme is at least 4 times more than the annual volume of water currently supplied
by LWSC to Chirundu Border Town.
It is therefore concluded that Lusitu River cannot provide water to Chirundu Border Towns at the required
quantities because the river is dry for most of the year.
The Kafue River
The Kafue River is located at least some 10 km north of Chirundu Town. It stretches for about 1,576 km from its
source on the Zambia-Democratic Republic of Congo border, in the northwestern region, and its confluence with
the Zambezi River, traversing through the Copperbelt, Central, Southern and Lusaka provinces8. The Kafue
River discharges 10 km3/yr
9 or 1 x 10
10 m
3/yr of water at the confluence with the Zambezi River. Box 1 presents
some facts on the Kafue River Basin as summarized by Matiza et al. (1995) and WHO (1995) and reproduced in
Kambole (2003).
8 Kambole, M. S. 2003. Managing the Water Quality of the Kafue River. Physics and Chemistry of the Earth.
Elsevier 23, p1105-1109
9 http://www.fao.org/docrep/w4347e/w4347e0o.htm Accessed 17.05.2016
Box 1 - Basic Facts about the Kafue River Basin
Total area coverage of basin 152,000 km2.
Mean annual runoff 350 m3/s or 3.02 x 10
7 m
3/day.
Area coverage of the Kafue River Basin represents approximately 20 percent of Zambia’s
total land area (752,000 km2).
Source of portable water for approximately 40 percent of the Zambian population in 1995.
Host to the Kafue Gorge Hydroelectric Power Station that generates about 60 percent of
Zambia’s electricity supply.
Supports and sustain vital ecological systems like wetlands, game reserves, bird sanctuary,
etc.
Provided for daily water demand of 42,228,650 m3/day or 4.22 x 10
7 m
3/day to holders of
130 water abstraction rights in 1995 out of which 14,515,200 m3/day (1.45 x 10
7 m
3/day) or
approximately 34 percent was used for hydroelectric generation.
Source: Adapted from Kambole (2003)

Chirundu WSS Feasibility Report Page 49 of 209
Applying the discharge of the Kafue at the confluence with the Zambezi River (1.0 x 10¹⁰
m3/yr), therefore, the
available water in the Kafue River at the point of discharge into the Zambezi River (Kafue River and Zambezi
River confluence) is more than 10,000 times the current volume of water supplied to Chirundu Border Town by
the LWSC (7.3 x 10⁵ m
3/yr). Therefore, the Kafue River could be an alternative source of water supply to the
Chirundu Border Town in respect to the quantities of water available in the surface waterbody.
The Zambezi River
The Zambezi River is located to the east of Chirundu Border Town and flows in the south-north direction.
Chirundu Border Town has historically depended on the Zambezi River for its source of water supply from two
abstraction points which are located upstream (southeast of Chirundu Border Town) and downstream (northeast
of Chirundu Border Town). Each of these intake points pumps water to separate water treatment plants. A total
of about 2,000 m3 of water is supplied from the two water treatment plants to the Chirundu Border Town.
The Zambezi River Basin covers a total catchment area of catchment area of some 1.37 million square
kilometres and the basin as a whole receives a mean annual rainfall of about 950 mm (Mott MacDonald, 2007).
Historical discharge records at Chirundu bridge indicate peak flows ranging from 5,000 m3/s to 7,000 m
3/s while
minimum flow are as low as 450 m3/s (GRZ, 2015). In comparison to the historical flow regime, the recent
hydrographs (1993 to 2012), showed that peak flows ranged from 4,200 m3/s to about 7,000 m
3/s, thereby
indicating that the flows on the Zambezi River between Kariba Dam and Chirundu have also been consistent
over the years (GRZ, 2015).
In terms of water availability, Zambezi River consistently provided water for different users along its length and
the GRZ (2015) computed Flow Duration Curve (FDC) showed that for 95 percent of the time, the river carries
490 m3/s (42,336,000 m
3/day) and for 50 percent of the time the flow was above 1000 m
3/s (86,400,000
m3/day). Therefore, even at 95 percent of the time, water availability in the Zambezi River is 60 times more than
the total water supplied by LWSC to Chirundu Border Town.
Nonetheless, Mott MacDonald (2007) computed the mean annual runoff at the Chirundu Bridge to be 4.44 x
1010
m3/yr. The mean annual runoff at the Chirundu Bridge is therefore 60,000 times more than the annual
quantities of the water supplied to the Chirundu Border Town.
Therefore, the Zambezi River will continue to be the most reliable source of water supply to the Chirundu Border
Town, both in terms of the water availability as well as the close proximity to the border town. The upstream
water intake is located approximately 300 m from the ex-ZRA Water Treatment Plant (although the plant has
two separate treatment plants, one for sedimentation, one modified for filtration) while that on the downstream is
located some 1 km to the Main Water Treatment Plant.
Water Quality
The flows on the Zambezi River downstream of the Kariba Dam are mainly outflows from the dam and are
regulated. The flows therefore represent a combination of turbine and spillway discharge. For the purposes of

Chirundu WSS Feasibility Report Page 50 of 209
this assignment, water quality sample compliance monitoring analyses from the Lake Harvest Aquaculture
(LHA), a fish farm located on Lake Kariba on the Zimbabwean side were used (see Table 3).
Table 3 Water quality in the Kariba Dam at LHA
Parameter Results Environmental Agency of
Zimbabwe standards
Decision
1. Temperature (°C) 27.6 Less than 35 Blue, complies with standards
2. pH 7.42 6-9 Blue, complies with standards
3. Do (mg/l) 3.8 Greater or equal to 60% Blue, complies with standards
4. Turbidity (NTU) 0.0936 Less or equal to 5 Blue, complies with standards
5. Conductivity (µS/cm) 84.0 Less or equal to 1000 Blue, complies with standards
6. BOD5 (mg/l) 0.0038 Less or equal to 30 Blue, complies with standards
7. NH4-N (mg/l) 0.019 Less or equal to 10 Blue, complies with standards
8. Total nitrates (mg/l) 0.353 Less or equal to 10 Blue, complies with standards
9. Total phosphates (mg/l) 0.043 Less or equal to 0.5 Blue, complies with standards
Source: Adapted from IESTO (2012)10
Therefore, based on the water quality analysis of water samples collected from Lake Kariba by Lake Harvest
Aquaculture, it can be expected that the water quality in the Zambezi is good, as the results did not present any
constraints to its availability for domestic consumption downstream. Note that turbidity results from Lake Kariba
are not expected to be applicable to the Zambezi at Chirundu, as there will be some suspended solid increase
after the lake, especially during high flow periods.
Groundwater Resources
Three major hydrogeological units in the Zambezi River Basin are distinguished, namely the:
Kalahari sands;
Dolomites, quartzite, shales and sandstone, and
Basement granites and gneisses.
According to Mott MacDonald (2007), important aquifer types in the basin included intergranular aquifer that
was well represented by the Kalahari sand aquifer as well as the alluvial aquifers. These aquifers were mostly
high yielding with great potential for large scale use. In addition to the Kalahari sand aquifer, Karoo deposits
were also intergranular aquifers but these were mainly poor yielding aquifers although occasionally they had
high secondary porosity or faulting that resulting into moderate to high yields.
10 IESTO. 2012. Lake Harvest Limites Siavonga Aquaculture Project Environmental Social Impact Assessment (EIA)
Report, Institute for Eco-Development Strategies and Toxicology (IESTO), Lusaka

Chirundu WSS Feasibility Report Page 51 of 209
Dolomite, sandstones and limestones aquifers predominate in the Kafue sub-basin and the potential of these
aquifers was good particularly in the presence of extensive secondary porosity (Mott MacDonald, 2007). Other
aquifers of the Zambezi River Basin included:
Crystalline formation or basement formation aquifers – the largest aquifer system of the Zambezi
River Basin – where groundwater flows was predominantly in fissures, channels or discontinuities;
Sedimentary formation of sands, silts and clays aquifers were common particularly in lower sections
of the basin, Zambezi delta, and along the main river channels and flood plains, and
Aquifers composed of sandstones, marine sandstones, mudstones, siltstones and shales and these
are located in old valleys and depressions.
Overall groundwater yield potential in the Zambezi River Basin ranged from 1-2 l/s to 40-80 l/s. Basement
aquifers yielded between 1 l/s to 2 l/s; yields from alluvial aquifers were up to 10 to 15 litres per second while
those from dolomite aquifers ranged from 40 l/s to 80 l/s (Mott MacDonald, 2007). Therefore, Mott MacDonald
(2007) concluded that the groundwater potential of the Zambezi River Basin, targeting large water use such as
irrigation, was moderate to low but occasionally high especially in alluvial aquifers along the main river reaches
as well as Karst aquifers that had high secondary porosity. Other aquifers with considerable potential were the
basement aquifers that had extensive faulting despite these being localized systems and only present in few
areas across the basin.
Projected future climate and water vulnerability
The main threats to water availability for the Chirundu Border Town are the stresses that would affect the
Zambezi River Basin (ZRB). These stresses included the droughts resulting from below average rainfall as well
as demand from competing users within the ZRB. The occurrence of these droughts, their frequency and
magnitude over the coming decades both spatially and in time, would affect the mean annual flows in the
Zambezi River and would primarily be due to water supply (because of climate change). Furthermore, growth in
population and economic activities as well as agricultural activities (particularly expanded irrigated agricultural
activities) within the ZRB over the coming decades would increase water usage as the result of water demand.
Beck and Bernauer 11
showed that while climatic changes were likely to have only relatively small effects on
water availability in the Zambezi River Basin, population and economic growth coupled with expansion of
irrigated agriculture and water transfers were likely to have very important transboundary impacts. Such impacts
involved drastically reduced runoff in the dry season at key locations and changing (relative) shares of ZRB
countries in the basin’s total runoff and water demand.
Although the regional average annual rainfall is quiet high in the ZRB (approximately 950 mm), it is distributed
very unevenly across the basin with the southern and western parts of the basin receiving much lower rainfall
than the eastern and northern parts. Moreover, the more densely populated areas are located within the
11 Beck, L and Bernauer, T. 2011. How Will Combined Changes in Water Demand and Climate Change Affect the Water
Availability in the Zambezi River Basin? Global Environmental Change, 21(3), 1061-1072

Chirundu WSS Feasibility Report Page 52 of 209
medium and low rainfall areas and this asymmetry between water availability and population density would
become even more pronounced in the future (Beck and Bernauer, 2011).
Water consumptive uses in the Zambezi River Basin were estimated to be between 15-25 percent of total runoff
(Mott MacDonald, 2007 and SADC-WD, 200812
). Dams and agricultural lands are the largest consumptive water
users, through evapotranspiration from impoundments and irrigated agricultural land, respectively. Evaporation
through impoundments accounts for approximately 13 km³ per annum while agricultural irrigated lands accounts
for about 1.5 km³ per year (Beck and Bernauer, 2011). By 2025, SADC-WD (2008)12
projected that the
consumptive uses of the water in the ZRB would reach up to 40 percent of the total runoff. Beck and Bernauer
(2011) observed that the projected massive increase in consumptive water uses might become a source of
conflicts among the ZRB riparian countries.
Therefore, in order to understand the effect of water demand and climate change on water availability in key
areas of the ZRB, Beck and Bernauer (2011) developed a model consisting of two components namely: a
hydrological model that mimicked the natural process and the demand model that represented water demand
based on actual water use and water use projections. Three scenarios were therefore derived based on
particular combinations of water demand and climate change projections for 2050 namely: Scenario 1 which
was based on minor changes in demand; Scenario 2 was based on moderate changes in demand and supply,
and Scenario 3 which was based on strong changes in demand and supply.
The results of the models by Beck and Bernauer (2011) under Scenario 1 showed the 9 percent reduction in
runoff of the Kafue sub-basin compared to 4 percent for the whole ZRB (with 5 percent at the end of ZRB at the
delta). Similarly, Scenario 2 showed all sub-basins experiencing a general drastic reduction in the runoff,
averaging 31 percent although the reduction in the runoff at the delta was 17 percent of the annual flow
compared to the year 2000. Reduction in runoff of the Kafue sub-basin was also 31 percent. Furthermore, the
Scenario 3 had extremely negative effects on annual flows in all the sub-basins were on average there was a
reduction in runoff by 77 percent. The annual flows in the Kafue sub-basin reduced by 85 percent while the
runoff at the delta also reduced by 47 percent which also signified severe losses.
Table 4 shows the mean annual flows (m3/s) for the 13 sub-basins, indicating total river flow at the end of each
sub-basin for the year 2000 and under the three scenarios in 2050.
The decreases in mean annual flows under Scenario 2 and Scenario 3 were even more extreme when focused
on the dry season. It was evident from the model that several of the sub-basins could have their water flows
reduced to nil even under Scenario 2. Overall, the dry season average mean annual water flows for the 13 sub-
basins was reduced to 10 percent under the Scenario 1, 69 percent in Scenario 2 and 95 percent in the
Scenario 3 (Beck and Bernauer, 2011).
12 SADC-WD, ZRA, SIDA, and DANIDA. 2008. Integrated Water Resources Management Strategy and Implementation
Plan for the Zambezi River Basin, SADC, Gaborone

Chirundu WSS Feasibility Report Page 53 of 209
Table 4 Mean annual flows for the year 2000 and Scenarios in 2050
Sub-basin Year 2000 Scenario 1 Scenario 2 Scenario 3
MA
flows§
Dry
flows
MA
flows
Dry
flows
MA
flows
Dry
flows
MA
flows
Dry
flows
1. Delta 2597 2126 2457 1964 2162 1542 1383 462
2. Tete 1729 1457 1682 1397 1464 1069 834 105
3. Shire 445 279 354 181 307 110 165 0
4. Mupata 1248 996 1188 873 818 514 23 0
5. Luangwa 489 87 485 82 431 0 250 0
6. Kariba 929 748 898 687 598 405 0 0
7. Kafue 273 159 248 131 187 61 62 30
8. Cuando Chobe 32 26 31 24 0 0 0 0
9. Barotse 1007 204 1002 198 720 0 149 0
10. Luanginga 58 15 58 14 34 0 0 0
11. Lunge Bungo 263 124 263 123 235 84 152 28
12. Upper Zambezi 253 34 252 33 186 0 0 0
13. Kabompo 82 3 82 2 70 0 8 0
§MA flows = Mean annual flows
Source: Adapted from Beck and Bernauer (2011)
Effects of reduced flows on aquatic environment as well as the environmental flows were projected to be more
adverse on the Kafue sub-basin. Required minimum environmental flows in the Kafue sub-basin were estimated
by Denconsult (1998) to be 250 m³/s during the low flow season (Beck and Bernauer, 2011). Unfortunately, the
minimum environmental flows in the Kafue River Basin were never achieved. This, however, was in contrast to
the minimum environmental flows at the Zambezi Delta which were met in all three scenarios. Minimum
environmental flows at the delta were recommended by SADC to be 250 m³/s (Dencosult (1998) as cited by
Beck and Bernauer, 2011.
One of the significant finding by Beck and Bernauer (2011) was that the general effect of increasing water
demand were clearly greater than the projected effects of the climatic change. As such, effective governance
mechanisms for water allocation and for dealing with flow variability should be set up within the next few years
in order to manage the situation cooperatively.
Water use entitlements
The Water Resources Management No. 21 of Act of 2011 is the principle law governing water resource
planning, development and management in Zambia. The Act established the Water Resources Management
Authority (WARMA) whose main functions included ‘…to promote and adopt a dynamic, gender-sensitive,
integrated, interactive, participatory and multi-sectoral approach to water resources management and
development that includes human, land, environmental and socio-economic considerations, especially poverty

Chirundu WSS Feasibility Report Page 54 of 209
reduction and the elimination of water borne diseases, including malaria’. Specific aspects of the Act that relate
to the Chirundu Water Supply Project could be found under Part VII, VIII, IX, XI and XII.
Part VII relates to the management of shared water courses and water resources and enforces the need to
retain territorial sovereignty over water resources whilst upholding rights and obligations arising from treaties,
conventions, agreements or declarations relating to shared water courses to which Zambia is State Party and
the same time safeguarding basic principles and rules of international law as contained in treaties, conventions,
agreements or declarations the country is Sate Party.
Part VIII prescribes core principles fundamental to water uses and further provides guidelines on the uses. The
Act also provides for the allocation of water and prioritizes its uses as well as stipulating regulations for use of
water.
Part IX mandates WARMA as an oversight authority to input on any planned activities within a catchment and /
or on, or along a water resource. In addition, the Act also provides for activities that require permits as well as
those activities that are exempt from permitting. Procedures for applying for permits are also outlined.
Finally, Part XI deals with groundwater and boreholes while Part XII regulates water works. The Chirundu Water
Supply Project when implemented will involve abstraction of water directly from the Zambezi River and that
would require a water right. Therefore, LWSC will need to ensure that necessary permits and licenses regarding
the water right are obtained.
Water Resource Assessment - Conclusions
Water supply for the Chirundu Border Town has historically been provided from the Zambezi River.
Two other surface waterbodies could offer alternative sources of water supplies for the Chirundu Border Town,
namely the Lusitu River and the Kafue River.
The Lusitu River is located some 12 km south of the Chirundu Border Town, however cannot offer sustainable
sources of water supply to the Chirundu Border Town due to the low flow in the river. The river only flows
during the rainy season.
Groundwater supplies have never been considered because of the availability of good quality water from the
Zambezi River throughout the year. Although good groundwater sources are available within the Zambezi River
Basin and could possibly provide water for the Chirundu Border Town. Groundwater potential for large water
uses such as irrigation were reportedly moderate to low although occasionally high particularly in alluvial
aquifers as well as Karoo aquifer. Further geophysical work would need to be undertaken to assess the
potential and position of high yielding aquifers. Therefore groundwater is not seen as a viable option considering
the availability of water in the Kafue and Zambezi Rivers.
Although the Kafue River currently has sufficient water to supply the demand, it is disadvantaged because of the
relatively long distance to the border town (~10 km). It is, however, more likely to be affected by both climate
change and increased consumptive uses over the coming decades. Mean annual flows for the Kafue River sub-
basin (Beck and Bernauer (2011)) were expected to be lower than the environmental flows estimated to be 250

Chirundu WSS Feasibility Report Page 55 of 209
m³/s. This, therefore, leaves the Zambezi River as the long-term sustainable source of water supply for the
Chirundu Border Town.
Overall, Zambian laws demand the need to retain territorial sovereignty over water resources whilst upholding
rights and obligations arising from treaties, conventions, agreements or declarations relating to shared water
courses to which Zambia is State Party and the same time safeguarding basic principles and rules of
international law as contained in treaties, conventions, agreements or declarations the country is State Party.
The law also demands for permitting activities that are undertaken within, along or on the water resource.
Water Supply System design
Introduction
The water supply system design combined available information on the existing reticulation with expected future
water demand to develop a feasible engineering design.
There is no Integrated Development Plan (IDP) for Chirundu and there was no town planning available to
understand how the Chirundu town is envisaged to grow and develop. It is, however, understood that the
Chirundu District Council is in discussion with the traditional leaders to acquire more customary land for the
urban centre. The water demand has been based on the incorporation of additional areas by 2021.
Therefore, although it is expected that the supply side information (water demand and treatment) will be
sufficient to accommodate the population growth, there is uncertainty regarding where the development will take
place. It is therefore recommended that the necessary town planning be undertaken to allow for efficient
detailed engineering designs.
The interventions in Table 5 are proposed for Chirundu town, which has taken the condition of the existing
infrastructure, the current capacity and future demand into account.
Table 5 Proposed interventions
Component Existing status Intervention
1. Water Source The Zambezi River This is the existing source and is satisfactory despite high
turbidity at certain times during the year.
2. Water Intake
+ Raw
Pipeline
Floating mechanism, with
makeshift pipe
installations
The existing method of abstraction is a satisfactory and
Climate Resilient solution. However, the system that is
currently in place needs to be upgraded to allow for
improved access to the float and screens before the
pumps.
3 Water
Treatment
Plant (WTP)
Water treatment plant of
conventional design and
basic treatment processes
Upgrade treatment plant in phases to meet the estimated
2036 demand. Connect existing OHT to distribution system
and construct new backwash OHT at WTP.

Chirundu WSS Feasibility Report Page 56 of 209
Component Existing status Intervention
4. Ground Level
Storage
Chlorine contact tank
approx. 120 m³
Capacity can be increased to provide 24 hours storage
based on current demand. Future phases should provide
additional storage capacity to match demand.
5. High Level
Distribution
system
storage
50 m³ OHT in system Upgrade to 3 h system storage
6. Distribution
System
Branch Main, Gravity Flow Upgrade bulk pipelines and increase distribution capacity
within the network.
Design criteria for the proposed water supply system
Four distinct components of the water supply system need to be upgraded, namely:
Water abstraction system;
Water Treatment
Storage facilities; and
Distribution system.
The design philosophy of ‘Low Mechanical Content’ LMC is incorporated throughout the designs for both water
supply and sewerage projects, but due to the rolling hill topography of Chirundu there is a requirement for some
mechanisation within the system.
The population projection for Chirundu District by 2036 is 45,535 people (Table 1). The average daily demand
of water for Chirundu District by 2036 is 5,094 m³/d, inclusive 15% UFW reduced from the current 50% UFW
(Table 2).
The feasibility design included calculating the water demand during the interim years to 2036 in order to
understand the current system and to propose rehabilitation/expansion works to meet future needs of the town
in a phased approach.
LWSC, ZEMA requirements together with national/regional regulations and international standards have been
the basis for the water and sanitation conceptual designs. The main design criteria adopted is shown in Table 6,
which is recommended as the basis of future phases to provide consistency within the water supply system.
Table 6 Water design criteria
Item Component of the
system
Proposed Design Currently available
1.a. Intake [Flow] Floating Intake – Climate Resilient and animal
resilient at existing up-stream location.
Pump Capacity 260l/s (16 h pumping)
16l/s [60hp]

Chirundu WSS Feasibility Report Page 57 of 209
Item Component of the
system
Proposed Design Currently available
+ Stand-by Pumps + Stand-by Generator
1.b. Raw Water Pipe Flow
(2036)
936 m³/h (based on peak day and 16 h of
functioning including losses)
36m³/h
1.c. Raw Water Pipe Static Vertical Lift. Source to WTP
50 m
50m
1.d. Raw Water Pipe 450mm dia 200/90mm dia
2.a. Water treatment plant
(2036)
5,094 m³/day - designed to produce this
assuming a 16 hour working day [allowing for
backwashing/breakdowns, etc.]
4 stage treatment to Zambian Water Quality
Standards.
1,300 m³/day
4 stage treatment
3.a. Treated Water Storage
Reservoir
Upgrade Reservoir with 12 hour storage
capacity 4,000 m³ (1.5 x avg demand).
Material/construction to be evaluated at
detailed design stage.
3.b Ditto at Water
Treatment Plant
Introduce a backwash overhead tank to replace
already existing which will become a system
OHT.
4.a. Outlet Pipe /Ring Main Flow 630m³/h based on “peak hourly flows” -
b. Outlet Pipe / Ring Main 600 mm HDPE Various, HDPE
5. System Overhead Tank
[OHT]
New 3 hour capacity OHT within the distribution
system.
6. Bulk/DNI Zone Meters Electromagnetic meters powered with Long Life
Battery including Built in GSM Modem for
wireless communication.
7. Customer Meters As existing LWSC specification
8. Network 200mm – 75mm 110mm – 63mm
b. Flow of distribution
main
Peak hour flow -
c. Pressure in the network 6 bar maximum at public tap -
d. Velocities in the
network
0.5 to 2.0 m/s Less than 0.5 m/s
e. Minimum diameter of
distribution pipes
75 mm 63mm
f. Minimum diameter of
connection pipes
20 mm 20 mm
g. Distribution Pipework uPVC Various.
h. Fire Hydrants To Fire Brigade Specifications
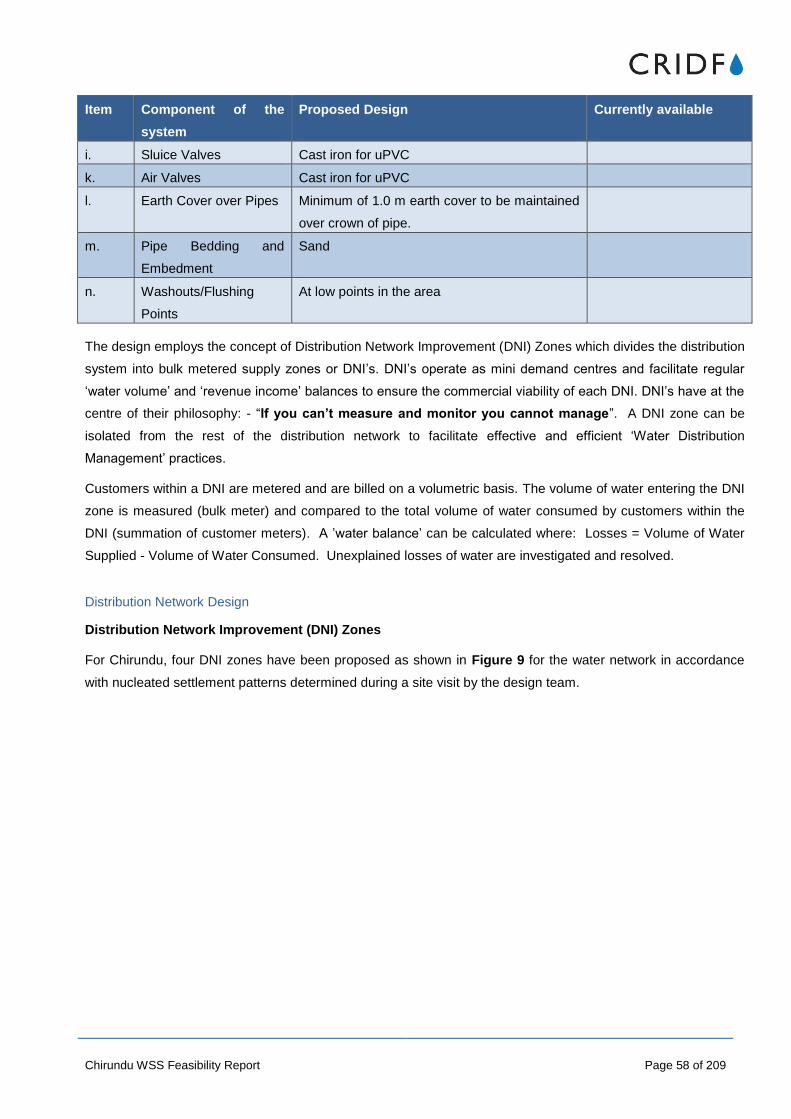
Chirundu WSS Feasibility Report Page 58 of 209
Item Component of the
system
Proposed Design Currently available
i. Sluice Valves Cast iron for uPVC
k. Air Valves Cast iron for uPVC
l. Earth Cover over Pipes Minimum of 1.0 m earth cover to be maintained
over crown of pipe.
m. Pipe Bedding and
Embedment
Sand
n. Washouts/Flushing
Points
At low points in the area
The design employs the concept of Distribution Network Improvement (DNI) Zones which divides the distribution
system into bulk metered supply zones or DNI’s. DNI’s operate as mini demand centres and facilitate regular
‘water volume’ and ‘revenue income’ balances to ensure the commercial viability of each DNI. DNI’s have at the
centre of their philosophy: - “If you can’t measure and monitor you cannot manage”. A DNI zone can be
isolated from the rest of the distribution network to facilitate effective and efficient ‘Water Distribution
Management’ practices.
Customers within a DNI are metered and are billed on a volumetric basis. The volume of water entering the DNI
zone is measured (bulk meter) and compared to the total volume of water consumed by customers within the
DNI (summation of customer meters). A ’water balance’ can be calculated where: Losses = Volume of Water
Supplied - Volume of Water Consumed. Unexplained losses of water are investigated and resolved.
Distribution Network Design
Distribution Network Improvement (DNI) Zones
For Chirundu, four DNI zones have been proposed as shown in Figure 9 for the water network in accordance
with nucleated settlement patterns determined during a site visit by the design team.

Chirundu WSS Feasibility Report Page 59 of 209
Figure 9 Chirundu DNI zones
The DNI zones are in no order of service provision but rather by land area usage, facilitating a means of water
balancing within the demand service areas. The DNI’s are described in Table 7 below.
Table 7 DNI Zone Description and Components
DNI Description Components
Zone 1 Residential development area
43% of population, Low - Medium
density residential
Unserviced traditional land
Hospital, School,
Transit vehicles
Zone 2 Residential development area Chirundu business market in built up
area
32% of population medium – high
density residential
Transit vehicles
Zone 3 Residential development area 25% of population, Low density
residential
Small holding and tourism (lodges etc.)
Zone 4 Border and Commercial Border, Institutional and Administrative
and Commercial Development area

Chirundu WSS Feasibility Report Page 60 of 209
Development of the Proposed Water Supply system
It is proposed to develop a ring main network comprising a ring mains running along the T2 main road, RD491,
along an unmarked feeder road and back to connect along the T2 main as it feeds the DNI zones via bulk
meters. Water kiosks are proposed to cover all the main low cost residential areas but number and location will
be determined and finalised after consultation with stakeholders at detailed design stage. The layout of the
proposed network is shown in Figure 10.
Figure 10 Proposed Ring Main Layout
Three residential demand centres have been identified comprising the two existing housing areas, and the new
housing development area as shown in Figure 9. An additional DNI Zone 4 covers the border demand together
with all commercial and industrial connections along the T2 main highway.
Peak day and peak hourly demand for each centre was computed by multiplying average daily demand for year
2036 by 1.5 and 3 respectively. The results for the 2036 peak water demand are summarised in Table 8.
Table 8 Chirundu Peak Water Demand by DNI zone for year 2036
Peak Hour Peak day (16 hour pumping)
m3/day m
3/hr m
3/day m
3/hr
DNI 1 5976 249.5 4482 186.8
DNI 2 4482 186.8 3362 140.1
DNI 3 3486 145.3 2615 108.9
DNI 4 994 41.5 497 20.7
Totals 623.1 456.5
Chirundu WSS Feasibility Report Page 61 of 209
The current distribution system has grown from a small network serving a limited number of connections
incorporating private water sources (Apollo borehole) and water supply infrastructure (e.g. ZRA).
The proposed network has been designed to cater for future housing developments through infills and
densification of existing residential areas.
Intake, Treatment and Transmission Mains
Water will be pumped to the WTP from the Zambezi River with pumps mounted on a floating pontoon, i.e. an
upgrade of the existing system, including replacement or twinning of the raw water pipeline.
The raw will be treated through a four stage treatment process comprising flocculation, clarification, filtration and
disinfection. The existing treatment plant is in reasonable condition and therefore the plant only needs to be
upgraded in a phased approach to match the demand.
The treated water will flow into a new 12 h ground storage that will also provide contact time for chlorine
disinfection. The treated water will be pumped to high level storage tanks for gravitation to distribution ring main.
Components of the distribution network will include:
3 No. high discharge raw water pumps and motors with screens, mounted on climate resilient floating
pontoon, well anchored with access from shore.
260 m long, 450mm diameter raw water pumping mains to WTP
3 No. horizontal booster pumps and motors in pump station
568 m long, 400mm diameter pumping mains to high level storage tank
Storage Reservoir
It is proposed to construct a 4,000 m³ ground sectional steel (Braithwaite) reservoir at the water treatment plant,
to cater for 12 hour peak day storage requirements, based on the 2036 peak average water demand. Water will
be pumped to a new 3 hour elevated storage reservoir on an 18 m high tank stand at a high level location as
shown in Figure 10.
Distribution Mains
Water will gravitate from the elevated storage reservoir into a distribution network designed to cater for peak
hourly demand. It has been designed to cater for expected growth up to 2036.
Components of the network include:
6,000 m long, 300 mm diameter class 16 gravity ring mains laid along the T2 and RD491 supplying the
DNI zones via five (5) bulk meters as shown in Figure 10.
Overhead system tank along RD491 before zone 3 bulk meter at the junction of RD491 and the feeder
road.

Chirundu WSS Feasibility Report Page 62 of 209
A 300 m long, 75 mm mains branch continues along the T2 from the junction with RD491 supplying
truck stop owners and Institutional buildings along the T2.
50 m long, 40 mm diameter lateral pipelines supplying the main Market area and Truck stop ablution
blocks. Other locations to be determined after detailed town planning and through stakeholder
consultation during detail design.
Secondary distribution pipelines (not shown) will be laid from the ring mains bulk meter to DNI Zone 1
Secondary distribution pipelines (not shown) will be laid from the ring mains bulk meter to DNI Zone 2
Secondary distribution pipelines (not shown) will be laid from the ring mains bulk meter to DNI Zone 3
80 m long, 250 mm diameter Secondary distribution pipelines will be laid from the ring mains bulk meter
to the Chirundu Border
The design options were limited due to inadequate information and the existing situation and will need an
extended investigation at the detailed design stage. The adopted feasibility design constitutes a ‘preferred
design’, with further detail and motivation provided in Table 9.
Table 9 Summary of Water Supply Technical Considerations
WATER SUPPLY
COMPONENT
WATER SUPPLY
DESIGN OPTION
REMARKS
WATER SOURCE
1 Surface Water
[Zambezi River]
Large prolific source
Raw water quality is good.
Used as source in most of Zambia’s Southern
Province towns.
Appropriate – LWSC have good knowledge base of
source and treatment required.
2 Groundwater Yield is unproven
WATER INTAKE & RAW WATER PIPE
3 Fixed Bankside Not climate Resilient. Production unreliable.
Construction costs are high
4 Floating Intake Climate Resilient. Production Reliable.
Rehabilitation costs – moderate.
As existing system - appropriate technology.
5 Raw Water Pipe The existing varying diameter pipe is inadequate.
The replacement pipe will be in the order of 450mm
diameter.
WATER TREATMENT PROCESS
6 Expand Existing WTP Existing WTP is in good condition and provides a
significant portion of the current demand. Land is
available at the WTP site with parallel trains for
expansion already considered during original

Chirundu WSS Feasibility Report Page 63 of 209
WATER SUPPLY
COMPONENT
WATER SUPPLY
DESIGN OPTION
REMARKS
design. Capital cost is high.
Treated water is to Zambian standards.
7 New Package Plant Can be mechanically complex with high maintenance
cost and reliability issues.
Parallel ‘trains’ easily installed to increase capacity and
is more flexible than concrete structures.
Long term operating success rate is typically low in
similar contexts so ‘appropriateness’ is a factor.
Capital cost is high
Would require a different process or abandoning of the
existing treatment train.
GROUND LEVEL STORAGE
8 12, 18 and 24 Hour
storage
Insufficient storage is a problem with the existing
system and leads to water shortages during power
cuts and mechanical breakdowns.
New reservoir to be constructed and capacity
increased in phases.
Construction to be Steel or Concrete depending on
capital cost and full assessment.
OVERHEAD TANK [OHT]
9 Connect Existing OHT to
distribution system
Low cost option but capacity is small – to supply WTP
surrounding areas.
10 New High Level Storage
with 2, 3, 4, 8 and 12
hour options
Operationally preferred and provides the best level
of service.
Capital Expense is high.
DISTRIBUTIONN NETWORK
11 Branch Main,
Gravity Flow
Incorporating and upgrading the existing system as a
branch of an extended water distribution system with
basic improvements to provide the required safe water.
Limited in design due to inadequate and inaccurate
information on existing distribution pipelines.
12 Ring Main, Gravity Flow
(A)
All Zambian water quality standards and LWSCs
target levels of service are fully met through the
development of an entirely new water reticulation
system using none of the existing infrastructure in
Chirundu.
13 Ring Main, Gravity Flow
(B) - using existing
Provides an in-between scenario under which the
existing system is upgraded to produce Zambian water

Chirundu WSS Feasibility Report Page 64 of 209
WATER SUPPLY
COMPONENT
WATER SUPPLY
DESIGN OPTION
REMARKS
infrastructure. quality standards, but there is not enough information
on the existing infrastructure.
Based on the numbering in Table 9, the proposed system would include 1, 4, 5, 6, 8, 10 and 12 (shown with
bold text in table).
The technical options for all of the Chirundu water supply components follow traditional Zambian design
parameters and lie within the conservative existing design. The only design departure from the existing is in the
configuration of the Distribution system which is designed to introduce commercial practices specifically to
improve services to customers and to support sustainability.
Sewerage and Sanitation Design
The Feasibility Study sanitation and sewerage design is based on a phased approach to the principles of
Decentralised Wastewater Treatment Systems (DEWATS), i.e. the system utilizes various technologies to
satisfy the local economic and social situation. Sanitation in the project area is catered for through a mixed
technology combination of on-site systems (septic tanks, Ventilated Improved Latrines (VIP) and traditional pit
latrines) and a waterborne system.
The proposed sewer network designs are based on the assumption that 70% of the water used within Chirundu
Border post and other high water consumers enters the sewerage system by 2036 and is treated at the existing
(although not operational) Sewage Treatment Ponds.
Proposed On-Site Intervention
The low to medium income residents will be encouraged to use onsite treatment solutions, especially to
construct Ventilated Improved Pit (VIP) latrines instead of simple pit latrines. The basic concept and benefits of
the VIP latrine is shown in Figure 11.

Chirundu WSS Feasibility Report Page 65 of 209
Figure 11 Improved VIP Latrines
It is proposed to construct public ablution facilities for use by travellers crossing the border and at the Local
Business Market. The ablution block will consist of toilets, shower and laundry facilities, which will be separate
for males and females (see Figure 12). Treatment of the wastewater generated in the ablution facilities will be
by means of a septic tank, designed to be emptied every 3 years. The sludge will be discharged into sewage
ponds located at the nearest town with sewage treatment facilities. In future, these facilities can be connected to
the sewer network system.
The facility will be under delegated management. Charges will be levied for the use of the ablution facilities by
travellers, as a cost recovery measure to fund cleaning and water supply services.
Figure 12 Proposed layout of ablution block

Chirundu WSS Feasibility Report Page 66 of 209
Proposed Sewerage Network Interventions
There is an existing sewerage system in Chirundu, however it was never commissioned after construction.
Utilising the existing infrastructure, even though it has a rehabilitation cost attached, will be lower than the
construction cost of new infrastructure. One aspect that needs to be considered is the position of the
wastewater sewage ponds, because the site has been encroached by residential properties.
It is proposed that the existing sewerage system, including pump stations and wastewater sewage ponds are
incorporated into the sewerage network. The following key interventions are proposed:
A conventional sewer system to convey sewerage from the border post and surrounding commercial
area to the sump at Pump Station 1
A small bore sewerage conveyance system from other high volume water consumers (Lodges, hotels
etc.) to Pump Station 2.
Pump Station 1 and 2 convey sewerage to Pump Station 3 pumping to the Oxidation ponds.
Allowance for other users to connect to the system.
The proposed interventions are shown in Figure 13.
Figure 13 Proposed Sewer and Sanitation Interventions
Proposed operations and management structures for the systems
The facility will need to have an operations and maintenance plan in place to provide for daily maintenance and
cleaning requirements as well as desludging when the septic tank fills up. It is therefore important that provision
of these services is sustainable for the facility to operate to the satisfaction of the would-be users.

Chirundu WSS Feasibility Report Page 67 of 209
As the facility will fall under LWSC Limited, the sewerage section of the company should take up the operations
and maintenance aspects of the facility. The utility should provide an attendant / attendants / vender to collect
the user fees as well as to clean the facilities on a daily basis. The funds raised should be managed in such a
way that there should be enough funds available to enable regular desludging of the facility.
Key attributes and operational features:
The operations for the new facilities will fall in Chirundu services section of the LWSC
The CU (LWSC) appoints a water vendor to manage the revenue and cleanliness of the ablution facility.
The water vendor takes a percentage of the water used by the facility, currently kiosks are operated on
the basis of 40% of total revenue.
The water vendor pays for the water used by the ablution facility.
Climate Change Risk Assessment (CCRA)
Scope of Review
The scope of this Climate Resilience Risk Assessment (CCRA) review includes the following project
components and outcomes.
Climate risk screening on the following project components:
Refurbishment of existing water treatment works, including increased storage capacity
Distribution network upgrade and extension
Water zoning and non-revenue water reduction
Sanitation facilities for cross border population (communal ablutions building)
Identification of resilience benefits of the following project outcomes:
Provision of a reliable water supply system
Water zoning and non-revenue water reduction
Provision of water and sanitation facility for the cross border population (communal ablution building)
Climate Vulnerability Mapping and Tool Indicators
Table 10 and Table 11 presents the level of the climate vulnerability indicators for the Chirundu Water Supply
project area according to the climate vulnerability assessment tool. For some indicators a range is presented,
which reflects the differences in vulnerability amongst sites. Further guidance on the meaning of the indicators is
presented in Annex C2.

Chirundu WSS Feasibility Report Page 68 of 209
Table 10 Chirundu WSS - Climate Vulnerability Indicators (from website13
)
Indicator Outcome
Future risks to people 5. Moderately High
Water risk under climate change 5. High
Climate change pressure 4. High
Baseline risks to people 3. Medium
Resilient population 4. High
Population density 55 (people per km²)
Household and community resilience Groundwater stress 0.46 Moderately less resilient
Groundwater stress 1. Low (<1)
Upstream storage 1. High (>1)
Drought severity 3. Medium to High (30-40)
Flood FREQ MINM
Seasonal variability 5. Extremely High (>1.33)
Inter-annual variability 2. Low to Medium (0.25 to 0.5)
Baseline Water Stress 1. Low (<10%)
CRIDF Basin ZAMBEZI
Table 11 Chirundu WSS - Climate Vulnerability Indicators (From CRIDF Assessment Report14
)
Risk /
Vulnerability Indicator Overall
Physical- Quantity
Baseline Water Stress Low (<10%) Low risk (0-1)
Inter-annual Variability Low to medium (0.25-0.5)
Seasonal Variability Extremely high (>1.33)
Flood Occurrence Medium to high (4-9)
Drought Severity Medium to High (30-40)
13 The CRIDF Climate Vulnerability Assessment is available online at:
http://geoservergisweb2.hrwallingford.co.uk/CRIDF/CCVmap.htm 14 CRIDF Report, 'Assessing the climate resilience impact of proposed CRIDF projects', Shehnaaz Moosa, 12 March 2014

Chirundu WSS Feasibility Report Page 69 of 209
Risk /
Vulnerability Indicator Overall
Upstream Storage High (>1)
Groundwater Stress Low (<1)
Physical- Quality Return Flow Ratio Low (<10%) Low risk (0-1)
Upstream Protected Land Medium to High (20 – 40%)
Regulatory and
reputational risk
Media Coverage Extremely High (0.4 – 0.8%) Extremely high
risk (4-5) Access to Water Extremely High (>20%)
Threatened Amphibians Low (0%)
The project area faces extremely high seasonal variability, with flood occurrence and drought severity medium
to high risks. In addition to these factors regulatory and reputation risk is extremely high risks that could have
an impact on the ability to supply services to the beneficiaries.
The development of a reliable supply through improving the abstraction system, the capacity of treatment and
the reticulation will enhance inherent climate resilience of the community and surrounding area and allow for
effective water services for the poor given the current level of climate change.
Regional Climate Projections
The project falls within Region 1 (refer Annex C), and the expected impacts associated with this region are
presented in Table 12.
Table 12 Chirundu WSS - Climate projections for project area
Climate
change trend /
parameter
Impacts
By 2025 By 2055
Precipitation
variability
Continuing trend of seasonal and
inter-annual variability in
precipitation. A transition zone
between areas where the annual
rainfall is more likely to increase
(to the north) and more likely to
decrease (to the south). Any
changes are most likely (but not
definitively) in the range −10% to
Continuing trend of seasonal and inter-annual variability
in precipitation, decreased winter rainfall and increased
aridity, in combination with wind gustiness, drying out of
seasonal wetlands/pans and ephemeral rivers.
Variability in particular at boundary with southernmost
extent of intertropical convergence zone (ITCZ). A
transition zone between areas where the annual rainfall
is more likely to increase (to the north) and more likely
to decrease (to the south). Any changes are most likely
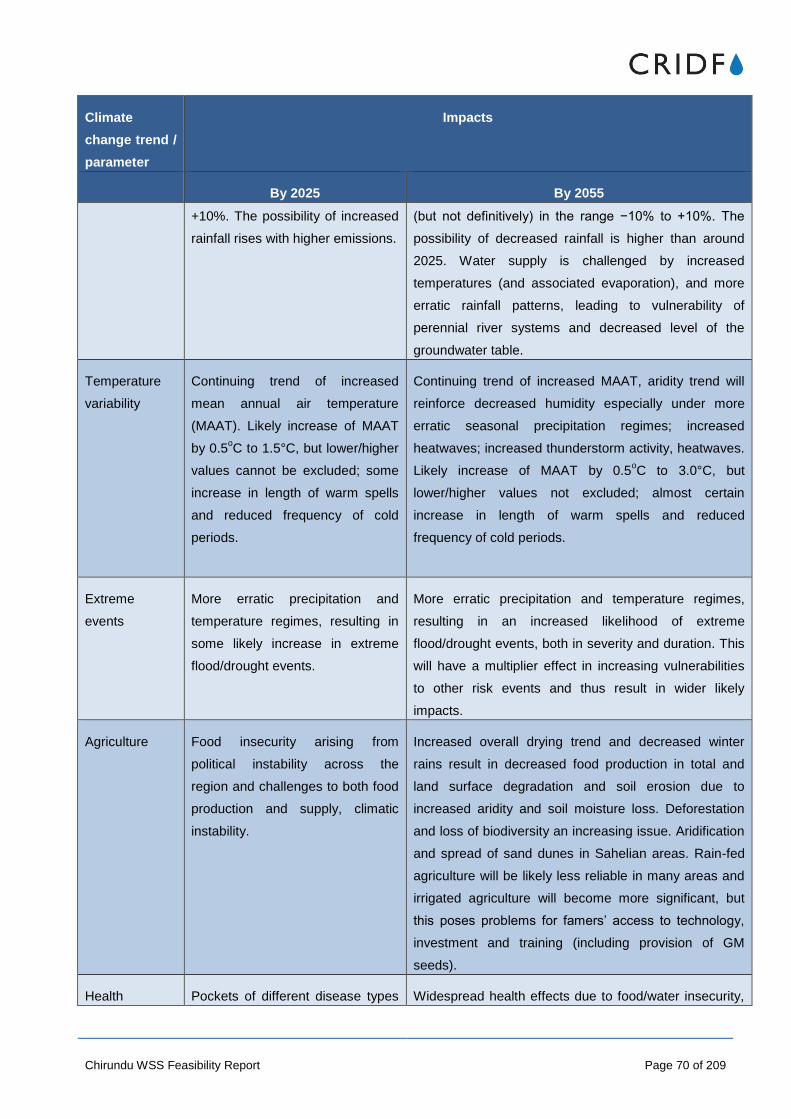
Chirundu WSS Feasibility Report Page 70 of 209
Climate
change trend /
parameter
Impacts
By 2025 By 2055
+10%. The possibility of increased
rainfall rises with higher emissions.
(but not definitively) in the range −10% to +10%. The
possibility of decreased rainfall is higher than around
2025. Water supply is challenged by increased
temperatures (and associated evaporation), and more
erratic rainfall patterns, leading to vulnerability of
perennial river systems and decreased level of the
groundwater table.
Temperature
variability
Continuing trend of increased
mean annual air temperature
(MAAT). Likely increase of MAAT
by 0.5oC to 1.5°C, but lower/higher
values cannot be excluded; some
increase in length of warm spells
and reduced frequency of cold
periods.
Continuing trend of increased MAAT, aridity trend will
reinforce decreased humidity especially under more
erratic seasonal precipitation regimes; increased
heatwaves; increased thunderstorm activity, heatwaves.
Likely increase of MAAT by 0.5oC to 3.0°C, but
lower/higher values not excluded; almost certain
increase in length of warm spells and reduced
frequency of cold periods.
Extreme
events
More erratic precipitation and
temperature regimes, resulting in
some likely increase in extreme
flood/drought events.
More erratic precipitation and temperature regimes,
resulting in an increased likelihood of extreme
flood/drought events, both in severity and duration. This
will have a multiplier effect in increasing vulnerabilities
to other risk events and thus result in wider likely
impacts.
Agriculture Food insecurity arising from
political instability across the
region and challenges to both food
production and supply, climatic
instability.
Increased overall drying trend and decreased winter
rains result in decreased food production in total and
land surface degradation and soil erosion due to
increased aridity and soil moisture loss. Deforestation
and loss of biodiversity an increasing issue. Aridification
and spread of sand dunes in Sahelian areas. Rain-fed
agriculture will be likely less reliable in many areas and
irrigated agriculture will become more significant, but
this poses problems for famers’ access to technology,
investment and training (including provision of GM
seeds).
Health Pockets of different disease types Widespread health effects due to food/water insecurity,

Chirundu WSS Feasibility Report Page 71 of 209
Climate
change trend /
parameter
Impacts
By 2025 By 2055
as a result of site-specific water/
air/ pollution, amplified by incorrect
water, agricultural and land
management practices, and mining
wastes. Low nutrition/health in
some areas due to food insecurity.
availability of potable water, water contamination by
runoff, and low water quality due to biological diseases,
pollution/sewage runoff into rivers, wastewater and
groundwater contamination due to poor sanitation in
informal settlements and due to industries such as
mining.
CCRA Results
Climate Risks
The project comprises of a number of physical infrastructure components that were identified and screened at a
high level against a series of relevant climatic threats for the area such as flooding, drought and fire. A
summary of the outcome of the process in terms of climate risks is presented in Table 13 along with a series of
risk management options.
Table 13 Chirundu WSS - Climate Risk Matrix
Project
component
Flood Drought Fire Risk mitigation
options
Provision of a
reliable water
supply system
Medium: The raw
water is abstracted
from the Zambezi
River, downstream of
Lake Kariba and
therefore flooding
could have an
impact.
Medium: Prolonged
drought can impact
on the water levels in
the river, which could
impact the intake.
The existing intake
has the ability to be
moved further out
into the river.
Low:
Infrastructure will be
provided within an
urban area, with low
vegetation cover.
The infrastructure will
be place well above
the flood level. The
intake works will be a
floating pontoon,
which is applicable
technology for both
floods and droughts.
Water zoning
and non-
revenue water
reduction
Low: Flooding is
unlikely to impact
water distribution
network
Low: Drought is
unlikely to impact
water distribution
network. Water
zoning and reducing
non-revenue water
will reduce the
Low: Fire is unlikely
to impact water
distribution network,
except at above
ground infrastructure
like the treatment
works, reservoirs and
No mitigation
required

Chirundu WSS Feasibility Report Page 72 of 209
Project
component
Flood Drought Fire Risk mitigation
options
impact of drought
significantly
the intake, which is
not relevant to this
project component.
Provision of
water and
sanitation
facility for the
cross border
population
(communal
ablution
building)
Medium: Flooding
could damage the
communal ablution
building and could
also flood the septic
tank.
Low: Drought is
unlikely to impact the
communal ablution
buildings.
Medium: Fire could
destroy the
communal ablution
building.
The design of the
communal ablution
building will need to
take flooding and fire
into account, in terms
of selection of
materials, positioning
away from flammable
materials / bushes /
trees and flood
resistance of the
septic tank.
Resilience benefits
The project delivers a series of outcomes that enhance the resilience of project recipients to climate change. An
overview of the project’s outcomes along with a list of resilience benefits that the project delivers are presented
in the 'Climate Resilience Benefits Matrix' attached in Annex C1.
Conclusions
The CCRA shows that the project brings a number of high resilience benefits to the project recipients especially
in relation to governance and livelihoods, gender and health. The review also identified a number of risks in
relation to the associated infrastructure and risk-mitigating actions which if implemented will improve the
resilience of the project itself to climate change risks.
Flood
The existing flood risk in the area is medium to high and is likely to intensify with future climate change impacts.
The infrastructure that is at risk of flooding (communal ablution blocks and water treatment works) should be
designed to firstly manage storm water run-off and secondly minimise the impact of flooding. This will improve
the additional resilience of the community and surrounding area to future climate change.

Chirundu WSS Feasibility Report Page 73 of 209
Drought
Drought is a known and recurrent issue in the area and is likely to intensify with climate change. This could
impact water abstractions from the Zambezi River and this in turn could have systemic implications for the water
supply of the project area. An ongoing study is reviewing the current intake position and will consider the impact
of climate change on potential relocation or mitigation modification. This study will look at options to improve the
additional resilience of the community and surrounding area to future climate change
Recommendations
The project should address the specific future changes in precipitation due to climate change as projected by
climate models. Furthermore institutional strengthening of the water and sewerage supply company, which can
address long terms aspects like water conservation, demand management and reduction of non-revenue water,
could influence the volume of water required to supply the town. Climate projections should be shared and
discussed with local stakeholders by the project team to explore future and alternative risk mitigation options.
Implementation Costs
The estimated implementation costs for the construction and expansion of the system, as proposed in this
section, for Chirundu are summarised in Table 14.
Table 14 Estimated Project Implementation Cost
Component Preferred Solution /
Design
Capital
Cost US$
Capital
Cost GB£
Remarks
1 Water Source The Zambezi River $0 £0 This is the existing source and is
satisfactory.
2 Water Intake Rehabilitate to Climate
Resilient Floating Intake
$212,500 £146,000 This is the existing method of
abstraction and is satisfactory.
3 WTP Expand water treatment
plant of conventional
design [as existing].
$1,255,000 £862,400 To be constructed and
expanded along the parallel train
provision of the existing.
Expands the plant to
accommodate laboratories and
administrative buildings
4 Ground Level
Storage,
Pumps and
transmission
12 hour capacity. $780,000 £536,000 Capacity can be reduced to 8,
hours if ‘Affordability’ becomes
an issue
but with reliability of
supply consequences. To be
constructed in phases,
additional storage capacity can
be added in the future.

Chirundu WSS Feasibility Report Page 74 of 209
Component Preferred Solution /
Design
Capital
Cost US$
Capital
Cost GB£
Remarks
5 High Level
Storage
New 4 hour storage
capacity within the system.
$437,200 £300,400 High Capital cost. Lower cost
alternatives available but with
service level consequences.
6 Distribution
System
Ring Main, Gravity Flow $2,120,000 £1,456,800 Provides best performance of all
Options. All design criteria is
achieved especially levels of
service and sustainability.
7 Water and
Sanitation
centres
Water Kiosks + Ablution
blocks
$120,000 £82,500 Provides water and sanitation
services to the high volume of
transit consumers moving
between the town and border
and business market areas.
8 Sewer
Treatment
Rehabilitation of Oxidation
ponds, chambers and
administration structures.
$850,000 £584,000 Affordable and most appropriate
solution as the works and siting
are advanced. Operationally
straightforward.
9 Sewerage
Collection and
conveyance
and pumping
Simplified/ Small bore
Gravity Sewer
$2,250,000 £1,546,000 Affordable and most appropriate
solution than can be
implemented for domestic
discharge. Mechanisation
cannot be avoided due to
Chirundu’s rolling hills
topography
TOTAL INTERVENTIONS COST $8,024,700 £5,514,100
Implementation Phasing
It is proposed that the project be split into phases to optimise the use of capital expenditure and ensure that
capital expenditure matches actual growth.
The established phases for Chirundu are Short, Medium and Long Term, up to 2036. A summary of the
objectives and main interventions per phase are described in Table 15.

Chirundu WSS Feasibility Report Page 75 of 209
Table 15 Planned Implementation Phases
Phases Planning
Horizon (Year) Main areas of intervention Implementation plan
Phase 1 Short Term
(2021)
Upgrade intake pontoon
Upgrade of treatment plant to 2ML/d
Upgrade pumping system, pumps and
pumping mains
Upgrade bulk main pipelines
Introduce bulk meters
Increase storage to 2ML/day
Construct new and refurbish existing
ablution facilities
Design and construction
before 2021.
Phase 2 Medium Term
(2026)
Upgrade treatment plant to 6Ml/d (double
from 2ML/day)
Increase storage to 6ML/day (12hr)
Upgrade secondary distribution network
within DNI zones
Refurbish sewer system and connect high
water consumption users
Design and construction
before 2026 – to be
confirmed based on actual
population growth.
Phase 3 Long Term
(2036)
Expand secondary distribution network
with increase in population
Design and construction
before 2036 – to be
confirmed based on actual
population growth.
Preliminary Budget for Implementation
The following tables provide a breakdown of the preliminary budget for implementation based on the proposed
phases.
The Total Implementation cost split into phases (corresponding with the total from Table 14) is provided in
Table 16.

Chirundu WSS Feasibility Report Page 76 of 209
Table 16 Total Preliminary Implementation Costs - All Phases of Works
Total Capital investment 2016-2036
Item No. Item Description Amount
US$
Amount
GB£
1 Short Term (Phase 1) – Water Supply 2,335,000 1,604,500
2 Short Term (Phase 1) – Sanitation 75,000 51,500
3 Medium Term (Phase 2) – Water Supply 2,388,600 1,641,300
4 Medium Term (Phase 2) - Sewer and Sanitation 3,029,400 2,081,600
5 Long Term (Phase 3) – Water Supply
196,700 135,200
Total
8,024,700 5,514,100
Short Term (Phase 1) Implementation
The Short Term (Phase 1) Implementation consists of a water supply portion and a sanitation portion. Table 17
and Table 18 provides the estimated investment for this work, shown per individual item.
Table 17 Estimated Costs Short Term (Phase 1) – Water Supply
Item No. Item Description Quantity Amount
US$
1 Short Term (Phase 1) - Water Supply
1.1 Floating Intake and Pump sets 1 170,000
1.2 Conventional Treatment plant expansion 0.6 Ml/d 80,000
1.3 Transmission and Storage Expansion 2 Ml/d 250,000
1.4 Booster Pumps Expansion 22,000
1.5 Ring Main Distribution network complete appurtenances 6,000 m 1,000,000
1.6 Distribution centre 50 m³ OHT complete appurtenances 2 No. 346,000
1.7 Engineering and Contingencies 25%
467,000
Sub – Total 1
2,335,000
Table 18 Estimated Costs Short Term (Phase 1) – Sanitation
Item No. Item Description Quantity Amount
US$
2 Short Term (Phase 1) – Sanitation
2.1
Ablution blocks 2 60,000
2.2 Engineering and Contingencies 25%
15,000
Sub – Total 2
75,000

Chirundu WSS Feasibility Report Page 77 of 209
Medium Term (Phase 2) Implementation
The Medium Term (Phase 2) Implementation consists of a water supply portion and a sanitation portion. Table
19 and Table 20 provides the estimated investment for this work, shown per individual item.
Table 19 Estimated Costs Medium Term (Phase 2) – Water Supply
Item No. Item Description Quantity Amount
US$
3 Medium Term (Phase 2) – Water Supply
3.1 Floating Intake and Pump sets
0
3.2 Conventional Treatment plant Expansion
Offices2
4 Ml/d 1,000,000
3.3 Transmission and Storage Expansion 4 Ml/d 295,000
3.4 Booster Pumps Expansion 56,000
3.5 Ring Main Distribution network complete with appurtenances 0
3.6 Distribution centre OHT complete with appurtenances 0
3.7 Secondary Distribution complete with appurtenances 4,600 m 524,900
3.8 Water kiosks 35,000
3.9 Engineering and Contingencies 25%
477,700
Sub – Total 3
2,388,600
Table 20 Estimated Costs Medium Term (Phase 2) – Sanitation
Item No. Item Description Quantity Amount
US$
4 Medium Term (Phase 2) - Sewer and Sanitation
4.1 Sewer treatment works rehabilitation 680,500
4.2 Transmission pipeline 2,480 m 90,000
4.3 Small Bore Collection pipeline 4,000 m 1,583,200
4.4 Pump and lift stations 3 120,800
4.5
Ablution blocks 0
4.6 Improved latrines 40,000
4.7 Awareness, training and education campaigns 10,000
4.8 Engineering and Contingencies 20%
504,900
Sub – Total 4
3,029,400

Chirundu WSS Feasibility Report Page 78 of 209
Long Term (Phase 3) Implementation
Phase 3 is an expansion of the secondary distribution network to unserviced areas of Chirundu that will in future
fall with the Chirundu town boundary. Table 21 provides the estimated investment for this work, shown per
individual item.
Table 21 Estimated Costs Long Term (Phase 3) – Water Supply
Item No. Item Description Quantity Amount
US$
5 Long Term (Phase 3) – Water Supply
5.1 Conventional Treatment plant Expansion
Offices2
0
5.2 Transmission and Storage Expansion 0
5.3 Ring Main Distribution network complete with appurtenances 0
5.4 Secondary Distribution complete with appurtenances 1,500 m 171,000
5.5 Engineering and Contingencies 15%
25,700
Sub – Total 5
196,700
Conclusions and recommendations
The following conclusions can been drawn from the above feasibility technical assessment of the status of water
supply and sanitation services in Chirundu:
The town planning structure for Chirundu Town is yet to be determined.
The town has developed spatially, in the process creating numerous vacant lots and traditional land.
The proposed water supply network will promote properly structured growth of the centre by creating a
strong incentive to develop housing in existing vacant lots that are in proximity to water supply services.
It is proposed that during detail design that LWSC develop drawings and layouts of the town’s urban
development and water and sewer networks. Once this is achieved, these drawings can be used to
develop a hydraulic model of the network.
The proposed water supply infrastructure will cater for growth within infill areas of the Town up to 2036.
In the medium term the following measures are recommended.
Authorities should encourage the development of housing in existing infill areas that are covered by the
network through densification, with spatial expansion of the housing area only occurring after all vacant
lots have been filled, and even then preferably in fully planned areas.
The Zambian Government authority responsible for urban and regional planning for the area should
urgently develop an Integrated Development Plan (IDP) new housing areas. This will streamline the
provision of water supply and sanitation services to cater for growth.
The IDP for the growth of the border post should include a master plan for the provision of water supply
and sanitation covering the planned development area.

Chirundu WSS Feasibility Report Page 79 of 209
Environmental Assessment
The following section provides a preliminary environmental assessment of the project and the expected impacts
based on the proposed infrastructure described in the Technical Assessment.
The Surrounding Community
The surrounding community to the town is predominantly identified as a border town, with the sister town across
the international border in Zimbabwe, known and called by the same name. The general development of the
town is towards the north-east lying parallel to the Zambezi River. The northern and north-west areas comprise
residential and service developments and further out are dotted peri urban settlements and agricultural fields as
seen in Figure 14. These peri-urban settlements employ traditional methods of water supply and sanitation.
Figure 14 Chirundu Town Settlements and Main Roads
The Water Supply Infrastructure
This section briefly outlines the status of the conventional system that is currently in operation by the utility
company for the supply of water to the consumers. A more detailed description is provided in Annex B.

Chirundu WSS Feasibility Report Page 80 of 209
Abstraction
The primary source of water in Chirundu is from the Zambezi River, where the LWSC abstracts water. The town
of Chirundu abstracts 2,000 m³/d from the Zambezi River. The abstraction point is located about 300 m from the
existing Water Treatment Plant (WTP) and just over 400 m south west of the upstream bridge as shown in
Figure 15. There are no settlements within the vicinity of the abstraction point. The suction pump is mounted on
a floating Intake pontoon, which requires refurbishment.
Figure 15 The location of the Floating pontoon Abstraction point
The water supply for the town has an alternative borehole supply from the ‘Apollo’ borehole and situated about
200 m south-west of the existing WTP. Due to the pump capacity, it is not pumped to the WTP for any treatment
but is fed directly into the main distribution network.
Water Treatment System
The abstracted water is transmitted to the WTP about 25 m above the river level. The WTP comprises of the
receiving reservoir, Treatment tank, Booster station and an Overhead tank. The abstracted water only receives
drip-feed chlorination before being stabilized and pumped out into the distribution network. The chlorination is
gravity operated and mounted atop the reservoir.
Storage Facilities
The current water supply system for Chirundu is provided with a number overhead tanks located at different
places, e.g. the 80 m³ OHT at the WTP and the concrete OHT situated at Nyambadwe.
Water Supply and Distribution
The current water supply within the district has several challenges. Among others is the current pumping
capacity, coupled with modest storage facilities that do not afford sustainability of supply whenever there is any
eventuality such as interruption to power. The infrastructure is old in most sections and results into high

Chirundu WSS Feasibility Report Page 81 of 209
maintenance costs. The poor or non-existent supervision of citizens / residents building structures without the
Council’s Approval infringes on the distribution network. The distribution system is made up of pipes of various
materials and various sizes. The approximate layout of the pipe network in Chirundu is shown in Figure 5.
The Sanitation Infrastructure
The district is currently faced with a challenge to provide sanitation services due to several factors. The principal
one is the low financing meant for the establishment or maintenance of sanitation facilities. Associated to this is
the low rate of payments for sanitation services by the consumers or residents. The nature of undulating
topography for the town is unfavourable for gravity flow that favours establishment of the STP and the
associated ponds.
Sewerage Reticulation system
The Chirundu town has a centralized sewerage system, which has never been completed or commissioned.
Therefore, most of the residents within the high cost areas, offices and other such places employ on-site
sanitation of septic tanks and soakaways. The initial investment required often times is the gap that discourages
the majority of the residents to invest in these facilities.
The rest of the residents either use VIP toilets or pit latrines. A smaller number, those living further in the peri-
urban area are reported to practice open defecation.
Sewerage Treatment Plant (STP)
As indicated Chirundu has a centralized Sewerage Treatment Plan (STP) with no reticulation system. The STP
was never completed nor commissioned. Therefore no connections were made to the system.
The Biological and Geophysical Environment
The Physical Environment
Climate Conditions for Chirundu District
Generally, the Southern Province has typical Zambian climate that is described as sub-tropical although
Chirundu town falls in the valley and has slightly higher temperatures and more humid conditions. There are
three main seasons in this part of the country: April to August – cool and dry, with daytime temperatures of
20°C to 25°C and night-time temperatures as low as 4°C. September to October/November – hot and dry,
with daytime temperatures rising to 40°C. November/December to March – warm and wet. When the rains
come, the temperatures drop by several degrees, and the humidity rises. The Chirundu falls within Agro-
Ecological Zone I which is characterised by rainfall of less than 800mm. The mean annual rainfall recorded at
Chirundu station (12 km north) is 678 mm, and that at Kariba station (47 km south) is 767 mm.
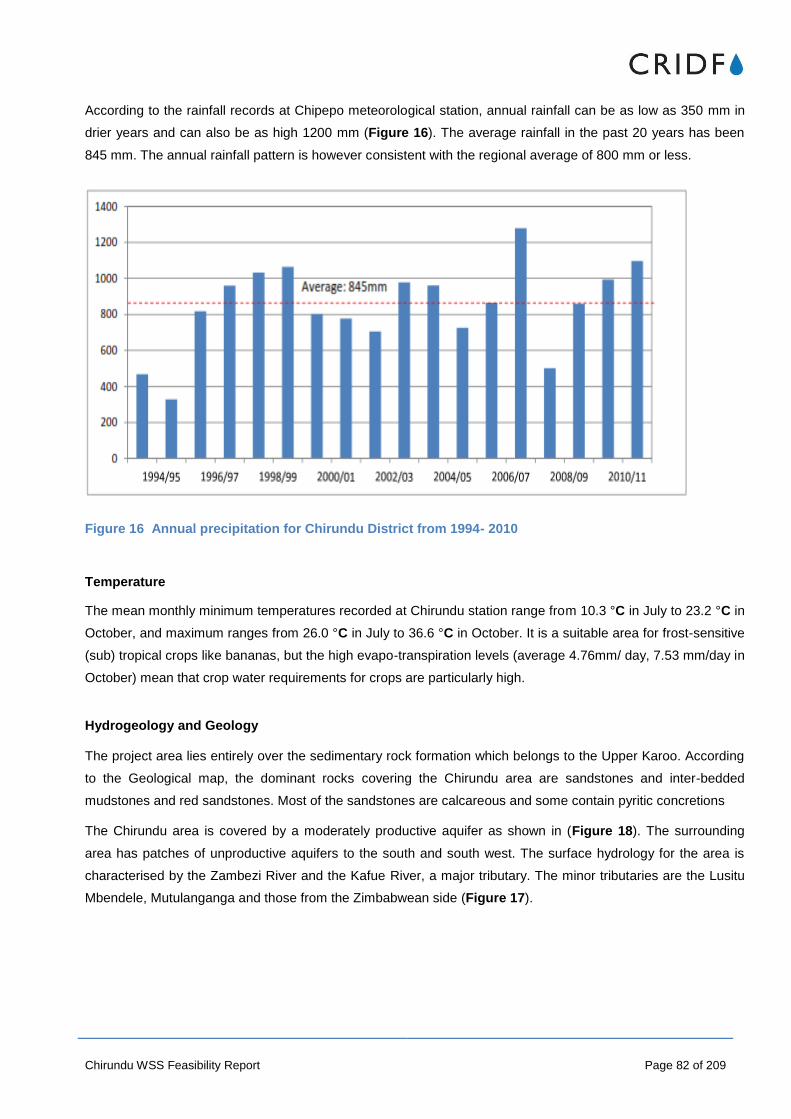
Chirundu WSS Feasibility Report Page 82 of 209
According to the rainfall records at Chipepo meteorological station, annual rainfall can be as low as 350 mm in
drier years and can also be as high 1200 mm (Figure 16). The average rainfall in the past 20 years has been
845 mm. The annual rainfall pattern is however consistent with the regional average of 800 mm or less.
Figure 16 Annual precipitation for Chirundu District from 1994- 2010
Temperature
The mean monthly minimum temperatures recorded at Chirundu station range from 10.3 °C in July to 23.2 °C in
October, and maximum ranges from 26.0 °C in July to 36.6 °C in October. It is a suitable area for frost-sensitive
(sub) tropical crops like bananas, but the high evapo-transpiration levels (average 4.76mm/ day, 7.53 mm/day in
October) mean that crop water requirements for crops are particularly high.
Hydrogeology and Geology
The project area lies entirely over the sedimentary rock formation which belongs to the Upper Karoo. According
to the Geological map, the dominant rocks covering the Chirundu area are sandstones and inter-bedded
mudstones and red sandstones. Most of the sandstones are calcareous and some contain pyritic concretions
The Chirundu area is covered by a moderately productive aquifer as shown in (Figure 18). The surrounding
area has patches of unproductive aquifers to the south and south west. The surface hydrology for the area is
characterised by the Zambezi River and the Kafue River, a major tributary. The minor tributaries are the Lusitu
Mbendele, Mutulanganga and those from the Zimbabwean side (Figure 17).
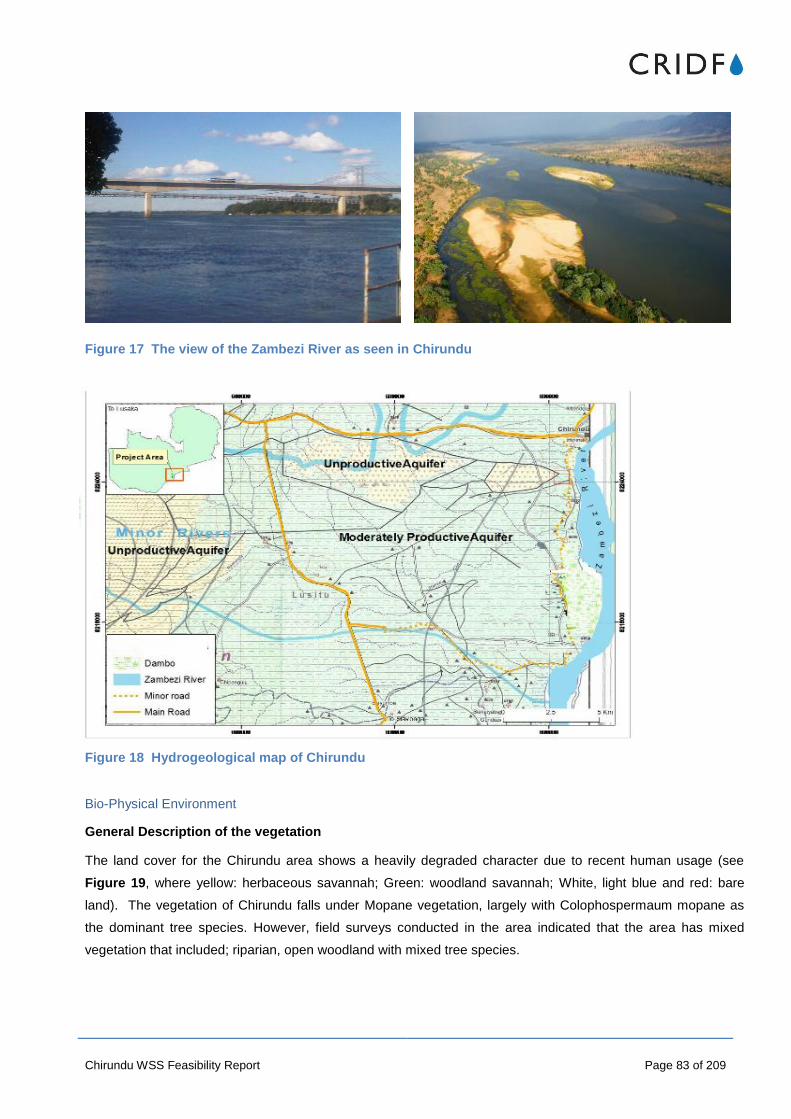
Chirundu WSS Feasibility Report Page 83 of 209
Figure 17 The view of the Zambezi River as seen in Chirundu
Figure 18 Hydrogeological map of Chirundu
Bio-Physical Environment
General Description of the vegetation
The land cover for the Chirundu area shows a heavily degraded character due to recent human usage (see
Figure 19, where yellow: herbaceous savannah; Green: woodland savannah; White, light blue and red: bare
land). The vegetation of Chirundu falls under Mopane vegetation, largely with Colophospermaum mopane as
the dominant tree species. However, field surveys conducted in the area indicated that the area has mixed
vegetation that included; riparian, open woodland with mixed tree species.

Chirundu WSS Feasibility Report Page 84 of 209
Figure 19 Chirundu Vegetation Cover
Riparian vegetation
Riparian vegetation was observed close to the banks of Zambezi River. The riparian band ranged between 3 m
to 12 m with tree species that included; Diospyros sp, Tamarindus indica, Acacia nigrescens, Ficus niloticus,
Lonchocarpasa capasa, Syzygium cordatum, Phoenix reclinata (Wild date palm), Hyphaene petersiana and
some scattered Borassus aethiopum.
The river banks of the Zambezi River were found to be mostly lined with papyrus grass species with varying
heights and densities depending on the a particular community. In certain instances continuous patches of
highly hydrophilic grass species like Leptocchloa fusca (swamp grass, Echinochloa pyramidalis and
Echinochloa colona were observed along the rivers banks. Also commonly observed was Arundinella
nepalensis. Most areas of the riparian vegetation are currently under cultivation due to rich soils and availability
of water.

Chirundu WSS Feasibility Report Page 85 of 209
Figure 20 The vegetation along the Zambezi River and near the abstraction
Open woodland
The open woodland in Chirundu area was observed to have scattered woody species arranged in two layers:
old big scattered trees species mostly ranging from 4 – 8 m high and the shrubs constituting a different
combination of plant species. Old tree species observed included Adansonia digitata, Accacia nigrescens,
Lonchocarpus capassa, Acacia tortilis, Kigelia African, Kirkia accuminata, Sclerocarya caffra.
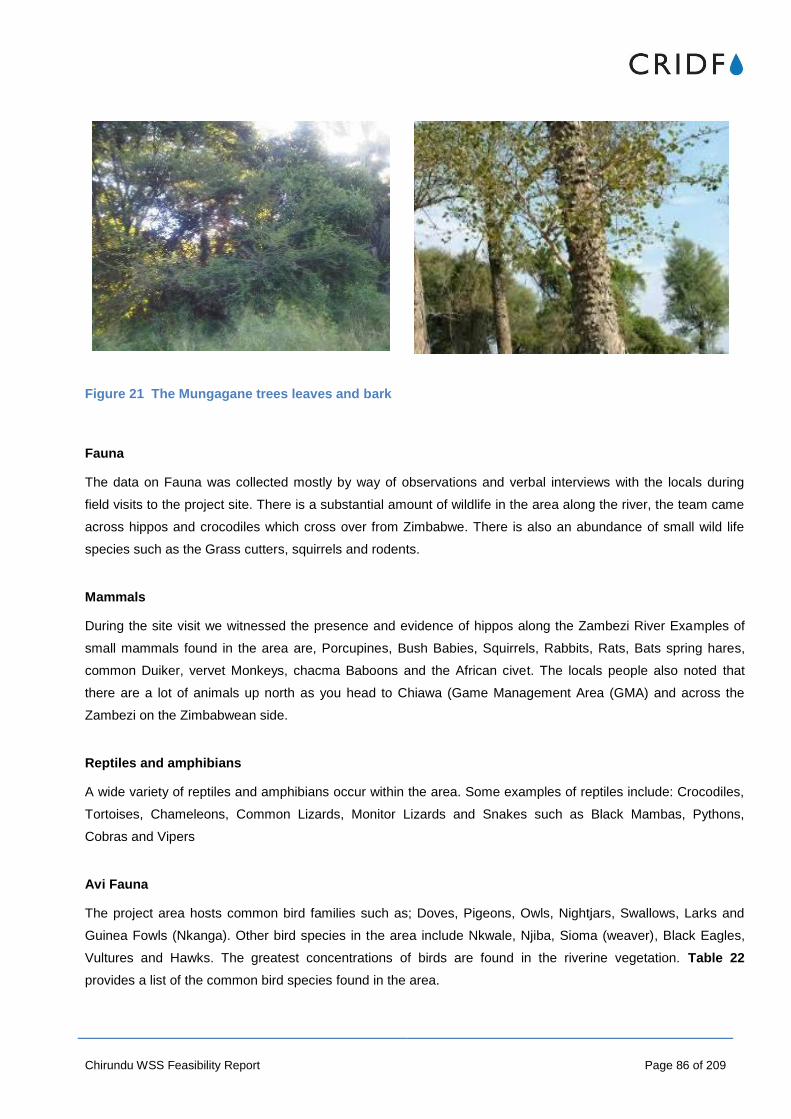
Chirundu WSS Feasibility Report Page 86 of 209
Figure 21 The Mungagane trees leaves and bark
Fauna
The data on Fauna was collected mostly by way of observations and verbal interviews with the locals during
field visits to the project site. There is a substantial amount of wildlife in the area along the river, the team came
across hippos and crocodiles which cross over from Zimbabwe. There is also an abundance of small wild life
species such as the Grass cutters, squirrels and rodents.
Mammals
During the site visit we witnessed the presence and evidence of hippos along the Zambezi River Examples of
small mammals found in the area are, Porcupines, Bush Babies, Squirrels, Rabbits, Rats, Bats spring hares,
common Duiker, vervet Monkeys, chacma Baboons and the African civet. The locals people also noted that
there are a lot of animals up north as you head to Chiawa (Game Management Area (GMA) and across the
Zambezi on the Zimbabwean side.
Reptiles and amphibians
A wide variety of reptiles and amphibians occur within the area. Some examples of reptiles include: Crocodiles,
Tortoises, Chameleons, Common Lizards, Monitor Lizards and Snakes such as Black Mambas, Pythons,
Cobras and Vipers
Avi Fauna
The project area hosts common bird families such as; Doves, Pigeons, Owls, Nightjars, Swallows, Larks and
Guinea Fowls (Nkanga). Other bird species in the area include Nkwale, Njiba, Sioma (weaver), Black Eagles,
Vultures and Hawks. The greatest concentrations of birds are found in the riverine vegetation. Table 22
provides a list of the common bird species found in the area.

Chirundu WSS Feasibility Report Page 87 of 209
Table 22 Common Bird species
No. Bird Species Scientific Name
1 African fish Eagle Haliaeetus vocifer
2 Blue Waxbill Uraeginthus angolensis
3 Common Bulbul pycnonotus barbatus
4 Crowned Hornbill Tockus alboterminatus
5 Little Bee-eater Merops pusillus
6 Tropical Boubou Laniarius aethioipicus
7 Tawny-flanked Prinia Prinia subflava
8 Pied Crow Corvus albbus
9 Red-eyed dove Streptopelia semitorrquata
10 Paradise Flycatcher Terpsiphone viridis
Figure 22 Paradise Flycatcher and bark Red-eyed dove
Figure 23 Tawny-flanked Prinia and Pied Crow
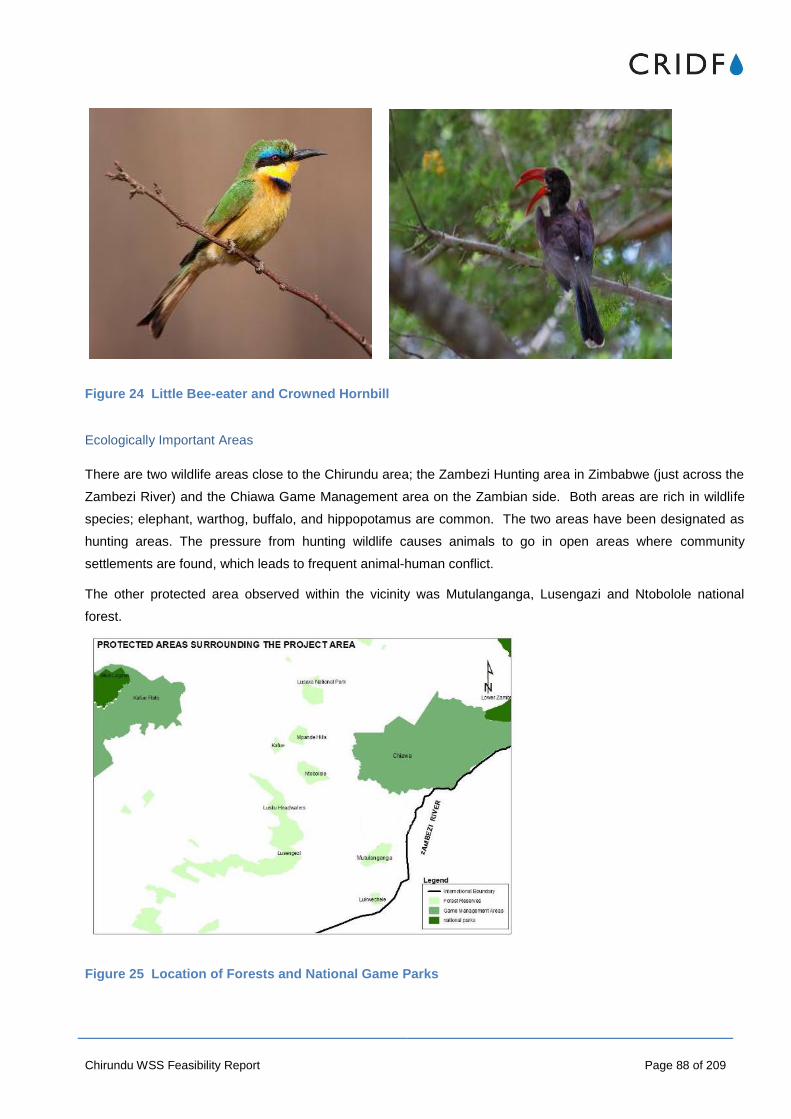
Chirundu WSS Feasibility Report Page 88 of 209
Figure 24 Little Bee-eater and Crowned Hornbill
Ecologically Important Areas
There are two wildlife areas close to the Chirundu area; the Zambezi Hunting area in Zimbabwe (just across the
Zambezi River) and the Chiawa Game Management area on the Zambian side. Both areas are rich in wildlife
species; elephant, warthog, buffalo, and hippopotamus are common. The two areas have been designated as
hunting areas. The pressure from hunting wildlife causes animals to go in open areas where community
settlements are found, which leads to frequent animal-human conflict.
The other protected area observed within the vicinity was Mutulanganga, Lusengazi and Ntobolole national
forest.
Figure 25 Location of Forests and National Game Parks

Chirundu WSS Feasibility Report Page 89 of 209
While the project is not a forestry based project, the utility company will be aware of the sensitivity or impact the
proposed project may have on the nearby forested areas.
The forestry department is responsible for the conservation of National and local forests. The utilization of all the
products from these conserved areas requires the authority of the department and the payment of the
appropriate royalties. Their operation is enshrined by the Forest Act No.7 of 1999 CAP199 of the laws of
Zambia, which repealed the act of 1973.
Active collaboration with the Forestry department will have to be pursued in order to achieve a holistic
management of any potential impact arising from the implementation of the proposed project. This will be done
in compliance to the Forest Act No.7 of 1999.
The Applicable Policy Framework and Legislation
Water Sector Policy and Reforms
The Water and Sanitation sectors in Zambia are implemented by several collaborative pieces within the
legislative framework. These pieces of legislation are underpinned by two interrelated principal national policies
(National Water Sector Policy and the Environmental Policy). The policies provide the foundations for the
establishment of the associated regulatory authorities or agencies that provide overall oversight within the
sector.
Zambia has for more than two decades implemented several water sector reforms to ensure economic and
sustainable development. In 1994, the reforms resulted into Water Sector Policy. The Water sector policy was
further subdivided into two main sections. The first one provides guidance in Water Supply and Sanitation, while
the other one deals with countrywide Water Resources Management. This incorporates guidance on the
interaction of the different subsectors vis-à-vis shared international waters resources.
These two policies have given rise to several associated legislation that provides for the establishment of the
associated regulatory authorities, their oversight powers and the statutory instruments or guidelines for the
implementation and operation of the various projects and entities in the related subsectors.
A developer of any water treatment and or sewerage plant is required to follow conditions set out in these laws
and any other applicable statutes, regulations, guidelines and procedures and to seek approvals in advance of
any construction.
The National Water Policy (2010), provides for 14 subsectors that include Water Resources Management,
Water Resources Development, Water for Food and Agriculture, Water for Fisheries, Water for Tourism, Water
Supply and Sanitation, Water for Wildlife, Water for Mining and Water for Industry. The others are Water for
Environment, Water for Energy, Water and Land, Water for National Heritage and Water for Transportation. Two
of these - Water Resources Management and Development and Water Supply and Sanitation are discussed in
relation to this study.

Chirundu WSS Feasibility Report Page 90 of 209
Water Supply and Sanitation
The policy statement seeks to promote sustainable water resources management and development with a view
to facilitate an equitable provision of adequate quantity and quality of water for water supply and sanitation in a
timely manner.
The policy provides for the legal framework that establishes the National Water and Sanitation Council
(NWASCO) that oversees the operation of the 11 Water Utilities and 6 Private schemes.
Water Resources Management & Development
The aspect on water resources management provides comprehensive framework for management of the water
resources that takes into account catchment management of water resources, stakeholder consultation and
involvement, assessment, monitoring, water conservation and preservation of its acceptable quality and
quantity, efficient and equitable water allocation to all users and disaster preparedness. Among others, its main
objective is to ensure inter-sectoral linkages in the management of the water resources so as to support cross-
sectoral development needs and maximise the economic benefits accruing there to. The aspect on development
seeks to achieve sustainable water resource development with a view to facilitate an equitable provision of
adequate, quantity and quality of water for all competing groups of users at reasonable costs and ensuring
security of supply under varying conditions. Among others, its main objective is to ensure that Zambia’s water
resources are developed to contribute to wealth creation through improved access to water, increased food
production and food security for all Zambians.
The policy provides for the legal framework that establishes the Water Resources and Management Authority
(WARMA) that oversees the identification, abstraction and use of the widespread water resources. The
government oversees water resources development and management in Zambia through the Ministry of Energy
and Water Development (MEWD), while the operations of the various water utilities spread over the country are
supervised through the Ministry of Local Government and Housing (MLGH), whose various city and district
councils are shareholders in the utility companies. The Chirundu Water Supply and Sanitation is under the water
utility of the Lusaka Water and Sewerage Company (LWSC).
The Zambia Environmental Policy
The National Policy on Environment, 2009 was developed to safeguard the environment and to ensure the
sustainable use of natural resources. The main purpose of the policy is:
"To create an umbrella policy for the welfare of the nation's environment so that socio-economic development
will be achieved effectively without damaging the integrity of the environment or its resources".
The Policy expects to achieve increased economic growth that is not damaging to the environment and natural
resources. Like its predecessor de facto ‘policy’ the National Environmental Action Plan (NEAP), the NPE is
also founded on three fundamental principles. These are:
The right of citizens to a clean and healthy environment;
Local community and private sector participation in natural resources management; and

Chirundu WSS Feasibility Report Page 91 of 209
Obligatory Environmental Impact Assessments (EIAs) for major project undertakings in all sectors of the
economy.
This policy provides the basis for the management of environmental protection and pollution control. It also
provided the basis for the legal framework that gave rise to the previous Environmental Protection and Pollution
Control Act of 1997 and its various Statutory Instruments and the established the regulatory authority for the
environment known as the Environmental Council of Zambia (ECZ). A further amendment to the Act resulted
into its being repealed and replaced by the Environmental Management Act No. 11 of 2012 and the
transformation of ECZ into the Zambia Environmental Management Agency (ZEMA). The Ministry of Lands,
Environment and Natural Resources (MELNR) is the principal ministry that oversees the implementation of this
policy through the ZEMA.
The Institutional and Regulatory Framework
The aforementioned policies provide the basis for the legislative and regulatory framework that has created the
various institutions that provide oversight related to Water Supply and Sanitation and the environmental
management.
Water Resources Management Authority (WARMA)
The Water Resources Management Authority was established to execute functions related the management,
development, conservation, protection and preservation of water resource and its ecosystems. The Authority
also monitors the sustainable utilization of the water resource and issues the right to draw or take water for
domestic and non-commercial purposes. LWSC will therefore abstract water under license and specifications
obtained from the WARMA.
National Water Supply and Sanitation Council (NWASCO)
The National Water Supply and Sanitation Council (NWASCO) is a statutory body established by the Water
Supply and Sanitation Act Number 28 of 1997 to regulate water supply and sanitation service provision in
Zambia.
In order to regulate the provision of water supply and sanitation services for efficiency and sustainability, its core
functions are to:
License providers;
Advise the Government on water supply and sanitation matters;
Establish and enforce sector standards and guidelines;
Advise providers on procedures for handling complaints from consumers; and
Disseminate information to consumers on water supply and sanitation issues.
In its pursuit to discharge these functions, the Council is guided by the following values.
Accountability - to all stakeholders on our mandate
Legitimacy - in operating within the confines of the law

Chirundu WSS Feasibility Report Page 92 of 209
Transparency - work shall be executed in an objective and transparent manner in all regulatory
functions while maintaining predictability, fairness and confidentiality.
Integrity and Professionalism - in discharging responsibilities. We shall not allow bias, conflict of interest
or the influence of others to override our professional judgment.
According to the Water Sector and Sanitation Report of 2015, the Council is currently overseeing 11
Commercial Utilities (CUs) and 6 Private schemes (Lafarge Cement, Kaleya Small Holders, ZESCO, Zambia
Sugar Plc, KCM – Nampundwe, and Kafue Sugar Private Scheme). The CU’s are shown in Table 23.
Table 23 Commercial Utilities in Zambia, 2015
No Commercial
Utility (CU)
Abbreviation Commence
ment of
Operations
No. of
Towns/
Centres
Serviced
Total
Population
in Service
Area
No. of
Connecti
ons
No. of
Staff
1. Lusaka WSC LWSC 1989 6 2,246,825 94,184 889
2. Nkana WSC NWSC 2000 3 753,782 58,701 600
3. Kafubu WSC KWSC 2000 3 690,530 60,462 655
4. Mulonga
WSC
MWSC 2000 3 489,160 51,429 405
5. Lukanga
WSC
LGWSC 2006 8 419,081 23,550 237
6. Southern
WSC
SWSC 2000 21 396,335 45,626 412
7. Chambeshi
WSC
CHWSC 2003 12 331,308 19,294 255
8. North
Western WSC
NWWSC 2000 8 255,979 12,968 133
9. Eastern WSC EWSC 2009 10 276,840 17,301 146
10. Western WSC WWSC 2000 10 204,185 12,314 124
11. Luapula WSC LPWSC 2009 7 206,400 5,899 77
Zambia Environmental Management Agency (ZEMA)
The primary environmental law in Zambia is the Environmental Management Act No. 12 of 2011 (EMA). Since
1990, it originally existed as the Environmental Protection and Pollution Control Act, No. 12 of 1990 (EPPCA). It
has since been repealed and replaced with the EMA. It is a superior piece of legislation for Environmental
Management and regulation, and provides for the right to a clean, safe and healthy environment in Zambia. It
provides for the establishment of the Zambia Environmental Management Agency (ZEMA), as a direct
replacement of the former Environmental Council of Zambia (ECZ). This is the main body which implements
and enforces the provisions of the law that deal with prohibition of pollution of air, land and water and protection
of the environment. It further provides for the Environmental Inspectorate that conducts the whole scope of
Chirundu WSS Feasibility Report Page 93 of 209
Environmental Management i.e. environmental guidance, stakeholder interaction and feedback, projects
inspection, regulation and monitoring.
The other sections of the law provide for the mandate for the ZEMA to maintain an environmental database and
register with relevant information and conduct environmental awareness. The law also provides for the right for
members of the public to participate in decision making in environmental matters through Public meeting
participation, Reviews, hearings and a right to initiate review, appeal and litigation. The establishment of the
Environmental Fund, its administration and application has been made possible through the enactment of this
legislation. The ZEMA also acts as a secretariat for the Board (an independent authorising body comprising of
various stakeholders, and responsible for final mandates.). As a secretariat, it provides the Licensing for the
various permits and licences. This proposed project will seek the active approval of the Board through the
ZEMA by way of conducting an Environmental Impact Assessment which one of the requirements for approval.
The other sections and Statutory Instruments of the Act provide for regulations as they relate to Water, Air and
Noise Pollution and management.
As part of the compliance to this legislation, this project will seek the active approval of the Zambia
Environmental Management Agency, of which this Feasibility study report is the foundation for the affording the
environmental impact assessment due to the proposed rehabilitation activities in Chirundu. The resultant
impact’s report will be submitted to ZEMA for review and compliance decision. Compliance to the other
regulations as they relate to Water, Air and Noise.
The Chirundu District Council (CDC)
The district council is the body mandated to regulate and grant development permits for the district as part of the
delegated planning responsibility of central government through the local authority. It is the administrative and
implementation arm of the Local government for the district.
Meanwhile, like all local government agencies and departments, the Local Government Act, Cap 22 of 1991
(amended), established the council. Its principal function through the Department of District Planning is to
effectively take care of physical planning matters of the district.
Additionally, the department ensures that planning permission is granted for all developmental activities in the
district in accordance with the provisions of the Town and Country Planning Act, Cap 283 of the Laws of
Zambia. The Works department oversees all infrastructure development for the council and in conjunction with
LWSC will be responsible for the rehabilitation works for the Water Supply. As a body corporate and exercising
its delegated authority from the central government through the Ministry of Local Government and Housing, the
Chirundu Council is a shareholder in the LWSC Company.
The Regulatory and Legislative Framework
The following Acts provide the legislative framework within which the water supply and sanitation sector is
operated.

Chirundu WSS Feasibility Report Page 94 of 209
The Water Resources Management Act, 2011
The Act provides for the control, ownership and use of all water resources in the country. The Act establishes
the Water Resources Management Board and regulates the use of public water including protection against
pollution. It also outlines the functions and powers of different government institutions in the water resources
sector; provide for the management, development, conservation, protection and preservation of the water
resource and its ecosystems. It outlines guidelines for water utilization by members of the society and among
other things provides for the functions and composition of catchment councils, sub-catchment councils and
water users associations. It also provides for international and regional cooperation in, and equitable and
sustainable utilization of, shared water resources; provide for the domestication and implementation of the basic
principles and rules of international law relating to the environment and shared water resources as specified in
the treaties, conventions and agreements to which Zambia is a State Party.
The Chirundu Water and Sanitation development will need to abide by the SADC water protocols for shared
waters and the Zambezi River Authority guidelines, provided for by this Act. Chirundu town is partly bordered by
the international boundary with Zimbabwe, a member of SADC. As part of the compliance to this Act no permit
will be necessary as the Zambezi river source is a shared water course and the abstracted water is for local
consumption.
The Water Supply and Sanitation Act Number 28 of 1997
This act establishes the National Water Supply and Sanitation Council (NWASCO), a statutory regulatory body.
Its principal objective through NWASCO is to regulate water supply and sanitation service provision in Zambia.
NWASCO became operational in June 2000 and its objective is to improve service delivery, efficiency and
sustainability of water supply and sanitation at a fair price. NWASCO regulates large settlements and towns like
Chirundu that service more than 500 people.
The Act places the responsibility for the provision of Water and Sanitation Services (WSS) under local
authorities that are supervised by the Ministry of Local Government and Housing (MLGH) through the
Department of Infrastructure and Support Services (DISS). The Act provides room for operation of commercial
utilities in the Water Supply and Sanitation sector. The Department of Infrastructure and Support Services also
assists in the mobilization and co-ordination of financial resources for infrastructure development by WSS
providers.
Environmental Management Act and Licensing Regulations
This is the Principal Act on environmental management. That came into effect in 2011 and repeals and replaces
the EPPCA Cap 240 of 1990. It provides for the whole spectrum of environmental management including
protection, control of pollution and monitoring. Under the acts umbrella, various Statutory Instruments and
Regulations are produced that address various project components. These are broadly outlined in its various
Regulations contained in the Statutory Instrument No. 112 of 2013. These sections are listed below.

Chirundu WSS Feasibility Report Page 95 of 209
The Environmental Impact Assessment (EIA), Regulations, S.I No.28 of 1997
The Environmental Impact Assessment (EIA) Regulations, Statutory Instrument 28 of 1997, requires that an
Environmental Impact Assessment is conducted before the implementation of projects that are deemed to have
major potential negative impacts. This is done to facilitate the identification of possible mitigation and monitoring
measures well in advance during the initial planning stages. This is done in conjunction with all the Interested
and Affected Parties (IAP’s) with the oversight of the ZEMA. The impact identification, proposed mitigation and
monitoring plans are thereafter compiled and submitted to the ZEMA for review as either the Environmental
Project Brief (EPB), for smaller impact projects or Environmental Impact Statement for larger impact projects.
The Agency is also empowered to review Strategic Environmental Assessment (SEA) reports A Decision is
made after consideration by the Council. The proposed water supply rehabilitation works will have to comply
with the stipulations under this legislation according to the guidance related to the scope of works.
Environmental Management (Licensing) Regulations, S.I No.112 of 2013, PART II - Air Pollution Control
This SI provides for statutory discharge limits for the respective emission parameters and other pollutants into
the atmosphere in order to safeguard the general health, safety or welfare of persons, animal or plant life. This
includes property for the affected workers, industrial or business activities undertaken by a developer. The
regulations provide for licensing of gaseous waste emission to the environment. The project is not anticipated to
have air emissions other than vehicular fumes during the construction and operation period which will be
minimal. Further guidance from ZEMA will indicate if the proposed project will require a permit or licence related
to this regulation.
Environmental Management (Licensing) Regulations, 2013, PART II - Water Pollution Control
These regulations provide for the licensing of liquid waste discharge to the environment and also provides for
statutory discharge limits for respective effluent parameters. They also provide for the installation of appropriate
pre-treatment facilities and ensuring that the discharged effluent conforms to the conditions and standards for
chemical, biological and physical parameters contained in the table of standards for effluent and waste water,
set out in the Third Schedule of the regulations. This project will fully comply to this regulation as it only be
dealing with the treatment and supply of raw water.
Environmental Management (Licensing) Regulations, 2013 PART III - Waste Management License
This regulation provides for licensing of solid non-hazardous waste transportation and operating or owning of a
non- hazardous waste disposal site. There shall be no production of hazardous waste from the planned project
components requiring transportation. It is thus expected that the project may not be entirely be subject to this
regulation for compliance.
Environmental Management (Licensing) Regulations, 2013, PART IV - Hazardous Waste Management
These regulations provides for licensing of solid hazardous waste transportation and operating or owning of a
hazardous waste disposal site. They also reinforce the EMA in the management of the wider spectrum of
hazardous waste. This includes the control and monitoring of the generation, collection, storage and

Chirundu WSS Feasibility Report Page 96 of 209
transportation. The pre-treatment, treatment, disposal, export, and import over trans-boundaries are also
covered under these provisions. This project will not be dealing in hazardous waste and thus may not be have
to comply with this provision.
The Local Government Act, Ca0 282, 1991
This Act provides for the establishment of the local Councils and their functions. Some of these relate to
pollution control and protection of the environment. The relevance of this ACT is that it allows for supervision of
the local councils by the Central Government vis-à-vis city planning and pollution management and the
implementation of infrastructure projects like Water Supply and Sanitation projects. The LWSC will comply with
this Act through its close collaboration with the MLGH at the ministerial level and the Chirundu District Council
for the actual implementation of the proposed water rehabilitation works. This constant liaison with the council
has established its willingness and acceptance to the implementation of the project.
Public Health Act Cap 295 of 1978
This Act provides for prevention and suppression of public health hazards. It regulates all matters and activities
that are connected to outbreak of diseases and pollution of drinking water sources and storage facilities. It
ensures that these facilities are protected from harm that can harm human beings.
The Act also requires that councils fumigate households under their jurisdiction to control malaria by killing the
mosquitoes in ponded or riverine areas. Councils implement provisions of the Act through licensing and
inspections. Wherever human activities take place, issues of public health are critical. Environmental aspects of
the project that shall require adherence to the Act include provision of waste management facilities, sanitation
facilities, food, shelter for eating, drinking water storage and food storage facilities. The project proponent shall
ensure that all issues of public health are understood, implemented and sustained during the rehabilitation
works. The LWSC will have to obtain health permits related to water supply within the district
The Occupational Health and Safety Act (No. 36 of 2010)
This Act is enforced by the Occupational Health and Safety Institute, and provide for the health, safety and
welfare of persons at work. The Act also defines duties of manufacturers, importers and suppliers of articles,
devices, items and substances for use at work in relation to health and safety. It also imposes the responsibility
of protecting persons, other than persons at work, against risks to health or safety arising from the employer’s
operations. It provides general guiding principles for occupational health and safety. The rehabilitation works will
have to be managed in compliance with the Act and LWSC will have to put in place measures to ensure the
safety and protection of both workers and the general public.
Disaster Mitigation and Management Act
The Disaster Management and Mitigation Unit (DMMU) is vested in the Office of the Vice President and was
created in 1994. The following are the objectives of DMMU:

Chirundu WSS Feasibility Report Page 97 of 209
To put in place appropriate preparedness measures in order to manage disasters effectively and
efficiently
To activate response mechanism for effective and timely search and rescue operations in order to save
life and reduce damage to property.
To put in place measures to restore livelihoods and other life support systems to affected communities.
To mitigate the disruptive and destructive effects of hazards and all disasters in order to reduce their
impact on vulnerable communities, assets and the environment
To put in place preventive measures in order to reduce the negative effect of hazards and strengthen
the national capacity for disaster management in order to avoid the adverse impact of hazards.
To effectively co-ordinate disaster management activities through a body of procedures and practices in
order to avoid duplication of efforts and resources at all levels.
The district of Chirundu is in the belt that is prone to both natural and man-made disasters. The company
(LWSC) will coordinate with the unit in case of any such occurrence that may impact on the Water Supply
Infrastructure including the proposed rehabilitation works.
The National Heritage Conservation Commission Act
This Act establishes the National Heritage Conservation Commission (NHCC), which is responsible for the
conservation of ancient, cultural and natural heritage, relics and objects of aesthetic, historical, prehistoric,
archaeological or scientific interest by preservation, restoration, rehabilitation, reconstruction, adaptive use and
good management. The Commission also provides regulations for archaeological excavation and export of
relics. If a development is unable to proceed without affecting an item of heritage, permission must be sought
from the NHCC as outlined in Sections 35 and 36 of the Act.
This Act is relevant to the project in that the activities of the project will involve excavation which may in the
process lead to the discovery of artefacts or objects of archaeological significance. These will need to be
reported to the National Heritage and Conservation Commission (NHCC), the statutory regulatory body that
oversees all matters related to the heritage conservation. Chirundu town is in the vicinity (20 km) of one such
heritage area known as ‘In’gombe Ilede’.
It is an Iron Age prehistoric site on the highest point of a ridge of the same name, on the left bank of the Lusitu
River, a tributary of the Zambezi River in southern Zambia. In the local Tonga language the name means “the
place where the cow sleeps or lies down.
The International Conventions and Treaties
The regulatory framework within which this project falls is also governed by international treaties and
conventions to which the country of Zambia is a signatory party or has acceded. Some of these are outlined
below.

Chirundu WSS Feasibility Report Page 98 of 209
Convention on Biological Diversity (CBD)
This convention identifies the responsibility of states to conserve their biological diversity and use their biological
resources sustainably. The convention has become an important framework for conservation related activities
on the regional and international level. It requires that the contracting parties anticipate, prevent and address the
causes of reduction or loss of biological diversity. To achieve this, the parties are required to among others:
Establish a system of protected areas where special measures are taken to conserve biological
diversity.
Develop guidelines for the selection, establishment and management of protected areas.
Regulate or manage biological diversity within the protected areas with a view to ensure sustainability.
Promote the protection of ecosystem, natural habitats and maintenance of viable populations of
species.
Promote environmentally sound and sustainable development in areas adjacent to protected areas.
Rehabilitate and restore degraded ecosystems and promote the recovery of threatened species, inter
alia, through the development and implementation of action plans or other management strategies.
Prevent the introduction of, control or eradicate those alien species which threaten ecosystems, habitats
or species.
Zambia ratified the CBD in May 1993, and as part of the compliance highlighting the relevance of this
convention, the proponent shall strive to implement the proposed project within this framework, especially as it
relates to the trans-frontier boundary for protected species.
The World Heritage Convention
This is also known as the Convention concerning the Protection of the World Cultural and Natural Heritage. It
aims to protect areas of outstanding global cultural or natural value. The following are considered natural sites:
Natural features consisting of physical and biological formations which are of outstanding universal
value, aesthetic or scientific.
Geographical and physiographical formations and precisely delineated areas which constitute the
habitat of threatened species of animals and plants of universal value from the point of science or
conservation.
Natural sites or precisely delineated areas of outstanding universal value from the point of view of
science, conservation or natural beauty.
These guidelines are there to enable the convention achieve its primary objective of the protection of habitats
and ecosystems rather than the species. To achieve its objectives, developers are required to integrate heritage
protection into comprehensive planning programmes, set up services for heritage protection, and develop
scientific, technical, administrative and financial measures necessary for the identification, protection,
conservation and protection. Zambia ratified the convention in June 1984 and the Victoria Falls is the only site to
have been declared a World Heritage Site.
The relevance of this convention is appreciated as the proponent shall take cognizance of the presence of any
site within the project area and avoid encroachment or any actions that may subtract from this establishment,
though it not itself a selected heritage site.
Chirundu WSS Feasibility Report Page 99 of 209
Convention on International Trade in Endangered Species of Wild Flora and Fauna (CITES)
This convention aims to protect threatened species from the detrimental effects of international trade. Over 150
species have been identified due to their status as being threatened by extinction, are not allowed to be traded
commercially, while another 150 species are only allowed to enter the international trade under specific
controlled circumstances. Many threatened African species are covered and include all Raptors, Owls and
Parrots. Zambia ratified and contracting party status entered into force in August 1981. The proposed project
has as one its sites a local forest.
Compliance to this convention has been through investigating the presence of any endangered, threatened or
endemic species. None of these were identified within or near the vicinity of the site.
United Convention to Combat Desertification in those Countries Experiencing Serious Drought and /or
Desertification, particularly in Africa (UNCCD)
This convention aims to combat desertification and mitigate the effects of drought. Desertification is defined as
land degradation in arid, semi-arid and sub-humid areas, resulting from factors such as climatic variations and
human activities. The main tools are regional and national action programmes.
Article 8 of the regional implementation Annex for Africa demands the National Action Programmes to include
measures to conserve Natural Resources by ensuring Integrated and Sustainable Management of natural
resources, and training with regard to public awareness and environmental education campaigns.
The relevance of this convention is that Zambia ratified this convention as a member of the UN system,
Adherence shall be through close collaboration by the proponents with the Ministries of Lands and
Environmental Protection and Agriculture to ensure an effective implementation of the proposed project.
United Nations Framework Convention on Climate Change (UNFCCC)
This is one of the most widely accepted global conventions. Its ultimate objective is to stabilize greenhouse gas
concentrations in the atmosphere at a level that would prevent dangerous anthropogenic interference with the
climate system. It is anticipated that such levels should be achieved within an agreed time frame to allow
ecosystems to adapt naturally to climate change. The Kyoto Protocol contains the individual emissions
limitations and reductions commitments for a range of developed -country parties.
Though, the convention has widespread acceptability, agreement on cap emission values has been virtually
impossible as evidenced by the inconclusive Copenhagen and Doha Conferences on Climate Change in 2010
and 2012 respectively. The dispute was caused by a general lack of agreement between the developed and
developing countries on the same cap values. The 2015 Paris Conference made some substantial progress,
with the United States and China (major producers of Green House Gases (GHG), that contribute to Global
Warming Potential (GWP) and Global Warming (GW)) agreeing that they will ratify and implement the
provisions of the conference. Nevertheless, Zambia ratified the convention in May 1993 and signed The Kyoto
Protocol in August 1998. Meanwhile, the new climate treaty was signed in the United States of America and
Chirundu WSS Feasibility Report Page 100 of 209
Zambia is one of the signatories to it, to ensure it implements the international guidelines that seek to implement
sustainable climate resilient projects.
The relevance of this convention is that it provides a framework within which this project implementation may be
undertaken as respects the compliance to climate change issues. The proposed project is being implemented to
facilitate resilience of communities in light of climate change.
Identification of Potential Environmental and Social Impacts
The potential impacts, positive and negative, were evaluated for the project.
The Positive Impacts on the social-economic and cultural environment
Enhanced Economic Development
The rehabilitation of the water treatment plant in Chirundu will invariably result into improved water supply to
newly created and rapidly growing district of Chirundu. The water supply will be supplied to both residential and
industrial areas thereby enhancing economic and industrial development.
Increased Employment Opportunity
The rehabilitation will create increased opportunities for employment for the local residents and other qualified
staff from its operations. There will be a more than 200 persons at the site during the construction of the civil
works and installations. There will be a multiplier effects shall be created for the material suppliers, equipment
and tank providers and other construction materials.
Improved Welfare of the Local Population
The proposed project shall provide an economic avenue for the local people. The resources obtained from the
employment opportunity will not only enable the households to weather the difficult times but also increase the
amount of disposable income into other sectors of the economy. This will ultimately uplift the welfare of the
general local population
Increased Government Revenue
This project will result into more avenues for revenue collection by the Government of the Republic Zambia by
increasing number of people accessing and paying for the water.
Impacts on Welfare of Women (Gender)
Water collection, storage, and treatment are predominantly perceived as women’s roles across all income
levels. In addition to physical stress, the mental anxiety due to unreliable water supply, and the pressure to
manage their basic needs falls disproportionately on women. This project will ensure that it improves the welfare
of women.

Chirundu WSS Feasibility Report Page 101 of 209
Impacts on Health
The project will have a massive positive impact on the health of the population by increasing the amount of
people who are able to access clean and reliable portable water. This in essence reduces the amount of
diarrhoea diseases thereby improving the health of the people.
The Negative Impacts on the social - economic and cultural environment
Impacts on Health and Safety
During the rehabilitation activities that shall be undertaken on site during the project construction and operation
there is a possibility of accidents happening on site which may result in loss of limb or unfortunately life. The
non-availability or proper use of personal protective equipment further compounds this risk and may expose
workers to chest inhalations that may be damaging to their health.
Impacts on the Health (HIV /AIDS)
It is anticipated that the rehabilitation project will be affected by the prevailing HIV/AIDS epidemic in Zambia.
The estimates are that urban areas are typified by higher HIV prevalence (20 percent) than rural areas (10
percent). Coupled with higher illiteracy levels and poverty, the rate is anticipated to increase. According to the
National Aids Council / United Nations AIDS - Zambia country report for 2012, under its epidemiological
synthesis of the epidemic, it was estimated that most of the new infections among adults were in individuals
whose partners had casual heterosexual sex (37 per cent), followed by individuals reporting casual
heterosexual sex (34 per cent), those reporting low risk heterosexual sex i.e. mutual monogamy (21 per cent),
and clients of female sex workers (4 per cent). One per cent of new infections were estimated to occur in sex
between men through unprotected anal sex and 3 per cent from other causes. The project will provide
employment during the construction and operation phase as skilled and unskilled. Short term relationship
between men employed to rehabilitate the treatment plant and women in nearby communities may result in an
increase in STIs and HIV/AIDS in the area. This situation will be compounded by Chirundu being a border town
with slightly higher STIs and HIV/AIDS incidence rates.
Social and Cultural Settlement Impact
It is anticipated that the project will bring about an influx of people from outside the project area in search of
jobs. The Contractor is also expected to come with a team of skilled personnel for various specialized tasks
during the entire construction phase.
Experience derived from past projects, shows that most of the construction workers leave their spouses in their
respective places of residence as it is assumed to be burdensome. Arising from this, some workers develop the
tendency of getting women from the areas where they have camped.
This could create conflict between the villagers and the construction workers, which could even culminate into
social strife leading to delays in work schedules. The influx of people into the project area may breed social
problems such as theft, prostitution and drug abuse. This impact will be localized, have a short duration
expected to be related to the duration of the construction.
Chirundu WSS Feasibility Report Page 102 of 209
Health facilities
The mild increase in the local population due to the proposed project will create some pressure on the existing
health facilities in the local areas. With the increase of people in the areas it can be expected that the workers
would have to use the local health facilities. The severity of this impact is localized.
The Negative Impacts on the bio physical environment
Impacts on Flora and Fauna
The risk of adverse impact on flora and fauna will be minimal as the rehabilitation will be of the existing network
and infrastructure. As described in the section for biophysical assessment, local flora exists in interspersed
sections and small sized fauna and birds exists, there is also the presence of hippos and crocodiles along the
river where the abstraction points are located. There are no protected or vulnerable species.
Air Pollution during construction
Construction unavoidably creates dust during the course of site works due to material and vehicle movement
and construction activities. Fine particles may also be lifted from exposed surfaces by the action of wind,
although the extent and nature of the generated dusts is dependent upon the materials to be used. Dusts,
particularly finer particulates, can present respiratory problems when inhaled, as well as potential allergic
reactions. In addition, dusts can cause nuisance problems when redeposited. It established that no air quality
monitoring data is available for the area however, given the absence of any significant industrial and commercial
processes to be implemented, it is considered that the air quality will be minimally impacted.
Noise and Vibration during construction
Noise can have a significant effect on the environment and on the quality of life enjoyed by individuals and
communities. The perception of noise may be reflected by many factors (acoustic and non-acoustic) but in
general the impact in response to a noise depends on the level of noise, the margin by which it exceeds the
background level, its spectral character and temporal variation.
Other factors may also be important including time of day, day of the week, duration and other acoustic
features. Vibrations, even very low magnitude, may be perceptible to people and can interfere with the
satisfactory conduct of certain activities. Noise will be generated during the construction works by both the use
of machinery, movement of materials and the movement of vehicles, and could cause a nuisance to local
residents.
Impacts due to Solid Waste
Generation of waste materials during site preparation and installation of tanks and pipes could lead to pollution
of surrounding environment. Throughout construction, the workforce will generate general refuse comprising
food scraps, waste paper, empty containers etc. The storage, handling and disposal of general refuse have the

Chirundu WSS Feasibility Report Page 103 of 209
potential to give rise to some environmental impacts if not properly managed. These include odour if waste is
not collected frequently, windblown litter, water quality impacts if waste enters water bodies, and visual impact.
Rapid and effective collection of site wastes will therefore be required. With the implementation of good site
practices and the recommended mitigation measures on disposal arrangements, adverse environmental
impacts are not expected to arise during the construction works.
Pollution of Surface water
A number of activities associated with the rehabilitation of the water reticulation system plant will generate
pollutants that may contaminate surface water resources. These include:
Sediment and other pollutant loaded run off from the surrounding area.
Sediments and run-off from loosened soil on land clearing
Sediment loaded run-off from earthworks during construction
It is important to put in place management structure because if unchecked the severity of this impact is high and
tends to have a wide spatial extent due to the stream or channel flow and direction.
Water and Sanitation
The project will likely create demand for water and sanitation facilities in Chirundu. This will be as a result of the
mild increase in the population during the construction phase. It is envisaged that appropriate and adequate
sanitary facilities like pit latrines and places to bath shall be constructed for the workers to address the situation.
Domestic waste generated at the camps for workers could adversely affect the sanitation in the area. Domestic
waste such as leftover foodstuffs and human waste could pollute the environment if not well managed.
Mitigation for Negative Impacts
Table 24 provides mitigation actions and approaches for the identified negative impacts.
Table 24 Mitigation of Negative Impacts
No. Activity/Impact Mitigating Actions and Approaches
1. Spills or leaks of fuels, lubricants or
chemicals from machinery and
vehicles may contaminate
groundwater
Spill control measures will be implemented to prevent spills
from infiltrating into the groundwater table. The Measures
will include appropriate materials handling and storage
procedures, and
development of contingency plans in the event of a spill
2. Noise pollution during
construction All machinery and vehicles will be operated efficiently and
according to the manufacturers

Chirundu WSS Feasibility Report Page 104 of 209
No. Activity/Impact Mitigating Actions and Approaches
specifications, by trained and qualified operator
The activities likely to cause adverse noise impacts will be
timed to have least impact on
surrounding land users and other site activities (such as
the schools and the hospitals)
Make sure all personnel are issued with hearing protection
and are advised of its proper use
Consultation of earthwork hours with affected residents and
nearby sensitive receivers
3. Inadequate storage and
management of litter, construction
waste and liquid wastes prior to
disposal
Waste management measures will be implemented to
prevent litter and debris and liquid wastes from entering
soil excavations
4. Effluent from construction workers’
temporary
amenities leaching into
groundwater, carrying nutrients and
micro-organisms
Provision of temporary amenities for workers were
appropriate.
The existing sanitary facilities on the WTP will be availed to
the construction staff during the construction period.
5. Contamination of the storm
water from litter and construction
wastes
Waste control measures will be implemented to prevent
litter and construction waste from
infiltrating into the groundwater table
Provision of suitable workers’ amenities facilities. If
possible, effluent should be disposed of off-site at nearby
STP
6. Odour generated from sewer of
worker's amenities Provision of suitable workers’ amenities, located within the
construction area and, if possible, downwind from
residential areas
7. Traffic congestion The construction management team shall install warning
signs and specified speed limits (site roads will reduce
traffic speeds to 20 km/h) areas
The construction activity shall be timed, such as restricting
construction traffic to designated roads during designated
times, avoiding peak hour traffic

Chirundu WSS Feasibility Report Page 105 of 209
No. Activity/Impact Mitigating Actions and Approaches
8. Exhaust and Dust emissions
generated from earthworks due to
loading and unloading of materials
on site and from uncovered
truckload in addition to the potential
dust emissions that could occur as
a result of excavation for the water
supply network
The height of the slope of stockpiles shall be minimised to
ensure erosion of unconsolidated
materials during rainfall events does not occur
Dusty vehicle loads transported to, from and within the
Project site will be covered by sheets and should not be
overloaded
The use of water sprays to decrease dust generation will
be undertaken
Regular maintenance and inspection programs will be
implemented
Proper and efficient operation of construction machinery
and vehicles by qualified workers
Regular maintenance and inspection program for all
vehicles
9. Inadequate storage and
management of litter, construction
waste and liquid wastes prior to
disposal
Waste management measures will be implemented to
prevent litter and debris and liquid wastes from entering
soil excavations
10. Effluent from construction workers’
temporary
amenities leaching into ground
water organisms
Provision of temporary amenities for workers were
appropriate.
11. Potential Public Safety Concerns
associated with the excavation
works for the installation of the
water supply network
The area surrounding the excavations will be fenced off or
otherwise restricted from public access to prevent injury or
accident due to entry onto a construction site
Impact Assessment Matrix
Definition and criteria of the Impacts Significance
In this assessment we made use of qualitative risk assessment whereby the impacts are rated as ‘low’,
‘medium’ or ‘high’ according to two parameters – the severity of the impact (Consequence) and the likelihood
of its occurrence. The severity depends on the nature and size of the activity/aspect and the environmental and
social sensitivity/value of resources/receptors, while the likelihood depends upon the nature of the
activity/aspect and the control/mitigation measures in place.

Chirundu WSS Feasibility Report Page 106 of 209
Evaluation criteria of the Impacts Significance
Nature of the Impact
This is an appraisal of the type of effect the proposed activity would have on the affected environmental
component. Its description includes what is being affected and in what way. This includes both the positive and
negative.
Direct Impact - This is an impact that appears immediately as a result of an activity of the project. For
example, the loss of ecological habitat is a direct impact. The direct impacts would be experienced
mainly during the site preparation and clearing, and include effects on the physical environment, health
and safety of the workers during the operation phase.
Indirect Impact - This is an impact that is related to the project but it‘s of secondary nature and
presents itself in an indirect way. The indirect impacts are primarily socio-economic and extend beyond
the project implementation. Unlike the direct impacts, which occur in the immediate environment, the
indirect impacts would be felt in the adjacent regions.
Spatial Extent
The physical and spatial size of the impact. It is a description of whether the impact would occur on a scale
described as follows:
Site - the impact could affect the whole or measurable portion of the site. Whether it is limited to the
immediate area of the proposed project
Local - the impact could affect the extended area adjacent to the site perhaps a neighbourhood or small
town. Whether it would affect environs up to 15km outside the immediate environment
Regional - that impact could affect the area including the outlying areas of the city, the transport routes
and the adjoining towns.
National - the impact could be as far reaching international boundaries.
Duration of the Impact
The lifetime of the impact; this is measured in the context of the life-time of the proposed development.
Short term -the impact will either disappear with mitigation or will be mitigated through natural process
in a span shorter than the construction phase.
Medium term- the impact will last for the period of the construction phase, thereafter it will be entirely
negated.
Long term-the impact will continue or last for the entire operational life of the development, but will be
mitigated by direct human action or by natural processes thereafter.
Permanent- the only class of impact which will be non-transitory. Mitigation either by man or natural
process will not occur in such a way or in such a time span that the impact can be considered transient.

Chirundu WSS Feasibility Report Page 107 of 209
Intensity of the impact
A description of whether or not the intensity (magnitude) of the impact would be high, medium, low or negligible
(no impact). An attempt will be made to quantify the impacts on components of the affected environment will be
described as follows: Is the impact destructive, or benign? Does it destroy the impacted environment, alter its
functioning, or slightly alter it? These are rated as follows:
Low,- where the impact will not have significant influence on the environment, and this will not be
required to be significantly accommodated in the project design or implementation; the impact alters the
affected environment in such a way that natural processes of functions are not affected in any
significant way.
Moderate- where it could have an adverse influence on the environment which would require
modification of the project design or alternative implementation schedules; The affected environment is
altered, however, function and process continue, albeit in a modified way.
High- where it could have significant influence on the environment but cannot be mitigated or be
accommodated by the project environment by introducing alternative mitigation measures such as
realignment at a particular stretch or adoption of different design measures. Function or process of the
environment is disturbed to the extent where it temporarily or permanently ceases. This will be a relative
evaluation within the context of all the activities and the other impacts within the framework of the
project. Note that some impacts have a high intensity and a short duration with no permanent effects.
Determination of Significance
Significance is an indication of the importance of the impact in terms of physical extent, intensity and time scale,
and therefore indicates the level of mitigation required. Usually the community is involved in provision of
information and determination on the characteristics of the impacts and the significance is determined based on
this information.
Probability
This describes the likelihood of the impacts actually occurring. The impact may occur for any length of time
during the life cycle of the activity, and not at any given time. The classes are rated as follows:
Unlikely - the probability of the impact occurring is very low, due to either the circumstances, design or
experience.
Possible - the impact could possibly happen, and mitigation planning should be undertaken.
Probable - it is most likely that the impact will occur at some or other stage of the development. Plans
must be drawn up before the undertaking of the activity.
Definite - the impact will take place regardless of any prevention plans, and only mitigatory actions or
contingency plans can be relied on to contain the effect.
Environmental Risk quantification
Environmental risk is the chance of something happening that will have an impact upon environmental
objectives or performance. Environmental risk is measured in terms of consequence (severity) and likelihood

Chirundu WSS Feasibility Report Page 108 of 209
(probability) of the event happening. As part of a risk identification and prioritization process undertaken during
the preparation of the Environmental Assessment for the project, all potential environmental impacts were
identified and each potential impact allocated an environmental risk rating based on the potential consequences
and likelihood of occurrence.
Table 25 Qualitative Likelihood Rating
Level Descriptor Description
A Almost Certain Is expected to occur in most circumstances.
B Likely Will probably occur in most circumstances.
C Possible Could occur.
D Unlikely Could occur but not expected.
E Rare Occurs only in exceptional circumstances.
The allocation of a consequence rating is based on the definitions contained in Table 26. It is noted that the
assigned consequence rating represents the highest level applicable, i.e. if a potential impact is assigned a level
of 4 - Major based on impact to the environment and 2 - Minor based on area of impact, the consequence level
assigned would be 4 - Major.
Table 26 Environmental Risk Rating
Likelihood
Consequences
Insignificant
1
Minor
2
Moderate
3
Major
4
Catastrophic
5
A - (Almost Certain) H H E E E
B - (Likely) M H H E E
C - (Possible) L M H E E
D - (Unlikely) L L M H E
E - (Rare) L L M H H
The four risk aspects are defined as follows:
Low (L): Requiring a basic assessment of proposed controls and residual impacts. Any residual
impacts are unlikely to have any major impact on the local environment or stakeholders.
Moderate (M): Requiring a medium level assessment of proposed controls and residual impacts. It is
unlikely to preclude the development of the Project but may result in impacts deemed
unacceptable to some local or government stakeholders.
High (H): Requiring in-depth assessment and high level documentation of the proposed controls and
mitigation measures. Ultimately, this level of risk may preclude the development of the
Project.

Chirundu WSS Feasibility Report Page 109 of 209
Extreme (E): Requiring in-depth assessment and high level documentation of the proposed controls and
mitigation measures and possible preparation of a specialized management plan. Unless
considered to be adequately managed by the controls and/or management plan, this level of
risk is likely to preclude the development of the Project.
The risk associated with each environmental impact was assessed without the inclusion of any operational
controls or safeguards in place and based on the qualitative assessment of consequence and likelihood, an
environmental risk ranking of either; low, medium, high or extreme was assigned to each potential impact based
on the matrix. The assessment of environmental impacts and residual risk after mitigation is provided in Table
27 (Construction) and Table 28 (Operational). The tables summarize the impacts for each activity related to the
project and presents the magnitude, likelihood and consequence of each impact.

Chirundu WSS Feasibility Report Page 110 of 209
Table 27 Analysis of Residual Risk – Construction Phase
Potential
Environmental
Impacts
Level/Scale of Impact
Unmitigated
Risk Rating
Consequence
of
Occurrence if
Mitigated
Likelihood
of
Occurrence
if Mitigated
Residual
Risk Rating
Air Quality
A Nuisance- deposited
dust
Deposited dust levels attributable to the Project
during the construction phase M 2 D L
Erosion and Sedimentation
B
Soil erosion
Minor gully erosion of drainage lines, stockpiles
or created slopes H 2 D L
C Minor sheet or gully erosion of rehabilitated
landform M 2 D L
D Major gully or sheet erosion formation H 3 D M
Ground /Soil pollution of the project site
E General use of
vehicles and
machinery
Water for wash down of vehicles and machinery
on site may contaminate groundwater L 2 D L
F Spills or leaks of fuels, lubricants or chemicals

Chirundu WSS Feasibility Report Page 111 of 209
Potential
Environmental
Impacts
Level/Scale of Impact
Unmitigated
Risk Rating
Consequence
of
Occurrence if
Mitigated
Likelihood
of
Occurrence
if Mitigated
Residual
Risk Rating
from machinery and vehicles L 2 D L
G Source of noise H 4 E H
Threatened Flora and Fauna
H Loss of, or
alteration to,
existing habitats
Disturbance to native vegetation/ habitat
within the project area L 2 E L
I Reduced
biodiversity Local biodiversity M 3 D M
Noise and Vibration
J Increased noise
levels associated
with construction
activities causing
annoyance,
distractions, i.e.
Amenity impacts.
Occasional minor exceedance of noise criteria H 2 A H
K Regular minor exceedance of noise criteria H 2 D L
L Occasional marginal exceedance of noise H 2 C M
M Regular marginal exceedance of noise criteria H 2 D L
N Occasional major exceedance of noise criteria E 2 C M

Chirundu WSS Feasibility Report Page 112 of 209
Potential
Environmental
Impacts
Level/Scale of Impact
Unmitigated
Risk Rating
Consequence
of
Occurrence if
Mitigated
Likelihood
of
Occurrence
if Mitigated
Residual
Risk Rating
O Increased noise /
vibration levels
associated with
Project traffic
activities causing
annoyance,
distractions, i.e.
amenity impacts.
Occasional minor exceedance of noise criteria M 2 D L
P Regular minor exceedance of noise criteria M 3 D M
Q Occasional marginal exceedance of noise M 2 E L
R Regular marginal exceedance of noise criteria M 3 E M
S Occasional major exceedance of noise criteria M 3 E M
T Regular major exceedance of noise criteria M - - N
Cultural Heritage site
U
Impact on identified
sites of cultural
heritage
L N
Waste Management
V Contamination by
waste oil
Contamination requiring minor recovery Works L 2 D L
W Contamination requiring major recovery Works M 3 D M
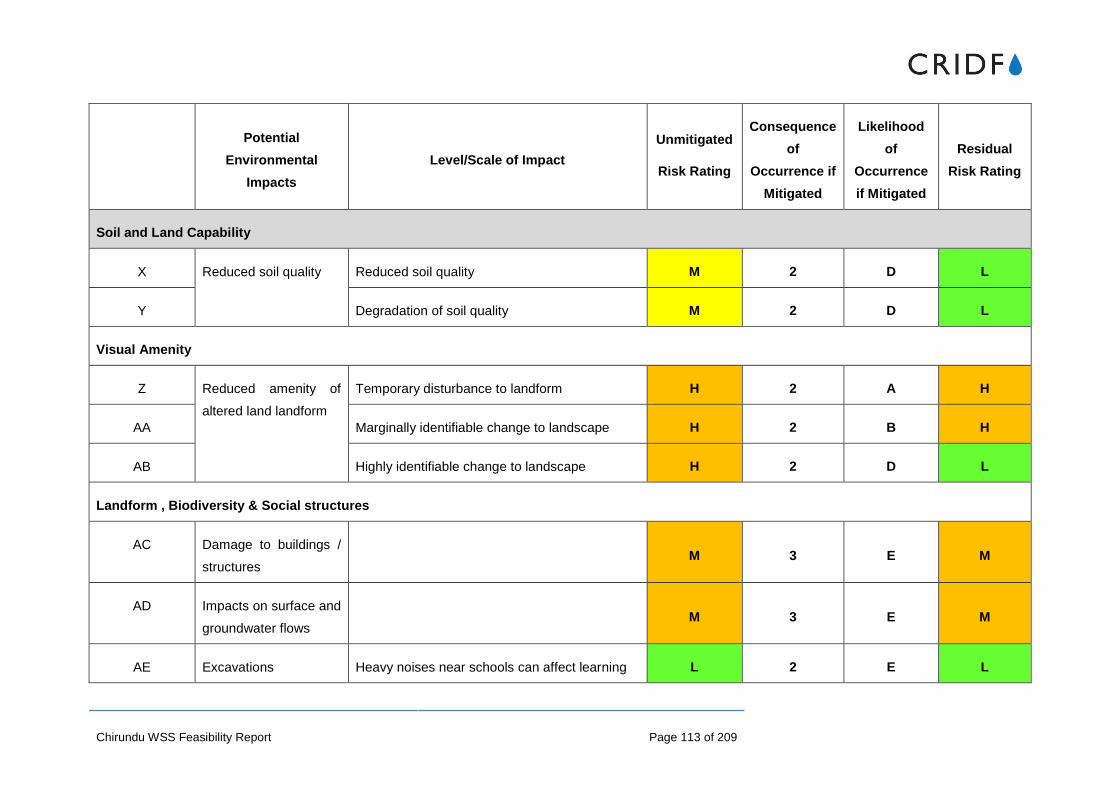
Chirundu WSS Feasibility Report Page 113 of 209
Potential
Environmental
Impacts
Level/Scale of Impact
Unmitigated
Risk Rating
Consequence
of
Occurrence if
Mitigated
Likelihood
of
Occurrence
if Mitigated
Residual
Risk Rating
Soil and Land Capability
X Reduced soil quality Reduced soil quality M 2 D L
Y Degradation of soil quality M 2 D L
Visual Amenity
Z Reduced amenity of
altered land landform
Temporary disturbance to landform H 2 A H
AA Marginally identifiable change to landscape H 2 B H
AB Highly identifiable change to landscape H 2 D L
Landform , Biodiversity & Social structures
AC Damage to buildings /
structures
M 3 E M
AD Impacts on surface and
groundwater flows
M 3 E M
AE Excavations Heavy noises near schools can affect learning L 2 E L

Chirundu WSS Feasibility Report Page 114 of 209
Potential
Environmental
Impacts
Level/Scale of Impact
Unmitigated
Risk Rating
Consequence
of
Occurrence if
Mitigated
Likelihood
of
Occurrence
if Mitigated
Residual
Risk Rating
AF Dust emissions generated from earthworks L 1 E M
AG Contamination of water from exposed soils M 2 C M
AH Health and Safety Potential public safety concerns M 3 B M
Consequence of Occurrence: 1=Insignificant; 2=Minor; 3=Moderate;4=Major; 5=Catastrophic
Likelihood of Occurrence: A= Almost Certain; B=Likely; C = Possible; D =Unlikely; E=Rare
Risk Rating: E=Extreme , H=High; M=Moderate; L=Low; N =Nil.

Chirundu WSS Feasibility Report Page 115 of 209
Table 28 Analysis of Residual Risk – Operational Phase
Potential Environmental
Impacts Level/Scale of Impact
Unmitigated
Risk Rating
Consequence
of Occurrence
if Mitigated
Likelihood of
Occurrence if
Mitigated
Residual Risk
Rating
Traffic Management
A
Delivery of Water
Treatment Plant
supplies
Increase traffic of vehicles required to deliver
materials and supply for the treatment
processes
M 1 D L
Surface water abstraction
B
Water abstraction from
the Zambezi River
Water drawdown H 2 C L
C Unsustainable water use M 1 D L
D Decrease in water available for existing flora
and fauna in the river H 3 D M
E Effects on the current fishing activities N N E N
Ground /Soil pollution of the project site
F
Pump room operation
Halted operation due to electricity cuts L 2 D L
G Pollution in case generators are needed L 2 D L

Chirundu WSS Feasibility Report Page 116 of 209
Potential Environmental
Impacts Level/Scale of Impact
Unmitigated
Risk Rating
Consequence
of Occurrence
if Mitigated
Likelihood of
Occurrence if
Mitigated
Residual Risk
Rating
H
Contamination of water due to spills and
propagation of chemical elements (e.g. PCB,
oil, etc.)
H 4 C H
I Risk of leakage from fuel storage tanks H 3 C H
Consequence of Occurrence: 1=Insignificant; 2=Minor; 3=Moderate;4=Major; 5=Catastrophic
Likelihood of Occurrence: A= Almost Certain; B=Likely; C = Possible; D =Unlikely; E=Rare
Risk Rating: E=Extreme , H=High; M=Moderate; L=Low; N =Nil.

Chirundu WSS Feasibility Report Page 117 of 209
Table 29 summarize the impacts for each activity related to the project and presents the spatial extent and
frequency, of each impact.
Table 29 Evaluation matrix for potential environmental impacts
Activity
Type of Impact Spatial Extent Frequency /
Duration
CONSTRUCTION PHASE
Site Preparation Construction of the water network may cause
increase in traffic in the area
Local Short term
Construction of a temporary site offices Local Short term
Commercial activities hindered because of the
difficulty of access
Local Short term
General use of
vehicles and
machinery
Water for wash down of vehicles and machinery
on site may contaminate groundwater
Significant Long term
Spills or leaks of fuels, lubricants or chemicals
from machinery and vehicles
Local Long term
Source of noise site Short term
General labourers
presence on site
Inadequate storage and management of litter,
construction
site Short term
Effluent from construction workers ‘temporary
amenities leaching into groundwater, carrying
nutrients and micro-organisms
Regional Long term
Contamination of the storm water from litter and
construction wastes and untreated effluent from
temporary workers' amenities
Regional Short term
Excavation works Heavy noises near schools can affect learning Site Short term
Dust emissions generated from earthworks due to
loading and unloading of materials on site and
from uncovered truckload
site Short term
Contamination of storm water from exposed soils Local Short term
Potential public safety concerns associated with
the excavation works for the installation of the
water supply network
site Short term
Disposal of debris
hauling to an
approved location
Traffic congestion Local Short term
Adverse impact on the health of the workers and
residents in and around the due to deterioration
of the air quality, increase of noise and traffic
Site Short term
Volatile emissions during earthwork phase from
solvents and fuels stored or used on the Project
Site Short term

Chirundu WSS Feasibility Report Page 118 of 209
Activity
Type of Impact Spatial Extent Frequency /
Duration
site
Exhaust and dust emissions from construction
vehicles and machinery
Site Short term
OPERATION PHASE
Delivery of Water
Treatment Plant
supplies
Increase traffic of vehicles required to deliver
materials and supply for the treatment processes
Local Long term
Water extraction
from the river
Water drawdown Regional Long term
Unsustainable water use Regional Long term
Decrease in water available for existing flora and
fauna in the river
Local Long term
Effects on the current fishing activities Local Long term
Challenges and Anticipated Impacts
Challenges and Anticipated Environmental and Social Impacts
The feasibility study for the existing water supply in Chirundu has noted that the system will require rehabilitation
that will involve the replacement of the dilapidated network parts and extension of the network in certain areas
that are hitherto un-serviced by the current system.
The current water supply system is inadequate to meet the current and projected water demand. This scenario
has been caused by several challenges that are existent within the district. They are summarised below:
Inadequate and erratic provision of operational funds to the utility company to afford regular
maintenance of the installed works.
Low or erratic funding to the local authority that affects their service provision of supervision and
inspections.
Poor or non-existent supervision and inspections by the local authority of the building of residential,
commercial and recreational structures within the district
Failure to comply with the strategic development plans of the district by the residents resulting into
encroachment on public utilities infrastructure and reserve land.
Low or non-existent enforcement of the breach of council by-laws by the local authority due to the
operational challenges and attendant litigation and compensation costs
Some of the effects are shown in Figure 26 and Figure 27.

Chirundu WSS Feasibility Report Page 119 of 209
Figure 26 Encroachment of water utility lines by housing structures
Figure 27 Unplanned road network encroaching on the water supply network
It is anticipated that these challenges outlined above have resulted into an unmitigated development status quo,
which will be impacted by the proposed rehabilitation works for the water supply. While positive environmental,
public health and economic benefits will accrue from proposed project, negative environmental and social
impacts are anticipated.
The principal ones will include, but not exclusive to the following:
Potential demolition of some housing and commercial structures due to realignment of existing network
or establishment of the new extensions.
Potential disruption of the road network thus impacting on the smooth flow of the local and international
traffic.
Loss of business due to the negative impact on the flow of local and international traffic
Recommendations
The feasibility has established the need for the rehabilitation of the water reticulation in Chirundu due to the
various factors outlined in the foregoing sections. Undertaking the proposed water supply rehabilitation works
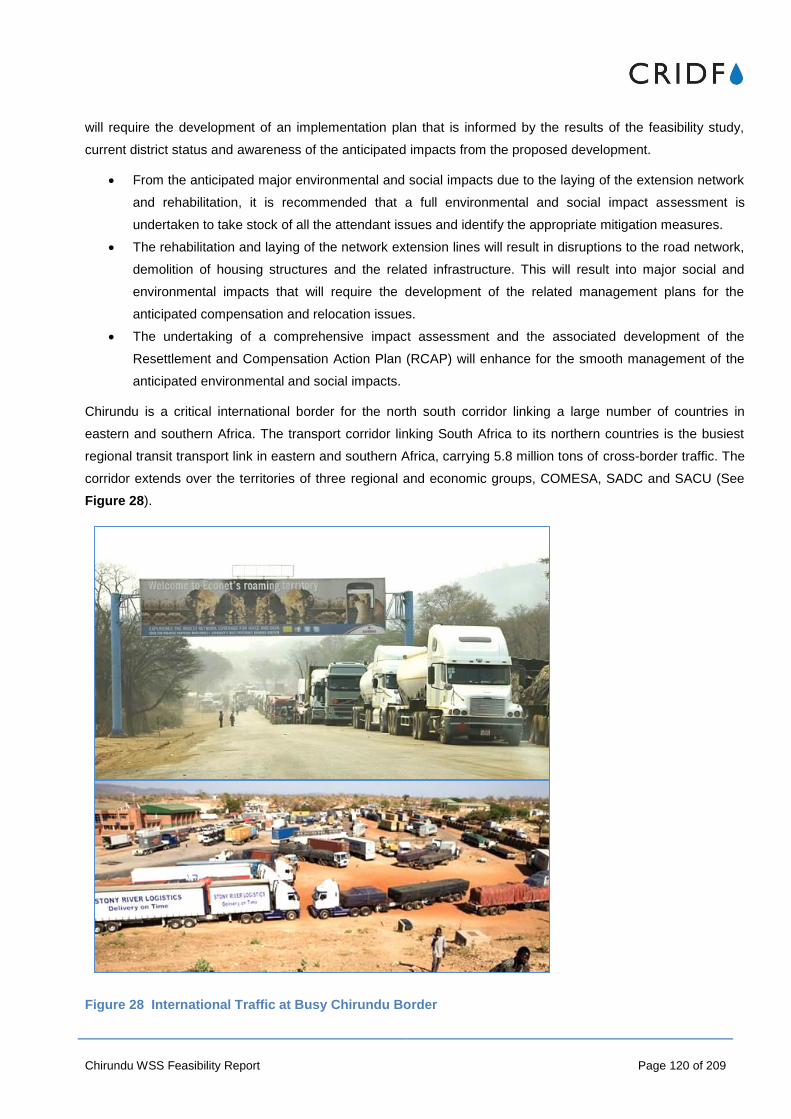
Chirundu WSS Feasibility Report Page 120 of 209
will require the development of an implementation plan that is informed by the results of the feasibility study,
current district status and awareness of the anticipated impacts from the proposed development.
From the anticipated major environmental and social impacts due to the laying of the extension network
and rehabilitation, it is recommended that a full environmental and social impact assessment is
undertaken to take stock of all the attendant issues and identify the appropriate mitigation measures.
The rehabilitation and laying of the network extension lines will result in disruptions to the road network,
demolition of housing structures and the related infrastructure. This will result into major social and
environmental impacts that will require the development of the related management plans for the
anticipated compensation and relocation issues.
The undertaking of a comprehensive impact assessment and the associated development of the
Resettlement and Compensation Action Plan (RCAP) will enhance for the smooth management of the
anticipated environmental and social impacts.
Chirundu is a critical international border for the north south corridor linking a large number of countries in
eastern and southern Africa. The transport corridor linking South Africa to its northern countries is the busiest
regional transit transport link in eastern and southern Africa, carrying 5.8 million tons of cross-border traffic. The
corridor extends over the territories of three regional and economic groups, COMESA, SADC and SACU (See
Figure 28).
Figure 28 International Traffic at Busy Chirundu Border

Chirundu WSS Feasibility Report Page 121 of 209
It is anticipated that the proposed water supply rehabilitation works will greatly impact on this international traffic
flow, thereby affecting trade, movement of people and the associated economic gains. Undertaking a
comprehensive a comprehensive impact and traffic assessment will enable the development of the related
management plans that will mitigate this disruption and thus reduce any lead times that may inadvertently be
introduced by the proposed works.

Chirundu WSS Feasibility Report Page 122 of 209
Financial and Economic Assessment
Introduction
The Financial and Economic Assessment aims to determine the financial and economic feasibility of the project
as designed. Cost-Benefit Analysis (CBA) is the tool used for this assessment. CBA is a framework for
appraising the viability of capital projects by weighing up financial flows, as well as the implicit and explicit
positive and negative socio-economic impacts of the investment.
As such, the use of the project CBA is to show both the commercial and social imperatives of project. The CBA
is also an invaluable tool for informing and guiding project development so that the project design maximises
both the commercial and social imperative of project. In this respect, the project has been redesigned based on
the outcomes of a previous CBA which found that despite the clear socio-economic justification for the project,
the previous design was highly unlikely to be financially sustainable.
Methodology
This section of the report outlines the Cost-Benefit Analysis (CBA) assessment, which forms an input to the
feasibility study of the Chirundu project.
It is anticipated that a project of this nature is unlikely to attract private-sector investors due to limited returns
and the risks associated with water supply; however, its broader public-good nature is likely to increase the
welfare of the population significantly. CBA is a useful approach in demonstrating this as it is able to weigh up
future project costs and benefits in a present value approach, thus helping to give direction as to whether the
project is desirable and should be implemented.
The main elements of this report includes the core assumptions to the CBA, followed by the financial
appraisal which looks at the financial flows (expenditures and revenues) over the life of the project, to calculate
the Financial Net Present Value (FNPV) of the investment, Financial Internal Rate of Return (FIRR) on the
project investment, and Financial Benefit-Cost Ratio (BCR). The economic appraisal then assesses a wider
spectrum of costs and benefits compared to the case of pure profit determination of the financial appraisal. The
outcome of the quantitative economic appraisal includes the Economic Net Present Value (ENPV), Economic
Rate of Return (ERR), and Economic Benefit-Cost Ratio (BCR) of the project. In addition to these quantitative
indicators, a description of the qualitative economic impacts serves to inform an understanding of the expected
net socio-economic impact of the project to society.
Based on the results of the financial and economic appraisals, and drawing on a broader understanding of the
context, institutional arrangements, and prevailing local socio-economic conditions, a sustainability analysis
provides an assessment of the on-going financial and economic sustainability of the project, primarily from the
perspective of the affordability of the project to the local community. Lastly a high-level risk assessment serves
to highlight the key risks to the financial and economic viability of the project and discusses associated

Chirundu WSS Feasibility Report Page 123 of 209
recommendations for risk mitigation arrangements, before final conclusions and recommendations of the CBA
are put forward.
Key CBA Assumptions
The CBA analysis is premised on a number of key input assumptions. The assumptions are drawn from the
technical report, observations by the project team in the project area, and peer-reviewed
publications/international benchmarks. The tables below provide the detail of the assumptions that frame the
CBA analysis. The details underlying some of these assumptions are provided in Annex D1.
Table 30 Financial assumptions
Item Assumption
Financial Discount Rate 10%15
Exchange Rate ZMW 1.00 = GBP 0.06716
O&M Costs 5% of capital costs17
Constant Versus Current Prices All prices are given in constant 2016 terms
Source: CRIDF CBA
Table 31 Revenue generating assumptions
Item Assumption
Number of households (2016) 3,77418
Household size 5.119
Population size 19,246
15 A real interest rate of 10% was used in the financial analysis, suggested by the AfDB in their 2011 study of the Kazungula
Bridge Project. African Development Bank (2011) Kazungula Bridge Project. Appraisal Report. Online: http://open_jicareport.jica.go.jp/pdf/11649951_03.PDF 16
Oanda Currency Converter. Online: https://www.oanda.com/currency/converter/ [accessed 25 May 2016] 17
A rate of 5% is suggested by the Swiss Resource Centre for Development (2008), as sufficient for a water supply system. See SKAT (2008). Operation and Maintenance of Rural Water Supplies. Online: www.rural-water-supply.net/_ressources/documents/default/208.pdf 18
Section 1: Social Assessment 19
Calculated as total population (2010) divided by the number of households (2010), i.e. (14,864/2,915). The Census of Population National Analytical Report, 2010, suggests a household size of 5.2 for the area.

Chirundu WSS Feasibility Report Page 124 of 209
Item Assumption
Annual population growth 4.4%20
Proportion of household types21
High-cost: 30%
Medium cost: 30%
Low cost: 25%
Low cost (kiosk): 15%
Per capita water consumption High-cost: 150 litres/capita/day
Medium cost: 100 litres/capita/day
Low cost: 40 litres/capita/day
Low cost (kiosk): 25 litres/capita/day
Domestic water tariffs22
Per m3 GBP
0 – 6 0.17
6 – 30 0.25
30 – 100 0.3
100+ 0.4
Kiosk 0.25
Commercial water tariffs23
0 – 30 0.37
30 – 170 0.43
170+ 0.53
Sewerage charges GBP/m3
% of domestic water 30%
20 Section 2: Social Assessment
21 Section 3: Technical Assessment
22 Approved NWASCO Tariffs, 2016, Chirundu Border Town
23 Approved NWASCO Tariffs, 2016, Chirundu Border Town

Chirundu WSS Feasibility Report Page 125 of 209
Item Assumption
% of commercial/industrial water 40%
Sanitation charges
% of water bill 2.5%
Ablution tariffs (GBP)24
Toilet (per entry) 0.134
Shower/laundry (per
entry)
0.334
Number of truck passengers per day 70025
Number of bus passengers per day 560
Annual growth in truck traffic 5%26
Non-revenue water 20%
Source: CRIDF CBA
Table 32 Project phasing
Phase Years
Phase 1a and b – Water and Sanitation 2016
Phase 2a – Water 2021
Phase 2a – Sanitation 2021
Phase 3 2026
24 Based on current payments in the informal market
25 Site visit, 2016
26http://www.afdb.org/fileadmin/uploads/afdb/Documents/Multinational__Malawi-Zambia__-
_Nacala_Road_Corridor_Development_Project_-_Phase_IV_-_Appraisal_Report.pdf

Chirundu WSS Feasibility Report Page 126 of 209
Table 33 Economic assumptions
Factor Discount/conversion factor
Social Discount Factors 3.5% 10%
Tradable goods 0.8
Unskilled labour 0.527
Skilled labour 1.00
Non-tradable goods 1.00
Source: CRIDF CBA
The CBA is carried out within the context of a with- and without-project basis, and hence includes only
incremental values for the costs and benefit inputs. This is in an effort to include only the incremental costs and
benefits of the project, including variables such as additional water supplied to the town and time spent
collecting water in the current system versus time spent in the new system. Operation and maintenance (O&M)
costs for the proposed design only are included, and revenues from water tariffs are included only when they
are associated with additional water supply. In terms of the sanitation facilities in the town, including the two
ablution buildings, as well as the sewerage system, the costs and benefits are included in their entirety as there
are no such facilities at present.
In the economic appraisal, incremental values are important in calculating the health, time, efficiency and
ecosystem benefits. In other words, it is unlikely that the project will result in all water-related health concerns
being addressed, while there will still be some residual time spent by rural households in collecting water from
kiosks or yard taps. These incremental benefits will be discussed in more detail under the section Economic
Appraisal.
Options Appraisal
The project has been designed to account for the current needs of the town – increasing water supply and
sanitation, catering for a large border population, town residents and businesses – as well as for the significant
increase in the town’s population over the next 20 years.
27 Asian Development Bank (2011). Financial / Economic Analysis and Shadow Pricing. Online:
http://www.adb.org/sites/default/files/page/149401/financial-economic-analysis-shadow-pricing-mar2012.pdf

Chirundu WSS Feasibility Report Page 127 of 209
Table 34 Population and household projections for Chirundu Border Town
Item 2016 2021 2026 2031 2036
Population 19,246 23,869 29,604 36,715 45,535
Truck drivers and passengers per day 700 851 1,140 1,455 1,857
Other border crossers per day28
560 560 560 560 560
Source: CRIDF CBA
One of the complexities of the town is the dual operation by LWSC and the District Council for water supply.
While LWSC is mandated to provide water to the urban areas of the town, at present their reach is relatively
limited. At present, despite a total population of the town being close to 20,000, LWSC currently supplies 2,062
households with water, roughly 45% (928) of which are household connections.
The existing water supply system thus has inadequate capacity to meet current demands of the town, and will
require expansion and full replacement of some components to meet projected 2036 demands. The proposed
system accounts for all residents of Chirundu Border Town (that is, not including the rural areas around the
town), a large expansion of water supply to existing households and the potential for growth in the population.
Water Supply and Treatment
Residents currently access water from LWSC which extracts water from the Zambezi River, or from the river
itself when supplies are insufficient to meet demand. It provides generally good quality water to the town, with
reliable supply. Where boreholes have been sunk in the town, water quality is a concern, and Key Informant
Interviews (KII) mentioned that salination is a challenge in the town. Therefore, water from the River is
suggested as the most optimal water source for the project.
In terms of the water intake, currently the system is a makeshift pipe structure. This system requires upgrading
to ensure it is climate proof – a floating mechanism should still be used to ensure its climate resilience as the
water levels in the Zambezi River change. The water treatment plant meets only half of the current water
demand in the town. The options analysed were to build a new package plant, or to expand the current plant. It
was found that land is available around the existing plant, and that the expansion of the existing plant would be
the most cost-effective means of meeting the needs.
Water Storage and Distribution
Currently, there is insufficient water storage to service the existing population of the town – resulting in frequent
water cuts and an unstable supply. Water storage can be capital intensive, and it has been suggested that
28 It has been conservatively assumed that passenger vehicle traffic stays constant over the project’s life cycle

Chirundu WSS Feasibility Report Page 128 of 209
storage is done in phases so as to provide what is necessary and expand as populations grow. There are a
number of options for the rehabilitation and expansion of the distribution system. These include a branch main
or ring main, and varying levels of expansion to the current system (refer to the Technical Report for more detail
on these alternatives). The final preliminary design makes use of the Distribution Network Improvement Concept
which divides the ring main distribution system into measured bulk metered zones. This will allow LWSC a
means to monitor water losses and introduce demand management efficiencies in the town and to ensure the
commercial viability of each zone.
Financial Appraisal
The purpose of the financial appraisal is to identify the financial return to the project investment and the
operational sustainability of the infrastructure. The financial appraisal is conducted from the perspective of
Lusaka Water and Sewerage Company (LWSC), who will be the project owner, and will be responsible for the
operation and maintenance of the infrastructure. LWSC will also be the direct recipient of the water and
sewerage service tariffs and charges.
The costs considered in the financial appraisal include the capital investment for the water and sanitation
infrastructure, and the operation and maintenance cost for the systems. The revenue considered includes the
expected water tariffs that will be charged to domestic customers and the border patrons. Assessing the
financial return of the project over its lifespan against the capital and operational costs yields a financial return to
the project. The following indicators represent the key outputs of the financial appraisal:
Financial Net Present Value – the discounted flow of expected investment and operating costs
deducted from expected return
Financial Internal Rate of Return – the financial return on the project. The financial rate of return should
be above the cost of capital (discount rate)
Financial Net Benefit Cost Ratio – the ratio of the present value of the returns on the project set against
the project’s costs.
Importantly, should the project not be financially viable on its own, the financial appraisal will set out the amount
of subsidisation the project will require to make it financially viable and sustainable. The project’s costs and
revenues are set out below, before the financial appraisal results are outlined.
Project Costs
The project is divided into three phases, Phase 1 (short-term), Phase 2 (medium-term, which includes both
water supply and sanitation components) and Phase 3 (long-term). Phase 1 - the upgrading of the current
system as well as the introduction of bulk water meters and increased storage. Phase 2 - the upgrading of water
treatment, distribution, and storage, as well as the refurbishment of the sewer system and connection to high
water consumption users. Phase 3 - the expansion of the distribution system in-line with population growth.
The total cost of the project over the three phases is GBP 5,514,100, broken own as follows:
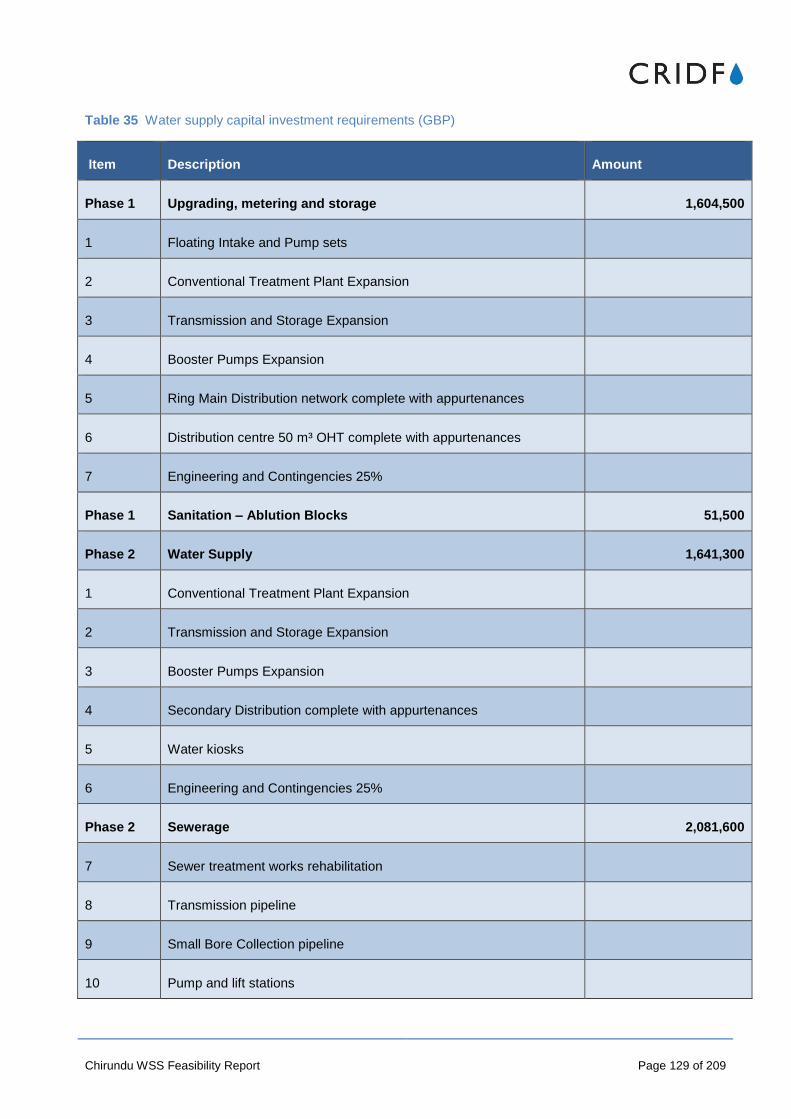
Chirundu WSS Feasibility Report Page 129 of 209
Table 35 Water supply capital investment requirements (GBP)
Item Description Amount
Phase 1 Upgrading, metering and storage 1,604,500
1 Floating Intake and Pump sets
2 Conventional Treatment Plant Expansion
3 Transmission and Storage Expansion
4 Booster Pumps Expansion
5 Ring Main Distribution network complete with appurtenances
6 Distribution centre 50 m³ OHT complete with appurtenances
7 Engineering and Contingencies 25%
Phase 1 Sanitation – Ablution Blocks 51,500
Phase 2 Water Supply 1,641,300
1 Conventional Treatment Plant Expansion
2 Transmission and Storage Expansion
3 Booster Pumps Expansion
4 Secondary Distribution complete with appurtenances
5 Water kiosks
6 Engineering and Contingencies 25%
Phase 2 Sewerage 2,081,600
7 Sewer treatment works rehabilitation
8 Transmission pipeline
9 Small Bore Collection pipeline
10 Pump and lift stations

Chirundu WSS Feasibility Report Page 130 of 209
Item Description Amount
11 Improved latrines
12 Awareness, training and education campaigns
13 Engineering and Contingencies 20%
Phase 3 Expansion of distribution system 135,200
TOTAL PROJECT COST 5,514,100
Source: CRIDF CBA
Annual Operation and Maintenance Costs
O&M costs for the scheme are separated into those for the water supply and sanitation system, and those of the
ablution blocks. In the former, O&M costs include electricity to pump water from the river, chlorine to treat the
water and labour. Operation costs for the ablution block include electricity costs of running the building, cleaning
materials, labour and regular desludging. It is envisaged that the ablution blocks are operated by an outsourced
company in much the same was the flush toilets situated at the border post operate currently – where the
operating entity keeps 40% of the revenue and absorbs the costs of the facilities on-going maintenance. The
cost of large upgrades to the system would be borne by the water utility, but are not included in the financial
appraisal as the useful life of the facility is limited to 20 years and these costs are not expected to occur in this
time period.
O&M costs for the water supply and sanitation infrastructure amounts are estimated to be 5% of the capital
costs annually, increasing in-line with the phasing of the project. O&M costs are assumed to be constant across
the project life span as inflation is excluded from the financial appraisal.
Table 36 Capital and O&M cost phasing (GBP)
Year 0 1 - 5 5 6 - 10 10 11 - 20
Capital - Phase 1a 1,604,500
Capital – Phase 1b 51,500
Capital - Phase 2a
1,641,300
Capital - Phase 2b
2,081,600
Capital - Phase 3
135,200
O&M (per year) 78,163 266,889 273,645

Chirundu WSS Feasibility Report Page 131 of 209
Revenues
Revenue streams are expected to flow from the three groups of users – households, including high, medium,
low costs households, as well as those that access water from communal kiosks, businesses and border
patrons. These will be discussed separately below.
The revenue analysis for household use is based on estimations of water demand by high, medium, low cost
and kiosk users and the corresponding tariffs charged per usage. Tariff rates are based on the NWASCO 2016
approved domestic block rates for the Lusaka Province, and vary from low cost per unit charges at low levels of
consumption and then escalate to higher charges at higher levels of consumption. Mapping demand over the
project’s lifespan is derived from population growth figures and the evolution of consumption patterns between
communal water kiosks and household connections.
Based on information gathered during site visits, and from input from the Technical Report, it is assumed that
out of the current population, 30% of households are considered high cost, 30% medium cost, 25% low cost and
15% are assumed to access their water from communal water points (kiosks). Each of these groups of users
have varying levels of daily water consumption, as demonstrated in Table 37. In-line with the Technical
Assessment, these proportions are assumed to stay constant throughout the 20-year life-span of the project.
Table 37 Daily water consumption per household classification type
Household type Proportion of population Water consumption per capita
per day (litres)
High 30% 150
Medium 30% 100
Low 25% 40
Kiosk 15% 25
From discussions with the LWSC representative in Chirundu, current water supply is known. LWSC supplies
approximately 2,000 m3 of water per day to the town, but only half of this is considered revenue supply due to
high Non-Revenue Water (NRW) of 50%. In calculating revenues from each user group, a number of steps were
followed:
Firstly, given that the current system is not able to supply the current demands of the town, it is
assumed that no further water supply by LWSC is possible without the proposed intervention. Thus, as
population grows and demands more water, an incremental increase in water supply supports the
implementation of the scheme.
Applying the respective proportions of households in Table 37 to this incremental water supply, water
demand per month and year can be calculated per household type.

Chirundu WSS Feasibility Report Page 132 of 209
Calculating the average household use per month per household type allows one to identify the
appropriate tariff, which is to be multiplied by this demand, deriving the incremental revenue created
through the implementation of the scheme.
Using these figures, sewerage and sanitation charges can be calculated, assuming 70% of the water in
the system is returned by 2036 (and applying straight-line increases in water returned until then).
An additional revenue source is created through the construction and operation of the two proposed ablution
facilities that provide truck drivers and other patrons with toilet, shower and laundry facilities. These facilitates
are expected to operate similarly to the flush toilet facility that already exists at the border-post, where patrons
pay a fee for the use of the facility. Based on the prices currently charged at the facility which are ZMW 2
(GBP0.13) and ZWM 5 (GBP 0.334) for the use of the toilet and shower/laundry facility respectively, and
assuming that 20% of the truck drivers use the one facility, and 20% of the other border patrons use the other
facility, revenues from the use of these ablution facilities can be calculated. The proposed operational scheme
sees the outsourcing of their operation to a private party who keeps 40% of the total revenue and provides
staffing and daily maintenance of the system. LWSC will collect the additional revenue and provide water to the
facility, as well as long-term O&M. Only the revenue collected by LWSC is included in the financial appraisal
below.
The project is highly dependent on the revenue that is derived from these ablution facilities, providing
approximately 20% of revenue to the scheme in the first year that the ablution facilities open (year 6 of the
project). This is an important finding as the sanitation facilities make up a small component of the capital
investment requirements but provides an important source of revenue to LWSC.
The project also proposes a number of interventions that will help LWSC with its efficiency and decrease its
NRW. It is suggested in the Technical Assessment that NRW will change from 50% to 35% in the fifth year of
the project, and decrease further to 20% by the 10th year and 15% by the end of the project’s lifecycle. These
efficiency gains have direct impact on the revenue generating potential of LWSC as they increase the amount of
water that LWSC can charge for in Chirundu.
In order to calculate the financial inflow associated with the efficiency gains of the project, the incremental
efficiency gains (i.e. a 15% saving after the fifth year of the project and so forth), is multiplied by the total current
annual loss in the system, estimated to be 1,000 m3
per day, and by the appropriate tariff. In order to keep this
estimate conservative, the lowest tariff rate for domestic consumers is applied and it is assumed that efficiency
gains only occur after the 5th year of the project.

Chirundu WSS Feasibility Report Page 133 of 209
Table 38 Projected incremental revenue from water tariffs (GBP)
Revenue category Year 0 Year 5 Year 10 Year 15 Year 20
High-cost (metered access) 0 55,360 79,124 108,587 145,150
Medium cost (metered access) 0 36,845 52,688 72,337 96,705
Low cost (metered access) 0 8,208 11,729 16,095 21,511
Low cost (kiosk) 0 4,615 6,579 9,016 12,038
Commercial 0 11,583 16,556 22,724 30,373
Sewerage revenues 0 14,921 18,334 22,568 27,818
Sanitation revenues 0 1,234 1,528 1,881 2,318
Sanitation facilities 0 0 50,353 61,098 74,812
Efficiency savings 0 13,814 27,628 32,233 32,233
Total 0 146,591 264,521 346,548 442,958
Source: CRIDF CBA
NRW has already been accounted for in the above tariff calculations, equal to 50% of current water supply by
LWSC. The table indicates additional revenue to LWSC as a result of the implementation of the scheme.
Financial Appraisal Results
The results of the appraisal indicate that the project as a standalone entity is not financially viable: at a 10%
discount rate the FNPV is negative (-GBP 3.8 million); and the FIRR (-13%) is below the discount rate. These
results show that the revenues generated by the project infrastructure are not sufficient to cover the full
investment cost over the project life. This is not surprising, given that water and sanitation provision is largely a
public good and that current tariff design in Zambia does not account for full cost recovery.29
Since 2000, water
tariffs in Zambia have not kept pace with inflation of around 20 percent.30
This means that effectively the true
value of tariffs has declined, and do not represent the actual cost of providing the service. USAID (2014)
suggests that as a result, Zambia’s water utilities are able to generate sufficient revenue to cover their costs,
29 USAID (2014) Cost Recovery for Urban Water Services. Online: http://usaid-suwasa.org/index.php/projects-and-
activities/zambia/item/44-economic-regulation-of-zambian-urban-water-services 30
USAID (2014) Cost Recovery for Urban Water Services. Online: http://usaid-suwasa.org/index.php/projects-and-activities/zambia/item/44-economic-regulation-of-zambian-urban-water-services

Chirundu WSS Feasibility Report Page 134 of 209
and rely on government support for on-going sustainability. KII with LWSC in Chirundu indicate that their current
O&M costs are high and that they rely on subsidisation for their current operations. While they do some minor
repair in the town, they rely on LWSC head office in Kafue to do the larger repairs to the system.
Table 39 provides a summary of the financial appraisal, while the table 'Financial Appraisal' in Annex D2
contains a full summary of the results.
Table 39 Financial Appraisal Results
Indicator Results (10% discount rate)
FNPV (GBP) -3.8 million
FIRR (%) -13%
FBCR 0.32
N/K Ratio 0.32
Source: CRIDF CBA
In terms of the financial sustainability of the project infrastructure however, the projected operational cost-
recovery of the infrastructure is positive. Annual operational cash-flows (annual revenues less annual O&M
costs) have a positive FNPV of GBP 216,638 and a BCR of 1.2, implying that over the project life, cost recovery
for LWSC is positive. This implies that the project infrastructure will be financially sustainable should external
grant/concessional financing be found for the required capital investments. The FIRR indicator is not suitable for
projects with a non-typical distribution of cash-flows31
(as is the case here where cash-flows alternate between
negative and positive values given the phased nature of the capital investment). The FIRR indicators should
therefore be viewed with caution in the results.
Funding Scenarios
Table 40 indicates the financial return on the project investment when varying degrees of external grant funding
are leveraged. An external grant for the entire capital investment results in a stronger financial outlook, with an
IRR of 7%, but because this is lower than the discount rate of 10% the FNPV still remains negative.
31 Mackevicius, M. & Tomasevic, V. (2010) “Evaluation of investment projects in case of conflict between the internal rate of
return and the net present value methods”, ISSN 1392-1258. EKONOMIKA, Vol.89(4) [http://www.zurnalai.vu.lt/files/journals/37/articles/962/public/116-130.pdf]

Chirundu WSS Feasibility Report Page 135 of 209
Table 40 Project funding scenarios
Description FNPV (GBP) FIRR (%)
Project alone -3.8 million -13%
Full grant funding -1.6 million 7%
Source: CRIDF CBA
These project scenarios demonstrate a weak financial outlook for the project relative to its costs. The project is
not financially ‘bankable’, meaning it does not deliver high enough risk-adjusted returns to attract private-sector
equity or debt. This is not unique to this project– all middle and low-income countries face challenges at
providing bankable water supply projects. Not only do they often lack project-development resources, but their
governments also may not be able to afford the funding commitments required or cannot offer sufficient
guarantees to mitigate the perceived risk of the project.32
Despite these financial outcomes, the project does provide a sustainable means of providing water supply to an
increasingly important border town in Lusaka Province – with long run operational revenues higher than
operational costs.
Sensitivity Analysis
A sensitivity analysis is an important way to analyse whether the key input assumptions for the project have a
material impact on its outcomes, particularly those of its overall viability. The objective is to identify the factors
that have the biggest impact on the project’s sustainability and returns. The sensitivity assessment looks at the
main factors that could impact the project’s costs, as well as the factors affecting the project’s revenue
generation.
The project’s operational sustainability is impacted by the significant upfront costs, leading to a poor overall
financial outlook. Increasing the upfront costs and O&M costs of the project by 10% sees a material impact on
the project’s NPV from -GBP 3.8 million to -GBP 4.2 million. The associated change in the FIRR is from -13% to
-14%.
Decreasing the capital costs and their associated O&M costs by 10% results in an increase of the NPV from -
GBP3.8 million to -GBP3.4 million, while the BCR changes from 0.32 to 0.34. A decrease in capital costs by
50% does not elicit a positive NPV for the project.
While capital costs play a role in determining the overall financial viability of the project, it is also necessary to
do a sensitivity analysis on the operational sustainability of the project. This is particularly the case for project’s
which are funded by an external source but which will need to rely on operational sustainability for their on-going
32 Development Finance (2016) How to plug the gap in water investments. Online:
http://alliance4water.org/resources/Development-Finance-03.pdf

Chirundu WSS Feasibility Report Page 136 of 209
success. In the case of Chirundu, a sensitivity analysis was carried out on the operational flows of the proposed
intervention in isolation of the capital costs.
Looking only at the operational costs (O&M costs) and revenues of the project, two variables investigated in this
report are the population of the town, as well as the border patrons. The sensitivity analysis cost parameter
results are shown in Table 41.
Table 41 Sensitivity Analysis – Cost Parameters (GBP)
Parameter Change FNPV before
change
FNPV after
change
BCR before
change
BCR after
change
Increase in
population
+10% 216,638 456,542 1.2 1.5
Decrease in
population
-10% 216,638 23,265 1.2 1.0
Increase in trucks +10% 216,638 237,799 1.2 1.2
Decrease in trucks -10% 216,638 195,477 1.2 1.2
Source: CRIDF CBA
From the table above it is evident that the population plays a larger role in determining the outcomes of the
project. Future work on the project should ensure that population figures are correct, particularly as the District
Council releases updated District Plans for the town.
Economic Appraisal
The economic appraisal is conducted from the perspective of the economy as a whole to assess whether the
project will have a net positive socio-economic impact. As such, the economic appraisal assesses project costs
and benefits beyond financial returns alone, and aims to do so at prices equal to their real value to society
rather than financial/market prices.
Project Costs
It is necessary to convert financial prices into economic prices. This removes any market distortions (such as
taxes or import duties) and presents the true capital cost of the project to Zambian society. In many cases,
market prices do not reflect the opportunity cost of inputs and outputs and items in the financial analysis must
therefore be adjusted. The methodology used in the economic analysis thus applies ‘conversion factors’ to
market prices to correct for market distortions and attain relevant ‘shadow prices’ of inputs and outputs.

Chirundu WSS Feasibility Report Page 137 of 209
If a conversion factor is less than one it indicates that the true value of that price is less than its market price,
and vice versa. An example would be an imported product which is subject to exchange rate commissions and
VAT. These are transfers within the economy and not true indications of value – hence they should be removed
from its market price. If a market price is higher than 1, it indicates that the true value of that price is higher than
its associated market value, such as due to government subsidies.
Capital Costs
Through a discussion with the technical logistics team, it was noted that most of the inputs for the construction
of the project and supply of associated materials, machinery, and equipment during construction and operations
of the hostel can be sourced locally. A conversion factor of 20% was thus applied to the capital costs of the
project to remove import duties from any costs in the economic analysis, along with the proportion of low-skilled
labour included in these costs.
Price of labour
The cost of labour is included in the financial analysis in both the construction of the project facilities and during
its operation. This is the financial price for the use of labour. In the economic analysis, however, it is necessary
to consider the social opportunity costs of labour; that is, be aware that market prices for labour may not
embody its true value. This is done by looking at the alternative use of labour in the absence of the project and
valuing the substitute used for labour, what is known as the ‘shadow wage’.
Two assumptions are therefore made given the project’s context. First, the price of high-skilled labour is
understood to reflect its true value given the shortage of readily available skills in the country.
For labour classified as low-skilled, however, the situation is different. Not only might there not be another job
available, but it is likely that workers will be willing to work for a wage that is lower than the market wage, if
given a choice between being unemployed and accepting a lower paying job. Therefore, in cases with
involuntary unemployment, the shadow wage will be lower than the financial wage. In line with the Asian
Development bank’s guideline for the conversion factor for low-skilled labour in labour surplus countries, a
conversion factor of 0.5 is applied.33
This is in line with that applied in other Zambian border town projects,
where a rate of 0.4 was applied in Kazungula, and 0.6 in Mwami and Chanida. The higher the conversion factor,
the lower the opportunity cost of low-skilled labour.
In order to calculate the economic O&M costs, the O&M percentage of 5% applied in the financial appraisal is
used on the economic costs of the project. Additionally, O&M costs are allocated between the following inputs,
and the conversion factor of 0.4 is applied to O&M staff costs.
33 Asian Development Bank (2011). Financial/ Economic Analysis and Shadow Pricing. Online:
http://www.adb.org/sites/default/files/page/149401/financial-economic-analysis-shadow-pricing-mar2012.pdf

Chirundu WSS Feasibility Report Page 138 of 209
Table 42 Economic O&M costs
Item Proportion of Cost Conversion factor
Fuel costs 6% 1
Chemical costs 11% 1
Electricity costs 12% 1
Maintenance costs 23% 1
Lab costs 6% 1
Staff costs 38% 0.4
Other costs 4% 1
Source: CRIDF CBA
Table 43 Economic costs
Component Financial Cost (GBP) Conversion factor Economic cost
Phase 1 1,656,000 0.8 1,324,800
Phase 2 3,722,900 0.8 2,978,320
Phase 3 135,200 0.8 108,200
Economic Benefits
The economic benefits of the Chirundu water supply and sanitation project include impacts that can be
quantified into monetary terms as well as those which can only be captured qualitatively. The CBA aims to
capture both the quantitative and qualitative benefits which stem from the project.
Quantitative benefits
Financial revenues are a poor indication of the true value of water supply and sanitation infrastructure to the
town of Chirundu. While they capture some of the willingness-to-pay for these water services, financial values
are often moderated to account for the human rights-to-water, incentive structures and affordability concerns.
Essentially, the tariffs charged for water in Zambia do not reflect the full associated costs of providing
sustainable services.
The real value of water supply and sanitation is commonly estimated through an estimation of the maximum
willingness to pay (WTP) of consumers for the service rather than the market tariff. WTP includes the full benefit
of water and sanitation to a consumer – in terms of health, time savings, productivity, preference of supply, etc.

Chirundu WSS Feasibility Report Page 139 of 209
It is usually assessed through stated preference (contingent valuation) methodologies, which can be resource
intensive and misleading where there is significant asymmetry of information.
In this economic appraisal (in lieu of a WTP survey and analysis), the following expected project benefits are
assigned a monetary value in order to estimate the real (economic) value of the project:
Health benefits
Time savings
The economic value of water not lost to inefficiencies
Ecosystem improvements
Health improvements associated with water supply and sanitation
The World Health Organisation (WHO) (2004) asserts that 1.8 million people die every year from diarrhoeal
diseases; 90% of which are children under five, mostly in developing countries. The National Environmental
Health Policy (2001) estimates that up to 80% of the preventable diseases in Zambia are related to poor
sanitation. The proposed interventions for Chirundu will directly and indirectly contribute to the reduction of a
range of water and sanitation related diseases, such as cholera, dysentery and trachoma. Exposure to
diarrhoea-causing agents is frequently related to the use of contaminated water and to unhygienic practices in
the preparation of food and disposal of excreta.34
Chirundu border town suffers from a number of water and sanitation-related challenges. These include
inadequate water supply to the current population – KII indicated that there is often only two hours of water
supply provided by the utility, most of which occurs at night. Water is therefore heavily rationed in the town, with
impacts on sanitation and hygiene practices. When there is no water in the taps, the community must resort to
fetching water from the Zambezi, with risk of crocodile attacks, or else rely on water from boreholes which is of
inadequate quality. Significantly limited water supply as currently provided in the town reduces the amount of
water available to grow gardens, with implications on household food security, as well as on the levels of
erosion and dust in the town. Chirundu suffers from high levels of dust particulates in the air which are said to
lead to rhinitis, bronchitis and pneumonia.
Additionally, the town does not have a sewerage system, and residents rely on pit latrines, most of which are
not improved. Open defecation is still practiced by some residents living in the peri-urban areas of the town.35
These sanitation practices, coupled with a lack of water supply and a large, mostly unserviced border
population, have resulted in a tenuous situation in which outbreaks of diarrhoea are common. 36
34 Central Statistics Office (CSO), Ministry of Health (MOH), Tropical Diseases Research Centre (TDRC), University of
Zambia, and Macro International Inc. (2009) “Zambia Demographic and Health Survey 2007”, CSO & Macro International Inc., Calverton, Maryland, USA 35
KII, site visit 2016 36
KII, site visit 2016

Chirundu WSS Feasibility Report Page 140 of 209
The World Bank Water and Sanitation Program (WSP) has calculated the economic costs of poor sanitation in
Zambia37
; and found that Zambia loses USD 194 million annually – or GBP 11.27 per person annually – due to
poor water supply and sanitation, which include health impacts of poor water supply and sanitation, the cost of
premature death due to illness caused by diarrhoea and the cost of productivity losses while sick or accessing
health care. Inflating this value to current prices using the average inflation rate of 9.5% between 2005 until
201638
, the per capita cost of inadequate water supply and sanitation is estimated to be GBP 16 per person.
The economic cost estimate of poor sanitation is used as a basis to estimate the health benefits (or avoided
cost) of the project on the resident population. In line with the estimates from the Centre for Disease Control and
Prevention (CDC) which estimates that adequate sanitation and hygiene have the potential to prevent at least
9.1% of the global disease burden, health savings are calculated as a proportion of the total water-related health
costs to the town for the first 5 years of the project. After Phase 2 these benefits are assumed to increase by a
further 45%. This estimate is based on the analysis of the WHO and SIWI finding that improved water supply
can decrease diarrhoea morbidity by up to 25%; and hygiene interventions and drinking water quality can
reduce the number of diarrhoeal cases by up to 45% and 39% respectively.39
Moreover, more expensive
interventions such as the implementation of advanced types of technologies such as regulated in-house piped
water and sewer connections (as planned in the project), can lead to an average global reduction in diarrhoeal
cases by around 70%.40
Chirundu’s one-stop border has decreased the time trucks spend waiting at the border, However, truck drivers
still currently rely on an informal pit latrine system in the town. They are also vulnerable to health risks
associated with unprotected water as well as inadequate supply of water and sanitation. In order to calculate the
total cost savings from this segment of the population, it was conservatively assumed that the implementation of
the two ablution facilities, with adequate water supply, would decrease water-related health impacts by 9% in
the truck population. Health impacts for other border patrons were not included due to the fact that flush toilets
exist at the border offices for this population, and health impacts were thus assumed to be negligible.
Table 44 Health savings (GBP)
Annual value of health savings 2016 2021 2026 2031 2036
Health savings 0 515,567 872,582 1,104,324 1,397,848
37 WSP Africa (2012) “Economic Impacts of Poor Sanitation in Zambia” Water and Sanitation Program, World Bank,
http://www.wsp.org/sites/wsp.org/files/publications/WSP-ESI-Zambia.pdf 38
Trading Economics (2016) Zambia Inflation rate. Online: http://www.tradingeconomics.com/zambia/inflation-cpi 39
WHO & SIWI, “Making Water a Part of Economic Development”, Government of Norway & Sweden as input into Commission on Sustainable Development (CSD) (2004-2005) 40
Ibid.

Chirundu WSS Feasibility Report Page 141 of 209
While the health benefits estimated in this CBA are calculated on the quantifiable health savings due to the
proposed intervention, it is expected that they are significantly less than the full cost to society. This is because
they ignore a number of benefits that are difficult to quantify and monetise. These are listed below:
The cost of reduced long-term cognitive development which is a result of early childhood
diarrhoea and associated under-nutrition, stunting and wasting;
The cost of funerals, which are borne directly by households and are particularly significant in
African culture. A study in South Africa found that on average, households spend the equivalent
of year’s total expenditure on food and groceries on funerals;
The cost of epidemic outbreaks, of which faecal contamination of the environment is the root
cause of an annual average 3,200 cases of cholera affecting Zambia. Chirundu is particularly
vulnerable to epidemic outbreaks due to the large number of border patrons that pass through
the town on a daily basis. An epidemic outbreak of cholera would pose a severe cost to the
economy due to productivity losses, premature death, diversion of expenditure to health, and
losses in trade and tourism;
Increasingly poor health due to climate change impacts, namely more frequent occurrences of
drought, rainfall variability and temperature increases.
Time savings
At present, Chriundu has a mixed system of water supply which includes some household connections and
communal water points spread across high, medium and low cost households. A lot of households have
graduated to household connections, often being yard taps, but the town is still faced with serious water supply
challenges. Because the current system lacks adequate water storage and suffers from frequent power cuts,
water supply is unstable and sometimes is only provided for two hours per day. In the absence of water supply
through the current system, residents are forced to either purchase water in the informal water market that
exists in Chirundu, where vendors sell water collected from the Zambezi River for ZMW 2 (GBP 0.13) or ZMW 5
(GBP 0.33), depending on how far the sale occurs from the river, or walk to fetch the water themselves.
Fetching the water from the river is dangerous due to crocodiles, and can take over an hour to fetch 20 litres
because of the distance.
KII indicate that at communal water points slow yields and a limited supply of water result in long queues.
Fetching water is predominantly a woman and children’s role in Chirundu and long waiting periods are spent
queuing at hand-pumps. The community asserted that some households can spend up to two hours per day
collecting water.41
Children are expected to collect water in the afternoon, upon returning from school, and can
spend an hour fetching water.42
Given that time has an opportunity cost, a benefit value can be placed on the
amount of time saved in the Chirundu population due to the intervention. This opportunity cost might be
41 CRIDF (2016) Chirundu Outline Business Case
42 CRIDF (2016): Chirundu Outline Business Case

Chirundu WSS Feasibility Report Page 142 of 209
attendance at school for children and informal trading for women, both groups who are usually tasked with water
collection in the household.
Time savings through the new system are expected to occur in two stages. The first stage, associated with
Phase 1 of the technical design, sees the supply of water to existing household connections stabilise due to
increased pump capacity and storage. High and medium cost households who only receive limited water supply
are assumed to purchase at least one bucket of water through the informal water trade system in the town
currently. Time savings for this period of the project are thus valued as the cost of this water which will no longer
need to be purchased when water supply is stable and consistent.
The second stage of time savings span from year six of the project until the end of its useful life after 20 years.
This corresponds to Phase 2 of the technical design, which sees a significant increase of water supply to
households as well as communal water points. Assigning a monetary value to the time that can be saved for
households collecting water for domestic purposes as a result of the project is subjective, given that it depends
on how much time households currently spend fetching water and the expected time savings associated with
the new project infrastructure. Time savings was thus broken down into the two types of households in the town,
namely households which have household water connections and those who do not (i.e. those who fetch water
from communal access points).
The monetary value of time savings can be calculated as the opportunity cost of the time spent fetching water.
The economic value of one hour saved is expected to be less than the minimum wage per hour in the
community due to the high levels of unemployment in the town, especially for women who are usually tasked
with water collection for the household.
Time savings under this period of time are estimated in the following way:
Assuming no new households could be connected to the water supply in the absence of the intervention
due to capacity constraints, the total time taken to fetch water per additional household was calculated
as the journey time (assumed to be 15 minutes per trip) multiplied by the number of households fetching
water
Dividing this figure by the number of work hours in the day (8 hours) gives an indication of the work-
value of this time
This time is then assigned its opportunity cost, being the minimum wage in the town (estimated to be
ZWM600 per month43
) and discounted in line with the low-skilled conversion factor discussed above in
the Economic Appraisal
To get the annual opportunity cost of time, this figure is then multiplied by 240 working days in the year
Metered households are expected to have the larger time savings of the two dwelling types due to the fact the
entire time that was spent on fetching water is now avoided due to household water connections. They will no
longer have to travel to fetch water nor wait for slow yielding hand pumps. The total opportunity cost of time for
metered households is equal to GBP 33,029 in 2021.
43 Household survey carried out for Mwami border town (2015). This wage is a monthly farm worker wage.

Chirundu WSS Feasibility Report Page 143 of 209
As this CBA includes only the incremental benefits of the project, only the additional savings brought about from
the proposed intervention are included. In the current system, low-cost unmetered households collect water
from communal stand pipes, whereas in the new system they will collect water from kiosks. It is assumed that
these households will save only 20% of the current time taken to fetch water through the new scheme as a
result of more kiosks being available, and shorter waiting times at kiosks. The total annual opportunity cost of
time saved for households accessing kiosks is equal to GBP 3,303 in 2021.
The combined time savings is valued at GBP 56,524 in the first year of the project. Time savings is assumed to
grow proportionally to the size of the population. The summary of time savings is presented in Table 45, refer to
'Time and Health Savings' table in Annex D2 for a detailed breakdown of these calculations. Overall, metered
households save more time per household at an individual level as well as at an aggregate level than communal
access households.
Table 45 Time Savings (GBP)
Annual value of time savings 2016 2021 2026 2031 2036
High cost households 0 56,524 85,013 105,436 130,765
Communal access households 0 0 3,924 4,866 6,035
Total time savings 0 56,524 88,937 110,302 136,800
Source: CRIDF CBA
Environmental benefit
There is currently pollution of the surrounding environment and Zambezi River from open defecation and
surface flooding of pit latrines and septic tanks in Chirundu. Such pollution is expected to become significant as
the population and concentration of people in the border town increases rapidly.
WHO and SIWI44
argue that immediate and future economic profits depend directly on investment in improved
water resources management to maintain ecosystem goods and services – the economic costs of
environmental degradation have been estimated at 4-8% of GDP in many developing countries.45
Moreover,
poor segments of the population are disproportionately dependent on natural resources and ecosystem goods
and services for their livelihood.46
44 WHO & SIWI, “Making Water a Part of Economic Development”, Govt Norway & Sweden as input into Commission on
Sustainable Development (CSD) (2004-2005) 45
WHO & SIWI, “Making Water a Part of Economic Development”, Govt Norway & Sweden as input into Commission on Sustainable Development (CSD) (2004-2005) 46
Krop, R.A., Hernick, C. & Frantz, C. (2008) “Local Government Investment in Water and Sewer Infrastructure: Adding Value to the National Economy”, US Conference of Mayors, Mayors Water Council Washington, DC

Chirundu WSS Feasibility Report Page 144 of 209
The Chirundu border town is situated upstream from a number of important water users. Of direct importance
are those of the National parks downstream of the town, identified in Figure 1 below. These important
biodiversity areas which rely on clean water from the Zambezi, are negatively affected by pollution from the
town.
Figure 29: Location of Chirundu
By improving water quality and ecological conditions in respective catchments, projects generate substantial
social benefits and support a variety of Ecosystem Services. While many of these benefits are experienced
outside of market systems and are difficult to value in their entirety, there is a large amount of literature available
on the value of ecosystem services.
The infrastructure proposed by this project will have direct impacts on the ecosystem health of the Zambezi
River. The project is expected to improve the quality of water in the river through sanitation interventions and
better sewerage handling and treatment.
Vardakoulias and Arnold (2015) estimate that for each £1 invested in a river improvement project, between £1.9
and £4.5 are generated for downstream users, depending on the project location. Their research used extended
Cost-Benefit Analysis (CBA) in order to estimate the socioeconomic and environmental returns generated by
five projects that would positively impact watershed areas, and included an estimation of the potential
environmental (ecological) impacts of these projects, the potential societal benefits supported by those
ecological impacts, the value of those benefits, expressed in monetary terms and the Benefit-Cost ratios of the
projects, i.e. the comparison between the investments and the wider benefits generated.

Chirundu WSS Feasibility Report Page 145 of 209
Given the current and potential level of pollution from surface flooding of unimproved pit latrine and septic tanks,
the economic appraisal assumes the sanitation investment (GBP 1.2 million), as an investment in the protection
of the Zambezi River and the surrounding environment. De Groot et al. (2013) suggest that river basin
investments are usually only 75% efficient over a lifespan of 20 years (i.e. only 75% of the total cost of
investment should be included into calculations of their impact). Thus, using the benefit-cost ratio of
Vardakoulias and Arnold (2015) of 1.91, and attributing 75% of this value over the project’s lifespan gives a total
environmental benefit of GBP 1.4 million over 20 years.
Efficiency savings
Efficiency savings in the current system are also included as a small positive economic benefit of the scheme
due to the fact that this water has a true value to society that is currently lost due to leaks in the system. While
the value of this water is expected to be higher than its financial value due to the fact that water tariffs do not
reflect scarcity of water or the willingness-to-pay of the population, in the absence of an economic cost, the
financial price is included in the economic appraisal.
Quantitative results
The results of the quantitative economic appraisal, as summarised in Table 46, indicate that the project is
economically desirable at both a 3.5% and 10% discount rate, with positive ENPVs and an ERR which is higher
than both discount rates.
Table 46 Economic Appraisal Results
Indicator 3.5 % discount rate 10 % discount rate
ENPV (GBP) 7,6 million 2,7 million
ERR (%) 24% 24%
EBCR 2.21 2.52
Source: CRIDF CBA
Sensitivity Analysis
Two important factors in the estimation of economic benefits are: the length of time taken to fetch water and the
percentage of diarrhoea-related illness cases avoided due to the intervention. The impact of these assumptions
is summarised in Table 47.
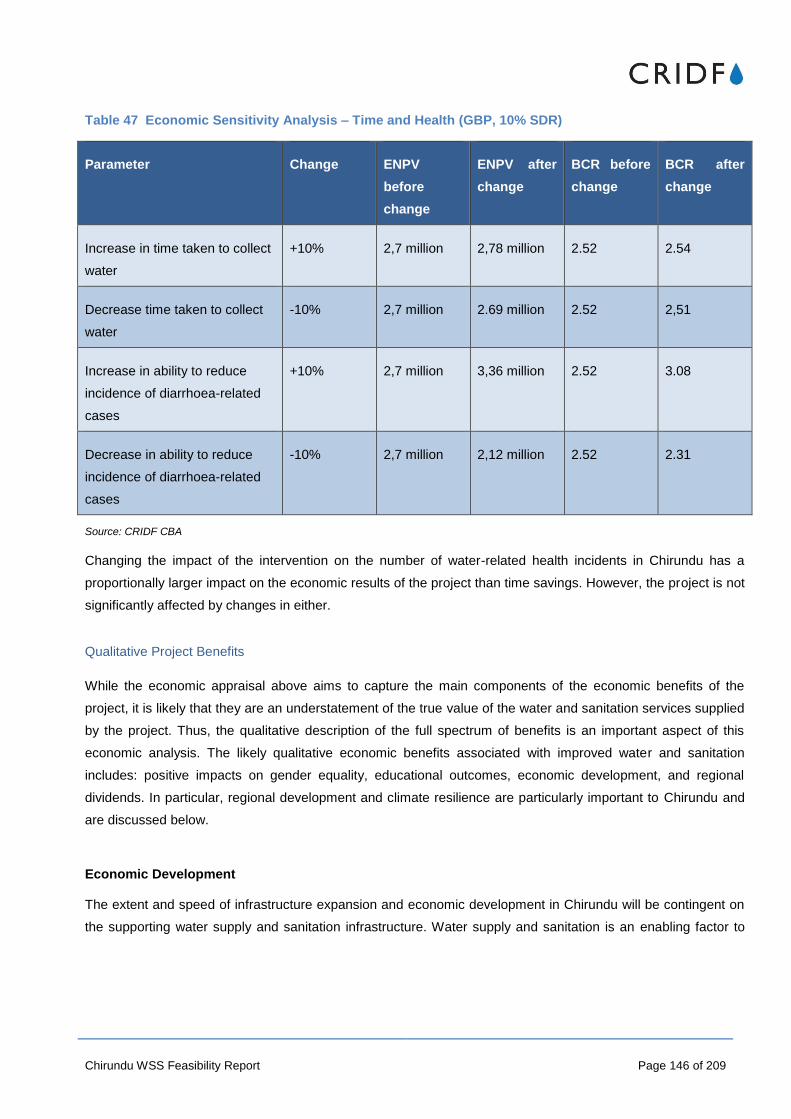
Chirundu WSS Feasibility Report Page 146 of 209
Table 47 Economic Sensitivity Analysis – Time and Health (GBP, 10% SDR)
Parameter Change ENPV
before
change
ENPV after
change
BCR before
change
BCR after
change
Increase in time taken to collect
water
+10% 2,7 million 2,78 million 2.52 2.54
Decrease time taken to collect
water
-10% 2,7 million 2.69 million 2.52 2,51
Increase in ability to reduce
incidence of diarrhoea-related
cases
+10% 2,7 million 3,36 million 2.52 3.08
Decrease in ability to reduce
incidence of diarrhoea-related
cases
-10% 2,7 million 2,12 million 2.52 2.31
Source: CRIDF CBA
Changing the impact of the intervention on the number of water-related health incidents in Chirundu has a
proportionally larger impact on the economic results of the project than time savings. However, the project is not
significantly affected by changes in either.
Qualitative Project Benefits
While the economic appraisal above aims to capture the main components of the economic benefits of the
project, it is likely that they are an understatement of the true value of the water and sanitation services supplied
by the project. Thus, the qualitative description of the full spectrum of benefits is an important aspect of this
economic analysis. The likely qualitative economic benefits associated with improved water and sanitation
includes: positive impacts on gender equality, educational outcomes, economic development, and regional
dividends. In particular, regional development and climate resilience are particularly important to Chirundu and
are discussed below.
Economic Development
The extent and speed of infrastructure expansion and economic development in Chirundu will be contingent on
the supporting water supply and sanitation infrastructure. Water supply and sanitation is an enabling factor to

Chirundu WSS Feasibility Report Page 147 of 209
economic activity, by expanding the productive capacity of the economy – both by increasing resources, and
enhancing the productivity of existing resources.47
Similarly, the growth potential of new enterprises in all sectors of the economy will depend on water supply and
sanitation as a factor of production. Such opportunities for new enterprises include those in trading, the
provision of roadside services, salaried workers, government officials in the new District Council offices and the
general public. The increase in local economic activity will in turn result in an increase in tax revenues for local
government.
In the above context, the economic value of the project consists of both direct and indirect impacts on economic
development. Direct value added is the value generated directly in the operations of the infrastructure through
the consumptive use of the water resources – in the first ‘round’ of expenditure. First round expenditure however
induces another round of expenditure and value-add in other sectors of the economy, and further rounds after
that may follow. These ‘backward linkages’ create a multiplier effect, so that the overall impact is larger than the
direct value add alone. The magnitude of the multiplier effect of water and sanitation investments on national
income have been estimated by Krop et al (2008)48
and WHO & SIWI (2005)49
.
Krop et al (2008) find that the long term multiplier effect of water and sanitation investment on GDP is roughly
6.35 times the original investment – that is, for every GBP 1.00 investment in water and sewer infrastructure
increases private output (GDP) in the long term by GBP 6.35. This estimate was developed through the review
of over 300 economic studies. The WHO and SIWI have estimated a multiplier of 3.33; however, this multiplier
is specific to the effect of investment in household access to safe water supply on GDP only, excluding
sewerage systems.
Both Krop et al and WHO & SIWI stress that their economic multiplier estimates for water and sanitation
infrastructure vary geographically and by past investment – that is, if public water and sanitation infrastructure is
adequate and of high quality, rates of return on further investment will be lower than it would be if infrastructure
were inadequate50
- the greatest economic benefits will be felt in countries with the greatest water challenges.51
Regional Dividends
Chirundu holds a strategic position on the trade route between Zambia and Zambia and has been identified for
its strategic importunate to both Zambia and the SADC region in general. A total of 350 trucks pass through the
border town each day, carrying a variety of commodities between the two countries. This substantial number of
vehicles is expected to increase as trade within SADC grows. The number of truck drivers passing through the
47 Krop, R.A., Hernick, C. & Frantz, C. (2008) “Local Government Investment in Water and Sewer Infrastructure: Adding
Value to the National Economy”, US Conference of Mayors, Mayors Water Council Washington, DC 48
Ibid. 49
WHO & SIWI, “Making Water a Part of Economic Development”, Govt Norway & Sweden as input into Commission on Sustainable Development (CSD) (2004-2005) 50
Krop, R.A., Hernick, C. & Frantz, C. (2008) “Local Government Investment in Water and Sewer Infrastructure: Adding Value to the National Economy”, US Conference of Mayors, Mayors Water Council Washington, DC 51
WHO & SIWI, “Making Water a Part of Economic Development”, Govt Norway & Sweden as input into Commission on Sustainable Development (CSD) (2004-2005)

Chirundu WSS Feasibility Report Page 148 of 209
border depends on the amount of time that it takes to cross the border, as well as a range of other amenities
available to them while they wait. Water supply and sanitation infrastructure is one of these basic and
fundamental amenities.
Improved water supply and sanitation will enable increased and smoother regional connectivity, trade and
ultimately regional integration. With a high standard of basic infrastructure, Chirundu will remain a primary
conduit for traffic crossing the Zambezi on the Regional Transport Corridors.
Without water supply and sanitation improvements, truck drivers will continue putting strain on the town’s
already limited water supplies. The fact that Chirundu is a border town means that the chance of these
epidemics spreading throughout the region is significant. The WSP52
estimate that the cost of an epidemic
outbreak – of which faecal contamination of the environment is the root cause – will cost Zambia approximately
USD 2 million per year.
Climate Resilience
The compounding pressures of growing populations, increasing number of border patrons and climate change,
which sees a decrease in the average rainfall53
to the area while simultaneously more variable rainfall, suggests
the urgent need for better water infrastructure.
The proposed scheme sees the introduction of a number of climate-resilient interventions, including increased
storage, a floating intake, and better monitoring of water supply to reduce leaks in the system. These
interventions are likely to increase the town’s climate resilience and to avoid severe stress to the population of
the town should there be any large climate shock.
Sustainability Analysis
The economic appraisal shows that the project is justified from a socio-economic perspective. The financial
appraisal shows that with external funding support for capital investment costs, there is adequate cash flow to
maintain operations at the assumed current tariff levels. The remaining issue for a sustainability analysis is to
assess the affordability of the project for its intended beneficiaries. The analysis assesses the affordability of the
current tariff levels that will be charged for the services provided in the Chirundu project, based on the average
monthly income of the population.54
Benchmarks are a useful source of affordability standards for water and sanitation services. Hutton (2012)55
finds that in Africa, the affordability index for the monthly spend of median households on water is around 2.8%
52 WSP Africa (2012) “Economic Impacts of Poor Sanitation in Zambia” Water and Sanitation Program, World Bank,
http://www.wsp.org/sites/wsp.org/files/publications/WSP-ESI-Zambia.pdf [2015, July 14] 53
CEEPA (2006). The economic impacts of climate change on agriculture in Zambia. http://www.ceepa.co.za/uploads/files/POLICY%20NOTE%2027.pdf [2015, July 14] 54
We have assumed that tariffs will remain fixed at 2016 prices 55
Hutton, G. (2012) Monitoring affordability of water and sanitation services after 2015: Review of global indicator options”, PhD – A paper submitted to the United Nations Office of the High Commission for Human Rights, http://www.wssinfo.org/fileadmin/user_upload/resources/END-WASH-Affordability-Review.pdf

Chirundu WSS Feasibility Report Page 149 of 209
of monthly income, and for poor households connected to public water supply can easily reach 7.5%.
International agencies have provided their own affordability thresholds – UNDP (3%), World Bank (5%), OECD
unofficial (4%), and African Development Bank (5%).
The average monthly spend for a rural household in Chirundu is equal to GBP 3 per month for high cost
households (based on an average monthly water consumption of 11 m3
and an associated tariff of GBP 0.25).
For communal access households, the average monthly spend is GBP 0.5, based on an average monthly use of
2m3. Using the average monthly wage in the agriculture of GBP 40 (600 ZMW), communal access households
will spend roughly 1% of their household budget, assuming that only one household member works. For high-
cost households, this equates to roughly 7% of their monthly wage, assuming only one member of the
household works. At the current assumed income levels, the tariffs appear to be affordable for both rural and
high cost households. Comparing these with the benchmarks outlined above, the project will be affordable to the
Chirundu population.
As discussed in the Financial Appraisal section above, tariffs for border patrons are based on current charges in
the informal market for water and sanitation services. They thus represent sufficient willingness to pay for the
water supply and sanitation services proposed in the project design.
Conclusions and Recommendations
There is an overwhelming economic justification for the project, as indicated by the quantitative results
of the economic appraisal in conjunction with the qualitative benefits arguments. In the short term the
provision of WASH infrastructure is fundamental to basic human needs; in the medium and longer term,
WASH infrastructure will be catalytic to economic development at a local (community) level, as well as
for Zambia and the SADC region. The project is expected to result in significant improvements to the
health of Chirundu residents, as well as border patrons, along with time savings and ecological
improvements, all of which indicate that the project should be implemented.
The project alone however is not commercially viable – the revenue generated by the project is not
sufficient to cover the investment cost over the project life. This is neither surprising nor uncommon for
water and sanitation projects of this scale, given that such projects are fundamentally providing a public
good. Traditional financing is therefore not appropriate to this project; long term
developmental/concessional loans, grant or subsidised funding are required to cover the capital
investment.
The financial appraisal indicates that the project is operationally sustainable. Annual revenues generated
exceed the annual operation and maintenance requirements of the infrastructure over the project life. Domestic
demand, O&M costs, and water supply coverage are however critical to the operational sustainability of the
infrastructure. As such, should these parameters vary significantly over time; LWSC must adjust the phased
investments as appropriate.

Chirundu WSS Feasibility Report Page 150 of 209
Institutional Assessment
Introduction
The purpose of this section of the Feasibility Study is to address the institutional component of the Chirundu
project and in particular, the implications for the organisation responsible for management of the project once it
is completed, namely; Lusaka Water and Sewerage Company (LWSC). Of particular emphasis is the
sustainability of the current and future institutional arrangements. The Institutional Assessment was done on the
basis of a strategic review due to being done at a high level, primarily consisting of a desk study. Only limited
interaction with LWSC was possible. Within these constraints, the analysis attempted to be holistic in nature.
Legal and Policy Context
The Zambian water sector has been in a process of sector reform for the last two decades. One of the critical
documents which sets out much of the vision and proposals for sector reform in the water services sector is a
Discussion Document56
produced in 1994. This document was far-sighted and wide-ranging and set out
proposed objectives, sector principles and policies. It also covered the sector investment strategy, proposed
organisational framework and transitional arrangements. At the outset it was very hard-hitting; “The Zambian
water supply and sanitation sector is in considerable disarray. The sector is generally under-financed, under-
staffed and unable to meet its service-delivery obligations.” This stark realisation set the scene for the wide-
ranging scope of discussions in the rest of the Discussion Document. It emphasised that at the time the
institutional framework was complex and fragmented and needed a major rethink. Core challenges57
included
the following:
The lack of a sector policy or strategy.
Potential conflict of interest in water resources management.
Severe financial constraints.
Lack of sustainability of water suppliers in small towns and in the rural areas.
Scarcity of human resources.
The document set out a proposed overall goal for the sector as follows “Zambia’s water supply and sanitation
policies and strategies are aimed at improving the quality of life and productivity of all people by ensuring the
equitable provision of an adequate quantity and quality of water to all competing user groups and sanitation
56 “Proposed Institutional Framework for the Water and Sanitation Sector: Final Discussion Document”. Water Supply and
Sanitation Sector Programme Coordination Unit, Government of Zambia. 29 June 1994. 57
Ibid.

Chirundu WSS Feasibility Report Page 151 of 209
services to all, at acceptable cost, on a sustainable basis”. To support this, the following objectives58
were set
out:
Service delivery levels and coverage appropriate to requirements of different consumer groups.
Long-term sustainability of service delivery through financial viability and cost recovery policies.
Provision of grants and subsidies designed to support investments to needy sections of the community
until executive organisations achieve financial viability and, subsequently, the ability of sector
organisations to support such investments through internal subsidies.
Improvements in efficiency and service delivery and application of funds through an appropriate
institutional legislative framework, clear definition of responsibilities, coordination with other
organisations, coordination of activities with donors and NGOs.
Community consultation and participation in project development, implementation, operation and
maintenance as appropriate to local conditions and customs.
Participation and regular consultation on future policy and organisation development.
Use of technology appropriate for local conditions and operating and maintenance capacity and more
effective development of both surface and groundwater resources for piped and point water supply.
Increased emphasis on the provision of sanitation services to overcome past neglect.
Improved efficiency in the use and re-use of scarce water resources.
Development of human-resource capacity and capability in the sector.
In addition to the above goals and objectives, the sector reform approach was informed by the following sector
principles and policies59
:
Principle 1: separation of water resource management from water supply and sanitation.
Principle 2: separation of regulatory and executive functions.
Principle 3: devolution of authority to local authorities and private enterprise.
Principle 4: full cost recovery in the long run.
Principle 5: human resource development leading to more effective institutions.
Principle 6: technology appropriate to local conditions.
Principle 7: increased Government of Zambia, priority and budget funding to the sector.
As was noted earlier, the issue of decentralisation was critical in the restructuring and the approach was
relatively aggressive in this regard; “few executive functions remain at the national level”. It was therefore
5 Ibid
59 “Proposed Institutional Framework for the Water and Sanitation Sector: Final Discussion Document”. Water Supply and
Sanitation Sector Programme Coordination Unit, Government of Zambia. 29 June 1994

Chirundu WSS Feasibility Report Page 152 of 209
foreseen that design and construction, operation and maintenance, commercial activities, contracting of
services, purchasing of materials and equipment, and raising of capital will occur at the regional and local levels.
It also set out the important principle that the operations, management and maintenance of the water services
should be carried out either by the private sector or autonomous, corporatized utility-type bodies.
The Water Supply and Sanitation Act60
sets out the enabling legislation for the establishment of the water
services regulator, the National Water Supply and Sanitation Council (NWASCO) and the water utilities. There
are a number of relevant pieces of legislation impacting on the water services sector in Zambia but undoubtedly
this is the key one in terms of the scope of this study. It sets out the functions of the NWASCO which are as
follows:61
(a) Advise the Government on water supply and sanitation matters.
(b) Advise local authorities on commercially-viable institutional arrangements for the provision of water supply
and sanitation services.
(c) License utilities and other service providers, as well as other activities related to the provision of water.
(d) Develop sector guidelines for
(i) Provision of water supply and sanitation services;
(ii) Establishment of water supply and sanitation utilities;
(iii) The technical and financial management of utilities; and
(iv) The setting of tariffs for the provision of water supply and sanitation services.
(e) Establishment of standards for
(i) Water supply and sanitation services;
(ii) The management of utilities and other service providers;
(iii) The design, construction, operation and maintenance of water supply and sanitation
facilities.
(f) Advise utilities and other service providers on procedures for handling complaints from consumers.
(g) Disseminate information to consumers on matters relating to water supply and sanitation services.
(h) Carry out any other activities relating to the regulation of water supply or sanitation services which are
necessary or conducive to the better performance of this function under this Act”.
The Act also establishes the legal framework for the establishment of the water supply and sanitation utilities to
be established by local authorities with three options given:
As a public or private company
60 “The Water Supply and Sanitation Act”, Government of Zambia. 1997.
61 Ibid.

Chirundu WSS Feasibility Report Page 153 of 209
As a joint venture with an individual or any private or public company
As a joint venture with another local authority or several local authorities.
It can be seen from this that the legislation is enabling in terms of potential private sector involvement at some
stage in the future, though not much has happened to date. It does however indicate that the majority shares
must be held by the local authority.
The Act defines that no-one may provide water and sanitation services unless they have a licence and this
licence can only be given by NWASCO. The licence period is a minimum of ten years which can be renewable.
The licence can also be withdrawn if the Regulator considers that the licence-holder is not carrying out their
work in an effective manner.
Institutional Arrangements
The institutional landscape for water and sanitation services in Zambia is depicted in Figure 30. This highlights
the fact that the Regulator reports to the Ministry of Energy and Water Development whilst the utilities report to
the Ministry of Local Government and Housing. As was noted earlier this was done very specifically to ensure
the impartiality of the Regulator. Though it sits under the Ministry of Energy and Water, NWASCO maintains a
very close working relationship with the Ministry of Local Government and Housing.

Chirundu WSS Feasibility Report Page 154 of 209
Figure 30 Institutional Landscape for Water Services in Zambia
The geographic areas of the Water and Sewerage Companies (WASCOs) are illustrated in Figure 31. These
cover virtually the whole country however in practice they focus on the urban areas with the rural areas
addressed by municipalities or district councils. The only exception is one or two smaller areas addressed by
private companies supplying primarily to their employees. These are typically either mining or sugar companies.
The population in each area varies dramatically from a high of approximately two million in the Lusaka Water
and Sewerage Company area to 180 000 in the Western and Luapula areas.
The municipalities are the nominal owners/shareholders of the utilities and nominate representatives to sit on
their boards. In practice however the municipalities appear to have little influence in terms of how utilities go
about their business.
MLGH
DISS
Co-ordination
and resource
mobilisation
NWASCO
UWSS regulation
MEWD
DWA
Water Resource
Development and
Management
DTF
Develop-
ment
Banks/
Donors
Local
Authorities
Commercial Utilities
and Other Licensed Providers
CU Boards
Water Watch
Groups
KEY
Reporting
Advice

Chirundu WSS Feasibility Report Page 155 of 209
Figure 31 Area covered by Water and Sanitation Utilities in Zambia
Following a significant period of institutional reform between 2000 and 2010, the arrangements in Zambia with
respect to water services are now quite well established and if anything, strengthening/improving. In this regard,
NWASCO has played, and continues to play, an important role in terms of raising the bar with respect to the
performance of the utilities as well as providing transparent information on their performance. There are, and
probably always will be, debates and contention around some of the evaluation processes and systems
however the support for the role of the Regulator in Zambia is nevertheless widespread62
. The Regulator in
Zambia also certainly does not play purely the role of policeman, and is involved quite significantly in capacity-
building elements. It does this both by development of guidelines but also by making training available to the
utilities in relation to these. This role of coach and supporter, as well as referee, while not necessarily a classical
model of the Regulator, is not uncommon in developing countries and is probably appropriate in this context63
.
62 “The Role of Regulation in Improved Water Services Management in Southern Africa”, Wilson, A. and Pendley, C., African
Development Bank. 63
Ibid

Chirundu WSS Feasibility Report Page 156 of 209
There has been ongoing discussion for some while with respect to whether there is a need to move NWASCO
from reporting to the Minister of Energy and Water Affairs, to the Ministry of Local Government in line with the
utilities. Thus far this has been resisted by NWASCO and a peer review process carried out in 2015 by other
regulators in Southern Africa confirmed that this was a best practice approach as it resulted in better model in
terms of independence64
.
Another institutional issue which has been under debate in the water services sector in Zambia is where the
Development Trust Fund should be located? This is a significant institution that provides substantial sums of
capital in the form of grants to assist utilities, particularly with the provision of infrastructure to sub-economic
areas but also in some cases to improve operational efficiency and refurbishment. This continues to be a critical
role in Zambia in view of the fact that virtually all of the utilities, with the possible exception of Lusaka Water and
Sewerage Company and Nkana WSC, are not what one could describe as being “bankable organisations” and
therefore cannot go to the market to raise funding on a commercial basis. The DTF disperses funds sourced
from the Regulator, from mechanisms such as the sanitation surcharge implemented some years previously and
which was ring-fenced to facilitate sanitation. In addition, the DTF acts as a basket fund for funding coming from
Co-operating Partners (CPs). The DTF has built up a solid track record of governance, financial management
and project management over the years and this has established good credibility with CPs and with the national
Government. In spite of this, the institutional design of the DTF has always been something of an anomaly as it
reports directly to the Regulator (and even shares offices). Though there are undoubtedly very good historic
reasons for this, probably related to the credibility of the Regulator as a whole, it is a somewhat unusual
institutional design that in the author’s experience has not been replicated in other countries. For this reason
therefore there is some support for proposals to relocate the DTF to another location, probably under the
Ministry of Local Government and Housing. One school of thought is to set it up as a separate parastatal with a
broader remit in terms of raising and dispersing funds for capital projects in the water sector. Either way, the
ongoing credibility around governance, financial management and project management will continue to be
crucial.
The commercial utilities in Zambia have generally improved significantly in the last 10 to 15 years across a wide
range of relevant indicators measured by the Regulator. This is also the case with the Lusaka Water and
Sewerage Company, which, as was noted earlier, is one of the best-performing utilities in the country. Given this
background, it would appear that the current institutional arrangements are working adequately.
The Chirundu project is small in the context of the current operations of LWSC so there is no reason to believe
that they would not be able to manage it adequately. Two possible areas of risk have been identified, first of all
with respect to the financial position of the utility and secondly the remote location of the scheme relative to the
City of Lusaka. With regard to the first issue; the organisation made a large loss in 2014 after virtually breaking
even in 2013. This trend is clearly not sustainable in the long term unless the Government steps in but that
would somewhat destroy the point of setting up commercial utilities in the first place. Having said this, the
64 “Peer Review of Water Services Regulatory System in Zambia”, Wilson, A. Eastern and Southern African Water and
Sanitation Regulators Association (ESAWAS)

Chirundu WSS Feasibility Report Page 157 of 209
history of the utility has shown that it is gradually strengthening over time and one cannot expect these issues
related to institutional reform to be resolved overnight. In addition, the 2014 year was particularly difficult for
LWSC with severe problems encountered with both the drought, unreliable electricity (in fact these two issues
are related in Zambia because of the country’s high reliance on hydropower generated at Kariba) and a big
decline in the exchange rate. The combination of the first two adverse factors resulted in a major drop in water
sales and hence financial losses. The latter had a major impact on the cost of servicing a dollar denominated
loan from the World Bank. In spite of this, and based on the experience of the last decade, it can be expected
that the organisation should continue to strengthen its financial position over time. In some respects the
Regulator is likely to play a positive role in this evolution, while also balancing the interests of customers.
LWSC is currently the recipient of a major programme of institutional support from the initiative known as the
Millennium Challenge Corporation, funded by the US Government. This is a very large programme with total
funding of $354.8 million. It is addressing a wide range of issues but the core areas of support are as follows;
Asset management
Sanitation provision to peri-urban areas
Reduction of non-revenue water
Solid waste management
Storm water management
Gender mainstreaming
Metering of unmetered connections
Adding new connections
Some of these are more focussed on supporting the Lusaka City Council however the bulk of the funding is to
support LWSC activities. The infrastructure components are focussed on Lusaka however the more cross
cutting aspects such as asset management and NRW will quite likely have wider benefits in terms of fostering
best practice that can be applied more broadly to other areas. In addition, since Lusaka provides by far the bulk
of LWSC’s income, an improvement in the performance there will probably have benefits to LWSC’s wider area.
The MCC initiative operates according to strict timelines with any funding unspent by the Compact end date
effectively being “handed back” to the US Government. Thus far the programme has been running behind
schedule however almost all of the major contracts have now been awarded65
, so acceleration should be
expected. With the extent of the funding injection, one would expect to significant improvements in the next few
years in areas such as NRW and asset management. This clearly addresses some of LWSC’s core
weaknesses and is likely to have a residual/spin off benefit for Chirundu.
LWSC have informed CRIDF officials that the Chirundu scheme does not currently cover its O and M costs. This
effectively means that operations there are cross-subsidised, which is not ideal for an organisation such as
LWSC which seeks to have a strong commercial focus. The small size of the scheme and its remote location
tend to make its “nuisance value” for LWSC potentially quite high. LWSC have also indicated that the staffing
65 Mr. George Ndongwe, MD of LWSC, personal communication

Chirundu WSS Feasibility Report Page 158 of 209
levels/qualifications at Chirundu are currently inadequate and that these would be improved when the scheme is
upgraded.
The fact that Chirundu is only a recently established District probably has something to do with the fact that the
institutional arrangements in the area are still evolving and that LWSC and the local municipality share
responsibilities. The delineation of the urban area would also appear to “be a work in progress”. This may be
why LWSC does not appear to have committed itself fully to management of the scheme as it stands. The
upgrade of the scheme, formalisation of the town and growth in the area are highly likely to provide the impetus
required for LWSC to commit additional resources to management of the scheme and hence to provide a high
quality service to customers in the area.
Overview of the Lusaka Water and Sewerage Company
LWSC is an independent company owned jointly by Lusaka City Council (LCC), Chongwe, Luangwa and Kafue
District Councils. LWSC owns and operates water and wastewater assets in the city of Lusaka and surrounding
outlying areas. In recent times LWSC has had a good reputation for engineering, Operation and Maintenance
and supporting service capability. As is common with a number of the water and sewerage companies in
Zambia, they have been on an upward trajectory in the last decade with improvements in areas such as the
number of water connections, water quality, operation and maintenance expenditure and cost recovery.
Key challenges nevertheless remain in aspects such as high levels of non-revenue water, reliability of the
service and low levels of sewer connections. Their financial viability has also improved over the years to the
point where they can now effectively break even. They are not yet what one would call a fully “bankable
organisation” but should achieve this status in the short term if they can continue on their current positive
trajectory (they have recently secured a loan from the World Bank).
The City of Lusaka is the core of LWSC’s activities and functions. It has a population of approximately 2 million
people, which represents approximately 20% of Zambia’s overall population. The overall population growth rate
is estimated to be approximately 4,5%. Only about 70% of Lusaka’s residents have access to a treated water
supply and 65% to waterborne sanitation66
. This means that there are significant quantities of people without
access to these basic services, with potential severe impacts on health. The city is located on a relatively flat
plateau, which can result in flooding in the summer months leading to potential further health risks when linked
with unsafe sanitation practices. At the same time, the city is unusual in that it is extremely reliant on water
extractions from primary dolomitic aquifers. The latter are being severely impacted upon by on-site sanitation
systems, which are having a negative effect on the water quality thereof. The water loss in the Lusaka system is
currently estimated at 47% of the water delivered to the system67
.
Much of the sewerage network in Lusaka was constructed more than 40 years ago and has undergone little
maintenance or expansion since that time. As a result, much of it is in a deteriorating condition and/or
66 “Final Sanitation Master Plan, Lusaka, Zambia”. The Republic of Zambia, Ministry of Local Government and Housing,
Lusaka Water and Sewerage Company, Millennium Challenge. June 24, 2011. 67
“Urban and Peri-Urban Water Supply and Sanitation Sector Report 2015”, NWASCO

Chirundu WSS Feasibility Report Page 159 of 209
overloaded. In addition a large proportion of the waterborne systems discharge to septic tanks, which again
have a negative impact on the groundwater. It is estimated that approximately 59% of households in Zambia
use pit latrines68
and this figure is likely to be similar in Lusaka.
Governance
The LWSC was officially established in 1988 and incorporated as a water utility under the Companies Act and
the National Water Supply and Sanitation Act although full operations only started in 1990. It commenced
functioning as a provincial Utility during 2008, with the Councils of Lusaka City, Kafue, Chongwe and Luangwa
as the shareholders.
The LWSC has a clear mandate that requires it to provide water and sewage services in urban and peri-urban
areas within the Lusaka Province. Local authorities are held responsible for delivery to rural areas. The various
aspects related to its mandate are well integrated into its target levels of service and, while ambitious, are
nevertheless appropriate and well defined.
The Company has taken the principle of subsidiarity as a basic point of departure with the devolution of a
proportion of necessary functional aspects of the Company to each of its branches, with Kafue serving as the
largest of these. The need to meet all commercial and operational requirements and to deliver water and
sewerage services to all urban and peri-urban areas as mandated coupled with the need for devolution, exacts
a price in respect of the management rigour that needs to be applied and the staff complement required to be in
place.
It is subject to all legal rights and obligations set for a corporate persona as well as the Regulations pertaining to
its functioning as required by NWASCO. All the NWASCO Corporate Governance Indicators were satisfied for
201569
(see further comment on this later).
In line with the regulations, the Board of Directors are drawn from various public stakeholder groups within the
Province and appointed collectively by the local authorities. These appointments are ratified by the MLGH,
which appoints an additional two members, one of whom is required to act as Chairperson. In the case of the
LWSC, it is accepted that the individual identified by the MLGH to act as Chair will, in addition, be drawn from
any of the participating Councils.
The position of Council Secretary is filled by an individual nominated into this position by fellow Town Clerks.
One of the two representatives from the community is drawn from the commercial consumer category, whilst the
other is drawn from the domestic consumer category.
It is uncertain whether or not gender equity targets are in place and/or applied within the context of the Board.
At the same time, Zambia as well as the LWSC have a solid track-record of the need for gender mainstreaming.
The LWSC Board is (normally) comprised as follows:
68 “Final Sanitation Master Plan, Lusaka, Zambia”. The Republic of Zambia, Ministry of Local Government and Housing,
Lusaka Water and Sewerage Company, Millennium Challenge Corporation. June 24, 2011. 69
NWASCO (2016) Urban and Peri-urban Water Supply and Sanitation Sector Report 2015

Chirundu WSS Feasibility Report Page 160 of 209
Mayor / Council Chairperson 1
Town Clerk/Council Secretary 1
Engineering Institute of Zambia 1
Provincial Local Government Officer 1
Private Sector 2
Community Representatives 2
MLGH Representatives 2
LWSC Managing Director 1
The Company operated without a Board of Directors for a period of time, with a new Board appointed in 2013.
Separate Board Sub-Committees were constituted during the 2013/2014 period as follows
Audit Committee
Works and Development Committee, and a
Finance and Human Resources Committee.
In addition, the World Bank makes reference to a Senior Management, Works and Development Committee of
the Board70
. The Regulator notes the establishment of a Gender Committee that has been put in place71
.
There were four Board meetings held during 2015 and 98% attendance during this period72
. In their 2015 Sector
Report, NWASCO indicated a relatively high degree of satisfaction with governance matters in LWSC and they
commented favourably on the strategic plan, approved budget, audited Annual Report and investment plan,
which is probably an Infrastructure Master Plan or a multi-year Capital Expenditure Plan.
The LWSC Board has recently completed its term and the process of appointing new members is underway. A
recent announcement from the Minister of Local Government regarding the appointment of Boards is indicative
of the possibility of political interference in the governance of utilities in Zambia at various times (see Figure
3273
). Both NWASCO74
and LWSC75
are engaging with the Minister to try and address this issue. They are
placing a major emphasis on the need for strong governance and hence the quality, independence and
qualifications of Board members.
70 World Bank Urban Development and Services Unit (2013) Water Sector Performance Improvement Project
Implementation Completion and Results Report 71
NWASCO (2016) Urban and Peri-Urban Water Supply and Sanitation Sector Report 2015 72
“Urban and Peri-Urban Water Supply and Sanitation Sector Report 2015”, NWASCO 73
Zambia Herald, 3 March 2016 74
Mr Kelvin Chitumbo, Director NWASCO, personal communication 75
Mr George Ndongwe, Managing Director, LWSC, personal communication

Chirundu WSS Feasibility Report Page 161 of 209
Figure 32 Dissolution of LWSC Board
Organisational Strategy
The organisational strategy as it stands would appear to contain most of the key elements that one would
expect to see for an organisation of this nature. In addition, it appears to respond to the particular challenges
that are facing LWSC at the current time.
The vision, mission and strategic objectives of the LWSC are shown below76
.
Vision
To be a world class company working together to change lives and bring pride to communities through provision
of water and sanitation services.
Mission
To provide quality water and sanitation services at commercially and environmentally sustainable levels to the
delight of our customers and other stakeholders.
76 “Strategic Plan: 2014-2018”, LWSC

Chirundu WSS Feasibility Report Page 162 of 209
Objectives for the planning period
In their most recent Strategic Plan, LWSC carried out a review of their performance for the previous planning
period77
. In this, they identified the following major challenges facing the organisation:
Lack of capacity to meet demand for water
Lack of capacity to meet demand for sanitation services
High non-revenue water
Inadequate resources for reinvestment
Increasing operation costs
The analysis also noted that these had not changed from the time when the previous strategic review
had been carried out.
LWSC have identified the following five major themes for the five year period 2014 to 2018:
Financial viability
Water supply and sanitation improvement
Customer satisfaction
Process re-engineering
Motivated committed and highly productive staff
As can be seen, the objectives set out in the Strategic Plan speak for the most part to the strategic challenges
identified by LWSC. It also addresses the weaknesses highlighted by NWASCO in areas such as non-revenue
water and the provision of safe sanitation.
Often the most challenging thing about strategy is not the development of the strategic plan but the
implementation thereof. In many cases this is where strategic planning succeeds or fails and speaks to the
concept of “strategic management” as opposed to strategic planning. A key part of this is action plans/workplans
to support the high level strategic plan that spell out the critical aspects such as “what?, how much?, by when?
and who?”. In this regard, LWSC carried out a review of their performance against their strategic objectives in
2014. A summary of the results of this are given in Table 2 below. This highlights that 2014 was an extremely
challenging year for LWSC on the financial front due to a number of (probably largely uncontrollable) external
factors (see discussion under 5.3 below). NRW also suffered a decline but it is known that this is currently an
area of enhanced focus for LWSC. An increase in NRW in such cases can sometimes be due to the process of
improved measurement, which provides better quality information on the subject than what was available
previously (where sometimes intelligent guesses were made). In other areas such as customer service the
target was exceeded.
77 “Strategic Plan: 2014-2018”, LWSC

Chirundu WSS Feasibility Report Page 163 of 209
Table 48 Performance against the Strategic Plan
No. Objective Target for 2014 Status as at 31st
December 2014
1 Improved
profitability
Attain 3% return
on capital
employed
(ROCE)
-8% attained. Affected by huge exchange loss and
low revenue
2 Improved liquidity 95% collection
efficiency
180 debtors days
-88% collection efficiency due water stress that
made debt management exercises to be difficult and
negatively impacted on the willingness to pay
228 days attained to convert receivables into cash to
settle short term obligations when they fall due. This
is in comparison with 225 days attained in 2013
3 To reduce non-
revenue Water
35% 42% attained
4 Provide reliable
water and
sanitation
services
Average daily
supply of 22hrs
20 hours attained, affected by erratic water supply
5 Improved
customer
services
No. of 100
connections
95% complaint
resolution
25 complaints per
100 connections
96% attained
10 complaints per 100 connections achieved
6 Implemented
quality and
Environmental
Management
systems
Implementation of
quality
management
system (QMS)
To date a total of 66 processes and procedures
have been documented. Activities that have an
impact were listed for each directorate and related
environmental aspects identified
7 Improve staff
productivity
At least 40%
score on
NWASCO
productivity index
60% attainment affected by low collection and billing
below target
Ideally progress on implementation of the strategy and related work plans should be discussed by top
management on a regular basis, perhaps every one to two months with a major review annually. The 2014

Chirundu WSS Feasibility Report Page 164 of 209
review would suggest that LWSC have put the necessary systems in place to ensure that implementation of the
strategic plan is monitored on an ongoing basis, but this could not be confirmed.
Financial
The latest financial statement that was accessed for the Feasibility Study was the draft for 201478
(see Annex
F3 and F4). The total income for 2014 was approximately 227 million Kwacha. LWSC had an extremely
challenging year in 2014 due to the droughts and (related) increasingly unreliable electricity supply and the
decline in the strength of the Kwacha against the US Dollar. LWSC’s supply sources are primarily via the
excellent underground aquifer located in the vicinity of Lusaka and the supply from the Iolanda Works at the
Kafue River. Both of these sources have to be pumped, which emphasises just how dependent LWSC is on
reliable electricity supply. The exchange rate impacted directly on a loan made by the World Bank that is dollar
denominated. LWSC made a loss of 41 million Kwacha in 2014, after almost breaking even in 2013. This
highlights the impact of the adverse external factors experienced in the 2014 year.
NWASCO79
reported that LWSC were very successful in terms of revenue management with a collection
efficiency of 96% in 2015. This resulted in an “O&M cost coverage” of 88%. The full cost coverage including
aspects such as depreciation, pension allowances and servicing debt will have been substantially lower.
LWSC’s current ratio for 2015 was 1.43, which is at a very acceptable level.
Tariffs
The tariff schedule for LWSC is shown in Figure 33. LWSC’s tariffs are below the average for Zambia, though
they do in theory have better economies of scale than any of the other commercial utilities. If however one does
some benchmarking with other commercially viable utilities in Southern Africa, these tariffs are probably on the
low side by a factor of perhaps 60-80%. This is indicative of why LWSC and other Zambian utilities are not yet
truly commercially viable. That said, nearly all of the commercial utilities in Zambia have strengthened
significantly in the last ten years and show signs of becoming viable in the not-too-distant future.
NWASCO typically carries out a comprehensive tariff determination for each utility every three years that covers
the following three years. This includes an associated “Service Level Guarantee” (SLG) that sets out targets for
the utility to achieve, if it is to obtain the tariff increases set out over the next three years. The assessment in
000 meters the intervening years is therefore less comprehensive in nature. In 2016 LWSC obtained a “no
objection” from NWASCO for a 30% tariff increase. Selected conditions in the SLG include the installation of at
least 15 000 meters in Lusaka and increase the number of connections by 5 000, both by the end of August
2015.
78 “Lusaka Water and Sewerage Company Limited: Financial Statements 31 December 2014” Draft – 22 October 2015,
Grant Thornton 79
“Urban and Peri-Urban Water Supply and Sanitation Sector Report 2015”, NWASCO

Chirundu WSS Feasibility Report Page 165 of 209
Figure 33 Approved Tariff Schedule for LWSC for 2016
Revenue Collection
In spite of the 96% collection efficiency, the meter coverage figure is only 72% and this provides a lot of
opportunities for enhancing revenue via this mechanism. Recently LWSC have commenced a fairly aggressive
initiative to install pre-payment meters. The idea with this is to improve on non-payment problems and delays.
Particularly problematic in this regard are government institutional and facilities. It will be interesting to see how
this new strategy works. It is understood that the Compact Agreement signed with the United States Agreement,
improvement of payment by government was a key condition. Early signs are that there has been an
improvement in the payment of arrears.
It was reported that LWSC has a lot of old and faulty meters that need to be replaced. This may also speak to
the issue of why the non-revenue water figure is so high at 47%.
Operation and Maintenance Costs
The breakdown of O and M costs is summarised in Figure 34.
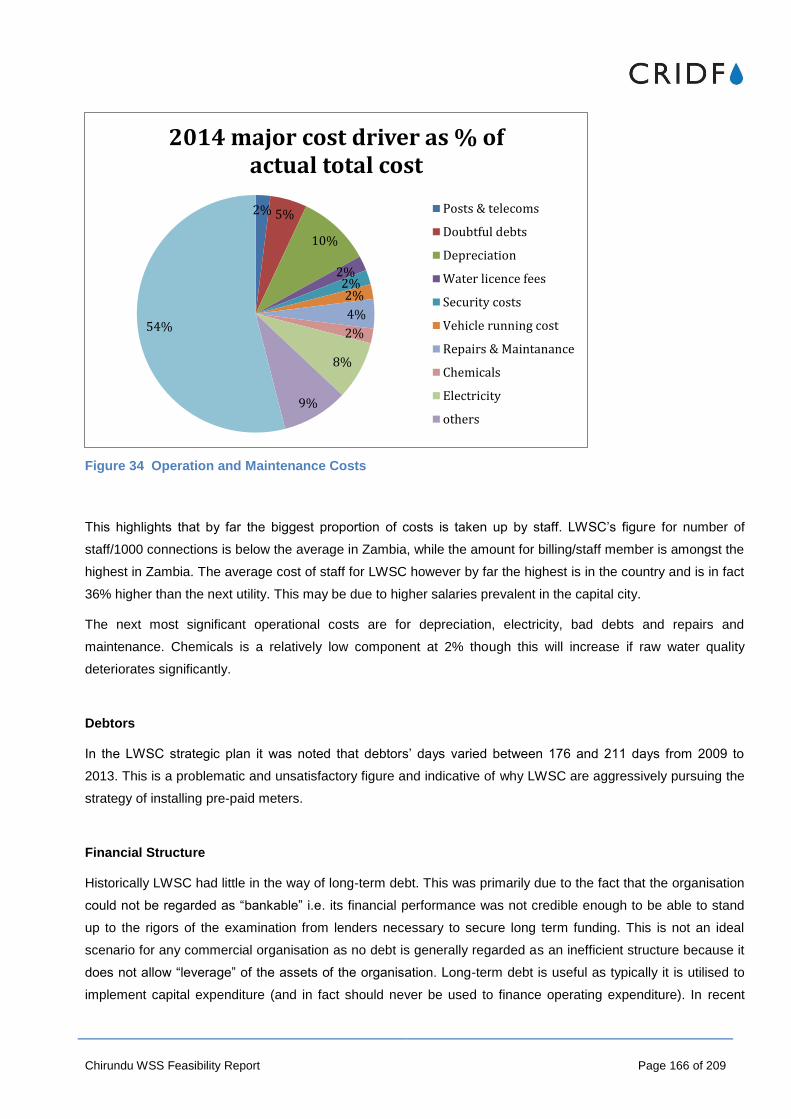
Chirundu WSS Feasibility Report Page 166 of 209
Figure 34 Operation and Maintenance Costs
This highlights that by far the biggest proportion of costs is taken up by staff. LWSC’s figure for number of
staff/1000 connections is below the average in Zambia, while the amount for billing/staff member is amongst the
highest in Zambia. The average cost of staff for LWSC however by far the highest is in the country and is in fact
36% higher than the next utility. This may be due to higher salaries prevalent in the capital city.
The next most significant operational costs are for depreciation, electricity, bad debts and repairs and
maintenance. Chemicals is a relatively low component at 2% though this will increase if raw water quality
deteriorates significantly.
Debtors
In the LWSC strategic plan it was noted that debtors’ days varied between 176 and 211 days from 2009 to
2013. This is a problematic and unsatisfactory figure and indicative of why LWSC are aggressively pursuing the
strategy of installing pre-paid meters.
Financial Structure
Historically LWSC had little in the way of long-term debt. This was primarily due to the fact that the organisation
could not be regarded as “bankable” i.e. its financial performance was not credible enough to be able to stand
up to the rigors of the examination from lenders necessary to secure long term funding. This is not an ideal
scenario for any commercial organisation as no debt is generally regarded as an inefficient structure because it
does not allow “leverage” of the assets of the organisation. Long-term debt is useful as typically it is utilised to
implement capital expenditure (and in fact should never be used to finance operating expenditure). In recent
2% 5%
10%
2% 2% 2%
4%
2%
8%
9%
54%
2014 major cost driver as % of actual total cost
Posts & telecoms
Doubtful debts
Depreciation
Water licence fees
Security costs
Vehicle running cost
Repairs & Maintanance
Chemicals
Electricity
others
Chirundu WSS Feasibility Report Page 167 of 209
years, LWSC’s balance sheet has strengthened to the point that it has been able to secure long term debt
funding, specifically from the World Bank. This has been utilised for a number of capital projects. LWSC’s
financial leverage (debt to equity ratio) was 1.05 in 2013. Sadly, the World Bank loan, which is dollar
denominated, has coincided with a sharp decline in the strength of the Kwacha and this has had an adverse
effect on the income statement in 2014 and 2015.
In spite of the recent problems, the strategy to increase financial leverage of the organisation is sound, as long
as it is kept at manageable levels and is used for capital expenditure designed to enhance revenue collection
and/or sales and /or reduce costs. This may lead to “short term pain but long term gain” for LWSC.
Organisational Design and Human Resources
Management Structure80
The Executive Management of the LWSC is constituted of a Managing Director, assisted by four Executive
Directors, variously in charge of the Engineering, Finance, Commercial Services and Human Resources
divisions.
Specific management functions have, as well, been put in place in respect of (i) Company Secretary and Legal
Functions, (ii) Audit Services, (iii) Corporate Planning, (iv) Quality Control, (v) Purchasing and Supplies, and (vi)
Non-Revenue Water. Each of these functional areas function under a specifically appointed manager.
Collectively they are tasked with the implementation of policy and strategic direction of the Company as
determined by the Board. It is further expected that the Executive Management will ensure that the Board is
well informed about the operations of the Company and supported in respect of strategic decisions.
The management team members have been screened with regard to academic qualifications as well as
experience within the sector. However, the specific qualifications of each as well as the age and gender
distribution has not been made available and can, therefore, not be commented on.
Management Functioning
The LWSC has a history of efficient and effective functioning and was ranked 2nd
highest performing water utility
in the Country by NWASCO in 2013 and 1st overall for the 2014 period, as measured against the various
benchmarks set by the regulator. However, the ranking for the Company fell to 4th overall during the 2015
period81
. The regulator makes it clear that a Utility “moving down in the ranking does not necessarily mean that
80 Unless otherwise stated, the contents of this Section based on information obtained through a series of interviews with
LWSC and other stakeholders undertaken for this assessment as well as for other studies such as the ‘LWSC Sustainability Agreement Baseline Indicators and Annual Technical Audit’ and the project to ‘Develop a Detailed Framework and Workplan to Operationalise the Sanitation Connection Action Plan for Mtendere. 81
NWASCO (2016) Urban and Peri-Urban Water Supply and Sanitation Sector Report 2015

Chirundu WSS Feasibility Report Page 168 of 209
it performed worse than the previous period, but it could also mean that it was outperformed82
” (it could also
have been impacted upon by adverse conditions out of its control).
Additional factors, outside the direct control of the LWSC include constraints such as electricity rationing and
associated extended periods of low voltage as well as reduced water resources levels in a number of areas in
the Province (e.g. the drying up of the Chongwe dam). The Regulator estimated that the LWSC “lost 10% of
their production owing to load shedding and low voltage which resulted in reduction of hours and subsequently,
revenue”.83
These factors have had a serious deleterious impact on LWSC delivery against the agreed targets
set by the Regulator.
At the same time, the World Bank84
states that “LWSC has good engineering, O and M and supporting service
capability”. As is common with a number of the water companies in Zambia, they have been on an upward
trajectory in the last decade with improvements in areas such as the number of water connections, water
quality, operation and maintenance expenditure and cost recovery.
Key challenges nevertheless remain in aspects such as high levels of non-revenue water, reliability of the
service and low levels of sewer connections. Their financial viability has also improved over the years to the
point where they can now effectively break even. They are not yet what one would call a “bankable
organisation” but should achieve this status in the short term if they can continue on their current positive
trajectory.
Based on discussions with stakeholders as well as the review provided by the Regulator, it may be concluded
that the Company demonstrates solid management functioning.
Decentralised Service Delivery
Due to the size and nature of its operations, the LWSC structure is a combination of decentralised day-to-day
delivery with aspects such as commercial services and engineering functions devolved to dedicated
management units.
The following graphic provides an overview of this decentralised operational delivery structure85
.
82 Ibid
83 Ibid
84 World Bank Urban Development and Services Unit (2013) Water Sector Performance Improvement Project
Implementation Completion and Results Report 85
Derived from composite information obtained through a series of interviews with LWSC and other stakeholders undertaken for this assessment as well as for other studies such as the ‘LWSC Sustainability Agreement Baseline Indicators and Annual Technical Audit’ and the project to ‘Develop a Detailed Framework and Workplan to Operationalise the Sanitation Connection Action Plan for Mtendere

Chirundu WSS Feasibility Report Page 169 of 209
Figure 35 Overview of Decentralised Operational Delivery Structure
Based on service requirements, separate commercial as well as engineering capacity has been put in place
within the Kafue District itself and run from the Kafue Branch Office. Kafue has, since 2013, been tasked with
the management of the Chilanga boreholes distribution system. In addition, the Branch took over the Chirundu
Treatment Plant and distribution system in 201486
. Services in respect of the other areas (Central, Chelstone,
Kabulonga, Kabwata and Lumumba) have a dedicated Commercial Services related human resources base.
The Kafue Branch is discussed later in this section. This has been done to provide greater clarity about the
capacity that exists at each level of the Company87
. The proposed developments at Chirundu, envisaged by
CRIDF, are expected to resort under the existing decentralised services to this area by the Kafue Branch.
The LWSC Engineering Services Division has allocated dedicated human resources to personnel specifically
tasked with water supply duties, within the majority of the Districts within the Province. The following Table
provides an overview of resource allocation per district, excluding the Kafue District but including water supply
personnel allocations for the Lusaka District (more detail is provided in Annex F5)..
While it has not been possible to confirm, it is assumed that the water supply personnel allocation for the
Chongwa District includes that for the recently proclaimed Rufunsa District which formerly formed part of
Chongwa88
. Unfortunately, no information has been provided as yet that allows a distinction to be made in
respect of the specific categories of employment, the professional / technical qualifications of personnel, their
86 World Bank Urban Development and Services Unit (2013) Water Sector Performance Improvement Project
Implementation Completion and Results Report 87
Ibid 88
UK Zambians (2012) Sata Creates Rufunsa and Sibuyunji Districts accessed at http://ukzambians.co.uk/home/2012/07/09/sata-creates-rufunsa-and-sibuyunji-districts/
LWSC
Head Office
Kafue Branch
Commercial Services
Engineering Services
Water Supply Sanitation Scientific Services
Engineering Services
Water Supply Lusaka Chongwe
Luangwa
Commercial Services Branch
Central Chelstone Kabwata Kabulonga Lumumba plus
Peri-Urban Centres

Chirundu WSS Feasibility Report Page 170 of 209
skills level and their age and gender distribution. It is also not known whether personnel are dispersed through
each of the districts, or function from a central district office.
Table 49 Human Resource Allocations per District
DISTRICT PERSONNEL NUMBERS89
Lusaka - Water Services (including Shikabet) 69
Chongwe - Water Services 9
Luangwa - Water Services 11
Human Resources Management Practices
Available information provides some insight into the full extent of the existing human resources management
function and systems of the LWSC. The following could be ascertained90
:
Specific steps are in place to strengthen the Company HR development function and there is an appointed
Human Resources Manager.
A number of Human Resource Policies are in place, including for mainstreaming Gender and HIV/AIDS. It is
believed that the following additional policies are in place although this has not, as yet, been finally confirmed:
Occupational, Health and Safety and Environment,
Performance Management,
Disciplinary Code and Grievance Handling
Recruitment and Selection, and
Training and Development.
It appears that workforce data and information are routinely collected and used for HR planning, including for
periodic staff projections. Key staffing information is said to be available and that reports are regularly prepared
and, apparently, shared with management;
Workplace safety has been taken on board, specifically in respect of the fact that a Safety, Health and the
Environment (SHE) Policy is in place. This is in place to protect staff and to ensure that the Company complies
89 Derived from composite information obtained through a series of interviews with LWSC and other stakeholders
undertaken for this assessment as well as for other studies such as the ‘LWSC Sustainability Agreement Baseline Indicators and Annual Technical Audit’ and the project to ‘Develop a Detailed Framework and Workplan to Operationalise the Sanitation Connection Action Plan for Mtendere 90
Derived from composite information obtained through a series of interviews with LWSC and other stakeholders undertaken for this assessment as well as for other studies such as the ‘LWSC Sustainability Agreement Baseline Indicators and Annual Technical Audit’ and the project to ‘Develop a Detailed Framework and Workplan to Operationalise the Sanitation Connection Action Plan for Mtendere’.

Chirundu WSS Feasibility Report Page 171 of 209
with workplace safety procedures and health regulations, including the issue of Personal Protective Equipment
(PPE) where necessary.
It appears that processes and procedures are in place that demonstrate an understanding of the need for
training to improve work related competencies, job specific proficiency and the associated optimal utilization of
personnel.
There appear to be policies, mechanisms, and practices in place or being put in place to ensure performance
management, including Disciplinary and Grievance Procedures, Workforce Retention Strategies as well as
processes for Succession Planning. Based on this, it is clear that there are job profiles, job descriptions and
associated standards and performance expectations in place, which are clearly communicated. This would
include a statement relating to the minimum academic and skill requirement for specific posts. It is understood
that mechanisms for undertaking staff performance reviews have been put in place; that competence appraisals
are undertaken; and that job specific competency development is enhanced through directed training. Where
required, alternative staffing methods such as sub-contracting, outsourcing and temporary hires is used.
Training Programmes
The LWSC has indicated that the training needs of staff, as measured against job requirements, are addressed.
As a result, training is structured to respond to specific gaps in work related competence, and based on the
needs of the Company.
While it has been reported that significant resources had been allocated to staff training, showing in the order of
a massive 350% increase in training provided in 2014 as compared to 2013, it is not possible to provide any
indication of the specific training that has been undertaken by the LWSC. From information available, it may be
concluded that such initiatives aimed at developing specific skills and competencies that will support work
related performance.
The 2014 Performance Overview states that “During the period under review, various training programmes were
conducted locally and abroad in various disciplines to build staff competencies and skills.91
” It further states
that:
Six members of staff attended training programmes ‘abroad/overseas’ although it is uncertain what this
training comprised of and where it was undertaken;
A total of 62 staff members pursued part-time courses (subject and type unknown); while
Five staff members were enrolled in full-time study courses, described as being approved in
accordance with the Company’s training objectives.”92
It is assumed, but has not been confirmed that the LWSC participated in the WAVE Plus programme (an
intervention of the German development cooperation partners) that serves as a regional multi-country learning
and networking forum (comprised of Kenya, Tanzania, Uganda and Zambia) and that offers ‘tailor made’
capacity development initiatives aimed at improving water services provider functions, appropriate to the
91 LWSC (2014) Company Performance Overview, January to December 2014
92 “Company Performance Overview, January to December 2014”, LWSC
Chirundu WSS Feasibility Report Page 172 of 209
specific water supply and sanitation needs and challenges of partner countries. The programme focuses on
activities that promote “Networking and exchange (that will) enable participants to identify, transfer and adapt
performance-related good practices either within a country or within the region and to implement them at their
workplaces.93
.
It is noted that the LWSC attended the GIZ funded capacity building workshop aimed at strengthening the
competence of utility gender focal persons to formulate gender policies as well as to ensure a coherent
approach to assessing gender mainstreaming against an agreed checklist of indicators.94
General Aspects of Employment95
LWSC staff are free to take up membership with the Trade Union as appropriate for employees in the 7 to 10
grade band. The Trade Union Representative acts in the interests of Union members in terms of
representation, conditions of service and issues related to discipline.
Employee contributions are paid to the National Pensions Scheme Authority and the Company has a Group Life
Assurance (GLA) Policy in place.
LWSC ensures the payment of Workman’s Compensation to the State Scheme for all employees in service, to
ensure employee compensation should they be injured on duty.
It is not known whether or not succession planning is in place and, if addressed, how this is addressed.
Staffing Numbers96
The LWSC has a total staff complement of 903 persons, which provides a staff to connection ratio of
6.86:1000.97
No gender disaggregated data has, as yet, been provided in respect of staff members at the Head Office as well
as across all Districts.
Currently no data is available that allows a breakdown to be provided in respect of the age, qualifications, level
of appointment or (generally) geographic location of each of the various staff members. Whilst it is known that
commercial services are provided in respect of the various districts, it is uncertain whether the Commercial
Services branches function from the LWSC Head Office in Lusaka or from offices located within each of the
districts.
The Table given as Annexure C provides an overview of personnel allocated to each of the various Divisions of
the LWSC. The data provided exclude the staffing numbers in respect of the Kafue Branch Office as well as in
93 http://www.wave-water.net
94 NWASCO (2016) Urban and Peri-Urban Water Supply and Sanitation Sector Report 2015
95 Derived from composite information obtained through a series of interviews with LWSC and other stakeholders
undertaken for this assessment as well as for other studies such as the ‘LWSC Sustainability Agreement Baseline Indicators and Annual Technical Audit’ and the project to ‘Develop a Detailed Framework and Workplan to Operationalise the Sanitation Connection Action Plan for Mtendere. 96
Ibid 97
NWASCO (2015) Urban and Peri-urban Water Supply and Sanitation Sector Report

Chirundu WSS Feasibility Report Page 173 of 209
respect of the Water Supply Services personnel in respect of each of the districts (including the Lusaka
District98
).
A total of 203 staff members are allocated to decentralised services delivery, bringing the total number of LWSC
personnel to 911 persons99
.
Staff Turnover
It is not possible to comment on staff turnover, due to the fact that no data in this regard have been made
available to date.
Organisational Structure100
The Company demonstrates a clear division of operational functions across different posts. Kafue, which
accounts for the second largest water consumption after the Lusaka District itself, runs a separate branch office.
It has been stated that there has been a well thought through and structured translation of the Organisational
Strategy into the Company’s institutional management procedures and processes as well as its organisational
structures and outputs.
Currently the Company is organised into four Functional Divisions that fall under the Managing Director. These
are:
Financial Services, with its own Director, providing direct oversight in respect of the Financial Accounting,
Management Accounting and Project Accounting functional management areas;
Commercial Services, with its own manager, providing direct oversight in respect of the Branches, the Peri-
urban areas as well as the Marketing and Public Relations functional management areas. The Division deals
with customer relations, marketing, credit control and billing. In addition, it takes responsibility for water supply
technical operations (from the bulk service reservoirs to the customer connections) as well as that for sewerage
(connection points through to the wastewater treatment plants); Technical operations are divided into five semi‐
autonomous branches (Central, Chelstone Kabulonga, Kabwata and Lumumba), each headed by a Branch
Manager as well as in respect of four peri-urban areas (Centre, East, South and West) staffed by Development
Officers, Plumbers and Customer Services / Billing staff.
98 Derived from composite information obtained through a series of interviews with LWSC and other stakeholders
undertaken for this assessment as well as for other studies such as the ‘LWSC Sustainability Agreement Baseline Indicators and Annual Technical Audit’ and the project to ‘Develop a Detailed Framework and Workplan to Operationalise the Sanitation Connection Action Plan for Mtendere’. 99
LWSC (2014) Company Performance Overview, January to December 2014 100
Derived from composite information obtained through a series of interviews with LWSC and other stakeholders undertaken for this assessment as well as for other studies such as the ‘LWSC Sustainability Agreement Baseline Indicators and Annual Technical Audit’ and the project to ‘Develop a Detailed Framework and Workplan to Operationalise the Sanitation Connection Action Plan for Mtendere’.

Chirundu WSS Feasibility Report Page 174 of 209
Engineering Services, with its own Director, providing direct oversight in respect of the (i) Sewerage and
Sanitation, (ii) Technical Services, (iii) Maintenance, (iv) Asset Management, (v) Scientific Services – Water, (vi)
Scientific Services – Wastewater, (vii) Water Supply (Lusaka, Chongwe and Lusangwa), (viii) the Project
Implementation Unit, and (ix) the Kafue Office management focus areas; The Division is tasked with the
functions of asset management, maintenance and technical services, water quality monitoring, and geographic
information system (GIS). Apart from the bulk water operations functions in respect of Kafue, which is the
responsibility of the Kafue office, this Division is responsible for bulk water supply (under the Water Supply
Manager) from the Lusaka distribution node and boreholes to the various reservoirs in and around Lusaka as
well as the Water Treatment Plants in Chongwe and Luangwa Districts. The Division is also responsible for
ensuring bulk wastewater treatment operations and maintenance within Lusaka City and across all four Districts,
under the Sewerage and Sanitation Services Manager.
Human resources, with its own Director, providing direct oversight in respect of the (i) HR operations, (ii)
Strategy and Staff development, (iii) Training, (iv) Health and Safety, and (v) Security Services related
management focus areas;
Separate Management Functional areas are in place in respect of (i) the Company Secretary/ Legal Functions,
(ii) Audit Services, (iii) Corporate Planning, (iv) Purchasing and Supplies, (v) Quality Management, and (vi) Non-
Revenue Water, each with its own manager. These functional management areas fall directly under the aegis
of the Managing Director.
The Organogram101
, set out on Figure 36 does not make specific reference to the detailed Organisational
Structures for all posts resorting under each of the Divisions. As such, the structure does not reflect all positions
in the organisation nor does it reflect the lower structures thereof.
101 Derived from composite information obtained through a series of interviews with LWSC and other stakeholders
undertaken for this assessment as well as for other studies such as the ‘LWSC Sustainability Agreement Baseline Indicators and Annual Technical Audit’ and the project to ‘Develop a Detailed Framework and Workplan to Operationalise the Sanitation Connection Action Plan for Mtendere’.

Chirundu WSS Feasibility Report Page 175 of 209
Figure 36 LWSC Organogram
Kafue District Branch - Organisational Structure and Functioning
The total population of the Kafue District is approximately 230,000 people.102
The Kafue Branch Office has
overall responsibility for managing the operations and maintenance of the system in the District, and for new
connections. It further undertakes functions related to commercial services (billing, customer services, etc.) and
human resource management for the District, overseen by the LWSC Head Office. While costs related to the
provision of services are expected to be covered by service payments, operational shortfalls are covered by the
LWSC.
102
Genderlinks (2013) Kafue Becomes Gender Centre of Excellence. Report accessed at http://genderlinks.org.za/programme-web-menu/kafue-coe-2012-05-18/

Chirundu WSS Feasibility Report Page 176 of 209
The District is said to have abundant water resources, which include an estimated 800,000 million m3
of
groundwater (with an estimated recharge rate of approximately 160,000 m3pa). It is also supplied by the Kafue
as well as the Zambezi rivers103
The branch office is situated in Kafue town, just over 90 km from the Chirundu border, accessed via route T2,
which serves as the main road link between Lusaka towards the north and Zimbabwe to the South-East via the
town of Chirundu104
. Services delivery to Chirundu has been undertaken by the Kafue Branch Office on behalf
of the LWSC since 2012.
The Kafue Branch is comprised of an organisational structure that addresses both the commercial and the
engineering aspects of delivery. The Kafue Commercial Branch resorts under the aegis of the Commercial
Services Division of LWSC, whilst the Engineering Services (comprised of Water Supply, Sanitation and
Scientific Services) resort under the LWSC Engineering Division.
Table 50 provides an overview of the staff complement of the Kafue Branch:
Table 50 Kafue Branch Staff Complement
BRANCH DIVISION STAFF NUMBERS
Commercial Services105
21
Water Supply 46
Sanitation & Scientific Services 69
TOTAL (excluding commercial services) 115
The following Organogram (Figure 37) serves to provide an overview of the manner in which the Kafue Branch
Office has been structured, and includes staff allocations in respect of Chirundu.
103 Swedish International Centre for Local Democracy (2014) Local Government Partnership Profile – Kafue District
accessed at http://www.icld.se/pdf/Kaufe_district_Council_profile.pdf 104
http://distancecalculator.globefeed.com/Zambia 105
Assumed to be situated in Lusaka and forming part of the LWSC personnel allocation to Commercial Services in the Western Zone (estimated to be in the order of 33% of the current 64 persons employed under this category

Chirundu WSS Feasibility Report Page 177 of 209
Figure 37 Kafue Branch Organogram
Chirundu
Although there appears to be some uncertainty as to the exact size of the Chirundu District population, it is
close to 60,000 people,106
residing in a geographic area of 6,693 km2107
. More than 65% of the population
resides in rural areas (engaged in commercial and subsistence agriculture), with an approximate 18,383 people
residing within the urban areas of Chirundu108
. Although current statistics are not directly available, it was
reported that some 500 people were directly employed in the commercial agriculture sector, with at least an
additional 2,000 agricultural workers being drawn into the sector on a seasonal basis109
.
Whereas much of the area around Chirundu town in Zimbabwe is set aside for wildlife, the rural areas
surrounding Chirundu, Zambia, are used for commercial and subsistence agriculture. The farms outside
Chirundu are large, employing more than 400 permanent workers and 2,000 seasonal workers.
Chirundu was declared a separate district during 2012 and realigned from the Southern Province to the Central
Province. Prior to this its administrative centre had been located in Siavonga from where all government related
activities were handled. Subsequent to the 2012 realignment, all government services (apart from those offered
by the Department of National Registration, Passport and Citizenship) had been moved to Chirundu110
.
Chirundu border has a number of townships and residential areas, which include Appolo, Border, Chibaketi, the
Mission and Zesco compounds, Mazyongololo, and the ‘High cost’ and government complexes. There appear
106 CRIDF (2016) Chirundu Water Supply and Sanitation Project - Outline Business Case
107 http://www.statoids.com/yzm.html
108 CRIDF (2016) Chirundu Water Supply and Sanitation Project - Outline Business Case
109 Family Health International (FHI) (2013) Corridors of Hope in Southern Africa: HIV Prevention Needs and Opportunities in
Four Border Towns 110
Zambia Daily Mail (20 October 2015) Chirundu: Border town on the move accessed at https://www.daily-mail.co.zm/?p=48347
BRANCH MANAGER
ENGINEERING
WATER SUPPLY
SANITATION
SCIENTIFIC SERVICES
COMMERCIAL SERVICES

Chirundu WSS Feasibility Report Page 178 of 209
to be a fairly ‘well-established’ informal settlements (Gabon and ChiBhaghedi) as well as informal houses dotted
throughout the formal settlement111
.
Currently the Mtendere Catholic Mission Hospital, located in Chirundu town, is said to provide significant health
facilities to patients from as far away as Kafue Town as well as from Zimbabwe. There are two smaller clinics in
place and an additional government health centre is currently being constructed in Chirundu which will require
access to water and sanitation related services.112
Additional rural health centres are in place in the Chirundu
District at Lusitu, Chipepo, Jamba, Chikanzaya and Ibbwe Munyama.113
Increasingly, access to Chirundu town is being facilitated through the development of infrastructure, including an
11-kilometre radius township road network as well as feeder roads, aimed at improving transportation in the
area. In addition, a connecting 160-meter bridge has been put in place over the Kafue River, to allow greater
access to services within Chirundu to the Chiawa rural population, who were previously obliged to use the Kafue
River pontoon system114
.
Significant numbers of transient sex workers visit Chirundu at peak periods, particularly at month's end, when
the border is deemed to be at its busiest and is reported to have increased as traffic load has increased. In
addition, informal traders congregate at three designated market areas. Cross-border trading takes place on a
regular basis115
.
The CRIDF OBC notes that approximately 2,440 people pass through the border post via light and heavy trucks,
passenger busses as well as private vehicles per day116
. According to a Study undertaken by the Zambian
Government in collaboration with the World Trade Organisation, Chirundu handles an average of 270 trucks on
a ‘typical’ day and that “the town has become the busiest port in Zambia and one of the most utilised inland
border points in the eastern and southern Africa region”117
.
Water supply and sanitation services are a shared responsibility between the Chirundu District Council
(mandated to ensure delivery in the rural areas of Chirundu) and the LWSC (mandated to provide services for
urban areas). At the same time, it is noted that the LWSC delivery mandate is “limited to a relatively small
population catchment area within the urban centre of Chirundu town. This mandate was established when
LWSC took over operations during the creation of the new district, and has since not been expanded even as
the size of Chirundu town has increased through urbanization and population growth.”118
111 Family Health International (FHI) (2013) Corridors of Hope in Southern Africa: HIV Prevention Needs and Opportunities in
Four Border Towns 112
Zambia Daily Mail (20 October 2015) Chirundu: Border town on the move accessed at https://www.daily-mail.co.zm/?p=48347 113
Ibid 114
Ibid 115
Family Health International (FHI) (2013) Corridors of Hope in Southern Africa: HIV Prevention Needs and Opportunities in Four Border Towns 116
CRIDF (2016) Chirundu Water Supply and Sanitation Project - Outline Business Case 117
Zambia Ministry of Trade and Commerce and the World Trade Organisation (2011) The One-Stop Border Post Concept – A Case of Chirundu Border Post Between Zambia and Zimbabwe 118
CRIDF (2016) Chirundu Water Supply and Sanitation Project - Outline Business Case
Chirundu WSS Feasibility Report Page 179 of 209
Asset Management
Infrastructure Capacity and Coverage
One of the biggest challenges facing LWSC is a severe lack of capacity in relation to demand. This is most
profound in Lusaka but also applies in the smaller towns such as Chilanga. Chongwe and Chirundu. The
situation is not quite as critical at Kafue. In 2014 LWSC supplied on average 235 Ml/day, whereas the estimated
demand was 411 Ml/day119
. This means that the potential for additional customers and sales is huge however it
also means that the capital expenditure needed to address the shortfall is massive. LWSC have projected a
capital expenditure of Kwacha 4,3 Billion over the next 5 years. The bulk of this is earmarked for expansion of
capacity.
Historically Lusaka made excellent use of the superb underground aquifer present in the dolomitic limestone
beneath the City. Almost 200 Ml/day is drawn from this aquifer, which is quite remarkable for a groundwater
source. This resource however reached its capacity some years ago and any additional draw on it is likely to
lead to its premature decline. The second major source is from the Kafue River. This water is treated at the
Iolanda Works located at the Kafue River. An upgrade of 50 Ml/day is currently being implemented, funded by
the Government of Zambia120
. This also requires a major upgrade of the pumping capacity. A further upgrade of
the Iolanda Works to 600 Ml/day is being discussed with JICA and the African Development Bank. This will cope
with demand at Lusaka for the foreseeable future. It is planned to start implementation of this well before
2020121
.
Accurate figures are not currently available however it is estimated that the existing Chirundu scheme supplies
an area containing approximately 4700 people. The Chirundu urban area as a whole is estimated to contain
over 17 000 people, so the potential additional demand is very significant, not to mention the wider rural and
peri-urban areas. LWSC estimate the current shortfall to be about 7 ML/day but it is not clear exactly what
catchment they have used to assess this.
There are currently two separate systems that are not interconnected. Both of these have their own river intakes
and treatment works. The current scheme is plagued by interruptions due to significant problems with the
current configuration and design. These problems are numerous however perhaps the most significant are lack
of adequate storage, inadequate process control at the treatment works and inadequate river intake systems.
Lack of storage means that there is no “buffer” to cope with operational problems of any nature and provides a
situation where there is very little margin for error for the operators, inevitably more supply interruptions and
hence inferior customer service (apparently even some of the existing storage is not connected for some
reason). Neither of the river intake systems is adequate at present. Both function reasonably adequately in
normal flow conditions but struggle when higher flows occur. The design of the two intakes varies somewhat but
both are impacted by surface debris that is carried down by the river at higher flow levels. This results in extra
119 “Company Performance Review: January to December 2014”, LWSC
120 Ibid
121 Ibid

Chirundu WSS Feasibility Report Page 180 of 209
load on the intake arrangements and often damage and malfunctioning. This again results in service
interruptions.
Operations and Asset Management
LWSC are conscious of the need for improved asset management and most certainly improved management of
NRW (see 5.5.3 below). In their most recent Strategic Plan, LWSC have identified the need to “implement asset
management policy”122
and have listed the following supporting strategies/plans:
Develop and implement maintenance management policy
Implement asset renewal policy
Implement asset disposal policy
Carry out condition monitoring
As always, a key building block for holistic asset management is the asset register. At this point it is not clear
how far LWSC have progressed with this. It can be an extremely time consuming and lengthy exercise where
there is a significant backlog in records as there are few short cuts when it comes to collecting missing
information.
A highly effective GIS is also fundamental for effective asset management. It is understood that this is in place
however its status is not known.
The importance of rehabilitation is a recurring theme in the strategic plan and a highly significant component in
the capital expenditure plan. This highlights the neglect and lack of maintenance that occurred prior to the last
ten years, which has resulted in significant backlogs in this area.
If anything, the condition of the sewer system in Lusaka is even more parlous with many years of neglect
necessitating massive expenditure on rehabilitation. The sewerage works feature prominently in this. Historically
NWASCO did not actively regulate these as this was the remit of ZEMA. However the latter was under sourced.
Recently there are signs that these two regulatory bodies will work more closely together to address this
problem. The state of the sewerage works and upgrades to elements of the sewerage system are focus areas of
the MCC Compact Agreement. There is also currently work underway on the planning for a major upgrade of
the Lusaka sewerage system as a whole.
Substantial investment was made in a water borne sewerage system in Chirundu by SWSC but for some reason
this was never commissioned. Apparently as built information regarding this is not available. LWSC staff at
Chirundu believe that this infrastructure is still in good condition but this will only be able to be determined once
suitable testing of it has been carried out.
From an operational perspective, Chirundu falls under the Kafue region, with its offices located in Kafue. This
office is also responsible for Chilanga, Chongwe, Luangwa, Kafue Town and the Iolanda Works. The latter is by
far the biggest and strategic element of infrastructure in this region. LWSC have acknowledged that the current
122 “Strategic Plan: 2014-2018”, LWSC

Chirundu WSS Feasibility Report Page 181 of 209
operational regime at Chirundu is inadequate. This comment applies to the levels and qualifications of staff,
water quality monitoring, reliability of supply and other aspects123
. The implication is that these issues will be
addressed when the scheme is upgraded. From a practical perspective, Chirundu is located in quite an isolated
location some distance from Kafue, which adds to the logistical challenges. This would also tend to imply that a
degree of autonomy will be necessary at Chirundu if the scheme is to be run effectively.
Non-Revenue Water
Non-revenue water is an endemic problem in Zambia with none of the commercial utilities achieving a figure
better than 32% and most, much higher. As a result, it is one of the key indicators monitored by NWASCO. In
spite of this, progress in the last 5 years has been slow and the current drought has highlighted the importance
of addressing NRW more effectively. The problem has now reached the stage whereby GOZ have set up a task
force designed to specifically target NRW. The results of this are not yet known to the author.
LWSC are experiencing severe problems with NRW throughout the systems that they manage. Their overall
NRW figure for 2015 was 47%, which is widely considered to be an unacceptable level. Due to the configuration
of their raw water supply systems, LWSC have to pump virtually all of the water that they supply so they also
have a strong motivation to reduce NRW. There are of course wider additional benefits such as reduced
chemical costs and deferment of capital works. Addressing NRW is one of the eight corporate objectives in the
LWSC Strategic Plan viz. “To Reduce Non-Revenue Water from 42% to 25% by 2018”. While this degree of
emphasis is laudable, the objective is far too optimistic in the view of this author. Meaningful reduction of NRW
is generally only achieved after a sustained effort maintained over 5 years or more involving multiple techniques
and strategies. It is known that LWSC have appointed a dedicated resource to oversee NRW but other details of
the work undertaken is not known at this stage.
Apparently LWSC are not currently able to carry out a reliable water balance exercise at Chirundu. In view of
the fact that every drop of water supplied at Chirundu has to be pumped, this provides a potent motivation to
reduce it to low levels. It is also not clear at this stage to what extent LWSC have a system of district meters so
that they can define zones and problem areas can be isolated and problems diagnosed and addressed more
rapidly. With the current low levels of staffing and poor condition of infrastructure, it is unlikely that meaningful
reductions in NRW will be made without a significant capital injection, as is contemplated by the CRIDF
programme.
Service quality
A summary of the overall performance of LWSC in comparison to the other utilities in Zambia is shown the
'Sector Performance (2015)' table in Annex F1. This demonstrates that LWSC have performed well in the areas
of water quality, water coverage and collection efficiency, while hours of supply at 17 and sanitation coverage at
74% are considered to be adequate.
123 Mr Mwanza, Operations Manager, Kafue, personal communication

Chirundu WSS Feasibility Report Page 182 of 209
Areas where LWSC did not perform as well included non-revenue water at 47%, metering ratio at 72% and O
and M cost coverage at 88%. They also had challenges in the areas of handling complaints from clients,
interruption of water supply, sewer blockages, sewer flooding and the quality of sewage discharge.
The latest tariff determination carried out on LWSC by NWASCO in 2015 was not the comprehensive
assessment carried out for a three year period but the so called “no objection” assessment. This resulted in an
approved tariff increase of 30%. The conditions attached to this (Service Level Guarantee) included installation
of an additional 15 000 meters and 5 000 new connections in Lusaka.
Conclusions
Interestingly, Technical Assessment for Chirundu has as many recommendations that speak to town planning
issues as those covering technical water and sanitation elements. This is indicative of the fact that Chirundu is
not only a “work in progress” but also a newly recognised urban area. Examples of this include the following:
“The proposed water supply network will promote properly structured growth of the centre by creating a
strong incentive to develop housing in existing vacant lots that are in proximity to water supply services
Authorities should encourage the development of housing in existing infill areas that are covered by the
network through densification, with spatial expansion of the housing areas only occurring after all vacant
lots have been filled.
The Zambian Government Authority responsible for urban and regional planning for the areas should
urgently develop a combination master plan for the new housing if this has not already been carried out.
This will streamline the provision of water supply and sanitation services to cater for the growth.”
These comments speak to the great potential the town has for further development and acknowledges the high
growth of the town in recent years. It also highlights the catalytic potential of the proposed project to upgrade
water and sanitation in the town.
From an institutional perspective, there is moderate to low risk with respect to this project. Partly this is because
the size is relatively small and partly because LWSC, though it has its challenges, has demonstrated significant
institutional capacity over the years. There are admittedly concerns regarding the ongoing financial viability of
the utility and the draft financials for 2014 are disappointing in this regard. It is hoped that this is an anomaly,
rather than a negative trend. In general however LWSC has demonstrated a trend over a number of years of
gradually gaining institutional and financial strength. In view of the concerns, some consideration should
perhaps be given to initiatives that further strengthen LWSC’s viability, in addition to delivering a high quality
and sustainable project at Chirundu.
There is also some potential to foster initiatives that can benefit the other utilities that are implementing border
projects i.e. EWSC and SWSC. Though there are differences in size, there do appear to be common challenges
in areas such as asset management, NRW, revenue management and process control. CRIDF could consider
an advocacy/facilitating role in this regard.
There is some risk that, with its remote location, and LWSC’s massive commitment to Lusaka, Chirundu could
become something of a nuisance to LWSC. The location of this project is nevertheless of a strategic nature with

Chirundu WSS Feasibility Report Page 183 of 209
potentially positive spin offs in terms of enhanced commerce, trade and tourism. This can only benefit the local
population and also, by extension, LWSC itself.
Recommendations
As part of the gearing up phase and before commencement of the formal project, these draft institutional
strengthening proposals should be workshopped with LWSC and thereafter refined. These recommendations
have also been formatted into a 'High Level Implementation Work plan', attached as Annex F2.
Institutional Arrangements
Refine and confirm the institutional model for Chirundu – its remoteness may necessitate more creative
options like outsourcing of some functions so as to manage operational costs.
Liaise with other key institutions so as to align planning and effective implementation of the project. This
is particularly crucial in this context in view of the early developmental stage of the urban planning for
Chirundu. There is a real opportunity here to influence development of the town in a positive manner.
Identify private operators for water kiosks and ablution blocks in conjunction with community structures
and put in place supply/service contracts.
Governance
It is assumed that both LWSC and NWASCO will continue to engage the Minister of MLGH regarding
the skills make-up of the new Board so as to ensure that the fiduciary responsibilities of the new Board
can be carried out effectively.
Identify appropriate training for board regarding fiduciary responsibilities and conduct these courses.
Strategic Management
Potentially use this new scheme to pilot new best practice approaches in areas like NRW, planned
maintenance, process control and outsourcing.
Investigate options of using local residents and entrepreneurs to perform outsourced functions, both to
contain costs but also to foster community relations.
In view of the strategic and international implications; consider giving the operation and maintenance of
this scheme some degree of higher priority.
Financial Management
Create a separate (ring fenced) profit centre for the Chirundu scheme (it is understood that this has
already been actioned by LWSC).
Provide guidelines to private operators regarding tariffs.
Implement a programme to replace old and defective meters.
Chirundu WSS Feasibility Report Page 184 of 209
Consider outsourcing to collect outstanding debt at Chirundu (this could also be a broader initiative
designed to enhance LWSC’s sustainability)
Organisational Design and Human Recourses
Review LWSC organogram to determine optimum arrangements to manage the upgraded scheme.
Implement changes as necessary.
Undertake training of staff that will be responsible for operation of the upgraded scheme.
Development of apprenticeship programme; possible broader initiative to be undertaken collaboratively
with EWSC and SWSC.
Asset and Operational Management
Put in place SOPs for the new scheme
Put in place system to carry out water balance on a monthly basis
Consider planning of systems so as to allow extensions to respond to the orderly expansion of Chirundu
in line with urban planning proposals.
Populate IAR with information on the new scheme (including all existing installations)
Develop planned maintenance schedule
Develop IAMP at Chirundu (potential broader initiative to strengthen LWSC)
Develop and Implement a Water Safety Plan
Service Quality
Ensure Chirundu is added to LWSC’s (water quality) compliance monitoring programme
Engage actively with local communities during planning and implementation process
Undertake public awareness campaigns
Design and undertake programme to promote safe sanitation, health, hygiene and water awareness in
Chirundu
Promote the use of private connections in Chirundu
Consider option of additional (commercial) ablution blocks for tourists
Consider use of mobile phone technology to enhance payment and customer experience

Chirundu WSS Feasibility Report Page 185 of 209
Risk Assessment
A high level risk analysis is outlined Table 51, reflecting possible technical, financial and operational risks that
might impact on the project’s viability or implementation.
Table 51 Identified project risks and mitigation measures
Risk Level Mitigation Level
A lack of understanding of the
requirements of the project
The level of data currently available is not
commensurate with the capital project cost.
Medium The assumptions and limitations of the data has
been stated in the Feasibility Study
Focus future actions and technical assistance on
obtaining validated information and
understanding of the system.
Involvement and consulting of all key
stakeholders at all stages of the project
formulation process.
Recognition of the roles and responsibilities of
each stakeholder in the process
Varying the scope and or project
objectives
This can impact on the project cost and
viability
Medium The objectives, scope and expected outputs and
outcomes have been stated within the Feasibility
Study.
Feedback to the stakeholders some of whom
communicate the same to the beneficiaries.
Involvement and consulting of all key
stakeholders at all stages of the project
formulation process.
Capital Costs
An excessive capital investment that is not
appropriate to Chirundu and the resultant
inability to fund the investment.
High The phased approach to the project aims to
ensure that capital investments are fully demand
driven by the growth and expansion of the town.
Domestic Demand
Population may not grow as predicted.
This will impact revenues generated by the
project and thus its operational
Medium Ensure adequate collaboration with the District
Council before project implementation. Stress the
importance of town planning in collaboration
meetings.

Chirundu WSS Feasibility Report Page 186 of 209
Risk Level Mitigation Level
sustainability. O&M costs will then be
serviced by small number of persons which
will challenge the affordability or cost
recovery of the intervention. Additionally, if
Chirundu’s development happens outside
of the proposed design, this will mean that
the target population will not be served by
the infrastructure. In turn this will result in
the socio-economic benefits and financial
revenues of the project not being realised.
Ensure detailed designs are based on realistic
projections of current and future water demand.
Domestic Tariff Rates
Affordability constraints pose the risk of the
average domestic tariff rate stretching the
financial ability of the poorer segments
population in particular. This could result in
either low uptake of the project
infrastructure and failure to realise all of its
associated socio-economic benefits; or
lower tariffs compromising the cost
recovery and operational sustainability of
the system.
Medium A more detailed analysis of affordability should
be conducted as part of project implementation
(particularly because new populations migrating
into Chirundu may have a lower/no monthly
income), however the affordability at the current
average domestic tariff is expected to be high (in
line with the high level affordability analysis
discussed earlier).
Ensure that detailed designs incorporate
adequate service level options to correspond with
the varying ability and willingness to pay for
services. These should be able to be upgraded/
improved over time as incomes and demand
increases.
Cost Recovery in General
Despite the positive annual cash flows
expected under the project infrastructure,
there is a risk to cost recovery if
inadequate management and financial
capacity means that potential revenues are
not realized (billed for and collected).
Medium The technical design (DNIs) of the project aims
to maximize the cost-recovery in the early stages
of the system implementation, and the
Institutional Strengthening component aims to
ensure there is adequate financial and
management capacity in SWSC to realize
service revenues.
Vandalism of the system Medium Facilitate establishment of community water
supply committee(s)
Promote community education, awareness
campaigns and promotion of social capital

Chirundu WSS Feasibility Report Page 187 of 209
Risk Level Mitigation Level
Sanitation facilities
Border patrons unwilling to pay for ablution
facility
Low Base tariffs charged in the ablution block on those
charged in the informal market for water supply
and sanitation as these represent observed
willingness to pay in this market.
Keep ablution facilities functional and clean so
that border patrons continue to value its services
Planning not in accordance with
assumptions made
This will not impact the bulk infrastructure,
but could result in incorrect sizing of
distribution infrastructure.
Medium Provide assistance with planning of the town
Obtain buy-in from stakeholders regarding the
identified plan.
Undertake the project in phases, to optimize
capital and match short term planning.
Operation and Maintenance Low LWSC currently operates much larger schemes
successfully
A risk is potentially ring fencing income from
Chirundu, for Chirundu.
Buy-in from Government
CRIDF has engaged the Ministry of Local
Government and Housing from the onset
and has had high level meetings
Low Full support from Government
Political interference is however a potential risk
Availability of Grant Funding
The Chirundu project will require grant
funding to proceed.
Medium Engage with funders at the earliest opportunity
Align the project with possible / available funding.

Chirundu WSS Feasibility Report Page 188 of 209
Conclusions and Recommendations
Chirundu is an important international border for the north south corridor linking a large number of countries in
eastern and southern Africa. The transport corridor linking South Africa to its northern countries is the busiest
regional transit transport link in eastern and southern Africa, carrying 5.8 million tons of cross-border traffic. The
corridor extends over the territories of three regional and economic groups, COMESA, SADC and SACU.
The high volume of traffic has brought commercial opportunities to Chirundu, while at the same time placing the
existing services under pressure. The pressure on services has increased the risk of waterborne diseases in
Chirundu and the possibility of cross border infection. This is exacerbated by the high HIV infection rate that is
experience in Chirundu, partially due to the high transient cross border population that spends time in Chirundu
while completing the cross border formalities.
Chirundu residents clearly expressed their dissatisfaction with the current water supply and sanitation services
as provided by the LWSC. Residents re-emphasised the need for adequate water supply and sanitation as they
felt the high temperatures and low rainfall in the area has already compromised their quality of life.
No clear town planning has been completed for Chirundu, which is complicated by the ongoing negotiations to
obtain a larger town boundary by obtaining a portion of surround customary land. It is critical that the planning
of the town be undertaken, with the input from LWSC with regard to most efficient method of servicing the entire
town.
The Feasibility Study has identified the capacity of the bulk infrastructure, including Water Treatment Plant, bulk
distribution and storage, as the main water supply constraints that need to be addressed. A phased approach is
recommended to optimise the available capital and match the population growth. The proposed implementation
phases is shown in Table 52, however the phases would need to be prioritised with available funding.
Furthermore the Medium and Long Term planning horizon needs to be implemented based on actual population
growth.
Table 52 Planned Implementation Phases
Phases Planning
Horizon (Year) Main areas of intervention Implementation plan
Phase 1 Short Term
(2021)
Upgrade intake pontoon
Upgrade of treatment plant to 2ML/d
Upgrade pumping system, pumps and
pumping mains
Upgrade bulk main pipelines
Introduce bulk meters
Increase storage to 2ML/day
Construct new and refurbish existing
ablution facilities
Design and construction
before 2021.

Chirundu WSS Feasibility Report Page 189 of 209
Phases Planning
Horizon (Year) Main areas of intervention Implementation plan
Phase 2 Medium Term
(2026)
Upgrade treatment plant to 6Ml/d (double
from 2ML/day)
Increase storage to 6ML/day (12hr)
Upgrade secondary distribution network
within DNI zones
Refurbish sewer system and connect high
water consumption users
Design and construction
before 2026 – to be
confirmed based on actual
population growth.
Phase 3 Long Term
(2036)
Expand secondary distribution network
with increase in population
Design and construction
before 2036 – to be
confirmed based on actual
population growth.
The estimated capital investment is shown in Table 53. The phases (Short, Medium and Long) are linked to the
population growth, which should be used as the basis for future development, i.e. confirm the population growth
is in accordance with the Feasibility Study.
Table 53 Total Preliminary Implementation Costs - All Phases of Works
Total Capital investment 2016-2036
Item
No.
Item Description Amount
US$
Amount
GB£
1 Short Term (Phase 1) – Water Supply 2,335,000 1,604,500
2 Short Term (Phase 1) – Sanitation 75,000 51,500
3 Medium Term (Phase 2) – Water Supply 2,388,600 1,641,300
4 Medium Term (Phase 2) - Sewer and Sanitation 3,029,400 2,081,600
5 Long Term (Phase 3) – Water Supply
196,700 135,200
Total
8,024,700 5,514,100
The project brings a number of high resilience benefits to the project recipients especially in relation to
governance and livelihoods, gender and health. The review also identified a number of risks in relation to the
associated infrastructure and risk-mitigating actions which if implemented will improve the resilience of the
project itself to climate change risks.
The project is not expected to have significant environmental impact, as it is mainly within the urban area, which
is already severely degraded. The intake may require special attention, as it is based in a lush riverine
environment, close to a forest area. A detailed environmental assessment will be required, in accordance with
the Environmental Management Act. Furthermore a number of permits will possibly be required before any
construction project can be contemplated.

Chirundu WSS Feasibility Report Page 190 of 209
The project could actually be used to enhance certain environmental challenges, like improved sanitation in
Chirundu, i.e. making Chirundu an open defecation free zone.
There is an overwhelming economic justification for the project, as indicated by the quantitative results of the
economic appraisal in conjunction with the qualitative benefits arguments. In the short term the provision of
WASH infrastructure is fundamental to basic human needs; in the medium and longer term, WASH
infrastructure will be catalytic to economic development at a local (community) level, as well as for Zambia and
the SADC region. The project is expected to result in significant improvements to the health of Chirundu
residents, as well as border patrons, along with time savings and ecological improvements, all of which indicate
that the project should be implemented.
The project alone however is not commercially viable – the revenue generated by the project is not sufficient to
cover the investment cost over the project life. This is neither surprising nor uncommon for water and sanitation
projects of this scale, given that such projects are fundamentally providing a public good. Traditional financing is
therefore not appropriate to this project; long term developmental/concessional loans, grant or subsidised
funding are required to cover the capital investment.
The financial appraisal indicates that the project is operationally sustainable. Annual revenues generated
exceed the annual operation and maintenance requirements of the infrastructure over the project life. Domestic
demand, O&M costs, and water supply coverage are however critical to the operational sustainability of the
infrastructure. As such, should these parameters vary significantly over time; LWSC must adjust the phased
investments as appropriate.
From an institutional perspective, there is moderate to low risk with respect to this project. Partly this is because
the size is relatively small and partly because LWSC, though it has its challenges, has demonstrated significant
institutional capacity over the years. There are admittedly concerns regarding the ongoing financial viability of
the utility and the draft financials for 2014 are disappointing in this regard. It is hoped that this is an anomaly,
rather than a negative trend. In general however LWSC has demonstrated a trend over a number of years of
gradually gaining institutional and financial strength. In view of the concerns, some consideration should
perhaps be given to initiatives that further strengthen LWSC’s viability, in addition to delivering a high quality
and sustainable project at Chirundu.
It is therefore recommended that this project should proceed, either through CRIDF support by taking the project
to Financial Closure or for CRIDF to support the LWSC with obtaining grant funding for the project. It will be
greatly beneficial to undertake some technical assistance work with the Chirundu District Council and LWSC to
strengthen the institutional ability, review planning options and obtain verifiable data / information on the existing
water supply network. Technical assistance could also be of benefit to the Chirundu District Council to finalise
the town boundary, which will potentially increase the LWSC supply area dramatically.

Chirundu WSS Feasibility Report Page 191 of 209
Annex A - GESI Tables
Annex A1: GESI Analytical Checklist
Annex A2: GESI Action Plan
Annex A3: GESI Rating Operations Table

Chirundu WSS Feasibility Report Page 192 of 209
Annex B – Existing Infrastructure

Chirundu WSS Feasibility Report Page 193 of 209
Annex C – CCRA Tables and Explanation Notes
Annex C1: Benefits Matrix
Annex C2: CCRA Explanatory Notes
Chirundu WSS Feasibility Report Page 194 of 209
Annex D – CBA Assumptions
Annex D1: CBA Assumptions
Annex D2: CBA Tables

Chirundu WSS Feasibility Report Page 195 of 209
Annex E – Key Informant Interview (Meeting Notes/Record)
Institution Name Lusaka Water and Sewerage Company Ltd.
Date of call/meeting 28th January, 2016, Kafue
Key contact David Ngenda
District Manager
[email protected]; +260968440153
Others present at the
meeting
nil
Discussion detail
Current access to water supply in Chirundu is about 65%
Population is growing very rapidly and Lusaka Water and Sewerage Company (LWSC) is not able
to match growth rate
There is a desperate need to expand and upgrade the existing network to meet demand
LWSC does not provide sewerage services as infrastructure is incomplete e.g. the sewage ponds
may even need to be relocated from their current proposed site (construction works
incomplete)due to increased space requirements
Population relies on on-site sewage disposal i.e. septic tanks and pit latrines
No major disease outbreaks arising out of erratic water supply have been experienced by LWSC
No topographical survey has yet been undertaken for the area
Subject Key points arising
Siavonga
District
Need for upgrading of infrastructure to meet current and future population
levels
Need for detailed topographical survey to ascertain the sewerage network
layout
Major risk of disease outbreak due to inadequate access to water and
acceptable sanitation services

Chirundu WSS Feasibility Report Page 196 of 209
Actionable Steps
To seek further information on challenges in the Chirundu service area from the Area Foreman
based in Chirundu
Topographical survey
Hydrological survey for raw water source
Institution Name Lusaka Water and Sewerage Company Ltd.
Date of call/meeting 29th January, 2016, Chirundu
Key contact William Kapya
District Foreman
[email protected]; +260977969015
Others present at the
meeting
nil
Discussion detail
Current access to water supply in Chirundu is about 65%
No of households (HH) approximately 2500 (2013 estimate) at an average 6 persons per
households
928 connections including commercial
Most HH source their water from kiosks
There is a high demand for individual connections but this inhibited by poor network
Groundwater is very saline and unpalatable hence raw water from the Zambezi is preferred
There are 3 unused sewage pumping stations and 4 oxidation ponds that are unused as the works
are not completed to date
There are 2 water treatment plants located 5Kms apart treating 1600m3 of water per day
There are 2 reservoirs of 50m3 each for storage of water
The 2 reservoirs are highly inadequate to meet demand hence the system operates such that the
water is directly pumped into the network from the treatment process

Chirundu WSS Feasibility Report Page 197 of 209
Pipe network needs urgent upgrade as it is inadequate to meet demand
Chirundu District Council needs to prepare a master development plan that will indicate the routes
that the water distribution lines will take in relation to the locations of the storm water network, road
network and plot boundaries
Chirundu District Council has been allocated 600Ha of land for new developments in the north side
of the district
Chirundu District Council is currently legalising the unplanned settlements in the district
Subject Key points arising
Chirundu
District
Need for upgrading of infrastructure to meet current and future population
levels
Need for detailed development master plan from Chirundu District Council to
enable design process
Actionable Steps
To seek further information from Chirundu District Council on master plan
Topographical survey
Hydrological survey for raw water source
Institution Name Lusaka Water and Sewerage Company Ltd.
Date of call/meeting 11th February, 2016, Lusaka
Key contact George Ndongwe
Managing Director
[email protected]; +260977688879
Others present at the
meeting
nil
Discussion detail

Chirundu WSS Feasibility Report Page 198 of 209
Welcomes CRIDF’s initiatives to undertake feasibility study of Chirundu border town
Chirundu one of the most important entry points into Zambia, hence improved water and sanitation
levels are a necessary imperative
Current access to water supply in Chirundu is very low as infrastructure is old and inadequate to
meet current and future demand levels
Urgently require resources to upgrade infrastructure to meet current and future demand
LWSC does not have the resources internally to address the problems at Chirundu
Topographical survey required due to undulating terrain in Chirundu
Subject Key points arising
Chirundu
District
Need for upgrading of infrastructure to meet current and future population
levels
Need for detailed development master plan from Chirundu District Council to
enable design process
Actionable Steps
Topographical and hydrological survey required
Hydrological survey for raw water source
Estimated costs of network expansion required
Institution Name Lusaka Water and Sewerage Company Ltd.
Date of call/meeting 18th February, 2016, Chirundu
Key contact William Kapya – District Foreman
District Foreman
[email protected]; +260977969015
Others present at the
meeting
Kenny Sililo –Cashier

Chirundu WSS Feasibility Report Page 199 of 209
Michael Kambole- CRIDF Hydrologist
Mathew Chennils – CRIDF Socio-Economist
Litumelo Mate – CRIDF Sociologist
Ian Banda –CRIDF Activity Lead
Discussion detail
Kiosk collections have dropped of late as large no of customers are migrating to household
connections
Collections will only improve with new infrastructure
Water flow rates in the river Zambezi can be collected from the Zambezi River Authority
Water testing is undertaken at the plant twice a month and a team from the headquarters conducts
tests from time to time
LWSC service newly opened up areas under customary land.
The company has extended into peri urban areas served through kiosks
Number of connections determined by the number of applications.
Average household size is estimated at 6 members.
Revenue raised at present is not adequate enough to cover costs of maintenance
Cost of maintenance is supplemented by headquarters
Company records 75% water fee collection rate with a billing efficiency of 90%
The company has potential to collect enough funds to finance its maintenance but some of the
constraints include the following:
Production capacity – hours of supply are limited to about 19 hours due to low pumping capacity,
however a few areas are on 24 hours service
Tariffs are reviewed annually
There a total of 9 kiosks in peri urban areas
These are maintained by LWSC and managed through vendors
All the 9 vendors are women, it was a deliberate decision to have women because they are seen to
be users of water in the households.
All the kiosks are metered to enable the company to charge for the water supplied.
Each vendor receives 40% of the total water sales in a month.

Chirundu WSS Feasibility Report Page 200 of 209
The company is encouraging household connections too this was in response to people’s requests
for household connections.
However there is still a need for kiosks to serve households that are poor
Response to pay is unusually overwhelming particularly when the supply is reliable and constant.
CRIDF reminded the company of the need to consider the relevance of kiosks.
Due to the climatic conditions of the area, residents are in need of water at all times for domestic
use especially for personnel, hygiene. When the water supply is erratic residents seek other
alternatives such as:
Drawing water from the Zambezi River.
Buying from residents with private boreholes
The company reported that there is an existing sewerage system infrastructure whose pump
station is not in use.
There are plans to develop a sewerage department to revamp the operations given the district
status and new urban centre development plans.
In the meantime the centre is on onsite sanitation with the use of septic tanks, soak away for those
with water supply connections
Subject Key points arising
Siavonga
District
Need for upgrading of infrastructure to meet current and future population
levels
Need for detailed development master plan from Chirundu District Council to
enable design process
Actionable Steps
To seek further information from Chirundu District Council on master plan
Topographical survey
Hydrological survey for raw water source


Chirundu WSS Feasibility Report Page 202 of 209
Meeting 1
Institution
Visited
Ministry of Community Development Social Welfare – District Office
Date of
Meeting
18th February 2016
Name of
Person
Contacted:
Mr. Simuluwa– District Community Development Officer - +260 977662118
Issues /
Aspects Discussion
Follow up action
/ Information
General
overview of the
Department of
Community
Development
The department works with vulnerable and incapacitated households.
There are a number of programmes such as gender, food and security,
non - formal education and self-help. Due to decentralization they also
work with markets and other urban issues.
Women
Department
This department is responsible for forming and registering clubs, training
women in entrepreneurship, establish savings groups and empowering
them with grants and village banking that provide soft loans.
27 women’s clubs have been formed, and 22 of these in
Chirundu urban have formed a Women’s Area Association.
Self Help In some rural parts of the district, some self-help programmes have been
initiated e.g. construction of a community hall in Sikongo, establishment
of Village Water Sanitation and Health Education (VWASHE).
Non Formal
Education
Vocational skills training offered in vocational skills, blacksmith, and
instructors.
Food relief Vulnerable but viable households who can pay for goods at the
cooperative are issued with a pack of fertilizer of 2x50kg and 10kg
seeds. Whilst some are on food relief. These are reviewed after 2 years.
A vulnerability assessment is conducted prior to provision of
respective packs.

Chirundu WSS Feasibility Report Page 203 of 209
Issues /
Aspects Discussion
Follow up action
/ Information
Peer monitoring used to ensure payback
About 40% of Chirundu urban area population is food insecure
because the area is arid and is a valley with very high
temperatures.
Water and
sanitation
related
activities
In sanitation women have been trained in sanitation to ensure
that each household has a latrine and also every households
participates in the ‘Keep Chirundu Clean’
Women and men participate in the CLTS, which is mainly rural
area programme.
Employment Chirundu urban centre has no agricultural activities
Major income based activities include, clearing agents, public
service workers, drivers, women in trading in the market. Those
along the rivers are involved in gardening.
Institutions
available
Include mainly government departments such as Chirundu District
Council, Ministries of Home Affairs ( migrations), Works and Supply,
Education, Community Development and Social Welfare, Labour,
Agriculture, Lands, Natural Resources and Environmental Protection
Zambia Revenue Authority Health, Zambia Bureau of Standards, Office
of the President,
The district has an active DDCC under which all the above are
represented and
Proposals for
expansion of
the area
Possible triggers for population growth would include
Land availability for other activities other than agriculture. Land
still available and still under customary ownership hence
relatively cheap
Availability of international waters such as the Zambezi for some
hospitality industry activities, and agricultural activities along
perennial rivers such as Kafue and Lusitu rivers.
Opportunity for the hospitality industry to promote tourism
Presence of a national park

Chirundu WSS Feasibility Report Page 204 of 209
Issues /
Aspects Discussion
Follow up action
/ Information
Vulnerabilities Chirundu district as a whole has a number of child headed, female
headed, widows, widowers and the aged...
Concerns as
regards water
supply and
sanitation
Color of water is murky brown cause to worry.
Would it be possible to have an intake along the Kafue river??
Meeting 2
Institution
Visited
Chirundu District Council
Date of
Meeting
18th February 2016
Name of
Person
Contacted:
Mr. Chipapa Kumpupa – Director of Works
Mr. Richard Tembo – Health Inspector
Mr. Jacob Tembo – Socio economic Officer - +260 979891324
Mr. Fred Munongo – District Planning Officer – [email protected]
Issues /
Aspects Discussion
Follow up action
/ Information
General
overview of
Water Supply
Services
Local authority function have been devolved to LWSC and the main
challenges have been the following
Pipe network and pumping needs upgrading
Unused sewer system needs some attention
Considering the growth of the urban centre, there would be need
to expand and extend the current water supply system to the
new areas.
Other activities that the local authority is engaged in are

Chirundu WSS Feasibility Report Page 205 of 209
Issues /
Aspects Discussion
Follow up action
/ Information
Implementing the CTLS programme
Sourcing for funding to implement the RWSS national
programme, which involves drilling boreholes.
Water supply
coverage area
Chirundu urban centre covers both state and customary land and the
authorities are still negotiating for more land from the traditional
leadership.
Urban centre has an approximate population of 15,052
Cover portion of six wards.
Proposals for
expansion of
the area
Possible triggers for population growth would include
Land availability for other activities other than agriculture. Land
still available and still under customary ownership hence
relatively cheap.
Availability of international waters such as the Zambezi for some
hospitality industry activities, and agricultural activities along
perennial rivers such as Kafue and Lusitu rivers.
Opportunity for the hospitality industry to promote tourism e.g.
presence of a national park.
Health and
sanitation
The town experiences a number of diarrhea cases amongst the
under-fives especially in the rainy season.
There are no health sensitization programmes yet.
To obtain more
information
from the
Chirundu
mission hospital
and the District
medical Office
Gender and
pro poor
development
LWSC receives a subsidy from government to facilitate provision
of water to the poor.
Commercial Utilities do not have a deliberate policy to supply
free water.
The local authority is yet to develop a gender policy. However, it
is a requirement that a Water Point Committee consists of 30%
female membership.

Chirundu WSS Feasibility Report Page 206 of 209
Meeting 3
Institution
Visited
Area Women’s Association – Chirundu Urban Centre
Date of
Meeting
19th February 2016
Name of
Person
Contacted:
Issues /
Aspects Discussion
Follow up action
/ Information
General
overview of
Water Supply
Services
There is a serious water supply deficit.
In general water is available from 23.00hrs to 03.00hrs or
05.00hrs in the conventional housing areas, whilst in peri urban
areas it is available from either 23.00hrs or 01.00hrs to 05.00hrs.
As a result women stay up or wait till 01.00 am to draw water.
Consequently most households draw water from the Zambezi
River where there are high risks of being attacked by crocodiles.
(Cases have been reported)
Severe problems are also present in the markets and peri urban
areas.
Water Quality It was reported that at times water is turbid, with visible organic
matter and worms.
Some water points especially from private boreholes are saline
causing stomach/ gastric problems.
Sanitation
There are prevailing unhygienic conditions at the main market
where the toilets are closed and not operational. Most times the
toilets do not have running water.
Water and
sanitation
Women were more highly concerned with the WSS situation at the
market where they claimed is a source of food items

Chirundu WSS Feasibility Report Page 207 of 209
services at the
market
The market is used as a haven for sleeping by travelers and
farmers from different parts of the district.
Sanitation facilities are used by travelers, taxi drivers and other
passer byes
At most times the toilets are closed and people use unfinished
buildings or backyards of stores and bars.
Waste is disposed of indiscriminately.
Effects of poor
water supply
and sanitation
Disruptions disturb family life as the women are always
exhausted and overburdened.
Compromises hygiene in the household
Compromises hygiene at the markets where foodstuffs are sold.
Women are not able to engage in gardening activities, due to the
cost and lack of water
Proposed
solutions for
water supply
Need to pump more water from Zambezi River.
If boreholes are used, there is need to use technology for
removing iron, however boreholes are not advisable due to the
low yielding boreholes.
The current situation can be managed if there was a fixed
schedule so that women can plan their daily activities. This
would be unlike the current inconsistent schedule.
Proposed
solutions for
sanitation for
households
Households
Sewerage system would be the best
Septic tanks for those with household connections
And improved pit latrines for those without.
Proposed
solutions for
sanitation for
markets
Markets should be connected to the sewerage system and if
septic tanks are used should be emptied on time and kept clean.
Market toilets should be sub contracted to private operators e.g.
the women’s Association or the market cooperative.
Chirundu WSS Feasibility Report Page 208 of 209
Annex F – Institutional Tables
Annex F1: Sector Performance (2015)
Annex F2: High Level Implementation Work plan
Annex F3: Statement of Comprehensive Income (2015)
Annex F4: LWSC Balance Sheet (2014)
Annex F5: Overview of Personnel Allocation