Embed Size (px)
Citation preview
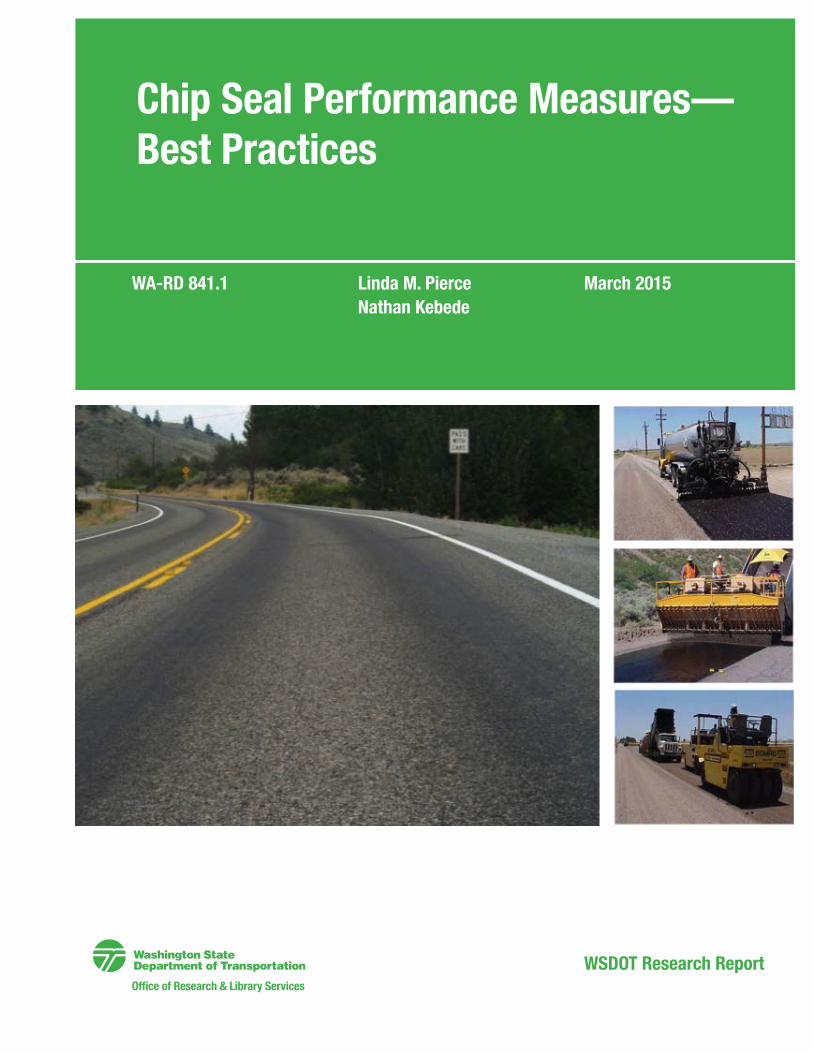
March 2015Linda M. Pierce Nathan Kebede
WA-RD 841.1
Office of Research & Library Services
WSDOT Research Report
Chip Seal Performance Measures—Best Practices
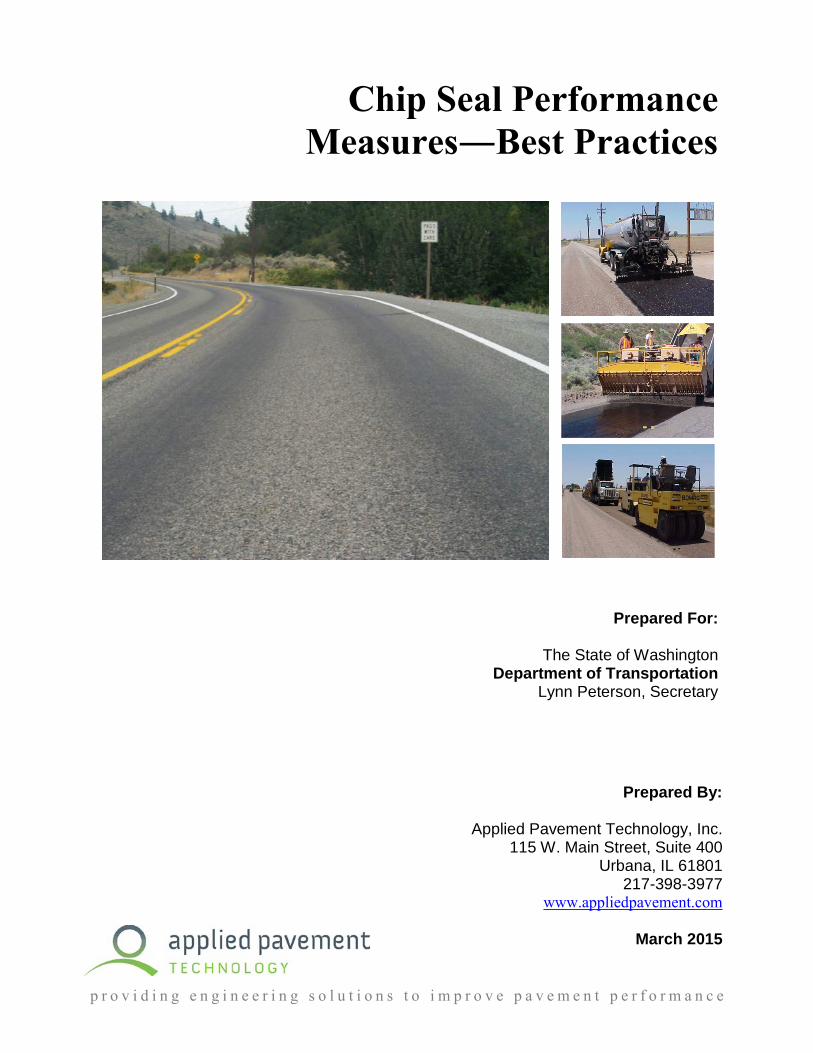
Chip Seal Performance Measures―Best Practices
Prepared For:
The State of Washington Department of Transportation
Lynn Peterson, Secretary
p r o v i d i n g e n g i n e e r i n g s o l u t i o n s t o i m p r o v e p a v e m e n t p e r f o r m a n c e
Prepared By:
Applied Pavement Technology, Inc. 115 W. Main Street, Suite 400
Urbana, IL 61801 217-398-3977
www.appliedpavement.com
March 2015
TECHNICAL REPORT STANDARD TITLE PAGE
1. Report No.
WA-RD 841.1
2. Government Accession No.
3. Recipient's Catalog No.
4. Title and Subtitle
Chip Seal Performance Measures – Best Practices
5. Report Date
March 2015
6. Performing Organization Code
7. Author(s)
Linda M. Pierce and Nathan Kebede
8. Performing Organization Report No.
9. Performing Organization Name and Address
Applied Pavement Technology, Inc. 115 W. Main St., Suite 400 Urbana, IL 61801
10. Work Unit No.
11. Contract or Grant No.
311145 12. Sponsoring Agency Name and Address
Washington State Department of Transportation PO Box 47372 Olympia, WA 98504-7372 Research Manager: Kim Willoughby 360.705.7978
13. Type of Report and Period Covered
Report March 2015
14. Sponsoring Agency Code
15. Supplementary Notes
16. Abstract
The Washington State Department of Transportation (WSDOT) has a long history of designing, constructing, and maintaining chip seal or bituminous surface treatment pavements. However, to date WSDOT has not developed pavement performance indicators or models to predict chip seal service life, but rather assumes an average life of 6 to 8 years. Due to funding constraints and good pavement management practices, WSDOT has increased the number of pavement segments that are candidates for receiving chip seal applications. In order to improve predictions of chip seal performance and improve their demonstrated cost effectiveness, chip seal performance indicators are needed. The objectives of this research project are to evaluate different performance indicators for chip seal treatments and to develop trigger values for these indicators that will indicate the end of service life and the appropriate index values for resurfacing. Under Phase I of this study, a formal literature review and detailed survey of transportation agency practices were conducted to identify which pavement distress or combination of distresses best characterize the optimal timing for chip seal application. This report summarizes the findings of the literature review, agency survey, WSDOT pavement management and performance modeling practices, and a recommendation of potential performance models for further evaluation as additional data become available.
17. Keywords
Chip seal, bituminous surface treatment, performance measure, prediction modeling, pavement management
18. Distribution Statement
No restrictions. This document is available to the public from the sponsoring agency.
19. Security Classification (of this report)
Unclassified
20. Security Classification (of this page)
Unclassified
21. No. of Pages
82
22. Price
N/A
DISCLAIMER The contents of this report reflect the views of the authors who are responsible for the facts and accuracy of the data presented herein. The contents do not necessarily reflect the official views or policies of the Washington State Department of Transportation or the Federal Highway Administration. This report does not constitute a standard, specification, or regulation.
ACKNOWLEDGEMENTS The authors would like to acknowledge and thank Jeff Uhlmeyer, Dave Luhr, and Tim Rydholm of the WSDOT Materials Laboratory for their assistance and providing the data needed to conduct this study, Kim Willoughby of the WSDOT Research Office for her direction throughout the research process, and the Washington State Department of Transportation for funding of this project.
Chip Seal Performance Measures Best Practices
Applied Pavement Technology, Inc. i
TABLE OF CONTENTS
Chapter 1. Introduction ........................................................................................................... 1
Study Objectives .................................................................................................................... 2 Study Approach ..................................................................................................................... 2 Report Organization ............................................................................................................... 2
Chapter 2. Literature Search .................................................................................................. 4
Introduction ............................................................................................................................ 4 Engineering-Based Performance Indicators .......................................................................... 5 Qualitative Performance Indicators ..................................................................................... 14 Summary .............................................................................................................................. 26
Chapter 3. Survey of Agency Chip Seal Practices ...............................................................28
Introduction .......................................................................................................................... 28 Chip Seal Use ....................................................................................................................... 28 Chip Seal Design and Material Selection ............................................................................ 30 Chip Seal Pretreatment Activities ........................................................................................ 31 Chip Seal Project Selection .................................................................................................. 33 Pavement Condition Assessment ......................................................................................... 37 Chip Seal Performance Life ................................................................................................. 39 Summary .............................................................................................................................. 40
Chapter 4. WSDOT Pavement Condition and Performance Modeling Techniques ...........42
Introduction .......................................................................................................................... 42 WSDOT Pavement Condition Data Collection ................................................................... 43 WSDOT Pavement Performance Prediction ........................................................................ 45
Chapter 5. Proposed Performance Measures ......................................................................47
Introduction .......................................................................................................................... 47 Evaluation of Chip Seal Performance Measures ................................................................. 47 Recommendations for Further Evaluation in Phase II ......................................................... 47
References ..............................................................................................................................48
Appendix A: Agency Survey Questions ...............................................................................51
Appendix B: Summary of Agency Survey Responses ........................................................57
Best Practices Chip Seal Performance Measures
ii Applied Pavement Technology, Inc.
LIST OF FIGURES
Figure 1. Examples of raveling and bleeding. ............................................................................ 1 Figure 2. Example of microtexture and macrotexture. ............................................................... 5 Figure 3. Locked-wheel friction trailer. ...................................................................................... 6 Figure 4. Sand circle test. .......................................................................................................... 10 Figure 5. Comparison of mean texture depth for emulsion and hot-applied
asphalt chip seals. ...................................................................................................... 11 Figure 6. Example of mean profile depth. ................................................................................ 12 Figure 7. Example of results using the Texas DOT 3D texture system. ................................... 12 Figure 8. Comparison of MPD from 3D scan and sand patch test. .......................................... 13 Figure 9. Comparison of MTD and MPD. ................................................................................ 13 Figure 10. Schematic of digital sand patch model. ..................................................................... 14 Figure 11. Illustration of treatment benefit. ................................................................................ 18 Figure 12. Survival curves for chip seal treatments. ................................................................... 22 Figure 13. Age failure curves for chip seal treatments. .............................................................. 24 Figure 14. ESAL failure curves for chip seal treatments. ........................................................... 25 Figure 15. Level of chip seal use. ............................................................................................... 28 Figure 16. Performance―chip seal over existing asphalt pavement. ......................................... 29 Figure 17. Performance life by functional class. ........................................................................ 40
LIST OF TABLES
Table 1. Chip seal performance. ................................................................................................ 8 Table 2. Performance indices and trigger values for surface treatment. ................................. 17 Table 3. PCR regression models for chip seal pavements. ...................................................... 20 Table 4. Survival probability results. ...................................................................................... 23 Table 5. Distress and IRI threshold values for end of service. ................................................ 23 Table 6. Probability of failure models. .................................................................................... 24 Table 7. Summary of chip seal performance prediction methods. .......................................... 27 Table 8. Typical number of chip seal courses―new construction. ......................................... 30 Table 9. Typical number of chip seal courses―preservation/rehabilitation. .......................... 31 Table 10. Pretreatment activities prior to chip seal application. ............................................... 31 Table 11. Chip seal project selection criteria. ........................................................................... 34 Table 12. Method for determining chip seal timing. ................................................................. 36 Table 13. Pavement condition practices. ................................................................................... 38 Table 14. Chip seal performance life―new construction. ........................................................ 39 Table 15. Chip seal performance life―over existing chip seal pavement. ............................... 39 Table 16. Chip seal performance life―over existing asphalt pavement. .................................. 40 Table 17. WSDOT asphalt-surfaced pavement core program distress types. ........................... 43 Table 18. WSDOT historical pavement condition data collection practice. ............................. 44 Table 19. WSDOT pavement condition thresholds. .................................................................. 46
Chip Seal Performance Measures Best Practices
Applied Pavement Technology, Inc. 1
CHAPTER 1. INTRODUCTION
The Washington State Department of Transportation (WSDOT) has a long history of
designing, constructing, and maintaining chip seal or bituminous surface treatment pavements.
However, to date WSDOT has not developed pavement performance indicators or models to
predict chip seal service life, but rather assumes an average life of 6 to 8 years. Currently,
WSDOT uses the same performance indicators for chip seal pavements that are used for asphalt
pavements. These distress indicators include rutting, roughness (based on the International
Roughness Index [IRI]), and cracking (as defined by the pavement structural condition [PSC]
indicator). However, chip seal pavements do not necessarily behave in the same manner as
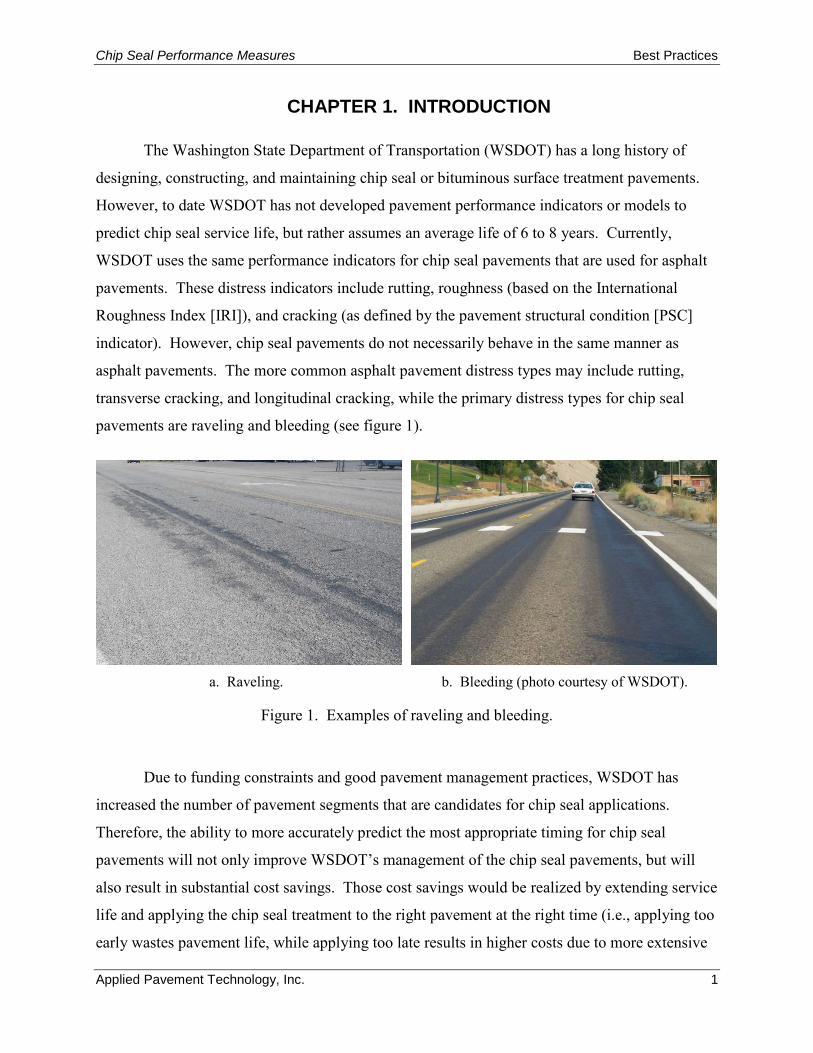
asphalt pavements. The more common asphalt pavement distress types may include rutting,
transverse cracking, and longitudinal cracking, while the primary distress types for chip seal
pavements are raveling and bleeding (see figure 1).
a. Raveling. b. Bleeding (photo courtesy of WSDOT).
Figure 1. Examples of raveling and bleeding.
Due to funding constraints and good pavement management practices, WSDOT has
increased the number of pavement segments that are candidates for chip seal applications.
Therefore, the ability to more accurately predict the most appropriate timing for chip seal
pavements will not only improve WSDOT’s management of the chip seal pavements, but will
also result in substantial cost savings. Those cost savings would be realized by extending service
life and applying the chip seal treatment to the right pavement at the right time (i.e., applying too
early wastes pavement life, while applying too late results in higher costs due to more extensive
Best Practices Chip Seal Performance Measures
2 Applied Pavement Technology, Inc.
pavement repair). For example, extending a chip seal’s pavement life by 1 year results in
approximately a 15 percent (or $1.6 million per year) reduction in annual chip seal costs
(WSDOT 2014). However, to improve the prediction of chip seal performance and therefore
better quantify cost effectiveness, performance prediction measures specific to chip seal
pavements are needed.
Study Objectives
The primary objectives of this research are to evaluate performance indicators for chip
seal pavements and to develop trigger values for these performance indicators that will indicate
the end of service life and the appropriate pavement condition indices values for resurfacing.
Study Approach
The scope of work for this project includes the following tasks:
• Task 1–Kick-off Meeting.
• Task 2–Conduct Literature Search.
• Task 3–Conduct Detailed Agency Interviews.
• Task 4–Evaluate Chip Seal Procedures.
• Task 5–Prepare Report Summarizing Best Practices.
• Task 6–Develop Phase II Plan.
• Task 7–Present Findings.
Report Organization
This report consists of five chapters (including this one) and two appendices, as
summarized below:
• Chapter 1. Introduction.
• Chapter 2. Literature Search.
• Chapter 3. Survey of Agency Chip Seal Practices.
• Chapter 4. WSDOT Pavement Condition and Performance Modeling Techniques.
• Chapter 5. WSDOT Chip Seal Design, Construction, and Project Selection Practices.
• Chapter 6. Proposed Performance Measures.
• Appendix A. Agency Survey Questions.
• Appendix B. Summary of Agency Survey Responses.
Chip Seal Performance Measures Best Practices
Applied Pavement Technology, Inc. 3
Best Practices Chip Seal Performance Measures
4 Applied Pavement Technology, Inc.
CHAPTER 2. LITERATURE SEARCH
Introduction
A formal literature search was conducted for this project by querying the Transportation
Research International Documentation (TRID) database managed by the Transportation
Research Board (TRB), the National Transportation Information Service (NTIS) and the
Engineering Index (EI Compendex) databases, and conference websites and/or CD-ROMs where
significant attention was focused on performance prediction measures/models within pavement
management activities. The research team also reviewed papers and presentations provided at
the TRB’s Annual Meetings and at the International Conferences on Managing Pavement Assets.
Chip seals are one of many pavement preservation treatments used in the U.S. and
worldwide. Chip seals are generally considered effective for preserving existing asphalt- and
chip seal-surfaced pavements that are distressed with longitudinal, transverse, and block
cracking; raveling; friction loss; low-severity bleeding; and moisture infiltration. However, chip
seals are not recommended on pavements with unsealed cracks greater than 0.25 in wide,
medium- to high- severity alligator cracking, rutting greater than 1 in deep, very rough surfaces,
or those which are structurally deficient (NHI 2013). In addition, chip seals may accelerate
stripping in susceptible asphalt pavements (Morian, Gibson, and Epps 1998; Huang and Dong
2009; NHI 2013). The expected performance life of chip seals have been reported to range from
1 to 12 years depending on site-specific circumstances; however, 4 to 6 years is common for
single chip seals (one application of binder followed by one application of aggregate) and 5 to 7
years for double chip seals (one application of binder and aggregate followed by a second
application of binder and aggregate) (NHI 2013).
There are a number of factors that can influence chip seal performance. These factors
include (Shuler et al. 2011; Testa and Hossain 2014):
• Construction technique.
• Condition of contractor’s equipment.
• Skill and knowledge of contractor’s employees.
• Knowledge and training of inspection personnel.
• Condition of existing pavement.
• Asphalt binder and aggregate properties.
Chip Seal Performance Measures Best Practices
Applied Pavement Technology, Inc. 5
• Asphalt binder and aggregate application rates.
• Uniformity of application.
• Adhesion between the chip seal and the existing pavement.
• Aggregate interlock.
• Strength of the underlying base or condition of underlying pavement.
• Amount and type of traffic.
• Environmental and drainage conditions.
In general, there are two commonly used methods for measuring chip seal performance:
engineering-based and qualitative. Each method is further described in the following sections.
Engineering-Based Performance Indicators
Friction Number
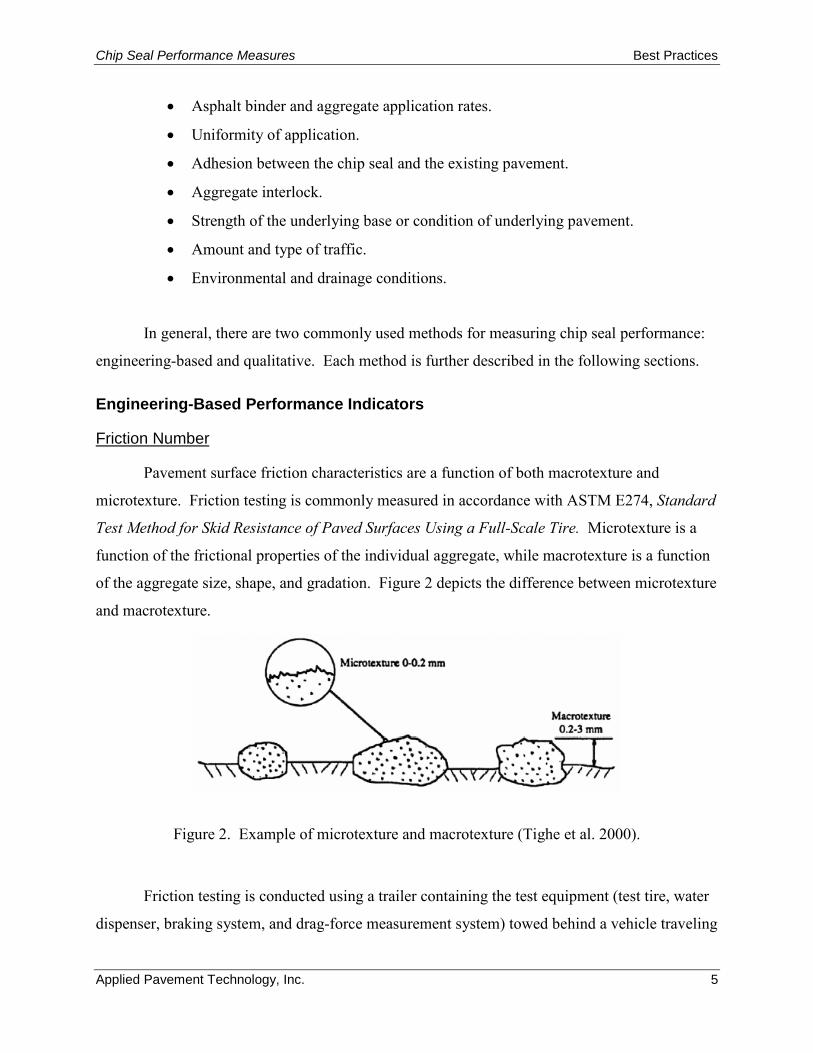
Pavement surface friction characteristics are a function of both macrotexture and
microtexture. Friction testing is commonly measured in accordance with ASTM E274, Standard
Test Method for Skid Resistance of Paved Surfaces Using a Full-Scale Tire. Microtexture is a
function of the frictional properties of the individual aggregate, while macrotexture is a function
of the aggregate size, shape, and gradation. Figure 2 depicts the difference between microtexture
and macrotexture.
Figure 2. Example of microtexture and macrotexture (Tighe et al. 2000).
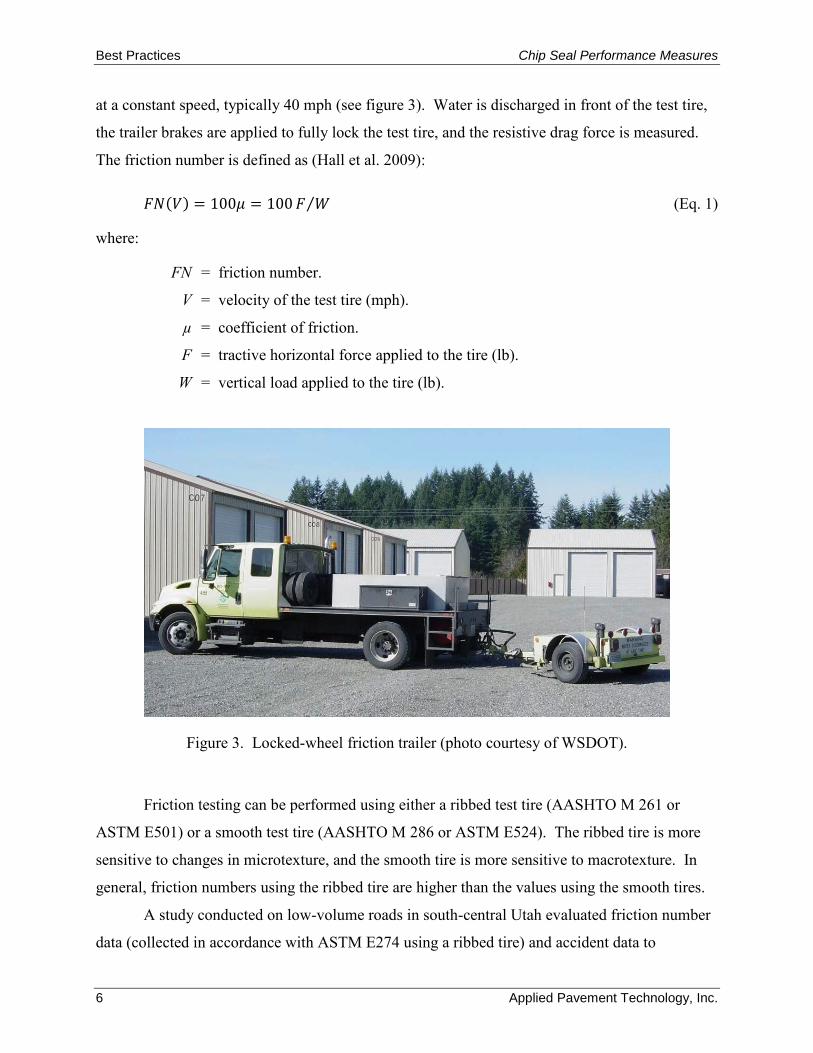
Friction testing is conducted using a trailer containing the test equipment (test tire, water
dispenser, braking system, and drag-force measurement system) towed behind a vehicle traveling
Best Practices Chip Seal Performance Measures
6 Applied Pavement Technology, Inc.
at a constant speed, typically 40 mph (see figure 3). Water is discharged in front of the test tire,
the trailer brakes are applied to fully lock the test tire, and the resistive drag force is measured.
The friction number is defined as (Hall et al. 2009):
𝐹𝐹(𝑉) = 100𝜇 = 100𝐹 𝑊⁄ (Eq. 1)
where:
FN = friction number.
V = velocity of the test tire (mph).
µ = coefficient of friction.
F = tractive horizontal force applied to the tire (lb).
W = vertical load applied to the tire (lb).
Figure 3. Locked-wheel friction trailer (photo courtesy of WSDOT).
Friction testing can be performed using either a ribbed test tire (AASHTO M 261 or
ASTM E501) or a smooth test tire (AASHTO M 286 or ASTM E524). The ribbed tire is more
sensitive to changes in microtexture, and the smooth tire is more sensitive to macrotexture. In
general, friction numbers using the ribbed tire are higher than the values using the smooth tires.
A study conducted on low-volume roads in south-central Utah evaluated friction number
data (collected in accordance with ASTM E274 using a ribbed tire) and accident data to
Chip Seal Performance Measures Best Practices
Applied Pavement Technology, Inc. 7
determine the safety benefits over the life of chip seal pavements (Seneviratne and Bergener
1994). The evaluation of friction numbers before and after chip seal application indicated an
average of a 24 point increase in friction number. However, there was no correlation between
the before and after friction number (i.e., the before friction number did not impact the friction
number measured after chip seal application). Seneviratne and Bergener (1994) determined that
there was no definite relationship between accident rate and friction number on chip sealed
pavements, but, in general, the study indicated that chip sealed pavements tend to result in lower
crash rates for both wet and dry weather conditions. The study also concluded that the reduction
in crashes cannot be solely attributed to chip seal treatments.
Romero and Anderson (2005) evaluated the performance life of chip seal treatments
based on a number of features including traffic volume, aggregate source, asphalt supplier,
roughness, and friction number. Due to the lack of sufficient data, Romero and Anderson (2005)
focused the evaluation of chip seal performance life on skid number and roughness. For skid
number, the developed performance equation (equation 2) resulted in a very low correlation
(primarily due to the large number of variables influencing surface friction).
𝑆𝐹 = −0.3815 (𝐴𝐴𝐴) + 59.4487 (Eq. 2) 𝑅2 = 0.0069
where:
SN = skid number.
Age = years since construction.
Due to the poor correlation, Romero and Anderson (2005) proposed a different approach
that evaluated chip seal skid number based on the percent of total miles with a skid number less
than 40. A skid number less than 40 was selected because this value would typically trigger
other corrective action requirements (Romero and Anderson 2005). The resulting performance
equation using this approach is shown in Equation 3.
𝑆𝐹(%) = 1.9176 (𝐴𝐴𝐴) − 1.2403 (Eq. 3) 𝑅2 = 0.825
where:
SN(%) = Percent of miles with skid number < 40.
Best Practices Chip Seal Performance Measures
8 Applied Pavement Technology, Inc.
Age = Years since construction (based on 6 years of data).
Romero and Anderson (2005) determined the corresponding treatment life based on the
percent of miles needing corrective action (see table 1). For example, if it assumed that 50
percent of the chip seal miles will need corrective action in a given year, then the corresponding
treatment life would be 27 years (depending on traffic level). It should be noted that Table 1
represents corresponding pavement life based only on skid number; treatment life may be less
due to other modes of failure.
Table 1. Chip seal performance (Romero and Anderson 2005).
Percent of Miles Needing Corrective Action Corresponding Life
10 6 years 25 14 years 50 27 years 75 40 years
Texture Depth
Although there are a number of different methods for measuring texture depth, the most
commonly used and accepted procedure is ASTM E965, Standard Test Method for Measuring
Pavement Macrotexture Depth Using a Volumetric Technique (ASTM 1996). In this test
method, the mean texture depth is determined using the sand patch method which has shown to
provide a good indication of chip seal performance (Roque, Anderson, and Thompson 1991).
Mean texture depth is determined by:
𝑀𝑀𝑀 = 4𝑉𝜋𝐷2
(Eq. 4)
where:
MTD = mean texture depth (in).
V = test material volume (in3).
D = average diameter of area covered by test material (in).
Roque, Anderson, and Thompson (1991) conducted a study for the Pennsylvania DOT to
evaluate the effects of materials (e.g., polymer modification, aggregate gradation), design
Chip Seal Performance Measures Best Practices
Applied Pavement Technology, Inc. 9
features (e.g., existing condition, traffic volume), and construction practices (e.g., emulsion type
and rate, rolling pattern) on the performance of chip seal treatments. Pavement sections were
evaluated based on visual evaluations, skid resistance, and mean texture depth. The sand patch
method was used to measure the mean texture depth of the pavement surface. The study found
that the mean texture depth decreased over time due to aggregate wear and embedment (Roque,
Anderson, and Thompson 1991). A forward stepwise multi-linear regression model was
developed to associate mean texture depth with emulsion application rate:
𝑀𝑀𝑀 = 0.096 − 0.125 × 𝐸𝐴𝑅 (Eq. 5) 𝑅2 = 0.71
where:
MTD = mean texture depth (in).
EAR = emulsion application rate (gal/yd2).
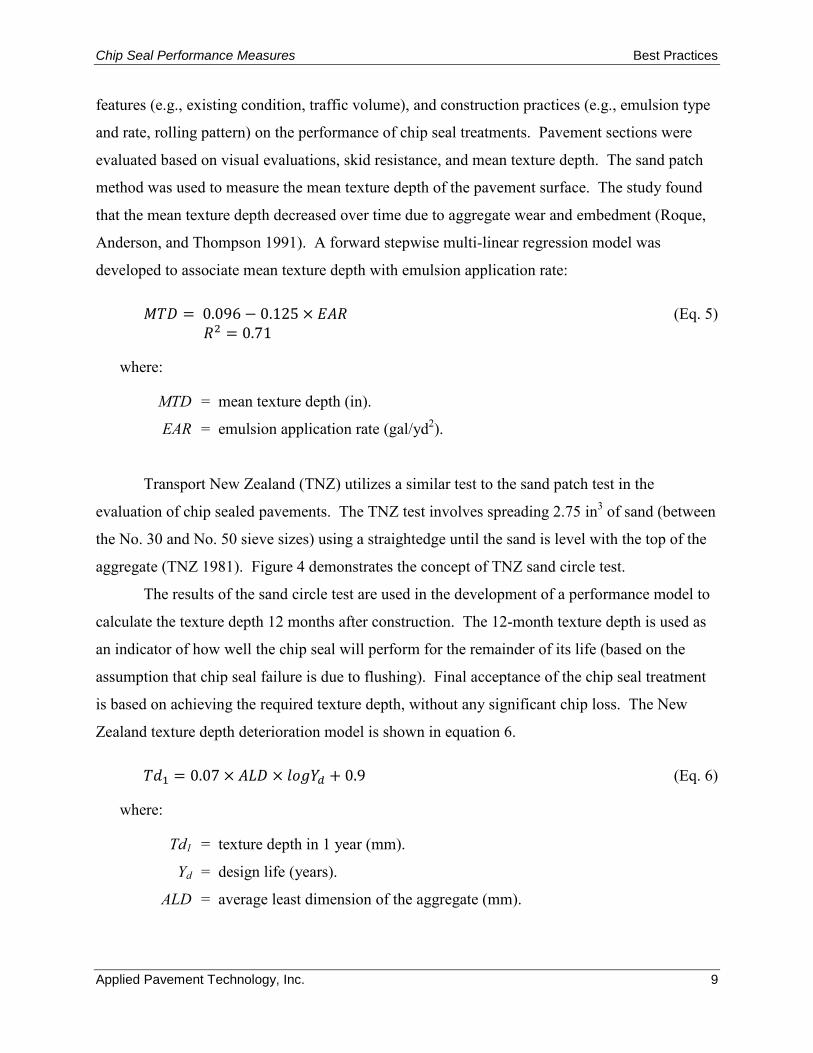
Transport New Zealand (TNZ) utilizes a similar test to the sand patch test in the
evaluation of chip sealed pavements. The TNZ test involves spreading 2.75 in3 of sand (between
the No. 30 and No. 50 sieve sizes) using a straightedge until the sand is level with the top of the
aggregate (TNZ 1981). Figure 4 demonstrates the concept of TNZ sand circle test.
The results of the sand circle test are used in the development of a performance model to
calculate the texture depth 12 months after construction. The 12-month texture depth is used as
an indicator of how well the chip seal will perform for the remainder of its life (based on the
assumption that chip seal failure is due to flushing). Final acceptance of the chip seal treatment
is based on achieving the required texture depth, without any significant chip loss. The New
Zealand texture depth deterioration model is shown in equation 6.
𝑀𝑇1 = 0.07 × 𝐴𝐴𝑀 × 𝑙𝑙𝐴𝑌𝑑 + 0.9 (Eq. 6)
where:
Td1 = texture depth in 1 year (mm).
Yd = design life (years).
ALD = average least dimension of the aggregate (mm).
Best Practices Chip Seal Performance Measures
10 Applied Pavement Technology, Inc.
Figure 4. Sand circle test (TNZ 1981).
New Zealand chip seal failure is determined when the chip seal’s texture depth is less
than 0.7 mm (0.028 in) for posted speeds less than 70 km/hr (44 mph); or less than 0.9 mm
(0.035 in) for posted speeds greater than 70 km/hr (44 mph).
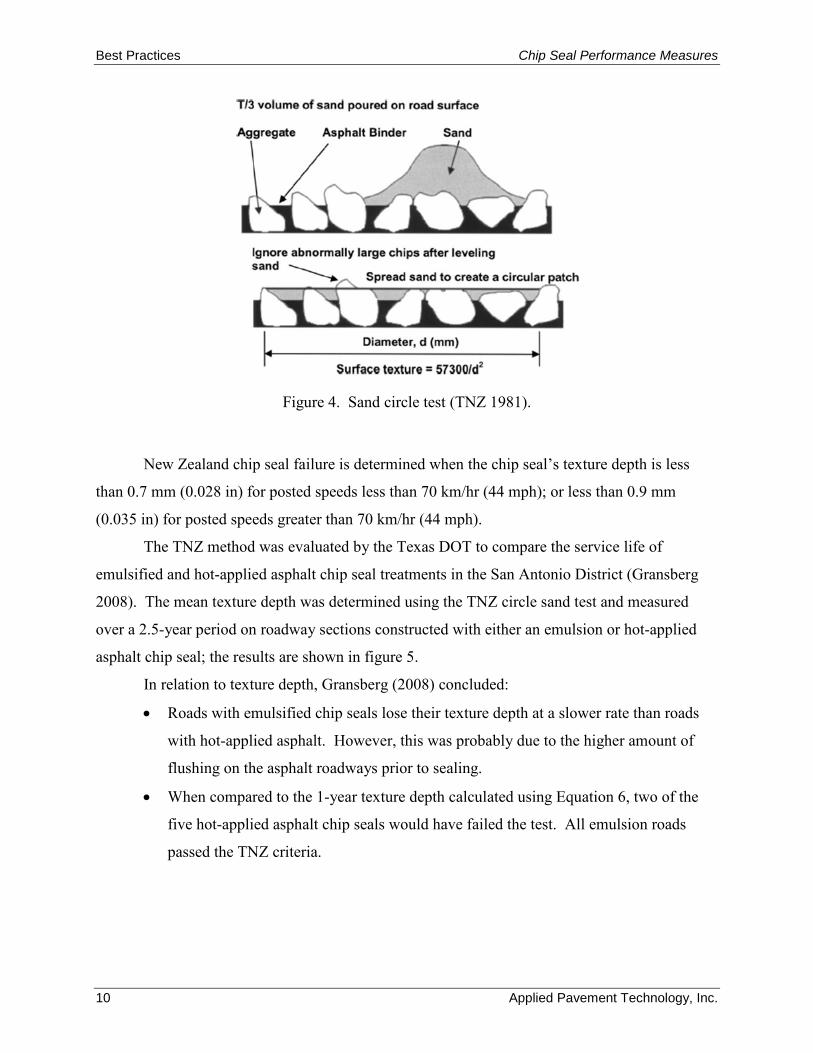
The TNZ method was evaluated by the Texas DOT to compare the service life of
emulsified and hot-applied asphalt chip seal treatments in the San Antonio District (Gransberg
2008). The mean texture depth was determined using the TNZ circle sand test and measured
over a 2.5-year period on roadway sections constructed with either an emulsion or hot-applied
asphalt chip seal; the results are shown in figure 5.
In relation to texture depth, Gransberg (2008) concluded:
• Roads with emulsified chip seals lose their texture depth at a slower rate than roads
with hot-applied asphalt. However, this was probably due to the higher amount of
flushing on the asphalt roadways prior to sealing.
• When compared to the 1-year texture depth calculated using Equation 6, two of the
five hot-applied asphalt chip seals would have failed the test. All emulsion roads
passed the TNZ criteria.
Chip Seal Performance Measures Best Practices
Applied Pavement Technology, Inc. 11
Figure 5. Comparison of mean texture depth for emulsion and hot-applied asphalt chip seals (Gransberg 2008).
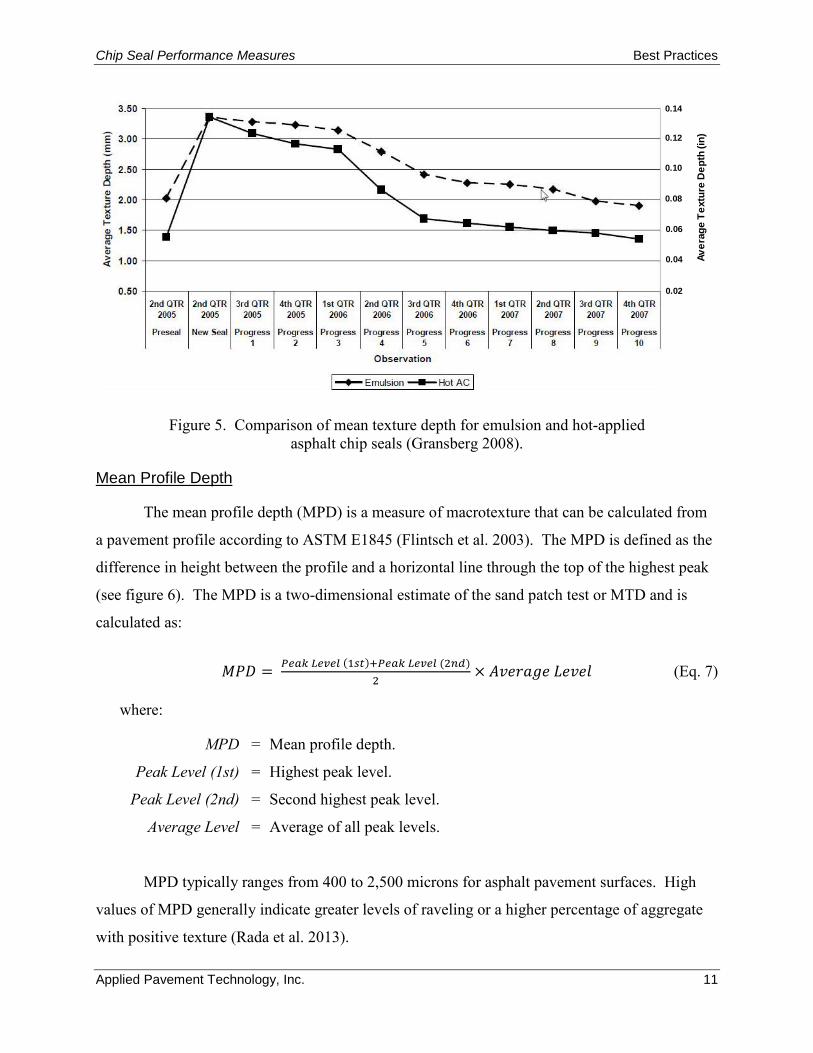
Mean Profile Depth
The mean profile depth (MPD) is a measure of macrotexture that can be calculated from
a pavement profile according to ASTM E1845 (Flintsch et al. 2003). The MPD is defined as the
difference in height between the profile and a horizontal line through the top of the highest peak
(see figure 6). The MPD is a two-dimensional estimate of the sand patch test or MTD and is
calculated as:
𝑀𝑀𝑀 = 𝑃𝑃𝑃𝑃 𝐿𝑃𝐿𝑃𝐿 (1𝑠𝑠)+𝑃𝑃𝑃𝑃 𝐿𝑃𝐿𝑃𝐿 (2𝑛𝑑)2
× 𝐴𝐴𝐴𝐴𝐴𝐴𝐴 𝐴𝐴𝐴𝐴𝑙 (Eq. 7)
where:
MPD = Mean profile depth.
Peak Level (1st) = Highest peak level.
Peak Level (2nd) = Second highest peak level.
Average Level = Average of all peak levels.
MPD typically ranges from 400 to 2,500 microns for asphalt pavement surfaces. High
values of MPD generally indicate greater levels of raveling or a higher percentage of aggregate
with positive texture (Rada et al. 2013).
Aver
age
Text
ure
Dep
th (i
n)
0.14
0.12
0.10
0.08
0.06
0.04
0.02
Best Practices Chip Seal Performance Measures
12 Applied Pavement Technology, Inc.
Figure 6. Example of mean profile depth (Vilaca et al. 2010).
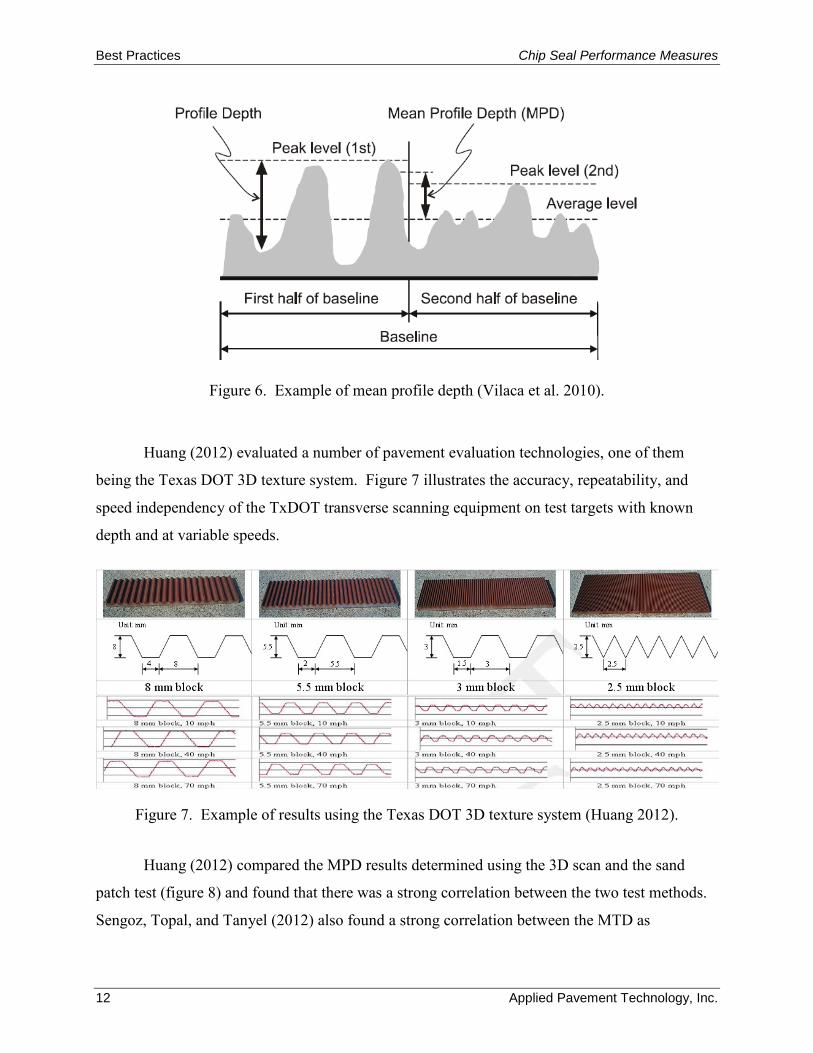
Huang (2012) evaluated a number of pavement evaluation technologies, one of them
being the Texas DOT 3D texture system. Figure 7 illustrates the accuracy, repeatability, and
speed independency of the TxDOT transverse scanning equipment on test targets with known
depth and at variable speeds.
Figure 7. Example of results using the Texas DOT 3D texture system (Huang 2012).
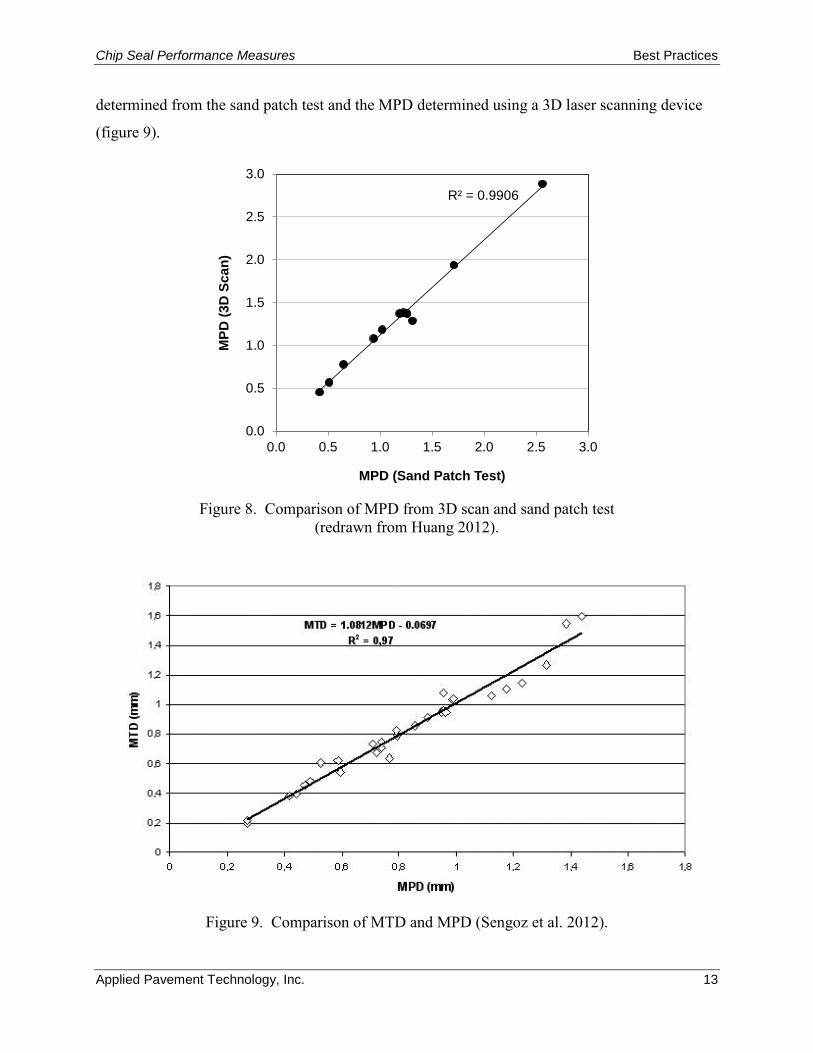
Huang (2012) compared the MPD results determined using the 3D scan and the sand
patch test (figure 8) and found that there was a strong correlation between the two test methods.
Sengoz, Topal, and Tanyel (2012) also found a strong correlation between the MTD as
Chip Seal Performance Measures Best Practices
Applied Pavement Technology, Inc. 13
determined from the sand patch test and the MPD determined using a 3D laser scanning device
(figure 9).
Figure 8. Comparison of MPD from 3D scan and sand patch test (redrawn from Huang 2012).
Figure 9. Comparison of MTD and MPD (Sengoz et al. 2012).
R² = 0.9906
0.0
0.5
1.0
1.5
2.0
2.5
3.0
0.0 0.5 1.0 1.5 2.0 2.5 3.0
MPD
(3D
Sca
n)
MPD (Sand Patch Test)
Best Practices Chip Seal Performance Measures
14 Applied Pavement Technology, Inc.
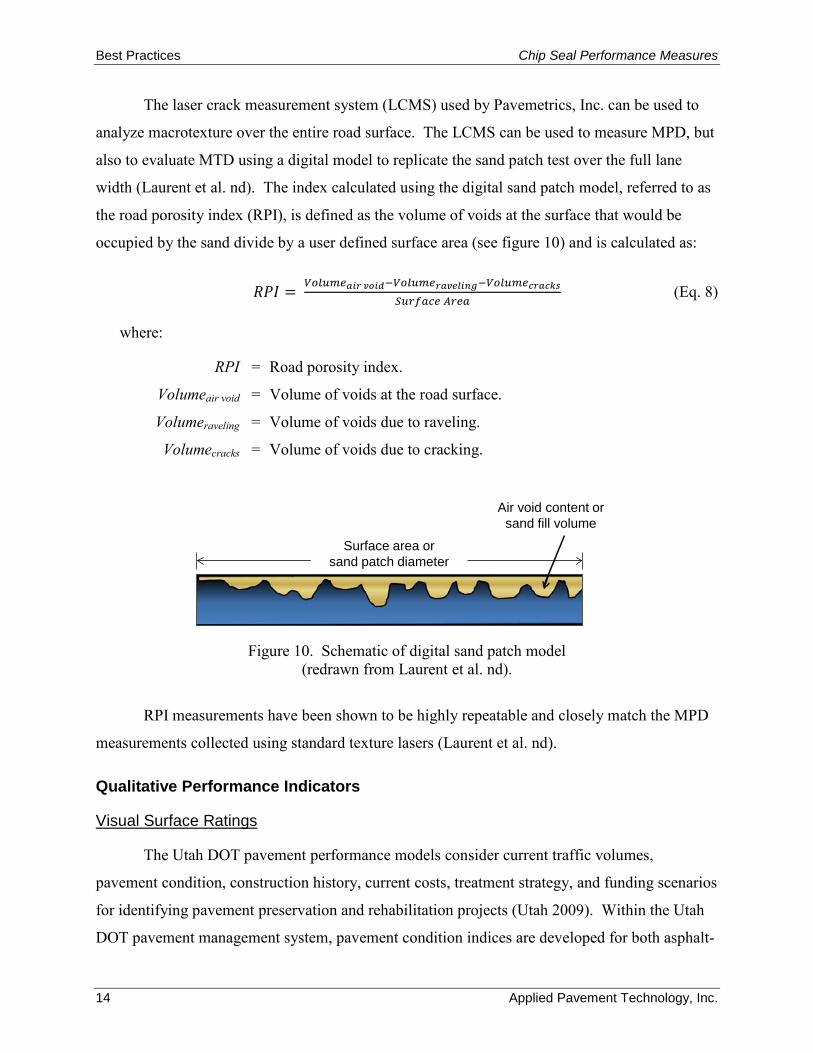
The laser crack measurement system (LCMS) used by Pavemetrics, Inc. can be used to
analyze macrotexture over the entire road surface. The LCMS can be used to measure MPD, but
also to evaluate MTD using a digital model to replicate the sand patch test over the full lane
width (Laurent et al. nd). The index calculated using the digital sand patch model, referred to as
the road porosity index (RPI), is defined as the volume of voids at the surface that would be
occupied by the sand divide by a user defined surface area (see figure 10) and is calculated as:
𝑅𝑀𝑅 = 𝑉𝑉𝐿𝑉𝑉𝑃𝑎𝑎𝑎 𝑣𝑣𝑎𝑣−𝑉𝑉𝐿𝑉𝑉𝑃𝑎𝑎𝑣𝑟𝑟𝑎𝑟𝑟−𝑉𝑉𝐿𝑉𝑉𝑃𝑐𝑎𝑎𝑐𝑐𝑐𝑆𝑉𝑆𝑆𝑃𝑆𝑃 𝐴𝑆𝑃𝑃
(Eq. 8)
where:
RPI = Road porosity index.
Volumeair void = Volume of voids at the road surface.
Volumeraveling = Volume of voids due to raveling.
Volumecracks = Volume of voids due to cracking.
Figure 10. Schematic of digital sand patch model (redrawn from Laurent et al. nd).
RPI measurements have been shown to be highly repeatable and closely match the MPD
measurements collected using standard texture lasers (Laurent et al. nd).
Qualitative Performance Indicators
Visual Surface Ratings
The Utah DOT pavement performance models consider current traffic volumes,
pavement condition, construction history, current costs, treatment strategy, and funding scenarios
for identifying pavement preservation and rehabilitation projects (Utah 2009). Within the Utah
DOT pavement management system, pavement condition indices are developed for both asphalt-
Air void content or sand fill volume
Surface area orsand patch diameter
Chip Seal Performance Measures Best Practices
Applied Pavement Technology, Inc. 15
and concrete-surfaced pavements. Asphalt pavement indices include roughness (based on IRI),
rutting, environmental cracking, and wheelpath cracking. The asphalt pavement indices use the
following equations (R2 values were not provided):
𝑅𝑅𝑇𝐴 𝑅𝐼𝑇𝐴𝐼 = 118 − 0.4 × 𝑅𝑅𝑅 (Eq. 9)
𝑅𝑅𝑅 𝑅𝐼𝑇𝐴𝐼 = 100 − 25 × 𝑅𝑅𝑅 (Eq. 10)
𝐸𝐹𝑉 = 100 − [0.947 × (𝑙𝑙𝑙 𝑅𝐴𝐴𝐼 + 0.1 × 𝑙𝑙𝑙 𝑙𝑙𝐼𝐴 + 0.1 × 𝑙𝑙𝑙 𝑏𝑙𝑙𝑏𝑏) + (Eq. 11) 1.263 × (𝑚𝐴𝑇 𝑅𝐴𝐴𝐼 + 0.1 × 𝑚𝐴𝑇 𝑙𝑙𝐼𝐴 + 0.1 × 𝑚𝐴𝑇 𝑏𝑙𝑙𝑏𝑏) + 1.894 × (ℎ𝑅𝐴ℎ 𝑅𝐴𝐴𝐼 + 0.1 × ℎ𝑅𝐴ℎ 𝑙𝑙𝐼𝐴 + 0.1 × ℎ𝑅𝐴ℎ 𝑏𝑙𝑙𝑏𝑏)]
𝑊𝑀𝑊𝑊 = 100 − (0.079 × 𝑙𝑙𝑙 𝑊𝑀 + 0.158 × 𝑚𝐴𝑇 𝑊𝑀 + 0.316 × ℎ𝑅𝐴ℎ 𝑊𝑀) (Eq. 12)
where:
IRI = International Roughness Index (in/mi).
Rut = rut depth (in).
ENV = environmental cracking index.
low = low severity.
med = medium severity.
high = high severity.
tran = transverse cracking (percent, where 100 percent > 53 cracks per 0.1 mile).
long = longitudinal cracking (percent, where 100 percent > 528 ft per 0.1 mile).
block = block cracking (percent, where 100 percent > 528 ft per 0.1 mile).
WPCK = wheelpath cracking index.
WP = wheelpath cracking (percent, where 100 percent = 1,584 ft2 per 0.1 mile).
Morian, Gibson, and Epps (1998) conducted an evaluation of the Long-Term Pavement
Performance (LTPP) Experiment SPS-3 sites in an attempt to develop performance prediction
models for maintenance treatments based on 5-years of performance data. A multiple regression
analysis was conducted using pavement age, original pavement condition (good, fair, and poor)
based on the Pavement Rating Score (PRS), traffic level (high, medium, and low), pavement
structural adequacy (structural number ratio), climate zone, and subgrade type as the independent
variables. PRS is an analysis approach specifically developed by the researchers for the LTPP
SPS-3 sections. It is a single distress index that includes other individual distress parameters
Best Practices Chip Seal Performance Measures
16 Applied Pavement Technology, Inc.
(fatigue cracking, longitudinal cracking, transverse cracking, patching, bleeding, and rutting).
PRS is based on a scale of 0 (failed) to 100 (perfect condition). Deduct values are assigned to
individual distress and severity levels. The PRS model for chip seal pavements is shown in
Equation 11.
𝑀𝑅𝑆 = 45.26 + 4.37 𝐴𝐴𝐴 + 9.79 𝑅𝑊 − 9.21 𝑆𝐴 + 10.43 𝑆𝑆 (Eq. 13) R2 = 0.306; standard error of estimate = 18.08
where:
PRS = Pavement Rating Score (0 to 100 scale).
Age = chip seal age (years).
IC = initial or pretreatment condition.
SA = structural adequacy (SN ≤ 1 or SN > 1).
SG = subgrade type (fine or coarse).
The Ministry of Transportation of Ontario (MTO) developed pavement performance
prediction models based on pavement type, traffic volume, climate zone, subgrade type, and total
pavement thickness (Li and Kazmierowski 2004). Performance prediction is based on a
Pavement Condition Index (PCI) that considers both a Distress Manifestation Index (DMI) and
IRI. The resulting MTO PCI equation for surface treatment pavements is:
𝑀𝑊𝑅 = 10 × (0.1 × 𝑅𝑊𝑅)0.5 × 𝑀𝑀𝑅 × 0.962 (Eq. 14) 𝑅2 = 0.962
where:
PCI = Pavement Condition Index.
RCI = Ride Comfort Index or IRI. RCI ranges from 10 (perfect condition) to 0 (very
poor).
DMI = Distress Manifestation Index. Reflects the overall pavement surface
condition and ranges from 1 (very poor) to 10 (excellent).
= 10 × 𝐷𝐷𝐷𝑀𝑎𝑀−∑ 𝑊𝑎(𝑠𝑎+𝑑𝑎)𝑟𝑎=1
𝐷𝐷𝐷𝑀𝑎𝑀
DMIMax = the maximum value theoretically assigned to an individual pavement distress.
For surface treated pavements = 180.
Chip Seal Performance Measures Best Practices
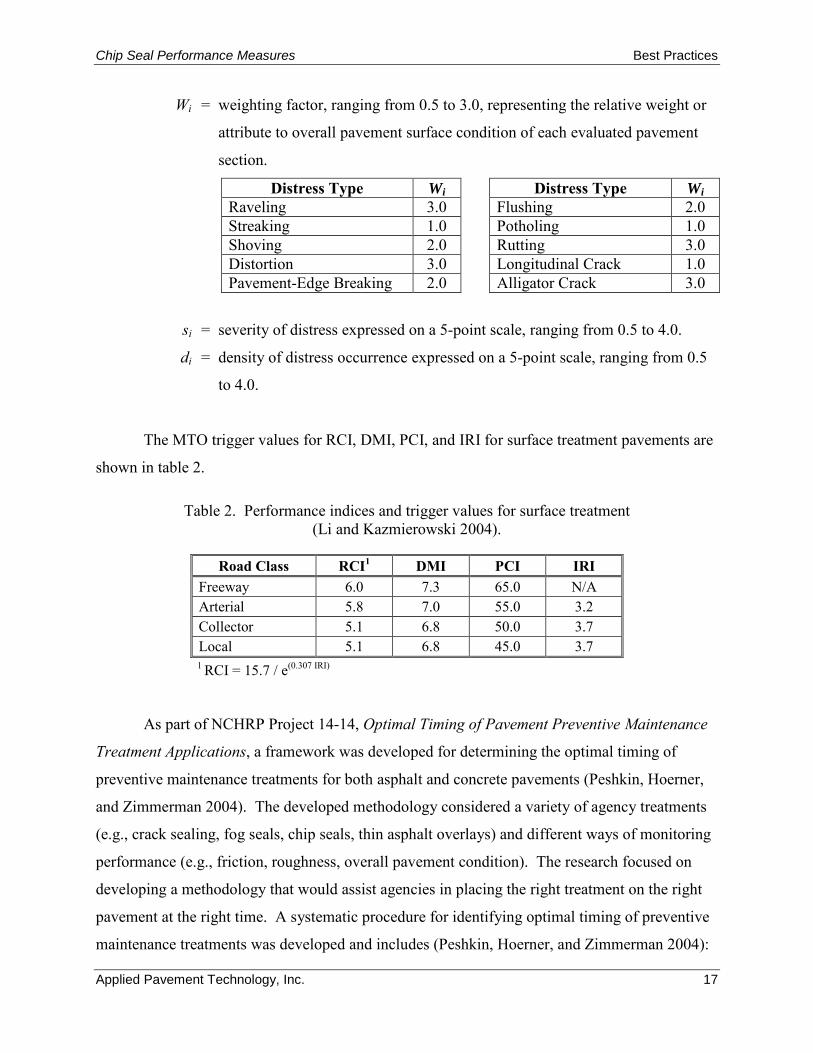
Applied Pavement Technology, Inc. 17
Wi = weighting factor, ranging from 0.5 to 3.0, representing the relative weight or
attribute to overall pavement surface condition of each evaluated pavement
section.
Distress Type Wi Distress Type Wi Raveling 3.0 Flushing 2.0 Streaking 1.0 Potholing 1.0 Shoving 2.0 Rutting 3.0 Distortion 3.0 Longitudinal Crack 1.0 Pavement-Edge Breaking 2.0 Alligator Crack 3.0
si = severity of distress expressed on a 5-point scale, ranging from 0.5 to 4.0.
di = density of distress occurrence expressed on a 5-point scale, ranging from 0.5
to 4.0.
The MTO trigger values for RCI, DMI, PCI, and IRI for surface treatment pavements are
shown in table 2.
Table 2. Performance indices and trigger values for surface treatment (Li and Kazmierowski 2004).
Road Class RCI1 DMI PCI IRI Freeway 6.0 7.3 65.0 N/A Arterial 5.8 7.0 55.0 3.2 Collector 5.1 6.8 50.0 3.7 Local 5.1 6.8 45.0 3.7 1 RCI = 15.7 / e(0.307 IRI)
As part of NCHRP Project 14-14, Optimal Timing of Pavement Preventive Maintenance
Treatment Applications, a framework was developed for determining the optimal timing of
preventive maintenance treatments for both asphalt and concrete pavements (Peshkin, Hoerner,
and Zimmerman 2004). The developed methodology considered a variety of agency treatments
(e.g., crack sealing, fog seals, chip seals, thin asphalt overlays) and different ways of monitoring
performance (e.g., friction, roughness, overall pavement condition). The research focused on
developing a methodology that would assist agencies in placing the right treatment on the right
pavement at the right time. A systematic procedure for identifying optimal timing of preventive
maintenance treatments was developed and includes (Peshkin, Hoerner, and Zimmerman 2004):
Best Practices Chip Seal Performance Measures
18 Applied Pavement Technology, Inc.
• Identification of specific objectives of the preventive maintenance program: Overall
agency expectations need to be clearly defined.
• Selection of treatments and definition of guidelines on their appropriate use: Since
each treatment provides unique benefits, or can be subjected to different constraints,
guidelines should be developed on the selection, use, and performance of treatments
specific to local/regional conditions (such as traffic and climatic conditions).
• Definition of typical performance of pavements when no treatment is applied, as well
as the expected performance for different treatments: Analysis of historical data
available should be conducted to develop pavement performance models with and
without treatment application.
• Identification and tracking of appropriate performance measures for different
treatments and analysis of data and calculation of optimal timing of treatments:
Treated sections should be monitored periodically to keep track of performance over
time.
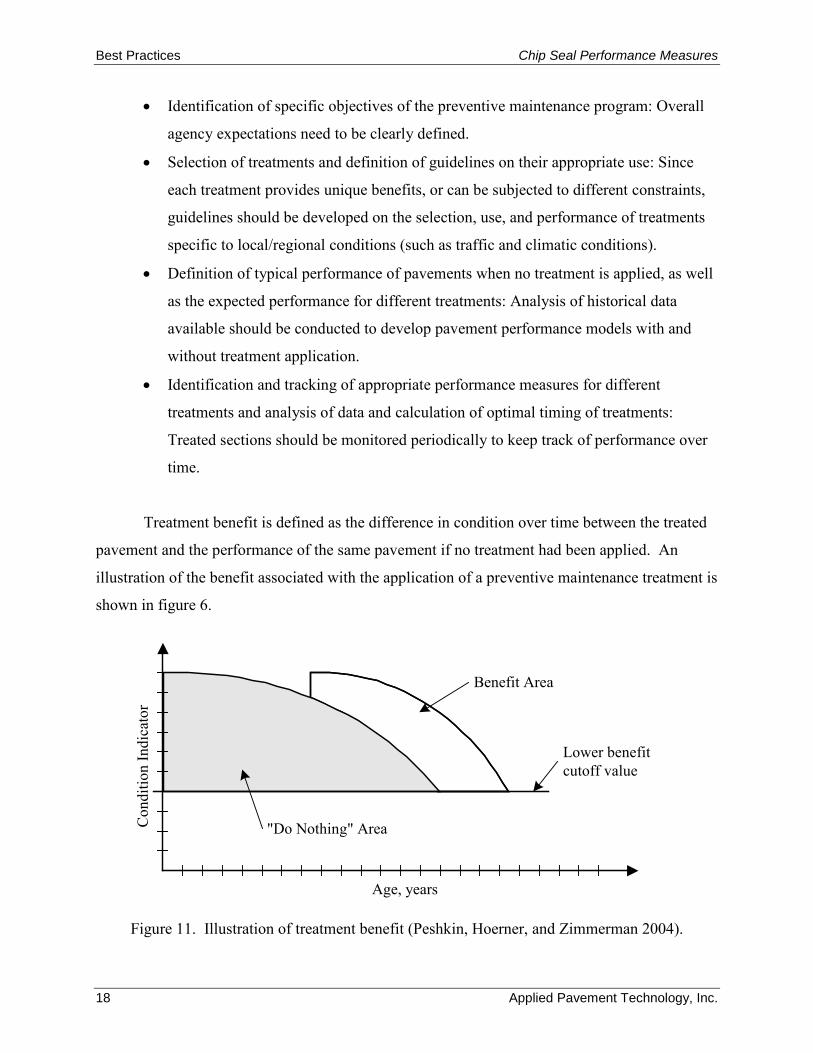
Treatment benefit is defined as the difference in condition over time between the treated
pavement and the performance of the same pavement if no treatment had been applied. An
illustration of the benefit associated with the application of a preventive maintenance treatment is
shown in figure 6.
Figure 11. Illustration of treatment benefit (Peshkin, Hoerner, and Zimmerman 2004).
Age, years
Con
ditio
n In
dica
tor
Lower benefitcutoff value
"Do Nothing" Area
Benefit Area
Chip Seal Performance Measures Best Practices
Applied Pavement Technology, Inc. 19
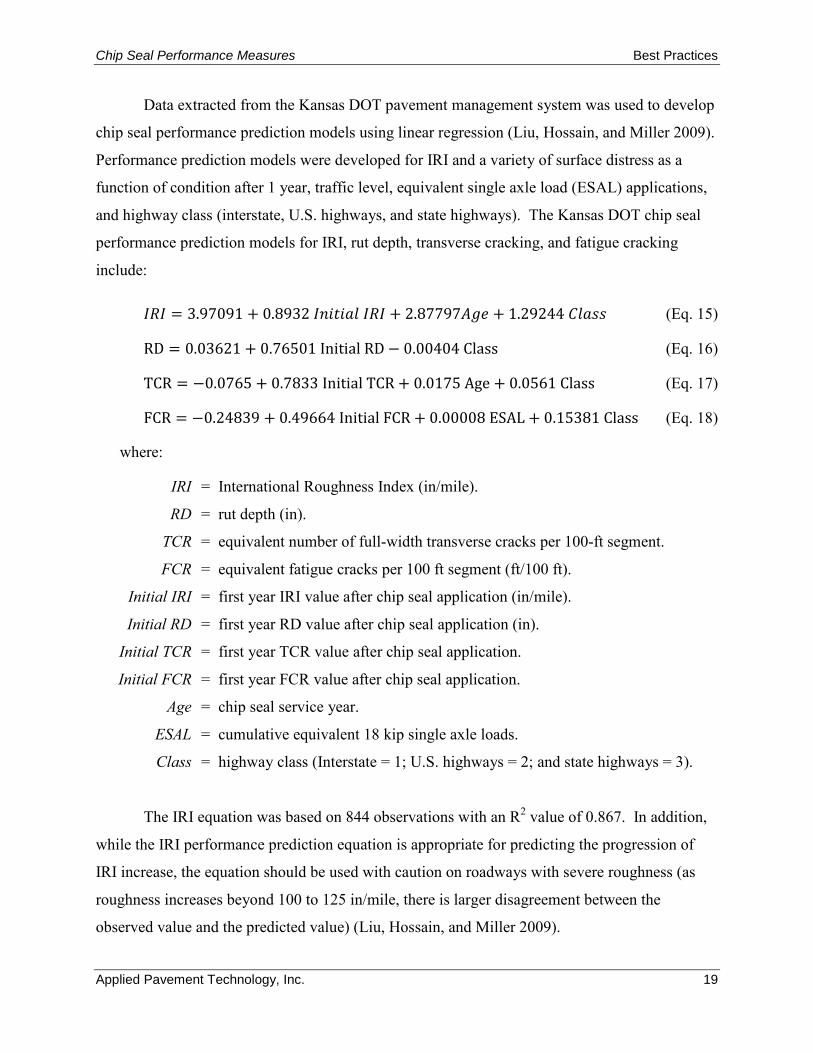
Data extracted from the Kansas DOT pavement management system was used to develop
chip seal performance prediction models using linear regression (Liu, Hossain, and Miller 2009).
Performance prediction models were developed for IRI and a variety of surface distress as a
function of condition after 1 year, traffic level, equivalent single axle load (ESAL) applications,
and highway class (interstate, U.S. highways, and state highways). The Kansas DOT chip seal
performance prediction models for IRI, rut depth, transverse cracking, and fatigue cracking
include:
𝑅𝑅𝑅 = 3.97091 + 0.8932 𝑅𝐼𝑅𝑅𝑅𝐴𝑙 𝑅𝑅𝑅 + 2.87797𝐴𝐴𝐴 + 1.29244 𝑊𝑙𝐴𝐶𝐶 (Eq. 15)
RD = 0.03621 + 0.76501 Initial RD − 0.00404 Class (Eq. 16)
TCR = −0.0765 + 0.7833 Initial TCR + 0.0175 Age + 0.0561 Class (Eq. 17)
FCR = −0.24839 + 0.49664 Initial FCR + 0.00008 ESAL + 0.15381 Class (Eq. 18)
where:
IRI = International Roughness Index (in/mile).
RD = rut depth (in).
TCR = equivalent number of full-width transverse cracks per 100-ft segment.
FCR = equivalent fatigue cracks per 100 ft segment (ft/100 ft).
Initial IRI = first year IRI value after chip seal application (in/mile).
Initial RD = first year RD value after chip seal application (in).
Initial TCR = first year TCR value after chip seal application.
Initial FCR = first year FCR value after chip seal application.
Age = chip seal service year.
ESAL = cumulative equivalent 18 kip single axle loads.
Class = highway class (Interstate = 1; U.S. highways = 2; and state highways = 3).
The IRI equation was based on 844 observations with an R2 value of 0.867. In addition,
while the IRI performance prediction equation is appropriate for predicting the progression of
IRI increase, the equation should be used with caution on roadways with severe roughness (as
roughness increases beyond 100 to 125 in/mile, there is larger disagreement between the
observed value and the predicted value) (Liu, Hossain, and Miller 2009).
Best Practices Chip Seal Performance Measures
20 Applied Pavement Technology, Inc.
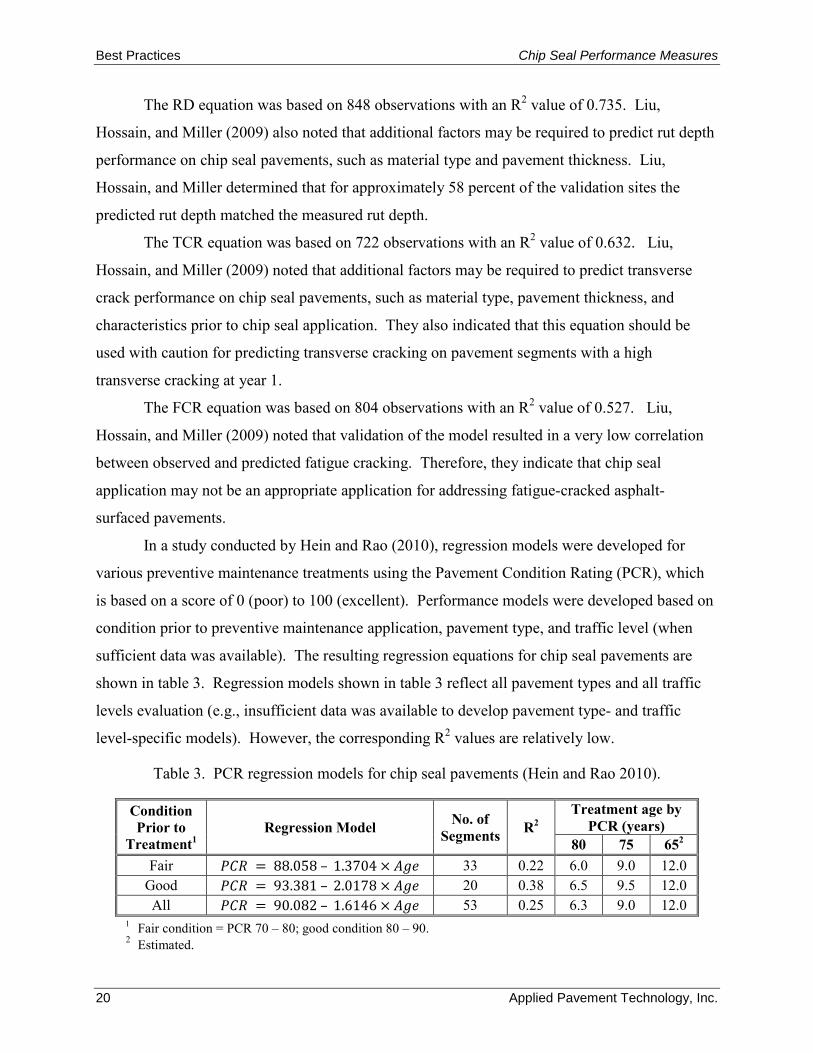
The RD equation was based on 848 observations with an R2 value of 0.735. Liu,
Hossain, and Miller (2009) also noted that additional factors may be required to predict rut depth
performance on chip seal pavements, such as material type and pavement thickness. Liu,
Hossain, and Miller determined that for approximately 58 percent of the validation sites the
predicted rut depth matched the measured rut depth.
The TCR equation was based on 722 observations with an R2 value of 0.632. Liu,
Hossain, and Miller (2009) noted that additional factors may be required to predict transverse
crack performance on chip seal pavements, such as material type, pavement thickness, and
characteristics prior to chip seal application. They also indicated that this equation should be
used with caution for predicting transverse cracking on pavement segments with a high
transverse cracking at year 1.
The FCR equation was based on 804 observations with an R2 value of 0.527. Liu,
Hossain, and Miller (2009) noted that validation of the model resulted in a very low correlation
between observed and predicted fatigue cracking. Therefore, they indicate that chip seal
application may not be an appropriate application for addressing fatigue-cracked asphalt-
surfaced pavements.
In a study conducted by Hein and Rao (2010), regression models were developed for
various preventive maintenance treatments using the Pavement Condition Rating (PCR), which
is based on a score of 0 (poor) to 100 (excellent). Performance models were developed based on
condition prior to preventive maintenance application, pavement type, and traffic level (when
sufficient data was available). The resulting regression equations for chip seal pavements are
shown in table 3. Regression models shown in table 3 reflect all pavement types and all traffic
levels evaluation (e.g., insufficient data was available to develop pavement type- and traffic
level-specific models). However, the corresponding R2 values are relatively low.
Table 3. PCR regression models for chip seal pavements (Hein and Rao 2010).
Condition Prior to
Treatment1 Regression Model No. of
Segments R2 Treatment age by
PCR (years) 80 75 652
Fair 𝑀𝑊𝑅 = 88.058 – 1.3704 × 𝐴𝐴𝐴 33 0.22 6.0 9.0 12.0 Good 𝑀𝑊𝑅 = 93.381 – 2.0178 × 𝐴𝐴𝐴 20 0.38 6.5 9.5 12.0 All 𝑀𝑊𝑅 = 90.082 – 1.6146 × 𝐴𝐴𝐴 53 0.25 6.3 9.0 12.0
1 Fair condition = PCR 70 – 80; good condition 80 – 90. 2 Estimated.
Chip Seal Performance Measures Best Practices
Applied Pavement Technology, Inc. 21
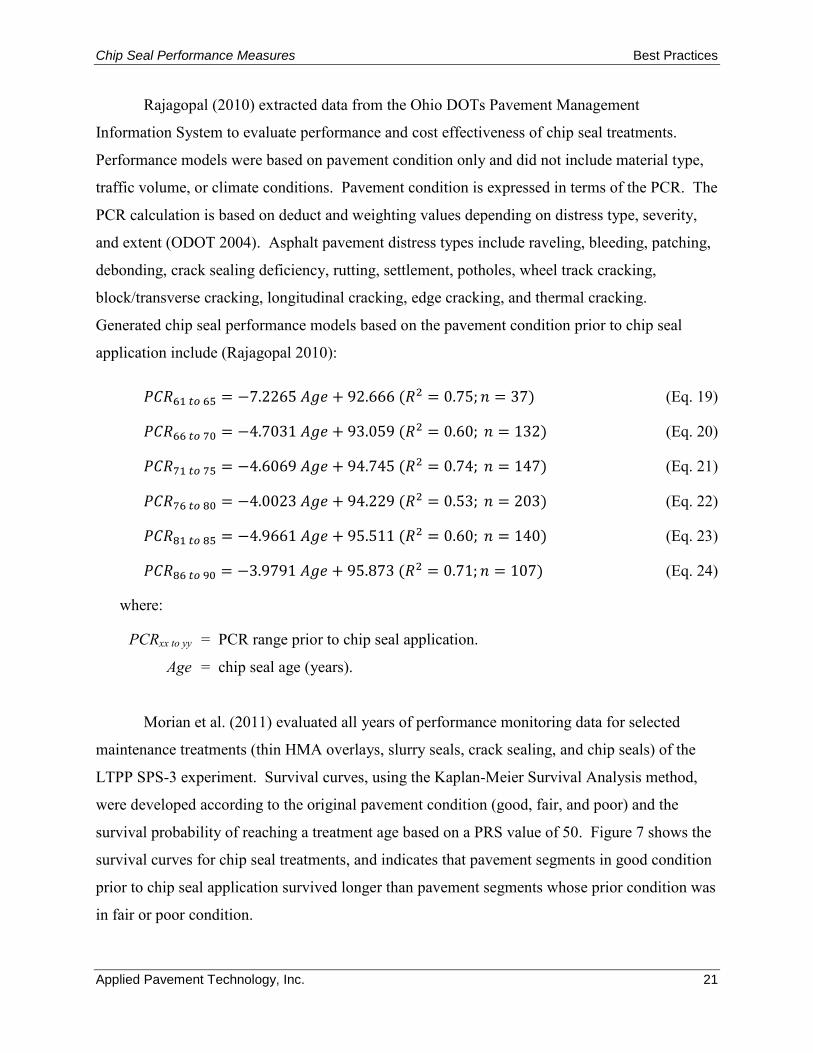
Rajagopal (2010) extracted data from the Ohio DOTs Pavement Management
Information System to evaluate performance and cost effectiveness of chip seal treatments.
Performance models were based on pavement condition only and did not include material type,
traffic volume, or climate conditions. Pavement condition is expressed in terms of the PCR. The
PCR calculation is based on deduct and weighting values depending on distress type, severity,
and extent (ODOT 2004). Asphalt pavement distress types include raveling, bleeding, patching,
debonding, crack sealing deficiency, rutting, settlement, potholes, wheel track cracking,
block/transverse cracking, longitudinal cracking, edge cracking, and thermal cracking.
Generated chip seal performance models based on the pavement condition prior to chip seal
application include (Rajagopal 2010):
𝑀𝑊𝑅61 𝑠𝑉 65 = −7.2265 𝐴𝐴𝐴 + 92.666 (𝑅2 = 0.75;𝐼 = 37) (Eq. 19)
𝑀𝑊𝑅66 𝑠𝑉 70 = −4.7031 𝐴𝐴𝐴 + 93.059 (𝑅2 = 0.60; 𝐼 = 132) (Eq. 20)
𝑀𝑊𝑅71 𝑠𝑉 75 = −4.6069 𝐴𝐴𝐴 + 94.745 (𝑅2 = 0.74; 𝐼 = 147) (Eq. 21)
𝑀𝑊𝑅76 𝑠𝑉 80 = −4.0023 𝐴𝐴𝐴 + 94.229 (𝑅2 = 0.53; 𝐼 = 203) (Eq. 22)
𝑀𝑊𝑅81 𝑠𝑉 85 = −4.9661 𝐴𝐴𝐴 + 95.511 (𝑅2 = 0.60; 𝐼 = 140) (Eq. 23)
𝑀𝑊𝑅86 𝑠𝑉 90 = −3.9791 𝐴𝐴𝐴 + 95.873 (𝑅2 = 0.71;𝐼 = 107) (Eq. 24)
where:
PCRxx to yy = PCR range prior to chip seal application.
Age = chip seal age (years).
Morian et al. (2011) evaluated all years of performance monitoring data for selected
maintenance treatments (thin HMA overlays, slurry seals, crack sealing, and chip seals) of the
LTPP SPS-3 experiment. Survival curves, using the Kaplan-Meier Survival Analysis method,
were developed according to the original pavement condition (good, fair, and poor) and the
survival probability of reaching a treatment age based on a PRS value of 50. Figure 7 shows the
survival curves for chip seal treatments, and indicates that pavement segments in good condition
prior to chip seal application survived longer than pavement segments whose prior condition was
in fair or poor condition.
Best Practices Chip Seal Performance Measures
22 Applied Pavement Technology, Inc.
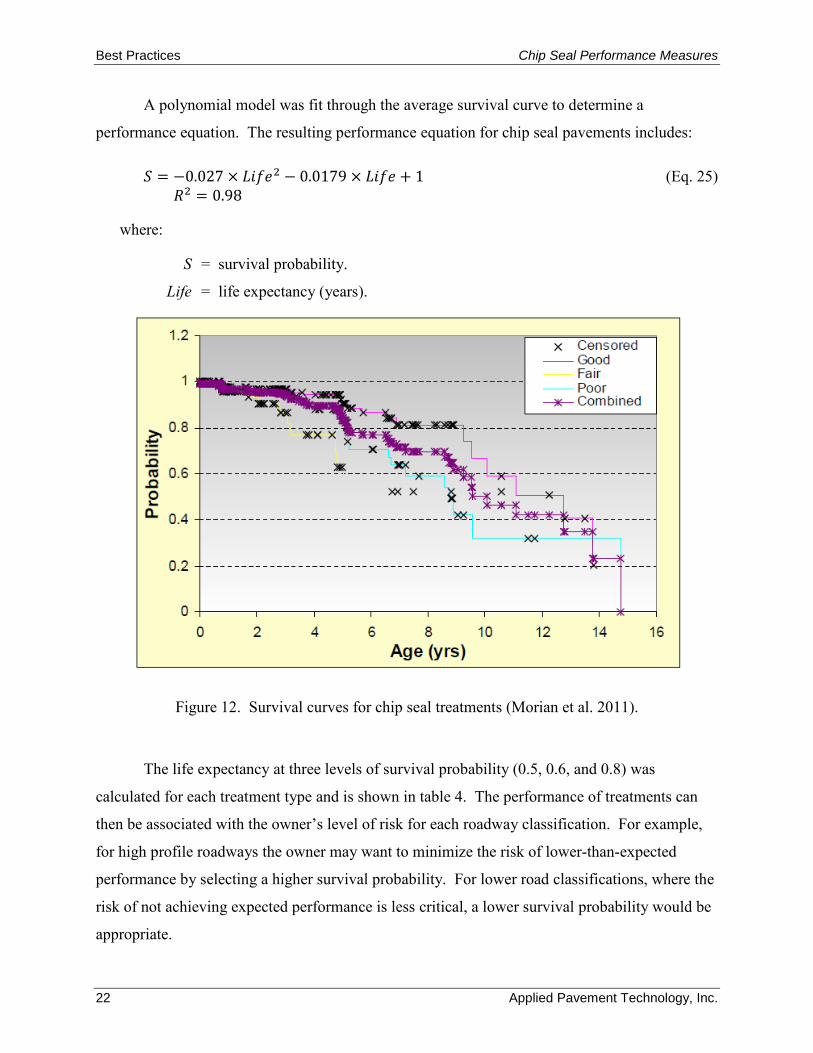
A polynomial model was fit through the average survival curve to determine a
performance equation. The resulting performance equation for chip seal pavements includes:
𝑆 = −0.027 × 𝐴𝑅𝐿𝐴2 − 0.0179 × 𝐴𝑅𝐿𝐴 + 1 (Eq. 25) 𝑅2 = 0.98
where:
S = survival probability.
Life = life expectancy (years).
Figure 12. Survival curves for chip seal treatments (Morian et al. 2011).
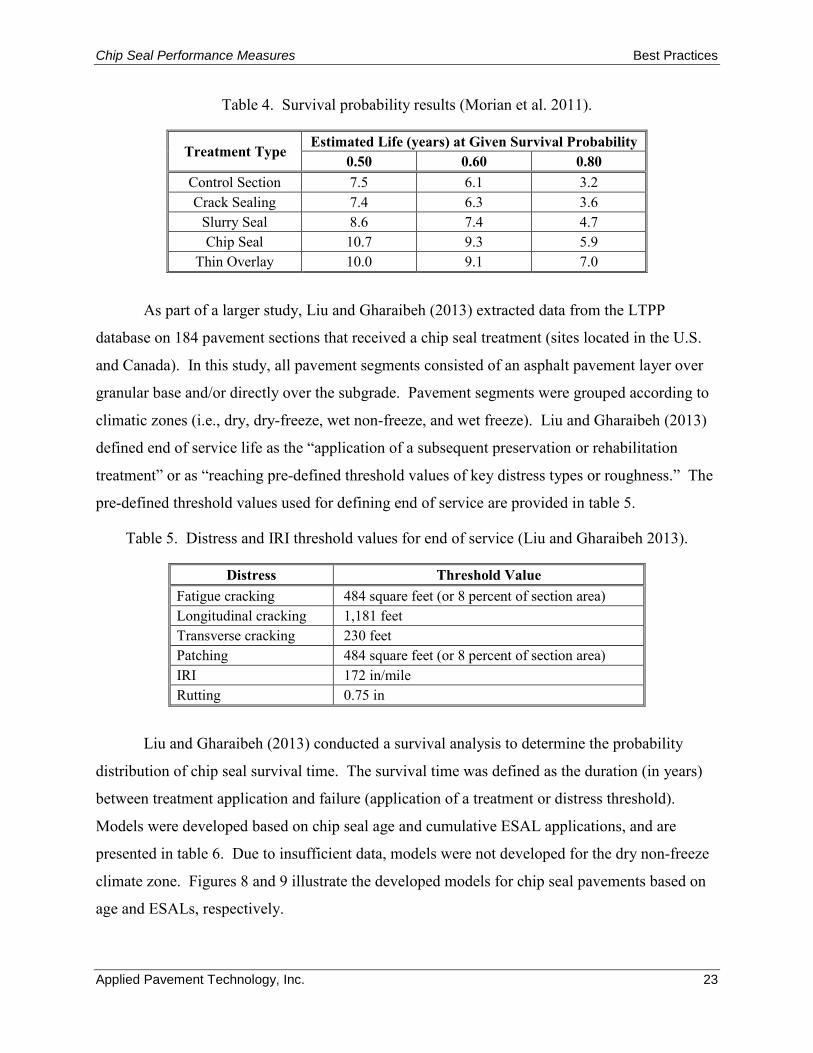
The life expectancy at three levels of survival probability (0.5, 0.6, and 0.8) was
calculated for each treatment type and is shown in table 4. The performance of treatments can
then be associated with the owner’s level of risk for each roadway classification. For example,
for high profile roadways the owner may want to minimize the risk of lower-than-expected
performance by selecting a higher survival probability. For lower road classifications, where the
risk of not achieving expected performance is less critical, a lower survival probability would be
appropriate.
Chip Seal Performance Measures Best Practices
Applied Pavement Technology, Inc. 23
Table 4. Survival probability results (Morian et al. 2011).
Treatment Type Estimated Life (years) at Given Survival Probability
0.50 0.60 0.80 Control Section 7.5 6.1 3.2 Crack Sealing 7.4 6.3 3.6
Slurry Seal 8.6 7.4 4.7 Chip Seal 10.7 9.3 5.9
Thin Overlay 10.0 9.1 7.0
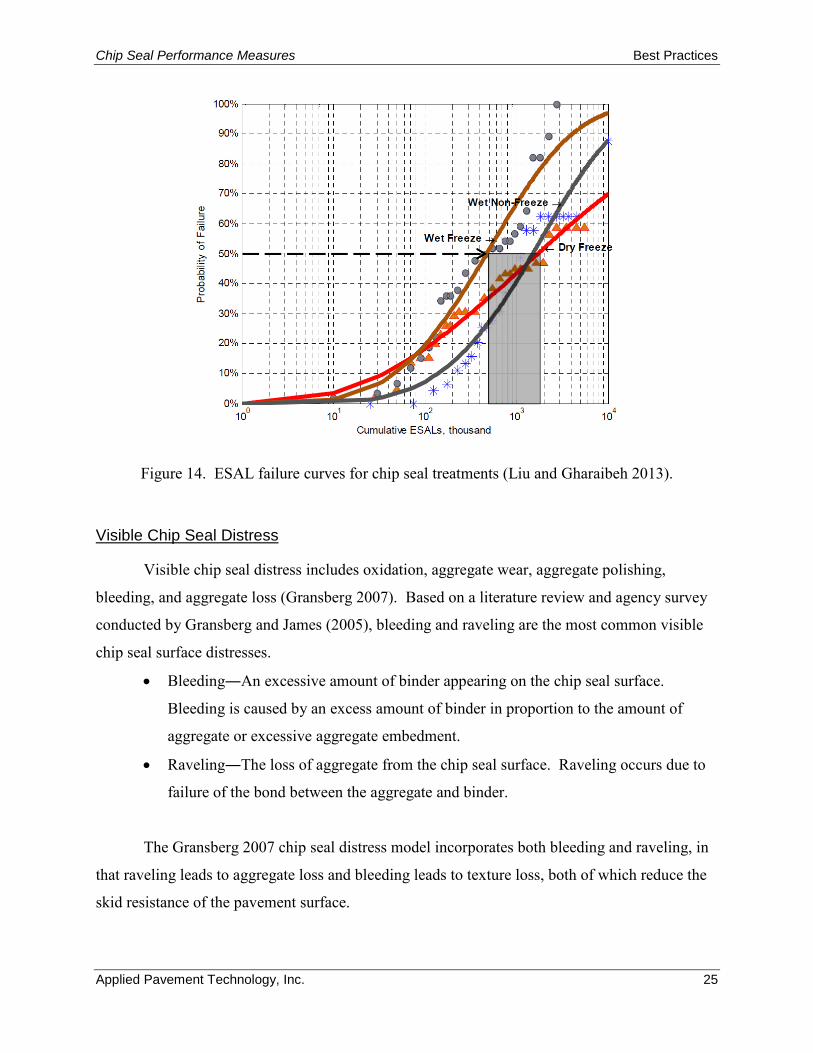
As part of a larger study, Liu and Gharaibeh (2013) extracted data from the LTPP
database on 184 pavement sections that received a chip seal treatment (sites located in the U.S.
and Canada). In this study, all pavement segments consisted of an asphalt pavement layer over
granular base and/or directly over the subgrade. Pavement segments were grouped according to
climatic zones (i.e., dry, dry-freeze, wet non-freeze, and wet freeze). Liu and Gharaibeh (2013)
defined end of service life as the “application of a subsequent preservation or rehabilitation
treatment” or as “reaching pre-defined threshold values of key distress types or roughness.” The
pre-defined threshold values used for defining end of service are provided in table 5.
Table 5. Distress and IRI threshold values for end of service (Liu and Gharaibeh 2013).
Distress Threshold Value Fatigue cracking 484 square feet (or 8 percent of section area) Longitudinal cracking 1,181 feet Transverse cracking 230 feet Patching 484 square feet (or 8 percent of section area) IRI 172 in/mile Rutting 0.75 in
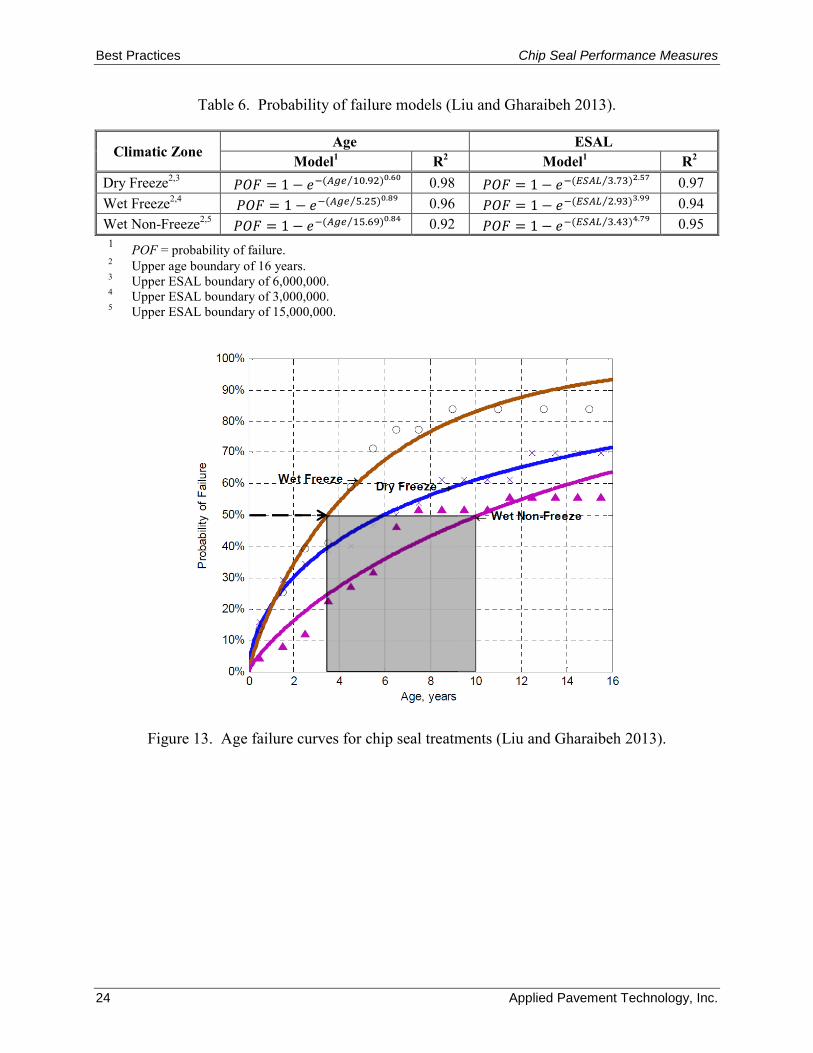
Liu and Gharaibeh (2013) conducted a survival analysis to determine the probability
distribution of chip seal survival time. The survival time was defined as the duration (in years)
between treatment application and failure (application of a treatment or distress threshold).
Models were developed based on chip seal age and cumulative ESAL applications, and are
presented in table 6. Due to insufficient data, models were not developed for the dry non-freeze
climate zone. Figures 8 and 9 illustrate the developed models for chip seal pavements based on
age and ESALs, respectively.
Best Practices Chip Seal Performance Measures
24 Applied Pavement Technology, Inc.
Table 6. Probability of failure models (Liu and Gharaibeh 2013).
Climatic Zone Age ESAL
Model1 R2 Model1 R2 Dry Freeze2,3 𝑀𝑃𝐹 = 1 − 𝐴−(𝐴𝐴𝑃 10.92⁄ )0.60 0.98 𝑀𝑃𝐹 = 1 − 𝐴−(𝐸𝑆𝐴𝐿 3.73⁄ )2.57 0.97 Wet Freeze2,4 𝑀𝑃𝐹 = 1 − 𝐴−(𝐴𝐴𝑃 5.25⁄ )0.89 0.96 𝑀𝑃𝐹 = 1 − 𝐴−(𝐸𝑆𝐴𝐿 2.93⁄ )3.99 0.94 Wet Non-Freeze2,5 𝑀𝑃𝐹 = 1 − 𝐴−(𝐴𝐴𝑃 15.69⁄ )0.84 0.92 𝑀𝑃𝐹 = 1 − 𝐴−(𝐸𝑆𝐴𝐿 3.43⁄ )4.79 0.95 1 POF = probability of failure. 2 Upper age boundary of 16 years. 3 Upper ESAL boundary of 6,000,000. 4 Upper ESAL boundary of 3,000,000. 5 Upper ESAL boundary of 15,000,000.
Figure 13. Age failure curves for chip seal treatments (Liu and Gharaibeh 2013).
Chip Seal Performance Measures Best Practices
Applied Pavement Technology, Inc. 25
Figure 14. ESAL failure curves for chip seal treatments (Liu and Gharaibeh 2013).
Visible Chip Seal Distress
Visible chip seal distress includes oxidation, aggregate wear, aggregate polishing,
bleeding, and aggregate loss (Gransberg 2007). Based on a literature review and agency survey
conducted by Gransberg and James (2005), bleeding and raveling are the most common visible
chip seal surface distresses.
• Bleeding―An excessive amount of binder appearing on the chip seal surface.
Bleeding is caused by an excess amount of binder in proportion to the amount of
aggregate or excessive aggregate embedment.
• Raveling―The loss of aggregate from the chip seal surface. Raveling occurs due to
failure of the bond between the aggregate and binder.
The Gransberg 2007 chip seal distress model incorporates both bleeding and raveling, in
that raveling leads to aggregate loss and bleeding leads to texture loss, both of which reduce the
skid resistance of the pavement surface.
Best Practices Chip Seal Performance Measures
26 Applied Pavement Technology, Inc.
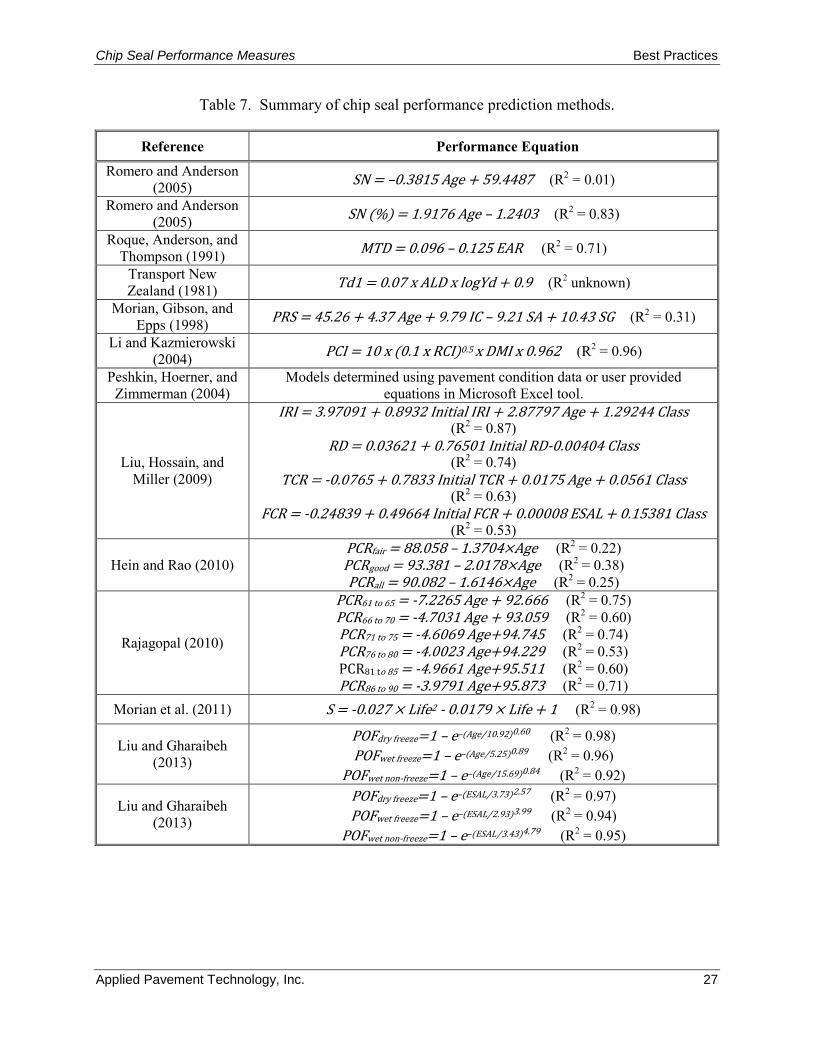
Summary
A number of national and state-level studies on predicting chip seal performance were
reviewed according to engineering-based and qualitative-based performance measures. The
reviewed studies indicated the use of visual surface ratings in a combined distress index,
accompanied by pavement performance prediction equations, as the primary method for
predicting chip seal performance. A summary of scheduled chip seal performance models is
provided in table 7.
Chip Seal Performance Measures Best Practices
Applied Pavement Technology, Inc. 27
Table 7. Summary of chip seal performance prediction methods.
Reference Performance Equation
Romero and Anderson (2005) SN = –0.3815 Age + 59.4487 (R2 = 0.01)
Romero and Anderson (2005) SN (%) = 1.9176 Age – 1.2403 (R2 = 0.83)
Roque, Anderson, and Thompson (1991) MTD = 0.096 – 0.125 EAR (R2 = 0.71)
Transport New Zealand (1981) Td1 = 0.07 x ALD x logYd + 0.9 (R2 unknown)
Morian, Gibson, and Epps (1998) PRS = 45.26 + 4.37 Age + 9.79 IC – 9.21 SA + 10.43 SG (R2 = 0.31)
Li and Kazmierowski (2004) PCI = 10 x (0.1 x RCI)0.5 x DMI x 0.962 (R2 = 0.96)
Peshkin, Hoerner, and Zimmerman (2004)
Models determined using pavement condition data or user provided equations in Microsoft Excel tool.
Liu, Hossain, and Miller (2009)
IRI = 3.97091 + 0.8932 Initial IRI + 2.87797 Age + 1.29244 Class (R2 = 0.87)
RD = 0.03621 + 0.76501 Initial RD-0.00404 Class (R2 = 0.74)
TCR = -0.0765 + 0.7833 Initial TCR + 0.0175 Age + 0.0561 Class (R2 = 0.63)
FCR = -0.24839 + 0.49664 Initial FCR + 0.00008 ESAL + 0.15381 Class (R2 = 0.53)
Hein and Rao (2010) PCRfair = 88.058 – 1.3704×Age (R2 = 0.22) PCRgood = 93.381 – 2.0178×Age (R2 = 0.38) PCRall = 90.082 – 1.6146×Age (R2 = 0.25)
Rajagopal (2010)
PCR61 to 65 = -7.2265 Age + 92.666 (R2 = 0.75) PCR66 to 70 = -4.7031 Age + 93.059 (R2 = 0.60) PCR71 to 75 = -4.6069 Age+94.745 (R2 = 0.74) PCR76 to 80 = -4.0023 Age+94.229 (R2 = 0.53) PCR81 to 85 = -4.9661 Age+95.511 (R2 = 0.60) PCR86 to 90 = -3.9791 Age+95.873 (R2 = 0.71)
Morian et al. (2011) S = -0.027 × Life2 - 0.0179 × Life + 1 (R2 = 0.98)
Liu and Gharaibeh (2013)
POFdry freeze=1 – e–(Age⁄10.92)0.60 (R2 = 0.98) POFwet freeze=1 – e–(Age⁄5.25)0.89 (R2 = 0.96)
POFwet non-freeze=1 – e–(Age⁄15.69)0.84 (R2 = 0.92)
Liu and Gharaibeh (2013)
POFdry freeze=1 – e–(ESAL⁄3.73)2.57 (R2 = 0.97) POFwet freeze=1 – e–(ESAL⁄2.93)3.99 (R2 = 0.94)
POFwet non-freeze=1 – e–(ESAL⁄3.43)4.79 (R2 = 0.95)
Best Practices Chip Seal Performance Measures
28 Applied Pavement Technology, Inc.
CHAPTER 3. SURVEY OF AGENCY CHIP SEAL PRACTICES
Introduction
A survey of agency practices and performance measures was conducted on chip seal
pavements. The agency survey was sent to the Pavement Management Engineer at each U.S.
State Highway Agency and Canadian Provincial Government. The following provides a
summary of the survey results, with more detailed discussions presented in Appendix B. In
total, thirty-seven agencies responded to the survey, thirty-one (or sixty-two percent) U.S. State
Highway Agencies, and six (or sixty percent) Canadian Provincial Governments. The survey
that was sent to the highway agencies is presented in Appendix A.
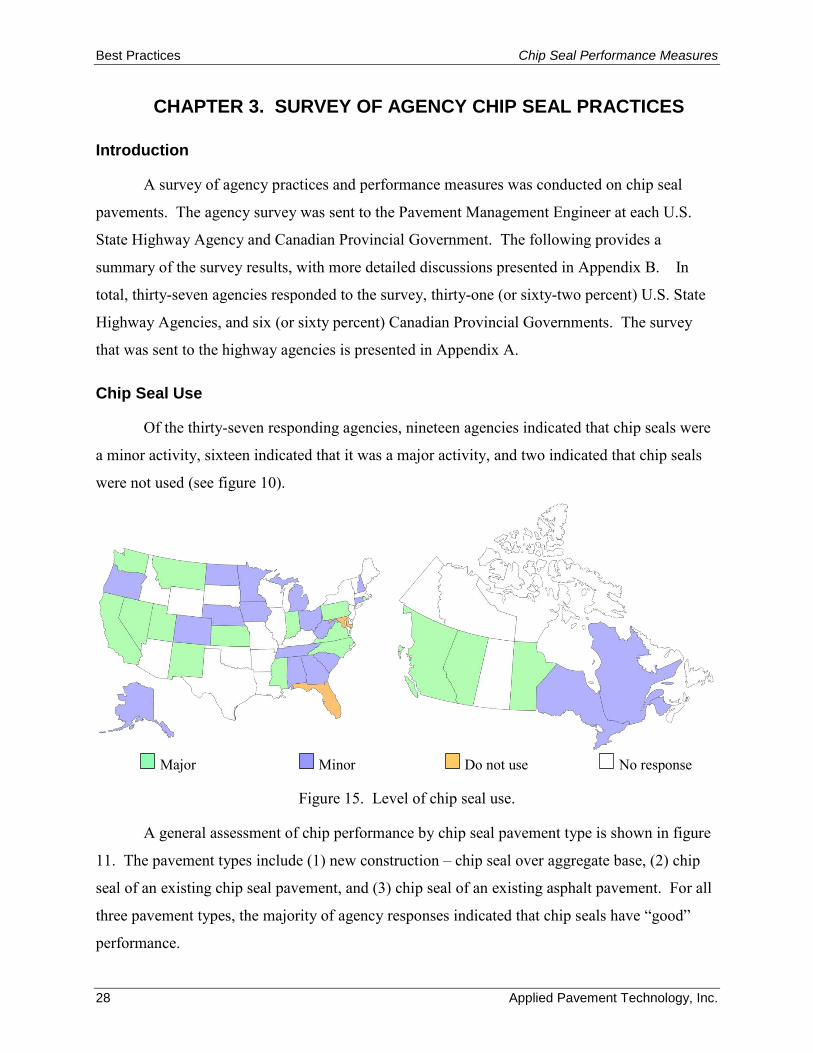
Chip Seal Use
Of the thirty-seven responding agencies, nineteen agencies indicated that chip seals were
a minor activity, sixteen indicated that it was a major activity, and two indicated that chip seals
were not used (see figure 10).
Major Minor Do not use No response
Figure 15. Level of chip seal use.
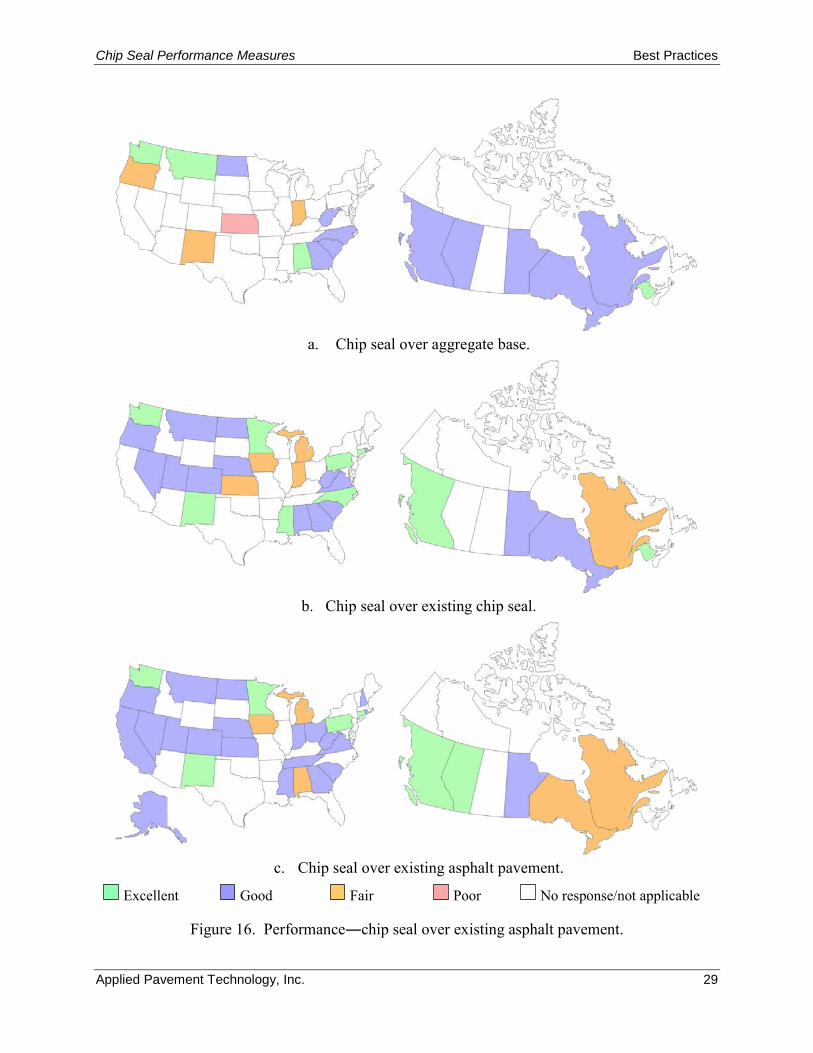
A general assessment of chip performance by chip seal pavement type is shown in figure
11. The pavement types include (1) new construction – chip seal over aggregate base, (2) chip
seal of an existing chip seal pavement, and (3) chip seal of an existing asphalt pavement. For all
three pavement types, the majority of agency responses indicated that chip seals have “good”
performance.
Chip Seal Performance Measures Best Practices
Applied Pavement Technology, Inc. 29
a. Chip seal over aggregate base.
b. Chip seal over existing chip seal.
c. Chip seal over existing asphalt pavement.
Excellent Good Fair Poor No response/not applicable
Figure 16. Performance―chip seal over existing asphalt pavement.
Best Practices Chip Seal Performance Measures
30 Applied Pavement Technology, Inc.
Of the thirty-five agencies that use chip seals, eighteen agencies (fifty-one percent)
indicated that chip seals are used for new construction, twenty-nine agencies (eighty-three
percent) indicated that chip seals are applied to existing chip seal pavements, and thirty-three
agencies (ninety-four percent) indicated that chip seals are applied to existing asphalt pavements.
This indicates that the majority of agencies are using chip seal treatments as part of their
pavement preservation program.
Chip Seal Design and Material Selection
The majority of responding agencies (nineteen) have no formal chip seal design method,
eight agencies use an agency-developed method, five agencies use the McLeod or modified
McLeod method, four agencies base the chip seal design on past performance, and one agency
uses the Asphalt Institute MS-19 method (AI 2009).
The most predominant binder type used is CRS-2P (twenty-one agencies), followed by
CRS-2 (seven agencies), HFRS-2P (four agencies), AC 15P and CRS-2H (two agencies each),
and AC 5, AC 10, AC 20, CRS-1H, and CRS-1P (one agency each).
For aggregate gradation, the eight agencies each indicated the use of 0.5 inch uniformly
graded and 0.375 inch uniformly graded aggregate, followed by 0.5 inch minus well-graded
(three agencies), 0.625 inch minus well-graded and 0.375 inch minus well-graded (two agencies
each), and 0.625 inch uniformly graded (one agency).
Finally, tables 8 and 9 summarize the number of chip seal courses (single, double, or
triple) used for new construction and preservation activities by functional classification,
respectively. For new construction, except for the interstate and dependent on functional
classification, there is a relatively even distribution between single (five to seven agencies) and
double (five to eight agencies) chip seals. However, for preservation treatments, the majority of
agencies use a single chip seal application.
Table 8. Typical number of chip seal courses―new construction.
Course Type
Number of Agencies
Interstate Arterial (Urban)
Arterial (Rural)
Collector (Urban)
Collector (Rural)
Local (Urban)
Local (Rural)
Single 5 5 7 6 7 7 6 Double 2 5 5 5 6 5 8 Triple 0 0 0 0 1 0 1
Chip Seal Performance Measures Best Practices
Applied Pavement Technology, Inc. 31
Table 9. Typical number of chip seal courses―preservation/rehabilitation.
Course Type
Number of Agencies
Interstate Arterial (Urban)
Arterial (Rural)
Collector (Urban)
Collector (Rural)
Local (Urban)
Local (Rural)
Single 11 13 22 15 23 15 25 Double 2 2 4 2 7 3 4
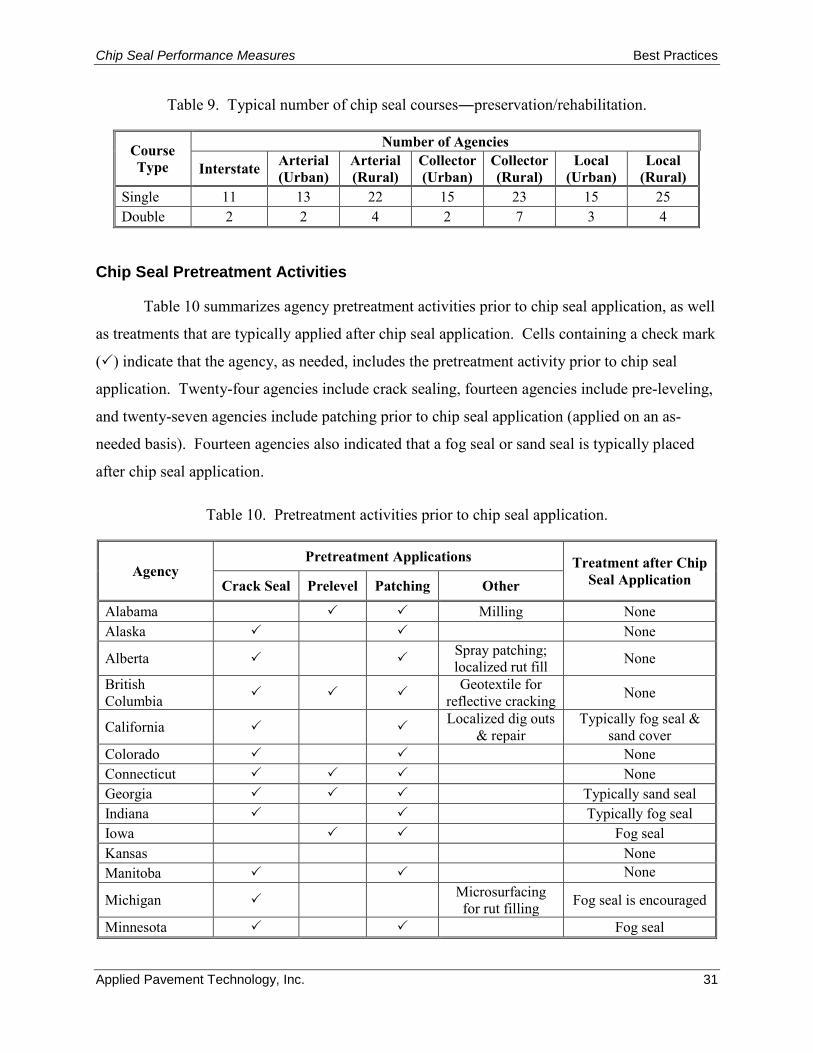
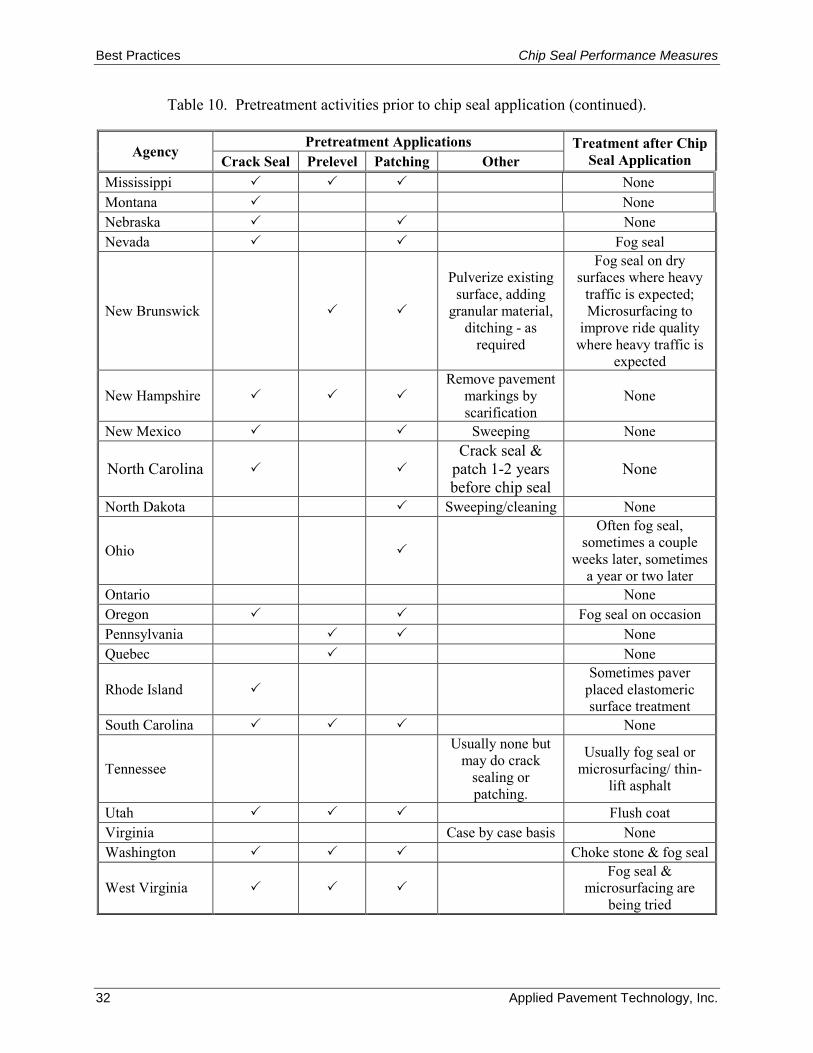
Chip Seal Pretreatment Activities
Table 10 summarizes agency pretreatment activities prior to chip seal application, as well
as treatments that are typically applied after chip seal application. Cells containing a check mark
() indicate that the agency, as needed, includes the pretreatment activity prior to chip seal
application. Twenty-four agencies include crack sealing, fourteen agencies include pre-leveling,
and twenty-seven agencies include patching prior to chip seal application (applied on an as-
needed basis). Fourteen agencies also indicated that a fog seal or sand seal is typically placed
after chip seal application.
Table 10. Pretreatment activities prior to chip seal application.
Agency Pretreatment Applications Treatment after Chip
Seal Application Crack Seal Prelevel Patching Other
Alabama Milling None Alaska None
Alberta Spray patching; localized rut fill None
British Columbia Geotextile for
reflective cracking None
California Localized dig outs & repair
Typically fog seal & sand cover
Colorado None Connecticut None Georgia Typically sand seal Indiana Typically fog seal Iowa Fog seal Kansas None Manitoba None
Michigan Microsurfacing for rut filling Fog seal is encouraged
Minnesota Fog seal
Best Practices Chip Seal Performance Measures
32 Applied Pavement Technology, Inc.
Table 10. Pretreatment activities prior to chip seal application (continued).
Agency Pretreatment Applications Treatment after Chip
Seal Application Crack Seal Prelevel Patching Other Mississippi None Montana None Nebraska None Nevada Fog seal
New Brunswick
Pulverize existing surface, adding
granular material, ditching - as
required
Fog seal on dry surfaces where heavy
traffic is expected; Microsurfacing to
improve ride quality where heavy traffic is
expected
New Hampshire Remove pavement
markings by scarification
None
New Mexico Sweeping None
North Carolina Crack seal &
patch 1-2 years before chip seal
None
North Dakota Sweeping/cleaning None
Ohio
Often fog seal, sometimes a couple
weeks later, sometimes a year or two later
Ontario None Oregon Fog seal on occasion Pennsylvania None Quebec None
Rhode Island Sometimes paver
placed elastomeric surface treatment
South Carolina None
Tennessee
Usually none but may do crack
sealing or patching.
Usually fog seal or microsurfacing/ thin-
lift asphalt
Utah Flush coat Virginia Case by case basis None Washington Choke stone & fog seal
West Virginia Fog seal &
microsurfacing are being tried
Chip Seal Performance Measures Best Practices
Applied Pavement Technology, Inc. 33
Chip Seal Project Selection
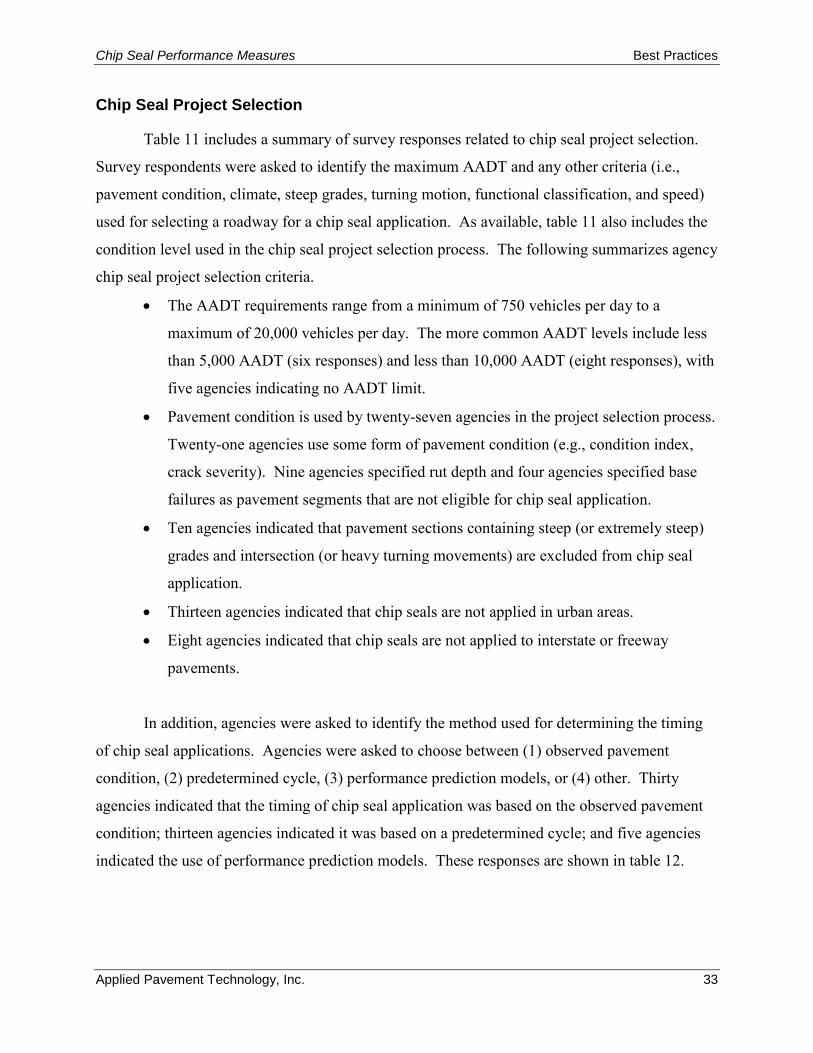
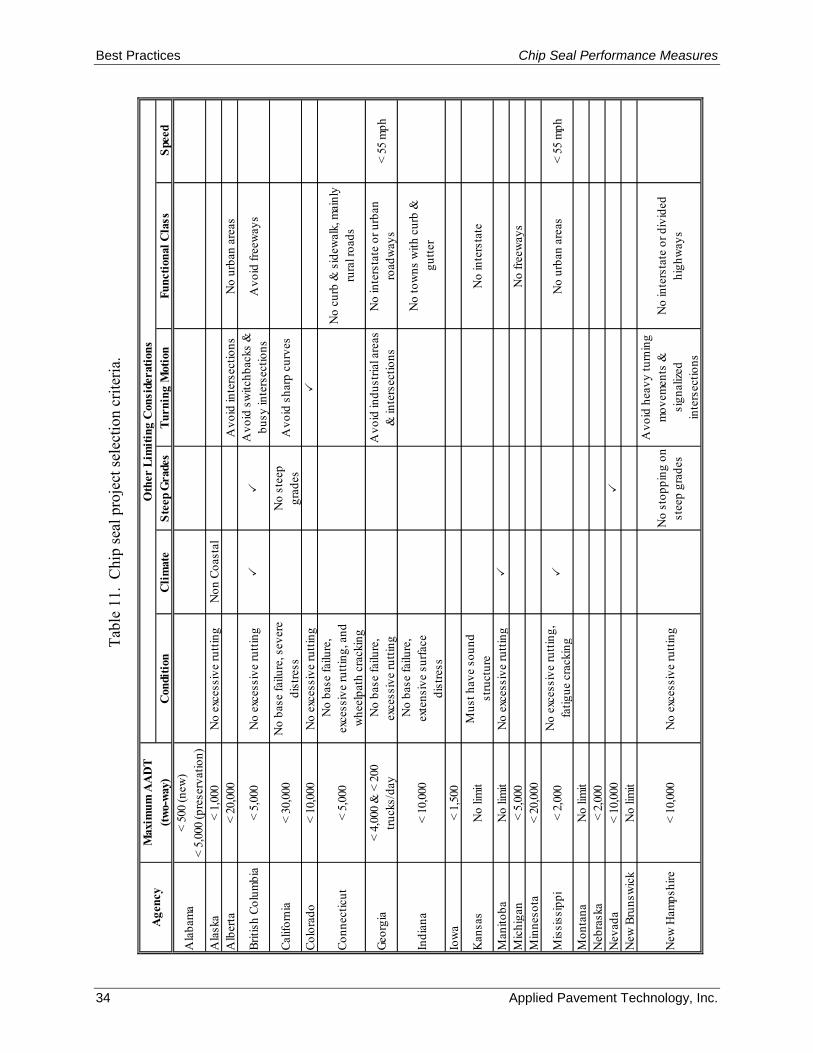
Table 11 includes a summary of survey responses related to chip seal project selection.
Survey respondents were asked to identify the maximum AADT and any other criteria (i.e.,
pavement condition, climate, steep grades, turning motion, functional classification, and speed)
used for selecting a roadway for a chip seal application. As available, table 11 also includes the
condition level used in the chip seal project selection process. The following summarizes agency
chip seal project selection criteria.
• The AADT requirements range from a minimum of 750 vehicles per day to a
maximum of 20,000 vehicles per day. The more common AADT levels include less
than 5,000 AADT (six responses) and less than 10,000 AADT (eight responses), with
five agencies indicating no AADT limit.
• Pavement condition is used by twenty-seven agencies in the project selection process.
Twenty-one agencies use some form of pavement condition (e.g., condition index,
crack severity). Nine agencies specified rut depth and four agencies specified base
failures as pavement segments that are not eligible for chip seal application.
• Ten agencies indicated that pavement sections containing steep (or extremely steep)
grades and intersection (or heavy turning movements) are excluded from chip seal
application.
• Thirteen agencies indicated that chip seals are not applied in urban areas.
• Eight agencies indicated that chip seals are not applied to interstate or freeway
pavements.
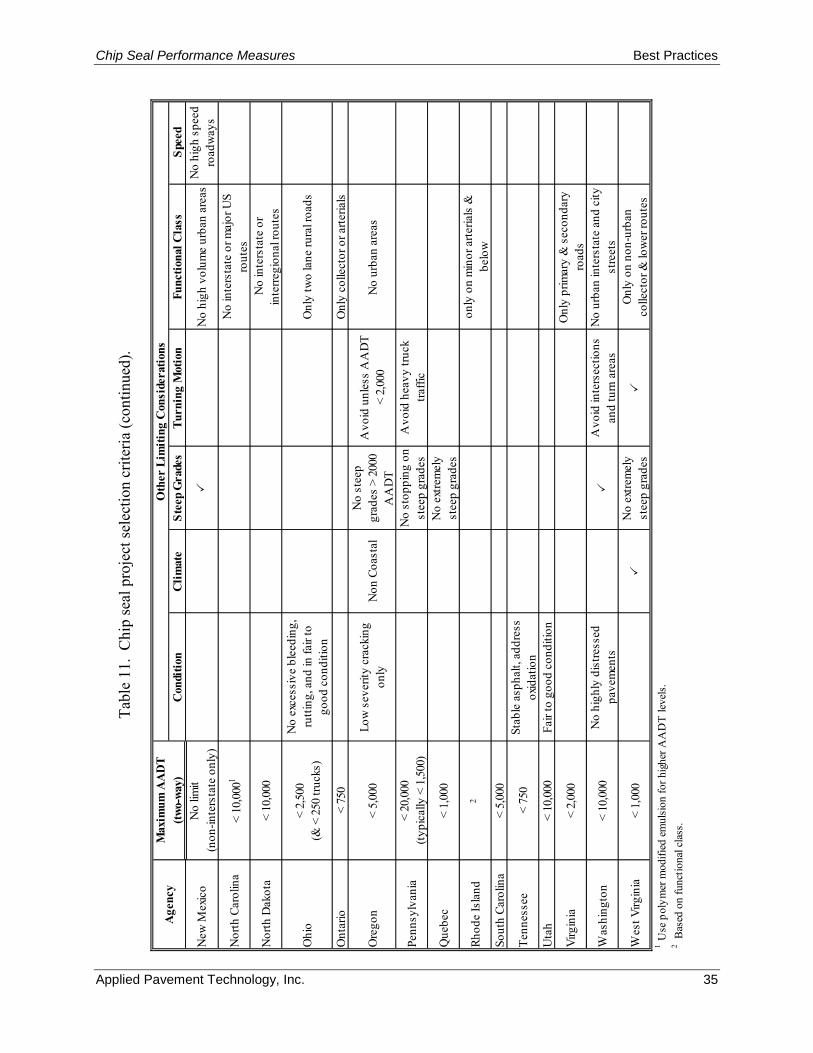
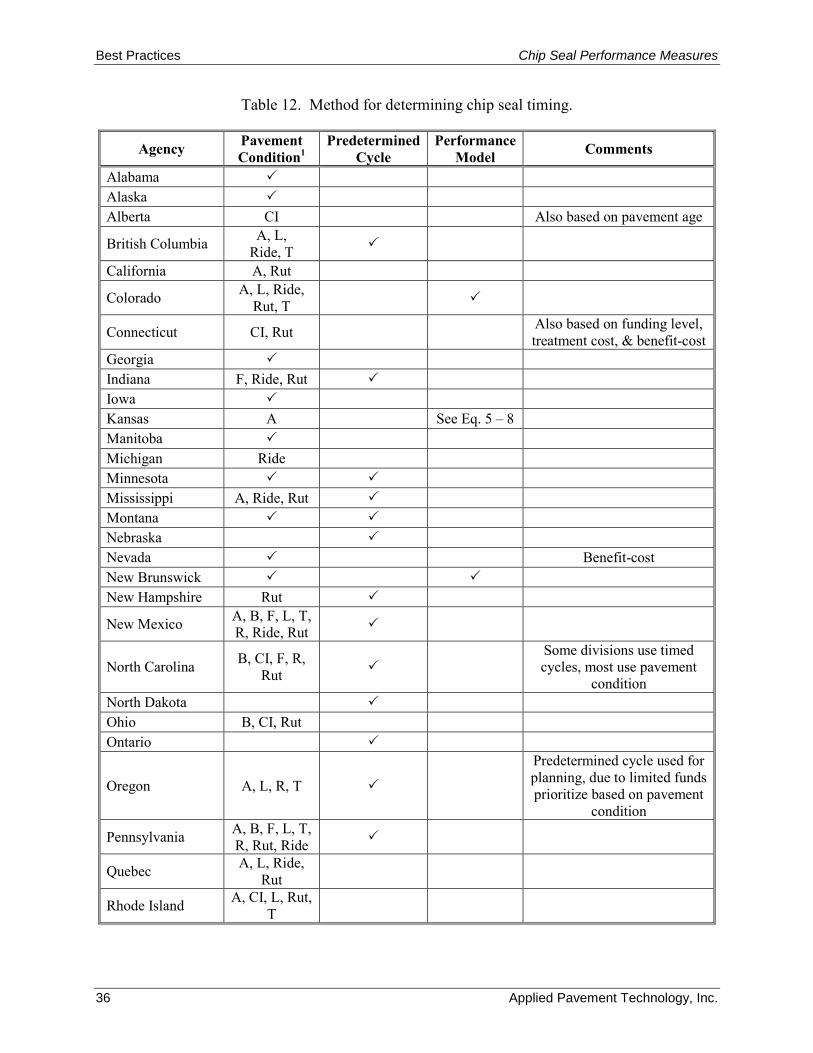
In addition, agencies were asked to identify the method used for determining the timing
of chip seal applications. Agencies were asked to choose between (1) observed pavement
condition, (2) predetermined cycle, (3) performance prediction models, or (4) other. Thirty
agencies indicated that the timing of chip seal application was based on the observed pavement
condition; thirteen agencies indicated it was based on a predetermined cycle; and five agencies
indicated the use of performance prediction models. These responses are shown in table 12.
Best Practices Chip Seal Performance Measures
34 Applied Pavement Technology, Inc.
Max
imum
AA
DT
(two-
way)
Con
ditio
nC
limat
eSt
eep
Gra
des
Turn
ing
Mot
ion
Func
tiona
l Cla
ssSp
eed
< 50
0 (n
ew)
< 5,
000
(pre
serv
atio
n)A
lask
a<
1,00
0N
o ex
cess
ive
rutti
ngN
on C
oast
alA
lber
ta<
20,0
00A
void
inte
rsec
tions
No
urba
n ar
eas
Briti
sh C
olum
bia
< 5,
000
No
exce
ssiv
e ru
tting
Avo
id s
witc
hbac
ks &
bu
sy in
ters
ectio
nsA
void
free
way
s
Calif
orni
a<
30,0
00N
o ba
se fa
ilure
, sev
ere
dist
ress
No
stee
p gr
ades
Avo
id s
harp
cur
ves
Colo
rado
< 10
,000
No
exce
ssiv
e ru
tting
Conn
ectic
ut<
5,00
0N
o ba
se fa
ilure
, ex
cess
ive
rutti
ng, a
nd
whe
elpa
th c
rack
ing
No
curb
& s
idew
alk,
mai
nly
rura
l roa
ds
Indi
ana
< 10
,000
No
base
failu
re,
exte
nsiv
e su
rface
di
stre
ss
No
tow
ns w
ith c
urb
&
gutte
r
Iow
a<
1,50
0
Kan
sas
No
limit
Mus
t hav
e so
und
stru
ctur
eN
o in
ters
tate
Man
itoba
No
limit
No
exce
ssiv
e ru
tting
M
ichi
gan
< 5,
000
No
freew
ays
Min
neso
ta<
20,0
00
Mis
siss
ippi
< 2,
000
No
exce
ssiv
e ru
tting
, fa
tigue
cra
ckin
g
No
urba
n ar
eas
< 55
mph
Mon
tana
No
limit
Neb
rask
a<
2,00
0N
evad
a<
10,0
00
New
Bru
nsw
ick
No
limit
New
Ham
pshi
re<
10,0
00N
o ex
cess
ive
rutti
ngN
o st
oppi
ng o
n st
eep
grad
es
Avo
id h
eavy
turn
ing
mov
emen
ts &
si
gnal
ized
inte
rsec
tions
No
inte
rsta
te o
r div
ided
hi
ghw
ays
< 55
mph
< 4,
000
& <
200
tru
cks/
day
Geor
gia
No
base
failu
re,
exce
ssiv
e ru
tting
Avo
id in
dust
rial a
reas
&
inte
rsec
tions
No
inte
rsta
te o
r urb
an
road
way
s
Age
ncy
Oth
er L
imiti
ng C
onsi
dera
tions
Ala
bam
a
Tabl
e 11
. C
hip
seal
pro
ject
sele
ctio
n cr
iteria
.
Chip Seal Performance Measures Best Practices
Applied Pavement Technology, Inc. 35
Max
imum
AA
DT
(two-
way)
Con
ditio
nC
limat
eSt
eep
Gra
des
Turn
ing
Mot
ion
Func
tiona
l Cla
ssSp
eed
No
limit
(non
-inte
rsta
te o
nly)
Nor
th C
arol
ina
< 10
,000
1N
o in
ters
tate
or m
ajor
US
rout
es
Nor
th D
akot
a<
10,0
00N
o in
ters
tate
or
inte
rregi
onal
rout
es
< 2,
500
(& <
250
truc
ks)
Ont
ario
< 75
0O
nly
colle
ctor
or a
rteria
ls
Ore
gon
< 5,
000
Low
sev
erity
cra
ckin
g on
lyN
on C
oast
alN
o st
eep
grad
es >
200
0 A
AD
T
Avo
id u
nles
s A
AD
T <
2,00
0N
o ur
ban
area
s
< 20
,000
(typi
cally
< 1
,500
)
Que
bec
< 1,
000
No
extre
mel
y
stee
p gr
ades
Rhod
e Is
land
2on
ly o
n m
inor
arte
rials
&
belo
wSo
uth
Caro
lina
< 5,
000
Tenn
esse
e<
750
Stab
le a
spha
lt, a
ddre
ss
oxid
atio
nU
tah
< 10
,000
Fair
to g
ood
cond
ition
Virg
inia
< 2,
000
Onl
y pr
imar
y &
sec
onda
ry
road
s
Was
hing
ton
< 10
,000
No
high
ly d
istre
ssed
pa
vem
ents
A
void
inte
rsec
tions
an
d tu
rn a
reas
No
urba
n in
ters
tate
and
city
st
reet
s
Wes
t Virg
inia
< 1,
000
N
o ex
trem
ely
stee
p gr
ades
O
nly
on n
on-u
rban
co
llect
or &
low
er ro
utes
1 U
se p
olym
er m
odifi
ed e
mul
sion
for h
ighe
r AA
DT
leve
ls.
2 Bas
ed o
n fu
nctio
nal c
lass
.
Penn
sylv
ania
No
stop
ping
on
stee
p gr
ades
Avo
id h
eavy
truc
k tra
ffic
No
high
spe
ed
road
way
s
Ohi
oN
o ex
cess
ive
blee
ding
, ru
tting
, and
in fa
ir to
go
od c
ondi
tion
Onl
y tw
o la
ne ru
ral r
oads
Age
ncy
Oth
er L
imiti
ng C
onsi
dera
tions
New
Mex
ico
N
o hi
gh v
olum
e ur
ban
area
s
Tabl
e 11
. C
hip
seal
pro
ject
sele
ctio
n cr
iteria
(con
tinue
d).
Best Practices Chip Seal Performance Measures
36 Applied Pavement Technology, Inc.
Table 12. Method for determining chip seal timing.
Agency Pavement Condition1
Predetermined Cycle
Performance Model Comments
Alabama Alaska Alberta CI Also based on pavement age
British Columbia A, L, Ride, T
California A, Rut
Colorado A, L, Ride, Rut, T
Connecticut CI, Rut Also based on funding level, treatment cost, & benefit-cost
Georgia Indiana F, Ride, Rut Iowa Kansas A See Eq. 5 – 8 Manitoba Michigan Ride Minnesota Mississippi A, Ride, Rut Montana Nebraska Nevada Benefit-cost New Brunswick New Hampshire Rut
New Mexico A, B, F, L, T, R, Ride, Rut
North Carolina B, CI, F, R, Rut
Some divisions use timed cycles, most use pavement
condition North Dakota Ohio B, CI, Rut Ontario
Oregon A, L, R, T
Predetermined cycle used for planning, due to limited funds prioritize based on pavement
condition
Pennsylvania A, B, F, L, T, R, Rut, Ride
Quebec A, L, Ride, Rut
Rhode Island A, CI, L, Rut, T
Chip Seal Performance Measures Best Practices
Applied Pavement Technology, Inc. 37
Table 12. Method for determining chip seal timing (continued).
Agency Pavement Condition1
Predetermined Cycle
Performance Model Comments
Tennessee CI Utah Virginia Washington
West Virginia A, B, CI, L, T, R, Ride
A – alligator cracking; B – bleeding; CI – combined condition index; F – friction; L – longitudinal cracking; R – raveling/weathering; Ride – roughness; Rut – rut depth; and T – transverse cracking.
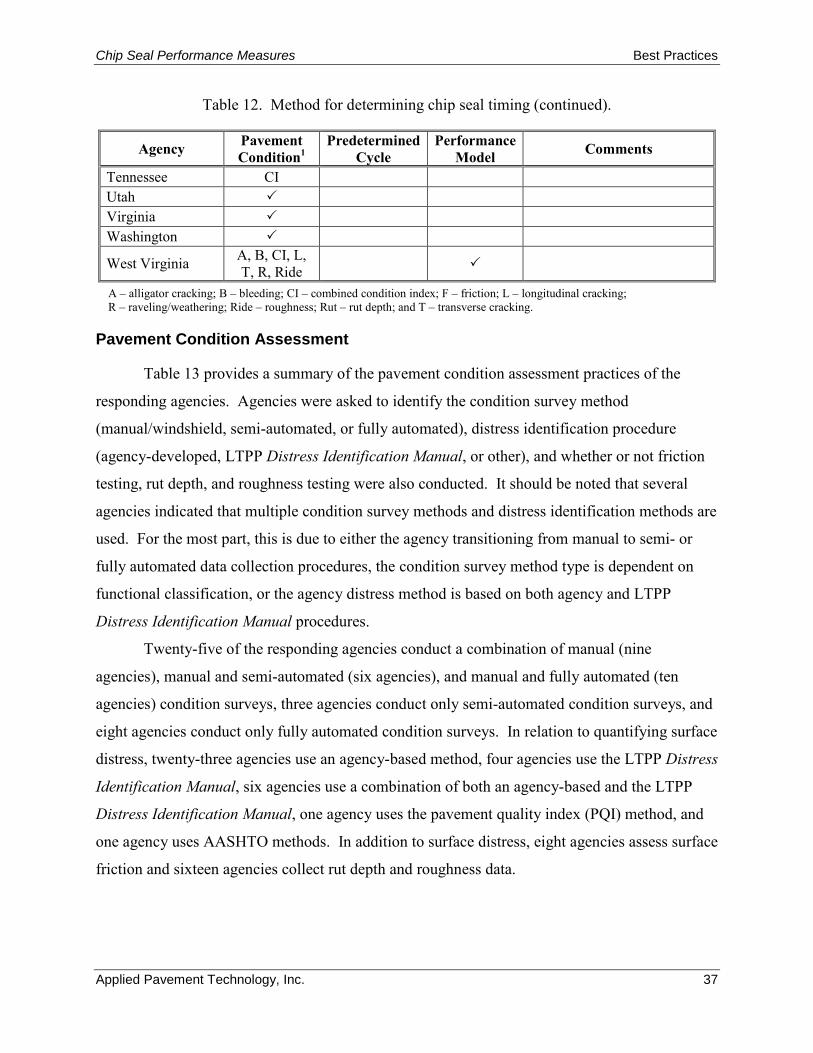
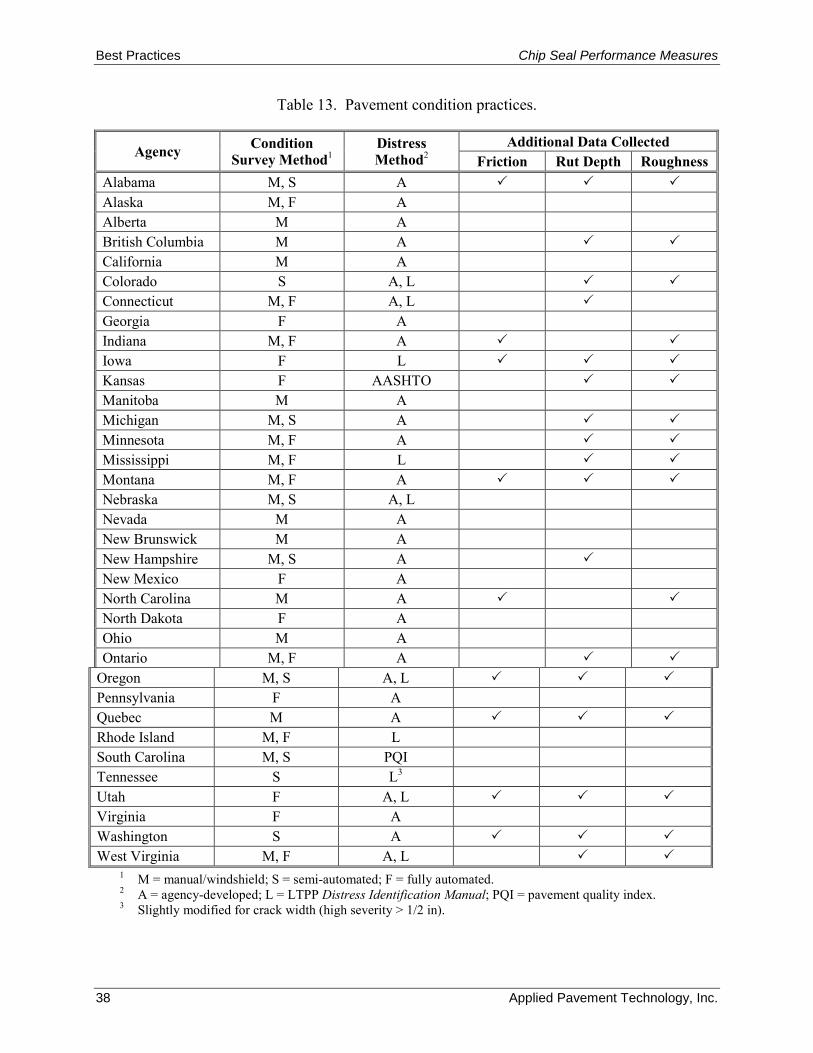
Pavement Condition Assessment
Table 13 provides a summary of the pavement condition assessment practices of the
responding agencies. Agencies were asked to identify the condition survey method
(manual/windshield, semi-automated, or fully automated), distress identification procedure
(agency-developed, LTPP Distress Identification Manual, or other), and whether or not friction
testing, rut depth, and roughness testing were also conducted. It should be noted that several
agencies indicated that multiple condition survey methods and distress identification methods are
used. For the most part, this is due to either the agency transitioning from manual to semi- or
fully automated data collection procedures, the condition survey method type is dependent on
functional classification, or the agency distress method is based on both agency and LTPP
Distress Identification Manual procedures.
Twenty-five of the responding agencies conduct a combination of manual (nine
agencies), manual and semi-automated (six agencies), and manual and fully automated (ten
agencies) condition surveys, three agencies conduct only semi-automated condition surveys, and
eight agencies conduct only fully automated condition surveys. In relation to quantifying surface
distress, twenty-three agencies use an agency-based method, four agencies use the LTPP Distress
Identification Manual, six agencies use a combination of both an agency-based and the LTPP
Distress Identification Manual, one agency uses the pavement quality index (PQI) method, and
one agency uses AASHTO methods. In addition to surface distress, eight agencies assess surface
friction and sixteen agencies collect rut depth and roughness data.
Best Practices Chip Seal Performance Measures
38 Applied Pavement Technology, Inc.
Table 13. Pavement condition practices.
Agency Condition Survey Method1
Distress Method2
Additional Data Collected Friction Rut Depth Roughness
Alabama M, S A Alaska M, F A Alberta M A British Columbia M A California M A Colorado S A, L Connecticut M, F A, L Georgia F A Indiana M, F A Iowa F L Kansas F AASHTO Manitoba M A Michigan M, S A Minnesota M, F A Mississippi M, F L Montana M, F A Nebraska M, S A, L Nevada M A New Brunswick M A New Hampshire M, S A New Mexico F A North Carolina M A North Dakota F A Ohio M A Ontario M, F A
Oregon M, S A, L Pennsylvania F A Quebec M A Rhode Island M, F L South Carolina M, S PQI Tennessee S L3 Utah F A, L Virginia F A Washington S A West Virginia M, F A, L
1 M = manual/windshield; S = semi-automated; F = fully automated. 2 A = agency-developed; L = LTPP Distress Identification Manual; PQI = pavement quality index. 3 Slightly modified for crack width (high severity > 1/2 in).
Chip Seal Performance Measures Best Practices
Applied Pavement Technology, Inc. 39
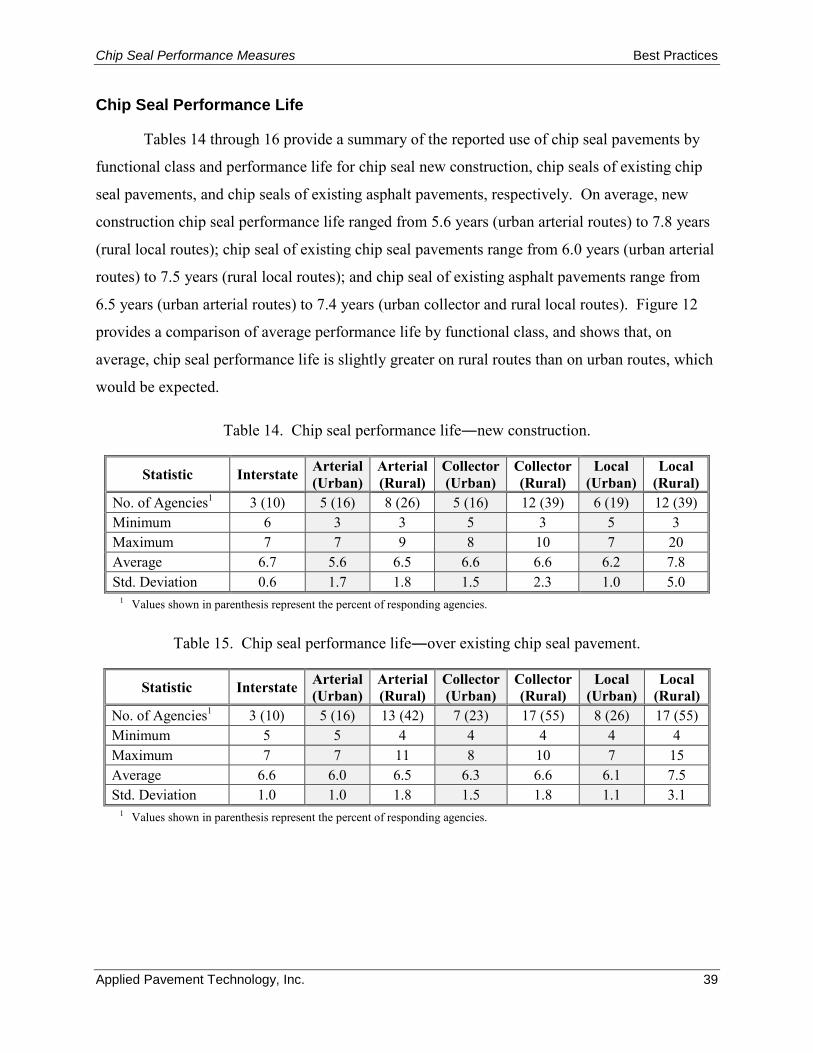
Chip Seal Performance Life
Tables 14 through 16 provide a summary of the reported use of chip seal pavements by
functional class and performance life for chip seal new construction, chip seals of existing chip
seal pavements, and chip seals of existing asphalt pavements, respectively. On average, new
construction chip seal performance life ranged from 5.6 years (urban arterial routes) to 7.8 years
(rural local routes); chip seal of existing chip seal pavements range from 6.0 years (urban arterial
routes) to 7.5 years (rural local routes); and chip seal of existing asphalt pavements range from
6.5 years (urban arterial routes) to 7.4 years (urban collector and rural local routes). Figure 12
provides a comparison of average performance life by functional class, and shows that, on
average, chip seal performance life is slightly greater on rural routes than on urban routes, which
would be expected.
Table 14. Chip seal performance life―new construction.
Statistic Interstate Arterial (Urban)
Arterial (Rural)
Collector (Urban)
Collector (Rural)
Local (Urban)
Local (Rural)
No. of Agencies1 3 (10) 5 (16) 8 (26) 5 (16) 12 (39) 6 (19) 12 (39) Minimum 6 3 3 5 3 5 3 Maximum 7 7 9 8 10 7 20 Average 6.7 5.6 6.5 6.6 6.6 6.2 7.8 Std. Deviation 0.6 1.7 1.8 1.5 2.3 1.0 5.0
1 Values shown in parenthesis represent the percent of responding agencies.
Table 15. Chip seal performance life―over existing chip seal pavement.
Statistic Interstate Arterial (Urban)
Arterial (Rural)
Collector (Urban)
Collector (Rural)
Local (Urban)
Local (Rural)
No. of Agencies1 3 (10) 5 (16) 13 (42) 7 (23) 17 (55) 8 (26) 17 (55) Minimum 5 5 4 4 4 4 4 Maximum 7 7 11 8 10 7 15 Average 6.6 6.0 6.5 6.3 6.6 6.1 7.5 Std. Deviation 1.0 1.0 1.8 1.5 1.8 1.1 3.1
1 Values shown in parenthesis represent the percent of responding agencies.
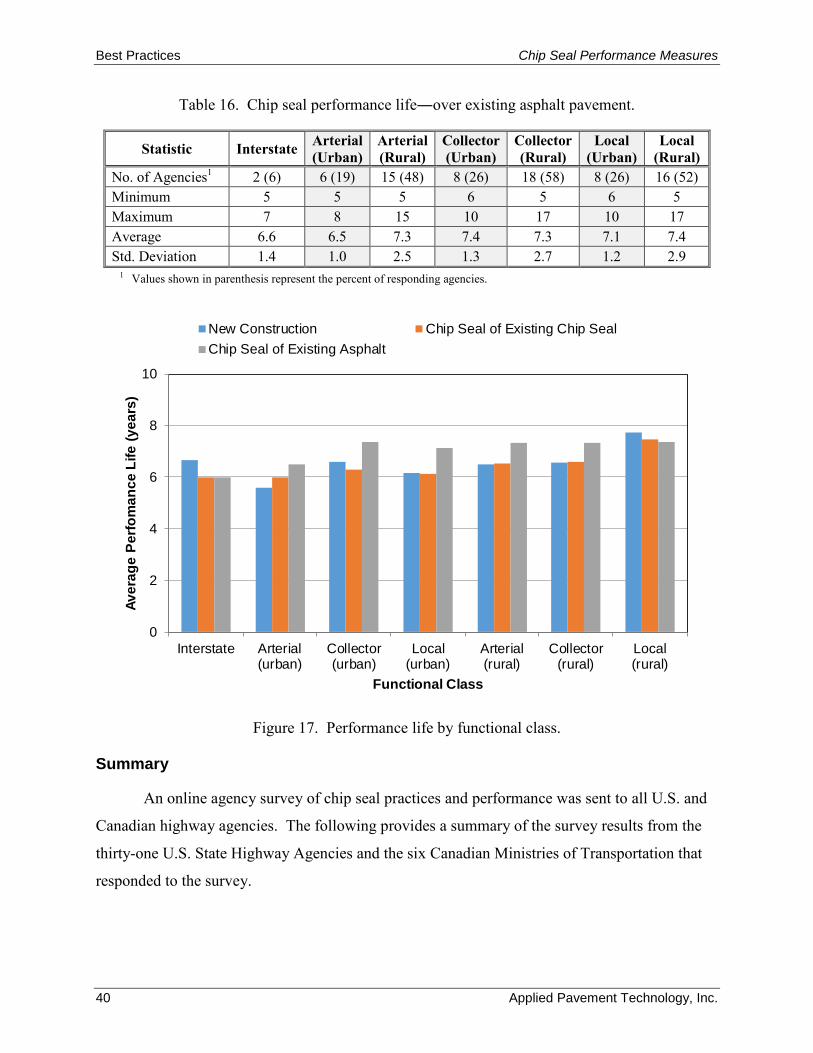
Best Practices Chip Seal Performance Measures
40 Applied Pavement Technology, Inc.
Table 16. Chip seal performance life―over existing asphalt pavement.
Statistic Interstate Arterial (Urban)
Arterial (Rural)
Collector (Urban)
Collector (Rural)
Local (Urban)
Local (Rural)
No. of Agencies1 2 (6) 6 (19) 15 (48) 8 (26) 18 (58) 8 (26) 16 (52) Minimum 5 5 5 6 5 6 5 Maximum 7 8 15 10 17 10 17 Average 6.6 6.5 7.3 7.4 7.3 7.1 7.4 Std. Deviation 1.4 1.0 2.5 1.3 2.7 1.2 2.9
1 Values shown in parenthesis represent the percent of responding agencies.
Figure 17. Performance life by functional class.
Summary
An online agency survey of chip seal practices and performance was sent to all U.S. and
Canadian highway agencies. The following provides a summary of the survey results from the
thirty-one U.S. State Highway Agencies and the six Canadian Ministries of Transportation that
responded to the survey.
0
2
4
6
8
10
Interstate Arterial(urban)
Collector(urban)
Local(urban)
Arterial(rural)
Collector(rural)
Local(rural)
Aver
age
Perfo
man
ce L
ife (y
ears
)
Functional Class
New Construction Chip Seal of Existing Chip SealChip Seal of Existing Asphalt
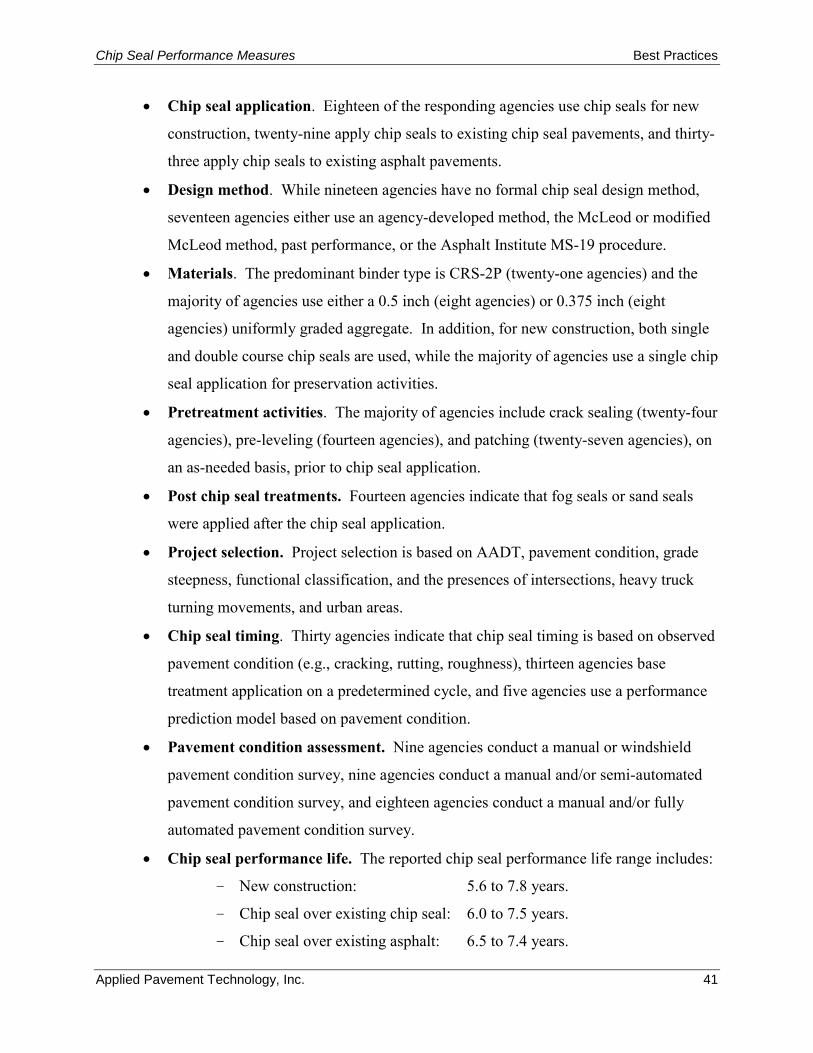
Chip Seal Performance Measures Best Practices
Applied Pavement Technology, Inc. 41
• Chip seal application. Eighteen of the responding agencies use chip seals for new
construction, twenty-nine apply chip seals to existing chip seal pavements, and thirty-
three apply chip seals to existing asphalt pavements.
• Design method. While nineteen agencies have no formal chip seal design method,
seventeen agencies either use an agency-developed method, the McLeod or modified
McLeod method, past performance, or the Asphalt Institute MS-19 procedure.
• Materials. The predominant binder type is CRS-2P (twenty-one agencies) and the
majority of agencies use either a 0.5 inch (eight agencies) or 0.375 inch (eight
agencies) uniformly graded aggregate. In addition, for new construction, both single
and double course chip seals are used, while the majority of agencies use a single chip
seal application for preservation activities.
• Pretreatment activities. The majority of agencies include crack sealing (twenty-four
agencies), pre-leveling (fourteen agencies), and patching (twenty-seven agencies), on
an as-needed basis, prior to chip seal application.
• Post chip seal treatments. Fourteen agencies indicate that fog seals or sand seals
were applied after the chip seal application.
• Project selection. Project selection is based on AADT, pavement condition, grade
steepness, functional classification, and the presences of intersections, heavy truck
turning movements, and urban areas.
• Chip seal timing. Thirty agencies indicate that chip seal timing is based on observed
pavement condition (e.g., cracking, rutting, roughness), thirteen agencies base
treatment application on a predetermined cycle, and five agencies use a performance
prediction model based on pavement condition.
• Pavement condition assessment. Nine agencies conduct a manual or windshield
pavement condition survey, nine agencies conduct a manual and/or semi-automated
pavement condition survey, and eighteen agencies conduct a manual and/or fully
automated pavement condition survey.
• Chip seal performance life. The reported chip seal performance life range includes:
- New construction: 5.6 to 7.8 years.
- Chip seal over existing chip seal: 6.0 to 7.5 years.
- Chip seal over existing asphalt: 6.5 to 7.4 years.
Best Practices Chip Seal Performance Measures
42 Applied Pavement Technology, Inc.
CHAPTER 4. WSDOT PAVEMENT CONDITION AND PERFORMANCE MODELING TECHNIQUES
Introduction
State Highway Agencies (SHA) continually seek to develop, refine, and modify
pavement performance prediction models to improve their overall ability to effectively manage
their pavement network. The level of sophistication, data requirements, and modeling
techniques can vary significantly depending on the specific needs and capabilities of the SHA.
Pavement performance can be modeled according to individual pavement sections or
groups of pavements with similar characteristics (referred to as families). Reliable performance
prediction models are a critical element in pavement management systems. Specifically,
performance prediction models are used to:
• Estimate future pavement conditions.
• Identify the appropriate timing for pavement preservation and rehabilitation activities.
• Identify the most cost-effective treatment strategy for pavements on the network
level.
• Estimate statewide pavement preservation and rehabilitation needs required to
address agency-specified goals, objectives, and constraints.
• Demonstrate the consequences of different pavement investment strategies and
funding scenarios.
• Plan future pavement programs.
The performance prediction models serve as the cornerstone in guiding highway agencies
to make more informed decisions regarding the preservation and rehabilitation of the pavement
network. Thus, it is important that the prediction models are not only reliable but also reflect the
actual pavement performance. The more accurately the performance prediction models reflect
agency-specific deterioration patterns, the less likely that the pavement management system is to
misrepresent future condition levels or the impacts of various construction programs.
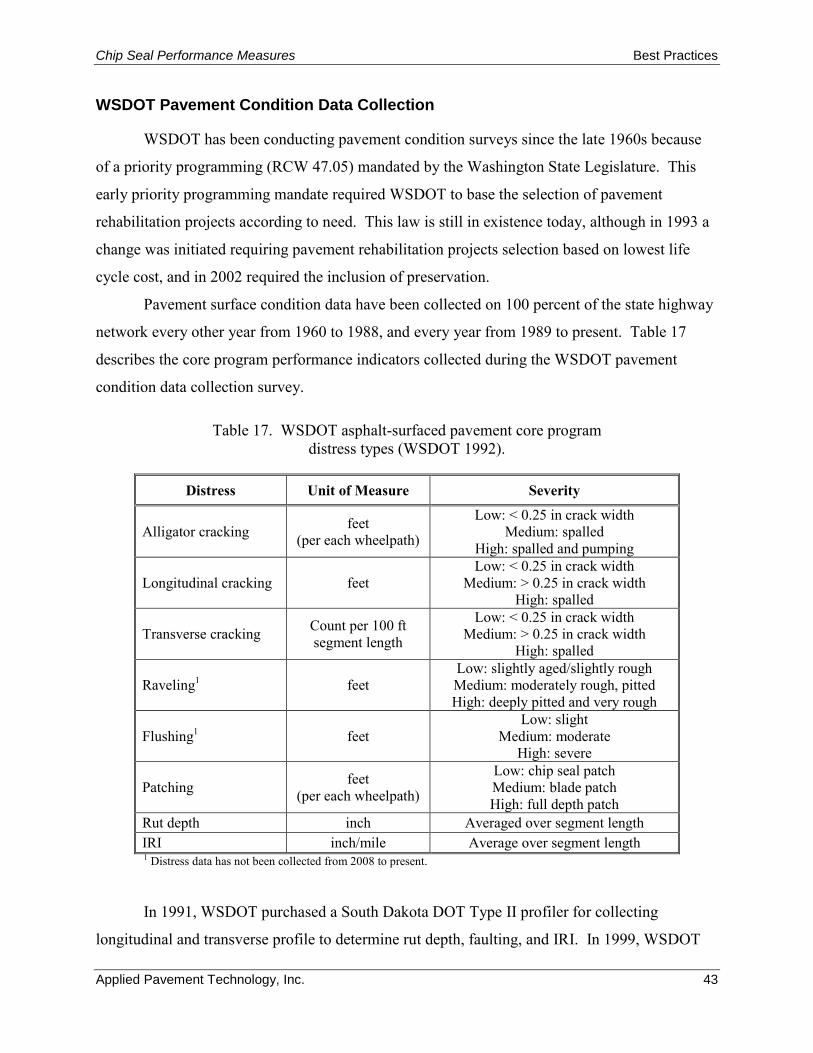
Chip Seal Performance Measures Best Practices
Applied Pavement Technology, Inc. 43
WSDOT Pavement Condition Data Collection
WSDOT has been conducting pavement condition surveys since the late 1960s because
of a priority programming (RCW 47.05) mandated by the Washington State Legislature. This
early priority programming mandate required WSDOT to base the selection of pavement
rehabilitation projects according to need. This law is still in existence today, although in 1993 a
change was initiated requiring pavement rehabilitation projects selection based on lowest life
cycle cost, and in 2002 required the inclusion of preservation.
Pavement surface condition data have been collected on 100 percent of the state highway
network every other year from 1960 to 1988, and every year from 1989 to present. Table 17
describes the core program performance indicators collected during the WSDOT pavement
condition data collection survey.
Table 17. WSDOT asphalt-surfaced pavement core program distress types (WSDOT 1992).
Distress Unit of Measure Severity
Alligator cracking feet (per each wheelpath)
Low: < 0.25 in crack width Medium: spalled
High: spalled and pumping
Longitudinal cracking feet Low: < 0.25 in crack width
Medium: > 0.25 in crack width High: spalled
Transverse cracking Count per 100 ft segment length
Low: < 0.25 in crack width Medium: > 0.25 in crack width
High: spalled
Raveling1 feet Low: slightly aged/slightly rough Medium: moderately rough, pitted High: deeply pitted and very rough
Flushing1 feet Low: slight
Medium: moderate High: severe
Patching feet (per each wheelpath)
Low: chip seal patch Medium: blade patch High: full depth patch
Rut depth inch Averaged over segment length IRI inch/mile Average over segment length 1 Distress data has not been collected from 2008 to present.
In 1991, WSDOT purchased a South Dakota DOT Type II profiler for collecting
longitudinal and transverse profile to determine rut depth, faulting, and IRI. In 1999, WSDOT
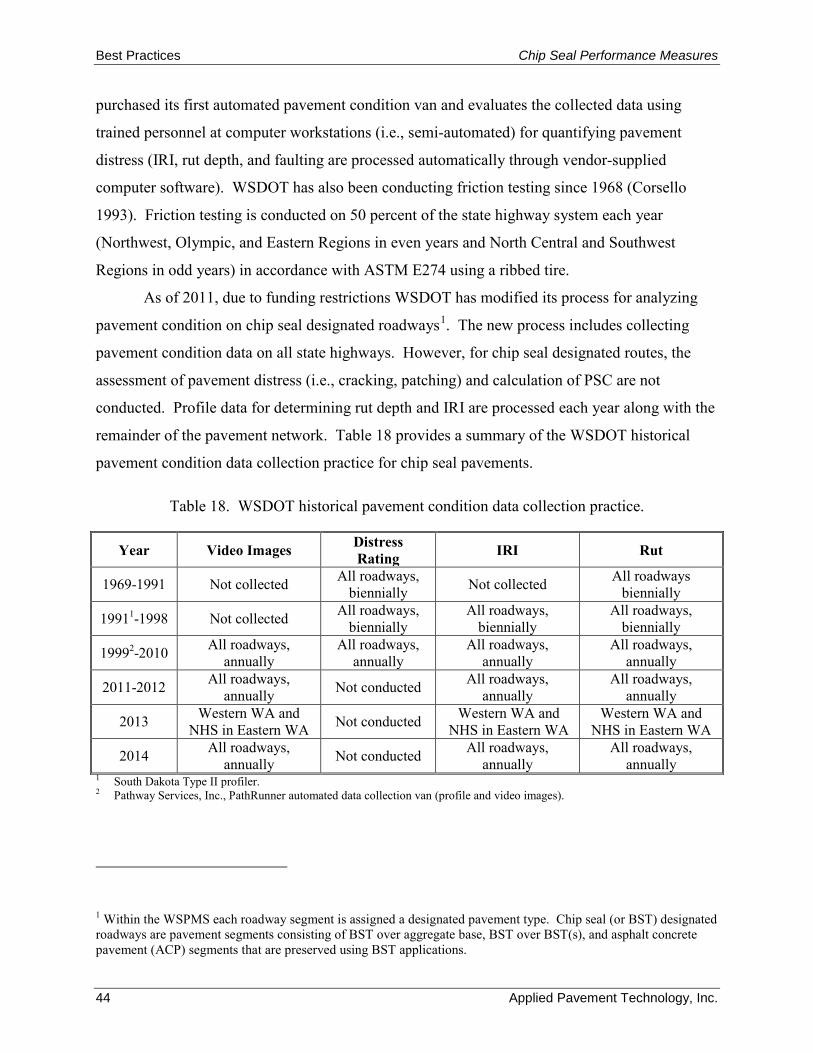
Best Practices Chip Seal Performance Measures
44 Applied Pavement Technology, Inc.
purchased its first automated pavement condition van and evaluates the collected data using
trained personnel at computer workstations (i.e., semi-automated) for quantifying pavement
distress (IRI, rut depth, and faulting are processed automatically through vendor-supplied
computer software). WSDOT has also been conducting friction testing since 1968 (Corsello
1993). Friction testing is conducted on 50 percent of the state highway system each year
(Northwest, Olympic, and Eastern Regions in even years and North Central and Southwest
Regions in odd years) in accordance with ASTM E274 using a ribbed tire.
As of 2011, due to funding restrictions WSDOT has modified its process for analyzing
pavement condition on chip seal designated roadways1. The new process includes collecting
pavement condition data on all state highways. However, for chip seal designated routes, the
assessment of pavement distress (i.e., cracking, patching) and calculation of PSC are not
conducted. Profile data for determining rut depth and IRI are processed each year along with the
remainder of the pavement network. Table 18 provides a summary of the WSDOT historical
pavement condition data collection practice for chip seal pavements.
Table 18. WSDOT historical pavement condition data collection practice.
Year Video Images Distress Rating IRI Rut
1969-1991 Not collected All roadways, biennially Not collected All roadways
biennially
19911-1998 Not collected All roadways, biennially
All roadways, biennially
All roadways, biennially
19992-2010 All roadways, annually
All roadways, annually
All roadways, annually
All roadways, annually
2011-2012 All roadways, annually Not conducted All roadways,
annually All roadways,
annually
2013 Western WA and NHS in Eastern WA Not conducted Western WA and
NHS in Eastern WA Western WA and
NHS in Eastern WA
2014 All roadways, annually Not conducted All roadways,
annually All roadways,
annually 1 South Dakota Type II profiler. 2 Pathway Services, Inc., PathRunner automated data collection van (profile and video images).
1 Within the WSPMS each roadway segment is assigned a designated pavement type. Chip seal (or BST) designated roadways are pavement segments consisting of BST over aggregate base, BST over BST(s), and asphalt concrete pavement (ACP) segments that are preserved using BST applications.
Chip Seal Performance Measures Best Practices
Applied Pavement Technology, Inc. 45
WSDOT Pavement Performance Prediction
Pavement performance prediction is conducted within the Washington State Pavement
Management System (WSPMS) using the core program pavement distresses (table 17) to
calculate the PSC. PSC is calculated using equation 24 (Kay, Mahoney, and Jackson 1993).
𝑀𝑆𝑊 = 100 − 15.8 × (𝐸𝑊)0.5 (Eq. 26)
where:
PSC = pavement structural condition.
EC = equivalent alligator, longitudinal, and transverse cracking, and patching.
= ACEC + LCEC + TCEC + PTEC
ACEC = alligator cracking component of equivalent cracking.
= 0.13 (AC1)1.35 + 0.445 (AC2)1.15 + AC3
AC1 = percent of low severity alligator cracking
AC2 = percent of medium severity alligator cracking
AC3 = percent of high severity alligator cracking
LCEC = longitudinal cracking component of equivalent cracking.
= 0.13 (0.1 LC1)1.35 + 0.445 (0.1 LC2)1.15 + 0.16AC3
LC1 = percent of low severity longitudinal cracking
LC2 = percent of medium severity longitudinal cracking
LC3 = percent of high severity longitudinal cracking
TCEC = transverse cracking component of equivalent cracking.
= 0.13 (0.8 TC1)1.35 + 0.445 (0.8 TC2)1.15 + 0.8 TC3
TC1 = number of low severity transverse cracks
TC2 = number of medium severity transverse cracks
TC3 = number of high severity transverse cracks
PTEC = patching component of equivalent cracking.
= 0.13 (0.75 PT1)1.35 + 0.445 (0.75 PT2)1.15
PT1 = percent of chip seal patching
PT2 = percent of blade and full-depth patching (score deduct is limited to no
more than 45 points)
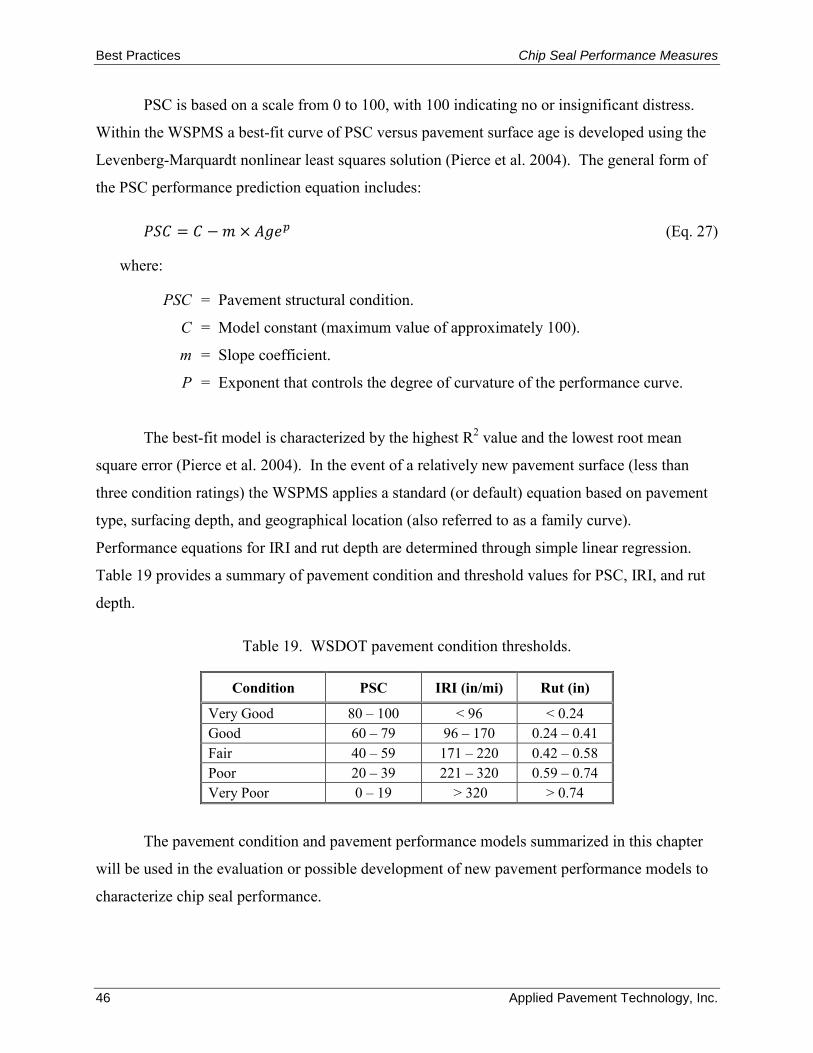
Best Practices Chip Seal Performance Measures
46 Applied Pavement Technology, Inc.
PSC is based on a scale from 0 to 100, with 100 indicating no or insignificant distress.
Within the WSPMS a best-fit curve of PSC versus pavement surface age is developed using the
Levenberg-Marquardt nonlinear least squares solution (Pierce et al. 2004). The general form of
the PSC performance prediction equation includes:
𝑀𝑆𝑊 = 𝑊 −𝑚 × 𝐴𝐴𝐴𝑝 (Eq. 27)
where:
PSC = Pavement structural condition.
C = Model constant (maximum value of approximately 100).
m = Slope coefficient.
P = Exponent that controls the degree of curvature of the performance curve.
The best-fit model is characterized by the highest R2 value and the lowest root mean
square error (Pierce et al. 2004). In the event of a relatively new pavement surface (less than
three condition ratings) the WSPMS applies a standard (or default) equation based on pavement
type, surfacing depth, and geographical location (also referred to as a family curve).
Performance equations for IRI and rut depth are determined through simple linear regression.
Table 19 provides a summary of pavement condition and threshold values for PSC, IRI, and rut
depth.
Table 19. WSDOT pavement condition thresholds.
Condition PSC IRI (in/mi) Rut (in)
Very Good 80 – 100 < 96 < 0.24 Good 60 – 79 96 – 170 0.24 – 0.41 Fair 40 – 59 171 – 220 0.42 – 0.58 Poor 20 – 39 221 – 320 0.59 – 0.74 Very Poor 0 – 19 > 320 > 0.74
The pavement condition and pavement performance models summarized in this chapter
will be used in the evaluation or possible development of new pavement performance models to
characterize chip seal performance.
Chip Seal Performance Measures Best Practices
Applied Pavement Technology, Inc. 47
CHAPTER 5. PROPOSED PERFORMANCE MEASURES
Introduction
To improve the acceptance and implementation of the proposed chip seal performance
measure, it is important that the identified measure be able to reflect in-service performance,
utilizes currently available data or data that can be readily obtained, and that it accurately
identifies the most appropriate treatment timing. Furthermore, the performance measure should
be developed using a data set that represents the full range of pavement segment scenarios (e.g.,
different climate regions, traffic volumes). All data included in the development of the
performance measures must be reliable for the performance measure to be applicable. Thus, the
data must be measured accurately without bias and collected in a consistent manner over time.
Furthermore, for any utilized data, it must agree with engineering logic; that is, it must have the
proper characteristics to make it a sensible choice for inclusion in the given performance
measure.
Evaluation of Chip Seal Performance Measures
As described in Chapter 2, a number of chip seal performance prediction models were
identified. However, none of the identified performance prediction models adequately address
raveling, which has been identified as one of the leading chip seal distress types. In addition, a
number of the identified performance models were based on existing pavement condition data
(e.g., rut depth, IRI) that may not adequately reflect optimum timing for chip seal application.
Recommendations for Further Evaluation
Based on the results of the Phase I study and discussion with WSDOT, the proposed
performance measures for chip seal pavements should include a measure of surface cracking
(e.g., longitudinal cracking, fatigue cracking, patching) and/or PSC, and pavement surface
macrotexture. At this time WSDOT has chosen to delay the evaluation of chip seal performance
measures until additional pavement condition data can be collected and evaluated. Once
sufficient data is available, the evaluation process outlined in the work plan can be used for the
development and evaluation of performance measures for chip seal pavements.
Best Practices Chip Seal Performance Measures
48 Applied Pavement Technology, Inc.
REFERENCES
American Association of State Highway and Transportation Officials (AASHTO). 1993. Guide for Design of Pavement Structures. American Association of State Highway and Transportation Officials, Washington, DC.
Asphalt Institute (AI). 2009. Basic Asphalt Emulsion Manual. MS-19. Asphalt Institute, Lexington, KY.
Corsello, P. 1993. Evaluation of Surface Friction Guidelines for Washington State Highways. Report No. WA-RD 312.1. Washington State Department of Transportation, Olympia, WA.
Flintsch, G. W., E. de Leon, K. K. McGhee, and I. L. Al-Qadi. 2003. “Pavement Surface Macrotexture Measurement and Application.” Transportation Research Record 1860. Transportation Research Board, Washington, DC.
Gransberg, D. D. 2008. Evaluate TXDOT Chip Seal Binder Performance Using Pavement Management Information System and Field Measurement Data San Antonio District. Interim Research Report No. 3. University of Oklahoma, Norman, OK.
Gransberg, D. D. and D. M. B. James. 2005. Chip Seal Best Practices. NCHRP Synthesis 342. Transportation Research Board, Washington, DC.
Hall, J. W., K. L. Smith, L. Titus-Glover, J. C. Wambold, T. J. Yager, and Z. Rado. 2009. Guide for Pavement Friction. NCHRP Web-Only Document 108. Transportation Research Board, Washington, DC.
Hein, D. K., and S. Rao. 2010. “Rational Procedures for Evaluating the Effectiveness of Pavement Preservation Treatments.” Compendium of Papers from the First International Conference on Pavement Preservation, Newport Beach, California, USA.
Huang, B. and Q. Dong. 2009. Optimizing Pavement Preventive Maintenance Treatment Applications in Tennessee (Phase I). Final Report. Tennessee Department of Transportation, Knoxville, TN.
Huang, R. 2012. New Technologies for Pavement Evaluation, TxDOT 3-D Pavement Survey Technology. Presentation, 86th Annual Transportation Short Course at Texas A&M University. Texas Department of Transportation, Austin, TX.
Kay, R. K., J. P. Mahoney, and N. C. Jackson. 1993. The WSDOT Pavement Management System―A 1993 Update. Report No. WA-RD 274.1. Washington State Department of Transportation, Olympia, WA.
Laurent, J., J. F. Hebert, D. Lefebvre, and Y. Savard. nd High-Speed Network Level Road Texture Evaluation using 1mm Resolution Transverse 3D Profiling Sensors Using a Digital Sand Patch Model. Pavemetrics, Quebec, Canada.
Chip Seal Performance Measures Best Practices
Applied Pavement Technology, Inc. 49
Li, N. and T. Kazmierowski. 2004. “Impact of Performance Measures on Pavement Asset Management in Canada.” Proceedings, 6th International Conference on Managing Pavements. Queensland Department of Main Roads, Brisbane, Queensland, Australia.
Liu, L., and N. G. Gharaibeh. 2013. “Survival Analysis of Thin Overlay and Chip Seal Treatments Using the Long-Term Pavement Performance Data.” Paper No. 13-0826. TRB 92nd Annual Meeting Compendium of Papers. Transportation Research Board, Washington, DC.
Liu, L., M. Hossain, and R. Miller. 2009. “Modeling of Chip Seal Performance on Kansas Highways.” Proceeding of the 2009 Mid-Continent Transportation Research Symposium, Ames, IA.
Morian, D. A., G. Wang, D. Frith, and J. Reiter. 2011. Analysis of Completed Monitoring Data for the SPS-3 Experiment. Transportation Research Board Annual Meeting, Paper No. 11-2516. Transportation Research Board, Washington, DC.
Morian, D. A., S. D. Gibson, and J. A. Epps. 1998. Maintaining Flexible Pavements―The Long Term Pavement Performance Experiment SPS-3 5-Year Data Analysis. Report No. FHWA-RD-97-102. Federal Highway Administration, Washington, DC.
National Highway Institute (NHI). 2013. Pavement Preservation: Preventive Maintenance Treatment, Timing, and Selection. NHI Course No. 131115. Federal Highway Administration, Washington, DC.
Ohio Department of Transportation (ODOT). 2004. Pavement Condition Rating System. Ohio Department of Transportation, Columbus, OH.
Peshkin, D. G., T. E. Hoerner, and K. A. Zimmerman. 2004. Optimal Timing of Pavement Preventive Maintenance Applications. NCHRP Report 523. Transportation Research Board, Washington DC.
Pierce, L. M., N. Sivaneswaran, K. Willoughby, and J. Mahoney. 2004. “Mining PMS Data to Evaluate the Performance of New Hot Mix Asphalt Pavement Design Practices.” Proceedings, Sixth International Conference on Managing Pavements, Brisbane, Australia. Queensland Department of Main Roads, Brisbane, Australia.
Rada, G. R., D. J. Jones, J. T. Harvey, K. A. Senn, and M. Thomas. 2013. Guide for Conducting Forensic Investigations of Highway Pavements. NCHRP Report 747. Transportation Research Board, Washington, DC.
Rajagopal, A. 2010. Effectiveness of Chip Sealing and Micro Surfacing on Pavement Serviceability and Life. Final Report. Ohio Department of Transportation, Columbus, OH.
Romero, P. and D. I. Anderson. 2005. Life Cycle of Pavement Preservation Seal Coats. Report No. UT-04.07. Utah Department of Transportation, Salt Lake City, UT.
Best Practices Chip Seal Performance Measures
50 Applied Pavement Technology, Inc.
Roque, R., D. Anderson, and M. Thompson. 1991. “Effect of Material, Design, and Construction Variables on Seal Coat Performance.” Transportation Research Record 1300. Transportation Research Board, Washington, DC.
Seneviratne, P. N. and J. M. Bergener. 1994. Effects of Aggregate Seal Coats on Skid Index Numbers & Accident Rates of Low Volume Roads in Utah. Utah Department of Transportation, Salt Lake City, UT.
Sengoz, B., A. Topal, and S. Tanyel. 2012. “Comparison of Pavement Surface Texture Determination by Sand Patch Test and 3D Laser Scanning.” Periodica Polytecnica, Volume 56, No 1. Budapest University of Technology and Economics, Budapest, Turkey.
Shuler, S., A. Lord, A. Epps-Martin, and D. Hoyt. 2011. Manual for Emulsion-Based Chip Seals for Pavement Preservation. NCHRP Report 680. Transportation Research Board, Washington, DC.
Testa, D. M. and M. Hossain. 2014. Kansas Department of Transportation 2014 Chip Seal Manual. Report No. K-TRAN: KSU-09-8. Kansas Department of Transportation, Topeka, KS.
Tighe, S., N. Li, L. Falls, and R. Haas. 2000. “Incorporating Road Safety into Pavement Management.” Transportation Research Record 1699. Transportation Research Board, Washington, DC.
Transit New Zealand (TNZ). 1981. Standard Test Procedure for Measurement of Texture by the Sand Circle Methods. TNZ T/3, Wellington, New Zealand.
Utah Department of Transportation (UDOT). 2009. Pavement Preservation Manual – Part 4 Pavement Condition Modeling with dTIMS. Office of Asset Management. Utah Department of Transportation, Salt Lake City, UT.
Vilaca, J. L., J. C. Fonesca, A. C. M. Pinho, and E. Freitas. 2010. “3D Surface Profile Equipment for the Characterization of the pavement texture – TexScan”. Megatronics 20. Elsevier Ltd., London, England.
Washington State Department of Transportation (WSDOT). 1992. Pavement Surface Condition Rating Manual. Washington State Department of Transportation, Olympia, WA.
Washington State Department of Transportation (WSDOT). 2014. Gray Notebook. Edition 52. Washington State Department of Transportation, Olympia, WA.
Chip Seal Performance Measures Best Practices
Applied Pavement Technology, Inc. 51
APPENDIX A: AGENCY SURVEY QUESTIONS
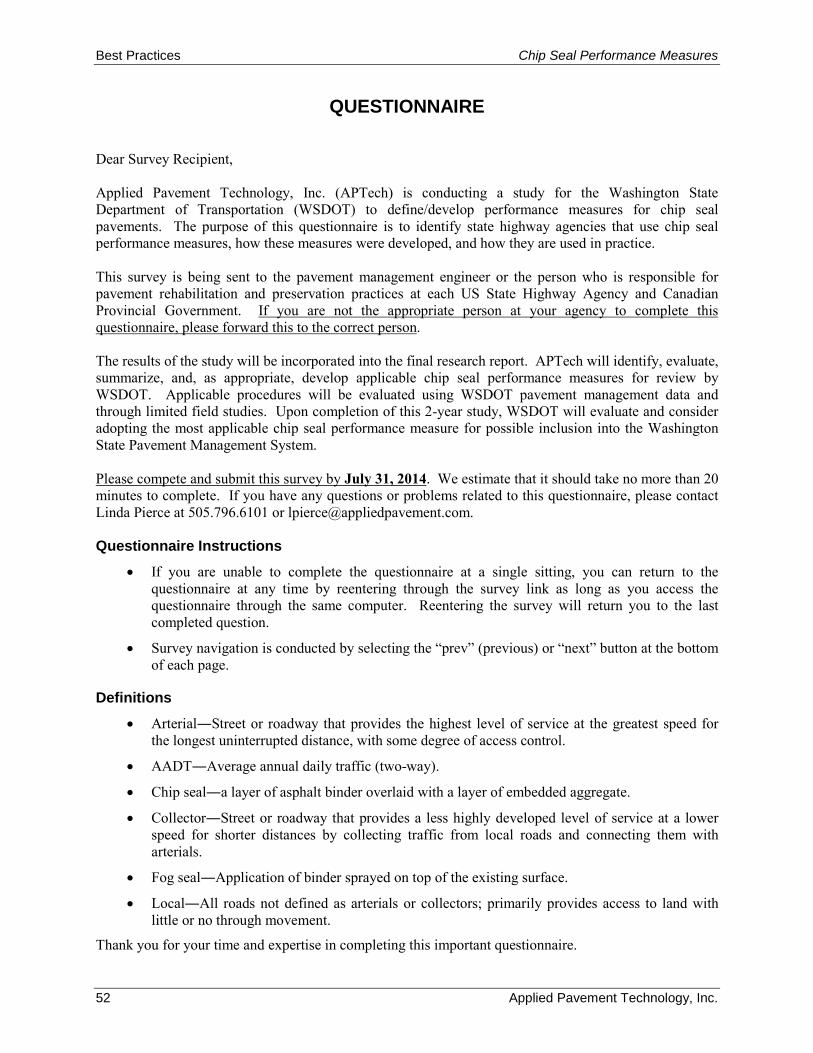
Best Practices Chip Seal Performance Measures
52 Applied Pavement Technology, Inc.
QUESTIONNAIRE Dear Survey Recipient, Applied Pavement Technology, Inc. (APTech) is conducting a study for the Washington State Department of Transportation (WSDOT) to define/develop performance measures for chip seal pavements. The purpose of this questionnaire is to identify state highway agencies that use chip seal performance measures, how these measures were developed, and how they are used in practice. This survey is being sent to the pavement management engineer or the person who is responsible for pavement rehabilitation and preservation practices at each US State Highway Agency and Canadian Provincial Government. If you are not the appropriate person at your agency to complete this questionnaire, please forward this to the correct person. The results of the study will be incorporated into the final research report. APTech will identify, evaluate, summarize, and, as appropriate, develop applicable chip seal performance measures for review by WSDOT. Applicable procedures will be evaluated using WSDOT pavement management data and through limited field studies. Upon completion of this 2-year study, WSDOT will evaluate and consider adopting the most applicable chip seal performance measure for possible inclusion into the Washington State Pavement Management System. Please compete and submit this survey by July 31, 2014. We estimate that it should take no more than 20 minutes to complete. If you have any questions or problems related to this questionnaire, please contact Linda Pierce at 505.796.6101 or [email protected]. Questionnaire Instructions
• If you are unable to complete the questionnaire at a single sitting, you can return to the questionnaire at any time by reentering through the survey link as long as you access the questionnaire through the same computer. Reentering the survey will return you to the last completed question.
• Survey navigation is conducted by selecting the “prev” (previous) or “next” button at the bottom of each page.
Definitions
• Arterial―Street or roadway that provides the highest level of service at the greatest speed for the longest uninterrupted distance, with some degree of access control.
• AADT―Average annual daily traffic (two-way).
• Chip seal―a layer of asphalt binder overlaid with a layer of embedded aggregate.
• Collector―Street or roadway that provides a less highly developed level of service at a lower speed for shorter distances by collecting traffic from local roads and connecting them with arterials.
• Fog seal―Application of binder sprayed on top of the existing surface.
• Local―All roads not defined as arterials or collectors; primarily provides access to land with little or no through movement.
Thank you for your time and expertise in completing this important questionnaire.
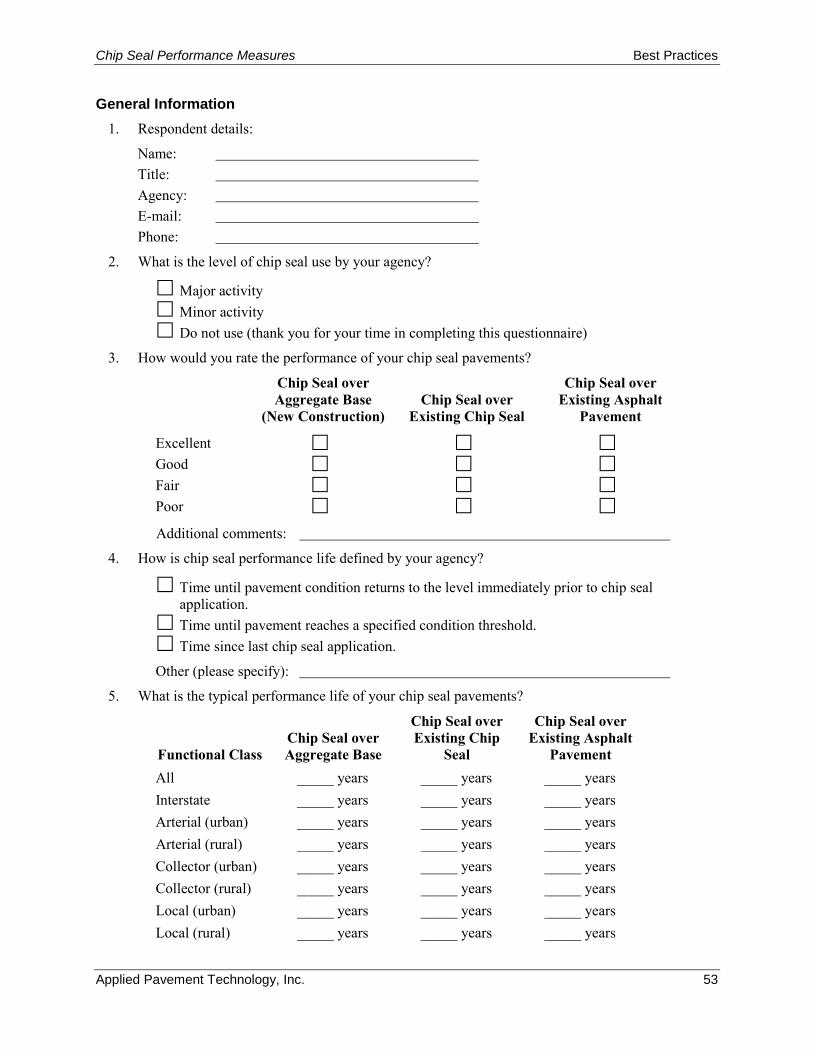
Chip Seal Performance Measures Best Practices
Applied Pavement Technology, Inc. 53
General Information 1. Respondent details:
Name: Title: Agency: E-mail: Phone:
2. What is the level of chip seal use by your agency?
Major activity Minor activity Do not use (thank you for your time in completing this questionnaire)
3. How would you rate the performance of your chip seal pavements?
Chip Seal over Aggregate Base
(New Construction) Chip Seal over
Existing Chip Seal
Chip Seal over Existing Asphalt
Pavement
Excellent Good Fair Poor Additional comments:
4. How is chip seal performance life defined by your agency?
Time until pavement condition returns to the level immediately prior to chip seal application.
Time until pavement reaches a specified condition threshold. Time since last chip seal application.
Other (please specify):
5. What is the typical performance life of your chip seal pavements?
Functional Class Chip Seal over Aggregate Base
Chip Seal over Existing Chip
Seal
Chip Seal over Existing Asphalt
Pavement All _____ years _____ years _____ years Interstate _____ years _____ years _____ years Arterial (urban) _____ years _____ years _____ years Arterial (rural) _____ years _____ years _____ years Collector (urban) _____ years _____ years _____ years Collector (rural) _____ years _____ years _____ years Local (urban) _____ years _____ years _____ years Local (rural) _____ years _____ years _____ years

Best Practices Chip Seal Performance Measures
54 Applied Pavement Technology, Inc.
6. What is the maximum AADT (two-way) for which a chip seal can be applied?
<500 AADT < 1,000 AADT < 2,000 AADT < 5,000 AADT <10,000 AADT < 20,000 AADT No limit
Other (please specify):
7. Are there additional factors that impact your decision for using chip seals (select all that apply)?
Exiting pavement condition (please describe): Climate conditions (please describe): Steep grades (please describe): Turning motions (please describe): Functional classification (please describe): Posted speed limit (please describe):
Other (please specify):
8. What chip seal design methods do you use?
Kearby method Modified Kearby method Asphalt Institute method (MS-19) Sand patch testing McLeod Method Based on past performance Agency developed method No formal design method
Other (please specify):
9. What binder type do you normally use (select all that apply)?
AC 2.5 AC 5 AC-5 latex AC 10 AC 10 AC 15P AC15-5TR AC20 AC 40 CRS-1 CRS-1H CRS-1P CRS-2 CRS-2H CRS-2P HFRS HFRS-2P
Other (please specify):
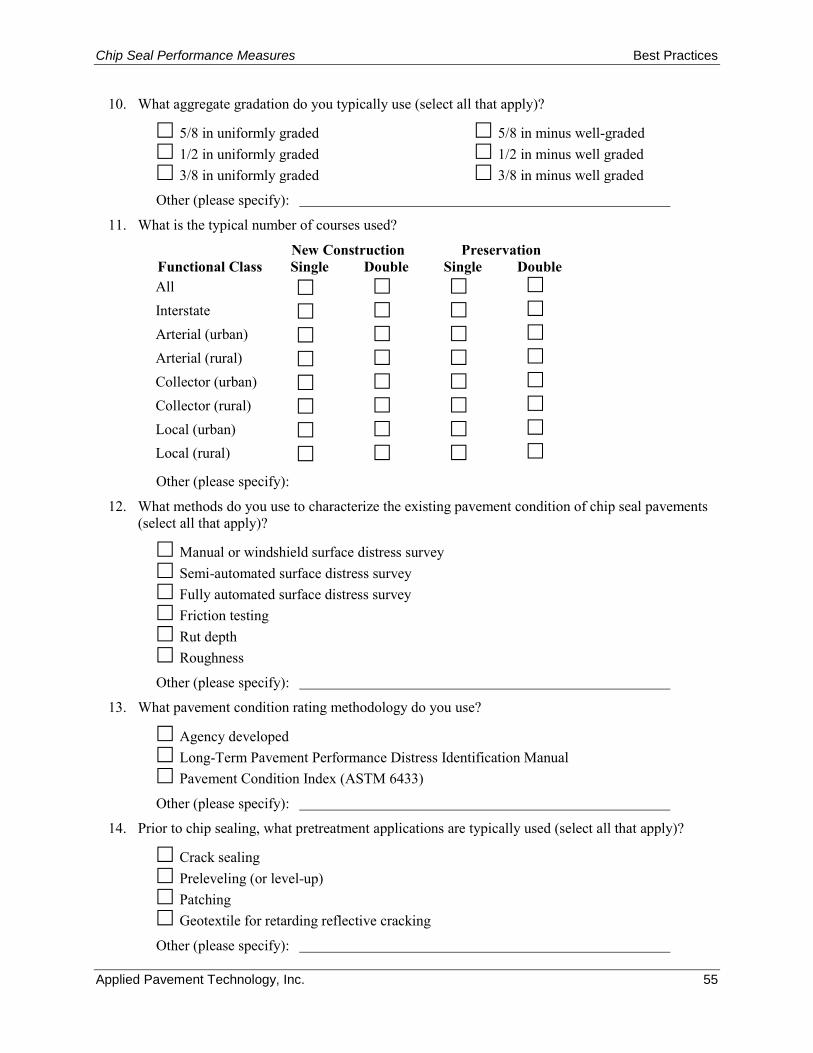
Chip Seal Performance Measures Best Practices
Applied Pavement Technology, Inc. 55
10. What aggregate gradation do you typically use (select all that apply)?
5/8 in uniformly graded 5/8 in minus well-graded 1/2 in uniformly graded 1/2 in minus well graded 3/8 in uniformly graded 3/8 in minus well graded
Other (please specify):
11. What is the typical number of courses used?
Functional Class New Construction Preservation Single Double Single Double
All Interstate Arterial (urban) Arterial (rural) Collector (urban) Collector (rural) Local (urban) Local (rural) Other (please specify):
12. What methods do you use to characterize the existing pavement condition of chip seal pavements (select all that apply)?
Manual or windshield surface distress survey Semi-automated surface distress survey Fully automated surface distress survey Friction testing Rut depth Roughness
Other (please specify):
13. What pavement condition rating methodology do you use?
Agency developed Long-Term Pavement Performance Distress Identification Manual Pavement Condition Index (ASTM 6433)
Other (please specify):
14. Prior to chip sealing, what pretreatment applications are typically used (select all that apply)?
Crack sealing Preleveling (or level-up) Patching Geotextile for retarding reflective cracking
Other (please specify):

Best Practices Chip Seal Performance Measures
56 Applied Pavement Technology, Inc.
15. Do you require additional treatment application after chip seal placement (e.g., fog seal, microsurfacing)?
Yes (please specify): No
16. What method do you use to identify when a chip seal treatment should be applied (select all that apply)?
Based on observed pavement condition Based on predetermined cycle (e.g. age) Based on performance prediction model
Other (please specify):
17. If chip seal treatment timing is based on pavement condition, which distress type(s) and trigger value(s) are used to determine treatment timing (select all that apply)?
Longitudinal cracking (trigger value =__________) Alligator cracking (trigger value =__________) Transverse cracking (trigger value =__________) Raveling/weathering (trigger value =__________) Bleeding (trigger value =__________) Rut depth (trigger value =__________) Roughness (trigger value =__________) Friction (trigger value =__________) Combined condition index (trigger value =__________)
Other (please specify):
18. If your agency uses performance measures/models for determining chip seal application timing, do you have any reports, manuals, guidelines, and so on that document your process?
Yes No
If yes, could you please send a copy to Linda Pierce at [email protected]?
19. Would you be interested in receiving a copy of the survey results?
Yes No
Thank you for your time.
Chip Seal Performance Measures Best Practices
Applied Pavement Technology, Inc. 57
APPENDIX B: SUMMARY OF AGENCY SURVEY RESPONSES
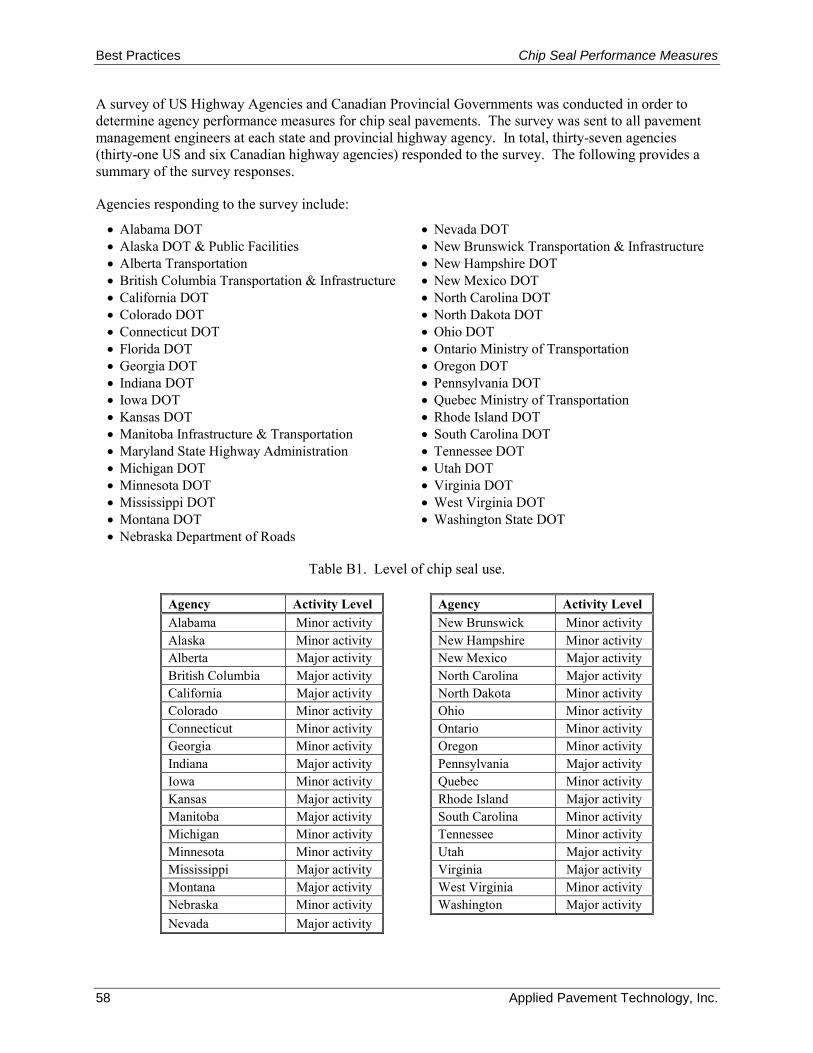
Best Practices Chip Seal Performance Measures
58 Applied Pavement Technology, Inc.
A survey of US Highway Agencies and Canadian Provincial Governments was conducted in order to determine agency performance measures for chip seal pavements. The survey was sent to all pavement management engineers at each state and provincial highway agency. In total, thirty-seven agencies (thirty-one US and six Canadian highway agencies) responded to the survey. The following provides a summary of the survey responses.
Agencies responding to the survey include:
• Alabama DOT • Nevada DOT • Alaska DOT & Public Facilities • New Brunswick Transportation & Infrastructure • Alberta Transportation • New Hampshire DOT • British Columbia Transportation & Infrastructure • New Mexico DOT • California DOT • North Carolina DOT • Colorado DOT • North Dakota DOT • Connecticut DOT • Ohio DOT • Florida DOT • Ontario Ministry of Transportation • Georgia DOT • Oregon DOT • Indiana DOT • Pennsylvania DOT • Iowa DOT • Quebec Ministry of Transportation • Kansas DOT • Rhode Island DOT • Manitoba Infrastructure & Transportation • South Carolina DOT • Maryland State Highway Administration • Tennessee DOT • Michigan DOT • Utah DOT • Minnesota DOT • Virginia DOT • Mississippi DOT • West Virginia DOT • Montana DOT • Washington State DOT • Nebraska Department of Roads
Table B1. Level of chip seal use.
Agency Activity Level Agency Activity Level Alabama Minor activity New Brunswick Minor activity Alaska Minor activity New Hampshire Minor activity Alberta Major activity New Mexico Major activity British Columbia Major activity North Carolina Major activity California Major activity North Dakota Minor activity Colorado Minor activity Ohio Minor activity Connecticut Minor activity Ontario Minor activity Georgia Minor activity Oregon Minor activity Indiana Major activity Pennsylvania Major activity Iowa Minor activity Quebec Minor activity Kansas Major activity Rhode Island Major activity Manitoba Major activity South Carolina Minor activity Michigan Minor activity Tennessee Minor activity Minnesota Minor activity Utah Major activity Mississippi Major activity Virginia Major activity Montana Major activity West Virginia Minor activity Nebraska Minor activity Washington Major activity Nevada Major activity
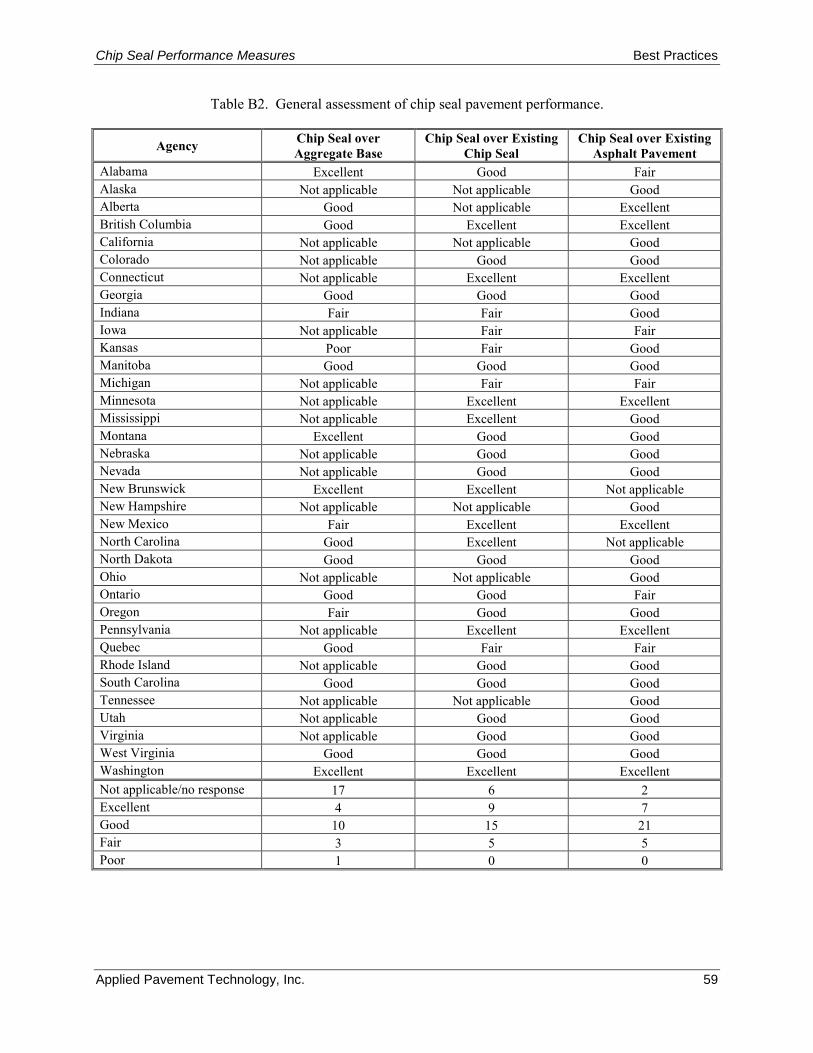
Chip Seal Performance Measures Best Practices
Applied Pavement Technology, Inc. 59
Table B2. General assessment of chip seal pavement performance.
Agency Chip Seal over Aggregate Base
Chip Seal over Existing Chip Seal
Chip Seal over Existing Asphalt Pavement
Alabama Excellent Good Fair Alaska Not applicable Not applicable Good Alberta Good Not applicable Excellent British Columbia Good Excellent Excellent California Not applicable Not applicable Good Colorado Not applicable Good Good Connecticut Not applicable Excellent Excellent Georgia Good Good Good Indiana Fair Fair Good Iowa Not applicable Fair Fair Kansas Poor Fair Good Manitoba Good Good Good Michigan Not applicable Fair Fair Minnesota Not applicable Excellent Excellent Mississippi Not applicable Excellent Good Montana Excellent Good Good Nebraska Not applicable Good Good Nevada Not applicable Good Good New Brunswick Excellent Excellent Not applicable New Hampshire Not applicable Not applicable Good New Mexico Fair Excellent Excellent North Carolina Good Excellent Not applicable North Dakota Good Good Good Ohio Not applicable Not applicable Good Ontario Good Good Fair Oregon Fair Good Good Pennsylvania Not applicable Excellent Excellent Quebec Good Fair Fair Rhode Island Not applicable Good Good South Carolina Good Good Good Tennessee Not applicable Not applicable Good Utah Not applicable Good Good Virginia Not applicable Good Good West Virginia Good Good Good Washington Excellent Excellent Excellent Not applicable/no response 17 6 2 Excellent 4 9 7 Good 10 15 21 Fair 3 5 5 Poor 1 0 0
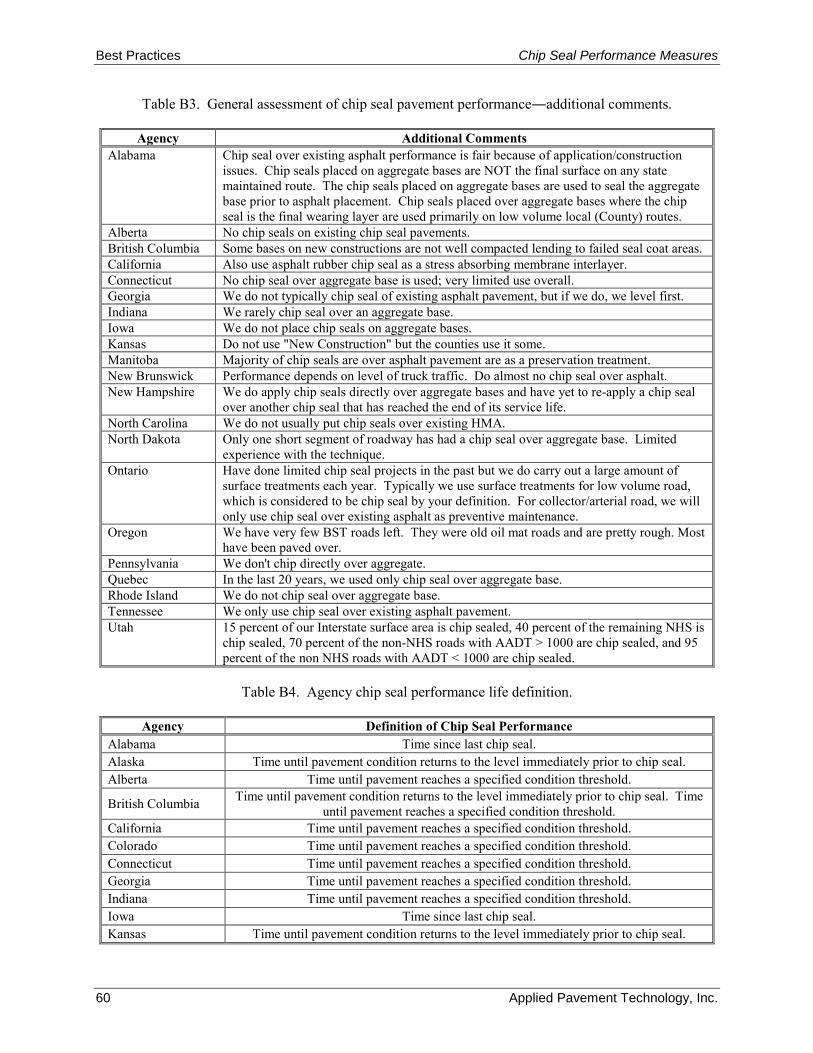
Best Practices Chip Seal Performance Measures
60 Applied Pavement Technology, Inc.
Table B3. General assessment of chip seal pavement performance―additional comments.
Agency Additional Comments Alabama Chip seal over existing asphalt performance is fair because of application/construction
issues. Chip seals placed on aggregate bases are NOT the final surface on any state maintained route. The chip seals placed on aggregate bases are used to seal the aggregate base prior to asphalt placement. Chip seals placed over aggregate bases where the chip seal is the final wearing layer are used primarily on low volume local (County) routes.
Alberta No chip seals on existing chip seal pavements. British Columbia Some bases on new constructions are not well compacted lending to failed seal coat areas. California Also use asphalt rubber chip seal as a stress absorbing membrane interlayer. Connecticut No chip seal over aggregate base is used; very limited use overall. Georgia We do not typically chip seal of existing asphalt pavement, but if we do, we level first. Indiana We rarely chip seal over an aggregate base. Iowa We do not place chip seals on aggregate bases. Kansas Do not use "New Construction" but the counties use it some. Manitoba Majority of chip seals are over asphalt pavement are as a preservation treatment. New Brunswick Performance depends on level of truck traffic. Do almost no chip seal over asphalt. New Hampshire We do apply chip seals directly over aggregate bases and have yet to re-apply a chip seal
over another chip seal that has reached the end of its service life. North Carolina We do not usually put chip seals over existing HMA. North Dakota Only one short segment of roadway has had a chip seal over aggregate base. Limited
experience with the technique. Ontario Have done limited chip seal projects in the past but we do carry out a large amount of
surface treatments each year. Typically we use surface treatments for low volume road, which is considered to be chip seal by your definition. For collector/arterial road, we will only use chip seal over existing asphalt as preventive maintenance.
Oregon We have very few BST roads left. They were old oil mat roads and are pretty rough. Most have been paved over.
Pennsylvania We don't chip directly over aggregate. Quebec In the last 20 years, we used only chip seal over aggregate base. Rhode Island We do not chip seal over aggregate base. Tennessee We only use chip seal over existing asphalt pavement. Utah 15 percent of our Interstate surface area is chip sealed, 40 percent of the remaining NHS is
chip sealed, 70 percent of the non-NHS roads with AADT > 1000 are chip sealed, and 95 percent of the non NHS roads with AADT < 1000 are chip sealed.
Table B4. Agency chip seal performance life definition.
Agency Definition of Chip Seal Performance Alabama Time since last chip seal. Alaska Time until pavement condition returns to the level immediately prior to chip seal. Alberta Time until pavement reaches a specified condition threshold.
British Columbia Time until pavement condition returns to the level immediately prior to chip seal. Time until pavement reaches a specified condition threshold.
California Time until pavement reaches a specified condition threshold. Colorado Time until pavement reaches a specified condition threshold. Connecticut Time until pavement reaches a specified condition threshold. Georgia Time until pavement reaches a specified condition threshold. Indiana Time until pavement reaches a specified condition threshold. Iowa Time since last chip seal. Kansas Time until pavement condition returns to the level immediately prior to chip seal.
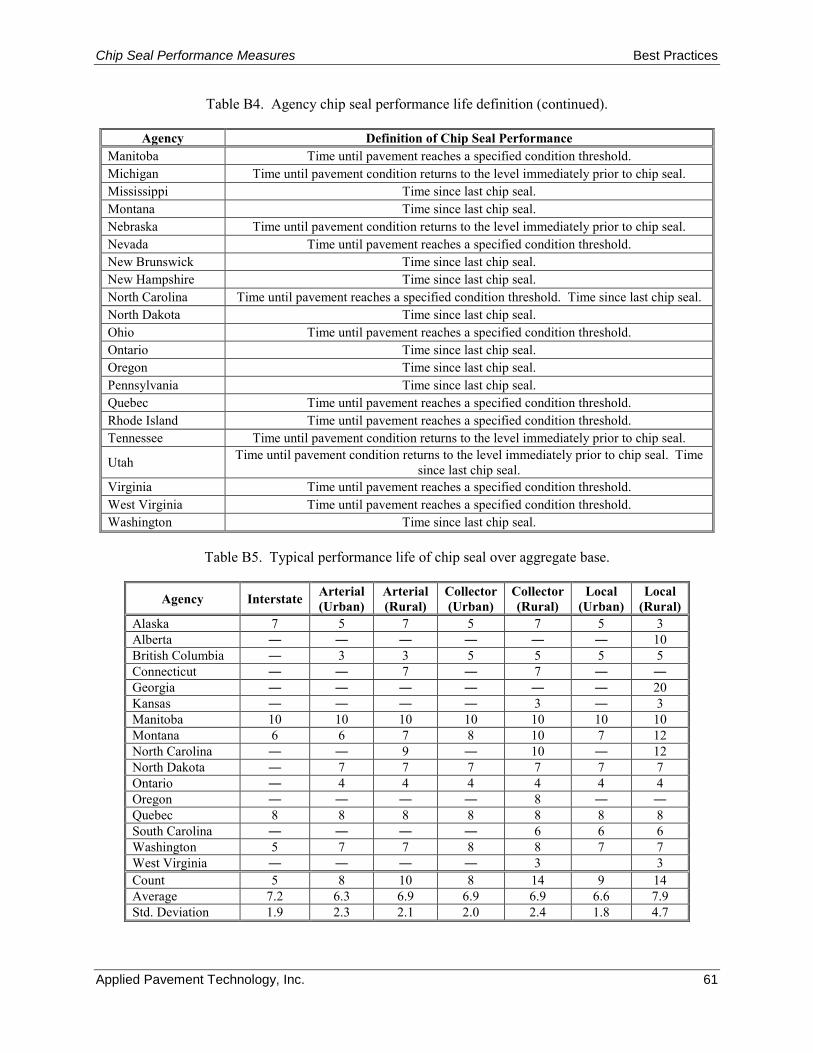
Chip Seal Performance Measures Best Practices
Applied Pavement Technology, Inc. 61
Table B4. Agency chip seal performance life definition (continued).
Agency Definition of Chip Seal Performance Manitoba Time until pavement reaches a specified condition threshold. Michigan Time until pavement condition returns to the level immediately prior to chip seal. Mississippi Time since last chip seal. Montana Time since last chip seal. Nebraska Time until pavement condition returns to the level immediately prior to chip seal. Nevada Time until pavement reaches a specified condition threshold. New Brunswick Time since last chip seal. New Hampshire Time since last chip seal. North Carolina Time until pavement reaches a specified condition threshold. Time since last chip seal. North Dakota Time since last chip seal. Ohio Time until pavement reaches a specified condition threshold. Ontario Time since last chip seal. Oregon Time since last chip seal. Pennsylvania Time since last chip seal. Quebec Time until pavement reaches a specified condition threshold. Rhode Island Time until pavement reaches a specified condition threshold. Tennessee Time until pavement condition returns to the level immediately prior to chip seal.
Utah Time until pavement condition returns to the level immediately prior to chip seal. Time since last chip seal.
Virginia Time until pavement reaches a specified condition threshold. West Virginia Time until pavement reaches a specified condition threshold. Washington Time since last chip seal.
Table B5. Typical performance life of chip seal over aggregate base.
Agency Interstate Arterial (Urban)
Arterial (Rural)
Collector (Urban)
Collector (Rural)
Local (Urban)
Local (Rural)
Alaska 7 5 7 5 7 5 3 Alberta ― ― ― ― ― ― 10 British Columbia ― 3 3 5 5 5 5 Connecticut ― ― 7 ― 7 ― ― Georgia ― ― ― ― ― ― 20 Kansas ― ― ― ― 3 ― 3 Manitoba 10 10 10 10 10 10 10 Montana 6 6 7 8 10 7 12 North Carolina ― ― 9 ― 10 ― 12 North Dakota ― 7 7 7 7 7 7 Ontario ― 4 4 4 4 4 4 Oregon ― ― ― ― 8 ― ― Quebec 8 8 8 8 8 8 8 South Carolina ― ― ― ― 6 6 6 Washington 5 7 7 8 8 7 7 West Virginia ― ― ― ― 3 3 Count 5 8 10 8 14 9 14 Average 7.2 6.3 6.9 6.9 6.9 6.6 7.9 Std. Deviation 1.9 2.3 2.1 2.0 2.4 1.8 4.7
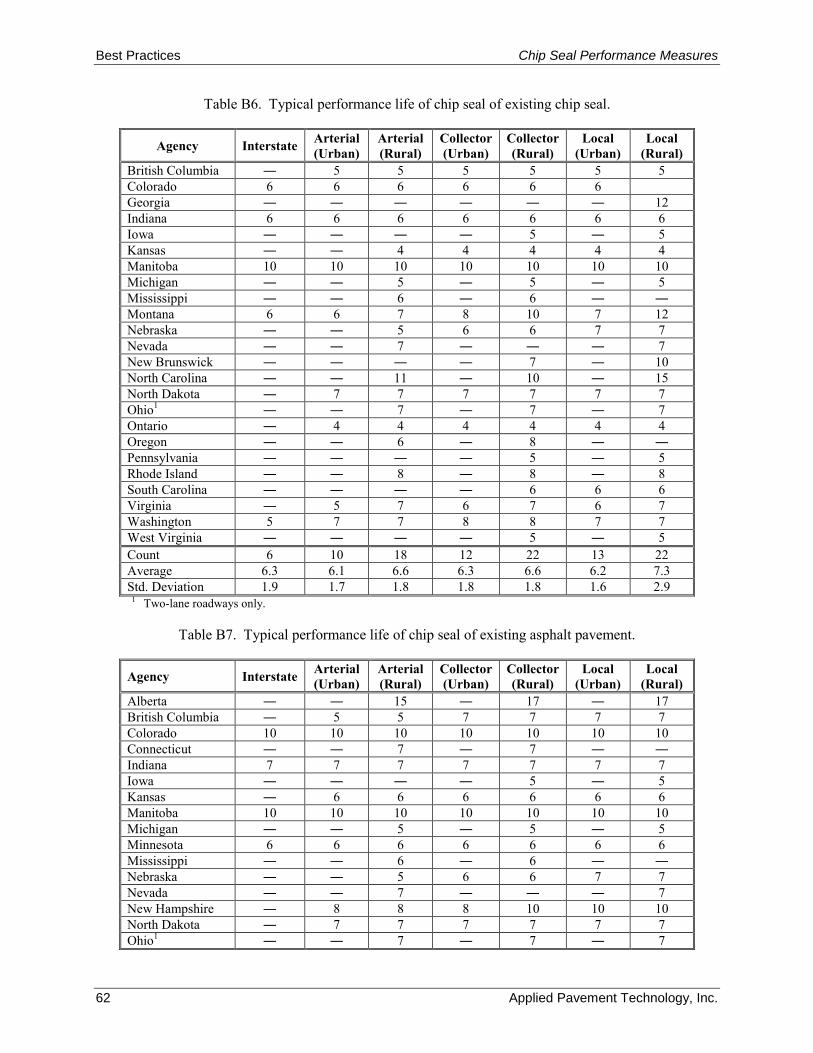
Best Practices Chip Seal Performance Measures
62 Applied Pavement Technology, Inc.
Table B6. Typical performance life of chip seal of existing chip seal.
Agency Interstate Arterial (Urban)
Arterial (Rural)
Collector (Urban)
Collector (Rural)
Local (Urban)
Local (Rural)
British Columbia ― 5 5 5 5 5 5 Colorado 6 6 6 6 6 6 Georgia ― ― ― ― ― ― 12 Indiana 6 6 6 6 6 6 6 Iowa ― ― ― ― 5 ― 5 Kansas ― ― 4 4 4 4 4 Manitoba 10 10 10 10 10 10 10 Michigan ― ― 5 ― 5 ― 5 Mississippi ― ― 6 ― 6 ― ― Montana 6 6 7 8 10 7 12 Nebraska ― ― 5 6 6 7 7 Nevada ― ― 7 ― ― ― 7 New Brunswick ― ― ― ― 7 ― 10 North Carolina ― ― 11 ― 10 ― 15 North Dakota ― 7 7 7 7 7 7 Ohio1 ― ― 7 ― 7 ― 7 Ontario ― 4 4 4 4 4 4 Oregon ― ― 6 ― 8 ― ― Pennsylvania ― ― ― ― 5 ― 5 Rhode Island ― ― 8 ― 8 ― 8 South Carolina ― ― ― ― 6 6 6 Virginia ― 5 7 6 7 6 7 Washington 5 7 7 8 8 7 7 West Virginia ― ― ― ― 5 ― 5 Count 6 10 18 12 22 13 22 Average 6.3 6.1 6.6 6.3 6.6 6.2 7.3 Std. Deviation 1.9 1.7 1.8 1.8 1.8 1.6 2.9
1 Two-lane roadways only.
Table B7. Typical performance life of chip seal of existing asphalt pavement.
Agency Interstate Arterial (Urban)
Arterial (Rural)
Collector (Urban)
Collector (Rural)
Local (Urban)
Local (Rural)
Alberta ― ― 15 ― 17 ― 17 British Columbia ― 5 5 7 7 7 7 Colorado 10 10 10 10 10 10 10 Connecticut ― ― 7 ― 7 ― ― Indiana 7 7 7 7 7 7 7 Iowa ― ― ― ― 5 ― 5 Kansas ― 6 6 6 6 6 6 Manitoba 10 10 10 10 10 10 10 Michigan ― ― 5 ― 5 ― 5 Minnesota 6 6 6 6 6 6 6 Mississippi ― ― 6 ― 6 ― ― Nebraska ― ― 5 6 6 7 7 Nevada ― ― 7 ― ― ― 7 New Hampshire ― 8 8 8 10 10 10 North Dakota ― 7 7 7 7 7 7 Ohio1 ― ― 7 ― 7 ― 7
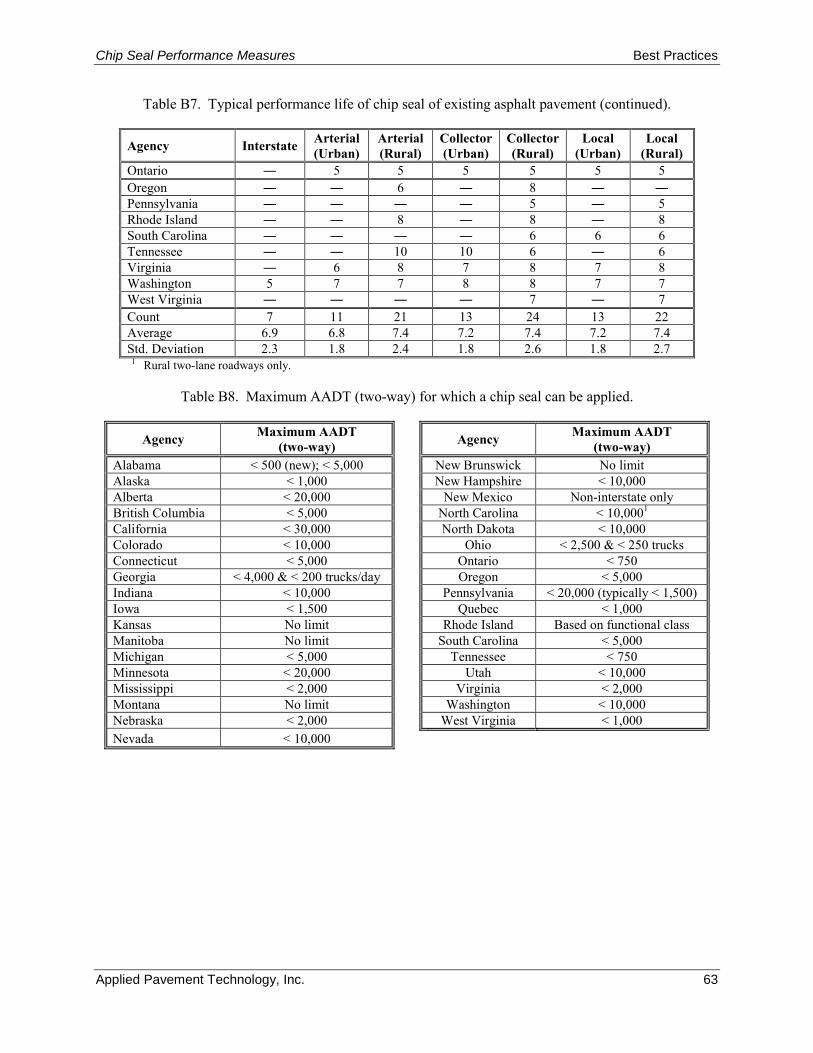
Chip Seal Performance Measures Best Practices
Applied Pavement Technology, Inc. 63
Table B7. Typical performance life of chip seal of existing asphalt pavement (continued).
Agency Interstate Arterial (Urban)
Arterial (Rural)
Collector (Urban)
Collector (Rural)
Local (Urban)
Local (Rural)
Ontario ― 5 5 5 5 5 5 Oregon ― ― 6 ― 8 ― ― Pennsylvania ― ― ― ― 5 ― 5 Rhode Island ― ― 8 ― 8 ― 8 South Carolina ― ― ― ― 6 6 6 Tennessee ― ― 10 10 6 ― 6 Virginia ― 6 8 7 8 7 8 Washington 5 7 7 8 8 7 7 West Virginia ― ― ― ― 7 ― 7 Count 7 11 21 13 24 13 22 Average 6.9 6.8 7.4 7.2 7.4 7.2 7.4 Std. Deviation 2.3 1.8 2.4 1.8 2.6 1.8 2.7
1 Rural two-lane roadways only.
Table B8. Maximum AADT (two-way) for which a chip seal can be applied.
Agency Maximum AADT (two-way)
Agency Maximum AADT (two-way)
Alabama < 500 (new); < 5,000 New Brunswick No limit Alaska < 1,000 New Hampshire < 10,000 Alberta < 20,000 New Mexico Non-interstate only British Columbia < 5,000 North Carolina < 10,0001 California < 30,000 North Dakota < 10,000 Colorado < 10,000 Ohio < 2,500 & < 250 trucks Connecticut < 5,000 Ontario < 750 Georgia < 4,000 & < 200 trucks/day Oregon < 5,000 Indiana < 10,000 Pennsylvania < 20,000 (typically < 1,500) Iowa < 1,500 Quebec < 1,000 Kansas No limit Rhode Island Based on functional class Manitoba No limit South Carolina < 5,000 Michigan < 5,000 Tennessee < 750 Minnesota < 20,000 Utah < 10,000 Mississippi < 2,000 Virginia < 2,000 Montana No limit Washington < 10,000 Nebraska < 2,000 West Virginia < 1,000 Nevada < 10,000
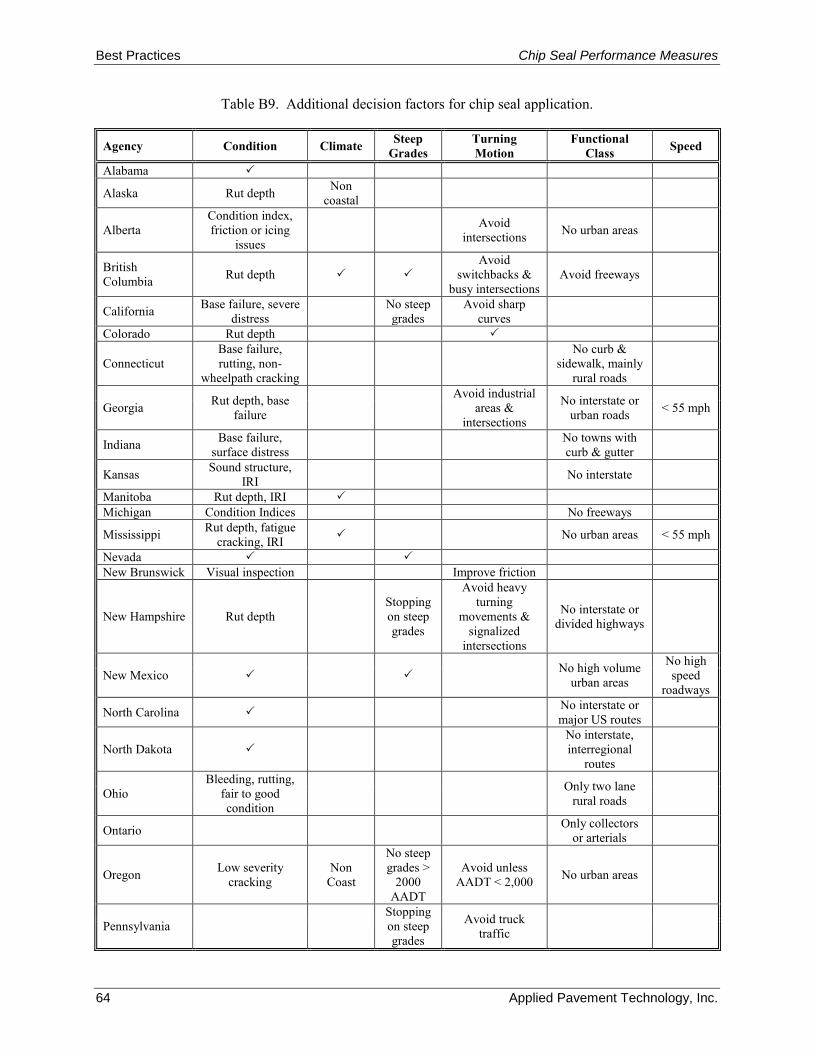
Best Practices Chip Seal Performance Measures
64 Applied Pavement Technology, Inc.
Table B9. Additional decision factors for chip seal application.
Agency Condition Climate Steep Grades
Turning Motion
Functional Class Speed
Alabama
Alaska Rut depth Non coastal
Alberta Condition index, friction or icing
issues Avoid
intersections No urban areas
British Columbia Rut depth
Avoid switchbacks &
busy intersections Avoid freeways
California Base failure, severe distress No steep
grades Avoid sharp
curves
Colorado Rut depth
Connecticut Base failure, rutting, non-
wheelpath cracking
No curb & sidewalk, mainly
rural roads
Georgia Rut depth, base failure
Avoid industrial areas &
intersections
No interstate or urban roads < 55 mph
Indiana Base failure, surface distress No towns with
curb & gutter
Kansas Sound structure, IRI No interstate
Manitoba Rut depth, IRI Michigan Condition Indices No freeways
Mississippi Rut depth, fatigue cracking, IRI No urban areas < 55 mph
Nevada New Brunswick Visual inspection Improve friction
New Hampshire Rut depth Stopping on steep grades
Avoid heavy turning
movements & signalized
intersections
No interstate or divided highways
New Mexico No high volume urban areas
No high speed
roadways
North Carolina No interstate or major US routes
North Dakota No interstate, interregional
routes
Ohio Bleeding, rutting,
fair to good condition
Only two lane rural roads
Ontario Only collectors or arterials
Oregon Low severity cracking
Non Coast
No steep grades >
2000 AADT
Avoid unless AADT < 2,000 No urban areas
Pennsylvania Stopping on steep grades
Avoid truck traffic
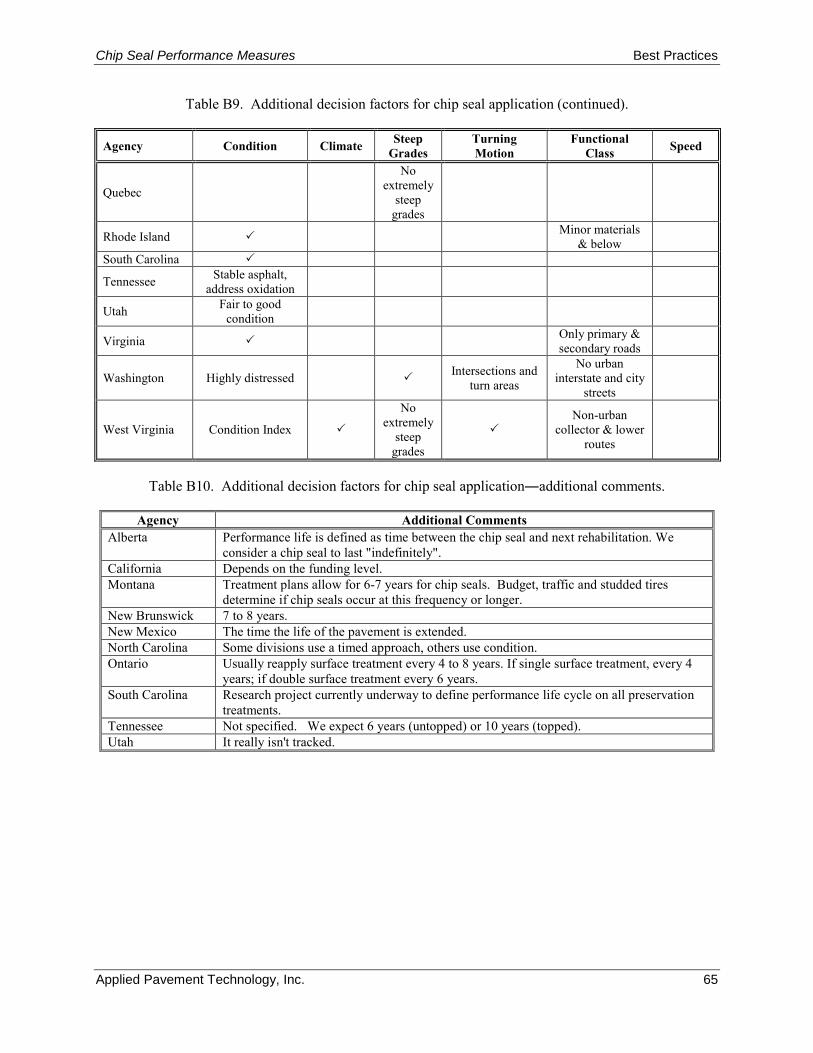
Chip Seal Performance Measures Best Practices
Applied Pavement Technology, Inc. 65
Table B9. Additional decision factors for chip seal application (continued).
Agency Condition Climate Steep Grades
Turning Motion
Functional Class Speed
Quebec
No extremely
steep grades
Rhode Island Minor materials & below
South Carolina
Tennessee Stable asphalt, address oxidation
Utah Fair to good condition
Virginia Only primary & secondary roads
Washington Highly distressed Intersections and
turn areas
No urban interstate and city
streets
West Virginia Condition Index
No extremely
steep grades
Non-urban
collector & lower routes
Table B10. Additional decision factors for chip seal application―additional comments.
Agency Additional Comments Alberta Performance life is defined as time between the chip seal and next rehabilitation. We
consider a chip seal to last "indefinitely". California Depends on the funding level. Montana Treatment plans allow for 6-7 years for chip seals. Budget, traffic and studded tires
determine if chip seals occur at this frequency or longer. New Brunswick 7 to 8 years. New Mexico The time the life of the pavement is extended. North Carolina Some divisions use a timed approach, others use condition. Ontario Usually reapply surface treatment every 4 to 8 years. If single surface treatment, every 4
years; if double surface treatment every 6 years. South Carolina Research project currently underway to define performance life cycle on all preservation
treatments. Tennessee Not specified. We expect 6 years (untopped) or 10 years (topped). Utah It really isn't tracked.
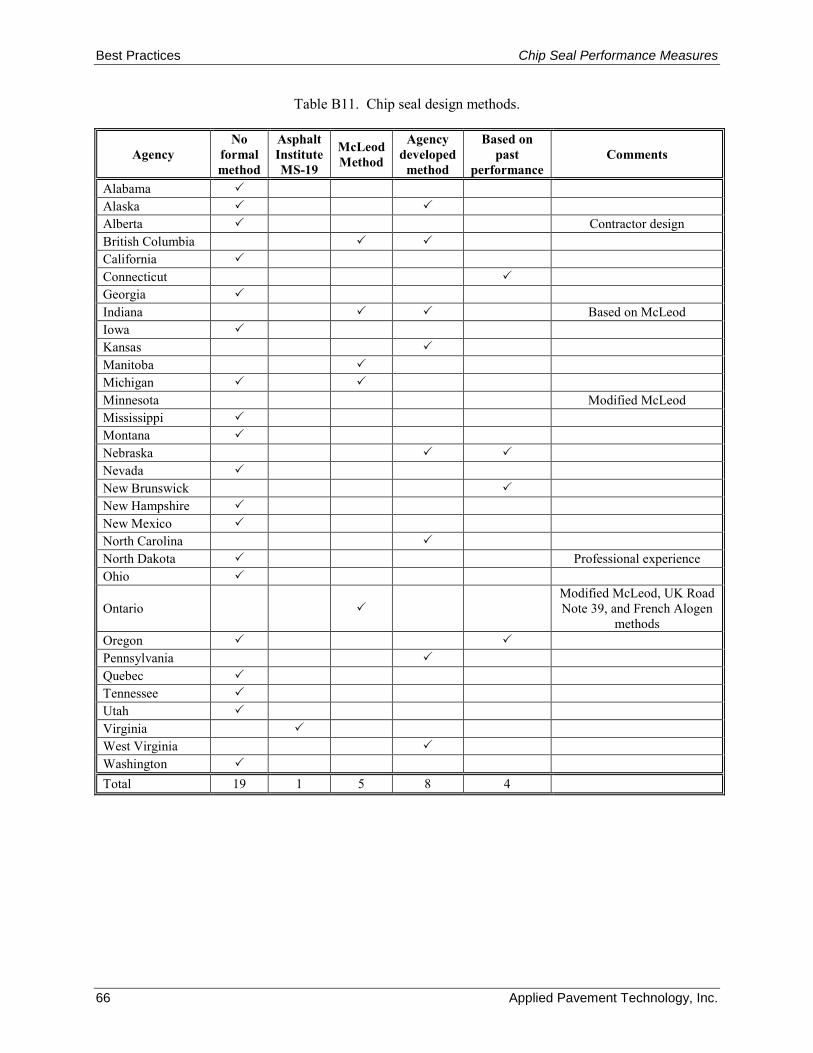
Best Practices Chip Seal Performance Measures
66 Applied Pavement Technology, Inc.
Table B11. Chip seal design methods.
Agency No
formal method
Asphalt Institute MS-19
McLeod Method
Agency developed
method
Based on past
performance Comments
Alabama Alaska Alberta Contractor design British Columbia California Connecticut Georgia Indiana Based on McLeod Iowa Kansas Manitoba Michigan Minnesota Modified McLeod Mississippi Montana Nebraska Nevada New Brunswick New Hampshire New Mexico North Carolina North Dakota Professional experience Ohio
Ontario
Modified McLeod, UK Road Note 39, and French Alogen
methods Oregon Pennsylvania Quebec Tennessee Utah Virginia West Virginia Washington Total 19 1 5 8 4
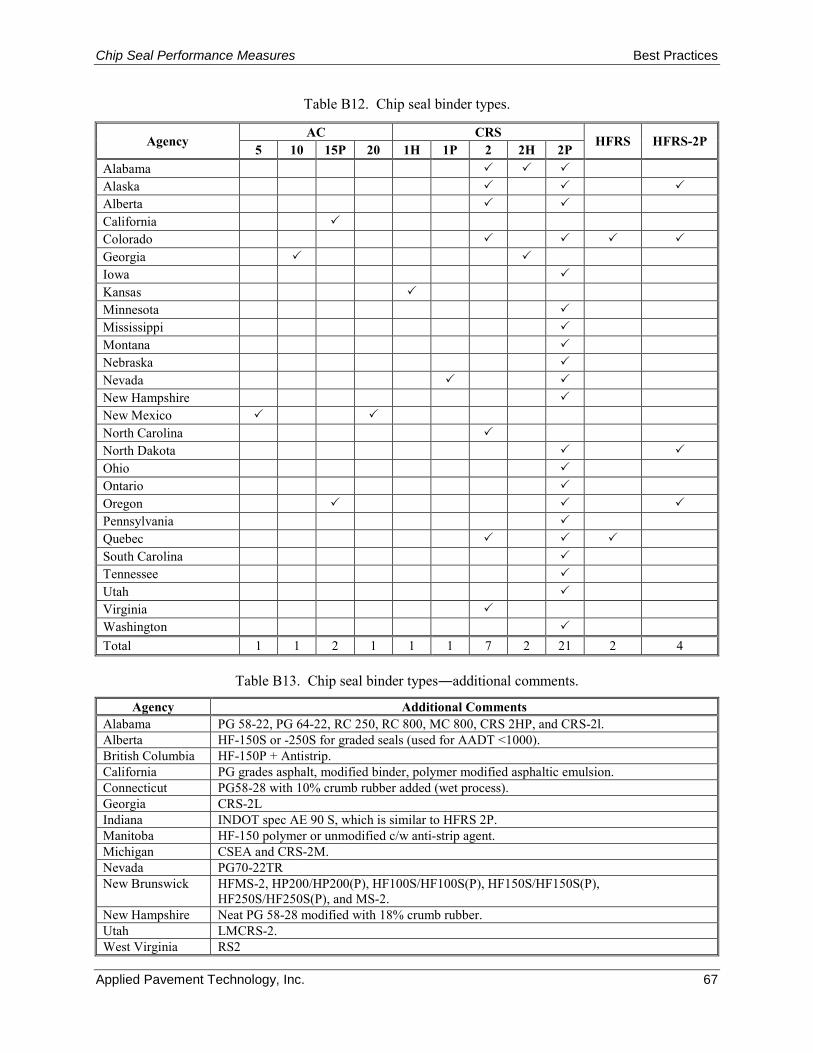
Chip Seal Performance Measures Best Practices
Applied Pavement Technology, Inc. 67
Table B12. Chip seal binder types.
Agency AC CRS
HFRS HFRS-2P 5 10 15P 20 1H 1P 2 2H 2P
Alabama Alaska Alberta California Colorado Georgia Iowa Kansas Minnesota Mississippi Montana Nebraska Nevada New Hampshire New Mexico North Carolina North Dakota Ohio Ontario Oregon Pennsylvania Quebec South Carolina Tennessee Utah Virginia Washington Total 1 1 2 1 1 1 7 2 21 2 4
Table B13. Chip seal binder types―additional comments.
Agency Additional Comments Alabama PG 58-22, PG 64-22, RC 250, RC 800, MC 800, CRS 2HP, and CRS-2l. Alberta HF-150S or -250S for graded seals (used for AADT <1000). British Columbia HF-150P + Antistrip. California PG grades asphalt, modified binder, polymer modified asphaltic emulsion. Connecticut PG58-28 with 10% crumb rubber added (wet process). Georgia CRS-2L Indiana INDOT spec AE 90 S, which is similar to HFRS 2P. Manitoba HF-150 polymer or unmodified c/w anti-strip agent. Michigan CSEA and CRS-2M. Nevada PG70-22TR New Brunswick HFMS-2, HP200/HP200(P), HF100S/HF100S(P), HF150S/HF150S(P),
HF250S/HF250S(P), and MS-2. New Hampshire Neat PG 58-28 modified with 18% crumb rubber. Utah LMCRS-2. West Virginia RS2
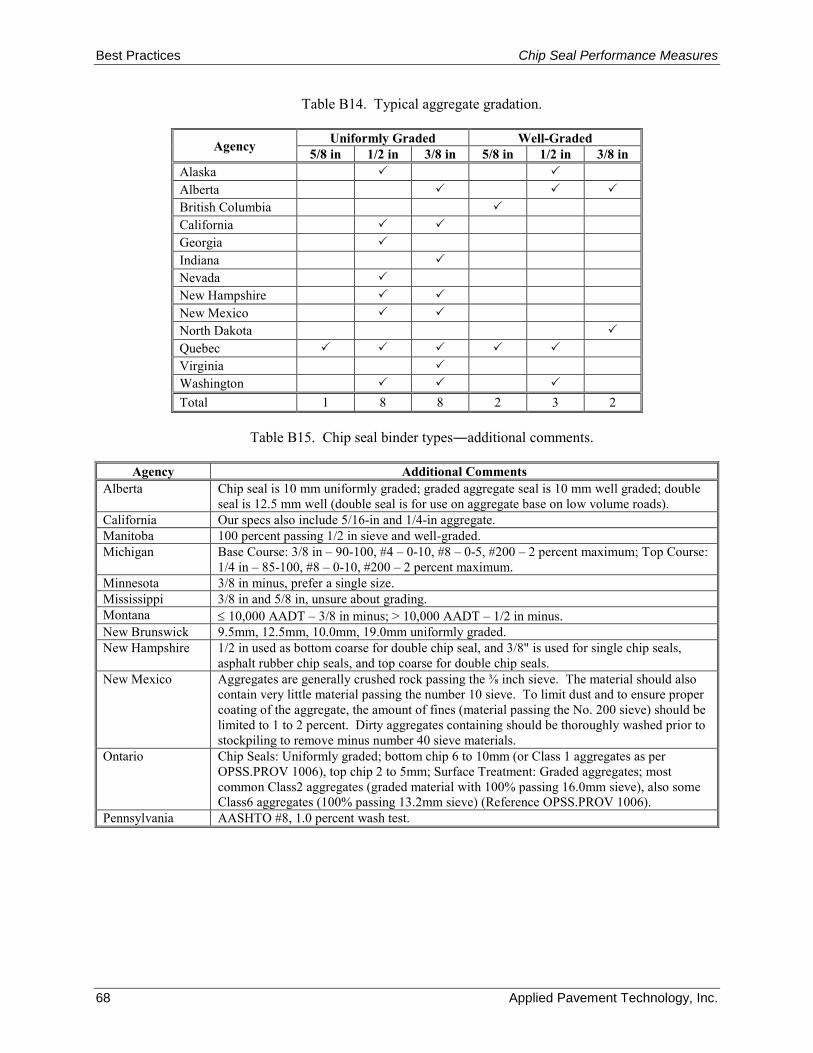
Best Practices Chip Seal Performance Measures
68 Applied Pavement Technology, Inc.
Table B14. Typical aggregate gradation.
Agency Uniformly Graded Well-Graded 5/8 in 1/2 in 3/8 in 5/8 in 1/2 in 3/8 in
Alaska Alberta British Columbia California Georgia Indiana Nevada New Hampshire New Mexico North Dakota Quebec Virginia Washington Total 1 8 8 2 3 2
Table B15. Chip seal binder types―additional comments.
Agency Additional Comments Alberta Chip seal is 10 mm uniformly graded; graded aggregate seal is 10 mm well graded; double
seal is 12.5 mm well (double seal is for use on aggregate base on low volume roads). California Our specs also include 5/16-in and 1/4-in aggregate. Manitoba 100 percent passing 1/2 in sieve and well-graded. Michigan Base Course: 3/8 in – 90-100, #4 – 0-10, #8 – 0-5, #200 – 2 percent maximum; Top Course:
1/4 in – 85-100, #8 – 0-10, #200 – 2 percent maximum. Minnesota 3/8 in minus, prefer a single size. Mississippi 3/8 in and 5/8 in, unsure about grading. Montana ≤ 10,000 AADT – 3/8 in minus; > 10,000 AADT – 1/2 in minus. New Brunswick 9.5mm, 12.5mm, 10.0mm, 19.0mm uniformly graded. New Hampshire 1/2 in used as bottom coarse for double chip seal, and 3/8" is used for single chip seals,
asphalt rubber chip seals, and top coarse for double chip seals. New Mexico Aggregates are generally crushed rock passing the ⅜ inch sieve. The material should also
contain very little material passing the number 10 sieve. To limit dust and to ensure proper coating of the aggregate, the amount of fines (material passing the No. 200 sieve) should be limited to 1 to 2 percent. Dirty aggregates containing should be thoroughly washed prior to stockpiling to remove minus number 40 sieve materials.
Ontario Chip Seals: Uniformly graded; bottom chip 6 to 10mm (or Class 1 aggregates as per OPSS.PROV 1006), top chip 2 to 5mm; Surface Treatment: Graded aggregates; most common Class2 aggregates (graded material with 100% passing 16.0mm sieve), also some Class6 aggregates (100% passing 13.2mm sieve) (Reference OPSS.PROV 1006).
Pennsylvania AASHTO #8, 1.0 percent wash test.
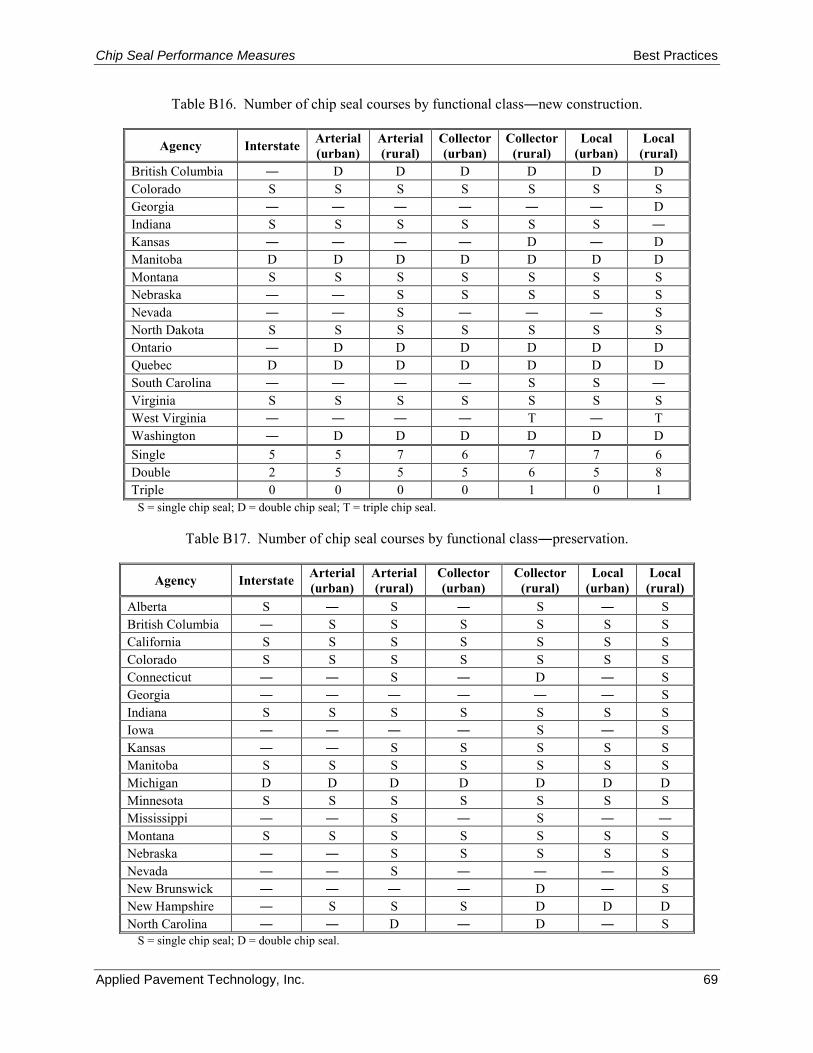
Chip Seal Performance Measures Best Practices
Applied Pavement Technology, Inc. 69
Table B16. Number of chip seal courses by functional class―new construction.
Agency Interstate Arterial (urban)
Arterial (rural)
Collector (urban)
Collector (rural)
Local (urban)
Local (rural)
British Columbia ― D D D D D D Colorado S S S S S S S Georgia ― ― ― ― ― ― D Indiana S S S S S S ― Kansas ― ― ― ― D ― D Manitoba D D D D D D D Montana S S S S S S S Nebraska ― ― S S S S S Nevada ― ― S ― ― ― S North Dakota S S S S S S S Ontario ― D D D D D D Quebec D D D D D D D South Carolina ― ― ― ― S S ― Virginia S S S S S S S West Virginia ― ― ― ― T ― T Washington ― D D D D D D Single 5 5 7 6 7 7 6 Double 2 5 5 5 6 5 8 Triple 0 0 0 0 1 0 1
S = single chip seal; D = double chip seal; T = triple chip seal.
Table B17. Number of chip seal courses by functional class―preservation.
Agency Interstate Arterial (urban)
Arterial (rural)
Collector (urban)
Collector (rural)
Local (urban)
Local (rural)
Alberta S ― S ― S ― S British Columbia ― S S S S S S California S S S S S S S Colorado S S S S S S S Connecticut ― ― S ― D ― S Georgia ― ― ― ― ― ― S Indiana S S S S S S S Iowa ― ― ― ― S ― S Kansas ― ― S S S S S Manitoba S S S S S S S Michigan D D D D D D D Minnesota S S S S S S S Mississippi ― ― S ― S ― ― Montana S S S S S S S Nebraska ― ― S S S S S Nevada ― ― S ― ― ― S New Brunswick ― ― ― ― D ― S New Hampshire ― S S S D D D North Carolina ― ― D ― D ― S
S = single chip seal; D = double chip seal.
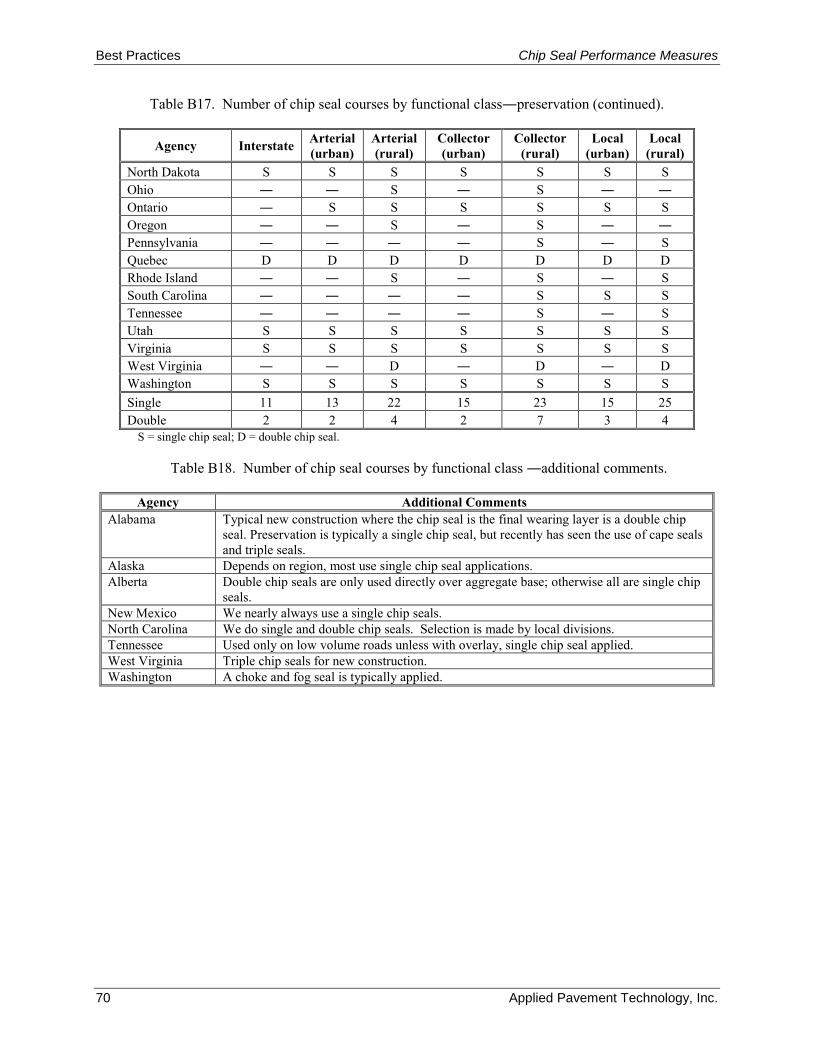
Best Practices Chip Seal Performance Measures
70 Applied Pavement Technology, Inc.
Table B17. Number of chip seal courses by functional class―preservation (continued).
Agency Interstate Arterial (urban)
Arterial (rural)
Collector (urban)
Collector (rural)
Local (urban)
Local (rural)
North Dakota S S S S S S S Ohio ― ― S ― S ― ― Ontario ― S S S S S S Oregon ― ― S ― S ― ― Pennsylvania ― ― ― ― S ― S Quebec D D D D D D D Rhode Island ― ― S ― S ― S South Carolina ― ― ― ― S S S Tennessee ― ― ― ― S ― S Utah S S S S S S S Virginia S S S S S S S West Virginia ― ― D ― D ― D Washington S S S S S S S Single 11 13 22 15 23 15 25 Double 2 2 4 2 7 3 4
S = single chip seal; D = double chip seal.
Table B18. Number of chip seal courses by functional class ―additional comments.
Agency Additional Comments Alabama Typical new construction where the chip seal is the final wearing layer is a double chip
seal. Preservation is typically a single chip seal, but recently has seen the use of cape seals and triple seals.
Alaska Depends on region, most use single chip seal applications. Alberta Double chip seals are only used directly over aggregate base; otherwise all are single chip
seals. New Mexico We nearly always use a single chip seals. North Carolina We do single and double chip seals. Selection is made by local divisions. Tennessee Used only on low volume roads unless with overlay, single chip seal applied. West Virginia Triple chip seals for new construction. Washington A choke and fog seal is typically applied.
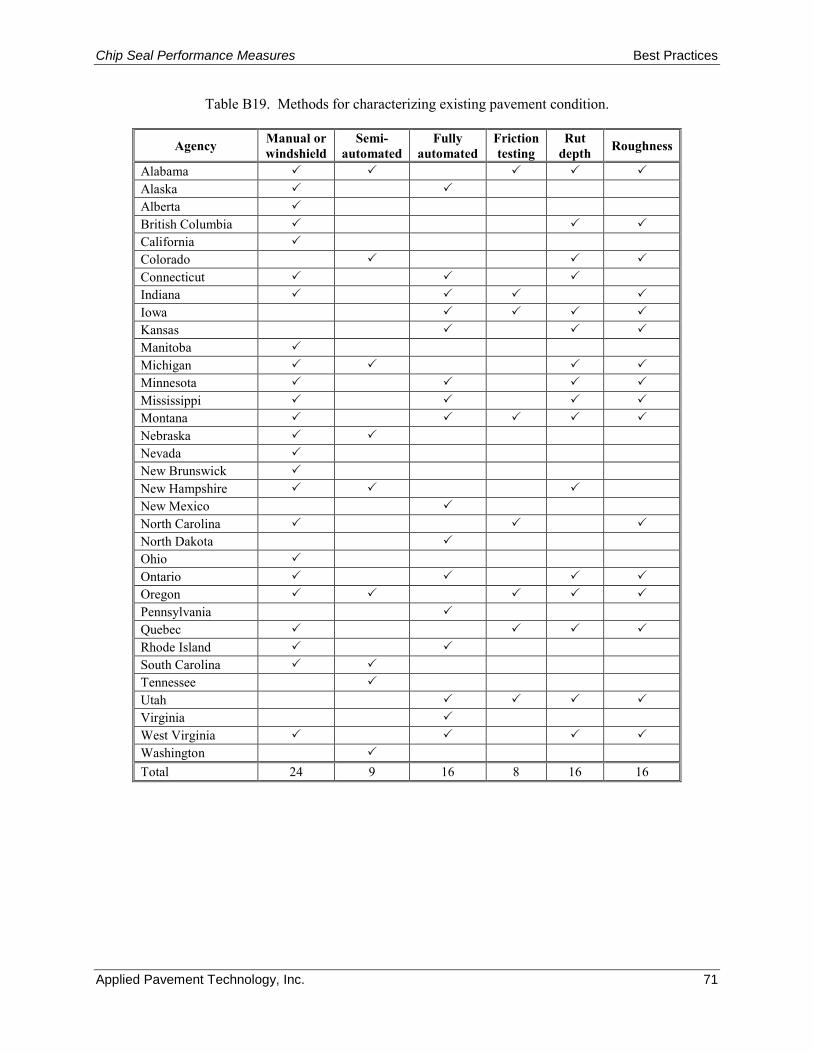
Chip Seal Performance Measures Best Practices
Applied Pavement Technology, Inc. 71
Table B19. Methods for characterizing existing pavement condition.
Agency Manual or windshield
Semi-automated
Fully automated
Friction testing
Rut depth Roughness
Alabama Alaska Alberta British Columbia California Colorado Connecticut Indiana Iowa Kansas Manitoba Michigan Minnesota Mississippi Montana Nebraska Nevada New Brunswick New Hampshire New Mexico North Carolina North Dakota Ohio Ontario Oregon Pennsylvania Quebec Rhode Island South Carolina Tennessee Utah Virginia West Virginia Washington Total 24 9 16 8 16 16
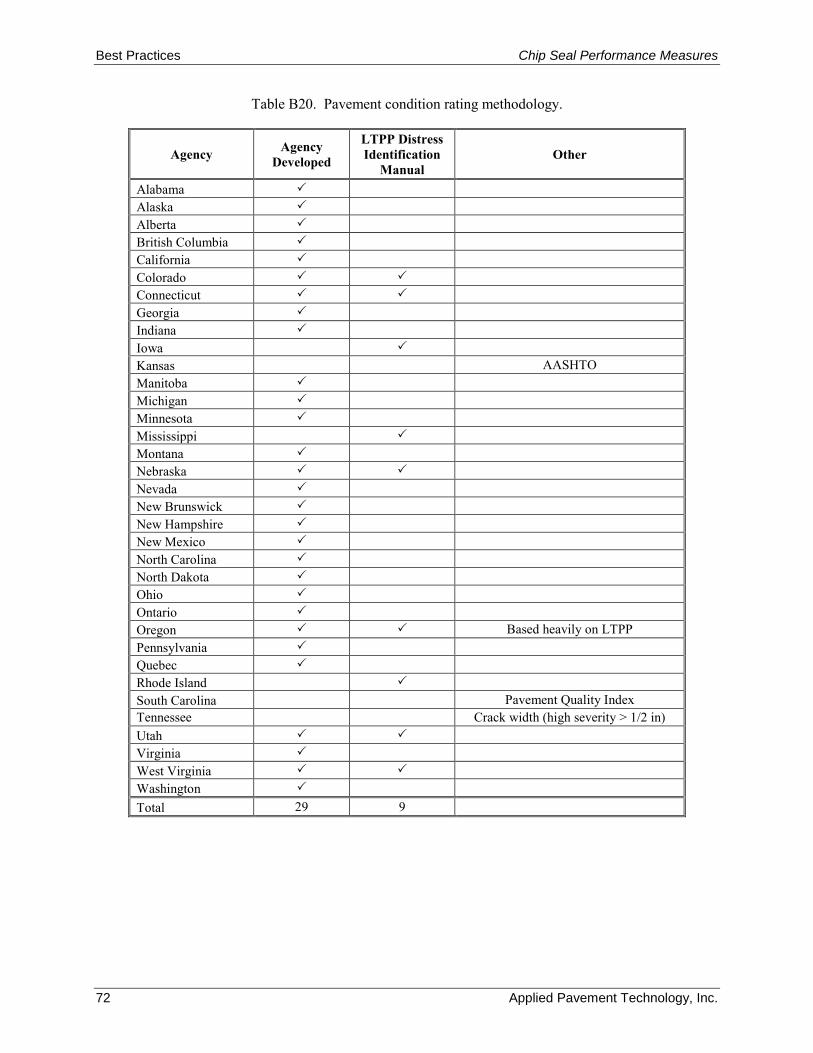
Best Practices Chip Seal Performance Measures
72 Applied Pavement Technology, Inc.
Table B20. Pavement condition rating methodology.
Agency Agency Developed
LTPP Distress Identification
Manual Other
Alabama Alaska Alberta British Columbia California Colorado Connecticut Georgia Indiana Iowa Kansas AASHTO Manitoba Michigan Minnesota Mississippi Montana Nebraska Nevada New Brunswick New Hampshire New Mexico North Carolina North Dakota Ohio Ontario Oregon Based heavily on LTPP Pennsylvania Quebec Rhode Island South Carolina Pavement Quality Index Tennessee Crack width (high severity > 1/2 in) Utah Virginia West Virginia Washington Total 29 9
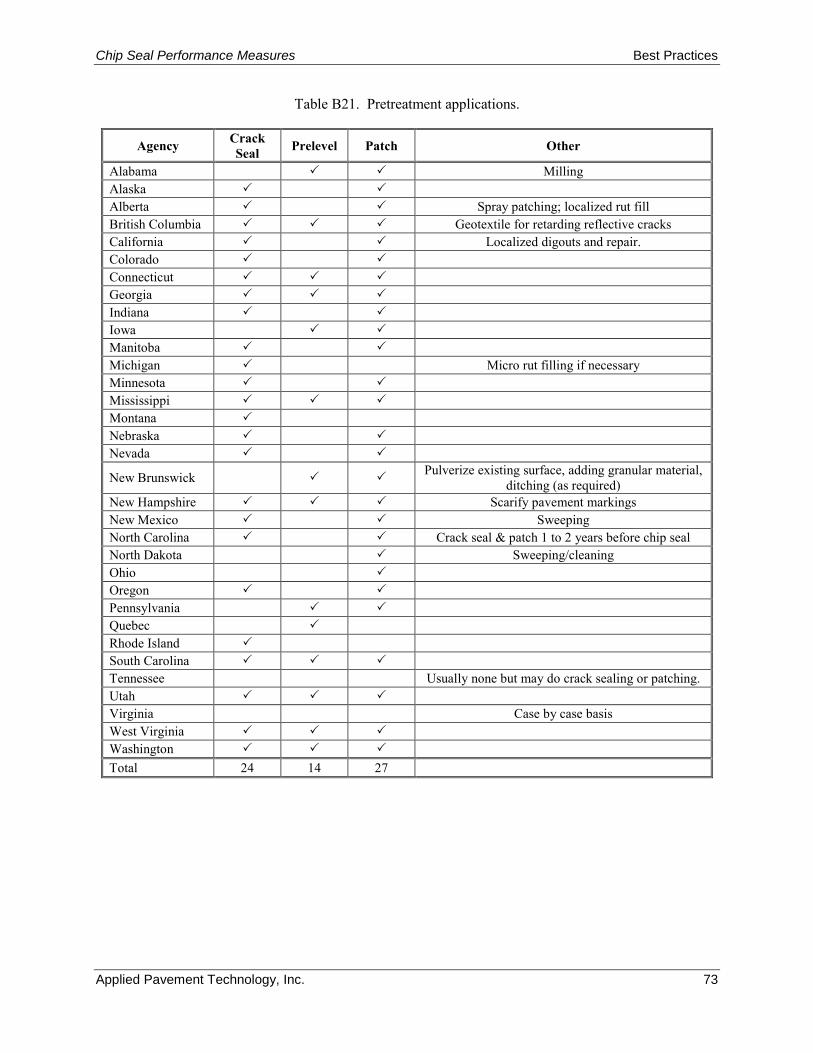
Chip Seal Performance Measures Best Practices
Applied Pavement Technology, Inc. 73
Table B21. Pretreatment applications.
Agency Crack Seal Prelevel Patch Other
Alabama Milling Alaska Alberta Spray patching; localized rut fill British Columbia Geotextile for retarding reflective cracks California Localized digouts and repair. Colorado Connecticut Georgia Indiana Iowa Manitoba Michigan Micro rut filling if necessary Minnesota Mississippi Montana Nebraska Nevada New Brunswick Pulverize existing surface, adding granular material,
ditching (as required) New Hampshire Scarify pavement markings New Mexico Sweeping North Carolina Crack seal & patch 1 to 2 years before chip seal North Dakota Sweeping/cleaning Ohio Oregon Pennsylvania Quebec Rhode Island South Carolina Tennessee Usually none but may do crack sealing or patching. Utah Virginia Case by case basis West Virginia Washington Total 24 14 27
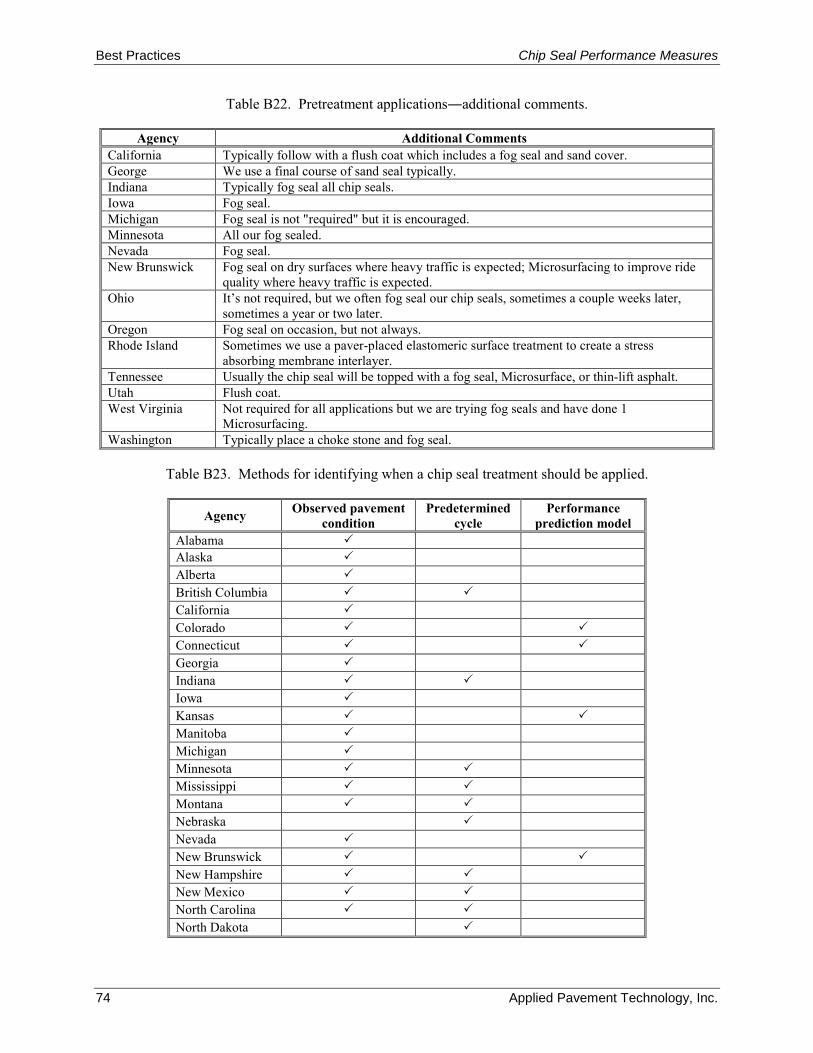
Best Practices Chip Seal Performance Measures
74 Applied Pavement Technology, Inc.
Table B22. Pretreatment applications―additional comments.
Agency Additional Comments California Typically follow with a flush coat which includes a fog seal and sand cover. George We use a final course of sand seal typically. Indiana Typically fog seal all chip seals. Iowa Fog seal. Michigan Fog seal is not "required" but it is encouraged. Minnesota All our fog sealed. Nevada Fog seal. New Brunswick Fog seal on dry surfaces where heavy traffic is expected; Microsurfacing to improve ride
quality where heavy traffic is expected. Ohio It’s not required, but we often fog seal our chip seals, sometimes a couple weeks later,
sometimes a year or two later. Oregon Fog seal on occasion, but not always. Rhode Island Sometimes we use a paver-placed elastomeric surface treatment to create a stress
absorbing membrane interlayer. Tennessee Usually the chip seal will be topped with a fog seal, Microsurface, or thin-lift asphalt. Utah Flush coat. West Virginia Not required for all applications but we are trying fog seals and have done 1
Microsurfacing. Washington Typically place a choke stone and fog seal.
Table B23. Methods for identifying when a chip seal treatment should be applied.
Agency Observed pavement condition
Predetermined cycle
Performance prediction model
Alabama Alaska Alberta British Columbia California Colorado Connecticut Georgia Indiana Iowa Kansas Manitoba Michigan Minnesota Mississippi Montana Nebraska Nevada New Brunswick New Hampshire New Mexico North Carolina North Dakota
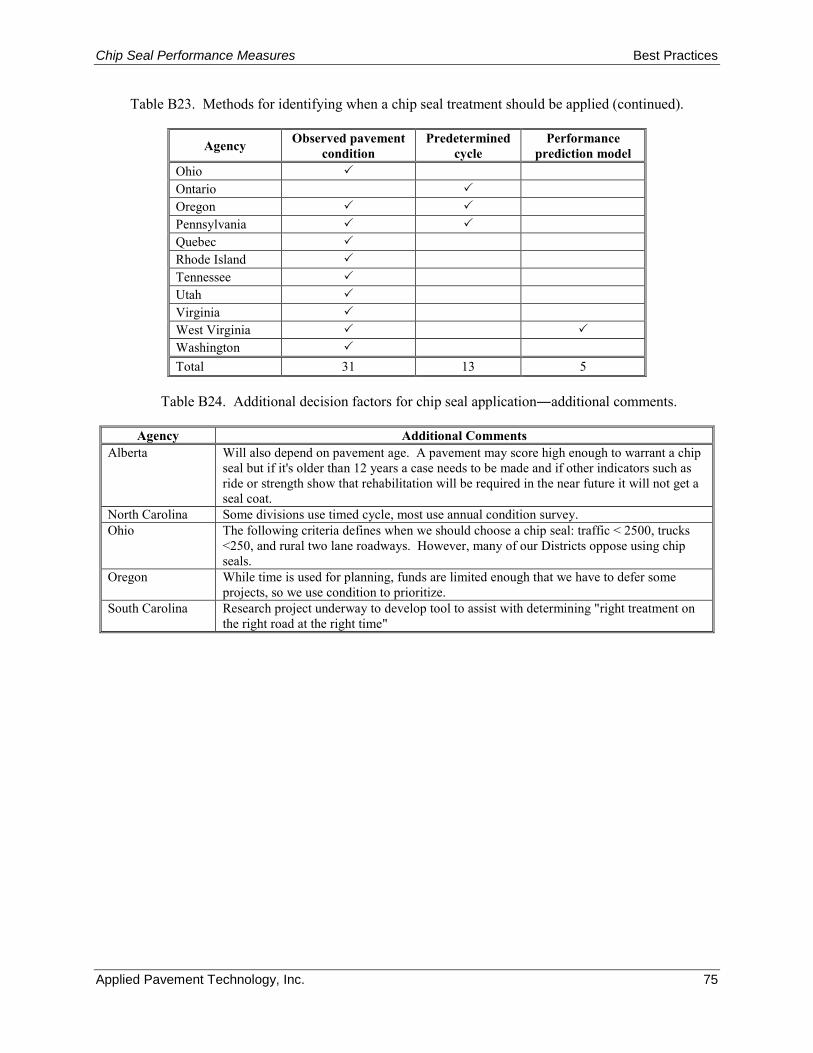
Chip Seal Performance Measures Best Practices
Applied Pavement Technology, Inc. 75
Table B23. Methods for identifying when a chip seal treatment should be applied (continued).
Agency Observed pavement condition
Predetermined cycle
Performance prediction model
Ohio Ontario Oregon Pennsylvania Quebec Rhode Island Tennessee Utah Virginia West Virginia Washington Total 31 13 5
Table B24. Additional decision factors for chip seal application―additional comments.
Agency Additional Comments Alberta Will also depend on pavement age. A pavement may score high enough to warrant a chip
seal but if it's older than 12 years a case needs to be made and if other indicators such as ride or strength show that rehabilitation will be required in the near future it will not get a seal coat.
North Carolina Some divisions use timed cycle, most use annual condition survey. Ohio The following criteria defines when we should choose a chip seal: traffic < 2500, trucks
<250, and rural two lane roadways. However, many of our Districts oppose using chip seals.
Oregon While time is used for planning, funds are limited enough that we have to defer some projects, so we use condition to prioritize.
South Carolina Research project underway to develop tool to assist with determining "right treatment on the right road at the right time"

Best Practices Chip Seal Performance Measures
76 Applied Pavement Technology, Inc.
Age
ncy
Long
itudi
nal
Cra
ckin
gA
lliga
tor
Cra
ckin
gTr
ansv
erse
C
rack
ing
Blo
ck
Cra
ckin
gR
avel
ing/
W
eath
erin
gB
leed
ing
Rut
Dep
thR
ough
ness
Fric
tion
Com
bine
d C
ondi
tion
Inde
xA
lber
ta
35
1,2
Briti
sh C
olum
bia
< 0.
40 in
Min
imal
< 0.
40 in
Min
imal
< 0.
40 in
Calif
orni
a<
10 p
erce
nt3
< 0.
50 in
Colo
rado
Conn
ectic
ut>
5.54
5.0
– 6.
85<
0.50
in
Geor
gia
Indi
ana
< 0.
25 in
< 13
0 in
/mi
< 25
Kan
sas
Man
itoba
Mic
higa
n6<
0.13
in<
107
in/m
iM
issi
ssip
pi7
Non
e7
< 0.
25 in
< 24
0 in
/mi
Nev
ada8,
9>
0.20
in, ≥
400
ft2 ;
≤
0.20
in, ≤
650
ft2
> 0
.25
in, ≥
40
ft2 ;
≤ 0.
25 in
, ≤ 5
0 ft2
> 0
.25
in, ≥
200
ft2 ;
≤
0.25
in, ≤
300
ft2
≥ 0.
15 in
;
< 0.
15 in
≥ 16
0 in
/mi;
<
160
in/m
i
New
Ham
pshi
re<
0.50
in
New
Mex
ico
< 0.
25 in
Low
sev
erity
< 0.
25 in
no lo
ose
aggr
egat
eN
one
< 0.
38 in
Nor
th C
arol
ina
Sp
ot re
pair
< 0.
50 in
< 37
65 –
852
Ohi
oN
one
< 0.
25 in
66 –
802
Ore
gon
Low
sev
erity
Low
sev
erity
aggr
egat
e lo
se &
sno
w
plow
dam
age
Penn
sylv
ania
Que
bec
< 25
per
cent
< 20
per
cent
< 0.
60 in
> 25
0 in
/mi
Rhod
e Is
land
250
– 7
0
if
ride
scor
e ≥
65>
70
if
ride
scor
e ≥
65
> 70
If rid
e sc
ore
≥ 65
, th
en 7
0 –
9050
- 75
≥ 65
70 –
85
Tenn
esse
e<
3.510
Uta
h2,11
≥ 50
(lev
el 2
)12,1
3
≥ 75
(all
othe
rs)12
≥ 70
(all
othe
rs)14
≥ 50
(lev
el 2
)13
≥ 70
(all
othe
rs)
≥ 30
(lev
el 2
)13
≥ 70
(all
othe
rs)
Wes
t Virg
inia
144
43.
5
3.
5
1 Sc
ore
also
bas
ed o
n ag
e, A
AD
T, s
urfa
ce te
xtur
e, a
nd fo
reig
n m
ater
ial (
AT
200
0).
10 Sc
ale
0 to
5 (e
xcel
lent
).2
Scal
e 0
(poo
r) to
100
(exc
elle
nt).
Uta
h D
OT
- 50
is c
onsi
dere
d to
be
unac
cept
able
con
ditio
n.11
At l
east
6 y
ears
sin
ce la
st tr
eatm
ent.
3 M
ultip
le in
terc
onne
cted
cra
cks
in th
e w
heel
pat
h.12
Whe
el p
ath
crac
king
inde
x.4
1-9
(no
crac
king
) sca
le; v
alue
cor
resp
onds
to 1
,700
ft/m
i of w
heel
path
cra
ckin
g.13
Leve
l 2 ro
adw
ays
- AA
DT
< 1
,000
.5
1-9
scal
e; v
alue
cor
resp
onds
to a
full-
wid
th c
rack
spa
cing
of 1
6 to
50
ft.
14 En
viro
nmen
tal c
rack
ing
inde
x th
at in
clud
es tr
ansv
erse
, lon
gitu
dina
l, an
d bl
ock
crac
king
.6
Rem
aini
ng S
ervi
ce L
ife >
5 y
rs (d
oubl
e) >
6 y
rs (s
ingl
e); D
istr
ess
Inde
x <
30 (d
oubl
e); <
25
(sin
gle)
; (M
IDO
T 2
014)
.7
< 15
per
cent
tota
l cra
ckin
g.8 F
or S
tate
rout
es, t
op v
alue
for s
egm
ents
with
PSI
≤ 2
.5; b
otto
m v
alue
for s
egm
ents
with
2.5
< P
SI ≤
4.0
(Haj
j, Lo
ria, a
nd S
ebaa
ly 2
009)
.9 F
or U
S &
Inte
rsta
te ro
utes
, top
val
ue fo
r seg
men
ts w
ith P
SI ≤
2.8
; bot
tom
val
ue fo
r seg
men
ts w
ith 2
.8 <
PSI
≤ 4
.0 (H
ajj,
Loria
, and
Seb
aaly
200
9).
Tabl
e B
25.
Dis
tress
type
(s) a
nd tr
igge
r val
ue(s
) for
det
erm
inin
g ch
ip se
al tr
eatm
ent t
imin
g.