Embed Size (px)
Citation preview
ChinaSoft International (0354.HK)
Investor Presentation Second Quarter 2013
Disclaimer
These presentations and/or other documents have been written and presented by
Chinasoft International Limited (“ChinaSoft International” or “the Company”).
The information presented or contained in these materials is subject to change
without notice and its accuracy is not guaranteed.
Neither the presentation nor any of the information contained therein constitutes an
offer to sell or issue or the solicitation of an offer to buy or acquire or invitation to
purchases or subscribe for any securities of the Company in any jurisdiction or an
inducement to enter into investment activity, nor may it or any part of it form the basis
of or be relied upon in connection with any contract, commitment or investment
decision whatsoever.
2
Strategic Partnerships and Growth Strategies
Background Info
Background Info 1
Deep domain expertise in China’s most attractive verticals 2
Comprehensive end-to-end service offerings with superior
consulting and solution capabilities 3
Serving blue-chip clients with strong China presence and global delivery
capabilities 4
Financials
5
6
3
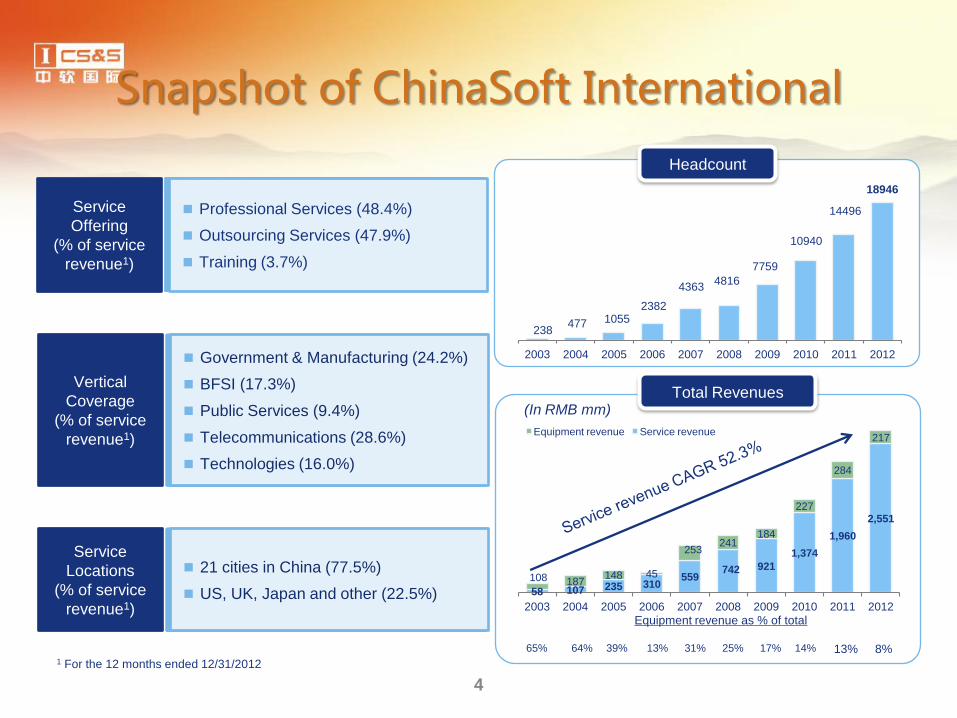
Snapshot of ChinaSoft International
4
238 477 1055
2382
4363 4816
7759
10940
14496
18946
2003 2004 2005 2006 2007 2008 2009 2010 2011 2012
58 107 235 310 559
742 921
1,374
1,960
2,551
108 187 148 45
253 241
184
227
284
217
2003 2004 2005 2006 2007 2008 2009 2010 2011 2012
Equipment revenue Service revenue
Service
Offering
(% of service
revenue1)
Professional Services (48.4%)
Outsourcing Services (47.9%)
Training (3.7%)
Vertical
Coverage
(% of service
revenue1)
Government & Manufacturing (24.2%)
BFSI (17.3%)
Public Services (9.4%)
Telecommunications (28.6%)
Technologies (16.0%)
Headcount
Total Revenues (In RMB mm)
Service
Locations
(% of service
revenue1)
21 cities in China (77.5%)
US, UK, Japan and other (22.5%)
64% 13% 31% 25% 17% 14%
Equipment revenue as % of total
39% 65%
1 For the 12 months ended 12/31/2012
13% 8%
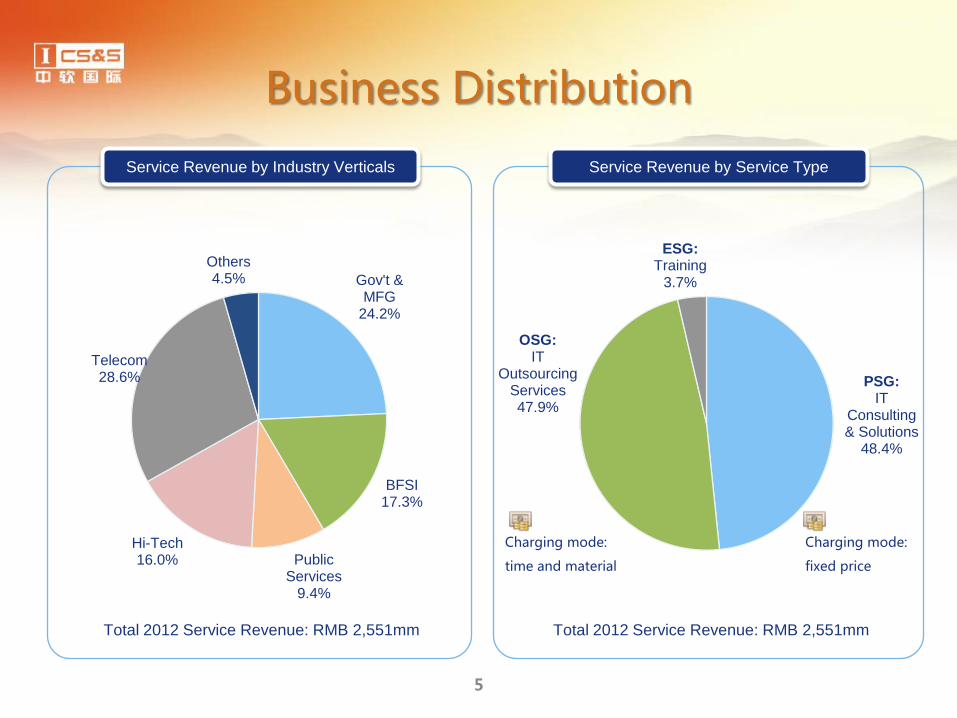
Business Distribution
5
Gov't & MFG
24.2%
BFSI 17.3%
Public Services
9.4%
Hi-Tech 16.0%
Telecom 28.6%
Others 4.5%
PSG: IT
Consulting & Solutions
48.4%
OSG: IT
Outsourcing Services 47.9%
ESG: Training
3.7%
Charging mode:
fixed price
Charging mode:
time and material
Service Revenue by Industry Verticals
Service Revenue by Service Type
Total 2012 Service Revenue: RMB 2,551mm Total 2012 Service Revenue: RMB 2,551mm
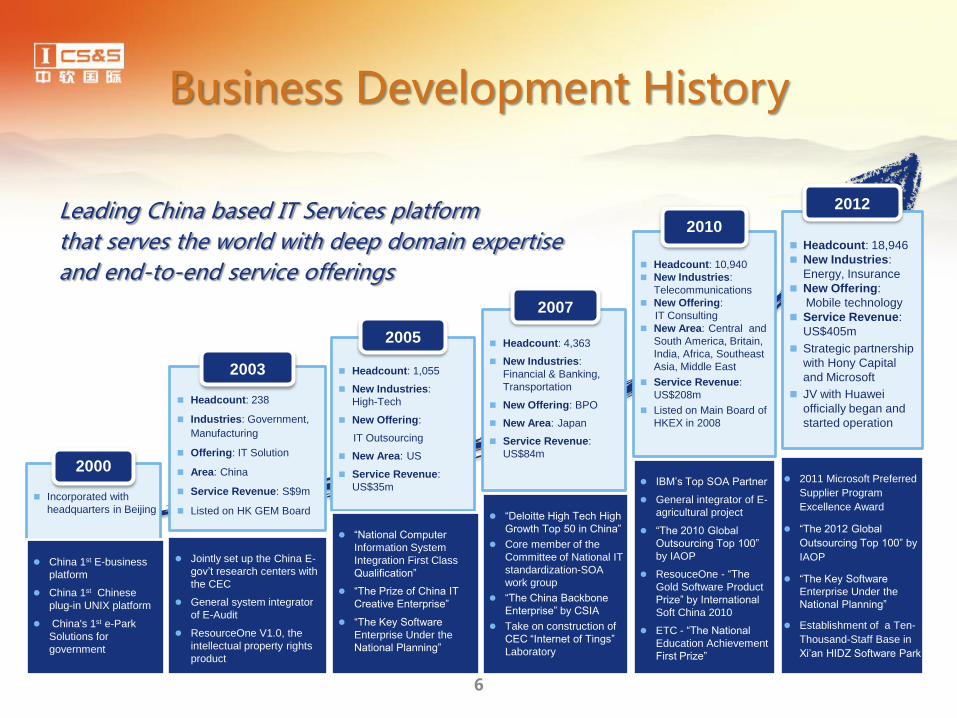
Business Development History
6
Incorporated with
headquarters in Beijing
2000
China 1st E-business
platform
China 1st Chinese
plug-in UNIX platform
China's 1st e-Park
Solutions for
government
Headcount: 238
Industries: Government,
Manufacturing
Offering: IT Solution
Area: China
Service Revenue: S$9m
Listed on HK GEM Board
2003
Jointly set up the China E-
gov’t research centers with
the CEC
General system integrator
of E-Audit
ResourceOne V1.0, the
intellectual property rights
product
Headcount: 1,055
New Industries:
High-Tech
New Offering:
IT Outsourcing
New Area: US
Service Revenue:
US$35m
2005
“National Computer
Information System
Integration First Class
Qualification”
“The Prize of China IT
Creative Enterprise”
“The Key Software
Enterprise Under the
National Planning”
Headcount: 10,940
New Industries:
Telecommunications
New Offering:
IT Consulting
New Area: Central and
South America, Britain,
India, Africa, Southeast
Asia, Middle East
Service Revenue:
US$208m
Listed on Main Board of
HKEX in 2008
2010
IBM’s Top SOA Partner
General integrator of E-
agricultural project
“The 2010 Global
Outsourcing Top 100”
by IAOP
ResouceOne - “The
Gold Software Product
Prize” by International
Soft China 2010
ETC - “The National
Education Achievement
First Prize”
Headcount: 4,363
New Industries:
Financial & Banking,
Transportation
New Offering: BPO
New Area: Japan
Service Revenue:
US$84m
2007
“Deloitte High Tech High
Growth Top 50 in China”
Core member of the
Committee of National IT
standardization-SOA
work group
“The China Backbone
Enterprise” by CSIA
Take on construction of
CEC “Internet of Tings”
Laboratory
Headcount: 18,946
New Industries:
Energy, Insurance
New Offering:
Mobile technology
Service Revenue:
US$405m
Strategic partnership
with Hony Capital
and Microsoft
JV with Huawei
officially began and
started operation
2012
2011 Microsoft Preferred
Supplier Program
Excellence Award
“The 2012 Global
Outsourcing Top 100” by
IAOP
“The Key Software
Enterprise Under the
National Planning”
Establishment of a Ten-
Thousand-Staff Base in
Xi’an HIDZ Software Park
Leading China based IT Services platform
that serves the world with deep domain expertise
and end-to-end service offerings
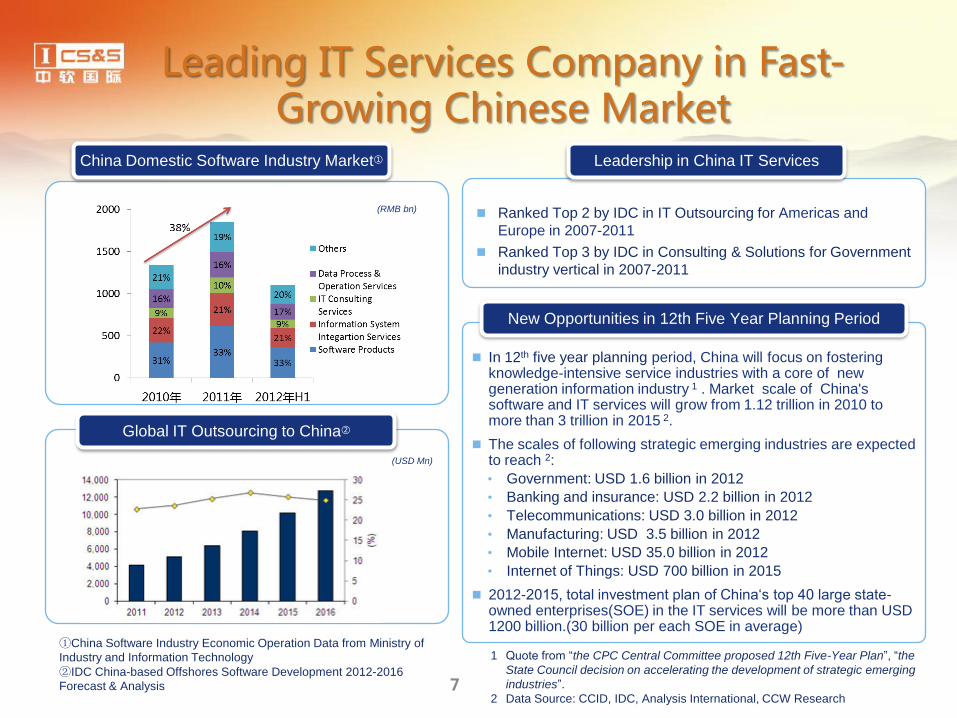
Leading IT Services Company in Fast-Growing Chinese Market
Ranked Top 2 by IDC in IT Outsourcing for Americas and
Europe in 2007-2011
Ranked Top 3 by IDC in Consulting & Solutions for Government
industry vertical in 2007-2011
Leadership in China IT Services
In 12th five year planning period, China will focus on fostering knowledge-intensive service industries with a core of new generation information industry 1 . Market scale of China's software and IT services will grow from 1.12 trillion in 2010 to more than 3 trillion in 2015 2.
The scales of following strategic emerging industries are expected to reach 2:
• Government: USD 1.6 billion in 2012
• Banking and insurance: USD 2.2 billion in 2012
• Telecommunications: USD 3.0 billion in 2012
• Manufacturing: USD 3.5 billion in 2012
• Mobile Internet: USD 35.0 billion in 2012
• Internet of Things: USD 700 billion in 2015
2012-2015, total investment plan of China‘s top 40 large state-owned enterprises(SOE) in the IT services will be more than USD 1200 billion.(30 billion per each SOE in average)
New Opportunities in 12th Five Year Planning Period
China Domestic Software Industry Market①
Global IT Outsourcing to China②
(USD Mn)
(RMB bn)
1 Quote from “the CPC Central Committee proposed 12th Five-Year Plan”, “the
State Council decision on accelerating the development of strategic emerging
industries”.
2 Data Source: CCID, IDC, Analysis International, CCW Research
①China Software Industry Economic Operation Data from Ministry of
Industry and Information Technology
②IDC China-based Offshores Software Development 2012-2016
Forecast & Analysis 7
Strategic Partnerships and Growth Strategies
Deep Domain Expertise
Background Info 1
Deep domain expertise in China’s most attractive verticals 2
Comprehensive end-to-end service offerings with superior
consulting and solution capabilities 3
Serving blue-chip clients with strong China presence and global delivery
capabilities 4
Financials
5
6
8
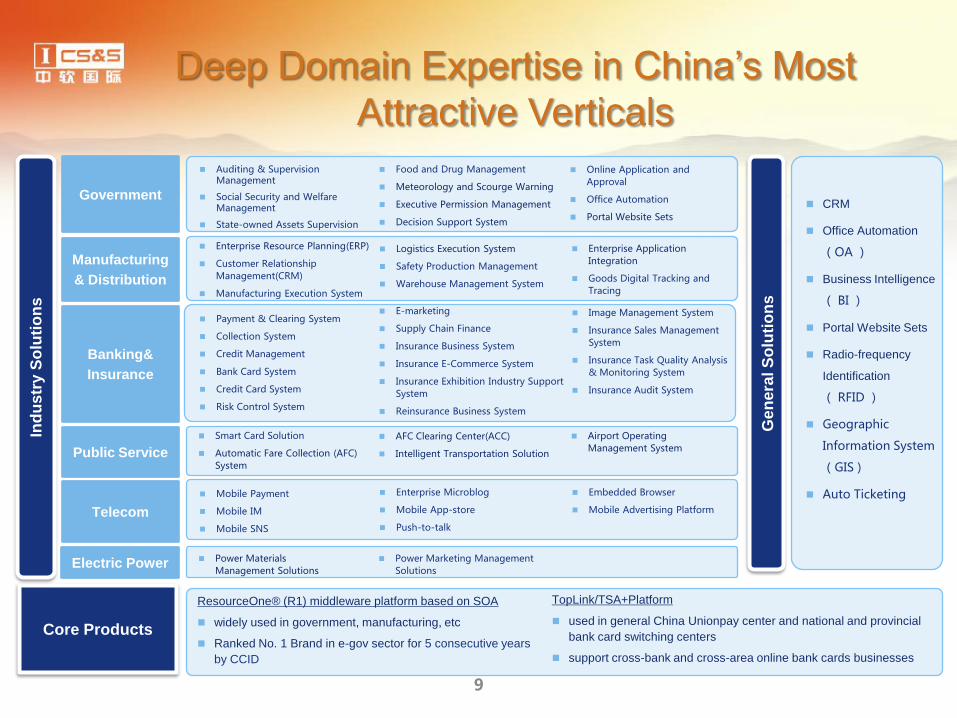
Deep Domain Expertise in China’s Most
Attractive Verticals
Core Products
Telecom
Banking&
Insurance
Manufacturing
& Distribution
Government
Auditing & Supervision Management
Social Security and Welfare Management
State-owned Assets Supervision
Food and Drug Management
Meteorology and Scourge Warning
Executive Permission Management
Decision Support System
Online Application and Approval
Office Automation
Portal Website Sets
Enterprise Resource Planning(ERP)
Customer Relationship Management(CRM)
Manufacturing Execution System
Logistics Execution System
Safety Production Management
Warehouse Management System
Enterprise Application Integration
Goods Digital Tracking and Tracing
Mobile Payment
Mobile IM
Mobile SNS
Enterprise Microblog
Mobile App-store
Push-to-talk
Embedded Browser
Mobile Advertising Platform
Payment & Clearing System
Collection System
Credit Management
Bank Card System
Credit Card System
Risk Control System
E-marketing
Supply Chain Finance
Insurance Business System
Insurance E-Commerce System
Insurance Exhibition Industry Support System
Reinsurance Business System
Image Management System
Insurance Sales Management System
Insurance Task Quality Analysis & Monitoring System
Insurance Audit System
Ind
us
try S
olu
tio
ns
Public Service Smart Card Solution
Automatic Fare Collection (AFC) System
AFC Clearing Center(ACC)
Intelligent Transportation Solution
Airport Operating Management System
CRM
Office Automation
(OA )
Business Intelligence
( BI )
Portal Website Sets
Radio-frequency
Identification
( RFID )
Geographic
Information System
(GIS )
Auto Ticketing
TopLink/TSA+Platform
used in general China Unionpay center and national and provincial
bank card switching centers
support cross-bank and cross-area online bank cards businesses
Ge
nera
l S
olu
tio
ns
ResourceOne® (R1) middleware platform based on SOA
widely used in government, manufacturing, etc
Ranked No. 1 Brand in e-gov sector for 5 consecutive years
by CCID
9
Electric Power Power Materials Management Solutions
Power Marketing Management Solutions
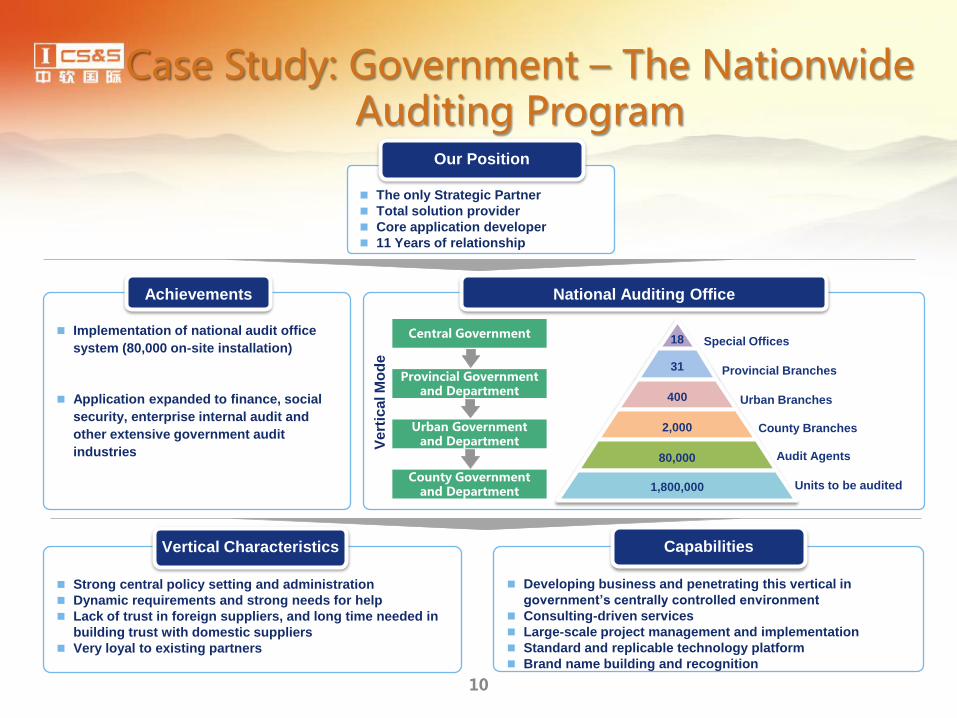
Case Study: Government – The Nationwide Auditing Program
Implementation of national audit office
system (80,000 on-site installation)
Application expanded to finance, social
security, enterprise internal audit and
other extensive government audit
industries
Achievements
Central Government
Provincial Government and Department
Urban Government and Department
County Government and Department
V
ert
ical M
od
e
18
31
400
2,000
80,000
1,800,000
Provincial Branches
Urban Branches
Special Offices
Units to be audited
Audit Agents
County Branches
National Auditing Office
The only Strategic Partner
Total solution provider
Core application developer
11 Years of relationship
Our Position
Developing business and penetrating this vertical in
government’s centrally controlled environment
Consulting-driven services
Large-scale project management and implementation
Standard and replicable technology platform
Brand name building and recognition
Capabilities
Strong central policy setting and administration
Dynamic requirements and strong needs for help
Lack of trust in foreign suppliers, and long time needed in
building trust with domestic suppliers
Very loyal to existing partners
Vertical Characteristics
10
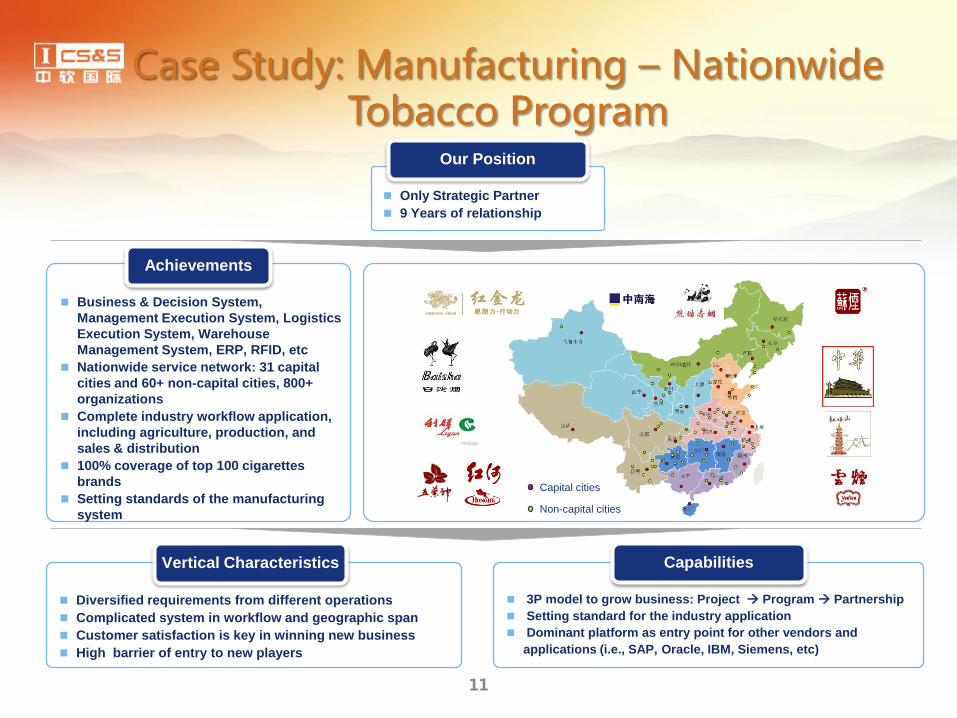
Case Study: Manufacturing – Nationwide Tobacco Program
Business & Decision System,
Management Execution System, Logistics
Execution System, Warehouse
Management System, ERP, RFID, etc
Nationwide service network: 31 capital
cities and 60+ non-capital cities, 800+
organizations
Complete industry workflow application,
including agriculture, production, and
sales & distribution
100% coverage of top 100 cigarettes
brands
Setting standards of the manufacturing
system
Achievements
Only Strategic Partner
9 Years of relationship
Capital cities
Non-capital cities
3P model to grow business: Project Program Partnership
Setting standard for the industry application
Dominant platform as entry point for other vendors and
applications (i.e., SAP, Oracle, IBM, Siemens, etc)
Capabilities
Diversified requirements from different operations
Complicated system in workflow and geographic span
Customer satisfaction is key in winning new business
High barrier of entry to new players
Vertical Characteristics
Our Position
11
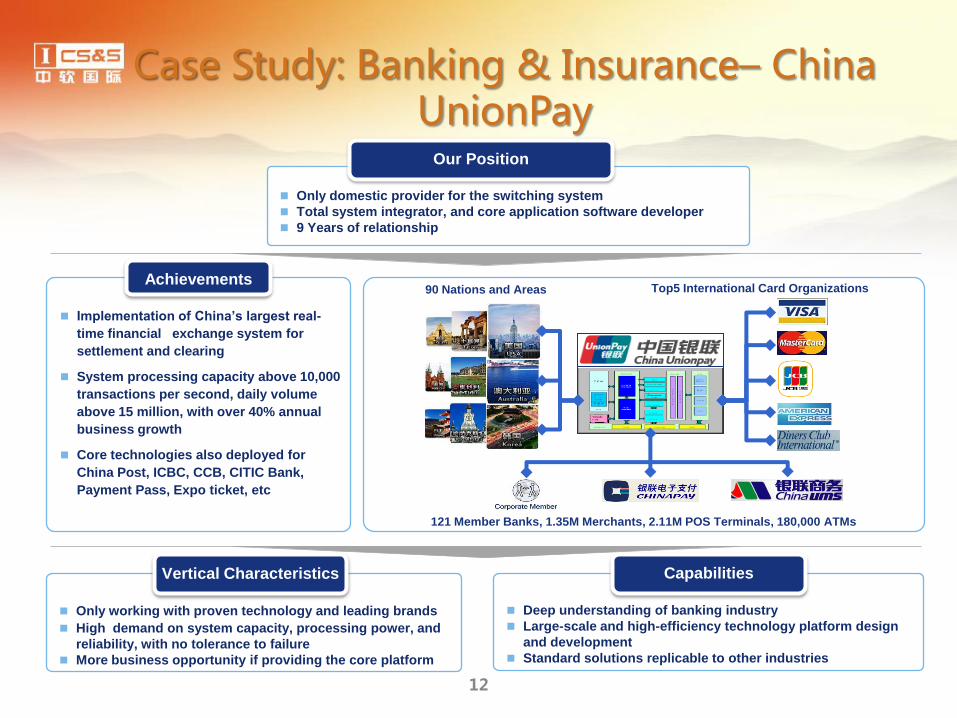
Case Study: Banking & Insurance– China UnionPay
Implementation of China’s largest real-
time financial exchange system for
settlement and clearing
System processing capacity above 10,000
transactions per second, daily volume
above 15 million, with over 40% annual
business growth
Core technologies also deployed for
China Post, ICBC, CCB, CITIC Bank,
Payment Pass, Expo ticket, etc
Achievements
Only domestic provider for the switching system
Total system integrator, and core application software developer
9 Years of relationship
Our Position
Top5 International Card Organizations 90 Nations and Areas
121 Member Banks, 1.35M Merchants, 2.11M POS Terminals, 180,000 ATMs
Deep understanding of banking industry
Large-scale and high-efficiency technology platform design
and development
Standard solutions replicable to other industries
Capabilities
Only working with proven technology and leading brands
High demand on system capacity, processing power, and
reliability, with no tolerance to failure
More business opportunity if providing the core platform
Vertical Characteristics
12
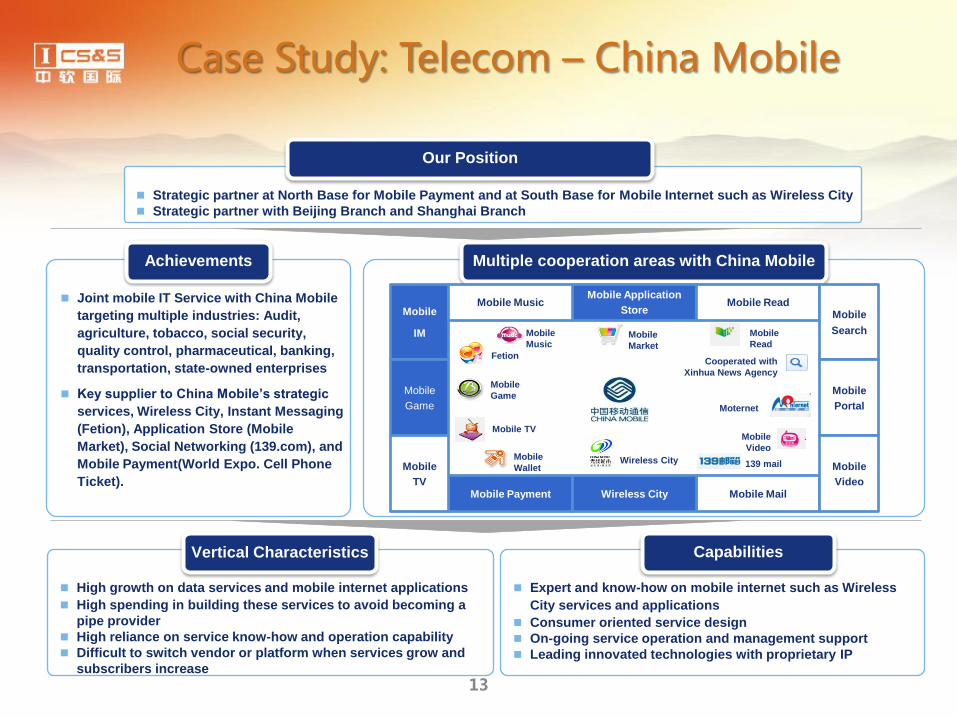
Case Study: Telecom – China Mobile
Joint mobile IT Service with China Mobile
targeting multiple industries: Audit,
agriculture, tobacco, social security,
quality control, pharmaceutical, banking,
transportation, state-owned enterprises
Key supplier to China Mobile’s strategic
services, Wireless City, Instant Messaging
(Fetion), Application Store (Mobile
Market), Social Networking (139.com), and
Mobile Payment(World Expo. Cell Phone
Ticket).
Achievements
Strategic partner at North Base for Mobile Payment and at South Base for Mobile Internet such as Wireless City
Strategic partner with Beijing Branch and Shanghai Branch
Our Position
Multiple cooperation areas with China Mobile
Mobile Application
Store Mobile
IM
Mobile Mail Mobile Payment
Mobile Read
Mobile
Game
Mobile Music
Wireless City
Mobile
Search
Mobile
Portal
Mobile
Video
Mobile
TV
Mobile
Market Fetion
Mobile
Music
Mobile
Read
Wireless City
Mobile TV
Mobile
Wallet
Mobile
Game
139 mail
Mobile
Video
Moternet
Cooperated with
Xinhua News Agency
Expert and know-how on mobile internet such as Wireless
City services and applications
Consumer oriented service design
On-going service operation and management support
Leading innovated technologies with proprietary IP
Capabilities
High growth on data services and mobile internet applications
High spending in building these services to avoid becoming a
pipe provider
High reliance on service know-how and operation capability
Difficult to switch vendor or platform when services grow and
subscribers increase
Vertical Characteristics
13
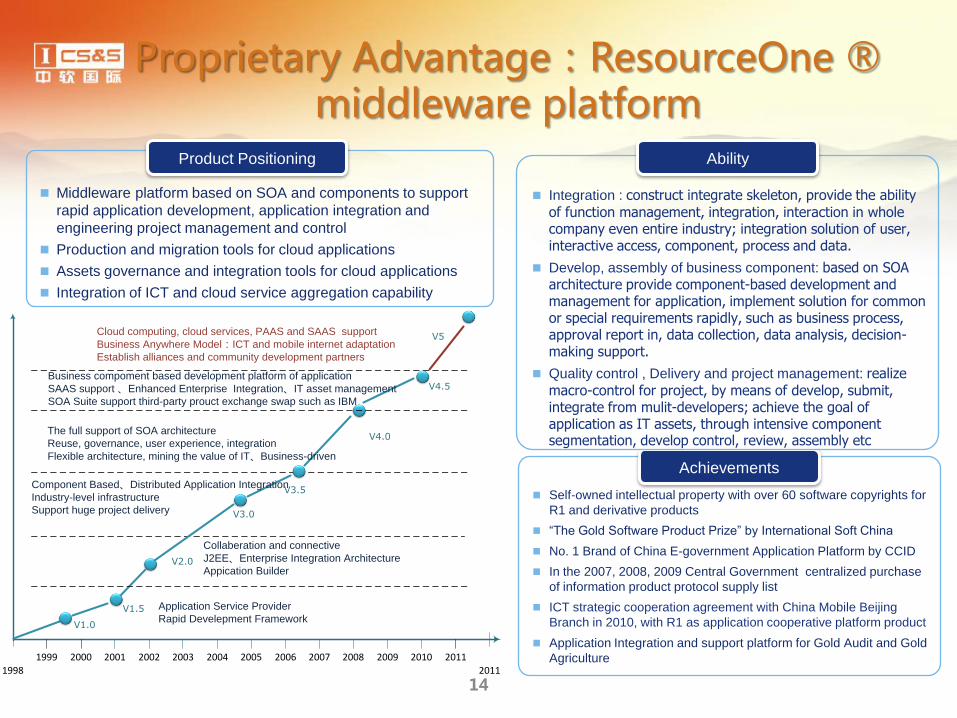
Proprietary Advantage:ResourceOne ® middleware platform
Self-owned intellectual property with over 60 software copyrights for
R1 and derivative products
“The Gold Software Product Prize” by International Soft China
No. 1 Brand of China E-government Application Platform by CCID
In the 2007, 2008, 2009 Central Government centralized purchase
of information product protocol supply list
ICT strategic cooperation agreement with China Mobile Beijing
Branch in 2010, with R1 as application cooperative platform product
Application Integration and support platform for Gold Audit and Gold
Agriculture
Achievements
Middleware platform based on SOA and components to support
rapid application development, application integration and
engineering project management and control
Production and migration tools for cloud applications
Assets governance and integration tools for cloud applications
Integration of ICT and cloud service aggregation capability
Product Positioning
Integration : construct integrate skeleton, provide the ability
of function management, integration, interaction in whole company even entire industry; integration solution of user, interactive access, component, process and data.
Develop, assembly of business component: based on SOA architecture provide component-based development and management for application, implement solution for common or special requirements rapidly, such as business process, approval report in, data collection, data analysis, decision-making support.
Quality control , Delivery and project management: realize
macro-control for project, by means of develop, submit, integrate from mulit-developers; achieve the goal of application as IT assets, through intensive component segmentation, develop control, review, assembly etc
Ability
1998 2011
1999 2000 2001 2002 2003 2004 2005 2006 2007 2008 2009 2010 2011
V1.0
V2.0
V3.0
V3.5
V4.0
V1.5
The full support of SOA architecture
Reuse, governance, user experience, integration
Flexible architecture, mining the value of IT、Business-driven
Collaberation and connective
J2EE、Enterprise Integration Architecture
Appication Builder
Application Service Provider
Rapid Develepment Framework
Component Based、Distributed Application Integration
Industry-level infrastructure
Support huge project delivery
V5Cloud computing, cloud services, PAAS and SAAS support
Business Anywhere Model:ICT and mobile internet adaptation
Establish alliances and community development partners
V4.5Business compoment based development platform of application
SAAS support 、Enhanced Enterprise Integration、IT asset management
SOA Suite support third-party prouct exchange swap such as IBM
14
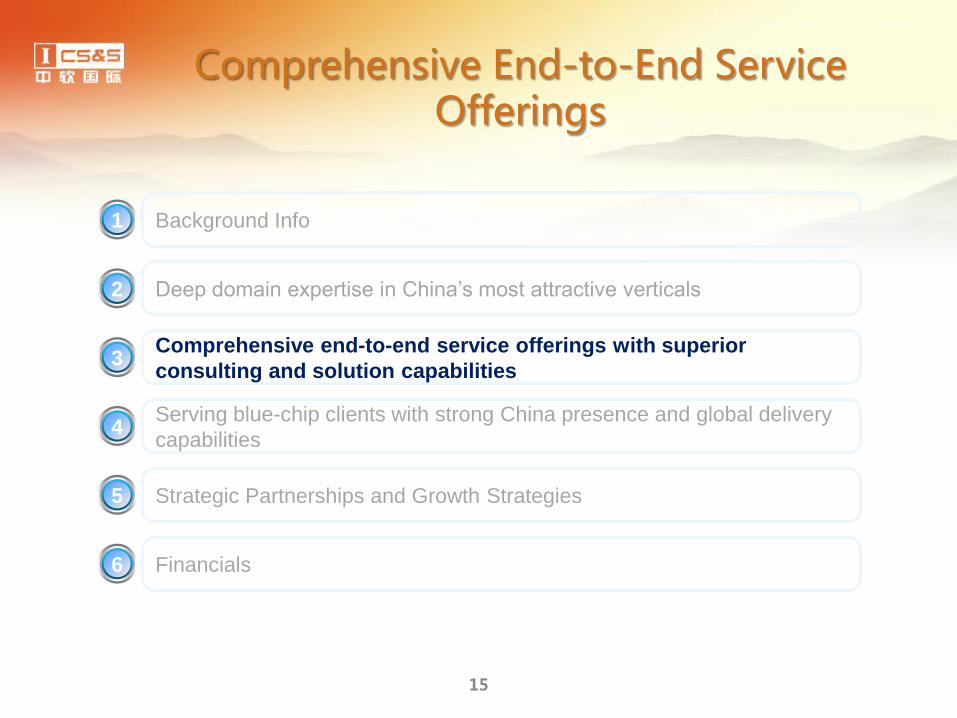
Strategic Partnerships and Growth Strategies
Comprehensive End-to-End Service Offerings
Background Info 1
Deep domain expertise in China’s most attractive verticals 2
Comprehensive end-to-end service offerings with superior
consulting and solution capabilities 3
Serving blue-chip clients with strong China presence and global delivery
capabilities 4
Financials
5
6
15

Moving Up the Value Chain
ESG
Emerging
Services Group
PSG Professional Service Group
OSG Outsourcing Service Group
Efficiency focused
效率型服务
Experience focused
经验型服务
Intelligence focused (Analytics, BI)
智慧型服务
Strengthening core competitiveness Moving up the value chain Enhancing profitability
16
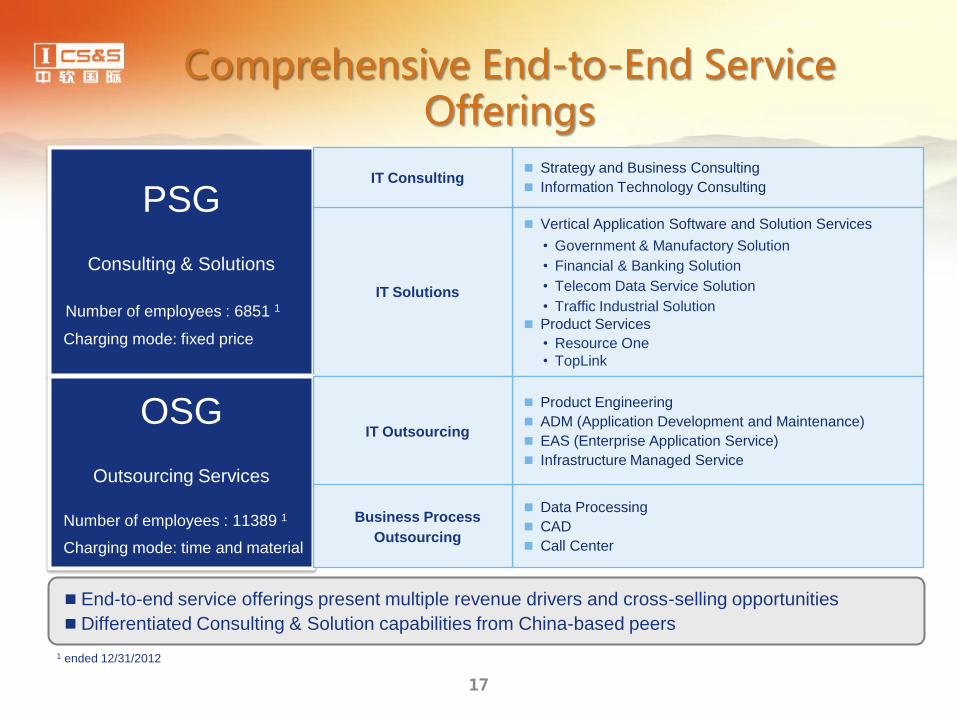
Comprehensive End-to-End Service Offerings
End-to-end service offerings present multiple revenue drivers and cross-selling opportunities
Differentiated Consulting & Solution capabilities from China-based peers
Strategy and Business Consulting
Information Technology Consulting
Vertical Application Software and Solution Services
• Government & Manufactory Solution
• Financial & Banking Solution
• Telecom Data Service Solution
• Traffic Industrial Solution
Product Services
• Resource One
• TopLink
Product Engineering
ADM (Application Development and Maintenance)
EAS (Enterprise Application Service)
Infrastructure Managed Service
PSG
Consulting & Solutions
Number of employees : 6851 1
Charging mode: fixed price
IT Solutions
IT Consulting
OSG
Outsourcing Services
Number of employees : 11389 1
Charging mode: time and material
IT Outsourcing
Data Processing
CAD
Call Center
Business Process
Outsourcing
1 ended 12/31/2012
17
Strategic Partnerships and Growth Strategies
Our Customers …
Background Info 1
Deep domain expertise in China’s most attractive verticals 2
Comprehensive end-to-end service offerings with superior
consulting and solution capabilities 3
Serving blue-chip clients with strong China presence and global
delivery capabilities 4
Financials
5
6
18
Customers Analysis
19
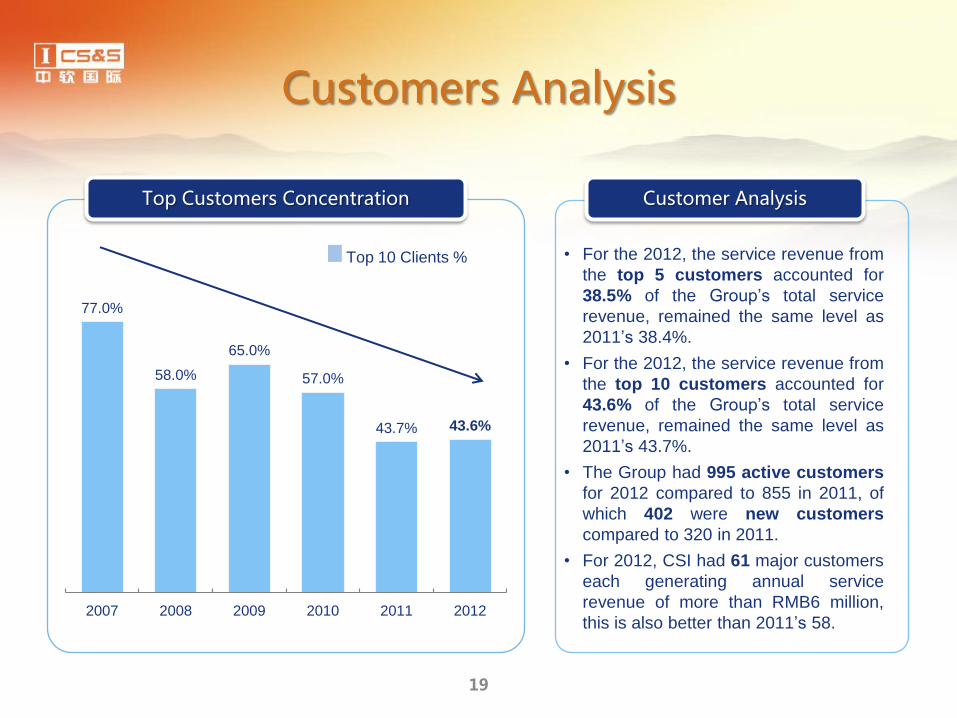
77.0%
58.0%
65.0%
57.0%
43.7% 43.6%
2007 2008 2009 2010 2011 2012
Top 10 Clients %
Customer Analysis
• For the 2012, the service revenue from
the top 5 customers accounted for
38.5% of the Group’s total service
revenue, remained the same level as
2011’s 38.4%.
• For the 2012, the service revenue from
the top 10 customers accounted for
43.6% of the Group’s total service
revenue, remained the same level as
2011’s 43.7%.
• The Group had 995 active customers
for 2012 compared to 855 in 2011, of
which 402 were new customers
compared to 320 in 2011.
• For 2012, CSI had 61 major customers
each generating annual service
revenue of more than RMB6 million,
this is also better than 2011’s 58.
Top Customers Concentration
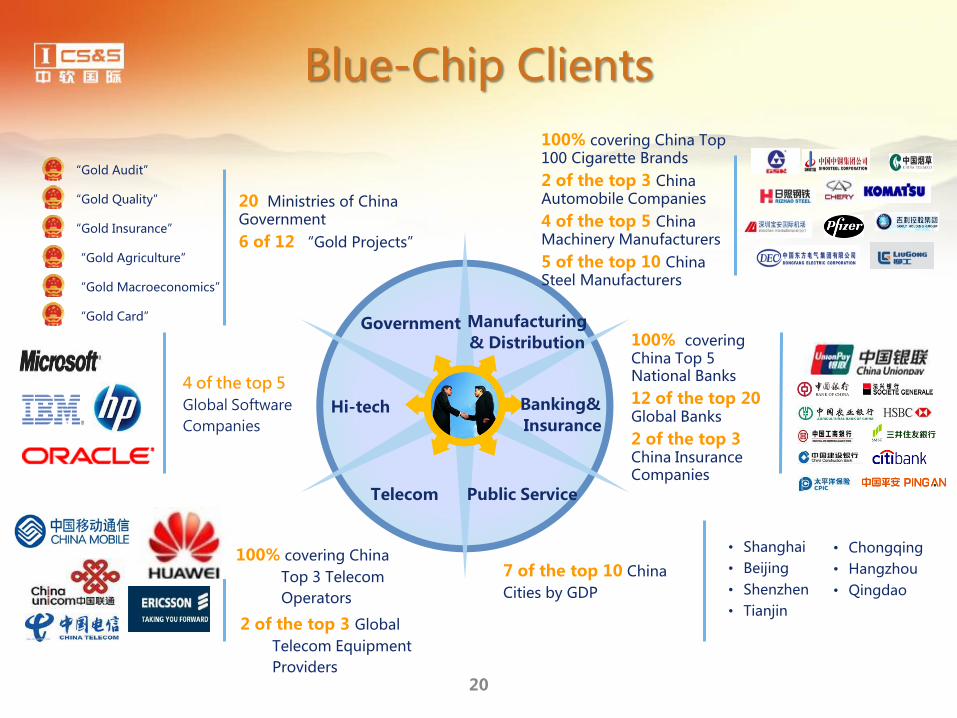
Blue-Chip Clients
20 Ministries of China Government
6 of 12 “Gold Projects”
100% covering China Top 5 National Banks
12 of the top 20 Global Banks
2 of the top 3 China Insurance Companies
7 of the top 10 China
Cities by GDP
4 of the top 5
Global Software
Companies
100% covering China
Top 3 Telecom
Operators
2 of the top 3 Global
Telecom Equipment
Providers
Government Manufacturing & Distribution
Banking& Insurance
Public Service Telecom
Hi-tech
100% covering China Top 100 Cigarette Brands
2 of the top 3 China Automobile Companies
4 of the top 5 China Machinery Manufacturers
5 of the top 10 China Steel Manufacturers
“Gold Audit”
“Gold Quality”
“Gold Insurance”
“Gold Agriculture”
“Gold Macroeconomics”
“Gold Card”
• Shanghai
• Beijing
• Shenzhen
• Tianjin
• Chongqing
• Hangzhou
• Qingdao
20
Global Delivery Capabilities
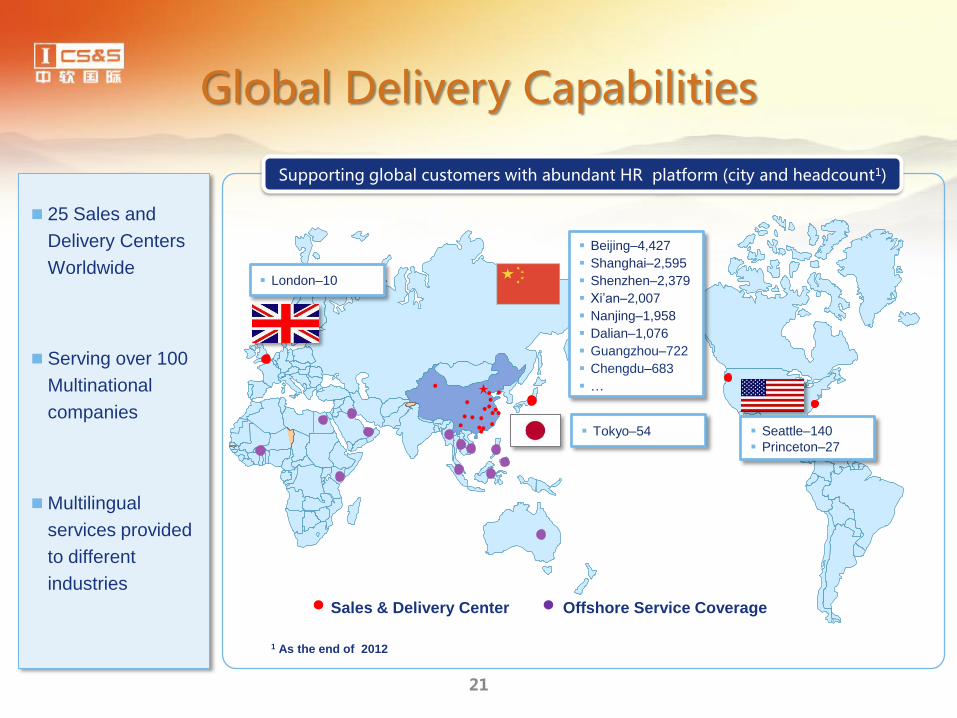
25 Sales and
Delivery Centers
Worldwide
Serving over 100
Multinational
companies
Multilingual
services provided
to different
industries
Supporting global customers with abundant HR platform (city and headcount1)
Offshore Service Coverage Sales & Delivery Center
Tokyo–54 Seattle–140
Princeton–27
London–10
Beijing–4,427
Shanghai–2,595
Shenzhen–2,379
Xi’an–2,007
Nanjing–1,958
Dalian–1,076
Guangzhou–722
Chengdu–683
…
1 As the end of 2012
21
Strategic Partnerships and Growth Strategies
Strategic Partnerships and Growth Strategies
Background Info 1
Deep domain expertise in China’s most attractive verticals 2
Comprehensive end-to-end service offerings with superior
consulting and solution capabilities 3
Serving blue-chip clients with strong China presence and global delivery
capabilities 4
Financials
5
6
22
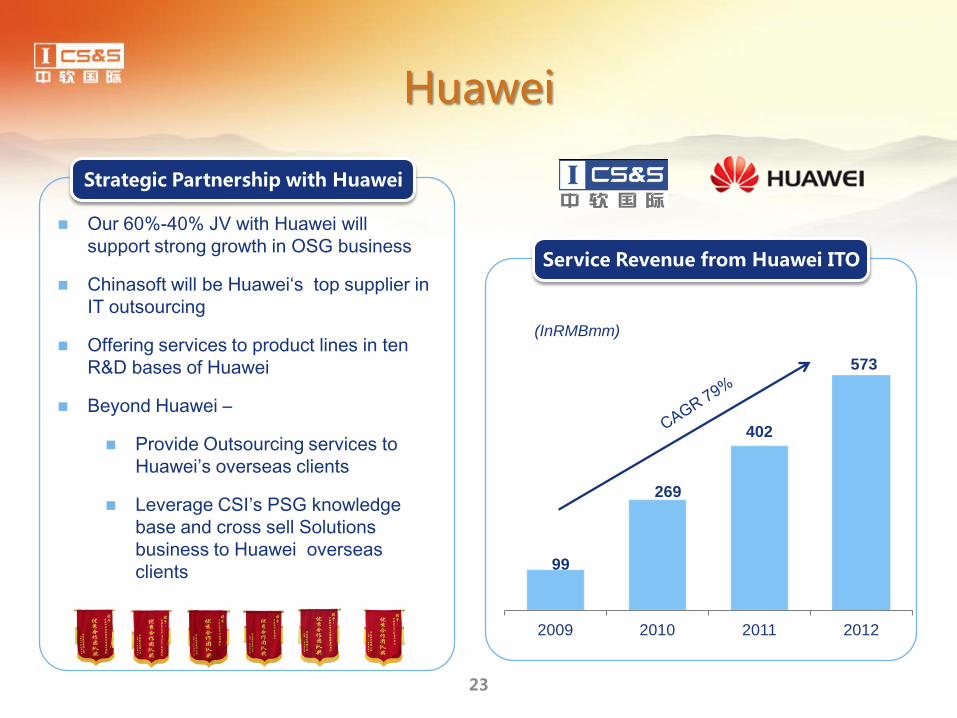
Huawei
Our 60%-40% JV with Huawei will
support strong growth in OSG business
Chinasoft will be Huawei‘s top supplier in
IT outsourcing
Offering services to product lines in ten
R&D bases of Huawei
Beyond Huawei –
Provide Outsourcing services to
Huawei’s overseas clients
Leverage CSI’s PSG knowledge
base and cross sell Solutions
business to Huawei overseas
clients
Strategic Partnership with Huawei
99
269
402
573
2009 2010 2011 2012
Service Revenue from Huawei ITO
(InRMBmm)
23
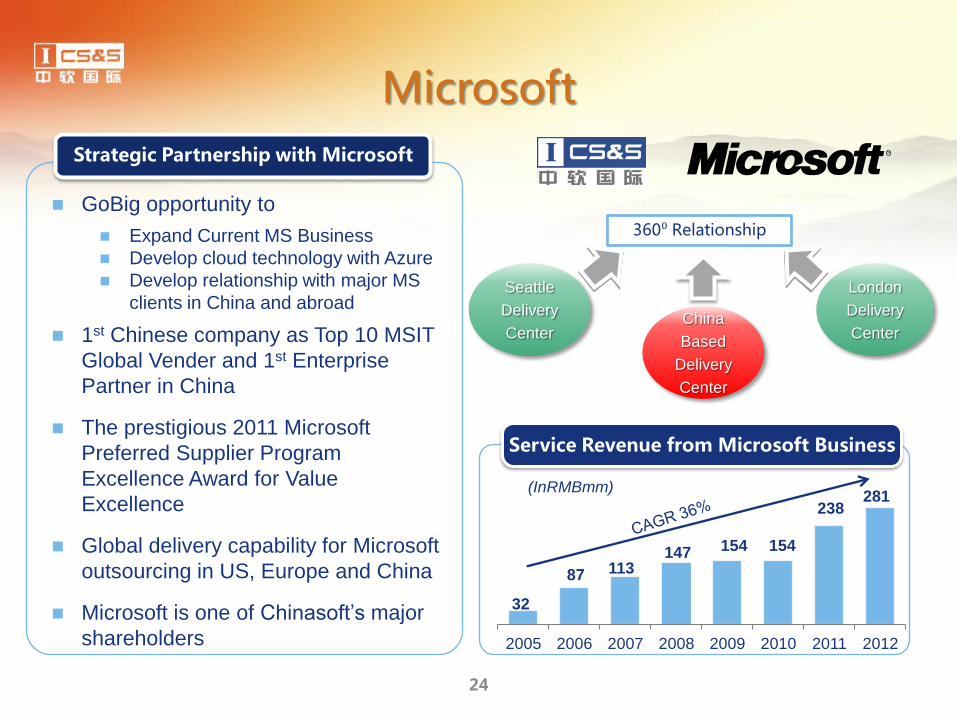
Microsoft
GoBig opportunity to
Expand Current MS Business
Develop cloud technology with Azure
Develop relationship with major MS
clients in China and abroad
1st Chinese company as Top 10 MSIT
Global Vender and 1st Enterprise
Partner in China
The prestigious 2011 Microsoft
Preferred Supplier Program
Excellence Award for Value
Excellence
Global delivery capability for Microsoft
outsourcing in US, Europe and China
Microsoft is one of Chinasoft’s major
shareholders
Strategic Partnership with Microsoft
360⁰ Relationship
Seattle
Delivery
Center
London
Delivery
Center China
Based
Delivery
Center
32
87 113 147 154 154
238 281
2005 2006 2007 2008 2009 2010 2011 2012
Service Revenue from Microsoft Business
(InRMBmm)
24
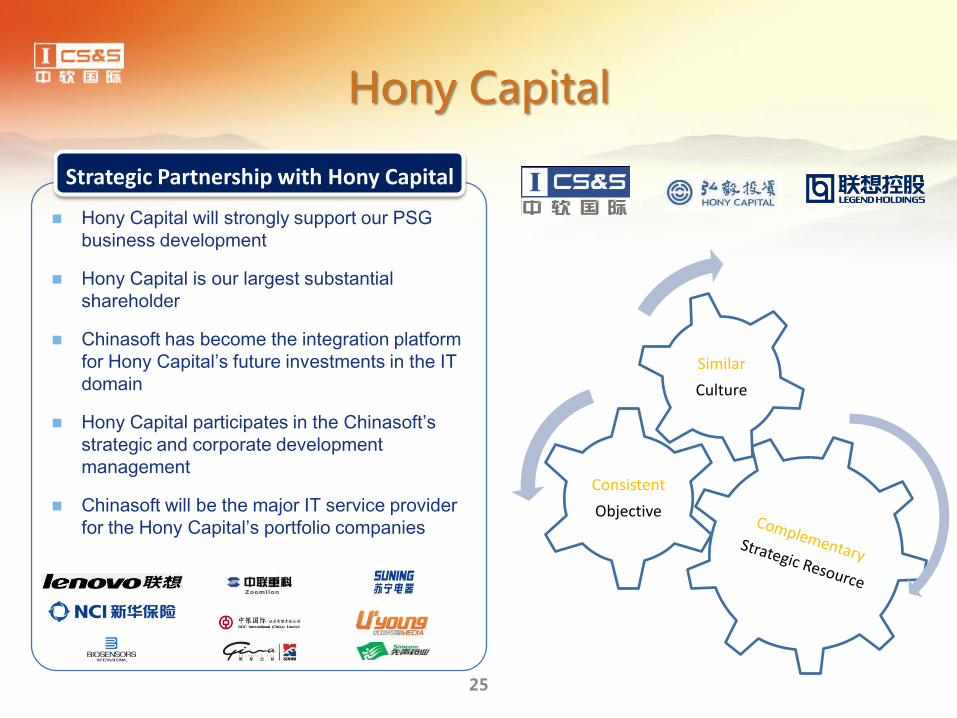
Hony Capital will strongly support our PSG
business development
Hony Capital is our largest substantial
shareholder
Chinasoft has become the integration platform
for Hony Capital’s future investments in the IT
domain
Hony Capital participates in the Chinasoft’s
strategic and corporate development
management
Chinasoft will be the major IT service provider
for the Hony Capital’s portfolio companies
Strategic Partnership with Hony Capital
Hony Capital
Consistent
Objective
Similar
Culture
25
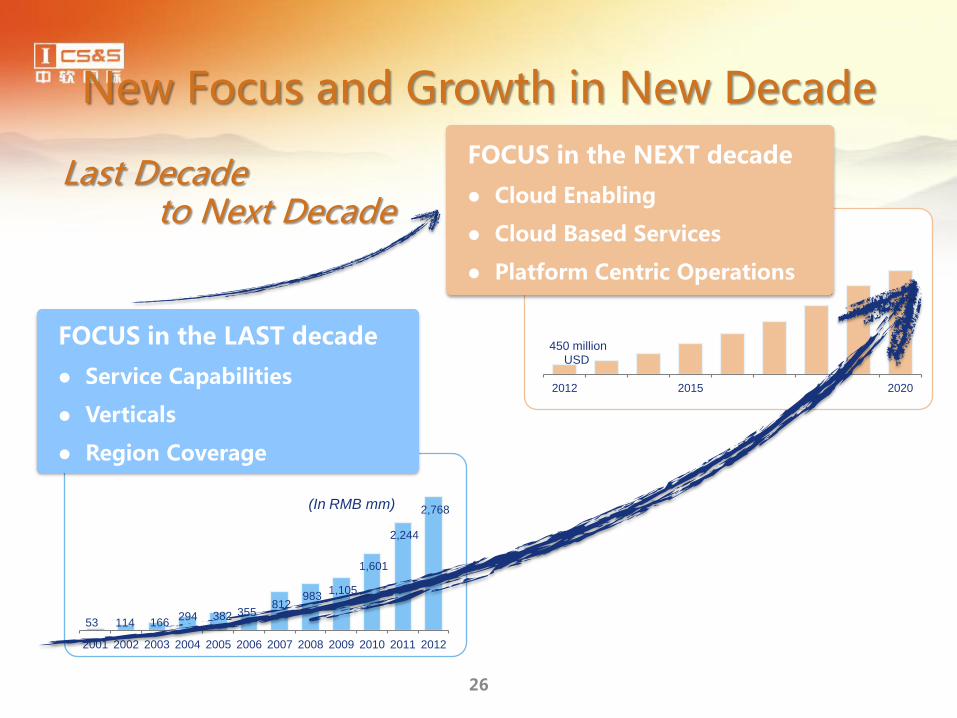
New Focus and Growth in New Decade
26
53 114 166 294 382 355
812 983
1,105
1,601
2,244
2,768
2001 2002 2003 2004 2005 2006 2007 2008 2009 2010 2011 2012
FOCUS in the LAST decade
Service Capabilities
Verticals
Region Coverage
450 million USD
2012 2015 2020
FOCUS in the NEXT decade
Cloud Enabling
Cloud Based Services
Platform Centric Operations
(In RMB mm)
Last Decade to Next Decade
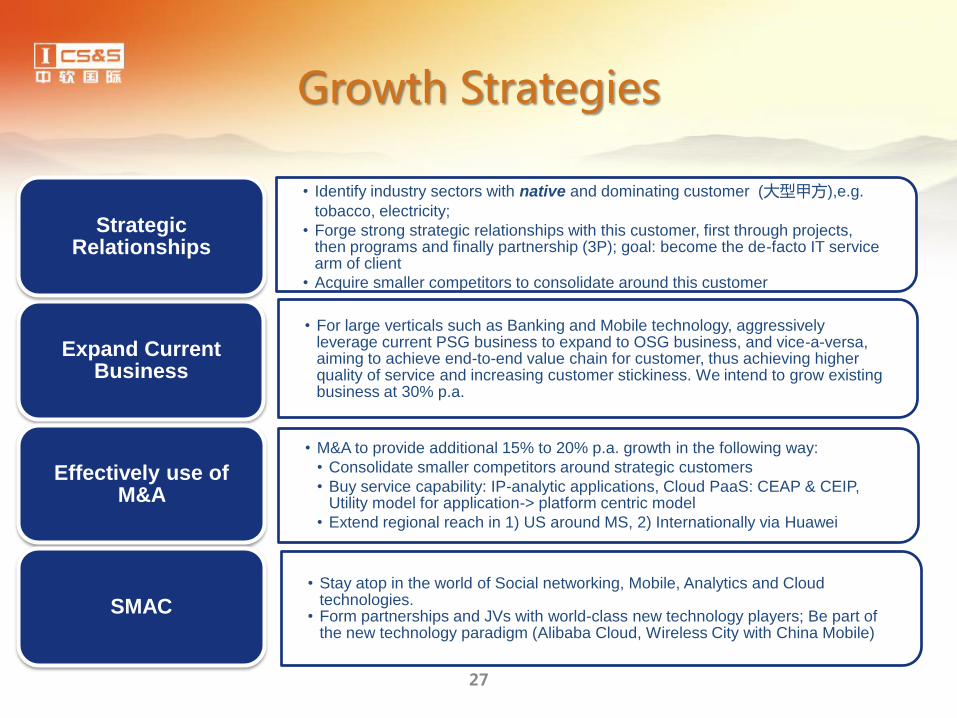
Growth Strategies
• For large verticals such as Banking and Mobile technology, aggressively leverage current PSG business to expand to OSG business, and vice-a-versa, aiming to achieve end-to-end value chain for customer, thus achieving higher quality of service and increasing customer stickiness. We intend to grow existing business at 30% p.a.
Expand Current Business
• M&A to provide additional 15% to 20% p.a. growth in the following way:
• Consolidate smaller competitors around strategic customers
• Buy service capability: IP-analytic applications, Cloud PaaS: CEAP & CEIP, Utility model for application-> platform centric model
• Extend regional reach in 1) US around MS, 2) Internationally via Huawei
Effectively use of M&A
• Stay atop in the world of Social networking, Mobile, Analytics and Cloud technologies.
• Form partnerships and JVs with world-class new technology players; Be part of the new technology paradigm (Alibaba Cloud, Wireless City with China Mobile)
SMAC
• Identify industry sectors with native and dominating customer (大型甲方),e.g.
tobacco, electricity;
• Forge strong strategic relationships with this customer, first through projects, then programs and finally partnership (3P); goal: become the de-facto IT service arm of client
• Acquire smaller competitors to consolidate around this customer
Strategic Relationships
27
Growth via Acquisition
Growth by acquisition has been, and will continue to be, a significant part of
ChinaSoft International’s growth strategy. (Please see a list of companies at the end
of this presentation that CIS acquired in the past.)
We typically acquire to 1) expand presence in a specific industry sector
(around a strategic customer) or 2) obtain new service capability or 3) expand
regional reach.
Current M&A Policy and Target Guidelines:
High Growth: Target should be growing at > 30% per year (revenue)
Appropriate Size: Target is < 13% of CSI in terms of business volume
Sector penetration acquisitions will depend on strategic customer needs
(3p- Project, Program, Partner)
Service capability acquisitions will center around proprietary technology
Financing: Open to both debt and equity or a combination; specific model
determined on a case-by-case basis; Strive to be very EPS accretive.
28
Strategic Partnerships and Growth Strategies
Financials
Background Info 1
Deep domain expertise in China’s most attractive verticals 2
Comprehensive end-to-end service offerings with superior
consulting and solution capabilities 3
Serving blue-chip clients with strong China presence and global delivery
capabilities 4
Financials
5
6
29
Key Financial and Operating Data
30
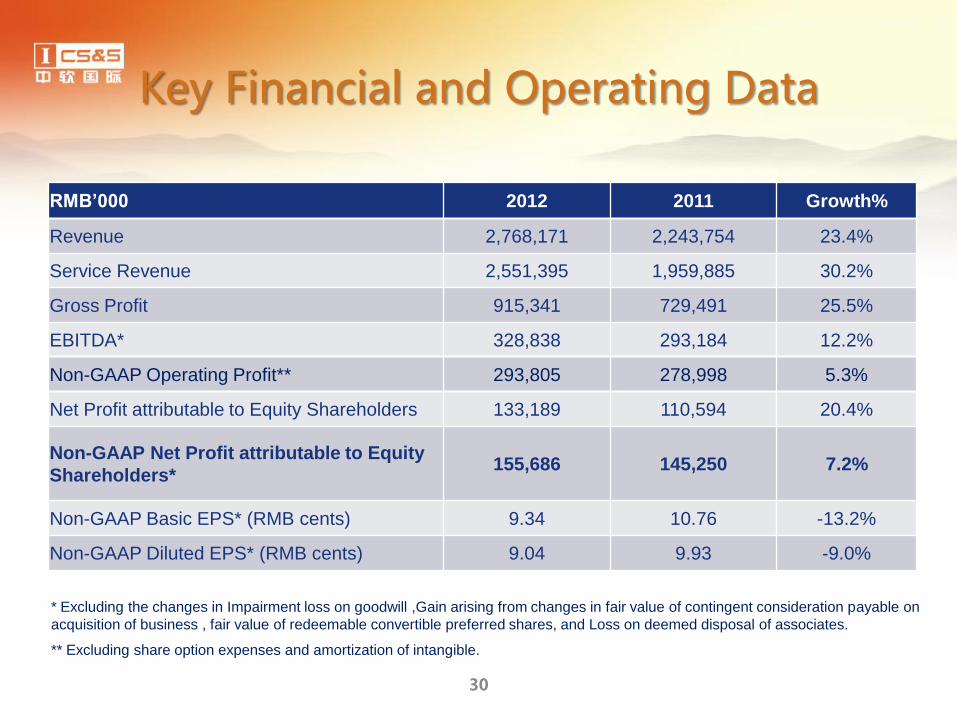
* Excluding the changes in Impairment loss on goodwill ,Gain arising from changes in fair value of contingent consideration payable on
acquisition of business , fair value of redeemable convertible preferred shares, and Loss on deemed disposal of associates.
** Excluding share option expenses and amortization of intangible.
RMB’000 2012 2011 Growth%
Revenue 2,768,171 2,243,754 23.4%
Service Revenue 2,551,395 1,959,885 30.2%
Gross Profit 915,341 729,491 25.5%
EBITDA* 328,838 293,184 12.2%
Non-GAAP Operating Profit** 293,805 278,998 5.3%
Net Profit attributable to Equity Shareholders 133,189 110,594 20.4%
Non-GAAP Net Profit attributable to Equity
Shareholders* 155,686 145,250 7.2%
Non-GAAP Basic EPS* (RMB cents) 9.34 10.76 -13.2%
Non-GAAP Diluted EPS* (RMB cents) 9.04 9.93 -9.0%
Financial and Operating Ratio Analysis
31
RMB’000 2012 Per
Revenue% Per Service revenue%
2011 Per
Revenue% Per Service revenue%
Growth%
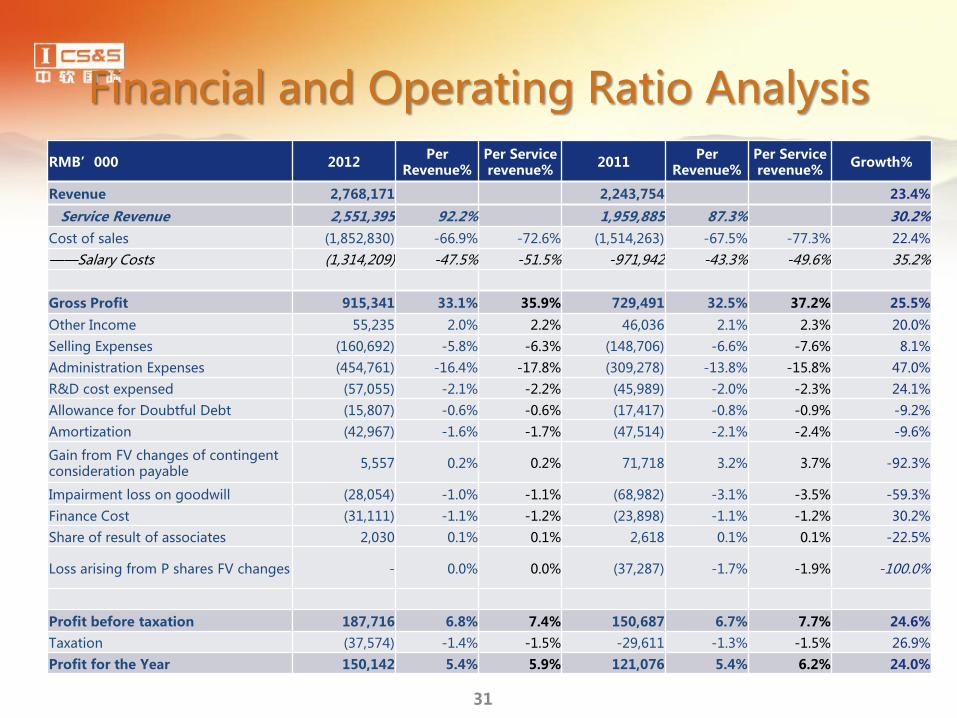
Revenue 2,768,171 2,243,754 23.4%
Service Revenue 2,551,395 92.2% 1,959,885 87.3% 30.2%
Cost of sales (1,852,830) -66.9% -72.6% (1,514,263) -67.5% -77.3% 22.4%
——Salary Costs (1,314,209) -47.5% -51.5% -971,942 -43.3% -49.6% 35.2%
Gross Profit 915,341 33.1% 35.9% 729,491 32.5% 37.2% 25.5%
Other Income 55,235 2.0% 2.2% 46,036 2.1% 2.3% 20.0%
Selling Expenses (160,692) -5.8% -6.3% (148,706) -6.6% -7.6% 8.1%
Administration Expenses (454,761) -16.4% -17.8% (309,278) -13.8% -15.8% 47.0%
R&D cost expensed (57,055) -2.1% -2.2% (45,989) -2.0% -2.3% 24.1%
Allowance for Doubtful Debt (15,807) -0.6% -0.6% (17,417) -0.8% -0.9% -9.2%
Amortization (42,967) -1.6% -1.7% (47,514) -2.1% -2.4% -9.6%
Gain from FV changes of contingent consideration payable
5,557 0.2% 0.2% 71,718 3.2% 3.7% -92.3%
Impairment loss on goodwill (28,054) -1.0% -1.1% (68,982) -3.1% -3.5% -59.3%
Finance Cost (31,111) -1.1% -1.2% (23,898) -1.1% -1.2% 30.2%
Share of result of associates 2,030 0.1% 0.1% 2,618 0.1% 0.1% -22.5%
Loss arising from P shares FV changes - 0.0% 0.0% (37,287) -1.7% -1.9% -100.0%
Profit before taxation 187,716 6.8% 7.4% 150,687 6.7% 7.7% 24.6%
Taxation (37,574) -1.4% -1.5% -29,611 -1.3% -1.5% 26.9%
Profit for the Year 150,142 5.4% 5.9% 121,076 5.4% 6.2% 24.0%
Non-GAAP and GAAP Reconciliations
32
RMB’000 2012 Per
Revenue%
Per Service revenue
%
2011 Per
Revenue%
Per Service revenue
%
Growth%
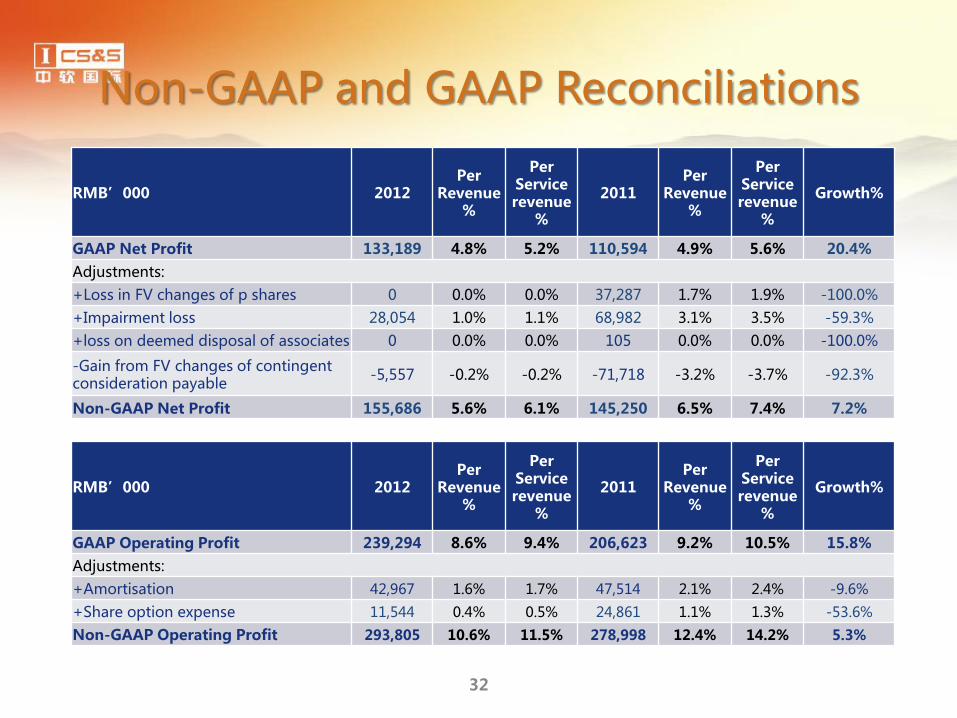
GAAP Net Profit 133,189 4.8% 5.2% 110,594 4.9% 5.6% 20.4%
Adjustments:
+Loss in FV changes of p shares 0 0.0% 0.0% 37,287 1.7% 1.9% -100.0%
+Impairment loss 28,054 1.0% 1.1% 68,982 3.1% 3.5% -59.3%
+loss on deemed disposal of associates 0 0.0% 0.0% 105 0.0% 0.0% -100.0%
-Gain from FV changes of contingent consideration payable
-5,557 -0.2% -0.2% -71,718 -3.2% -3.7% -92.3%
Non-GAAP Net Profit 155,686 5.6% 6.1% 145,250 6.5% 7.4% 7.2%
RMB’000 2012 Per
Revenue%
Per Service revenue
%
2011 Per
Revenue%
Per Service revenue
%
Growth%
GAAP Operating Profit 239,294 8.6% 9.4% 206,623 9.2% 10.5% 15.8%
Adjustments:
+Amortisation 42,967 1.6% 1.7% 47,514 2.1% 2.4% -9.6%
+Share option expense 11,544 0.4% 0.5% 24,861 1.1% 1.3% -53.6%
Non-GAAP Operating Profit 293,805 10.6% 11.5% 278,998 12.4% 14.2% 5.3%
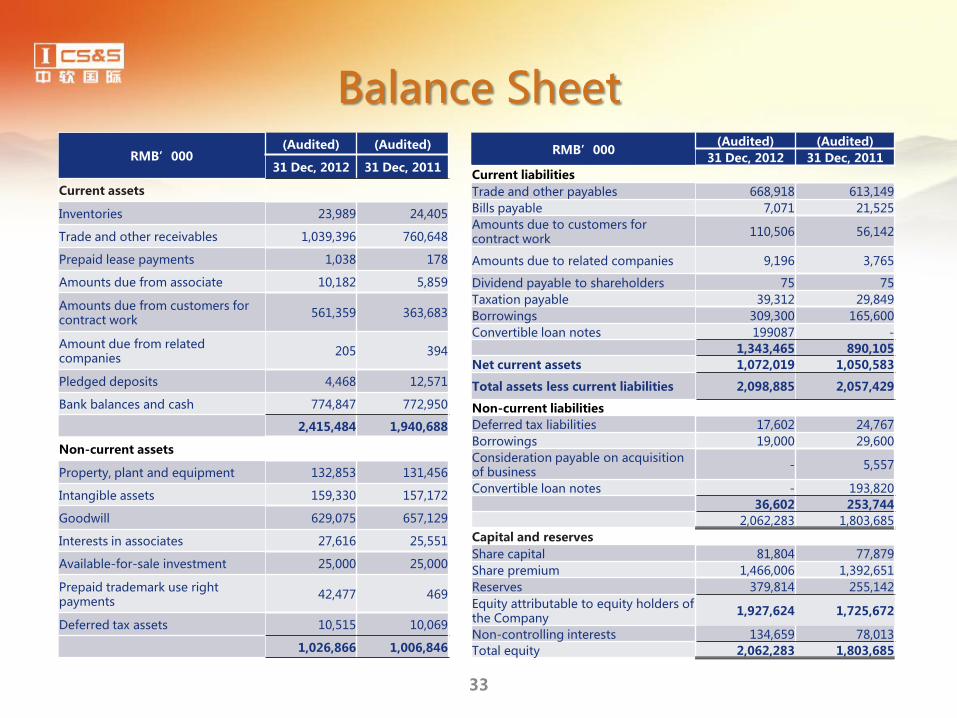
Balance Sheet
33
RMB’000 (Audited) (Audited)
31 Dec, 2012 31 Dec, 2011
Current assets
Inventories 23,989 24,405
Trade and other receivables 1,039,396 760,648
Prepaid lease payments 1,038 178
Amounts due from associate 10,182 5,859
Amounts due from customers for contract work
561,359 363,683
Amount due from related companies
205 394
Pledged deposits 4,468 12,571
Bank balances and cash 774,847 772,950
2,415,484 1,940,688
Non-current assets
Property, plant and equipment 132,853 131,456
Intangible assets 159,330 157,172
Goodwill 629,075 657,129
Interests in associates 27,616 25,551
Available-for-sale investment 25,000 25,000
Prepaid trademark use right payments
42,477 469
Deferred tax assets 10,515 10,069
1,026,866 1,006,846
RMB’000 (Audited) (Audited)
31 Dec, 2012 31 Dec, 2011
Current liabilities
Trade and other payables 668,918 613,149
Bills payable 7,071 21,525
Amounts due to customers for contract work
110,506 56,142
Amounts due to related companies 9,196 3,765
Dividend payable to shareholders 75 75
Taxation payable 39,312 29,849
Borrowings 309,300 165,600
Convertible loan notes 199087 - 1,343,465 890,105
Net current assets 1,072,019 1,050,583
Total assets less current liabilities 2,098,885 2,057,429
Non-current liabilities
Deferred tax liabilities 17,602 24,767
Borrowings 19,000 29,600
Consideration payable on acquisition of business
- 5,557
Convertible loan notes - 193,820 36,602 253,744 2,062,283 1,803,685
Capital and reserves
Share capital 81,804 77,879
Share premium 1,466,006 1,392,651
Reserves 379,814 255,142
Equity attributable to equity holders of the Company
1,927,624 1,725,672
Non-controlling interests 134,659 78,013
Total equity 2,062,283 1,803,685
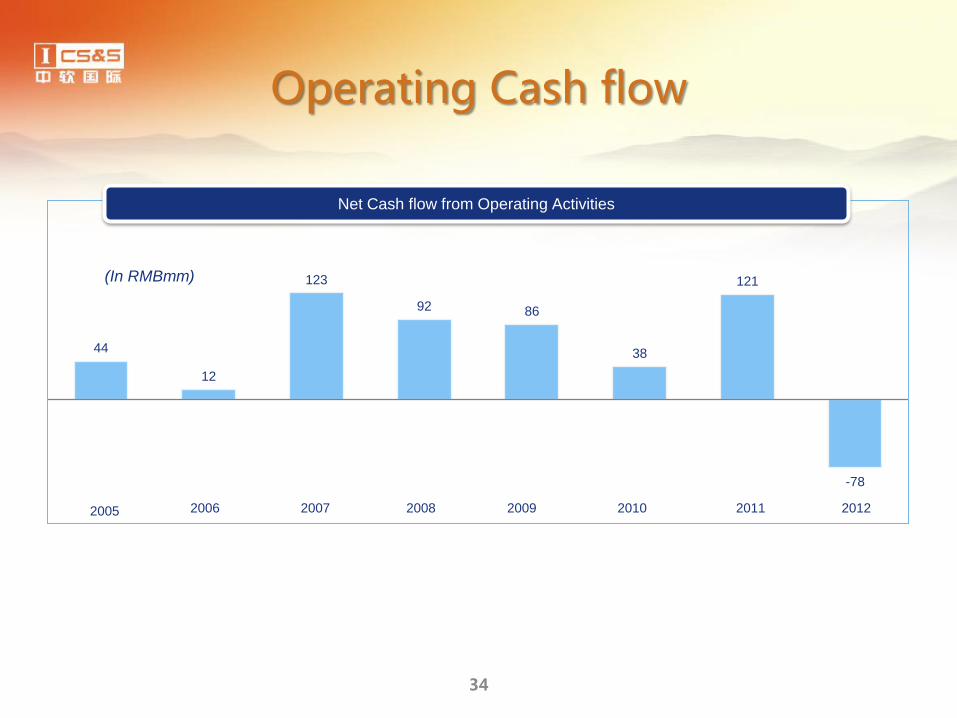
Operating Cash flow
34
44
12
123
92 86
38
121
-78
Net Cash flow from Operating Activities
(In RMBmm)
2005 2006 2007 2008 2009 2010 2012 2011
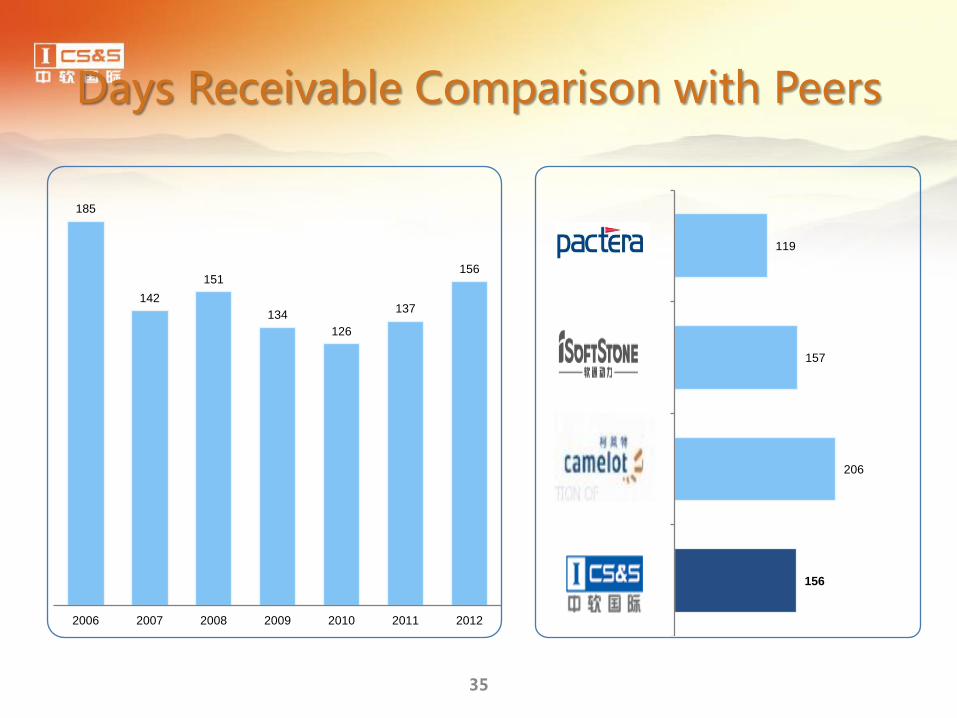
Days Receivable Comparison with Peers
35
185
142
151
134
126
137
156
2006 2007 2008 2009 2010 2011 2012
156
206
157
119
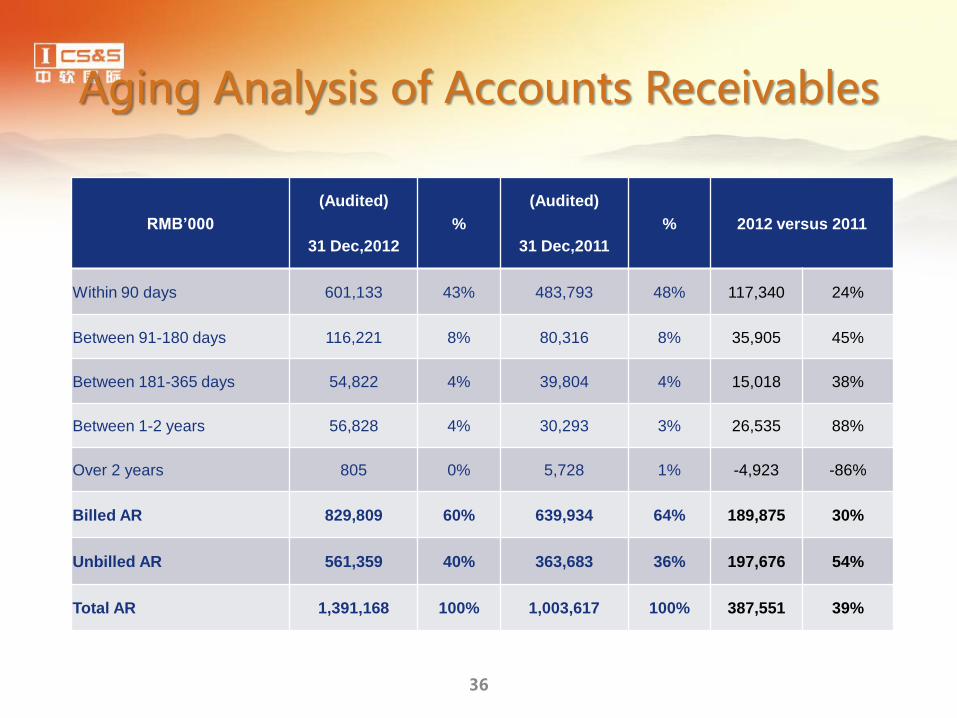
Aging Analysis of Accounts Receivables
36
RMB’000
(Audited)
%
(Audited)
% 2012 versus 2011
31 Dec,2012 31 Dec,2011
Within 90 days 601,133 43% 483,793 48% 117,340 24%
Between 91-180 days 116,221 8% 80,316 8% 35,905 45%
Between 181-365 days 54,822 4% 39,804 4% 15,018 38%
Between 1-2 years 56,828 4% 30,293 3% 26,535 88%
Over 2 years 805 0% 5,728 1% -4,923 -86%
Billed AR 829,809 60% 639,934 64% 189,875 30%
Unbilled AR 561,359 40% 363,683 36% 197,676 54%
Total AR 1,391,168 100% 1,003,617 100% 387,551 39%
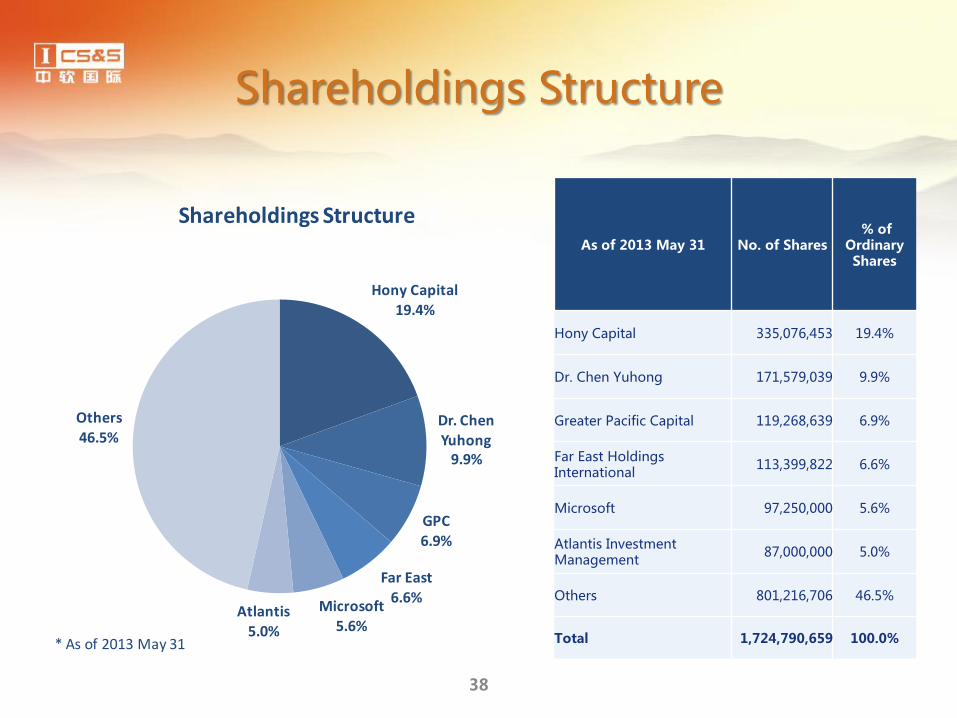
Shareholdings Structure
As of 2013 May 31 No. of Shares % of
Ordinary Shares
Hony Capital 335,076,453 19.4%
Dr. Chen Yuhong 171,579,039 9.9%
Greater Pacific Capital 119,268,639 6.9%
Far East Holdings International
113,399,822 6.6%
Microsoft 97,250,000 5.6%
Atlantis Investment Management
87,000,000 5.0%
Others 801,216,706 46.5%
Total 1,724,790,659 100.0%
38
Hony Capital19.4%
Dr. Chen Yuhong
9.9%
GPC6.9%
Far East6.6%
Microsoft5.6%
Atlantis5.0%
Others46.5%
Shareholdings Structure
* As of 2013 May 31