Embed Size (px)
Citation preview
226
China’s Dilemma
10
The political economy of emissions reduction in China Are �ncent�ves for low carbon growth compat�ble?
Cai Fang and Du Yang
There �s grow�ng, unassa�lable ev�dence of severe ex�st�ng and potent�al consequences of global cl�mate change and of the relat�onsh�p between human econom�c act�v�t�es and global warm�ng (for example, stern 2007). The kyoto Protocol and the Bal� cl�mate conference road-map proposed e�ther compulsory or moral requ�rements for act�on from all econom�es—�nclud�ng ch�na, wh�ch has the largest populat�on s�ze, the fastest growth rate and the second-largest gross domest�c product (GdP) �n purchas�ng power par�ty (PPP) terms. As research (Thomas 2007) est�mates, assum�ng the rat�o of carbon d�ox�de em�ss�ons to GdP rema�ns at the 2001 level, total global em�ss�ons w�ll reach as h�gh as 25 b�ll�on metr�c tonnes by 2018. Wh�le th�s w�ll represent an �ncrease �n global carbon d�ox�de em�ss�ons of 69 per cent, em�ss�ons �n ch�na w�ll �ncrease to 9 b�ll�on tonnes—a growth of 218 per cent, exceed�ng all other countr�es �n terms of total em�ss�ons.1
It �s seems to be the case that ch�na’s em�ss�ons reduct�on efforts are mot�vated by �nternat�onal pressure, wh�ch the central government passes on to local governments and enterpr�ses. If, however, external pressure �s the sole mot�vat�ng factor for the government to take the �ssue ser�ously—and �t �s not �nduced endogenously by ch�na’s econom�c growth per se—ch�na w�ll face great d�fficulty reduc�ng em�ss�ons because there w�ll be a lack of �ncent�ves to carry out em�ss�ons reduct�on strateg�es. That �s, the follow�ng quest�ons should be answered before we can be confident about the real�sat�on of the strateg�c goal. F�rst, does the central government have pers�stent vol�t�on to carry out the pol�cy, �n financ�al and adm�n�strat�ve terms? second, are local
227
The political economy of emissions reduction in China
governments w�ll�ng to sacr�fice short-term growth for susta�nable long-term development? Th�rd, can an enterpr�se’s behav�our �n deal�ng w�th em�ss�ons reduct�on �ncent�ves be compat�ble w�th the government’s �ntent�ons? As has been w�dely observed, ch�na’s rap�d econom�c growth dur�ng the trans�t�onal phase was st�mulated largely by local governments pursu�ng GdP growth and the result�ng enhancement of fiscal revenue. To guarantee an effect�ve �mplementat�on of the strategy, any slow-down of econom�c growth supposedly caused by em�ss�ons reduct�on must be compensated.2
Those pol�cy advocates for ch�na’s em�ss�ons reduct�on who emphas�se the �ssues of obl�gat�on and respons�b�l�ty but pay no attent�on to �ssues relat�ng to capab�l�ty and �ncent�ve, are �rrelevant �n pol�cy dec�s�ons and �ncomplete �n the-oret�cal cons�stency. The argument of th�s chapter �s that the relat�ve barga�n�ng power and effect�veness of pol�cy advocacy are determ�ned by the dom�nant pr�or�t�es and the part�cular stage of development. Wh�le cond�t�ons mature, �ncent�ves, behav�our and pr�or�t�es change. The env�ronmental kuznets curve (ekc), wh�ch dep�cts the relat�onsh�p between per cap�ta �ncome and env�-ronmental qual�ty, �s a reflect�on of such pol�t�cal and econom�c log�c (dea-con 2005). Wh�le the ekc �s �nd�cat�ve of a s�mpl�fied correlat�on of env�ron- mental appearance w�th env�ronmental requ�rements assoc�ated w�th per cap�ta �ncome, there can be deeper �mpl�cat�ons beh�nd �t. In the case of ch�na, the government’s behav�our, character�sed so far by �ts developmental state, wh�ch cons�sts of strong development �mpulses from the central and local govern-ments, responds more sens�t�vely to the demands from potent�al changes �n growth patterns than to the demands from �ncome �ncreases.
In th�s chapter, we d�scuss the cont�nu�ng fundamental changes �n ch�na’s development stage and the �mpl�cat�ons for growth patterns. Tak�ng sulphur d�ox�de em�ss�ons as an example, we est�mate a ch�nese ekc and try to reveal �ncent�ve mechan�sms and pol�cy focuses for �mplement�ng em�ss�ons reduct�on strateg�es from the emp�r�cal find�ngs. The follow�ng quest�ons are expected to be answered: 1) can the or�entat�on of growth pol�cy be changed as a result of �nteract�on between central and local governments; 2) are em�ss�ons reduct�ons and low carbon growth financ�ally feas�ble; and 3) can �ncent�ves be compat�ble between the central government, local governments, enterpr�ses and the general populat�on �n �mplement�ng a strategy of em�ss�ons reduct�on?
Development stage and growth patterns
ch�na’s env�ronmental problems are the result of �ts econom�c growth pat-tern, character�sed by a rel�ance on labour and cap�tal �nputs rather than on product�v�ty enhancement, although th�s growth pattern su�ts a part�cular
228
China’s Dilemma
development stage. The ch�nese st�mulat�on of econom�c growth �s un�que �n comb�n�ng central and local governments to form a developmental state, wh�ch character�ses the outstand�ng government funct�on �n econom�c development. consequently, wh�le �nd�v�dual enterpr�ses �nherently tend to respond to growth pattern changes—wh�ch em�ss�ons reduct�on �s the result of—regulat�ons and other government react�ons are much more �mportant �n guarantee�ng the real�sat�on of the strategy. The �mpend�ng new development stage w�ll help the government sh�ft �ts pol�cy or�entat�on by mak�ng the relevant regulat�ons �ncent�ve-compat�ble among stakeholders.
The pol�t�cal economy of em�ss�ons reduct�on relates to the d�fferent reac- t�ons of all relevant part�es. F�rst, for the central government, dec�s�on-mak�ng has to do w�th the recogn�t�on of the �mportance of em�ss�ons reduct�on as requ�red by the change �n the development stage. second, for local governments, �ncent�ves to sh�ft growth patterns from �nput dr�ven to product�v�ty dr�ven and a w�ll�ngness to sacr�fice short-term growth �n GdP and fiscal revenue for susta�n- able growth are more relevant �n response to the central government’s mandate. Th�rd, for enterpr�ses, wh�ch are supposed to care more about profitab�l�ty than external�ty, �mmanent �rr�tants requ�r�ng trans�t�on from �nputs-based to product�v�ty-based expans�on are generated by mod�ficat�on of the product�on factor endowment. F�nally, for people, stronger demands for env�ronmental qual�ty come ult�mately from the trans�t�on from a l�vel�hood dom�nated by subs�stence pressures to comprehens�ve human development that alters �n accordance w�th development stages. In the final analys�s, an env�ronmental strategy can be �mplemented effect�vely only by comb�n�ng the quartet of capac�ty, respons�b�l�ty, obl�gat�on and �ncent�ve.
In h�s prom�nent paper on the relat�onsh�p between econom�c growth and �ncome �nequal�ty, kuznets (1955) postulates that �n the econom�c growth process, �ncome �nequal�ty first �ncreases then decl�nes after reach�ng a turn�ng po�nt. env�ronmental econom�sts later appl�ed th�s �nverted U-shape curve to dep�ct a s�m�lar relat�onsh�p between econom�c growth and env�ronmental qual�ty (Grossman and krueger 1995). The ekc can also be a useful framework w�th wh�ch to exam�ne whether the ch�nese economy possesses �nherent momentum to transform �ts growth pattern to a more env�ronmentally fr�endly one and, �n part�cular, to understand the pol�t�cal economy beh�nd the transformat�on.
In more concrete terms, we �nvest�gate the ways �n wh�ch the changes �n development stages �mpact on env�ronmental pol�cy dec�s�ons from two asp- ects. F�rst, the change �n development stage requ�res transformat�on of growth patterns. The econom�c growth pattern can be referred to �n ways �n wh�ch factors of product�on are allocated at m�cro and macro levels and �t can usually be class�fied by what k�nds of sources the econom�c growth �s based on. Thanks
229
The political economy of emissions reduction in China
to the earl�er than expected complet�on of demograph�c trans�t�on, the ent�re per�od of reform and open�ng-up �n ch�na has been character�sed by adequate labour force supply and a h�gh sav�ngs rate. Th�s demograph�c d�v�dend result�ng from a product�ve populat�on structure has been real�sed through market�sed resource allocat�on mechan�sms and part�c�pat�on �n the global economy. The favourable populat�on factor has prov�ded ch�na’s econom�c growth w�th a w�ndow of opportun�ty and, therefore, the phenomenon of d�m�n�sh�ng return to cap�tal has been deterred (ca� and Wang 2005). In the meant�me, econom�c growth �n trans�t�onal ch�na has rel�ed heav�ly on �nputs of product�on factors rather than on product�v�ty �mprovement. After a short r�se �n total factor product�v�ty (TFP) and �ts contr�but�on to growth �n the early stages of reform, ch�na’s TFP performance has been unsat�sfactory s�nce the 1990s (for example, Zheng and hu 2004; ku�js and Wang 2005). Th�s was a major attr�but�on of the growth pattern character�sed by heavy pollut�on, h�gh deplet�on and low effic�ency (kaneko and manag� 2004).
s�m�lar stor�es were told about the early exper�ences of the ‘Four T�gers’ when they created the d�sputable ‘east As�an m�racle’. At the t�me, krugman (1994) noted that the econom�c growth �n east As�a was fuelled merely by �nputs of labour and cap�tal, and the growth of TFP and �ts share of econom�c growth were �ns�gn�ficant. krugman bel�eved the m�racle was doubtful; h�s judgement was based on the neoclass�cal theory of growth, wh�ch assumes d�m�n�sh�ng returns to cap�tal due to l�m�ted suppl�es of labour, wh�ch was not true �n those econom�es. The facts subsequently showed that once the dual-economy feature of an unl�m�ted labour supply d�sappeared, those econom�es had to transform the�r econom�c growth patterns from �nputs dr�ven to TFP dr�ven—and have s�nce susta�ned the�r growth (Bhagwat� 1996). After three decades of extraord�nary econom�c growth, fuelled largely by demograph�c d�v�dends, and as the populat�on ages rap�dly and the reservo�r of surplus labour �n rural areas runs dry, ch�na’s labour supply and demand scenar�o has changed fundamentally s�nce 2004. W�th the approach of a lew�s turn�ng po�nt, cond�t�ons under wh�ch econom�c growth becomes �ncreas�ngly rel�ant on product�v�ty �mprovement rather than on expans�on of �nputs are matur�ng (ca� 2008).
In add�t�on, the �ncrease �n per cap�ta �ncome �nduces people’s des�re for secur�ty and qual�ty of l�fe, and the�r calls for a better env�ronment. A decade ago, the World Bank (1997) est�mated that �n 1995, financ�al losses result�ng from a�r and water pollut�on were worth Us$54 b�ll�on, account�ng for 8 per cent of ch�na’s total GdP. s�nce then—namely, dur�ng the per�od from 1995 to 2006—the real per cap�ta �ncome of urban households �ncreased by 131
230
China’s Dilemma
per cent, and the real per cap�ta �ncome of rural households �ncreased by 74.8 per cent. As a result of a much faster rate of �ncome growth for the upper group, the r�chest 20 per cent earned 4.6 t�mes more than the poorest 20 per cent. Per cap�ta �ncome level �s the dec�s�ve factor �n both of the w�dely used approaches to est�mat�ng losses caused by env�ronmental damage—namely, the human-cost and the w�ll�ngness-to-pay approaches. The upper �ncome group, espec�ally, has stronger barga�n�ng power to have an �mpact on pol�cy dec�s�ons about env�ronmental �ssues. Therefore, the outstand�ng performance of �ncome enhancement for ch�nese res�dents must play a role �n �ncreas�ng calls for env�ronmental �mprovement. Frequent env�ronmental �nc�dents �n recent years have shown how qu�ckly and enthus�ast�cally c�t�zens and the press can respond to env�ronmental d�sasters (hayward 2005).
The concerns of ch�nese res�dents, scholars, pol�cymakers and, to a lesser extent, enterpr�ses about env�ronmental qual�ty have been translated �nto the central documents and protocols of the eleventh F�ve-Year Plan. The documents make repeated calls for transformat�on of growth patterns and the eleventh F�ve-Year Plan st�pulates restr�ct�ve cr�ter�a for em�ss�ons reduct�ons. As a response partly to those regulat�ons and partly to the �ncrease �n pr�ces of raw mater�als and wages, ch�nese manufactur�ng enterpr�ses successfully �mproved the effic�ency of the�r usage of �ntermed�ate �nputs and labour product�v�ty (k�m and ku�js 2007).
China’s environmental Kuznets curve
An effect�ve way of understand�ng the relat�onsh�p between econom�c development and em�ss�ons �n ch�na �s to dep�ct the ekc. As we have ment�oned already, econom�c development and demand for env�ronmental qual�ty as a result of �mproved l�v�ng cond�t�ons can be represented by per cap�ta GdP. When d�scuss�ng ekc therefore, we employ prov�nc�al panel data to explore the relat�onsh�p between em�ss�ons and per cap�ta GdP and observe when the kuznets turn�ng po�nt appears. The two ma�n em�ss�ons are those of carbon d�ox�de and sulphur d�ox�de; however, th�s chapter descr�bes only the ekc of sulphur d�ox�de because the data for carbon d�ox�de em�ss�ons are not yet ava�lable offic�ally.
sulphur d�ox�de �s one of the ma�n a�r pollutants produced by the combust�on of sulphur compounds and �s of s�gn�ficant env�ronmental concern. s�nce coal and petroleum, wh�ch are the ma�n sources of energy �n ch�na, often conta�n sulphur compounds, the�r combust�on generates sulphur d�ox�de. In 2005, total sulphur d�ox�de em�ss�ons �n ch�na were 25.49 m�ll�on metr�c tonnes—the h�ghest �n the world. In the eleventh F�ve-Year Plan, l�m�t�ng sulphur d�ox�de
231
The political economy of emissions reduction in China
em�ss�ons �s one of the ma�n goals for env�ronmental protect�on. The plan requ�res a 10 per cent reduct�on �n sulphur d�ox�de em�ss�ons by 2010—that �s, total em�ss�ons of sulphur d�ox�de should not exceed 22.95 metr�c tonnes.
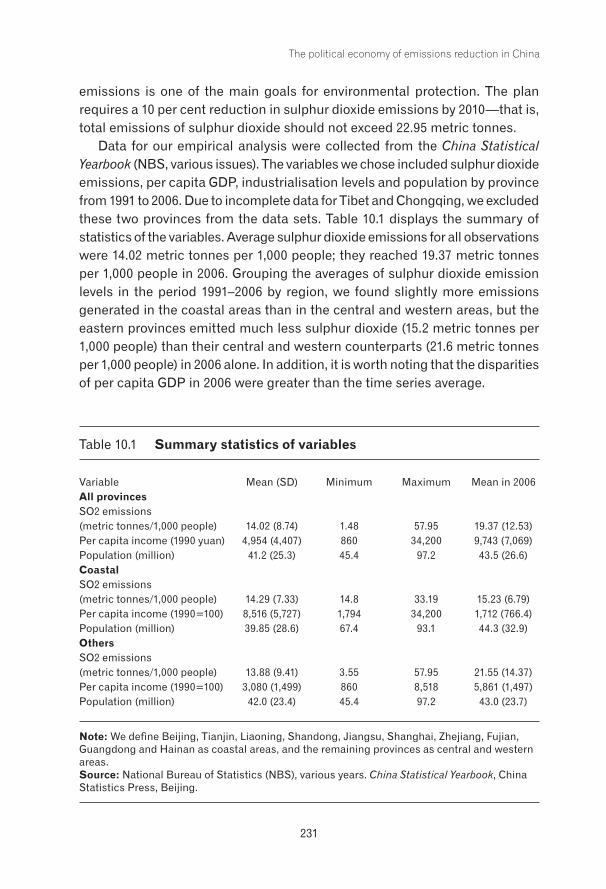
data for our emp�r�cal analys�s were collected from the China Statistical Yearbook (nBs, var�ous �ssues). The var�ables we chose �ncluded sulphur d�ox�de em�ss�ons, per cap�ta GdP, �ndustr�al�sat�on levels and populat�on by prov�nce from 1991 to 2006. due to �ncomplete data for T�bet and chongq�ng, we excluded these two prov�nces from the data sets. Table 10.1 d�splays the summary of stat�st�cs of the var�ables. Average sulphur d�ox�de em�ss�ons for all observat�ons were 14.02 metr�c tonnes per 1,000 people; they reached 19.37 metr�c tonnes per 1,000 people �n 2006. Group�ng the averages of sulphur d�ox�de em�ss�on levels �n the per�od 1991–2006 by reg�on, we found sl�ghtly more em�ss�ons generated �n the coastal areas than �n the central and western areas, but the eastern prov�nces em�tted much less sulphur d�ox�de (15.2 metr�c tonnes per 1,000 people) than the�r central and western counterparts (21.6 metr�c tonnes per 1,000 people) �n 2006 alone. In add�t�on, �t �s worth not�ng that the d�spar�t�es of per cap�ta GdP �n 2006 were greater than the t�me ser�es average.
Table 10.1 Summary statistics of variables
Var�able mean (sd) m�n�mum max�mum mean �n 2006All provinces so2 em�ss�ons (metr�c tonnes/1,000 people) 14.02 (8.74) 1.48 57.95 19.37 (12.53)Per cap�ta �ncome (1990 yuan) 4,954 (4,407) 860 34,200 9,743 (7,069)Populat�on (m�ll�on) 41.2 (25.3) 45.4 97.2 43.5 (26.6)Coastal so2 em�ss�ons (metr�c tonnes/1,000 people) 14.29 (7.33) 14.8 33.19 15.23 (6.79)Per cap�ta �ncome (1990=100) 8,516 (5,727) 1,794 34,200 1,712 (766.4)Populat�on (m�ll�on) 39.85 (28.6) 67.4 93.1 44.3 (32.9)Others so2 em�ss�ons (metr�c tonnes/1,000 people) 13.88 (9.41) 3.55 57.95 21.55 (14.37)Per cap�ta �ncome (1990=100) 3,080 (1,499) 860 8,518 5,861 (1,497)Populat�on (m�ll�on) 42.0 (23.4) 45.4 97.2 43.0 (23.7)
Note: We define Be�j�ng, T�anj�n, l�aon�ng, shandong, J�angsu, shangha�, Zhej�ang, Fuj�an, Guangdong and ha�nan as coastal areas, and the rema�n�ng prov�nces as central and western areas. Source: nat�onal Bureau of stat�st�cs (nBs), var�ous years. China Statistical Yearbook, ch�na stat�st�cs Press, Be�j�ng.
232
China’s Dilemma
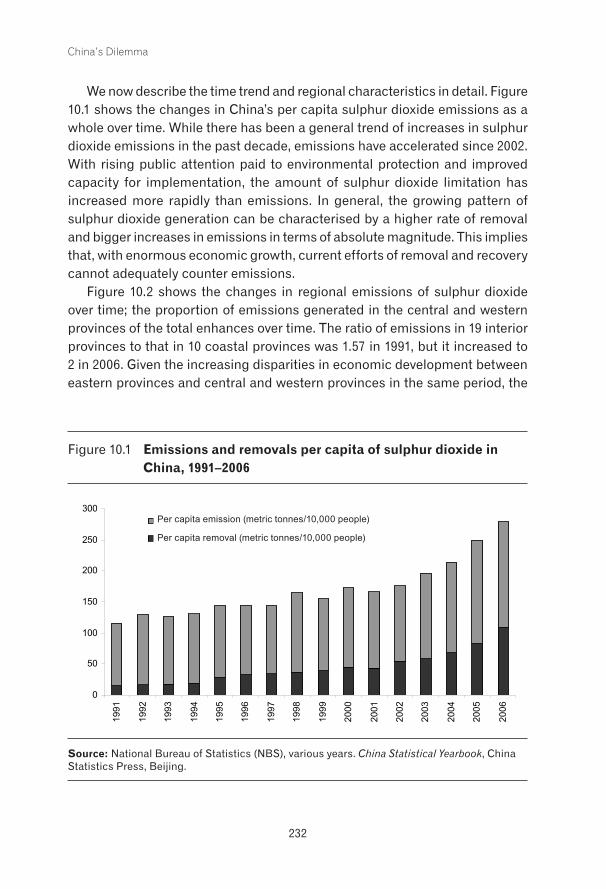
We now descr�be the t�me trend and reg�onal character�st�cs �n deta�l. F�gure 10.1 shows the changes �n ch�na’s per cap�ta sulphur d�ox�de em�ss�ons as a whole over t�me. Wh�le there has been a general trend of �ncreases �n sulphur d�ox�de em�ss�ons �n the past decade, em�ss�ons have accelerated s�nce 2002. W�th r�s�ng publ�c attent�on pa�d to env�ronmental protect�on and �mproved capac�ty for �mplementat�on, the amount of sulphur d�ox�de l�m�tat�on has �ncreased more rap�dly than em�ss�ons. In general, the grow�ng pattern of sulphur d�ox�de generat�on can be character�sed by a h�gher rate of removal and b�gger �ncreases �n em�ss�ons �n terms of absolute magn�tude. Th�s �mpl�es that, w�th enormous econom�c growth, current efforts of removal and recovery cannot adequately counter em�ss�ons.
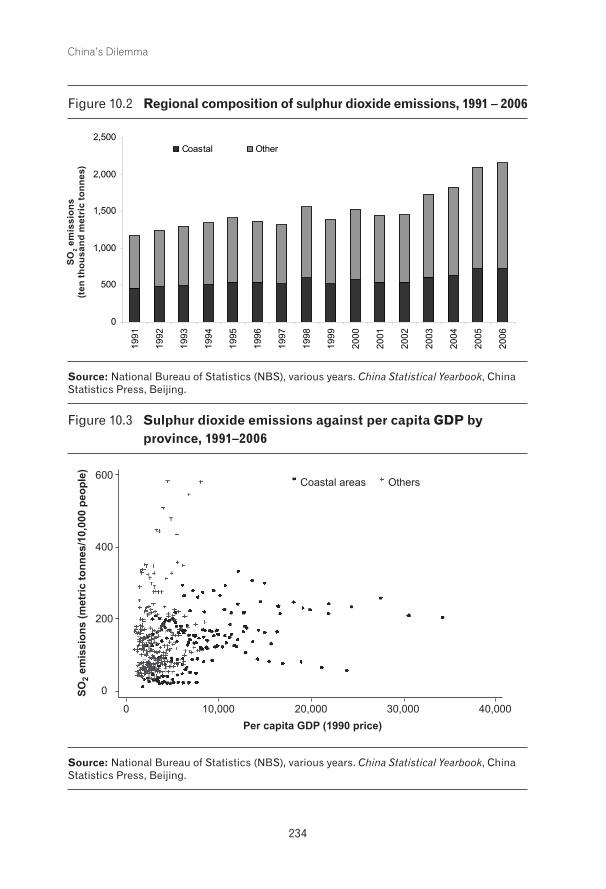
F�gure 10.2 shows the changes �n reg�onal em�ss�ons of sulphur d�ox�de over t�me; the proport�on of em�ss�ons generated �n the central and western prov�nces of the total enhances over t�me. The rat�o of em�ss�ons �n 19 �nter�or prov�nces to that �n 10 coastal prov�nces was 1.57 �n 1991, but �t �ncreased to 2 �n 2006. G�ven the �ncreas�ng d�spar�t�es �n econom�c development between eastern prov�nces and central and western prov�nces �n the same per�od, the
F�gure 10.1 Emissions and removals per capita of sulphur dioxide in China, 1991–2006
0
50
100
150
200
250
300
1991
1992
1993
1994
1995
1996
1997
1998
1999
2000
2001
2002
2003
2004
2005
2006
Per capita emission (metric tonnes/10,000 people)
Per capita removal (metric tonnes/10,000 people)
Source: nat�onal Bureau of stat�st�cs (nBs), var�ous years. China Statistical Yearbook, ch�na stat�st�cs Press, Be�j�ng.
Per capita emission (metric tonnes/10,000 people)
Per capita removal (metric tonnes/10,000 people)
233
The political economy of emissions reduction in China
effic�ency ga�ns of em�ss�ons reduct�on �n costal areas are much h�gher �n real terms, whereas those �n the �nter�or prov�nces are d�ssat�sfied. Th�s rejects any attempt to take em�ss�ons �n ch�na as a homogenous �ssue and suggests a methodology that treats the two d�st�nct reg�ons d�fferently wh�le try�ng to do any mean�ngful analys�s.
The scattered observat�ons �n terms of sulphur d�ox�de em�ss�ons at certa�n t�mes shown �n F�gure 10.3 further reveal the great heterogene�ty between the coastal and �nter�or reg�ons. The hor�zontal ax�s represents the levels of per cap�ta GdP �n 1990 pr�ces and the vert�cal ax�s the levels of per cap�ta sulphur d�ox�de em�ss�ons. At a relat�vely low level of per cap�ta �ncome for coastal and �nter�or reg�ons, there was no s�gn�ficant d�fference �n em�ss�ons between the two reg�ons. As each of the econom�es grow, the levels of em�ss�ons grow, w�th an even larger d�vergence �n em�ss�ons than �n econom�c growth, �mply�ng that �f there �s a s�gn of ekc, �t must be the case that the eastern prov�nces alone present the path of �ncrease first and then decl�ne �n em�ss�ons.
To see whether an ekc �n terms of a sulphur d�ox�de em�ss�ons pattern ex�sts, we run a regress�on to exam�ne the relat�onsh�p between reg�onal econom�c development and sulphur d�ox�de em�ss�ons based on the follow�ng emp�r�cal model.
Si,t = α0 + β1yi,t + β2y 2i,t + β3mi,t + ui + vt + εi,t (1)
�n wh�ch Si,t �s per cap�ta sulphur d�ox�de em�ss�ons of prov�nce i �n year t, yi,t and y2
i,t are per cap�ta GdP at the 1990 constant pr�ce and �ts square term of prov�nce i �n year t, and mi,t
�s the level of �ndustr�al�sat�on of prov�nce i �n year t measured by the rat�o of value added �n the �ndustr�al sector to total GdP. ui �s the prov�nce dummy reflect�ng the pers�stent prov�nc�al d�fference, such as d�fferent patterns of energy consumpt�on, regulat�on of energy use and env�ronmental protect�on, preferences for energy consumpt�on and so on. vt �s the year dummy to control the factors that change w�th t�me, apart from econom�c development, such as commod�ty and energy pr�ces, technology for sulphur d�ox�de removal and the l�ke. εi,t represents randomly d�sturb�ng factors apart from t�me and reg�on. As �n other stud�es on the ekc, the purpose of th�s est�mat�on �s to look at the s�gn�ficance and s�gn of β1 and β2 to dec�de �f they present an �nverted-U shape.
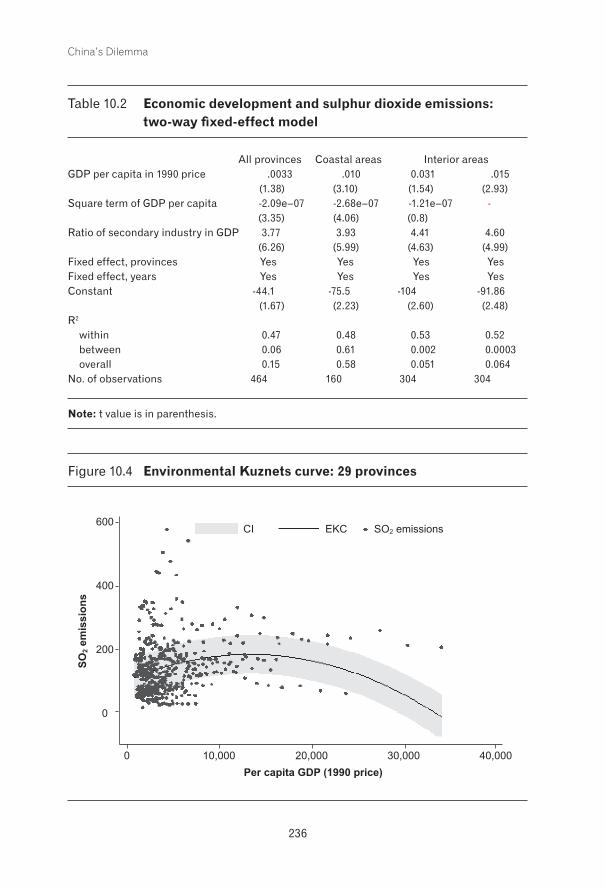
Table 10.2 presents the regress�on results. The three columns l�st regress�on results for all 29 prov�nces, for coastal prov�nces and for central and western prov�nces, respect�vely. The fitness to model var�es among reg�ons: that for the model of coastal areas has the h�ghest overall R2 �n three equat�ons, wh�le
234
China’s Dilemma
F�gure 10.3 Sulphur dioxide emissions against per capita GDP by province, 1991–2006
0 10,000 20,000 30,000 40,000Per capita GDP (1990 price)
SO2
emis
sion
s (m
etric
tonn
es/1
0,00
0 pe
ople
)
Coastal areas Others600
400
200
0
Source: nat�onal Bureau of stat�st�cs (nBs), var�ous years. China Statistical Yearbook, ch�na stat�st�cs Press, Be�j�ng.
F�gure 10.2 Regional composition of sulphur dioxide emissions, 1991 – 2006
0
500
1,000
1,500
2,000
2,50019
91
1992
1993
1994
1995
1996
1997
1998
1999
2000
2001
2002
2003
2004
2005
2006
SO
2 E
mis
sio
n (
ten
th
ou
san
d m
etri
c to
nn
es)
Coastal Other
Source: nat�onal Bureau of stat�st�cs (nBs), var�ous years. China Statistical Yearbook, ch�na stat�st�cs Press, Be�j�ng.
SO2 e
mis
sion
s (te
n th
ousa
nd m
etri
c to
nnes
)
235
The political economy of emissions reduction in China
that for other areas �s low. The model for coastal areas expla�ns 58 per cent of var�at�ons of sulphur d�ox�de em�ss�ons, wh�le that for others expla�ns only 5 per cent.
What concerns us are the s�gns of the square term of per cap�ta GdP �n all three equat�ons, because the negat�ve s�gns �nd�cate the ex�stence of an ekc, though the coeffic�ents are stat�st�cally �ns�gn�ficant for the regress�on for central and western prov�nces. For th�s reason, we can �nfer that the presence of an �nverted-U shape for the pooled sample ex�sts only because the general pattern of sulphur d�ox�de em�ss�ons �n coastal areas shows a pred�ctable kuznets turn�ng po�nt. Based on the regress�on results �n the first column, we can plot a graph that dep�cts the chang�ng pattern of sulphur d�ox�de em�ss�ons �n ch�na as a whole, denoted by 29 prov�nces (F�gure 10.4). look�ng at F�gures 10.3 and 10.4, the plots of observat�ons for the central and western areas scatter far left of the turn�ng po�nt, wh�le those for the coastal areas stand around the turn�ng po�nt. The huge heterogene�ty �dent�fies a need to d�st�ngu�sh between the two reg�ons when observ�ng the ekc �n ch�na.
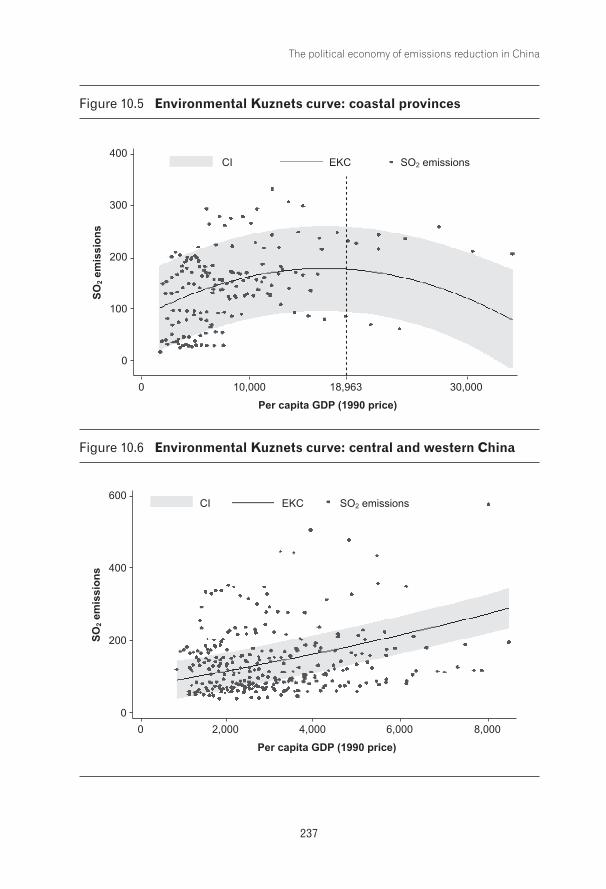
We now use �nformat�on from the second column �n Table 10.2 to pred�ct the ekc for coastal areas, and show the outcomes �n F�gure 10.5. Accord�ng to the parameters est�mated from the current sample, the turn�ng po�nt appears when per cap�ta GdP reaches rmB18,963 at the 1990 constant pr�ce. Beyond th�s po�nt, em�ss�ons are supposed to decrease. W�th th�s pattern, prov�nces that surpassed the turn�ng po�nt �n 2007 �ncluded Be�j�ng, T�anj�n, shangha� and Zhej�ng, wh�le Guangdong and J�angsu were very close to the po�nt �n terms of per cap�ta GdP. In other words, �n the current c�rcumstances, many prov�nces �n eastern ch�na have already had the capac�ty and �ncent�ves to reduce the�r sulphur d�ox�de em�ss�ons—namely, to afford low carbon growth.
on the other hand, w�th accelerat�ng econom�c growth, the central and western prov�nces cont�nue the�r patterns of em�ss�ons. In the th�rd column of Table 10.2, we see that coeffic�ents of per cap�ta GdP and �ts square term are stat�st�cally �ns�gn�ficant. If we use a d�fferent spec�ficat�on w�thout �nclus�on of the square term, as shown �n the last column of Table 10.2, we see a s�gn�ficant and pos�t�ve coeffic�ent for the var�able of per cap�ta �ncome, wh�ch �mpl�es that the central and western reg�ons stay at a phase of �ncreas�ng em�ss�ons. As �s expected, F�gure 10.6 shows that, though d�verg�ng, most of the prov�nces �n the reg�on are scrambl�ng �n l�ne w�th monotonously �ncreas�ng sulphur d�ox�de em�ss�ons. In compar�son w�th the pred�cted ekc of the eastern prov�nces, the p�cture here does not show any s�gn of an ekc.
236
China’s Dilemma
Table 10.2 Economic development and sulphur dioxide emissions: two-way fixed-effect model
All prov�nces coastal areas Inter�or areasGdP per cap�ta �n 1990 pr�ce .0033 .010 0.031 .015 (1.38) (3.10) (1.54) (2.93)square term of GdP per cap�ta -2.09e–07 -2.68e–07 -1.21e–07 - (3.35) (4.06) (0.8) rat�o of secondary �ndustry �n GdP 3.77 3.93 4.41 4.60 (6.26) (5.99) (4.63) (4.99)F�xed effect, prov�nces Yes Yes Yes YesF�xed effect, years Yes Yes Yes Yesconstant -44.1 -75.5 -104 -91.86 (1.67) (2.23) (2.60) (2.48)r2
w�th�n 0.47 0.48 0.53 0.52between 0.06 0.61 0.002 0.0003overall 0.15 0.58 0.051 0.064
no. of observat�ons 464 160 304 304
Note: t value �s �n parenthes�s.
F�gure 10.4 Environmental Kuznets curve: 29 provinces
0 10,000 20,000 30,000 40,000Per capita GDP (1990 price)
SO2 e
mis
sion
s
CI600
400
200
0
EKC SO2 emissions
237
The political economy of emissions reduction in China
F�gure 10.6 Environmental Kuznets curve: central and western China
0 2,000 4,000 6,000 8,000
Per capita GDP (1990 price)
SO2 e
mis
sion
s
CI600
400
200
0
EKC SO2 emissions
F�gure 10.5 Environmental Kuznets curve: coastal provinces
0 10,000 18,963 30,000
Per capita GDP (1990 price)
SO2 e
mis
sion
s
CI400
300
200
100
0
EKC SO2 emissions
238
China’s Dilemma
Conclusion and policy implications
exempl�fied by sulphur d�ox�de em�ss�ons, the ch�nese ekc shows the ex�stence of a relat�onsh�p between �ncome �ncreases and env�ronmental �mprovement. There are, however, �ssues to be cons�dered apart from the general conclus�on.
F�rst, wh�le one can expect a future turn�ng po�nt from �ncreases to decl�ne �n em�ss�ons for ch�na as a whole, most ch�nese prov�nces are st�ll far from reach�ng that po�nt. The central and western prov�nces �n part�cular st�ll have a strong des�re for econom�c growth at the cost of the env�ronment �n order to catch up w�th the�r eastern counterparts. If the prev�ously outl�ned path �s followed, ch�na w�ll have to suffer further env�ronmental degradat�on before reach�ng �ts spontaneous turn�ng po�nt, because the exper�ences of a spat�al transfer of �ndustr�es show (and the ekc �mpl�es) that the latecomers �n econom�c growth tend to rece�ve the transferred �ndustr�es from the�r advanced counterparts �n accordance not only w�th the�r comparat�ve advantage but w�th the�r acceptance of env�ronmental degradat�on—that �s, there w�ll be a tendency for the central and western reg�ons to welcome pollut�ng �ndustr�es transferr�ng from eastern reg�ons. G�ven the strong des�re for growth �n the less-developed prov�nces and the large �ncome gap between ch�nese prov�nces, s�ngle �ncent�ves such as per cap�ta �ncome are not suffic�ent to lead those reg�ons to the kuznets turn�ng po�nt. Genu�ne changes must rely on the �ntroduct�on of �ncent�ves and regulat�ons based on the need for transformat�on of growth patterns.
From the regress�on results, one can see a great heterogene�ty of sulphur d�ox�de em�ss�ons among reg�ons, wh�ch suggests d�st�nct pol�cy packages for d�fferent reg�ons �n terms of em�ss�ons reduct�on. For most coastal prov�nces, wh�ch e�ther passed through or are mov�ng towards the kuznets turn�ng po�nt, the �nert�al path and �ntr�ns�c forces can lead them to reduce em�ss�ons spontaneously. As far as the central and western prov�nces are concerned, �t �s hard to pred�ct when they w�ll enter the kuznets turn�ng �ntervals s�nce the em�ss�ons �n these areas are accelerat�ng. In th�s regard, �t �s essent�al to enforce regulat�ons to l�m�t the�r em�ss�ons behav�our as total em�ss�ons �n ch�na are already the h�ghest �n the world.
Although we est�mated a reasonably fitted ekc and �ts v�s�ble turn�ng po�nt for the eastern reg�ons, observat�ons d�ffer substant�ally. even for those observat�ons whose pos�t�ons are on the r�ght �nterval of the turn�ng po�nt, they stand at d�fferent plots, �mply�ng s�gn�ficant heterogene�ty among the eastern prov�nces. In general, the em�ss�ons �n the east rema�n h�gh and the�r decl�ne w�ll be slow.
stud�es show that wh�le a general relat�onsh�p between per cap�ta �ncome and env�ronmental qual�ty has been observed, there are huge d�fferent�als
239
The political economy of emissions reduction in China
across pollutants. Greenhouse gas em�ss�ons, wh�le concom�tant w�th those such as sulphur d�ox�de that are d�rectly harmful to people’s health, usually do not follow exactly the same path as other pollutants. As a greenhouse gas w�th no smell and no �mmed�ate harm to health, carbon d�ox�de em�ss�ons have not shown a s�gn�ficant path as the ekc suggests. For �nstance, the prev�ous emp�r�cal stud�es rarely found an ekc between �ncome levels and carbon d�ox�de em�ss�on patterns. If there are rare cases, they show that the turn�ng po�nt �nd�cat�ng carbon d�ox�de em�ss�ons tend�ng to decl�ne comes much later and requ�res several t�mes h�gher �ncome levels than do other pollutants (Webber and Allen 2004).
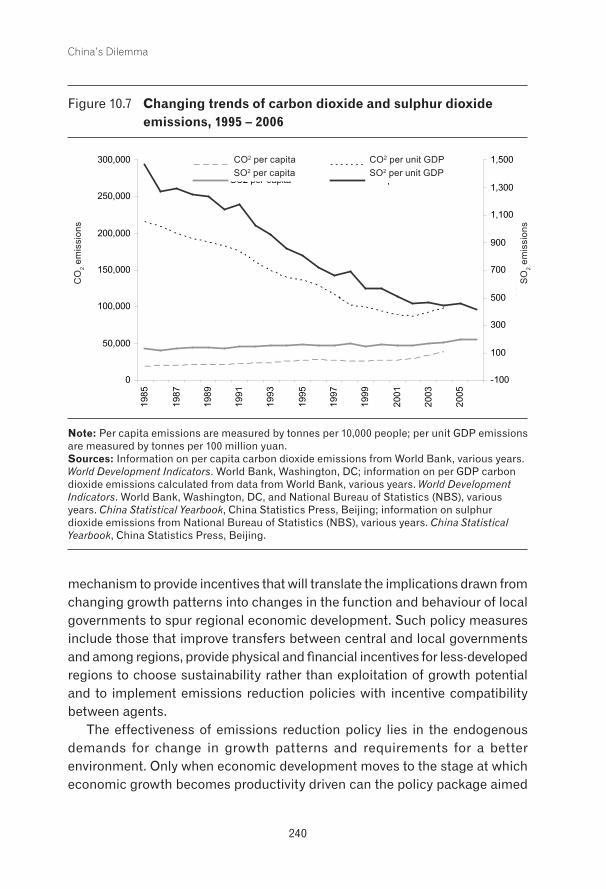
It �s bel�eved w�dely that because of ch�na’s enormous populat�on s�ze, the dom�nance of manufactur�ng �n �ts �ndustr�al structure and the low effic�ency of energy usage, �n �nternat�onal rank�ngs, ch�na �s pos�t�oned h�gh �n terms of per cap�ta em�ss�ons and low �n terms of per GdP em�ss�ons. start�ng w�th th�s feature, there �s a tendency for ch�na to converge w�th rest of the world—that �s, �ts per cap�ta em�ss�ons have been found to �ncrease over t�me, reflect�ng the development em�ss�ons effect, and the per GdP em�ss�ons decl�ne, reflect�ng the progress of technology and �mprovements �n effic�ency (F�gure 10.7). As �s expected, the overall performance of carbon d�ox�de has not been as good as that of sulphur d�ox�de.3
even though the ekc �s not a suffic�ent not�on for reveal�ng the complete determ�nants of the r�se or fall of em�ss�ons, �t �s useful to just�fy the ex�stence of the relat�onsh�p between levels of development and pollut�on, because �t shows that governments, enterpr�ses and people are w�ll�ng and able to respond pos�t�vely to chang�ng env�ronmental requ�rements der�ved from changes �n developmental stages and therefore growth patterns. The pred�ctable ekc and turn�ng po�nt d�sclose the governmental cogn�t�on, determ�nat�on and pol�cy measures �n respect of the env�ronmental �ssues, and the �ncent�ve compat�b�l�ty between stakeholders—although they by no means �mply that the chron�c env�ronmental problems can be solved xenogenet�cally when the t�me comes. Act�v�t�es conducted by governments at all levels, such as educat�on and the prov�s�on of �nformat�on, play a role �n shorten�ng the t�me of solv�ng the problem (deacon and norman 2004).
our emp�r�cal results show that there �s h�gh heterogene�ty �n sulphur d�ox�de em�ss�ons across prov�nces, wh�ch �s also true for the em�ss�ons pattern of carbon d�ox�de; therefore, the pol�c�es regard�ng em�ss�ons should be spec�fied reg�onally. In ch�na’s case, g�ven the strong mot�vat�ons of the central and western prov�nces to catch up w�th the�r eastern counterparts, one of the challeng�ng tasks for the central government �s to des�gn a well-funct�on�ng
240
China’s Dilemma
mechan�sm to prov�de �ncent�ves that w�ll translate the �mpl�cat�ons drawn from chang�ng growth patterns �nto changes �n the funct�on and behav�our of local governments to spur reg�onal econom�c development. such pol�cy measures �nclude those that �mprove transfers between central and local governments and among reg�ons, prov�de phys�cal and financ�al �ncent�ves for less-developed reg�ons to choose susta�nab�l�ty rather than explo�tat�on of growth potent�al and to �mplement em�ss�ons reduct�on pol�c�es w�th �ncent�ve compat�b�l�ty between agents.
The effect�veness of em�ss�ons reduct�on pol�cy l�es �n the endogenous demands for change �n growth patterns and requ�rements for a better env�ronment. only when econom�c development moves to the stage at wh�ch econom�c growth becomes product�v�ty dr�ven can the pol�cy package a�med
F�gure 10.7 Changing trends of carbon dioxide and sulphur dioxide emissions, 1995 – 2006
0
50,000
100,000
150,000
200,000
250,000
300,000
1985
1987
1989
1991
1993
1995
1997
1999
2001
2003
2005
CO
2 em
issi
on
-100
100
300
500
700
900
1,100
1,300
1,500
SO
2 em
issi
on
CO2 per capita CO2 per unit GDP
SO2 per capita SO2 per unit GDP
Note: Per cap�ta em�ss�ons are measured by tonnes per 10,000 people; per un�t GdP em�ss�ons are measured by tonnes per 100 m�ll�on yuan. Sources: Informat�on on per cap�ta carbon d�ox�de em�ss�ons from World Bank, var�ous years. World Development Indicators. World Bank, Wash�ngton, dc; �nformat�on on per GdP carbon d�ox�de em�ss�ons calculated from data from World Bank, var�ous years. World Development Indicators. World Bank, Wash�ngton, dc, and nat�onal Bureau of stat�st�cs (nBs), var�ous years. China Statistical Yearbook, ch�na stat�st�cs Press, Be�j�ng; �nformat�on on sulphur d�ox�de em�ss�ons from nat�onal Bureau of stat�st�cs (nBs), var�ous years. China Statistical Yearbook, ch�na stat�st�cs Press, Be�j�ng.
CO
2 em
issi
ons
SO
2 em
issi
ons
CO2 per capitaSO2 per capita
CO2 per unit GDPSO2 per unit GDP
241
The political economy of emissions reduction in China
at s�gn�ficantly reduc�ng greenhouse gas em�ss�ons be �ncent�ve-compat�ble w�th the development mot�vat�ons of local governments and the behav�our of enterpr�ses. By est�mat�ng the ekc, th�s chapter exam�ned the need for the ch�nese economy to �mplement em�ss�ons reduct�on strateg�es. The results show that �t �s not enough to wa�t for the turn�ng po�nt to come; �nstead, pol�cy �mplementat�on should be strengthened further �n order to make �ncent�ves compat�ble between the central and local governments, enterpr�ses and people �n a jo�nt effort to reduce em�ss�ons and �mprove the env�ronment.
Notes
1 The figures for ch�na’s carbon d�ox�de em�ss�ons are d�sputable. Apart from offic�al ch�nese den�al of the figures est�mated and publ�shed by Western scholars, there �s a problem of em�ss�ons transfer—that �s, �n the past two decades, an �ncreas�ng amount of the polluted, energy-consum�ng and em�ss�on-produc�ng products have been manufactured �n ch�na, but consumpt�on has taken place ma�nly outs�de ch�na.
2 In h�s d�scuss�on at a workshop, Assar l�ndbeck (2008) ra�sed the �ssue of government �ncent�ves for em�ss�ons reduct�on as a sacr�fice of growth. h�s concern was that the central government’s �mpos�t�on of em�ss�ons duty on local governments could result �n strong res�stance from the latter and countermeasures aga�nst �t, lead�ng to pol�cy fa�lure.
3 Auffhammer and carson (2008) forecast a l�kely scenar�o of a dramat�c �ncrease �n carbon d�ox�de em�ss�ons �n ch�na �n the future. As a consequence, ch�na �s expected to take the lead �n global greenhouse gas em�ss�ons.
References
Bhagwat�, J.n., 1996. The m�racle that d�d happen: understand�ng east As�a �n comparat�ve perspect�ve, keynote speech at the Government and market: The relevance of the Ta�wanese performance to development theory and pol�cy conference �n honour of Professors l�u and Ts�ang, cornell Un�vers�ty, 3 may.
ca�, F., 2008. Approaching a triumphal span: how far is China towards its Lewisian turning point?, UnU-WIder research Paper 2008/09, hels�nk�.
ca�, F. and Wang, d., 2005. ‘ch�na’s demograph�c trans�t�on: �mpl�cat�ons for growth’, �n r. Garnaut and l. song (eds), The China Boom and Its Discontents, As�a Pac�fic Press and AnU e Press, The Austral�an nat�onal Un�vers�ty, canberra:34–52.
deacon, r.T., 2005. Dictatorship, Democracy and the Provision of Public Goods. Ava�lable from http://www.econ.ucsb.edu/~deacon/d�ctdem11_05X.pdf
deacon, r.T., 2005. Dictatorship, Democracy and the Provision of Public Goods. Ava�lable from http://www.econ.ucsb.edu/~deacon/d�ctdem11_05X.pdf.
242
China’s Dilemma
Grossman, G. and krueger, A., 1995. ‘econom�c growth and env�ronment’, Quarterly Journal of Economics, 110(2):353–77.
hayward, s., 2005. ‘The ch�na syndrome and the env�ronmental kuznets curve’, Environmental Policy Outlook AEI Online. Ava�lable from http://www.ae�.org/publ�cat�ons/pubId.23617/pub_deta�l.asp.
kaneko, s. and manag�, s., 2004. ‘env�ronmental product�v�ty �n ch�na’, Economics Bulletin, 17(2):1–10.
k�m, s.-y. and ku�js, l., 2007. Raw material prices, wages, and profitability in China’s industry—how was profitability maintained when input prices and wages increase so fast?, World Bank ch�na research Paper 8, World Bank, Be�j�ng.
krugman, P., 1994. ‘The myth of As�a’s m�racle’, Foreign Affairs, november–december.
ku�js, l. and Wang, T., 2005. China’s pattern of growth: moving to sustainability and reducing inequality, World Bank ch�na research Paper, 2, october.
kuznets, s., 1955. ‘econom�c growth and �ncome �nequal�ty’, American Economic Review, 45(1):1–28.
l�ndbeck, A., 2008. Workshop presentat�on to ch�na econom�cs of cl�mate change—Towards a low-carbon economy, Incept�on meet�ng, st Brännbo, stockholm, 14–15 February.
nat�onal Bureau of stat�st�cs (nBs), var�ous years. China Statistical Yearbook, ch�na stat�st�cs Press, Be�j�ng
stern, n., 2007. The Economics of Climate Change: the Stern review, cambr�dge Un�vers�ty Press, cambr�dge.
Thomas, m., 2007. Climate Change and the Stern Review: an overview and comment from Future in Our Hands Network. Ava�lable from http://www.cl�matecooperat�on.org/�ndex.php?t�tle=stern_rev�ew/m�ke_Thomas_2
Webber, d.J. and Allen, d.o., 2004. Environmental Kuznets curves: mess or meaning?, school of econom�cs d�scuss�on Papers, (0406), Un�vers�ty of the West of england. Ava�lable from http://�deas.repec.org/s/uwe/wpaper.html
World Bank, 1997. Clear Water, Blue Skies: China’s environment in the new century, World Bank, Wash�ngton, dc.
World Bank, var�ous years. World Development Indicators. World Bank, Wash�ngton, dc.
Zheng, J. and hu, A., 2004. An empirical analysis on inter-provincial productivity growth during the reform period, center for ch�na s�tuat�on stud�es Work�ng Paper, (1):2–26.
Acknowledgements
The authors thank Wang me�yan and Zhang B�nb�n for the�r excellent ass�stance �n data process�ng.


![The Dilemma [Chapter 1: The Dilemma , Exponential Future]](https://img.pdfslide.us/doc/110x75/58eeb6841a28ab38788b4593/the-dilemma-chapter-1-the-dilemma-exponential-future.jpg)