Embed Size (px)
Citation preview

China—Challenges and Opportunities Sean Howley and Chip Ridley, Artisan Partners
This material is only intended for Professional Investors only. This material is not for use by retail investors and may not be reproduced or distributed without Artisan Partners’
permission.

Source: Image based on 2013 data from US Census Bureau. Countries encircled are China, India, Indonesia, Bangladesh, Japan, Philippines, Vietnam, Thailand, Burma, South Korea, Nepal, Malaysia, North Korea, Taiwan, Sri Lanka, Cambodia, Laos, Mongolia and Bhutan.

Southeast Asian Geopolitics

Disputed South China Sea Territory
Source: Wikipedia
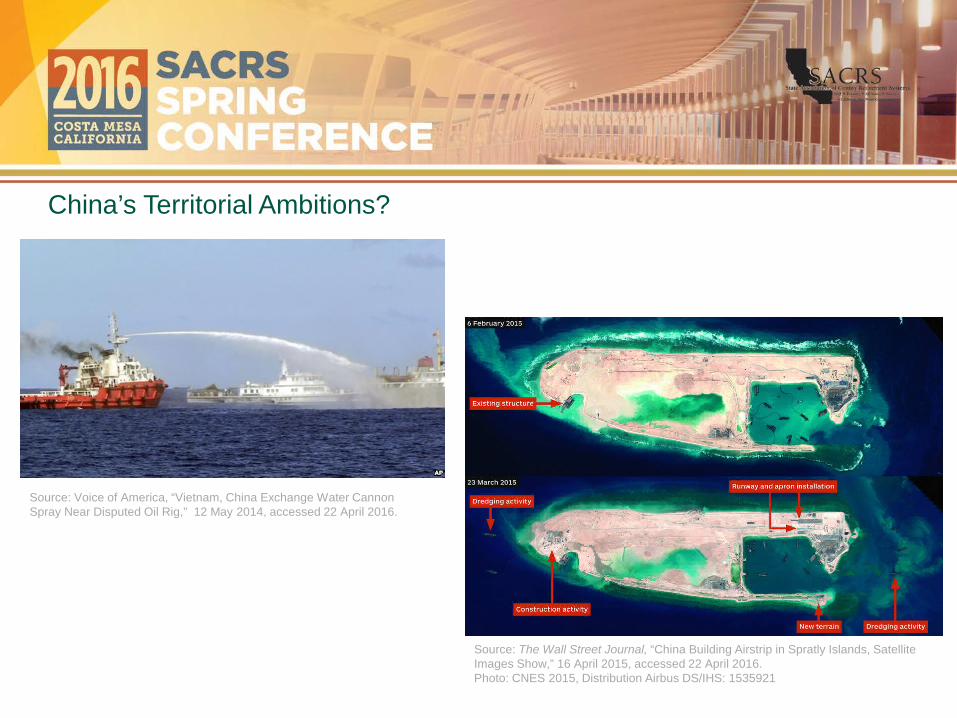
Source: Voice of America, “Vietnam, China Exchange Water Cannon Spray Near Disputed Oil Rig,” 12 May 2014, accessed 22 April 2016.
Source: The Wall Street Journal, “China Building Airstrip in Spratly Islands, Satellite Images Show,” 16 April 2015, accessed 22 April 2016. Photo: CNES 2015, Distribution Airbus DS/IHS: 1535921
China’s Territorial Ambitions?

China’s Macroeconomic Environment

0
100000
200000
300000
400000
500000
600000
700000
1980
1981
1982
1983
1984
1985
1986
1987
1988
1989
1990
1991
1992
1993
1994
1995
1996
1997
1998
1999
2000
2001
2002
2003
2004
2005
2006
2007
2008
2009
2010
2011
2012
2013
2014
China GDP, Hundreds of Millions of CNY
China’s Rapid Economic Growth
Source: FactSet as of 21 April 2016.

-7
-2
3
8
13
1999
2000
2001
2002
2003
2004
2005
2006
2007
2008
2009
2010
2011
2012
2013
2014
2015
China US UK Germany Japan
China’s Annual GDP Growth Rate vs. Developed World
Source: FactSet as of 22 April 2016, China 2015 GDP growth rate from World Bank 2015 estimate.

-10
-5
0
5
10
15
1999
2000
2001
2002
2003
2004
2005
2006
2007
2008
2009
2010
2011
2012
2013
2014
2015
China Brazil India South Africa Korea Mexico Russia Taiwan
China’s Annual GDP Growth Rate vs. Emerging World
Source: FactSet, Bloomberg, World Bank as of 21 April 2016.

0
5
10
15
20
25
1990
1991
1992
1993
1994
1995
1996
1997
1998
1999
2000
2001
2002
2003
2004
2005
2006
2007
2008
2009
2010
2011
2012
2013
2014
2015
China Industrial Production, 12m rolling y/y%change
0102030405060708090
2004
2005
2006
2007
2008
2009
2010
2011
2012
2013
2014
2015
2016
Fixed Assets Investment, y/y % change
Source: FactSet, as of 22 April 2016.
But Infrastructure-Focused Activity Is Slowing in China

0
1000
2000
3000
4000
5000
6000
7000
8000
1999
2000
2001
2002
2003
2004
2005
2006
2007
2008
2009
2010
2011
2012
2013
2014
2015
Australia Iron Ore Exports (AUD) - Price
China’s Economy—Alternate Measures
Source: FactSet, as of 22 April 2016.

0
5
10
15
20
25
30
2005
2006
2006
2007
2007
2008
2008
2009
2009
2010
2010
2011
2011
2012
2012
2013
2013
2014
2014
2015
2015
Premier Li Keqiang Index (Electricity, Railway & Bank Loans)
China’s Economy—Alternate Measures
Source: Bloomberg, as of February 2016.

By 2030, the world’s middle class is projected to reach 4.9 billion people Most of that growth will take place in emerging Asia
- 500
1,000 1,500 2,000 2,500 3,000 3,500 4,000 4,500 5,000
2009 2020 2030
Middle East andNorth AfricaSub-Saharan Africa
Asia Pacific
Central and SouthAmericaEurope
2009 2020 2030
North America 338 18%
333 10%
322 7%
Europe 664 36%
703 22%
680 14%
Central and South America 181 10%
251 8%
313 6%
Asia Pacific 525 28%
1,740 54%
3,228 66%
Sub-Saharan Africa 32 2%
57 2%
107 2%
Middle East and North Africa 105 6%
165 5%
234 5%
Numbers (millions) and share (percent) of global middle class
Sources: The Brookings Institute and OECD Development Working Centre, 2010

Impact of Urbanization The world is experiencing a massive wave of urbanization. More than half of the world’s population—over thr
billion people—already live in towns and cities.
Changes in Urban and Rural Populations
34%
53%
66%
47%
0%
20%
40%
60%
80%
1960 2014
Urban Rural
Source: The World Bank

40
45
50
55
60
65
70
75
80
85
90
1999
2000
2001
2002
2003
2004
2005
2006
2007
2008
2009
2010
2011
2012
2013
2014
China US UK Japan Germany Australia
Consumption as a % of GDP
Economic Opportunity in China
Source: World Bank, as of 22 April 2016.

0
10000
20000
30000
40000
50000
60000
70000
80000
0 20 40 60 80 100 120
GD
P pe
r Cap
ita (2
005
US
D)
Internet Users/100 People
EthiopiChina
Norway
Japan
United States
Internet Penetration
Source: The World Bank

Impact of Urbanization
1 Source: World Meteorological Organization, Press Release No. 1002. Sep-14 2 Source: European Commission, Joint Research Centre (JRC)/PBL Netherlands Environmental Assessment Age
Cities can act as powerful engines of economic growth but the resulting growth in industry and consumption comes along with negative environmental consequences.
The amount of greenhouse gases in the atmosphere reached a new record high in 2013, driven by a surge in carbon dioxide levels.1
2014 CO2 Emissions (kilotons)2
-
1,000,000
2,000,000
3,000,000
4,000,000
5,000,000
6,000,000
7,000,000
8,000,000
9,000,000
10,000,000
11,000,000
China UnitedStates
India Russia Japan Germany Iran Korea Canada Brazil
Top Ten Emitting Countries in 2014 (% of World)
China 30% Germany 2%
United States 15% Iran 2%
India 7% Korea 2%
Russia 5% Canada 2%
Japan 4% Brazil 1%
Total 60%

China’s Capital Markets

0
1000
2000
3000
4000
5000
6000
7000
Nov
-04
Mar
-05
Jul-0
5N
ov-0
5M
ar-0
6Ju
l-06
Nov
-06
Mar
-07
Jul-0
7N
ov-0
7M
ar-0
8Ju
l-08
Nov
-08
Mar
-09
Jul-0
9N
ov-0
9M
ar-1
0Ju
l-10
Nov
-10
Mar
-11
Jul-1
1N
ov-1
1M
ar-1
2Ju
l-12
Nov
-12
Mar
-13
Jul-1
3N
ov-1
3M
ar-1
4Ju
l-14
Nov
-14
Mar
-15
Jul-1
5N
ov-1
5M
ar-1
6
MSCI China A MSCI China H
China’s Developing Capital Markets
Source: FactSet as of 22 April 2016.

0.11
0.12
0.13
0.14
0.15
0.16
0.17
Dec
200
0
Dec
200
1
Dec
200
2
Dec
200
3
Dec
200
4
Dec
200
5
Dec
200
6
Dec
200
7
Dec
200
8
Dec
200
9
Dec
201
0
Dec
201
1
Dec
201
2
Dec
201
3
Dec
201
4
Dec
201
5
U.S. Dollar per China Renminbi
China’s Currency Peg
Source: FactSet as of 22 April 2016.

Questions

Biographies Sean J. Howley is a managing director of Artisan Partners and a business leader for the firm’s Global Equity team. Prior to joining Artisan Partners in March 2007, Mr. Howley was the managing director and product manager for international and global equity products at Putnam Investments, where he was responsible for overseeing communications on policy, strategy and tactics with institutional clients. Before that, he was head of sales and distribution for Pioneer Investment Management, where he developed sales and marketing channels in the United Kingdom and Ireland. Mr. Howley holds a bachelor’s degree in commerce from University College Dublin and a master’s degree in business administration from the Haas School of Business at the University of California-Berkeley. Chip Ridley, CFA, is a managing director of Artisan Partners and the business leader for the firm’s Growth and Emerging Markets teams. Prior to joining Artisan Partners in June 2006, Mr. Ridley was a director of business development and consultant relations for Grantham Mayo Van Otterloo & Co. LLC, where he managed the institutional marketing efforts for western North America and served as product manager for the Emerging Markets strategy. Before that, he was a corporate vice president and principal at Montgomery Asset Management. Mr. Ridley also spent nine years as an aviator in the United States Navy, where he flew and instructed in various types of fighter aircraft. Mr. Ridley holds a bachelor’s degree in economics and history from Duke University and a master’s degree in business administration from Mississippi State University.
Artisan Partners Growth Team

Notes and Disclosures
This presentation is prepared for the State Association of County Retirement Systems. This material represents the views and opinions of the speakers as of 11 May 2016 and are based on current market conditions, which will fluctuate, and are subject to change without notice. While the information contained herein is believed to be reliable, there no guarantee to the accuracy or completeness of any statement in the discussion. This material is for informational purposes only and should not be considered as investment advice or a recommendation of any investment service, product or individual security. Any forecasts contained herein are for illustrative purposes only and are not to be relied upon as advice or interpreted as a recommendation. International investments involve special risks, including currency fluctuation, lower liquidity, different accounting methods and economic and political systems, and higher transaction costs. These risks typically are greater in emerging markets. Such risks include new and rapidly changing political and economic structures, which may cause instability; underdeveloped securities markets; and higher likelihood of high levels of inflation, deflation or currency devaluations. Artisan Partners is an independent investment management firm focused on providing high value-added, active investment strategies to sophisticated clients globally. Artisan Partners Limited Partnership (APLP) is an investment adviser registered with the U.S. Securities and Exchange Commission (SEC). Artisan Partners UK LLP (APUK) is authorized and regulated by the Financial Conduct Authority and is a registered investment adviser with the SEC. APLP and APUK are collectively, with their parent company and affiliates, referred to as Artisan Partners herein. © 2016 Artisan Partners. All rights reserved. For Institutional Investors Only—Not for Onward Distribution