Embed Size (px)
Citation preview
Deutsche Bank Markets Research
Asia China
Strategy
China: Themes and strategy for 2014
Date 3 January 2014
Special Report
Growth-enhancing reforms
Jun Ma, Ph.D
Chief Economist (+852) 2203 8308 [email protected]
Lin Li, Ph.D
Strategist (+852) 2203 [email protected]
Audrey Shi
Research Associate (+852) 2203 6139 [email protected]
________________________________________________________________________________________________________________
Deutsche Bank AG/Hong Kong
Deutsche Bank does and seeks to do business with companies covered in its research reports. Thus, investors shouldbe aware that the firm may have a conflict of interest that could affect the objectivity of this report. Investors should consider this report as only a single factor in making their investment decision. DISCLOSURES AND ANALYST CERTIFICATIONS ARE LOCATED IN APPENDIX 1. MICA(P) 054/04/2013.
2014 will mark the beginning of a series of growth-enhancing structural reforms and shouldwitness a cyclical economic recovery. We expect GDP growth to continue its recovery on the backof five major drivers: 1) reduced overcapacity; 2) deregulation in sectors with under-capacity; 3)the effectiveness of the government’s efforts to “reactivate money stock”; 4) rising externaldemand; and 5) a pro-cyclical fiscal policy. Equity strategy outlook: we see 20% upside potential to the MSCI China Index in 2014, based onexpectations of stronger-than-expected earnings growth, as well as an index re-rating on cyclicalgrowth recovery and the positive impact of reforms. Reforms will likely improve market consensuson China’s growth potential and help lower concerns on macro risks and EPS volatility. Key investment themes: 1) export recovery: should benefit the shipping, ports, textiles, electronicsand machinery sectors; 2) capex recovery: driven by improved money velocity, deregulation, andbetter fiscal performance, higher capex should imply stronger-than-expected demand growth inthe railway, subway, environment, new energy, IT infrastructure and raw material sectors; 3)deregulation: railway/subway, new energy, health and Internet firms benefit due to higher privateinvestment and expanded business scope; 4) financial reform: banks will likely benefit fromreduced LGFV risk and milder-than-expected margin compression; 5) social security reform:insurance and health care sectors will likely see acceleration in earnings growth as a result; 6) newanti-pollution initiatives: gas, wind, and clean coal sectors will accelerate.
Deutsche Bank Markets Research
Asia China
Strategy
China: Themes and strategy for 2014
Date 3 January 2014
Special Report
Growth-enhancing reforms
________________________________________________________________________________________________________________
Deutsche Bank AG/Hong Kong
Deutsche Bank does and seeks to do business with companies covered in its research reports. Thus, investors should be aware that the firm may have a conflict of interest that could affect the objectivity of this report. Investors should consider this report as only a single factor in making their investment decision. DISCLOSURES AND ANALYST CERTIFICATIONS ARE LOCATED IN APPENDIX 1. MICA(P) 054/04/2013.
Jun Ma, Ph.D
Chief Economist (+852) 2203 8308 [email protected]
Lin Li, Ph.D
Strategist (+852) 2203 [email protected]
Audrey Shi
Research Associate (+852) 2203 6139 [email protected]
Economic outlook We expect GDP growth to continue its recovery towards 8.6% in 2014, after accelerating to 7.8-7.9% yoy in 2H 2013 from 7.5% in 2Q. We see five major drivers for the recovery in 2014: 1) reduced overcapacity; 2) deregulation in sectors with massive under-capacity; 3) the effectiveness of the government’s efforts to “reactivate money stock”; 4) rising external demand; and 5) a pro-cyclical fiscal policy. 2014 will mark the beginning of a series of aggressive structural reforms that will enhance China’s growth potential. In particular, we expect reforms to boost private investment in sectors such as railway, new energy, environment, and health. We expect monetary policy to remain stable at least in 1H 2014, and a possible shift towards a tightening bias in 2H. The RMB will likely appreciate by a further 2% vs. the USD in 2014, but the pace of its appreciation in REER terms should slow. The cyclically-adjusted fiscal policy stance should be modestly expansionary. Risks to our 2014 growth outlook include: 1) weaker-than-expected external demand recovery; 2) faster-than-expected property price inflation in China; 3) high volatility of interbank rates; and 4) geopolitical risks.
Equity market strategy We see 20% upside potential to the MSCI China Index in 2014. Our market outlook is based on expectations of stronger-than-expected earnings growth as well as index re-rating on cyclical growth recovery and the positive impact of reforms. We believe that reforms will improve market consensus on China’s growth potential and reduce concerns on macro risks and EPS volatility. We believe the following investment themes will present opportunities for sector outperformance: 1) Export recovery: stronger G3 demand should accelerate Chinese export growth in 2014, and benefit the shipping, ports, textile, electronics and machinery sectors. 2) Capex recovery: driven by improved money velocity, deregulation, and better fiscal performance, higher capex should imply stronger-than-expected demand growth in the railway, subway, environment, new energy, IT infrastructure and raw material sectors. 3) Deregulation: railway/subway, new energy, health and Internet firms should benefit, due to higher private investment and expanded business scope. 4) Financial reform: banks will likely benefit from reduced LGFV risk and milder-than-expected margin compression; 5) Social security reform: the insurance and health care sectors will likely see acceleration in earnings growth as a result; 6) New anti-pollution initiatives: gas, wind, and clean coal will accelerate.
3 January 2014
China: Themes and strategy for 2014
Page 2 Deutsche Bank AG/Hong Kong
Table Of Contents
Macro economic outlook .................................................... 4 2014 GDP growth forecast ................................................................................... 4 Five drivers of the cyclical recovery in 2014 ........................................................ 6 Macro policy outlook ............................................................................................ 9 Reforms and implications ................................................................................... 11
Equity market strategy ...................................................... 15 20% upside potential to MSCI China in 2014 .................................................... 15 Investment themes for 2014 .............................................................................. 18 Sectoral outlook .................................................................................................. 19 Our top buys ....................................................................................................... 21
Deregulation: railway ........................................................ 23 Railway reform: international experience .......................................................... 23 Social capital accounts for only 2% of railway FAI ............................................ 24 Private investment to rise seven-fold in the next two years .............................. 25 Impact on subsectors and companies ............................................................... 26 Companies under Deutsche Bank coverage ...................................................... 27
Deregulation: healthcare ................................................... 28 Significant growth opportunities for private service providers ......................... 28 Private healthcare service providers can reach 20% market share by 2015 ..... 29 Why is the target feasible? Policy initiatives post 3rd Plenum more aggressive than ever ............................................................................................................. 30
Deregulation: telco, new energy, oil & gas ....................... 34 Telco: value-added first, basic services next ...................................................... 34 Renewable energy: private share to rise to 40% ............................................... 36 Oil and gas: impact in the longer term ............................................................... 39
Impact of reforms on banks .............................................. 40 Private banks pose little competition to large banks ......................................... 40 Local government bonds to reduce LGFV risks ................................................. 41 Securitization to reduce WMP risks ................................................................... 43 Impact of rate liberalization on NIM likely be less concerning than perceived . 45
Social security reform........................................................ 48 The reform measures ......................................................................................... 48 Private hospital service could grow 30% p.a. .................................................... 51 Contribution to annuity plans to grow 30% p.a. ................................................ 52 Reforms to boost insurance premium growth by 1.5-2ppts .............................. 54 Market expansion of pharmaceuticals and medical equipment may be lifted by 2ppts p.a. ............................................................................................................ 55 Beneficiaries at the company level..................................................................... 55
Impact of reforms on property sector ............................... 57 Home purchase restrictions ............................................................................... 57 Urban land reform .............................................................................................. 58 Rural land reform ................................................................................................ 59 The property tax ................................................................................................. 61 Social service reform .......................................................................................... 62 Implications for listed developers ...................................................................... 62
New anti-pollution initiatives ............................................. 64 Ten new policies in sight .................................................................................... 64 Oil-to-gas for transportation ............................................................................... 66 Integrated gasification combined cycle (IGCC) .................................................. 70 Environmental monitoring instrument ............................................................... 72
3 January 2014
China: Themes and strategy for 2014
Deutsche Bank AG/Hong Kong Page 3
Table Of Contents - Cont'd
The two-child policy .......................................................... 74 Current policy: “shuangdu” for most locations, “dandu” for selected rural areas ............................................................................................................................ 74 Impact of reform on fertility rates and number of new babies .......................... 76 Reform to enhance long-term growth potential and reduce pension deficit .... 78 Sectoral and company level implications ........................................................... 79
Appendix A: Valuations of overseas-listed China stocks under Deutsche Bank coverage ........................................ 81
3 January 2014
China: Themes and strategy for 2014
Page 4 Deutsche Bank AG/Hong Kong
Macro economic outlook We expect GDP growth to continue its recovery towards 8.6% in 2014,
after accelerating to 7.8-7.9% yoy in 2H 2013 from 7.5% in Q2. We see five major drivers for the recovery in 2014: 1) reduced overcapacity; 2) deregulation in sectors with massive under-capacity; 3) the effectiveness of the government’s efforts to “reactivate money stock”; 4) rising external demand; and 5) a pro-cyclical fiscal policy.
We believe that monetary policy will remain stable in the first half of 2014, and move towards a tightening bias in the second half. We expect a 2% RMB appreciation vs. the USD in 2014. On fiscal policy, we expect the fiscal deficit as a percentage of GDP to fall to 1.8% in 2014 from 2.0% in 2013, but, given the revenue acceleration, fiscal policy in 2014 should become more expansionary.
Reforms should begin to enhance growth in 2014, mainly by boosting private investment in sectors such as railway, subway, health care, financial, new energy, and environment.
Risks to our 2014 growth outlook include: 1) weaker-than-expected external demand recovery; 2) faster-than-expected property price inflation in China, which may result in harsher policy reactions from the government; 3) high volatility of interbank rates in the transition from money targeting to interest rate targeting for monetary operation; and 4) geopolitical risks.
2014 GDP growth forecast
We expect GDP growth to continue its recovery towards 8.6% in 2014, after accelerating to 7.8-7.9% in 2H 2013 from 7.5% in 2Q. Our model shows that GDP growth of 8.5% is the natural rate of growth without excessive inflation – consistent with a modest 2% yoy PPI inflation rate – based on growth elasticity to PPI. The next peak in the ongoing uptrend will therefore likely exceed 8.5% (the mid-point of the current economic cycle) and will probably be close to 9% if monetary policy is adjusted by policy makers with enough foresight.
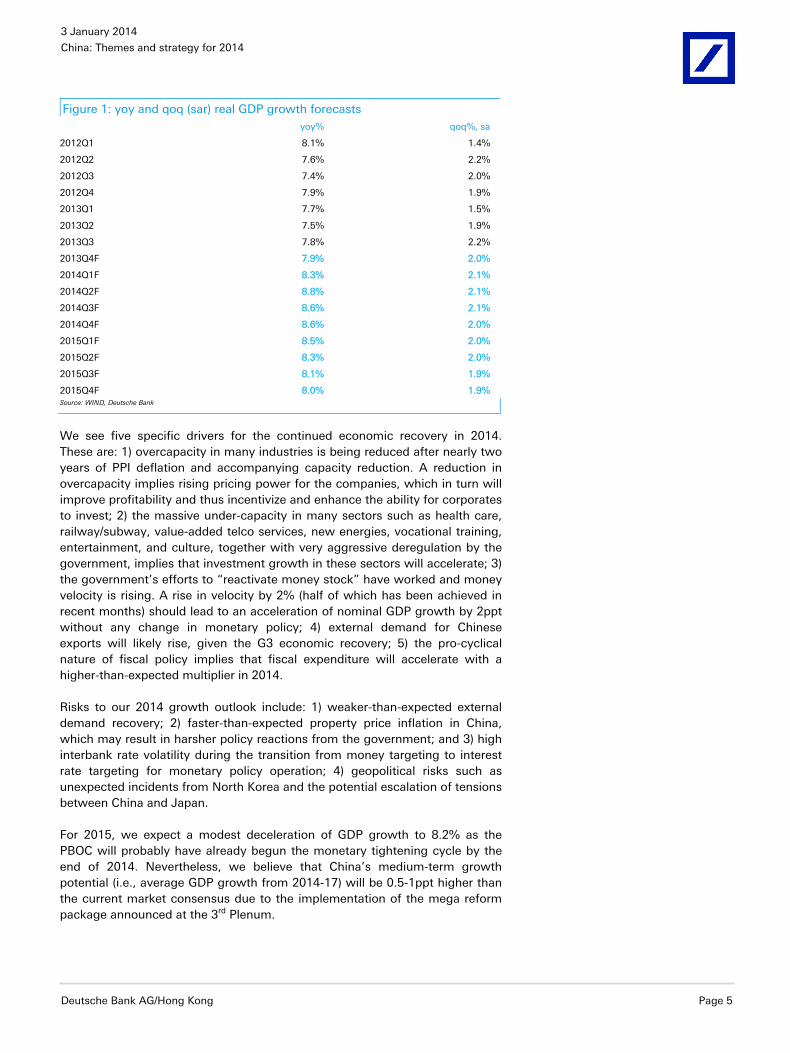
Our updated quarterly GDP growth forecasts (yoy and qoq) are shown in Figure 1. Following the recovery in 2H 2013, we expect the sequential growth momentum to stay at around 2.1% qoq in the coming three quarters, driven by rising external demand, stronger fiscal spending and corporate capex. From 4Q 2014, it is likely that activities will moderate a bit as CPI inflation may have exceeded the 3.5% target and monetary policy has switched towards a tightening bias. After 4Q 2014, we expect sequential GDP growth to remain at around 2% qoq (sa), as growth potential will likely be stronger than earlier expectation due to the benefits of structural reforms.
3 January 2014
China: Themes and strategy for 2014
Deutsche Bank AG/Hong Kong Page 5
Figure 1: yoy and qoq (sar) real GDP growth forecasts yoy% qoq%, sa
2012Q1 8.1% 1.4%
2012Q2 7.6% 2.2%
2012Q3 7.4% 2.0%
2012Q4 7.9% 1.9%
2013Q1 7.7% 1.5%
2013Q2 7.5% 1.9%
2013Q3 7.8% 2.2%
2013Q4F 7.9% 2.0%
2014Q1F 8.3% 2.1%
2014Q2F 8.8% 2.1%
2014Q3F 8.6% 2.1%
2014Q4F 8.6% 2.0%
2015Q1F 8.5% 2.0%
2015Q2F 8.3% 2.0%
2015Q3F 8.1% 1.9%
2015Q4F 8.0% 1.9%Source: WIND, Deutsche Bank
We see five specific drivers for the continued economic recovery in 2014. These are: 1) overcapacity in many industries is being reduced after nearly two years of PPI deflation and accompanying capacity reduction. A reduction in overcapacity implies rising pricing power for the companies, which in turn will improve profitability and thus incentivize and enhance the ability for corporates to invest; 2) the massive under-capacity in many sectors such as health care, railway/subway, value-added telco services, new energies, vocational training, entertainment, and culture, together with very aggressive deregulation by the government, implies that investment growth in these sectors will accelerate; 3) the government’s efforts to “reactivate money stock” have worked and money velocity is rising. A rise in velocity by 2% (half of which has been achieved in recent months) should lead to an acceleration of nominal GDP growth by 2ppt without any change in monetary policy; 4) external demand for Chinese exports will likely rise, given the G3 economic recovery; 5) the pro-cyclical nature of fiscal policy implies that fiscal expenditure will accelerate with a higher-than-expected multiplier in 2014.
Risks to our 2014 growth outlook include: 1) weaker-than-expected external demand recovery; 2) faster-than-expected property price inflation in China, which may result in harsher policy reactions from the government; and 3) high interbank rate volatility during the transition from money targeting to interest rate targeting for monetary policy operation; 4) geopolitical risks such as unexpected incidents from North Korea and the potential escalation of tensions between China and Japan.
For 2015, we expect a modest deceleration of GDP growth to 8.2% as the PBOC will probably have already begun the monetary tightening cycle by the end of 2014. Nevertheless, we believe that China’s medium-term growth potential (i.e., average GDP growth from 2014-17) will be 0.5-1ppt higher than the current market consensus due to the implementation of the mega reform package announced at the 3rd Plenum.
3 January 2014
China: Themes and strategy for 2014
Page 6 Deutsche Bank AG/Hong Kong
Five drivers of the cyclical recovery in 2014
We discuss five drivers of the likely economic recovery in 2014.
Driver for recovery #1: overcapacity is being reduced Many doomsayers argue that China is facing massive overcapacity and therefore its economy will continue to deleverage (i.e., de-invest) and slow down. The recent developments in the economy show the opposite. In several of the most frequently cited “overcapacity” industries – solar, cement, shipbuilding, for example – there are signs that overcapacity is being reduced. According to one of the largest solar panel producers, total capacity in industry in the sector has already come down by 30% in the past 12 months, and there will likely be a further 20-30% reduction in capacity in the coming 12 months, as in this industry, capacity built a few years ago becomes dated and unusable quickly. Together with the rapid increase in domestic demand, on the back of the government’s push for clean energy, the demand-supply balance will likely become very favorable for the sector in the coming 12 months. In the shipbuilding industry, although the level of overcapacity remains high, new orders received in the first half of 2013 rose 113% yoy. For cement, our sector analyst estimates that new capacity additions in 2014 will be down by 36% as a result of new government measures to crack down on new supply, while demand will likely rise strongly, as a result of economic recovery and the acceleration in urbanization.
At a more macro level, the recent sequential increase in PPI and acceleration in manufacturing profit growth were confirmations that overcapacity is being reduced. From July to October 2013, the PPI rose a cumulative 1.2%, compared with a 0.8% drop in the first six months of the year. Manufacturing profit growth accelerated to 16.8% yoy in September-October 2013, up from 12.8% in the first eight months of the year. Note that only when overcapacity eases do companies gain pricing power (i.e., PPI would increase), and thus see profits rise.
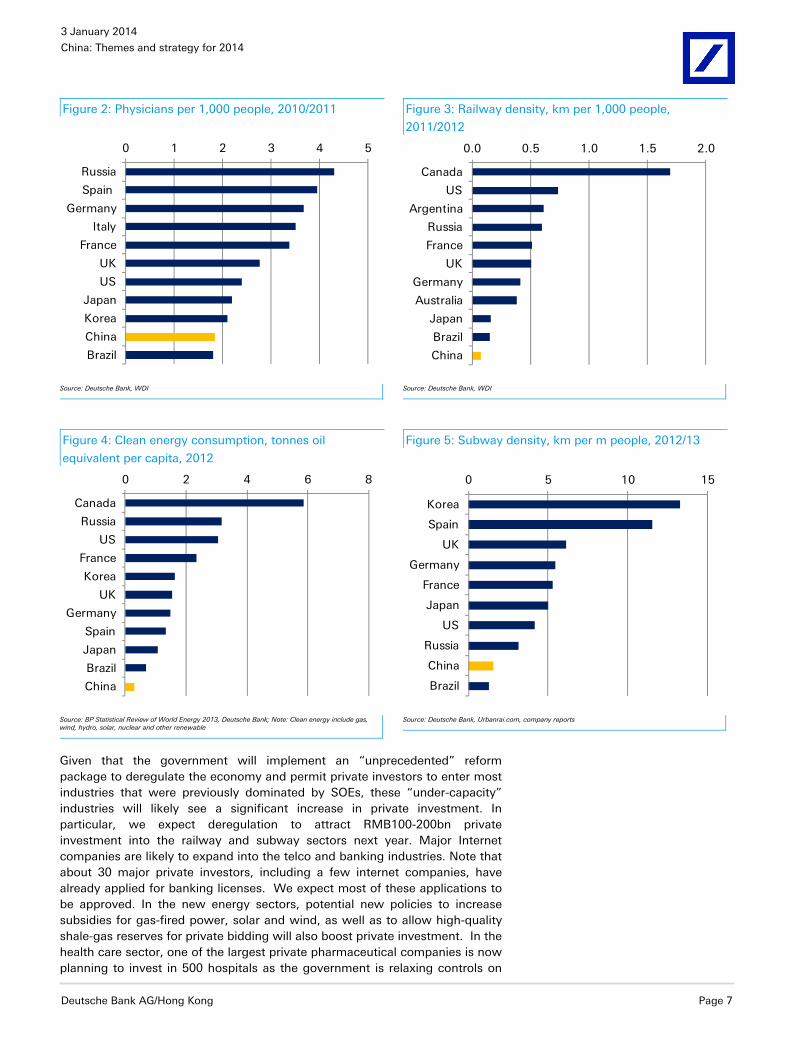
Driver for recovery #2: “under-capacity” + deregulation = stronger growth While most people focus on overcapacity as a downside risk to the economy, it is increasingly evident that a shortage (“under-capacity”) is severe in many other sectors, especially services. Examples of “under-capacity” include the health care, railway, subway and clean energy sectors in which China’s per capita service provision is only a fraction of that in more developed countries (see Figure 2-Figure 5)
3 January 2014
China: Themes and strategy for 2014
Deutsche Bank AG/Hong Kong Page 7
Figure 2: Physicians per 1,000 people, 2010/2011 Figure 3: Railway density, km per 1,000 people,
2011/2012
0 1 2 3 4 5
Russia
Spain
Germany
Italy
France
UK
US
Japan
Korea
China
Brazil
0.0 0.5 1.0 1.5 2.0
Canada
US
Argentina
Russia
France
UK
Germany
Australia
Japan
Brazil
China
Source: Deutsche Bank, WDI Source: Deutsche Bank, WDI
Figure 4: Clean energy consumption, tonnes oil
equivalent per capita, 2012
Figure 5: Subway density, km per m people, 2012/13
0 2 4 6 8
Canada
Russia
US
France
Korea
UK
Germany
Spain
Japan
Brazil
China
0 5 10 15
Korea
Spain
UK
Germany
France
Japan
US
Russia
China
Brazil
Source: BP Statistical Review of World Energy 2013, Deutsche Bank; Note: Clean energy include gas, wind, hydro, solar, nuclear and other renewable Source: Deutsche Bank, Urbanrai.com, company reports
Given that the government will implement an “unprecedented” reform package to deregulate the economy and permit private investors to enter most industries that were previously dominated by SOEs, these “under-capacity” industries will likely see a significant increase in private investment. In particular, we expect deregulation to attract RMB100-200bn private investment into the railway and subway sectors next year. Major Internet companies are likely to expand into the telco and banking industries. Note that about 30 major private investors, including a few internet companies, have already applied for banking licenses. We expect most of these applications to be approved. In the new energy sectors, potential new policies to increase subsidies for gas-fired power, solar and wind, as well as to allow high-quality shale-gas reserves for private bidding will also boost private investment. In the health care sector, one of the largest private pharmaceutical companies is now planning to invest in 500 hospitals as the government is relaxing controls on
3 January 2014
China: Themes and strategy for 2014
Page 8 Deutsche Bank AG/Hong Kong
market access. We believe that these sectors could easily attract RMB300bn new private investment due to deregulation in 2014, which is equivalent to about 0.5% of GDP.
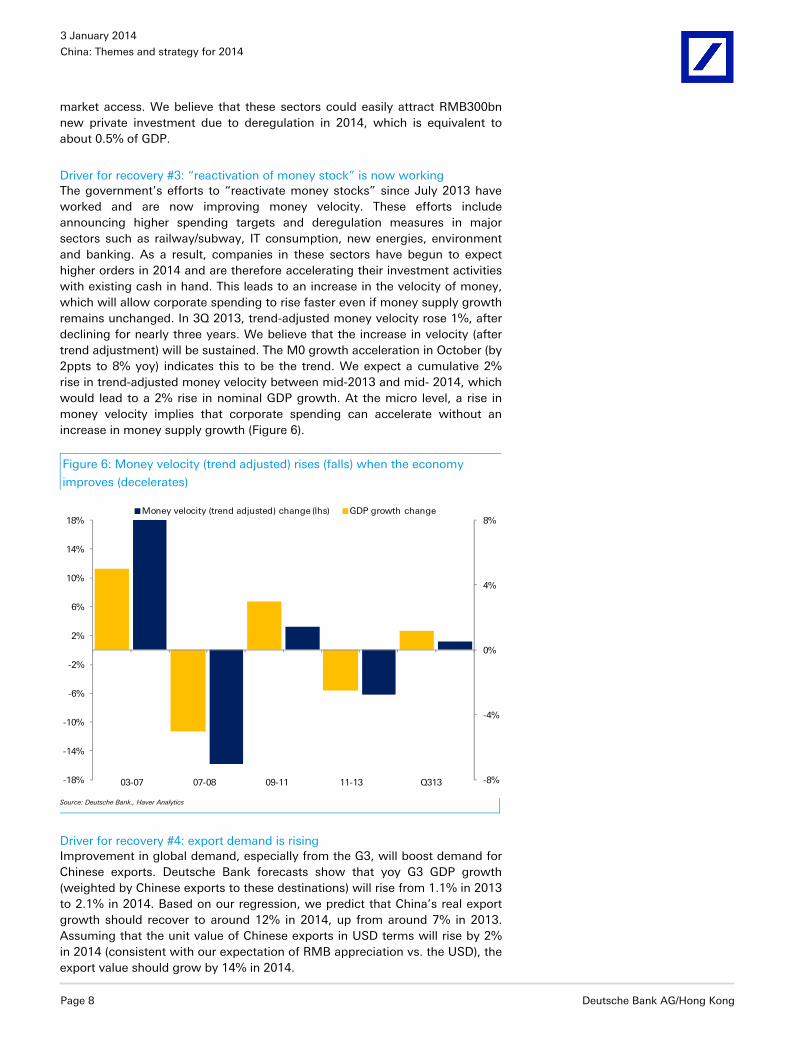
Driver for recovery #3: “reactivation of money stock” is now working The government’s efforts to “reactivate money stocks” since July 2013 have worked and are now improving money velocity. These efforts include announcing higher spending targets and deregulation measures in major sectors such as railway/subway, IT consumption, new energies, environment and banking. As a result, companies in these sectors have begun to expect higher orders in 2014 and are therefore accelerating their investment activities with existing cash in hand. This leads to an increase in the velocity of money, which will allow corporate spending to rise faster even if money supply growth remains unchanged. In 3Q 2013, trend-adjusted money velocity rose 1%, after declining for nearly three years. We believe that the increase in velocity (after trend adjustment) will be sustained. The M0 growth acceleration in October (by 2ppts to 8% yoy) indicates this to be the trend. We expect a cumulative 2% rise in trend-adjusted money velocity between mid-2013 and mid- 2014, which would lead to a 2% rise in nominal GDP growth. At the micro level, a rise in money velocity implies that corporate spending can accelerate without an increase in money supply growth (Figure 6).
Figure 6: Money velocity (trend adjusted) rises (falls) when the economy
improves (decelerates)
-8%
-4%
0%
4%
8%
-18%
-14%
-10%
-6%
-2%
2%
6%
10%
14%
18%Money velocity (trend adjusted) change (lhs) GDP growth change
03-07 07-08 09-11 11-13 Q313
Source: Deutsche Bank., Haver Analytics
Driver for recovery #4: export demand is rising Improvement in global demand, especially from the G3, will boost demand for Chinese exports. Deutsche Bank forecasts show that yoy G3 GDP growth (weighted by Chinese exports to these destinations) will rise from 1.1% in 2013 to 2.1% in 2014. Based on our regression, we predict that China’s real export growth should recover to around 12% in 2014, up from around 7% in 2013. Assuming that the unit value of Chinese exports in USD terms will rise by 2% in 2014 (consistent with our expectation of RMB appreciation vs. the USD), the export value should grow by 14% in 2014.
3 January 2014
China: Themes and strategy for 2014
Deutsche Bank AG/Hong Kong Page 9
Our model has taken into account a range of variables, including external demand (G3 GDP growth), the rise in the unit labor cost, current account balance, and the exchange rate (REER). The unit labor cost captures the structural factor that tends to undermine China’s export competitiveness. However, despite the rising trend in Chinese labor costs, the strengthening of external demand as well as the slowdown in REER appreciation (from about 6% in 2013 to our expectation of 3% in 2014) would still support a stronger export sector next year.
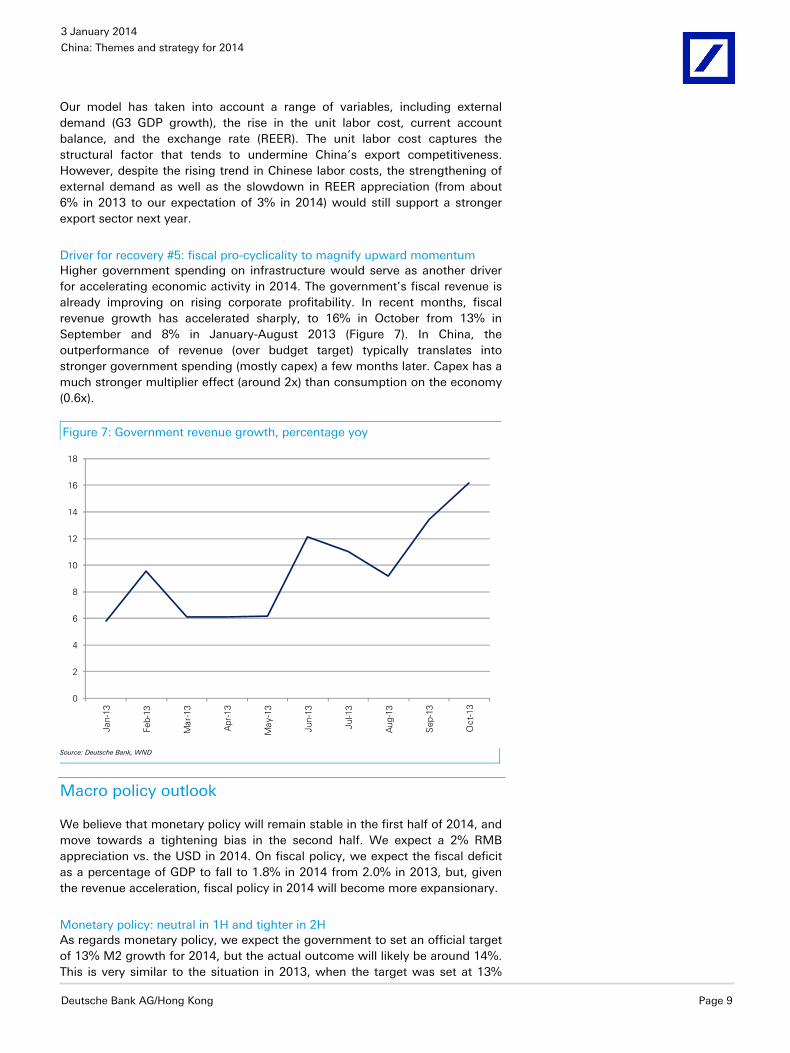
Driver for recovery #5: fiscal pro-cyclicality to magnify upward momentum Higher government spending on infrastructure would serve as another driver for accelerating economic activity in 2014. The government’s fiscal revenue is already improving on rising corporate profitability. In recent months, fiscal revenue growth has accelerated sharply, to 16% in October from 13% in September and 8% in January-August 2013 (Figure 7). In China, the outperformance of revenue (over budget target) typically translates into stronger government spending (mostly capex) a few months later. Capex has a much stronger multiplier effect (around 2x) than consumption on the economy (0.6x).
Figure 7: Government revenue growth, percentage yoy
0
2
4
6
8
10
12
14
16
18
Jan-
13
Feb-
13
Mar
-13
Apr
-13
May
-13
Jun-
13
Jul-1
3
Aug
-13
Sep
-13
Oct
-13
Source: Deutsche Bank, WND
Macro policy outlook
We believe that monetary policy will remain stable in the first half of 2014, and move towards a tightening bias in the second half. We expect a 2% RMB appreciation vs. the USD in 2014. On fiscal policy, we expect the fiscal deficit as a percentage of GDP to fall to 1.8% in 2014 from 2.0% in 2013, but, given the revenue acceleration, fiscal policy in 2014 will become more expansionary.
Monetary policy: neutral in 1H and tighter in 2H As regards monetary policy, we expect the government to set an official target of 13% M2 growth for 2014, but the actual outcome will likely be around 14%. This is very similar to the situation in 2013, when the target was set at 13%
3 January 2014
China: Themes and strategy for 2014
Page 10 Deutsche Bank AG/Hong Kong
and the outturn was slightly over 14% by end-November. We believe that the overall tone of monetary policy in the first half of 2014 will be labeled “prudent” and thus remain largely unchanged from 2013. This is because inflation is within the comfort zone – we expect CPI inflation to fall to 2.9% yoy in December 2013 due to the base effect, and yoy PPI will continue to post a deflation of about 1%. Historically, the PBOC tended to start to hike interest rates when both CPI and PPI inflation rates rose beyond 4%.
By mid-2014, when the 3mma of yoy CPI inflation reaches 3.5%, the PBOC will likely shift its policy stance towards a tightening bias. We believe that the policy tools for 3Q 2014 will likely be open market operations to soak up liquidity, while 4Q could witness the first benchmark interest rate hike and mark the beginning of a new monetary tightening cycle.
Exchange rate: 2% appreciation We forecast a 2% appreciation of the RMB vs. the USD in 2014 with an increase in its two-way volatility. This pace of RMB appreciation is significantly more bullish than the NDF market is implying (1% depreciation), but we believe it is justified by the following. First, stronger economic growth, reforms to further open up the economy, and further relaxation of the QFII scheme will likely result in higher net capital inflows into China. Second, China will likely further reduce its daily intervention into the FX market, as pointed out by PBOC governor Zhou Xiaochuan recently. This means that the authorities will likely allow stronger capital inflows to push up the RMB exchange rate in an economic up-cycle. Thirdly, the rise in CPI inflation towards 3.5-4% in 2H 2014 suggests that the PBOC will have an additional argument to tolerate more appreciation, as a stronger RMB implies lower import prices.
Fiscal policy: de facto expansion We believe that the government will target a general government (central + local) deficit of 1.8% of GDP in 2014, down slightly from 2.0% in 2013. This means that the RMB amount of the fiscal deficit will remain largely unchanged. This prediction is based on Premier Li Keqiang’s statement of “no expansion” in fiscal policy (defined as no increase in the RMB amount of the deficit) but also reflects the need to support many sectors, such as environment, new energies, health care, railway and other infrastructure, as well as the planned VAT reform. We believe that, within the general government budget, the portion of central government deficit will fall, and the portion of local government deficit will rise. This will allow an expansion of the local government bond issuance program, in order to meaningfully implement the “Decision” by the 3rd Plenum to develop the municipal bond market.
However, for two reasons, we believe that fiscal policy in 2014 will in fact be more expansionary. First, in the past few months, fiscal revenue growth accelerated significantly and annual collection will likely exceed the original target by 2% (actual growth of 10% vs. the target of 8%). This would translate into revenue outperformance of RMB260bn. Based on China’s budget convention, we expect these extra revenues to be allocated for spending in 2014 (but not officially counted as part of 2014 deficit). Second, given our forecast of stronger GDP growth, fiscal revenue growth will likely accelerate to around 13% in 2014 (e.g., by 3%, equivalent to 0.6% of GDP). This means that the cyclically-adjusted fiscal deficit will in fact rise by 0.4ppts of GDP (revenue improvement by 0.6% of GDP – reduction in official deficit/GDP ratio by
3 January 2014
China: Themes and strategy for 2014
Deutsche Bank AG/Hong Kong Page 11
0.2ppts). In other words, fiscal policy in 2014 will be a positive contributor to GDP growth acceleration in 2014.
Reforms and implications
The "Decision on Major Issues Concerning Comprehensively Deepening Reforms” issued by the 3rd Plenum of China’s Communist Party’s is by far the most profound in a decade, if not decades, measured by its scope and depth, and will significantly raise China’s growth potential in the years and decades to come.
Content of the reforms In the following paragraphs, we discuss ten major reforms that we believe will have important implications for the economy and are the most relevant to investors:
1) Deregulation
According to the “Decision”, the private sector would be permitted to enter most industries other than those relating to national security. The “Decision” specifically mentioned that “the government will create a level playing field for all market participants”, and “adopt a negative list for a unified market access system” (i.e., allow all investors to start businesses without government approval, unless the companies produce products/services on the negative list.)
We expect the government to issue specific policies in the near term to further open the following sectors to private investors: oil and gas, railway, subway, telco, banking, insurance, medical services, education, and culture. For example, in the oil sector, private investors will likely be allowed to engage in oil and gas exploration, trading (imports and exports), and pipeline operations.
Our view is that “deregulation” is by far the most important part of the reform plan as it will significantly lift China’s growth potential. Our estimate shows that relative to the “no-reform” scenario, deregulation as envisioned in the package will likely lift China’s annual average real GDP growth potential by 2ppts (and annual average private sector real output growth by 3ppts) for the coming decade (see our report “Deregulation and Private Sector Development” published on 13 September). As a result of deregulation, many service sectors (such as financials, telecom, railway, subway, new energy and health care), and will likely grow significantly faster than before, due to the removal of supply-side policy restrictions.
On the flip side, deregulation will likely result in a gradual reduction of the market share of major telco and oil sector SOEs, but the macro impact is that the overall efficiency of the economy will be enhanced and consumers will benefit.
2) Opening up
The reform plan states that China will grant foreign investors greater market access to many services industries, and hints that China would eventually move towards a pre-establishment national treatment system (part of TPP requirement). The sectors specifically named in the “Decision” to be open to foreign investments (e.g., via lifting the foreign ownership limits) include
3 January 2014
China: Themes and strategy for 2014
Page 12 Deutsche Bank AG/Hong Kong
financials, education, health care, culture, accounting and auditing, logistics, nursery, elderly care, construction design, and e-commerce.
We believe that the important background is China’s growing interest in joining negotiations for high standard FTAs such as TPP. At the end of September, China submitted its application to join the negotiations for the Trade-In-Service Agreement (TISA), a move that surprised many observers who continue to believe China is reluctant to open up its market. This application was echoed by the “Decision”, which highlights that China should use “opening up to promote domestic reforms”.
The key economic benefits for China in joining these high standard FTAs is that it will open up new markets for China (see our report “Economic Benefits of TPP Entry for China” published on 31 October), expand the opportunities and returns for China’s global investments, and help accelerate the growth of China’s service industry. The more important benefit is that it will serve as a commitment device for China to push forward many difficult reforms, such as deregulation. On the other hand, opening up means increased competition for some large SOEs with monopoly or near-monopoly positions in the market.
3) Financial liberalization
The reform plan states that the government will encourage private investors to establish small- and mid-sized financial institutions, accelerate interest rate deregulation, and accelerate the reform towards capital account convertibility.
We expect a few thousand privately-owned banks to be set up in the coming five to seven years as a result of this reform. We believe that interest rate deregulation will likely be completed within two to three years. The specific steps in coming years will likely include the introduction of CDs, further lifting the caps on deposit rates, and eventually the cancellation of the deposit rate ceilings. On capital account liberalization, we expect further relaxation of the QDII and QFII quota systems for institutional investors, permission for individuals and companies to freely convert between currencies within more relaxed annual limits, relaxation of restrictions on cross-border RMB flows under the capital account, and the establishment of prudential regulations on cross-border capital flows to replace administrative controls. We believe that China will be able to achieve basic RMB convertibility within three to five years. During the process, the Shanghai Free Trade Zone will play an important role as a pilot program via establishing an RMB offshore market in Shanghai.
Other financial reforms that are included in the reform package include: 1) establishing a multi-layer capital market; 2) establishing the bank deposit insurance scheme; and 3) establishing a government bond yield curve which better reflects market demand and supply.
Overall, we believe these financial reforms will be positive for brokers, insurance companies and FX banks, and most positive for privately-owned financial firms.
4) Land and Hukou reforms
According to the reform plan, the government will grant farmers the legal titles of land use rights (LURs) as well as the rights to transfer (sell and buy) LURs, receive rents on LURs, and pledge LURs as collateral. The Hukou system will be further relaxed and social services to be enhanced for migrant workers in
3 January 2014
China: Themes and strategy for 2014
Deutsche Bank AG/Hong Kong Page 13
cities via fiscal reforms. We believe that this reform will substantially increase the mobility of the 700 farmers (including those already migrated to cities but without Hukou) in China, increase their income, and help speed up the pace of urbanization. The implications are positive for developers and rural-based banks.
5) Resource pricing reform
The government aims to complete the resource pricing reform in the coming few years. As a result of this reform, we expect natural gas and water prices to be raised substantially, on-grid power tariffs to become largely competitive, and refined oil prices to move in line with global prices. We believe that the natural gas sector will likely benefit the most, followed by hydro power and water suppliers, while the oil refining business will enjoy a more stable margin outlook.
6) SOE reform
As we had expected, the government decided to separate non-commercial functions from SOEs, to list unlisted SOEs on the stock market, to establish several state asset management agencies to run the SOE portfolios, and to use the managerial labor market to recruit professional SOE managers. These reforms should help enhance the efficiency and resource allocation of the SOEs and improve the incentives of SOE managers.
In addition to the above “expected” reforms, two other reforms announced in the “Decision” exceeded our expectation. First, the “Decision” explicitly requires an increase in the SOE dividend payout ratio to 30% by 2020. Second, the “Decision” includes a provision to transfer SOE shares to the social security fund. This is a major reform that has been debated for more than a decade. Its final adoption will substantially improve the financial sustainability of the pension system in the longer term.
7) Fiscal reform
According to the “Decision”, the property (holding) tax legislation process will accelerate. We believe the property tax will become a key part of the long-term property stabilization mechanism. This tax will provide a more stable source of local revenue, and help reduce the reliance of local governments on land sales and incentives to push up land prices. The introduction of the property tax in a greater number of cities may initially be viewed by some investors as negative for developers, but would be positive for the sector in the longer term, in our view, as it helps reduce the chance of property bubbles.
Other fiscal reforms announced in the “Decision” include the expansion of the VAT reform to other service sectors, increasing taxes and levies on pollution industries, and improving the transparency of government budgets.
8) Social security reform
The government decided to consolidate the civil servant pension scheme with the enterprise pension scheme, to transfer SOE shares to the pension system, and to prepare a plan for raising retirement ages. These reforms will improve the fairness and the sustainability of the pension system in the longer term.
3 January 2014
China: Themes and strategy for 2014
Page 14 Deutsche Bank AG/Hong Kong
At the product level, the government decided to use tax deferral to incentivize the development of annuities (as a supplement to the basic pension pillar), and to develop critical illness insurance (as part of the health insurance reform) and catastrophe insurance. These reforms will be positive for the insurance sector by adding new product lines.
The promotion of private hospitals and the reform of public hospitals are also highlighted by the “Decision”, which will benefit companies with hospital assets and the entire healthcare industry via raising demand for pharmaceuticals and medical equipment.
9) Developing a municipal bond market
According to the reform plan, the government will permit local governments to issue (municipal) bonds independently, to gradually replace the current financing mechanisms of LGFVs. We expect the Ministry of Finance to be in charge of the qualification of the local governments to issue bonds, and these local governments will be required to publish their government balance sheets and obtain credit ratings. This reform will be highly positive for banks as it helps remove a major overhang on banks’ NPLs.
10) Relaxing the one-child policy
As we had expected in our 6 August report entitled “Quantifying the impact of two-child policy”, the “Decision” states that the government will loosen its decades-long one-child policy by allowing each couple to have two children if either the husband or the wife has no siblings. The “Decision” also mentions that the government will further adjust and improve its population policy going forward, implying that a genuine two-child policy will become possible a few years later. This reform will enhance China’s long-term growth potential by slowing the decline in the working age population. In the shorter run, the reform will benefit sectors such as infant formulas, diapers, baby care products, strollers, clothing, and education. We expect the number of new-born babies to rise by 1.6m per annum during 2014-16 as a result of the reform.
Impact of reforms As regards the impact of these reforms, we see two major implications. One is that many reforms, especially deregulation, will improve the growth potential of the country, and the impact will likely be felt as soon as 2014. This point was elaborated in the first section of this note.
The second implication is that reforms will help reduce macro risks and result in a more stable (sustainable) growth trajectory and less volatile EPS growth. The specific reforms that can reduce macro risks include: a reduction in LGFV risk to banks, due to the development of the local government bond market, lower demand for non-standardized WMPs, due to interest rate deregulation, a more stable property market, due to the introduction of the property tax, better fiscal sustainability, due to improved fiscal transparency, and improved pension sustainability, due to the transfer of SOE shares to the pension system as well as the increase in retirement ages.
3 January 2014
China: Themes and strategy for 2014
Deutsche Bank AG/Hong Kong Page 15
Equity market strategy We see 20% upside potential to the MSCI China Index in 2014. Our
market outlook is based on our expectation of stronger-than-expected earnings growth as well as index re-rating on cyclical growth recovery and the positive impact of reforms. We believe that reforms will likely improve market consensus on China’s growth potential and help reduce concerns on macro risks and EPS volatility.
We expect the following investment themes to allow investors to identify opportunities for sector outperformance:
1) Export recovery: stronger G3 demand to accelerate the Chinese export growth in 2014, and benefit shipping, ports, textile and electronics and machinery sectors.
2) Capex recovery: driven by higher money velocity, deregulation, and better fiscal performance, higher capex should imply stronger-than-expected growth in railway, subway, environment, new energy and IT infrastructure.
3) Deregulation: railway, subway, new energy, health care and Internet firms will benefit due to higher private investment and expanded business scope.
4) Financial reform: banks will likely benefit from reduced LGFV risk and smaller-than-expected margin compression;
5) Social security reform: the insurance and health care sectors will likely see acceleration in earnings growth as a result;
6) New anti-pollution initiatives: the gas, wind, and clean coal sectors should see growth acceleration.
7) Urbanization and land reforms: real estate developers with high exposure to Tier 1 and 2 cities will benefit.
20% upside potential to MSCI China in 2014
We expect 20% upside potential to the MSCI China Index in 2014. Our market outlook is based on our expectation of stronger-than-expected earnings growth as well as index re-rating on cyclical growth recovery and the positive impact of reforms. We believe that reforms will likely improve market consensus on China’s growth potential and help reduce concerns on macro risks and EPS volatility.
Despite the 18% yoy earnings growth of overseas listed Chinese companies with reported 3Q results, the MSCI China Index is still trading at only 9.1x consensus 2014 P/E. This implies that the market is expecting some significant deceleration in economic growth and EPS growth in 2014, which we consider unlikely. Our economic forecast is that real GDP growth rate will accelerate to 8.6% and our top-down EPS growth forecast is 13% in 2014, in contrast to the 7.5% consensus GDP growth forecast and the 9.7% consensus EPS growth.
A cyclical economic recovery ahead We expect GDP growth to rise further, to about 7.9% yoy in 4Q and to 8.6% in 2014. We believe several fundamental factors will sustain the recovery in the coming quarters:
3 January 2014
China: Themes and strategy for 2014
Page 16 Deutsche Bank AG/Hong Kong
Improvement in global demand, especially from the G3, will boost demand for Chinese exports. The Deutsche Bank forecast shows that yoy G3 GDP growth (weighted by Chinese exports to these destinations) will rise from 1.1% in 2013 to 2.1% in 2014. Based on the historical correlation between G3 growth and Chinese export growth, as well as our expectation of slower RMB appreciation in REER terms in 2014, China’s real export growth should recover to around 12% in 2014, up from around 6% in 2013.
Higher government spending on infrastructure would serve as another driver for accelerating economic activity in 2014. The government’s fiscal revenue is already improving on rising corporate profitability. In recent months, fiscal revenue growth accelerated sharply to 16% in October from 13% in September and 8% in January-August. In China, outperformance of revenue (over budget target) typically translates into stronger government spending (mostly capex) a few months later. Capex has a much stronger multiplier effect (around 2x) than consumption on the economy (0.6x).
The government’s efforts to “reactivate money stocks” since July have worked and are now improving money velocity. These efforts include announcing higher spending targets and deregulation measures in major sectors such as railway/subway, IT consumption, new energies, environment and banking. As a result, companies in these sectors have begun to expect higher orders in 2014 and therefore accelerate their investment activities with existing cash in hand. This leads to an increase in the velocity of money, which will allow corporate spending to rise faster, even if money supply growth remains unchanged. In 3Q this year, trend-adjusted money velocity rose 1%, after declining for nearly three years. We believe that an increase in velocity (after trend adjustment) will be sustained. The M0 growth acceleration in October (by 2ppts to 8% yoy) indicates this to be the trend. We expect a cumulative 2% rise in trend-adjusted money velocity between mid-2013 and mid- 2014, which would lead to a 2% rise in nominal GDP growth. At the micro level, a rise in money velocity implies that corporate spending can accelerate without an increase money supply growth.
Potential of market re-rating on cyclical recovery Relative to consensus forecasts – 7.5% yoy GDP growth and 9.7% yoy EPS growth of 2014, our bullish call of 8.6% GDP growth in 2014 suggests 26% upside potential for the MSCI China Index in 2014 with 11ppts coming from market re-rating and another 15ppts coming from EPS growth, based on the following sensitivity analyses:
A 0.5ppt rise in GDP growth implies a 2.5ppts rise in annual EPS growth;
A 2.5ppts rise in EPS growth is typically accompanied by a re-rating of the MSCI China Index by 5% from the current 9.1x 2014 P/E.
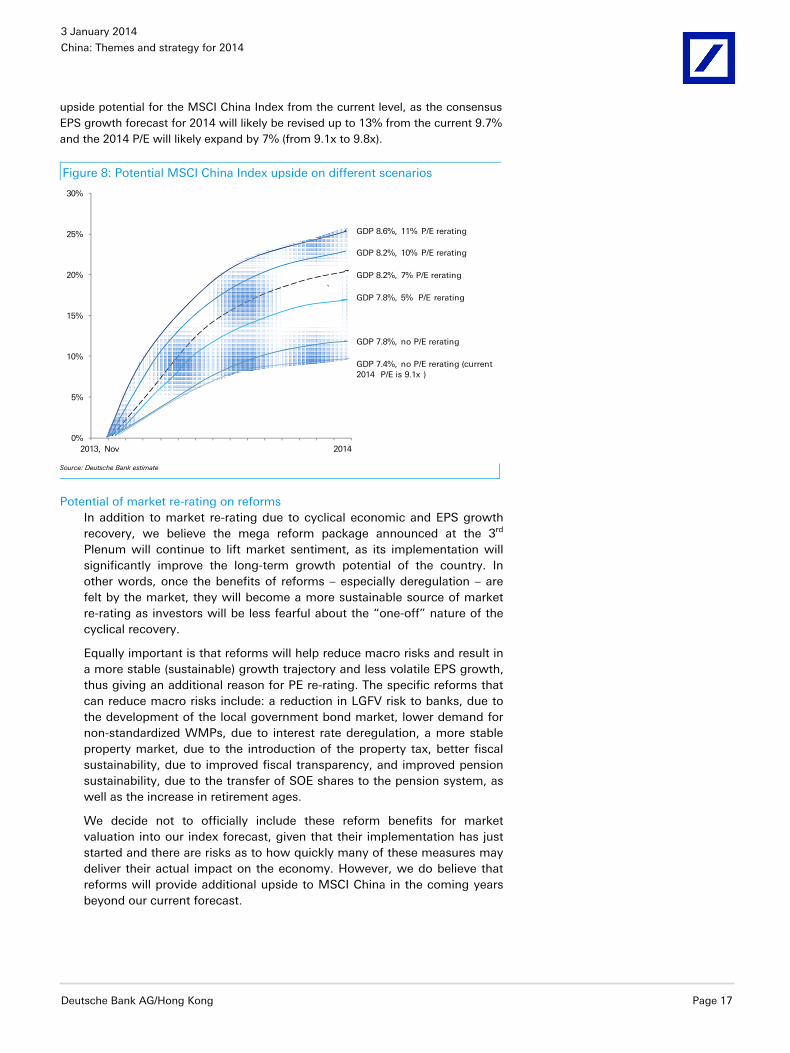
In Figure 8 we show various scenarios for the 2014 MSCI China Index outlook using different combinations of GDP growth projection and degree of market re-rating. Even if the actual final outcome of 2014 growth is 8.2% (below our forecast of 8.6%), and assuming interest rate liberalization would knock off 6ppts from banking sector EPS growth (and 2ppts from MSCI China), it would imply 20%
3 January 2014
China: Themes and strategy for 2014
Deutsche Bank AG/Hong Kong Page 17
upside potential for the MSCI China Index from the current level, as the consensus EPS growth forecast for 2014 will likely be revised up to 13% from the current 9.7% and the 2014 P/E will likely expand by 7% (from 9.1x to 9.8x).
Figure 8: Potential MSCI China Index upside on different scenarios
0%
5%
10%
15%
20%
25%
30%
2013, Nov 2014
GDP 8.6%, 11% P/E rerating
GDP 8.2%, 10% P/E rerating
GDP 8.2%, 7% P/E rerating
GDP 7.8%, 5% P/E rerating
GDP 7.8%, no P/E rerating
GDP 7.4%, no P/E rerating (current 2014 P/E is 9.1x )
Source: Deutsche Bank estimate
Potential of market re-rating on reforms In addition to market re-rating due to cyclical economic and EPS growth recovery, we believe the mega reform package announced at the 3rd Plenum will continue to lift market sentiment, as its implementation will significantly improve the long-term growth potential of the country. In other words, once the benefits of reforms – especially deregulation – are felt by the market, they will become a more sustainable source of market re-rating as investors will be less fearful about the “one-off” nature of the cyclical recovery.
Equally important is that reforms will help reduce macro risks and result in a more stable (sustainable) growth trajectory and less volatile EPS growth, thus giving an additional reason for PE re-rating. The specific reforms that can reduce macro risks include: a reduction in LGFV risk to banks, due to the development of the local government bond market, lower demand for non-standardized WMPs, due to interest rate deregulation, a more stable property market, due to the introduction of the property tax, better fiscal sustainability, due to improved fiscal transparency, and improved pension sustainability, due to the transfer of SOE shares to the pension system, as well as the increase in retirement ages.
We decide not to officially include these reform benefits for market valuation into our index forecast, given that their implementation has just started and there are risks as to how quickly many of these measures may deliver their actual impact on the economy. However, we do believe that reforms will provide additional upside to MSCI China in the coming years beyond our current forecast.
3 January 2014
China: Themes and strategy for 2014
Page 18 Deutsche Bank AG/Hong Kong
Investment themes for 2014
For 2014, we will focus on investment themes under two broad categories: cyclical recovery and reforms. Under these broad categories, we highlight the following themes:
Export recovery
As discussed previously, we expect stronger G3 demand to accelerate the Chinese export growth in 2014. This would benefit shipping, ports, textile, electronics and machinery sectors.
Capex recovery
As pointed out earlier, we expect both corporate capex and government infrastructure spending to grow at a faster pace in 2014. Corporate capex acceleration is likely without an expansion of monetary policy, as velocity is on the rise. Deregulation will provide further room for capex growth, especially by private sector investors. Higher-than-expected fiscal spending is likely, as fiscal revenue growth has accelerated sharply in the past few months. These new investments will likely focus on sectors with “shortages”, such as railways, subways, environment, new energy, IT infrastructure, and healthcare. The main beneficiaries of higher investment include railway construction, railway equipment, raw material and medical equipment producers.
Deregulation
In our view, “Deregulation” is by far the most important part of the reform plan as it will significantly lift China’s growth potential. As a result, sectors such as railways, subways, new energy, health care and the Internet will grow significantly faster than before, due to the removal of policy restrictions on private capital and expansion in business scope. On the flip side, deregulation will likely result in a gradual reduction of the market share of major telecom and oil sector SOEs.
Financial reform
Major reforms in the financial sector will likely include the opening up of the banking sector to private investment, the issuance of local government bonds, the development of securitization products, interest rate liberalization, and capital account liberalization.
The overall impact on these reforms on large banks will be positive in our view, as new privately-owned banks will mainly serve small and micro firms which currently are not yet clients of large banks. In the mean time, the issuance of local government bonds will help alleviate pressure on the quality of large banks’ LGFV loans. Growth of securitization products will improve transparency and thus reduce risks of wealth management products (WMPs). We believe that the impact of interest rate liberalization on banks’ NIM will be limited due to the stable macro environment, the way the demand deposit rate is to be determined, and the rise in the proportion of SME loans in banks’ overall loan portfolios.
3 January 2014
China: Themes and strategy for 2014
Deutsche Bank AG/Hong Kong Page 19
Social security reform
The 3rd Plenum decided on a series of reforms related to health care and pensions. These include: 1) deregulation – opening medical services to private and foreign investors; 2) developing annuities as part of the pension scheme by introducing a tax deferral policy; 3) introducing a house-for-pension scheme; and 4) developing critical illness insurance and catastrophe insurance. We believe these reforms will benefit insurance, high-end pharmaceuticals and medical equipment, as well as private hospitals.
Urbanization and land reforms
The aggregate impact of rural land reform, urban land reform, and urban social service reform is that property inflation will likely slow but real estate developers will likely enjoy higher volume growth. For 2014, we expect average residential property inflation to moderate to around 5% (down from 8% in 2013) but volume growth to accelerate further. At the company level, we believe developers with high exposure to Tier 1 and Tiet 2 cities but with lower risk of property tax introduction will likely outperform in 2014.
Anti-pollution policies
We believe that the government should and will likely raise taxes on coal (e.g., by hiking the resource tax on coal), increase levies on SO2 and NOx, introduce a carbon tax, increase subsidies to new energies such as gas and IGCC, introduce limits to car ownership growth in major cities, and raise industrial land prices (to increase the costs of polluting industrial activities and shift resources to services). These reforms should benefit the gas-related sectors, and other new energies, as well as the railway/subway sectors.
In the last eight chapters of this report we elaborate on many of the above-mentioned themes.
Sectoral outlook
For 2014, we see upside potential to consensus forecasts in the following sectors, due to potentially higher EPS growth and/or catalysts for market re-rating: banks, railway/subways, broker/insurance, shipping, cement, and new energies.
Banks Banks will likely enjoy visible benefits from: 1) reforms, such as the development of a municipal bond market, which will help reduce LGFV risk to banks; 2) securitization, which will help ease the binding constraints of LDR on banks, and reduce WMP risks; 3) accelerating economic growth, which will reduce the probability of NPLs in sectors such as steel, ship building, and solar. Although banks will face margin compression due to interest rate liberalization, we believe its negative impact will be more limited than market perception.
Insurance Insurance will directly benefit from the significant upside potential of Chinese stock indices, as well as potential new businesses in the area of annuities, critical illness insurance and other innovative products. As of June 2013, only 0.4% of Chinese companies participated in the annuities program. The rapid
3 January 2014
China: Themes and strategy for 2014
Page 20 Deutsche Bank AG/Hong Kong
growth of this program after the 3rd Plenum will benefit leading insurance
companies that had already begun to offer such products. As for critical illness insurance, insurance companies that have started pilot programs will likely benefit most, due to their technical readiness.
New energy and environment The new energy and environment sectors will likely benefit from reforms and new policy incentives such as: 1) higher/new government subsidies for new energies such as gas, wind, solar, and IGCC, and 2) deregulation of the national grid and the oil sectors.
We expect gas consumption in China to record a 15% CAGR in the coming five years. Within the value chain, gas distribution companies will likely see substantial upside thanks to: 1) the relaxation of controls on gas import rights; 2) the (potential) spin-off of gas pipelines; and 3) the government promotion of gas-fired power, as well as more extensive use of gas by the transport and industrial sectors.
Wind and solar companies will likely enjoy more stable and/or higher subsidies and better grid access, due to the reform of the national grid system, which will in turn boost the revenue growth of equipment suppliers. In addition, we believe that hydro power generators will be the biggest winners in the electricity price bidding reform (竞价上网、大用户直购电), as their current on-grid price is on average 30% lower than that of IPPs.
Railways/subways Railways/subways will likely be the main beneficiary of the improvement in government fiscal performance, the Ministry of Railway reform, deregulation of the sector as well as anti-pollution policies. Specifically, reforms to be rolled out in the coming years may include: 1) an increase in government spending; 2) a freight transport price hike of up to 20%; 3) rapid growth in private investment in the sector; 4) acceleration of subway development to reduce reliance on road traffic as part of the anti-pollution reform; 5) asset securitization/listing of major railway lines. Beneficiaries will include railway/subway construction companies, equipment markers, and producers of raw materials for this sector.
Brokers Brokers will be a key beneficiary of cross-border capital flows as a result of capital account liberalization, the establishment of a multi-layer capital market, underwriting fee incomes from securitization, and increased demand for asset management.
Shipping China’s export growth will likely accelerate on the back of the improvement in G3 growth outlook and demand for goods from Asia/China. China’s shipping and ports should directly benefit from the upcoming higher export growth.
Cement 2014 will be the beginning of structurally higher margins for cement due to the improving supply-demand outlook. Our cement analyst believes there will be a significant drop off in new additions for 2014 as a result of new government measures to crack down on new supply. Further, cement demand will continue to be boosted by increased FAI spending on railways/subways and social housing. This should lead to higher utilization rates.
3 January 2014
China: Themes and strategy for 2014
Deutsche Bank AG/Hong Kong Page 21
Our top buys
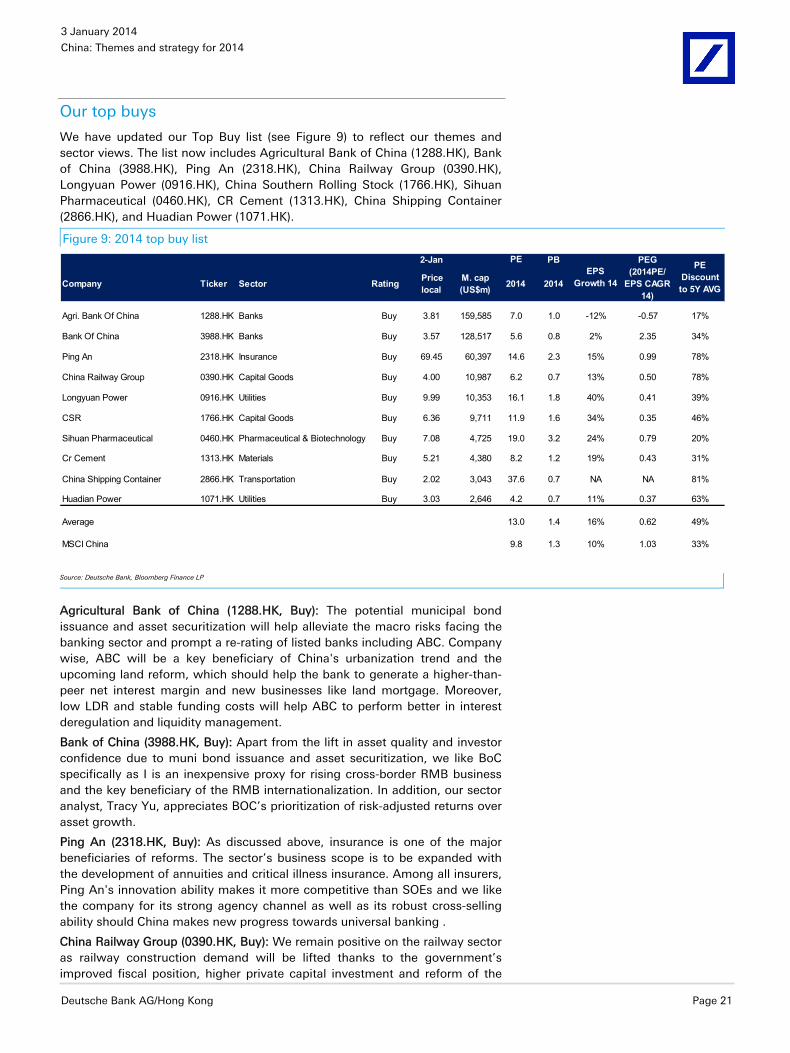
We have updated our Top Buy list (see Figure 9) to reflect our themes and sector views. The list now includes Agricultural Bank of China (1288.HK), Bank of China (3988.HK), Ping An (2318.HK), China Railway Group (0390.HK), Longyuan Power (0916.HK), China Southern Rolling Stock (1766.HK), Sihuan Pharmaceutical (0460.HK), CR Cement (1313.HK), China Shipping Container (2866.HK), and Huadian Power (1071.HK).
Figure 9: 2014 top buy list
2-Jan PB
Company Ticker Sector Rating Price local
M. cap (US$m) 2014 2014
Agri. Bank Of China 1288.HK Banks Buy 3.81 159,585 7.0 1.0 -12% -0.57 17%
Bank Of China 3988.HK Banks Buy 3.57 128,517 5.6 0.8 2% 2.35 34%
Ping An 2318.HK Insurance Buy 69.45 60,397 14.6 2.3 15% 0.99 78%
China Railway Group 0390.HK Capital Goods Buy 4.00 10,987 6.2 0.7 13% 0.50 78%
Longyuan Power 0916.HK Utilities Buy 9.99 10,353 16.1 1.8 40% 0.41 39%
CSR 1766.HK Capital Goods Buy 6.36 9,711 11.9 1.6 34% 0.35 46%
Sihuan Pharmaceutical 0460.HK Pharmaceutical & Biotechnology Buy 7.08 4,725 19.0 3.2 24% 0.79 20%
Cr Cement 1313.HK Materials Buy 5.21 4,380 8.2 1.2 19% 0.43 31%
China Shipping Container 2866.HK Transportation Buy 2.02 3,043 37.6 0.7 NA NA 81%
Huadian Power 1071.HK Utilities Buy 3.03 2,646 4.2 0.7 11% 0.37 63%
Average 13.0 1.4 16% 0.62 49%
MSCI China 9.8 1.3 10% 1.03 33%
PE Discount to 5Y AVG
PEEPS
Growth 14
PEG (2014PE/
EPS CAGR 14)
Source: Deutsche Bank, Bloomberg Finance LP
Agricultural Bank of China (1288.HK, Buy): The potential municipal bond issuance and asset securitization will help alleviate the macro risks facing the banking sector and prompt a re-rating of listed banks including ABC. Company wise, ABC will be a key beneficiary of China's urbanization trend and the upcoming land reform, which should help the bank to generate a higher-than-peer net interest margin and new businesses like land mortgage. Moreover, low LDR and stable funding costs will help ABC to perform better in interest deregulation and liquidity management.
Bank of China (3988.HK, Buy): Apart from the lift in asset quality and investor confidence due to muni bond issuance and asset securitization, we like BoC specifically as I is an inexpensive proxy for rising cross-border RMB business and the key beneficiary of the RMB internationalization. In addition, our sector analyst, Tracy Yu, appreciates BOC’s prioritization of risk-adjusted returns over asset growth.
Ping An (2318.HK, Buy): As discussed above, insurance is one of the major beneficiaries of reforms. The sector’s business scope is to be expanded with the development of annuities and critical illness insurance. Among all insurers, Ping An's innovation ability makes it more competitive than SOEs and we like the company for its strong agency channel as well as its robust cross-selling ability should China makes new progress towards universal banking .
China Railway Group (0390.HK, Buy): We remain positive on the railway sector as railway construction demand will be lifted thanks to the government’s improved fiscal position, higher private capital investment and reform of the
3 January 2014
China: Themes and strategy for 2014
Page 22 Deutsche Bank AG/Hong Kong
MoR. Subway construction will also accelerate due to the anti-pollution campaign, in our view. We prefer CRG to CRCC, mainly due to the former’s better expense control and cash flow management.
Longyuan Power (0916.HK, Buy): We like the wind power sector as its percentage in total energy consumption is set to rise due to the government’s anti-pollution efforts. Sector fundamentals like utilization and working capital will also likely improve steadily over the next few years, owing to the commencement of the UHV lines, accelerated tariff premium payment and the national grid reform. Our sector analyst, Kai-ting Wong, likes Longyuan given its capacity addition both domestically and overseas, as well as its attractive valuation at 16x FY14E P/E (10% below the historical average) vs. 40% EPS growth in 2014.
China Southern Rolling Stock (1766.HK, Buy): We foresee acceleration of revenue growth in the railway equipment sector to 20% per annum during 2013-15 vs. 9% 2008-2012. The key reasons are: 1) higher railway investment boosted by private capital; 2) stronger external demand, given that Premier Li Keqiang is personally helping with the global marketing of CRS products; 3) railway traffic increase; and 4) replacement needs of existing lines. CSR, as one of the two largest rolling-stock producers in China, will likely post a 25% EPS CAGR over the next two years, in our view (13ppts and 15ppts ahead of market consensus). The company is trading at a 2014E PE of 12x, which looks attractive based on our 34% EPS growth forecast for 2014.
Sihuan Pharmaceutical (0460.HK, Buy): We believe that the sector will enjoy upside potential from the deregulation of healthcare services and social security reform. For Sihuan, key drivers include the organic growth of in-line products, the ramp-up of acquired businesses, and the quality of the pipeline and incoming acquisitions. Moreover, the company's strong cash position and good track record of product procurement enable it to continue making product acquisitions that address market opportunities.
CR Cement (1313.HK, Buy): The overcapacity issue in the cement sector has been largely contained. Going forward, we expect major players with high technical and environmental standards to benefit from the scrapping of outdated capacity at smaller mills and the government’s anti-pollution campaign. Moreover, we believe that Southern China, including Guangxi (where CR Cement operates), is headed for a structural improvement in supply-demand balance and strong demand in the region will likely continue, given the pipeline of infrastructure and property projects, and relatively low cement penetration.
China Shipping Container (2866.HK, Buy): We expect Chinese exports to pick up with G3 growth recovery and to be further boosted by the reform benefits of SHFTZ, the establishment of other free trade zones and China’s potential entry into the TPP in the medium term. We view the company's container and cargo business as the major beneficiary of merchandise export recovery. We think carriers' supply discipline along with pickup in demand will drive strong earnings recovery going forward. The stock is trading at 0.7x 2014E P/B, which in our view is still cheap as we expect it to return profit in 2014. Buy.
Huadian Power (1071.HK, Buy): We expect IPPs to continue their outperformance given 1) relatively stable fuel prices; 2) tariff cut concerns are overly discounted in the price; and 3) the power sector reform ahead should improve the regulatory environment. Huadian is our sector analyst Michael Tong’s sector Buy due to: 1) its cheap valuation at 4.2x FY14E P/E and 0.7x P/B; 2) a high dividend yield of 6%; and 3) its quickly improving balance sheet.
3 January 2014
China: Themes and strategy for 2014
Deutsche Bank AG/Hong Kong Page 23
Deregulation: railway1 According to the “Decision on Major Issues Concerning Comprehensively Deepening Reforms” approved at the 3rd Plenum, greater market access will be granted to domestic private enterprises and foreign enterprises. The “Decision” specifically mentioned that the government will “create a level playing ground for all market participants”, and “adopt a negative list for a unified market access system” (i.e., allow all investors to start businesses without government approval, unless the companies produce products/services on the negative list).
We believe that such “deregulation” is by far the most important part of the reform plan as it will significantly lift China’s growth potential. Our estimate shows that relative to the “no-reform” scenario, the envisioned deregulation will likely lift China’s average annual real GDP growth potential by 2ppts for the coming decade (see our report, Deregulation and Private Sector Development published on 13 September).
In this and the following chapters we discuss the likely roadmaps for “deregulation” in a number of key sectors and their implications. These sectors are: railways, healthcare, new energy, and telecoms, as well as oil & gas (deregulation of the financial sector is discussed in the chapter on “Impact of reforms on banks” of report). In our view, private players in most of the above-mentioned sectors will likely grow significantly faster than before, due to the removal of policy restrictions. On the flip side, deregulation will likely result in a gradual reduction of the market share of some SOEs in previously monopolized sectors.
Railway reform: international experience
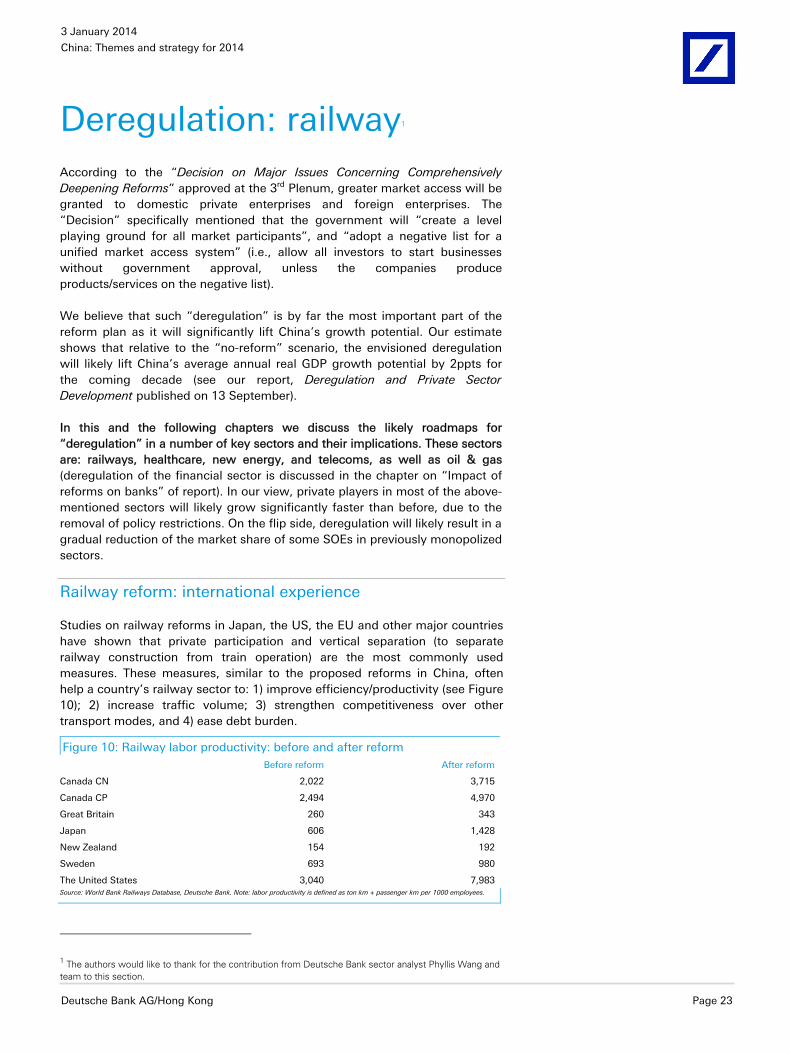
Studies on railway reforms in Japan, the US, the EU and other major countries have shown that private participation and vertical separation (to separate railway construction from train operation) are the most commonly used measures. These measures, similar to the proposed reforms in China, often help a country’s railway sector to: 1) improve efficiency/productivity (see Figure 10); 2) increase traffic volume; 3) strengthen competitiveness over other transport modes, and 4) ease debt burden.
Figure 10: Railway labor productivity: before and after reform Before reform After reform
Canada CN 2,022 3,715
Canada CP 2,494 4,970
Great Britain 260 343
Japan 606 1,428
New Zealand 154 192
Sweden 693 980
The United States 3,040 7,983Source: World Bank Railways Database, Deutsche Bank. Note: labor productivity is defined as ton km + passenger km per 1000 employees.
1 The authors would like to thank for the contribution from Deutsche Bank sector analyst Phyllis Wang and team to this section.
3 January 2014
China: Themes and strategy for 2014
Page 24 Deutsche Bank AG/Hong Kong
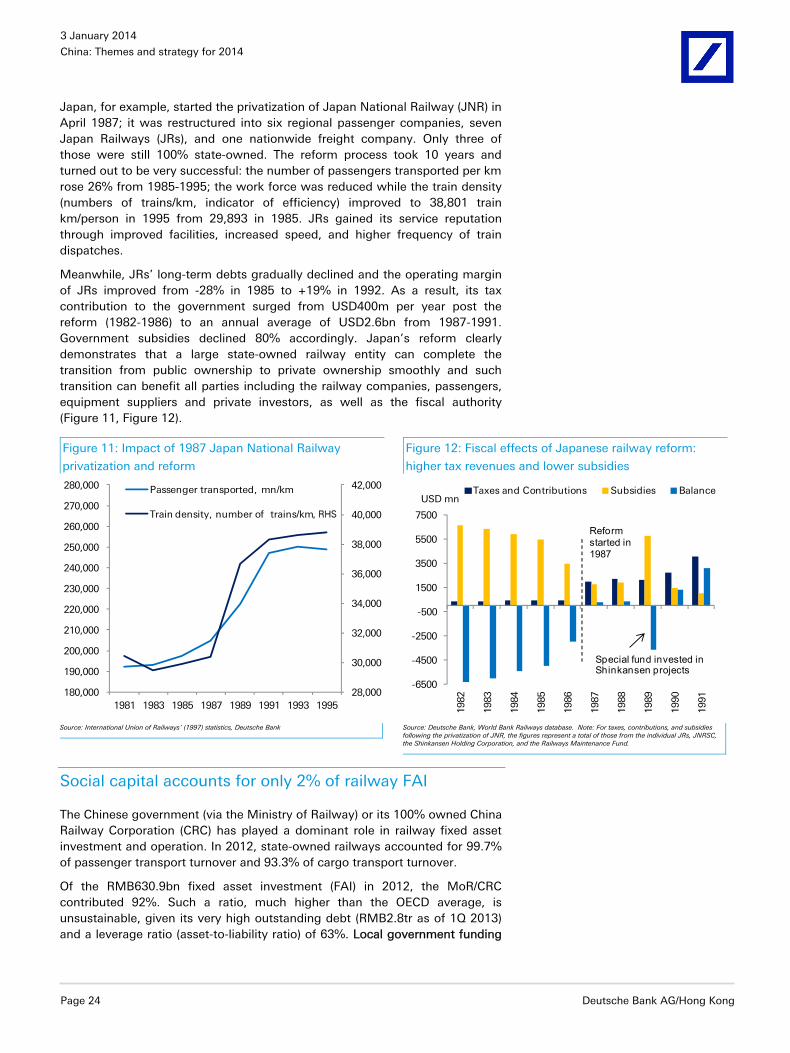
Japan, for example, started the privatization of Japan National Railway (JNR) in April 1987; it was restructured into six regional passenger companies, seven Japan Railways (JRs), and one nationwide freight company. Only three of those were still 100% state-owned. The reform process took 10 years and turned out to be very successful: the number of passengers transported per km rose 26% from 1985-1995; the work force was reduced while the train density (numbers of trains/km, indicator of efficiency) improved to 38,801 train km/person in 1995 from 29,893 in 1985. JRs gained its service reputation through improved facilities, increased speed, and higher frequency of train dispatches.
Meanwhile, JRs’ long-term debts gradually declined and the operating margin of JRs improved from -28% in 1985 to +19% in 1992. As a result, its tax contribution to the government surged from USD400m per year post the reform (1982-1986) to an annual average of USD2.6bn from 1987-1991. Government subsidies declined 80% accordingly. Japan’s reform clearly demonstrates that a large state-owned railway entity can complete the transition from public ownership to private ownership smoothly and such transition can benefit all parties including the railway companies, passengers, equipment suppliers and private investors, as well as the fiscal authority (Figure 11, Figure 12).
Social capital accounts for only 2% of railway FAI
The Chinese government (via the Ministry of Railway) or its 100% owned China Railway Corporation (CRC) has played a dominant role in railway fixed asset investment and operation. In 2012, state-owned railways accounted for 99.7% of passenger transport turnover and 93.3% of cargo transport turnover.
Of the RMB630.9bn fixed asset investment (FAI) in 2012, the MoR/CRC contributed 92%. Such a ratio, much higher than the OECD average, is unsustainable, given its very high outstanding debt (RMB2.8tr as of 1Q 2013) and a leverage ratio (asset-to-liability ratio) of 63%. Local government funding
Figure 11: Impact of 1987 Japan National Railway
privatization and reform
Figure 12: Fiscal effects of Japanese railway reform:
higher tax revenues and lower subsidies
28,000
30,000
32,000
34,000
36,000
38,000
40,000
42,000
180,000
190,000
200,000
210,000
220,000
230,000
240,000
250,000
260,000
270,000
280,000
1981 1983 1985 1987 1989 1991 1993 1995
Passenger transported, mn/km
Train density, number of trains/km
-6500
-4500
-2500
-500
1500
3500
5500
7500
1982
1983
1984
1985
1986
1987
1988
1989
1990
1991
Taxes and Contributions Subsidies BalanceUSD mn
Reform started in 1987
Special fund invested in Shinkansen projects
Source: International Union of Railways’ (1997) statistics, Deutsche Bank Source: Deutsche Bank, World Bank Railways database. Note: For taxes, contributions, and subsidies following the privatization of JNR, the figures represent a total of those from the individual JRs, JNRSC, the Shinkansen Holding Corporation, and the Railways Maintenance Fund.
, RHS
3 January 2014
China: Themes and strategy for 2014
Deutsche Bank AG/Hong Kong Page 25
and social capital2 combined contributed only 8% of railway FAI, of which only 2ppts was from social capital. Therefore, the deregulation of the railway sector is a must in order to attract more capital and reduce the CRC’s leverage ratio.
Private investment to rise seven-fold in the next two years
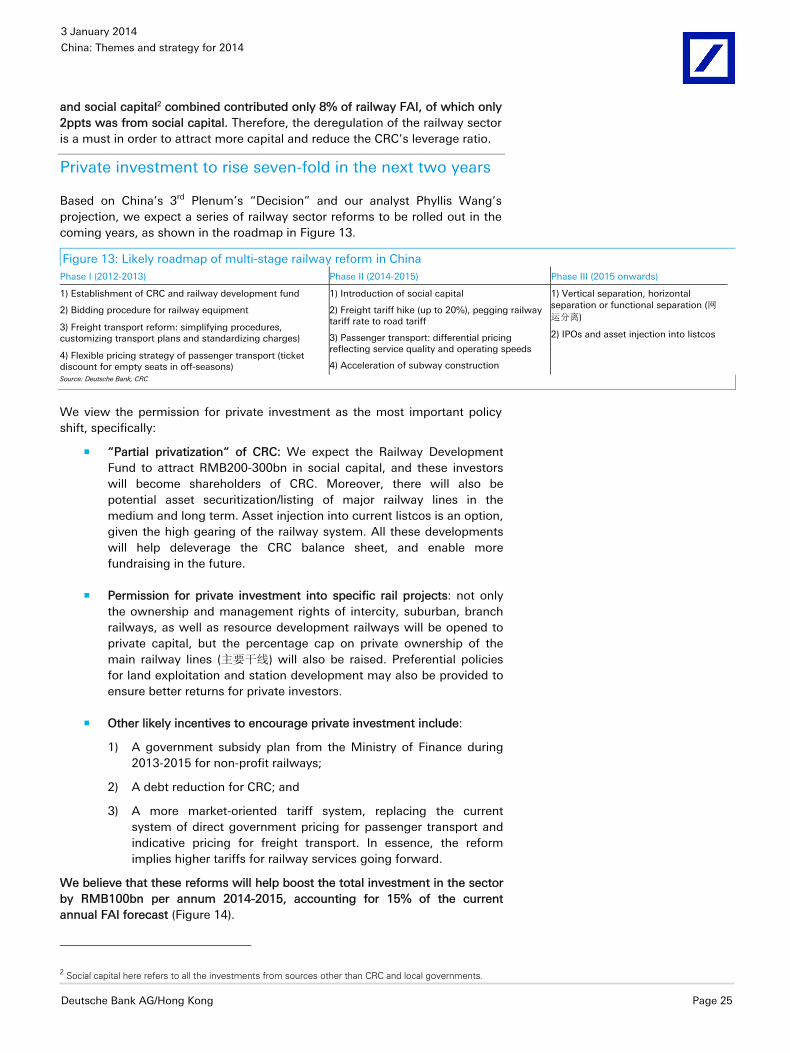
Based on China’s 3rd Plenum’s “Decision” and our analyst Phyllis Wang’s projection, we expect a series of railway sector reforms to be rolled out in the coming years, as shown in the roadmap in Figure 13.
Figure 13: Likely roadmap of multi-stage railway reform in China Phase I (2012-2013) Phase II (2014-2015) Phase III (2015 onwards)
1) Establishment of CRC and railway development fund
2) Bidding procedure for railway equipment
1) Introduction of social capital
2) Freight tariff hike (up to 20%), pegging railway tariff rate to road tariff
3) Passenger transport: differential pricing reflecting service quality and operating speeds
4) Acceleration of subway construction
1) Vertical separation, horizontal separation or functional separation (网运分离)
2) IPOs and asset injection into listcos 3) Freight transport reform: simplifying procedures, customizing transport plans and standardizing charges)
4) Flexible pricing strategy of passenger transport (ticket discount for empty seats in off-seasons) Source: Deutsche Bank, CRC
We view the permission for private investment as the most important policy shift, specifically:
“Partial privatization“ of CRC: We expect the Railway Development Fund to attract RMB200-300bn in social capital, and these investors will become shareholders of CRC. Moreover, there will also be potential asset securitization/listing of major railway lines in the medium and long term. Asset injection into current listcos is an option, given the high gearing of the railway system. All these developments will help deleverage the CRC balance sheet, and enable more fundraising in the future.
Permission for private investment into specific rail projects: not only the ownership and management rights of intercity, suburban, branch railways, as well as resource development railways will be opened to private capital, but the percentage cap on private ownership of the main railway lines (主要干线) will also be raised. Preferential policies for land exploitation and station development may also be provided to ensure better returns for private investors.
Other likely incentives to encourage private investment include:
1) A government subsidy plan from the Ministry of Finance during 2013-2015 for non-profit railways;
2) A debt reduction for CRC; and
3) A more market-oriented tariff system, replacing the current system of direct government pricing for passenger transport and indicative pricing for freight transport. In essence, the reform implies higher tariffs for railway services going forward.
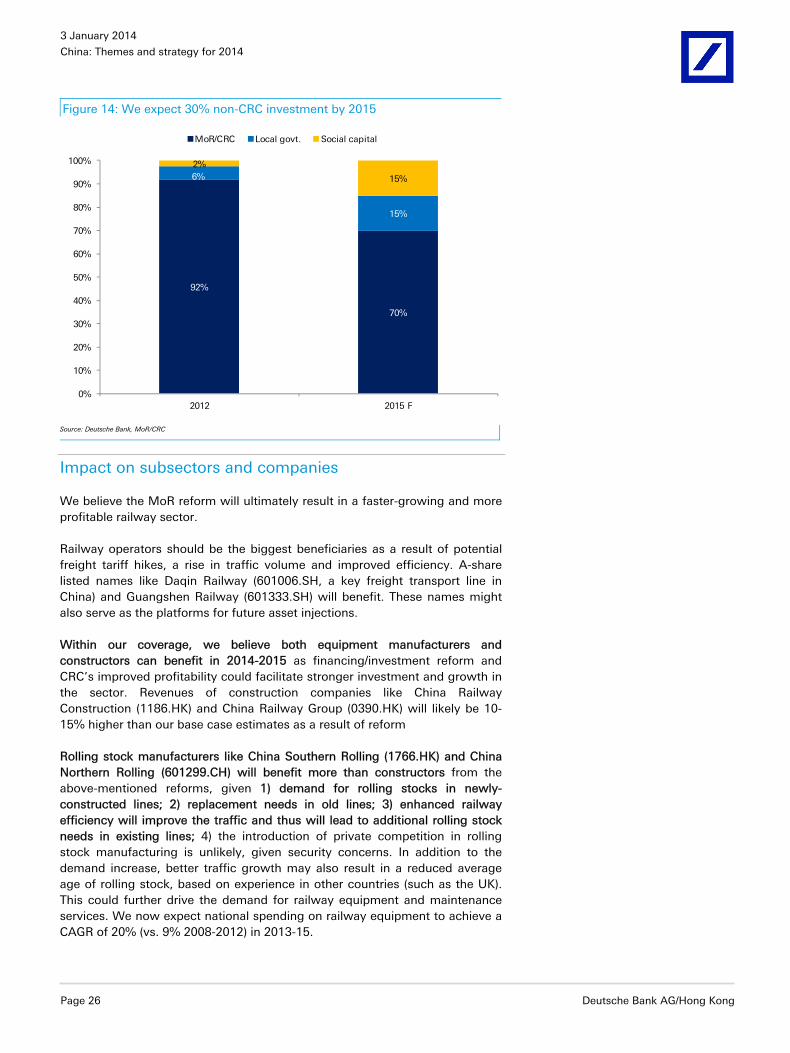
We believe that these reforms will help boost the total investment in the sector by RMB100bn per annum 2014-2015, accounting for 15% of the current annual FAI forecast (Figure 14).
2 Social capital here refers to all the investments from sources other than CRC and local governments.
3 January 2014
China: Themes and strategy for 2014
Page 26 Deutsche Bank AG/Hong Kong
Figure 14: We expect 30% non-CRC investment by 2015
92%
70%
6%
15%
2%
15%
0%
10%
20%
30%
40%
50%
60%
70%
80%
90%
100%
2012 2015 F
MoR/CRC Local govt. Social capital
Source: Deutsche Bank, MoR/CRC
Impact on subsectors and companies
We believe the MoR reform will ultimately result in a faster-growing and more profitable railway sector.
Railway operators should be the biggest beneficiaries as a result of potential freight tariff hikes, a rise in traffic volume and improved efficiency. A-share listed names like Daqin Railway (601006.SH, a key freight transport line in China) and Guangshen Railway (601333.SH) will benefit. These names might also serve as the platforms for future asset injections.
Within our coverage, we believe both equipment manufacturers and constructors can benefit in 2014-2015 as financing/investment reform and CRC’s improved profitability could facilitate stronger investment and growth in the sector. Revenues of construction companies like China Railway Construction (1186.HK) and China Railway Group (0390.HK) will likely be 10-15% higher than our base case estimates as a result of reform
Rolling stock manufacturers like China Southern Rolling (1766.HK) and China Northern Rolling (601299.CH) will benefit more than constructors from the above-mentioned reforms, given 1) demand for rolling stocks in newly-constructed lines; 2) replacement needs in old lines; 3) enhanced railway efficiency will improve the traffic and thus will lead to additional rolling stock needs in existing lines; 4) the introduction of private competition in rolling stock manufacturing is unlikely, given security concerns. In addition to the demand increase, better traffic growth may also result in a reduced average age of rolling stock, based on experience in other countries (such as the UK). This could further drive the demand for railway equipment and maintenance services. We now expect national spending on railway equipment to achieve a CAGR of 20% (vs. 9% 2008-2012) in 2013-15.
3 January 2014
China: Themes and strategy for 2014
Deutsche Bank AG/Hong Kong Page 27
Companies under Deutsche Bank coverage
China Southern Rolling (1766.HK, Buy): CSR mainly produces locomotives, MUs, passenger carriages, freight wagons and rapid transit vehicles. We post a 25% EPS CAGR for the company in 2013-2015, 13ppts and 15ppts ahead of market consensus. Apart from the sector upsides stated above, we like the company, given 1) CSR was the largest rolling stock manufacturer and solutions provider in China with strong research and leading technology; 2) stronger external demand, given that Premier Li Keqiang is personally helping with the global marketing of CRS products; 3) the company is trading at a 2014E PE of 13x, which looks attractive based on our 34% EPS growth forecast for 2014.
Zhuzhou CSR (3898.HK, Buy): Zhuzhou CSR Times Electric is a leading train-borne electrical system provider and integrator for the railway industry with comprehensive capabilities in train power converters, auxiliary power supply equipment and control systems for urban rail systems. We forecast a 30% earnings growth for the company in 2014, 11% ahead of market expectations, mainly because of higher revenue from power convert systems on multiple unit trains and locomotives. We have also upgraded its long-term growth, given better replacement demand during 2015-2020. Zhuzhou CSR is trading at a 2014E PE of 14.5x, which looks attractive based on its 30% profit growth.
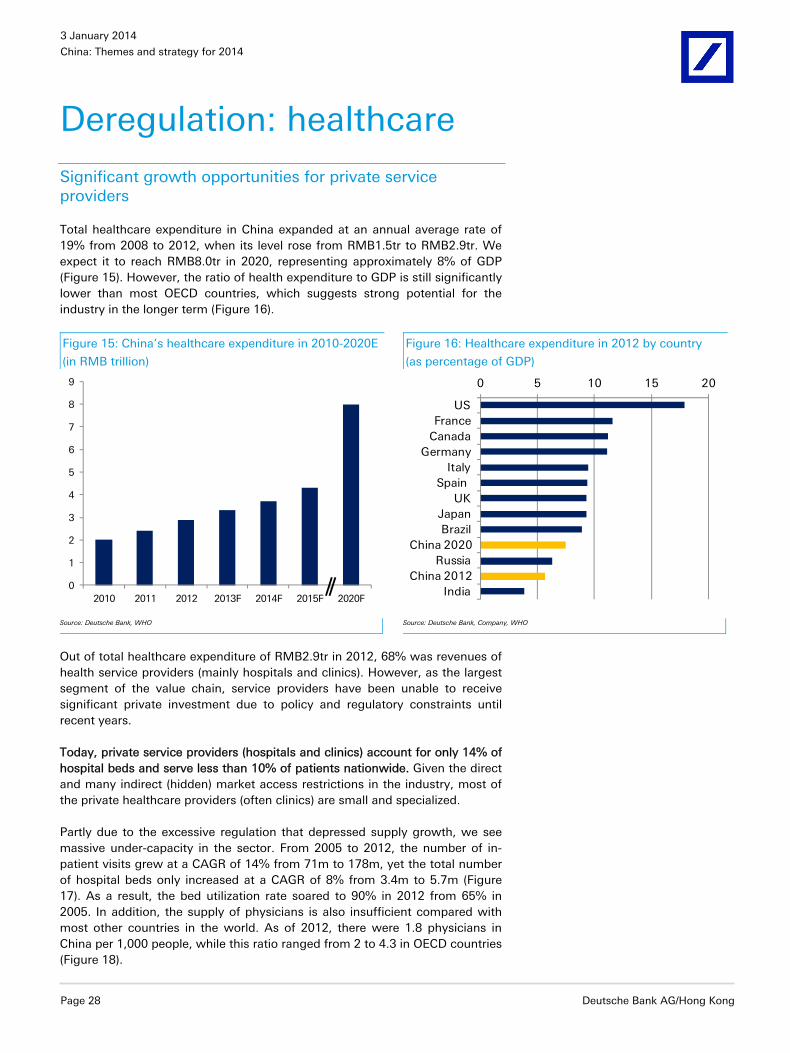
3 January 2014
China: Themes and strategy for 2014
Page 28 Deutsche Bank AG/Hong Kong
Deregulation: healthcare
Significant growth opportunities for private service providers
Total healthcare expenditure in China expanded at an annual average rate of 19% from 2008 to 2012, when its level rose from RMB1.5tr to RMB2.9tr. We expect it to reach RMB8.0tr in 2020, representing approximately 8% of GDP (Figure 15). However, the ratio of health expenditure to GDP is still significantly lower than most OECD countries, which suggests strong potential for the industry in the longer term (Figure 16).
Figure 15: China’s healthcare expenditure in 2010-2020E
(in RMB trillion)
Figure 16: Healthcare expenditure in 2012 by country
(as percentage of GDP)
0
1
2
3
4
5
6
7
8
9
2010 2011 2012 2013F 2014F 2015F 2020F
0 5 10 15 20
USFrance
CanadaGermany
ItalySpain
UKJapanBrazil
China 2020Russia
China 2012India
Source: Deutsche Bank, WHO Source: Deutsche Bank, Company, WHO
Out of total healthcare expenditure of RMB2.9tr in 2012, 68% was revenues of health service providers (mainly hospitals and clinics). However, as the largest segment of the value chain, service providers have been unable to receive significant private investment due to policy and regulatory constraints until recent years.
Today, private service providers (hospitals and clinics) account for only 14% of hospital beds and serve less than 10% of patients nationwide. Given the direct and many indirect (hidden) market access restrictions in the industry, most of the private healthcare providers (often clinics) are small and specialized.
Partly due to the excessive regulation that depressed supply growth, we see massive under-capacity in the sector. From 2005 to 2012, the number of in-patient visits grew at a CAGR of 14% from 71m to 178m, yet the total number of hospital beds only increased at a CAGR of 8% from 3.4m to 5.7m (Figure 17). As a result, the bed utilization rate soared to 90% in 2012 from 65% in 2005. In addition, the supply of physicians is also insufficient compared with most other countries in the world. As of 2012, there were 1.8 physicians in China per 1,000 people, while this ratio ranged from 2 to 4.3 in OECD countries (Figure 18).
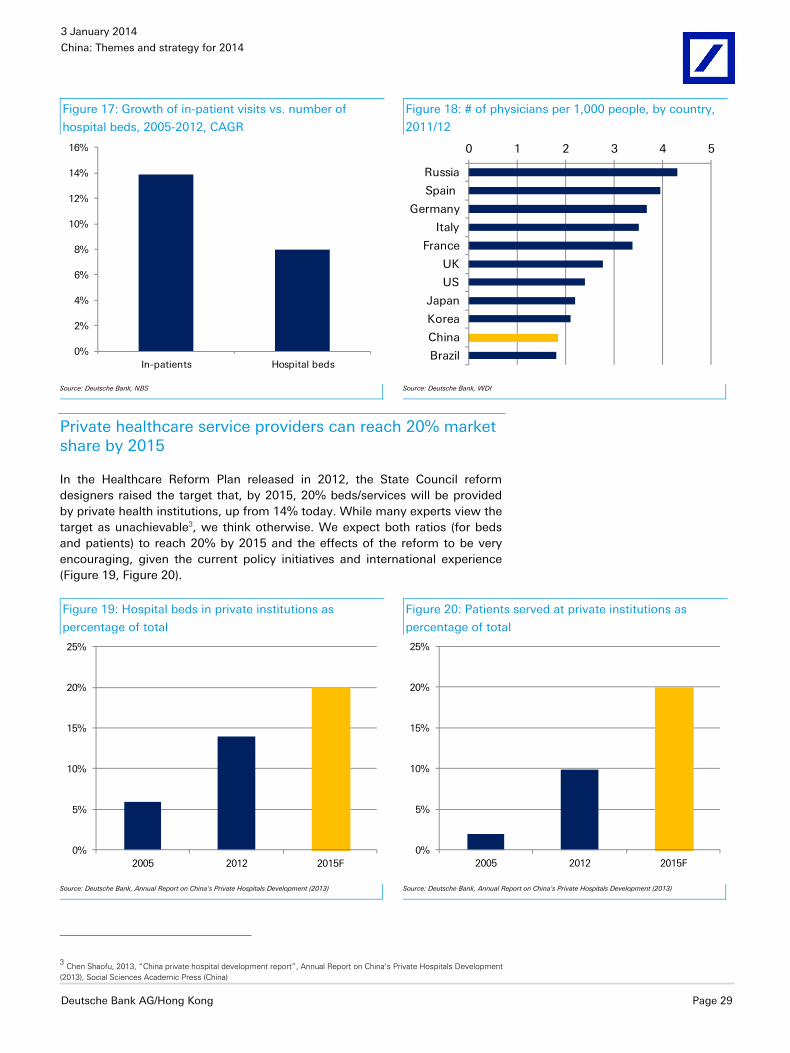
3 January 2014
China: Themes and strategy for 2014
Deutsche Bank AG/Hong Kong Page 29
Figure 17: Growth of in-patient visits vs. number of
hospital beds, 2005-2012, CAGR
Figure 18: # of physicians per 1,000 people, by country,
2011/12
0%
2%
4%
6%
8%
10%
12%
14%
16%
In-patients Hospital beds
0 1 2 3 4 5
Russia
Spain
Germany
Italy
France
UK
US
Japan
Korea
China
Brazil
Source: Deutsche Bank, NBS Source: Deutsche Bank, WDI
Private healthcare service providers can reach 20% market share by 2015
In the Healthcare Reform Plan released in 2012, the State Council reform designers raised the target that, by 2015, 20% beds/services will be provided by private health institutions, up from 14% today. While many experts view the target as unachievable3, we think otherwise. We expect both ratios (for beds and patients) to reach 20% by 2015 and the effects of the reform to be very encouraging, given the current policy initiatives and international experience (Figure 19, Figure 20).
Figure 19: Hospital beds in private institutions as
percentage of total
Figure 20: Patients served at private institutions as
percentage of total
0%
5%
10%
15%
20%
25%
2005 2012 2015F
0%
5%
10%
15%
20%
25%
2005 2012 2015F
Source: Deutsche Bank, Annual Report on China's Private Hospitals Development (2013) Source: Deutsche Bank, Annual Report on China's Private Hospitals Development (2013)
3 Chen Shaofu, 2013, “China private hospital development report”, Annual Report on China's Private Hospitals Development (2013), Social Sciences Academic Press (China)
3 January 2014
China: Themes and strategy for 2014
Page 30 Deutsche Bank AG/Hong Kong
Why is the target feasible? Policy initiatives post 3rd Plenum more aggressive than ever
In 2010, the State Council issued the Guidance to Accelerate Private Investment in Healthcare Service, signaling a new era of growth for private service providers. Subsequently, provincial level MOH followed up with detailed policies on implementation. Yet private healthcare institutions are still held back by many policy hurdles, and suffered from the lack of financing, and qualified talents, as well as a level playing field.
However, we expect more aggressive policies to be rolled out from now to 2015, as the Decision at the 3rd Plenum laid an unprecedented emphasis on encouraging private capital to the health sector. Some aggressive local policies currently in trial are very likely to be expanded to nationwide implementation. Major policy changes that are likely to take place include:
1. Granting market access for both domestic private capital as well as foreign players: China’s State Council issued “Several Opinions on Promoting the Development of the Healthcare Service Industry” on 14 October, which puts forward the concept of “equal footing” and a “negative list”. The Opinions explicitly state that private enterprises are encouraged to invest in the medical service industry through 1) establishment of new institutions, 2) acquisition of public hospitals, and 3) trusteeships and private operation of state-run institutions. Restrictions on hospital scale and business will be relaxed and the approval procedure will be simplified or even abolished.
Qinghai, for instance, has stipulated that the approval process for qualified applications cannot exceed 15 days and Jiangsu has announced prioritization of applications from private investors over government-owned entities. On opening up to foreign investors, provinces like Hubei have adjusted the classification of foreign-owned hospitals from “permitted” to “encouraged”. These measures are highly likely to be expanded to nationwide.
2. Emphasized by the Decision, doctors are now allowed to practice at multiple facilities: In past years, the most notable hurdle for private hospital development was the recruitment of qualified doctors. In the past, the government stipulated that each doctor could register and work in only one hospital. As a result, most doctors opted to stay in the public hospitals, for job security. From now on, the hiring of medical staff will become much easier for private healthcare players, as many doctors will likely chose to stay on the regular staff after working for a private hospital on a part time basis for a while.
3. Incorporating private healthcare institutions into insurance coverage: Until recently, reimbursement restrictions have kept many patients away from private hospitals, as in most regions, expenses at private hospitals were not eligible for reimbursement (or reimbursed at a lower rate) by public health insurance. Starting from 2014, we expect all the private hospitals to be incorporated into the health insurance networks based on the same standards as public hospitals.
4. Ameliorating the access to financing as well as government funding: As other private sectors, private healthcare providers often encountered difficulties in financing. Such obstacles should be alleviated by new policies.
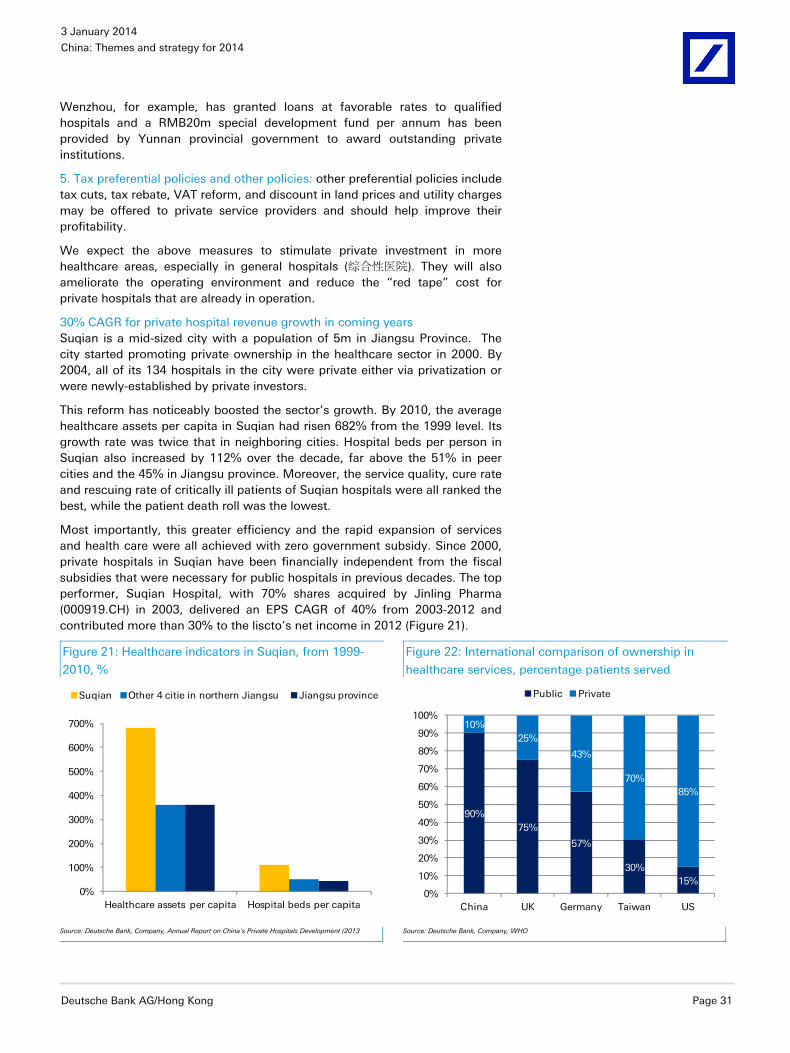
3 January 2014
China: Themes and strategy for 2014
Deutsche Bank AG/Hong Kong Page 31
Wenzhou, for example, has granted loans at favorable rates to qualified hospitals and a RMB20m special development fund per annum has been provided by Yunnan provincial government to award outstanding private institutions.
5. Tax preferential policies and other policies: other preferential policies include tax cuts, tax rebate, VAT reform, and discount in land prices and utility charges may be offered to private service providers and should help improve their profitability.
We expect the above measures to stimulate private investment in more healthcare areas, especially in general hospitals (综合性医院). They will also ameliorate the operating environment and reduce the “red tape” cost for private hospitals that are already in operation.
30% CAGR for private hospital revenue growth in coming years Suqian is a mid-sized city with a population of 5m in Jiangsu Province. The city started promoting private ownership in the healthcare sector in 2000. By 2004, all of its 134 hospitals in the city were private either via privatization or were newly-established by private investors.
This reform has noticeably boosted the sector’s growth. By 2010, the average healthcare assets per capita in Suqian had risen 682% from the 1999 level. Its growth rate was twice that in neighboring cities. Hospital beds per person in Suqian also increased by 112% over the decade, far above the 51% in peer cities and the 45% in Jiangsu province. Moreover, the service quality, cure rate and rescuing rate of critically ill patients of Suqian hospitals were all ranked the best, while the patient death roll was the lowest.
Most importantly, this greater efficiency and the rapid expansion of services and health care were all achieved with zero government subsidy. Since 2000, private hospitals in Suqian have been financially independent from the fiscal subsidies that were necessary for public hospitals in previous decades. The top performer, Suqian Hospital, with 70% shares acquired by Jinling Pharma (000919.CH) in 2003, delivered an EPS CAGR of 40% from 2003-2012 and contributed more than 30% to the liscto’s net income in 2012 (Figure 21).
Figure 21: Healthcare indicators in Suqian, from 1999-
2010, %
Figure 22: International comparison of ownership in
healthcare services, percentage patients served
0%
100%
200%
300%
400%
500%
600%
700%
Healthcare assets per capita Hospital beds per capita
Suqian Other 4 citie in northern Jiangsu Jiangsu province
90%75%
57%
30%15%
10%25%
43%
70%85%
0%
10%
20%
30%
40%
50%
60%
70%
80%
90%
100%
China UK Germany Taiwan US
Public Private
Source: Deutsche Bank, Company, Annual Report on China's Private Hospitals Development (2013 Source: Deutsche Bank, Company, WHO
3 January 2014
China: Themes and strategy for 2014
Page 32 Deutsche Bank AG/Hong Kong
As Suqian is a mid-sized city of average income level and fiscal situation, we believe its success is replicable in most of the 600 cities in China. An RMB8tr healthcare market by 2020 and the trend set by the 20% private sector share by 2015 imply that revenue growth of private health care institutions should rise at a 30% CAGR in the coming seven years.
International experience also suggests that private healthcare could grow further. In Germany, Taiwan and the US, privately-owned institutions serve 43%, 79% and 85% of their patients (Figure 22). Chang Gung Hospital (长庚医
院) in Taiwan, established in 1983, is another successful example of a privately-owned hospital, whose outperformance has led to the privatization of Taiwan’s healthcare sector.
Investment implication Healthcare service companies will no doubt be the biggest beneficiary of deregulation, as they will have vast opportunity to expand by investing in new hospitals or acquiring public hospitals. Large pharmaceutical groups with M&A plans in the field will also benefit. Moreover, drug and equipment producers will likely see upside in their sales due to faster healthcare expenditure growth as deregulation eases the supply-side constraint.
Among listcos, there are only a handful of pure healthcare service providers. These include Aier Eye Hospital (300015.CH) and Topchoice Medical Investment (600763.CH) on the A-share market, and Phoenix Healthcare Group (1515.HK) on the H-share market.
Other listed medical group/pharma companies with investments or intention to invest in hospitals include Fosun Pharma (2196.HK, 600196.CH), Hua Xia Healthcare (8143.HK), Sinopharm (1099.HK), Jinling Pharma (000919.CH), Mayinglong (600993.CH), Xi’an Kaiyuan (000516.CH), Kangmei Pharma (600518.CH) and Chengzhi Co.(000990.CH) (Figure 23). For example, Fosun announced that it plans to invest in 500 hospitals. If this target is achieved, heath services could potentially contribute 30%+ of the company’s net profit, up from 1.5% today.
Figure 23: Listcos with healthcare service business Name Ticker Business in healthcare services
Pure healthcare services providers
Phoenix Healthcare Group 1515.HK Largest private hospital group in China, general hospitals in Beijing
Aier Eye Hospital 300015.CH Ophthalmological diagnosis and treatments
Topchoice Medical Investment 600763.CH Dental and oral healthcare services
Medical groups with investments in healthcare services
Fosun Pharma 2196.HK, 600196.CH Plan to invest in 500+ hospitals nationwide
Hua Xia Healthcare 8143.HK General hospitals and hospital management services
Sinopharm 1099.HK 51% shareholding in Yujia Medical services
Jinling Pharma 000919.CH Pioneer in taking over public hospitals
Mayinglong 600993.CH Hospitals/clinics specialized treatment of hemorrhoids
Xi’an Kaiyuan 000516.CH Xi’an Gaoxin hospital, the first Grade 3, Class A private hospital in China
Kangmei Pharma 600518.CH Acquisition of 3 hospitals in Nov. 13
Chengzhi Co. 000990.CH Dandong No.1 hospital, Grade 3, Class A Source: Deutsche Bank, company data
3 January 2014
China: Themes and strategy for 2014
Deutsche Bank AG/Hong Kong Page 33
Companies under DB coverage Fosun Pharma (2196.HK, Hold): Fosun is a leading healthcare conglomerate whose business includes pharmaceutical and medical device manufacturing, distribution and retail, and healthcare services. Among Chinese listcos, Fosun Pharma is the one with most aggressive plan of investing in 500+ private hospitals. We believe its past experience in acquisitions and integration, as well as its comprehensive coverage of the healthcare value chain will guarantee a high success rate for its investments, which will in turn boost the sales of its medicines and equipment.
Phoenix Healthcare Group (1515.HK): with 3m patient visits in 2012 and 3,213 beds as of 30 June 2013, Phoenix Healthcare Group (PHG) is the largest private healthcare service provider in China at present. It currently operates through direct ownership or an IOT model (invest, operate, transfer). As of 31 December 2012, PHG manages its fully-owned hospital Jian Gong Hospital, and 11 hospitals and 28 community clinics under IOT agreements. We highlight PHG’s first-mover advantage, which should be instrumental in capturing future opportunities to participate in public hospital reform as PHG leverages its growing expertise.
3 January 2014
China: Themes and strategy for 2014
Page 34 Deutsche Bank AG/Hong Kong
Deregulation: telco, new energy, oil & gas In this chapter we discuss the likely roadmaps for deregulation in the telecom, new energy, and environmental sectors. In the telecom sector, we expect value-added services to be deregulated first, and basic services to be deregulated later. As for private players in the new energy field, their growth will likely be stimulated by new subsides, and anti-monopoly policy for grids as well as the resource pricing reform. In the oil & gas sector, deregulation will likely take place in unconventional gas exploitation, import and export rights of oil & gas, as well as spinning-off of the pipeline system.
The beneficiaries of these reforms include Internet companies with very large client bases and innovation ability (such as Tencent and Baidu), private new energy power generators and equipment manufacturers like Goldwind, as well as private oil service providers. On the flip side, major SOEs in telecom and oil & gas will likely see a gradual decline in market share.
Telco: value-added first, basic services next
Unlike the healthcare and renewable energy sectors, in which private capital has participated for years, the telecom sector has been long monopolized by SOEs in China. Nonetheless, this new round of reform, together with the technology development, will bring down the walls of monopoly at an accelerating pace and reshape the telecom sector rapidly. As a result, traditional operators may face a decline in market share while vast opportunities will be created for private investors. We expect the forthcoming deregulation measures to include:
Deregulation of new value-added telco business;
The integration of “three networks” (三网融合 ), namely telecom networks, computer networks (Internet) and broadcasting networks;
Restructuring and rebalancing of three major telecom operators;
Deregulation of basic telecom services.
Value-added services to be substantially deregulated The first of the above-mentioned measures (deregulation of value-added business) will be most meaningful to Internet companies. We believe that the forthcoming “Measures for the Administration of Pilot Projects Concerning New Telecommunications Business” by MIIT will lay an emphasis on the equality and non-discrimination principles, to encourage business innovation by non-telco companies and to grant value-added telecom business ("VATB") licenses to companies such as Tencent (0700.HK), Baidu (BIDU.OQ) and Alibaba.
In particular, smartphones with easy connection to the Internet have allowed the mushrooming of OTT (over the top) services, whereby users can bypass the traditional voice/message service of telecom operators by using third party platforms. The fact that this innovation is not restricted by the authorities is a major step towards deregulation.
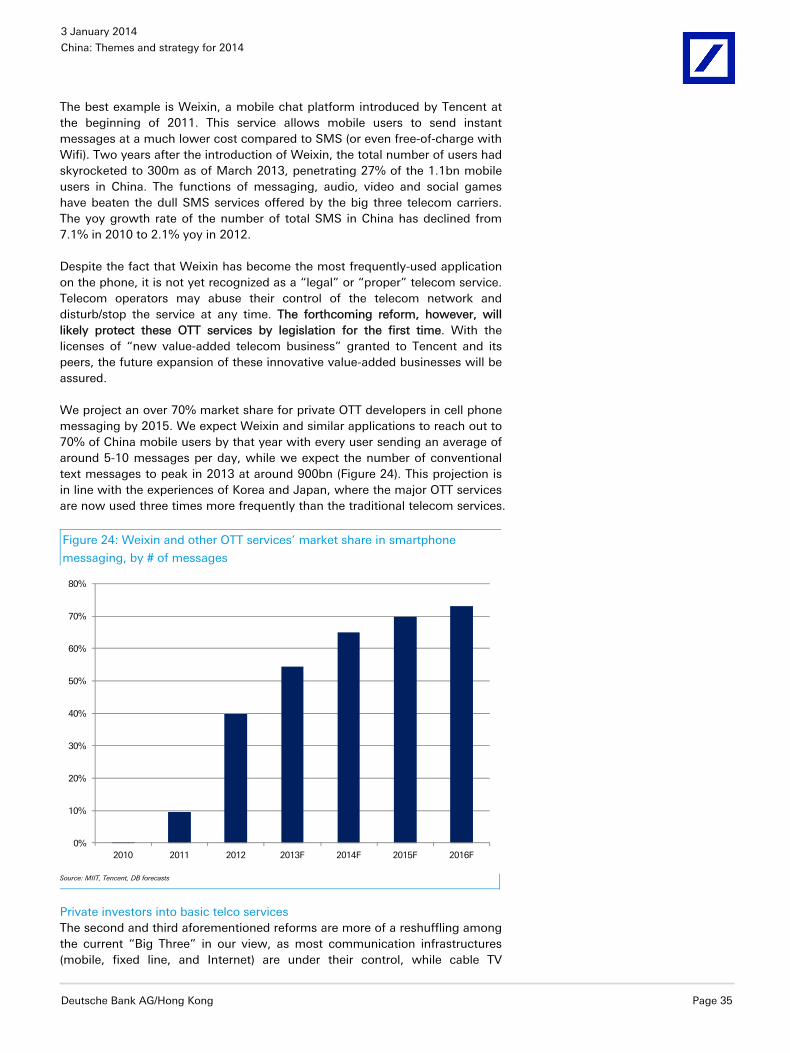
3 January 2014
China: Themes and strategy for 2014
Deutsche Bank AG/Hong Kong Page 35
The best example is Weixin, a mobile chat platform introduced by Tencent at the beginning of 2011. This service allows mobile users to send instant messages at a much lower cost compared to SMS (or even free-of-charge with Wifi). Two years after the introduction of Weixin, the total number of users had skyrocketed to 300m as of March 2013, penetrating 27% of the 1.1bn mobile users in China. The functions of messaging, audio, video and social games have beaten the dull SMS services offered by the big three telecom carriers. The yoy growth rate of the number of total SMS in China has declined from 7.1% in 2010 to 2.1% yoy in 2012.
Despite the fact that Weixin has become the most frequently-used application on the phone, it is not yet recognized as a “legal” or “proper” telecom service. Telecom operators may abuse their control of the telecom network and disturb/stop the service at any time. The forthcoming reform, however, will likely protect these OTT services by legislation for the first time. With the licenses of “new value-added telecom business” granted to Tencent and its peers, the future expansion of these innovative value-added businesses will be assured.
We project an over 70% market share for private OTT developers in cell phone messaging by 2015. We expect Weixin and similar applications to reach out to 70% of China mobile users by that year with every user sending an average of around 5-10 messages per day, while we expect the number of conventional text messages to peak in 2013 at around 900bn (Figure 24). This projection is in line with the experiences of Korea and Japan, where the major OTT services are now used three times more frequently than the traditional telecom services.
Figure 24: Weixin and other OTT services’ market share in smartphone
messaging, by # of messages
0%
10%
20%
30%
40%
50%
60%
70%
80%
2010 2011 2012 2013F 2014F 2015F 2016F
Source: MIIT, Tencent, DB forecasts
Private investors into basic telco services The second and third aforementioned reforms are more of a reshuffling among the current “Big Three” in our view, as most communication infrastructures (mobile, fixed line, and Internet) are under their control, while cable TV
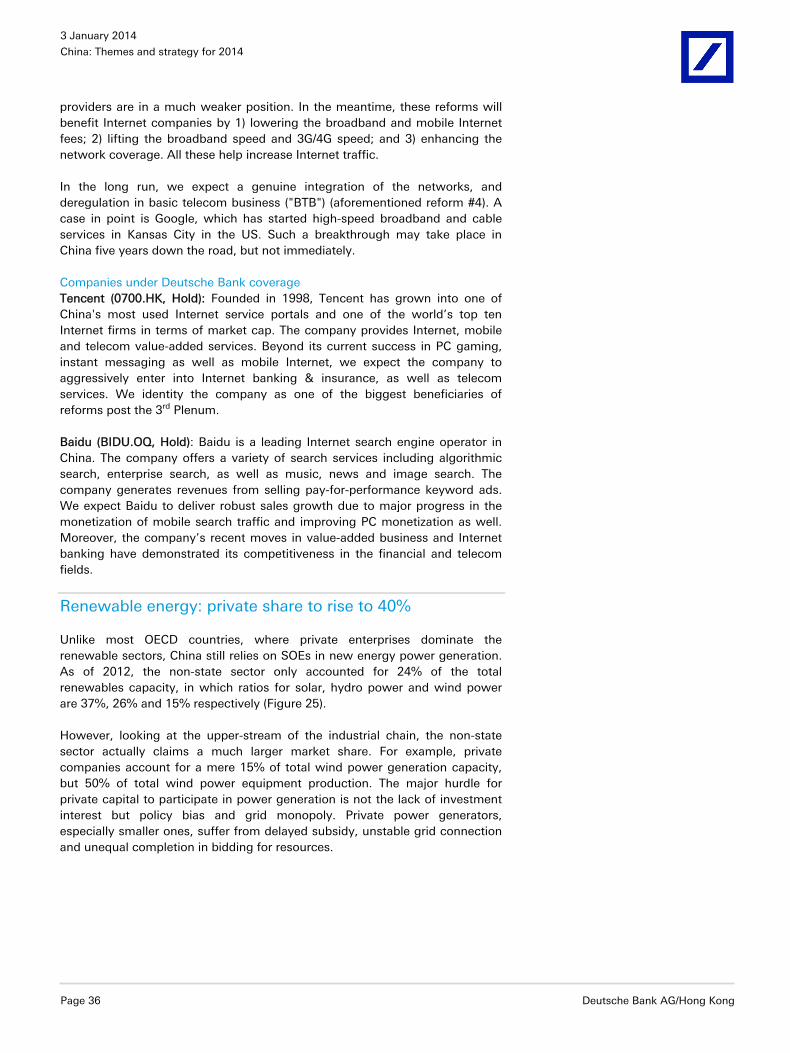
3 January 2014
China: Themes and strategy for 2014
Page 36 Deutsche Bank AG/Hong Kong
providers are in a much weaker position. In the meantime, these reforms will benefit Internet companies by 1) lowering the broadband and mobile Internet fees; 2) lifting the broadband speed and 3G/4G speed; and 3) enhancing the network coverage. All these help increase Internet traffic.
In the long run, we expect a genuine integration of the networks, and deregulation in basic telecom business ("BTB") (aforementioned reform #4). A case in point is Google, which has started high-speed broadband and cable services in Kansas City in the US. Such a breakthrough may take place in China five years down the road, but not immediately.
Companies under Deutsche Bank coverage Tencent (0700.HK, Hold): Founded in 1998, Tencent has grown into one of China's most used Internet service portals and one of the world’s top ten Internet firms in terms of market cap. The company provides Internet, mobile and telecom value-added services. Beyond its current success in PC gaming, instant messaging as well as mobile Internet, we expect the company to aggressively enter into Internet banking & insurance, as well as telecom services. We identity the company as one of the biggest beneficiaries of reforms post the 3rd Plenum.
Baidu (BIDU.OQ, Hold): Baidu is a leading Internet search engine operator in China. The company offers a variety of search services including algorithmic search, enterprise search, as well as music, news and image search. The company generates revenues from selling pay-for-performance keyword ads. We expect Baidu to deliver robust sales growth due to major progress in the monetization of mobile search traffic and improving PC monetization as well. Moreover, the company’s recent moves in value-added business and Internet banking have demonstrated its competitiveness in the financial and telecom fields.
Renewable energy: private share to rise to 40%
Unlike most OECD countries, where private enterprises dominate the renewable sectors, China still relies on SOEs in new energy power generation. As of 2012, the non-state sector only accounted for 24% of the total renewables capacity, in which ratios for solar, hydro power and wind power are 37%, 26% and 15% respectively (Figure 25).
However, looking at the upper-stream of the industrial chain, the non-state sector actually claims a much larger market share. For example, private companies account for a mere 15% of total wind power generation capacity, but 50% of total wind power equipment production. The major hurdle for private capital to participate in power generation is not the lack of investment interest but policy bias and grid monopoly. Private power generators, especially smaller ones, suffer from delayed subsidy, unstable grid connection and unequal completion in bidding for resources.
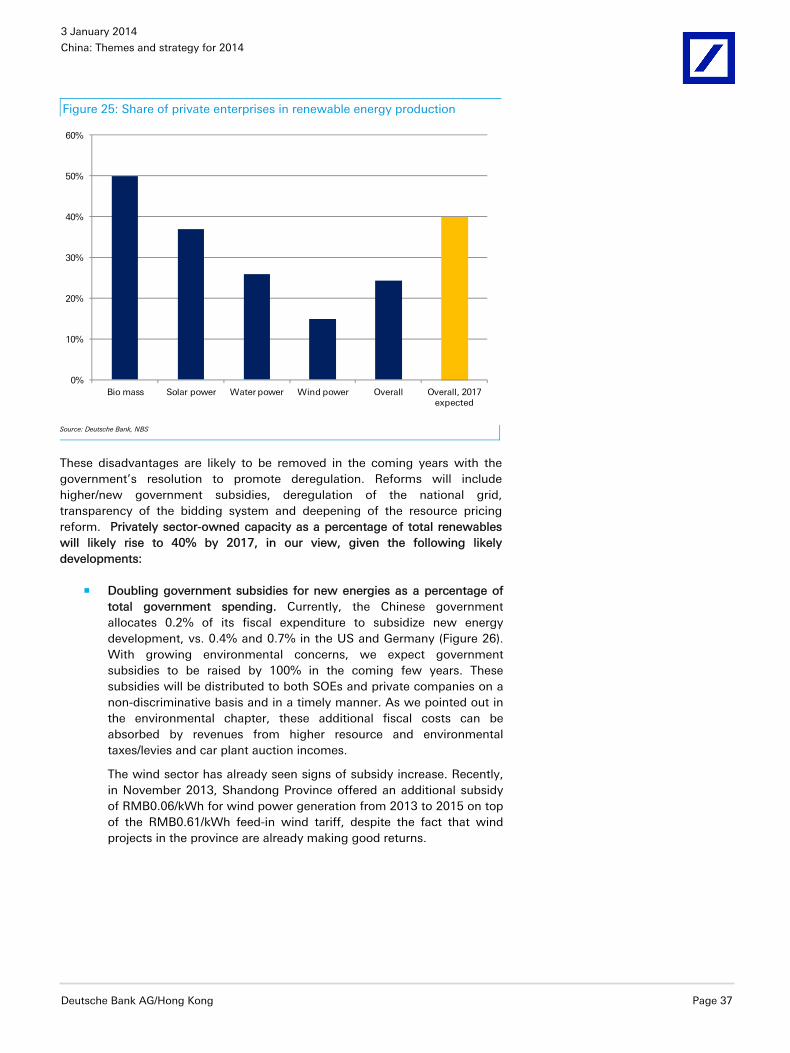
3 January 2014
China: Themes and strategy for 2014
Deutsche Bank AG/Hong Kong Page 37
Figure 25: Share of private enterprises in renewable energy production
0%
10%
20%
30%
40%
50%
60%
Bio mass Solar power Water power Wind power Overall Overall, 2017 expected
Source: Deutsche Bank, NBS
These disadvantages are likely to be removed in the coming years with the government’s resolution to promote deregulation. Reforms will include higher/new government subsidies, deregulation of the national grid, transparency of the bidding system and deepening of the resource pricing reform. Privately sector-owned capacity as a percentage of total renewables will likely rise to 40% by 2017, in our view, given the following likely developments:
Doubling government subsidies for new energies as a percentage of total government spending. Currently, the Chinese government allocates 0.2% of its fiscal expenditure to subsidize new energy development, vs. 0.4% and 0.7% in the US and Germany (Figure 26). With growing environmental concerns, we expect government subsidies to be raised by 100% in the coming few years. These subsidies will be distributed to both SOEs and private companies on a non-discriminative basis and in a timely manner. As we pointed out in the environmental chapter, these additional fiscal costs can be absorbed by revenues from higher resource and environmental taxes/levies and car plant auction incomes.
The wind sector has already seen signs of subsidy increase. Recently, in November 2013, Shandong Province offered an additional subsidy of RMB0.06/kWh for wind power generation from 2013 to 2015 on top of the RMB0.61/kWh feed-in wind tariff, despite the fact that wind projects in the province are already making good returns.
3 January 2014
China: Themes and strategy for 2014
Page 38 Deutsche Bank AG/Hong Kong
Figure 26: Government subsidies on new energies as a percentage of
government spending, 2011/12
0.0%
0.1%
0.2%
0.3%
0.4%
0.5%
0.6%
0.7%
0.8%
China, 2012 China, 2015F US, 2012 Germany, 2012
Source: WIND, 21CBN, MoComm, China-Nengyuan.com
“Potential breaking up” of the nation's power transmission monopolies. Presently, two SOEs – State Grid and China Southern Power Grid Corp – control power distribution for the whole of China. Meanwhile, power generators, especially private ones, have no choice but to sell their electricity to either grid at government-controlled prices – a system that denies bargaining power at every link in the business chain. Lots of wind farms and solar plants couldn’t even have access to the grid. We expect the anti-monopoly reform and a likely breakup of the State Grid to raise the bargaining power of new energy power generators and protect their utilization hours via a more stable grid access.
Deepening of resource pricing reform: the government aims to complete the resource pricing reform in the coming few years. More provinces will allow power plants to sell electricity to power users directly (大用户直购电). As a result, on-grid power tariffs will become competitive and hydropower will benefit the most as its current on-grid price is on average 30% lower than that of IPPs.
Development of the carbon trading market. In the next few months, we expect China to implement carbon trading schemes in a few more cities and to start allowing renewable projects such as wind and solar to sell their carbon credits in the domestic market. These positive developments could provide some earnings upside to wind developers.
Companies under Deutsche Bank coverage Goldwind (2208.HK, Buy): Goldwind is the No.1 wind turbine manufacturer in China. We believe that wind power companies will likely enjoy more stable/higher subsidies and better grid access due to the reform, which will in turn boost the revenue growth of equipment. We believe tier-one wind equipment players will likely benefit the most in this new round of demand
3 January 2014
China: Themes and strategy for 2014
Deutsche Bank AG/Hong Kong Page 39
boom. Our sector analyst, Michael Tong, foresees a sharp rise in wind capacity installation, from 14GW in 2012 to 18GW in 2013 and further in the coming years. This will lead to resumed order growth and a rebound in turbine prices.
Oil and gas: impact in the longer term
There’s no doubt that the deregulation and opening up will hurt the major SOEs in oil & gas sector. However, the decline in their market share will likely be very gradual, and some reforms may in fact improve their efficiencies. For example, the resource pricing reform will help improve margin of the oil refining business and the reform of SOE incentive mechanisms may improve corporate performance.
Our expected deregulation measures in the oil and gas sector include the following:
To encourage the private sector to participate in exploration, especially of unconventional gas such as Shale4. The government has promised to introduce subsidies and favorable tax policies for both state and non-state enterprises in the sector. While unconventional gas exploitation means huge uncertainty for investors, most upside will go to oil services companies, as they will enjoy stronger revenue growth regardless of drilling results. H-share listed local names include Jereh (002353.CH), Honghua (0196.HK) and Andong (3337.HK). It also means potential benefits for global large oil and gas players like Exxon Mobil (XOM.NY), Chevron (CVX.NY), as well as technology providers like GE (GE.NY), as most of them, with rich experience and advanced technology, are already somewhat involved in shale gas exploitation through JVs in China.
To allow private firms to import and export oil and gas, in order to break the monopoly by oil & gas majors. This reform may kick off early next year. Potential beneficiaries include downstream independent petroleum distributors and companies with overseas oil field assets. Listed companies like Shandong Tianshan Petro (000554.CH), Shandong Haihua (000822.CH) and Guangju Energy (000096.CH) with gas station business may enjoy more cost flexibility, should they be able to import directly from overseas.
Spin-off of pipelines and deregulation of storage business. The spin-off of oil and gas pipelines would undermine the oil majors’ monopoly position and would negatively impact their earnings assuming that take-or-pay gas contracts will not go with the pipelines. It could speed up natural gas development in China and benefit downstream gas distributors like Beijing Enterprises (0392.HK) and China Gas Holding (0384.HK).
4 CBM and coal-to-gas have been opened to private investors as their exploitation rights were part of the coal mining rights.
3 January 2014
China: Themes and strategy for 2014
Page 40 Deutsche Bank AG/Hong Kong
Impact of reforms on banks Major reforms and liberalization in China’s financial sector will include the opening up of the banking sector to private investment, issuance of local government bonds and development of securitization products, interest rate liberalization, and capital account liberalization. We believe that the overall impact of these on large banks will be positive, as newly established private banks will focus their business on SMEs that are not yet key clients of large banks, while the issuance of local government bonds will help alleviate pressure on the quality of banks’ LGFV loans. Securitization will generate new revenues for large banks, and will improve transparency of and thus reduce risks associated with wealth management products (WMPs). In addition, the impact of interest rate liberalization on banks’ NIM will likely be more limited than expected, due to the stable macro environment, the way the demand deposit rate is to be determined, and the rise in the proportion of SME loans in banks’ overall loan portfolios.
Private banks pose little competition to large banks
The government decided to reduce entry barriers for private investment in the banking sector, by encouraging the growth of privately-owned banks (hereafter private banks), including those operating on a nationwide basis and those community-based institutions such as village and township banks.
With already a few dozen applications pending, we expect the new round of private bank launches to take place in early 2014. By October 2013, there are more than 1,000 private banks (with another 500+ branches), mostly village and township banks. Over the medium term (e.g., next five years) we believe that the number of private banks will probably rise to 5,000.
Many investors fear that this rapid rise in the number of private banks will pose a major competition to large SOE banks, and large banks will see a sharp decline in market shares.
We believe this concern is overdone. The key reason is that private banks will most likely focus on delivering services to local SMEs, most of which are not yet serviced by the existing banking system. In other words, most private banks will serve a new market rather than competing with large banks for the same market.
In July 2013, the State Council issued policy guidance on “financial support for economic restructuring and upgrading”, wherein the government explicitly mentioned its desire to promote private investment in the financial industry. The CBRC has been approving village and township banks since 2009, and there are now more than 1,000 of them. The minimum capital requirement for township-village banks is RMB50m. The next reform plan under preparation will likely allow non-financial companies to lead the founding of a commercial bank. Currently, a major hurdle for private investment in the banking sector is the requirement that the leading sponsor of a town and village bank must hold a minimum of 15% shares. While no final decisions are published, policy
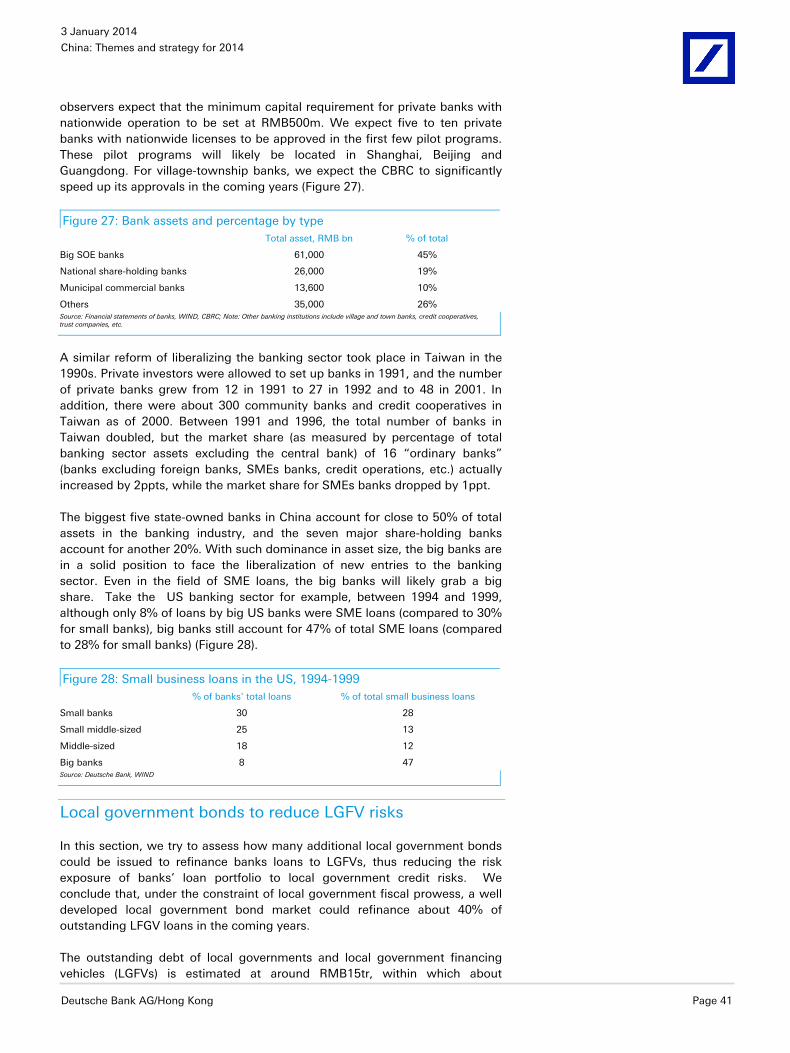
3 January 2014
China: Themes and strategy for 2014
Deutsche Bank AG/Hong Kong Page 41
observers expect that the minimum capital requirement for private banks with nationwide operation to be set at RMB500m. We expect five to ten private banks with nationwide licenses to be approved in the first few pilot programs. These pilot programs will likely be located in Shanghai, Beijing and Guangdong. For village-township banks, we expect the CBRC to significantly speed up its approvals in the coming years (Figure 27).
Figure 27: Bank assets and percentage by type Total asset, RMB bn % of total
Big SOE banks 61,000 45%
National share-holding banks 26,000 19%
Municipal commercial banks 13,600 10%
Others 35,000 26% Source: Financial statements of banks, WIND, CBRC; Note: Other banking institutions include village and town banks, credit cooperatives, trust companies, etc.
A similar reform of liberalizing the banking sector took place in Taiwan in the 1990s. Private investors were allowed to set up banks in 1991, and the number of private banks grew from 12 in 1991 to 27 in 1992 and to 48 in 2001. In addition, there were about 300 community banks and credit cooperatives in Taiwan as of 2000. Between 1991 and 1996, the total number of banks in Taiwan doubled, but the market share (as measured by percentage of total banking sector assets excluding the central bank) of 16 “ordinary banks” (banks excluding foreign banks, SMEs banks, credit operations, etc.) actually increased by 2ppts, while the market share for SMEs banks dropped by 1ppt.
The biggest five state-owned banks in China account for close to 50% of total assets in the banking industry, and the seven major share-holding banks account for another 20%. With such dominance in asset size, the big banks are in a solid position to face the liberalization of new entries to the banking sector. Even in the field of SME loans, the big banks will likely grab a big share. Take the US banking sector for example, between 1994 and 1999, although only 8% of loans by big US banks were SME loans (compared to 30% for small banks), big banks still account for 47% of total SME loans (compared to 28% for small banks) (Figure 28).
Figure 28: Small business loans in the US, 1994-1999 % of banks' total loans % of total small business loans
Small banks 30 28
Small middle-sized 25 13
Middle-sized 18 12
Big banks 8 47 Source: Deutsche Bank, WIND
Local government bonds to reduce LGFV risks
In this section, we try to assess how many additional local government bonds could be issued to refinance banks loans to LGFVs, thus reducing the risk exposure of banks’ loan portfolio to local government credit risks. We conclude that, under the constraint of local government fiscal prowess, a well developed local government bond market could refinance about 40% of outstanding LFGV loans in the coming years.
The outstanding debt of local governments and local government financing vehicles (LGFVs) is estimated at around RMB15tr, within which about
3 January 2014
China: Themes and strategy for 2014
Page 42 Deutsche Bank AG/Hong Kong
RMB9.7tr are bank loans as of mid-2013, according to CBRC. These LGFVs loans are a major concern among investors in relation to the underlying quality of banks’ loan portfolio. Currently, the total amount of outstanding RMB loans of Chinese banks is about RMB71tr, with an NPL ratio of 0.97% as of September 2013. In the unlikely event (or worst case) that the default rate of LGFV loans rises to 20%, the overall NPL ratio in China’s banking sector would rise to 3.6%.
But such worries are based on an unrealistic assumption, which is that local governments would not honor their guarantees. In reality, in the past three years, local governments have repaid most maturing LGFV loans in which projects did not have sufficient cash flows, via injecting assets and refinancing these loans using fiscal resources (e.g., local government bond proceeds, privatization proceeds, land sale proceeds, and tax revenues) from the sponsoring government or higher level governments. One of the fiscal resolutions has been the issuance of local government bonds, which was trailed in Shanghai, Zhejiang, Guangdong and Shenzhen starting from 2011. So far, the total issuance of local government bonds (general obligation bonds) reached around RMB812bn. In addition, the NDRC has authorized the issuance of city construction bonds (城投债 ) issued by selected LGFVs that have sufficient repayment capacities (equivalent to revenue bonds in the US), and the total outstanding amount of these urban construction bonds reached about RMB2200bn as of mid-2013. We believe that the local government bond market will be more rapidly developed and gradually become the main financing channel to replace LGFV borrowing from banks.
The reform toward developing a full-fledged local government bond market will be gradual, as it would involve revisions of the budget law and establishing the local government credit rating system. But we can do a rough estimation of the potential size of the local government bond market in China, with US data as reference. In the US, the total size of the municipal bond market is about 24% of GDP, or 105% of local government annual revenue (1990-2010 average). Taking these two ratios as a guide, we derive two estimates for the potential size of the local government bond market in China: first, using the 24% debt/GDP ratio, the outstanding amount of China’s local government bonds reach RMB5,400bn; second, using the 105% debt/revenue ratio, the outstanding amount of China’s local government bonds can reach RMB11tr. A simple average of the two estimates is RMB8,200bn. In addition, if we assume that half of the current RMB2,200bn of urban construction bonds5 are part of local government bonds, and considering that there are already RMB700bn of local government bonds issued by the central government on behalf of localities, there is extra room for additional issuance of RMB6,400bn in local government bonds.
The issuance of local government bonds will help alleviate much of the concerns on the quality of bank loans to LGFVs. With the issuance of local government bonds, credit risks will be resumed by bond investors rather than the banking system. In a simple calculation as discussed above, suppose additional RMB6,400bn of local government bonds will be issued to refinance part of the current RMB9,700bn bank loans to LGFVs, it would mean the amount of LGFV loans will go down by 6400/9700 = 66% (Figure 29).
5 We make this assumption because some of the city construction bonds are used to finance real estate development and are very different from the conventional “infrastructure” concept. We treat these as pure commercial activities rather than “government” capex.
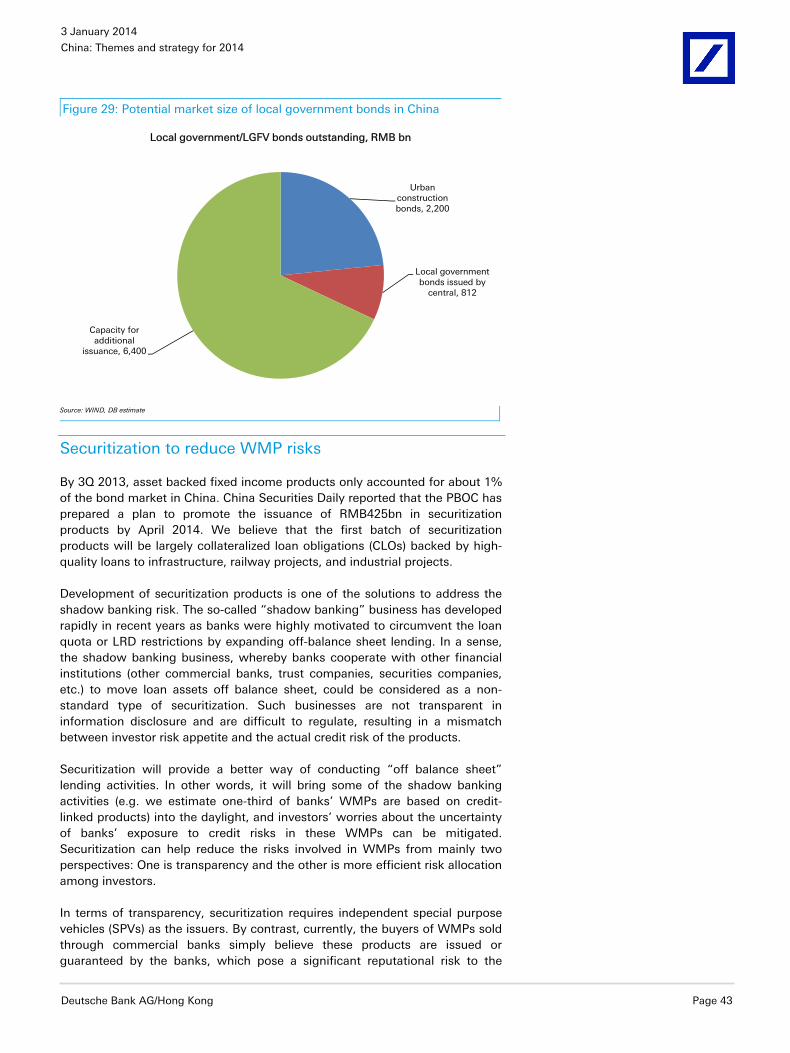
3 January 2014
China: Themes and strategy for 2014
Deutsche Bank AG/Hong Kong Page 43
Figure 29: Potential market size of local government bonds in China
Urban construction bonds, 2,200
Local government bonds issued by
central, 812
Capacity for additional
issuance, 6,400
Local government/LGFV bonds outstanding, RMB bn
Source: WIND, DB estimate
Securitization to reduce WMP risks
By 3Q 2013, asset backed fixed income products only accounted for about 1% of the bond market in China. China Securities Daily reported that the PBOC has prepared a plan to promote the issuance of RMB425bn in securitization products by April 2014. We believe that the first batch of securitization products will be largely collateralized loan obligations (CLOs) backed by high-quality loans to infrastructure, railway projects, and industrial projects.
Development of securitization products is one of the solutions to address the shadow banking risk. The so-called “shadow banking” business has developed rapidly in recent years as banks were highly motivated to circumvent the loan quota or LRD restrictions by expanding off-balance sheet lending. In a sense, the shadow banking business, whereby banks cooperate with other financial institutions (other commercial banks, trust companies, securities companies, etc.) to move loan assets off balance sheet, could be considered as a non-standard type of securitization. Such businesses are not transparent in information disclosure and are difficult to regulate, resulting in a mismatch between investor risk appetite and the actual credit risk of the products.
Securitization will provide a better way of conducting “off balance sheet” lending activities. In other words, it will bring some of the shadow banking activities (e.g. we estimate one-third of banks’ WMPs are based on credit-linked products) into the daylight, and investors’ worries about the uncertainty of banks’ exposure to credit risks in these WMPs can be mitigated. Securitization can help reduce the risks involved in WMPs from mainly two perspectives: One is transparency and the other is more efficient risk allocation among investors.
In terms of transparency, securitization requires independent special purpose vehicles (SPVs) as the issuers. By contrast, currently, the buyers of WMPs sold through commercial banks simply believe these products are issued or guaranteed by the banks, which pose a significant reputational risk to the
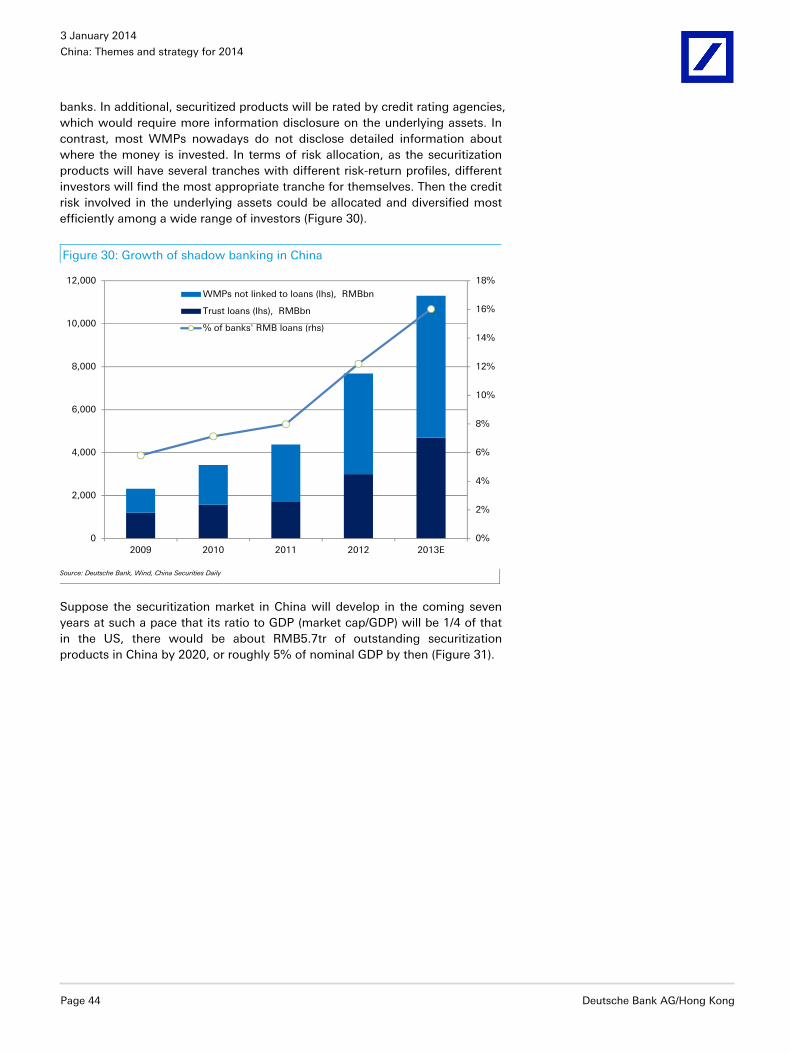
3 January 2014
China: Themes and strategy for 2014
Page 44 Deutsche Bank AG/Hong Kong
banks. In additional, securitized products will be rated by credit rating agencies, which would require more information disclosure on the underlying assets. In contrast, most WMPs nowadays do not disclose detailed information about where the money is invested. In terms of risk allocation, as the securitization products will have several tranches with different risk-return profiles, different investors will find the most appropriate tranche for themselves. Then the credit risk involved in the underlying assets could be allocated and diversified most efficiently among a wide range of investors (Figure 30).
Suppose the securitization market in China will develop in the coming seven years at such a pace that its ratio to GDP (market cap/GDP) will be 1/4 of that in the US, there would be about RMB5.7tr of outstanding securitization products in China by 2020, or roughly 5% of nominal GDP by then (Figure 31).
Figure 30: Growth of shadow banking in China
0%
2%
4%
6%
8%
10%
12%
14%
16%
18%
0
2,000
4,000
6,000
8,000
10,000
12,000
2009 2010 2011 2012 2013E
WMPs not linked to loans (lhs), RMBbn
Trust loans (lhs), RMBbn
% of banks' RMB loans (rhs)
Source: Deutsche Bank, Wind, China Securities Daily
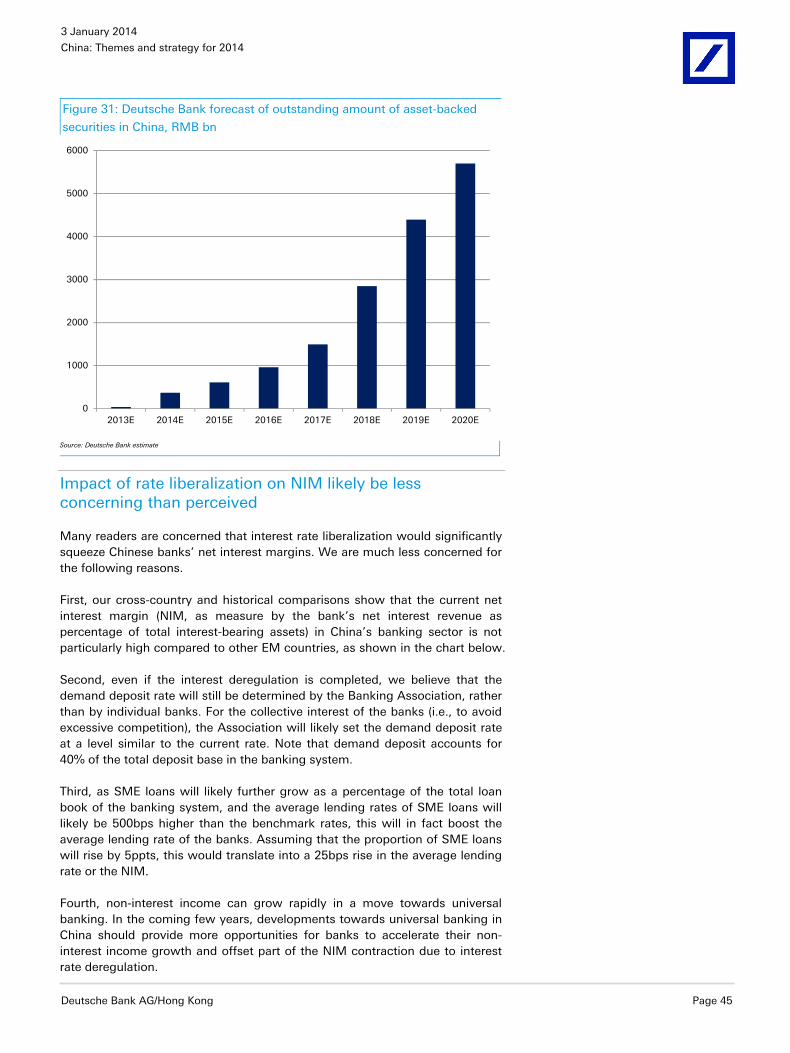
3 January 2014
China: Themes and strategy for 2014
Deutsche Bank AG/Hong Kong Page 45
Figure 31: Deutsche Bank forecast of outstanding amount of asset-backed
securities in China, RMB bn
0
1000
2000
3000
4000
5000
6000
2013E 2014E 2015E 2016E 2017E 2018E 2019E 2020E
Source: Deutsche Bank estimate
Impact of rate liberalization on NIM likely be less concerning than perceived
Many readers are concerned that interest rate liberalization would significantly squeeze Chinese banks’ net interest margins. We are much less concerned for the following reasons.
First, our cross-country and historical comparisons show that the current net interest margin (NIM, as measure by the bank’s net interest revenue as percentage of total interest-bearing assets) in China’s banking sector is not particularly high compared to other EM countries, as shown in the chart below.
Second, even if the interest deregulation is completed, we believe that the demand deposit rate will still be determined by the Banking Association, rather than by individual banks. For the collective interest of the banks (i.e., to avoid excessive competition), the Association will likely set the demand deposit rate at a level similar to the current rate. Note that demand deposit accounts for 40% of the total deposit base in the banking system.
Third, as SME loans will likely further grow as a percentage of the total loan book of the banking system, and the average lending rates of SME loans will likely be 500bps higher than the benchmark rates, this will in fact boost the average lending rate of the banks. Assuming that the proportion of SME loans will rise by 5ppts, this would translate into a 25bps rise in the average lending rate or the NIM.
Fourth, non-interest income can grow rapidly in a move towards universal banking. In the coming few years, developments towards universal banking in China should provide more opportunities for banks to accelerate their non-interest income growth and offset part of the NIM contraction due to interest rate deregulation.
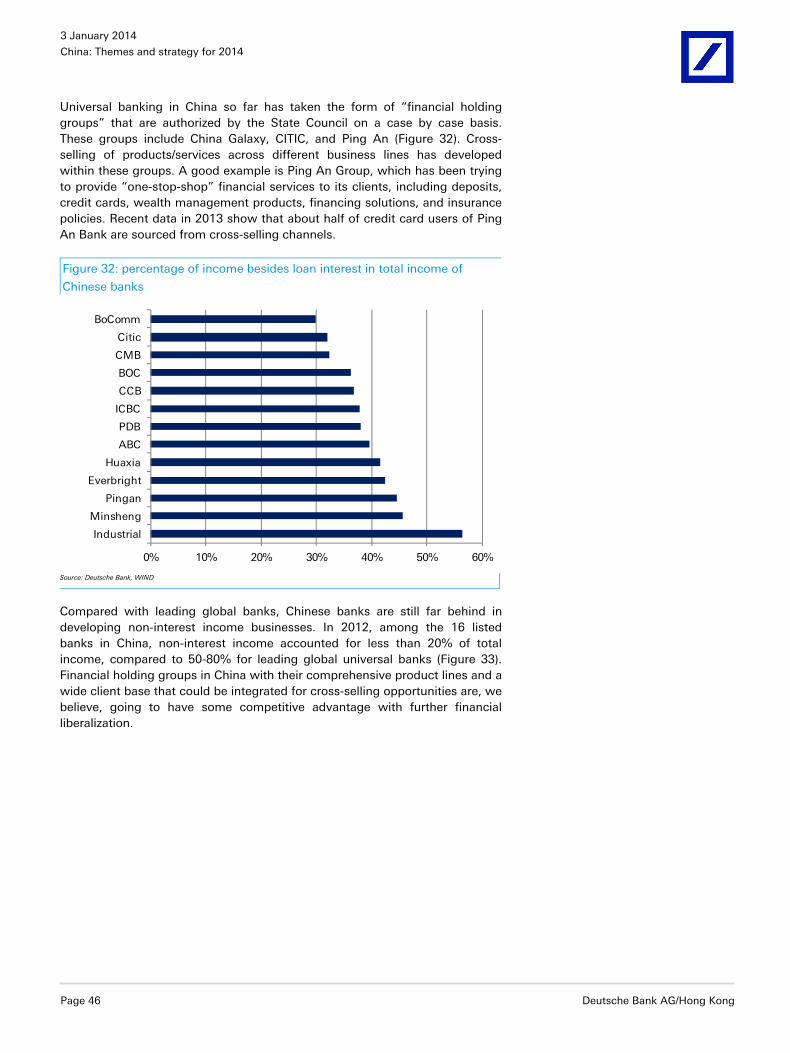
3 January 2014
China: Themes and strategy for 2014
Page 46 Deutsche Bank AG/Hong Kong
Universal banking in China so far has taken the form of “financial holding groups” that are authorized by the State Council on a case by case basis. These groups include China Galaxy, CITIC, and Ping An (Figure 32). Cross-selling of products/services across different business lines has developed within these groups. A good example is Ping An Group, which has been trying to provide “one-stop-shop” financial services to its clients, including deposits, credit cards, wealth management products, financing solutions, and insurance policies. Recent data in 2013 show that about half of credit card users of Ping An Bank are sourced from cross-selling channels.
Figure 32: percentage of income besides loan interest in total income of
Chinese banks
0% 10% 20% 30% 40% 50% 60%
Industrial
Minsheng
Pingan
Everbright
Huaxia
ABC
PDB
ICBC
CCB
BOC
CMB
Citic
BoComm
Source: Deutsche Bank, WIND
Compared with leading global banks, Chinese banks are still far behind in developing non-interest income businesses. In 2012, among the 16 listed banks in China, non-interest income accounted for less than 20% of total income, compared to 50-80% for leading global universal banks (Figure 33). Financial holding groups in China with their comprehensive product lines and a wide client base that could be integrated for cross-selling opportunities are, we believe, going to have some competitive advantage with further financial liberalization.
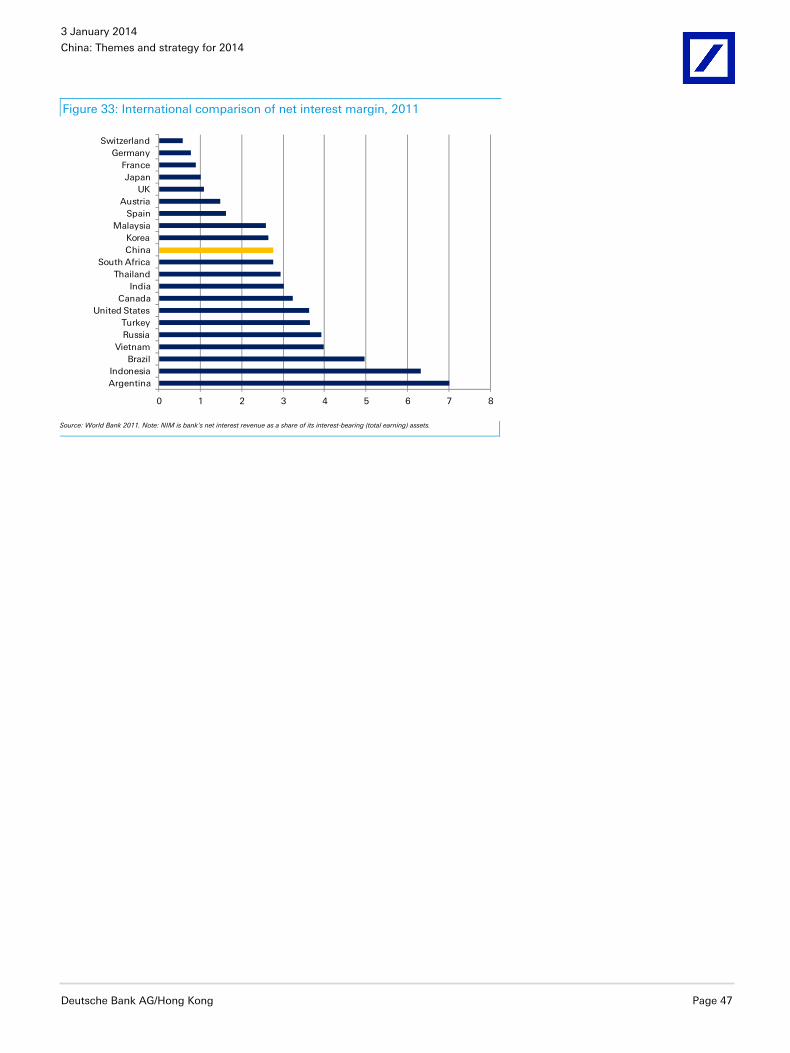
3 January 2014
China: Themes and strategy for 2014
Deutsche Bank AG/Hong Kong Page 47
Figure 33: International comparison of net interest margin, 2011
0 1 2 3 4 5 6 7 8
ArgentinaIndonesia
BrazilVietnam
RussiaTurkey
United StatesCanada
IndiaThailand
South AfricaChinaKorea
MalaysiaSpain
AustriaUK
JapanFrance
GermanySwitzerland
Source: World Bank 2011. Note: NIM is bank's net interest revenue as a share of its interest-bearing (total earning) assets.
3 January 2014
China: Themes and strategy for 2014
Page 48 Deutsche Bank AG/Hong Kong
Social security reform The 3rd Plenum decided on a series of reforms related to health care and the pension system. Those that may directly affect listed companies include: 1) deregulation – opening the medical service sector to private and foreign investors; 2) developing annuities as part of the pension scheme by introducing a tax deferral policy; 3) developing critical illness insurance and catastrophe insurance, and 4) introducing a house-for-pension scheme.
We believe that these reforms will lead to the following changes in the healthcare sector: 1) private hospitals to grow at a CAGR of 30% in the coming seven years. The ease of supply side constraints – increased availability of hospitals – will enable faster growth of heath care spending; 2) the development of annuities, critical illness insurance, catastrophe insurance, and the home-for-pension scheme will boost the annual average premium growth of the insurance sector by 1.5-2ppts for many years to come, compared with the base case (no reform scenario); 3) the market expansion of pharmaceuticals and medical equipment to accelerate 2-3ppts in the coming years compared with the base case.
At the company level, Ping An (2318.HK), CTIH (0966.HK), China Life (2628.HK), PICC Group (1339.HK), CPIC (2601.HK), Fosun Pharma (2196.HK), Phoenix Healthcare (1515.HK), Sihuan (0460.HK), Sino Biopharmaceutical (1177.HK) and Mindray Medical (MR.N) are good examples of beneficiaries.
The reform measures
The 3rd Plenum has approved a mega reform package, which includes measures that will profoundly reshape the landscape of the social security and the health care system. In the following paragraphs, we discuss four major reforms that we believe are most relevant to investors.
1. Deregulation of the health service sector According to the “Decision” at the 3rd Plenum, the private sector will be permitted to enter most industries other than those related to national security. Of these, medical services is explicitly mentioned as an area for deregulation. We expect more aggressive policies to be rolled out from now to 2015. The likely policy changes include:
1) Granting market access for both domestic private and foreign investors: Private capital will be encouraged to enter the health service sector through 1) establishment of new institutions, 2) acquisition of public hospitals, and 3) trusteeships and private operation of state-owned institutions. Restrictions on hospital size and business scope will be relaxed and the approval procedure will be simplified or even abolished, in accordance with the principles of “equal footing” and “negative list”.
2) Permitting doctors to practice at multiple facilities: During previous years, the most notable hurdle for private hospital development was the difficulty in recruiting qualified doctors, as the government stipulated that each doctor could register and work in only one hospital. From now on, as stated in the “Decision” at the 3rd Plenum, the hiring of medical staff will become much easier for private healthcare providers, as doctors can
3 January 2014
China: Themes and strategy for 2014
Deutsche Bank AG/Hong Kong Page 49
choose to stay on as regular staff members of public hospitals while working for private hospitals on a part time basis.
3) Incorporating private healthcare institutions into insurance coverage: until recently, reimbursement restrictions have kept many patients away from private hospitals, as in most regions expenses at private hospitals were not eligible for reimbursement (or can only be reimbursed at a lower rate) by the public health insurance scheme. As the “Decision” of the 3rd Plenum has specifically pointed out that private hospitals should be incorporated into the health insurance networks, we expect more private hospitals to be covered by insurance. In addition, the non-discrimination principle for “professional title assessment (职称评定)” outlined in the 2010 NDRC notice6 will likely be better implemented, in our view. That is, the granting of doctors’ professional titles in private hospitals will be conducted based on the same standards as in public hospitals.
4) Providing private institutions with access to financing: loans at favorable rates will likely be granted to qualified private hospitals and special development funds will likely be provided to support private hospitals. Our conviction on such reforms is from the pilot programs in Zhejiang, Anhui, and Yunnan. In Wenzhou, Zhejiang Province, for example, an annual development fund of RMB20m was set up to support the development of private hospitals.
5) Tax preferential policies and other policies: other preferential policies including tax cuts, tax rebate, VAT reform, and discount in land prices and utility charges may be offered to private service providers and should help improve their profitability.
We expect the above measures to stimulate private investment in healthcare services, especially in general hospitals. They will also ameliorate the operating environment and reduce the “red tape” cost for private hospitals that are already in operation.
2. Tax deferral policy for the annuity program Immediately after the 3rd Plenum, the government announced a tax deferral policy package on 6 December, to encourage the annuity program, as part of the pension reform. The policy changes that would become effective from 1 January 2014 include:
1) The portion of the annuity contribution made by employees will be deductible from their taxable income if the contribution is no more than 4% of monthly salary;
2) The entire amount contributed by employers to employees’ annuity accounts is exempt from employees’ personal income tax;
3) The investment gains of the annuity programs are exempt from personal income tax.
We believe that the tax deferral policy will greatly incentivize the employees to participate in the annuity plan. Currently, only 1.4% of the total working
6 National Development and Reform Commission & the Ministry of Health: Further Encouraging and Guiding Social Capital to Invest in Medical Institutions (关于进一步鼓励和引导社会资本举办医疗机构的意
见), December 2010.
3 January 2014
China: Themes and strategy for 2014
Page 50 Deutsche Bank AG/Hong Kong
population has taken part in the scheme. In the US, where a similar tax treatment for the 401(K) plan is offered, employee participation is over 90%.
Moreover, we expect more favorable policies to be rolled out to incentivize the contribution of employers. At present, the tax exempt amount for enterprises’ contribution into the “annuities and supplementary healthcare insurance“ is capped at 5% of total salaries of employees in most provinces. An upward revision to the cap is likely as some pilot provinces have already raised it to 12.5%. Currently, less than 0.5% of Chinese enterprises participate in the program, and most of them are SOEs.
The growth of the annuity program will create an important new business for the insurance, brokerage and asset management industry.
3 Developing critical illness insurance and catastrophe insurance The 3rd Plenum also decided on the nationwide implementation of the critical illness insurance program and catastrophe insurance program.
On critical illness, we expect the current pilot programs in 120 cities to be expanded to nationwide by end-2014/early 2015. The room for expansion is ample as the trials only cover 200m people and the ultimate coverage should be 1.1bn, covering all the participants in the Urban Resident Medical Insurance System (URBMIS 城镇居民医保) and the New Rural Co-operative Medical Care System (NRCMS 新农合). The reimbursement rate for the critical illness bill should be above 50% for all rural and urban residents, with eligible items including drugs, medical services, and use of medical devices. The source of premium contributions to the critical illness insurance policies will be a portion of the existing employee/employer contributions to the URBMIS and NRCMS. We expect a rapid development of the critical illness insurance program as it does not require additional contributions from either the employees or employers.
The government will also accelerate the launch of the catastrophe insurance scheme. This insurance scheme will be designed to compensate for damage to lives and properties after unforeseeable events such as major natural disasters. In the past, post-disaster reconstruction has mainly relied on the fiscal budget and donations, and less than 5% of the economic losses were covered by insurance. The coverage ratio by insurance in OECD countries is usually 20%-40%.
4 House-for-pension scheme The house-for-pension scheme is another initiative of social security reform. It was officially proposed by the government in September 2013. According to the fist pilot product to be rolled out by Happy Life Insurance in January 2014, an elderly person who owns an apartment could deed the property to an insurance company or a bank, which would pay him/her a fixed amount of money every month, based on assessed value of the property and estimated life expectancy of the applicant. The elderly person can still live in the apartment although the ownership has already been transferred to the insurance company or the bank.
Given the early development stage of the product, it may take years before the market develops, in our view. In the long term, the system might help banks and insurers to develop a new product line.
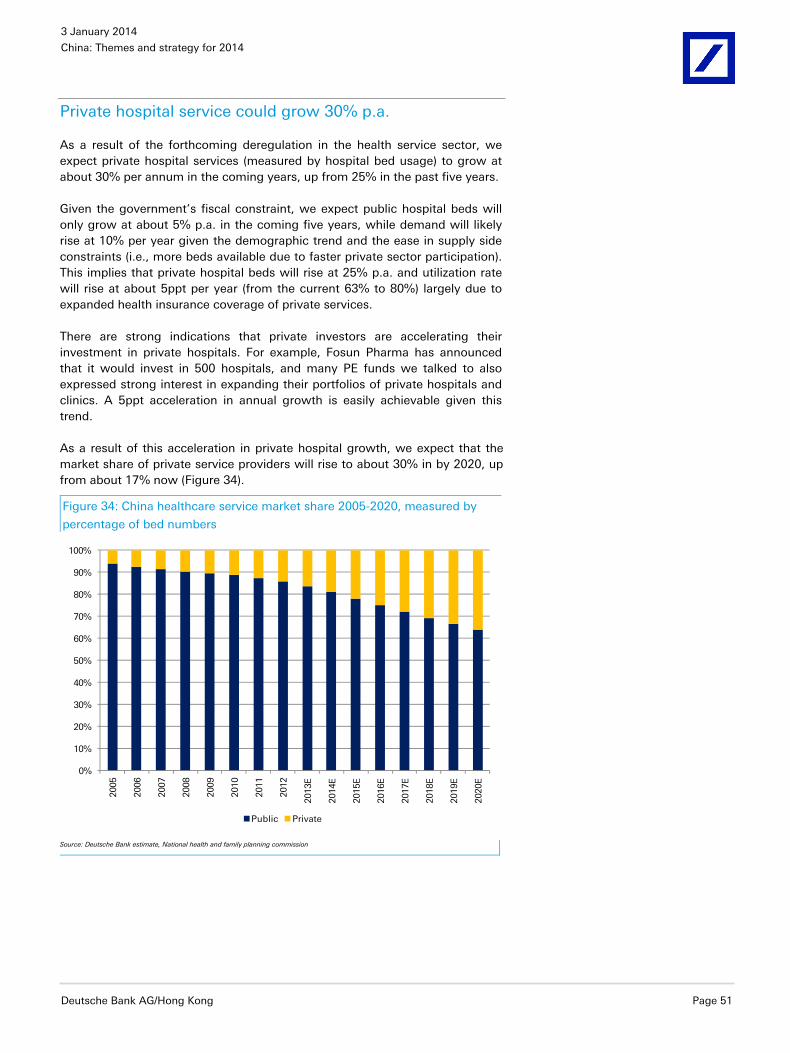
3 January 2014
China: Themes and strategy for 2014
Deutsche Bank AG/Hong Kong Page 51
Private hospital service could grow 30% p.a.
As a result of the forthcoming deregulation in the health service sector, we expect private hospital services (measured by hospital bed usage) to grow at about 30% per annum in the coming years, up from 25% in the past five years.
Given the government’s fiscal constraint, we expect public hospital beds will only grow at about 5% p.a. in the coming five years, while demand will likely rise at 10% per year given the demographic trend and the ease in supply side constraints (i.e., more beds available due to faster private sector participation). This implies that private hospital beds will rise at 25% p.a. and utilization rate will rise at about 5ppt per year (from the current 63% to 80%) largely due to expanded health insurance coverage of private services.
There are strong indications that private investors are accelerating their investment in private hospitals. For example, Fosun Pharma has announced that it would invest in 500 hospitals, and many PE funds we talked to also expressed strong interest in expanding their portfolios of private hospitals and clinics. A 5ppt acceleration in annual growth is easily achievable given this trend.
As a result of this acceleration in private hospital growth, we expect that the market share of private service providers will rise to about 30% in by 2020, up from about 17% now (Figure 34).
Figure 34: China healthcare service market share 2005-2020, measured by
percentage of bed numbers
0%
10%
20%
30%
40%
50%
60%
70%
80%
90%
100%
2005
2006
2007
2008
2009
2010
2011
2012
2013
E
2014
E
2015
E
2016
E
2017
E
2018
E
2019
E
2020
E
Public Private
Source: Deutsche Bank estimate, National health and family planning commission
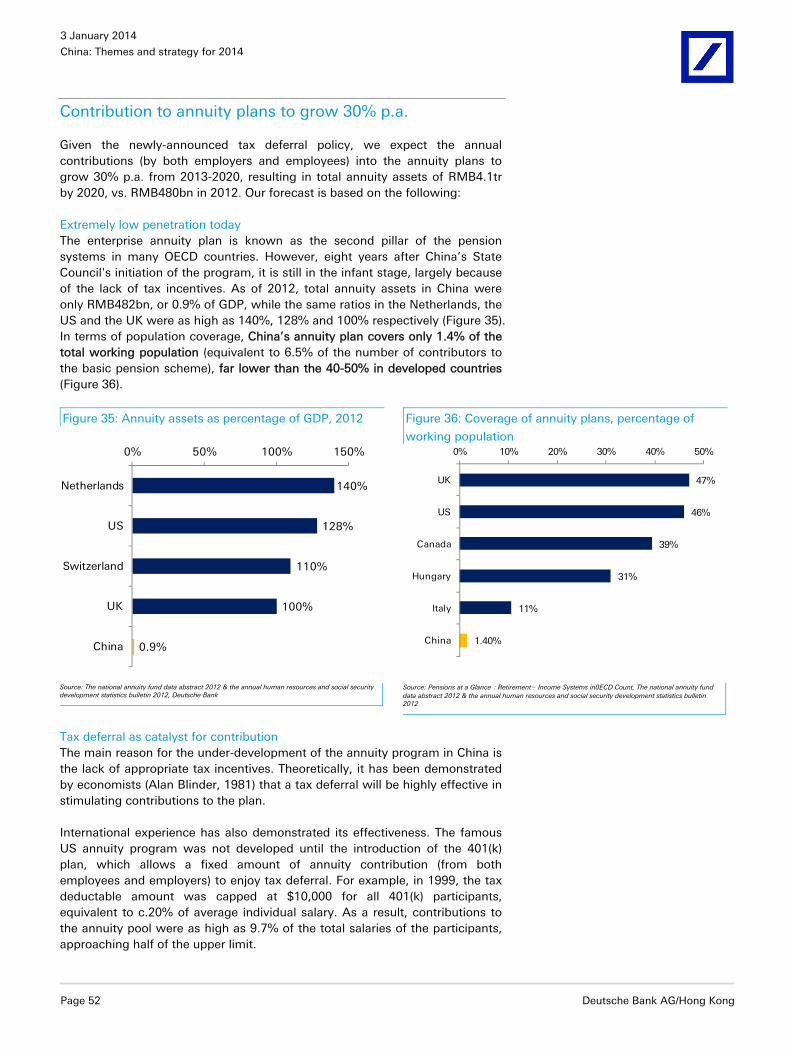
3 January 2014
China: Themes and strategy for 2014
Page 52 Deutsche Bank AG/Hong Kong
Contribution to annuity plans to grow 30% p.a.
Given the newly-announced tax deferral policy, we expect the annual contributions (by both employers and employees) into the annuity plans to grow 30% p.a. from 2013-2020, resulting in total annuity assets of RMB4.1tr by 2020, vs. RMB480bn in 2012. Our forecast is based on the following:
Extremely low penetration today The enterprise annuity plan is known as the second pillar of the pension systems in many OECD countries. However, eight years after China’s State Council's initiation of the program, it is still in the infant stage, largely because of the lack of tax incentives. As of 2012, total annuity assets in China were only RMB482bn, or 0.9% of GDP, while the same ratios in the Netherlands, the US and the UK were as high as 140%, 128% and 100% respectively (Figure 35). In terms of population coverage, China’s annuity plan covers only 1.4% of the total working population (equivalent to 6.5% of the number of contributors to the basic pension scheme), far lower than the 40-50% in developed countries (Figure 36).
Figure 35: Annuity assets as percentage of GDP, 2012 Figure 36: Coverage of annuity plans, percentage of
working population
140%
128%
110%
100%
0.9%
0% 50% 100% 150%
Netherlands
US
Switzerland
UK
China
47%
46%
39%
31%
11%
1.40%
0% 10% 20% 30% 40% 50%
UK
US
Canada
Hungary
Italy
China
Source: The national annuity fund data abstract 2012 & the annual human resources and social security development statistics bulletin 2012, Deutsche Bank Source: Pensions at a Glance:Retirement— Income Systems in0ECD Count, The national annuity fund
data abstract 2012 & the annual human resources and social security development statistics bulletin 2012
Tax deferral as catalyst for contribution The main reason for the under-development of the annuity program in China is the lack of appropriate tax incentives. Theoretically, it has been demonstrated by economists (Alan Blinder, 1981) that a tax deferral will be highly effective in stimulating contributions to the plan.
International experience has also demonstrated its effectiveness. The famous US annuity program was not developed until the introduction of the 401(k) plan, which allows a fixed amount of annuity contribution (from both employees and employers) to enjoy tax deferral. For example, in 1999, the tax deductable amount was capped at $10,000 for all 401(k) participants, equivalent to c.20% of average individual salary. As a result, contributions to the annuity pool were as high as 9.7% of the total salaries of the participants, approaching half of the upper limit.
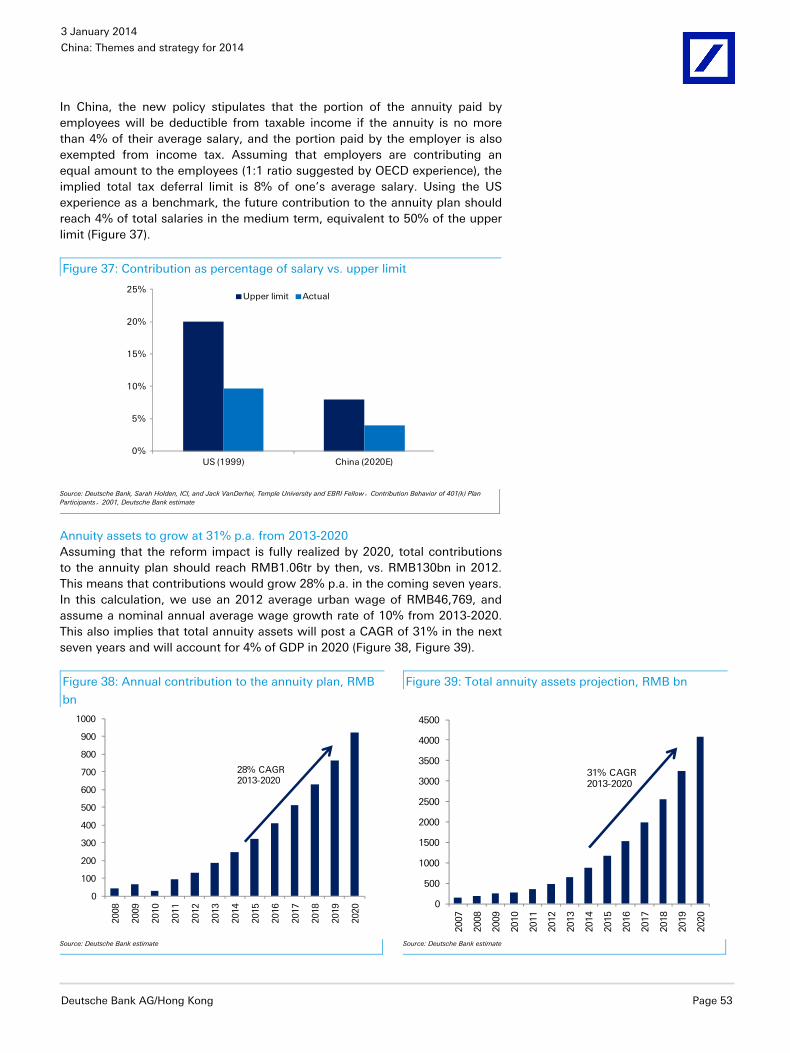
3 January 2014
China: Themes and strategy for 2014
Deutsche Bank AG/Hong Kong Page 53
In China, the new policy stipulates that the portion of the annuity paid by employees will be deductible from taxable income if the annuity is no more than 4% of their average salary, and the portion paid by the employer is also exempted from income tax. Assuming that employers are contributing an equal amount to the employees (1:1 ratio suggested by OECD experience), the implied total tax deferral limit is 8% of one’s average salary. Using the US experience as a benchmark, the future contribution to the annuity plan should reach 4% of total salaries in the medium term, equivalent to 50% of the upper limit (Figure 37).
Figure 37: Contribution as percentage of salary vs. upper limit
0%
5%
10%
15%
20%
25%
US (1999) China (2020E)
Upper limit Actual
Source: Deutsche Bank, Sarah Holden, ICI, and Jack VanDerhei, Temple University and EBRI Fellow,Contribution Behavior of 401(k) Plan Participants,2001, Deutsche Bank estimate
Annuity assets to grow at 31% p.a. from 2013-2020 Assuming that the reform impact is fully realized by 2020, total contributions to the annuity plan should reach RMB1.06tr by then, vs. RMB130bn in 2012. This means that contributions would grow 28% p.a. in the coming seven years. In this calculation, we use an 2012 average urban wage of RMB46,769, and assume a nominal annual average wage growth rate of 10% from 2013-2020. This also implies that total annuity assets will post a CAGR of 31% in the next seven years and will account for 4% of GDP in 2020 (Figure 38, Figure 39).
Figure 38: Annual contribution to the annuity plan, RMB
bn
Figure 39: Total annuity assets projection, RMB bn
0
100
200
300
400
500
600
700
800
900
1000
2008
2009
2010
2011
2012
2013
2014
2015
2016
2017
2018
2019
2020
28% CAGR2013-2020
0
500
1000
1500
2000
2500
3000
3500
4000
4500
2007
2008
2009
2010
2011
2012
2013
2014
2015
2016
2017
2018
2019
2020
31% CAGR2013-2020
Source: Deutsche Bank estimate Source: Deutsche Bank estimate
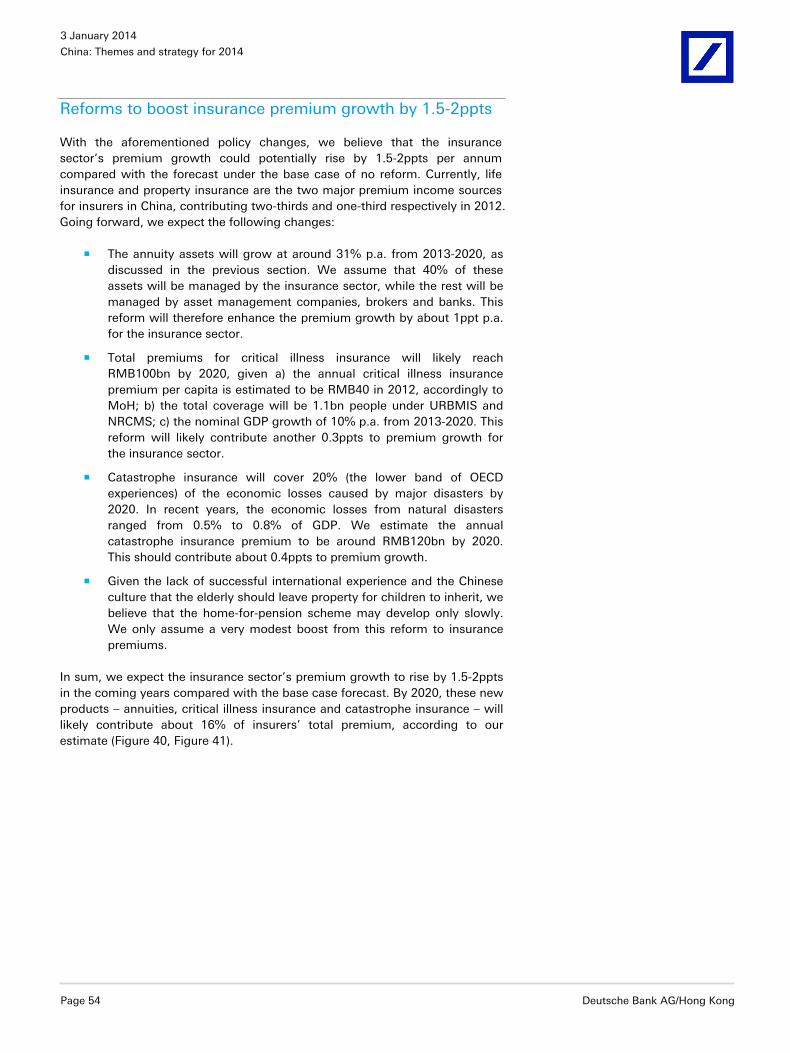
3 January 2014
China: Themes and strategy for 2014
Page 54 Deutsche Bank AG/Hong Kong
Reforms to boost insurance premium growth by 1.5-2ppts
With the aforementioned policy changes, we believe that the insurance sector’s premium growth could potentially rise by 1.5-2ppts per annum compared with the forecast under the base case of no reform. Currently, life insurance and property insurance are the two major premium income sources for insurers in China, contributing two-thirds and one-third respectively in 2012. Going forward, we expect the following changes:
The annuity assets will grow at around 31% p.a. from 2013-2020, as discussed in the previous section. We assume that 40% of these assets will be managed by the insurance sector, while the rest will be managed by asset management companies, brokers and banks. This reform will therefore enhance the premium growth by about 1ppt p.a. for the insurance sector.
Total premiums for critical illness insurance will likely reach RMB100bn by 2020, given a) the annual critical illness insurance premium per capita is estimated to be RMB40 in 2012, accordingly to MoH; b) the total coverage will be 1.1bn people under URBMIS and NRCMS; c) the nominal GDP growth of 10% p.a. from 2013-2020. This reform will likely contribute another 0.3ppts to premium growth for the insurance sector.
Catastrophe insurance will cover 20% (the lower band of OECD experiences) of the economic losses caused by major disasters by 2020. In recent years, the economic losses from natural disasters ranged from 0.5% to 0.8% of GDP. We estimate the annual catastrophe insurance premium to be around RMB120bn by 2020. This should contribute about 0.4ppts to premium growth.
Given the lack of successful international experience and the Chinese culture that the elderly should leave property for children to inherit, we believe that the home-for-pension scheme may develop only slowly. We only assume a very modest boost from this reform to insurance premiums.
In sum, we expect the insurance sector’s premium growth to rise by 1.5-2ppts in the coming years compared with the base case forecast. By 2020, these new products – annuities, critical illness insurance and catastrophe insurance – will likely contribute about 16% of insurers’ total premium, according to our estimate (Figure 40, Figure 41).
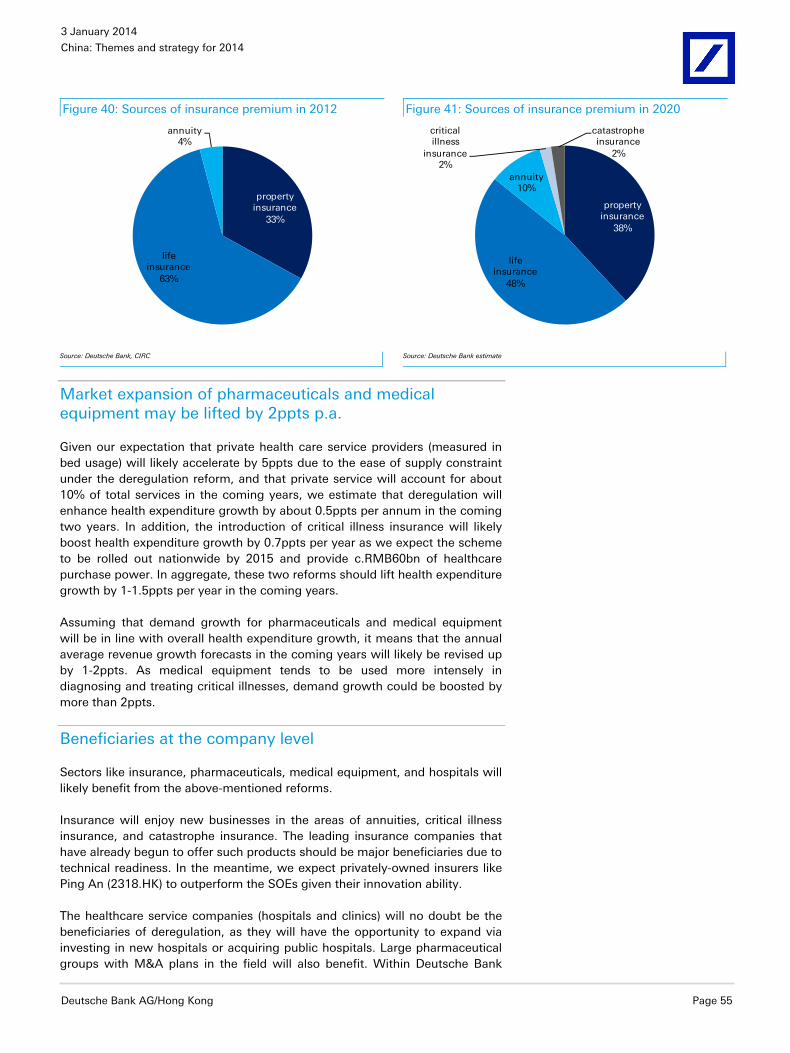
3 January 2014
China: Themes and strategy for 2014
Deutsche Bank AG/Hong Kong Page 55
Figure 40: Sources of insurance premium in 2012 Figure 41: Sources of insurance premium in 2020
property insurance
33%
life insurance
63%
annuity4%
property insurance
38%
life insurance
48%
annuity10%
critical illness
insurance 2%
catastrophe insurance
2%
Source: Deutsche Bank, CIRC Source: Deutsche Bank estimate
Market expansion of pharmaceuticals and medical equipment may be lifted by 2ppts p.a.
Given our expectation that private health care service providers (measured in bed usage) will likely accelerate by 5ppts due to the ease of supply constraint under the deregulation reform, and that private service will account for about 10% of total services in the coming years, we estimate that deregulation will enhance health expenditure growth by about 0.5ppts per annum in the coming two years. In addition, the introduction of critical illness insurance will likely boost health expenditure growth by 0.7ppts per year as we expect the scheme to be rolled out nationwide by 2015 and provide c.RMB60bn of healthcare purchase power. In aggregate, these two reforms should lift health expenditure growth by 1-1.5ppts per year in the coming years.
Assuming that demand growth for pharmaceuticals and medical equipment will be in line with overall health expenditure growth, it means that the annual average revenue growth forecasts in the coming years will likely be revised up by 1-2ppts. As medical equipment tends to be used more intensely in diagnosing and treating critical illnesses, demand growth could be boosted by more than 2ppts.
Beneficiaries at the company level
Sectors like insurance, pharmaceuticals, medical equipment, and hospitals will likely benefit from the above-mentioned reforms.
Insurance will enjoy new businesses in the areas of annuities, critical illness insurance, and catastrophe insurance. The leading insurance companies that have already begun to offer such products should be major beneficiaries due to technical readiness. In the meantime, we expect privately-owned insurers like Ping An (2318.HK) to outperform the SOEs given their innovation ability.
The healthcare service companies (hospitals and clinics) will no doubt be the beneficiaries of deregulation, as they will have the opportunity to expand via investing in new hospitals or acquiring public hospitals. Large pharmaceutical groups with M&A plans in the field will also benefit. Within Deutsche Bank
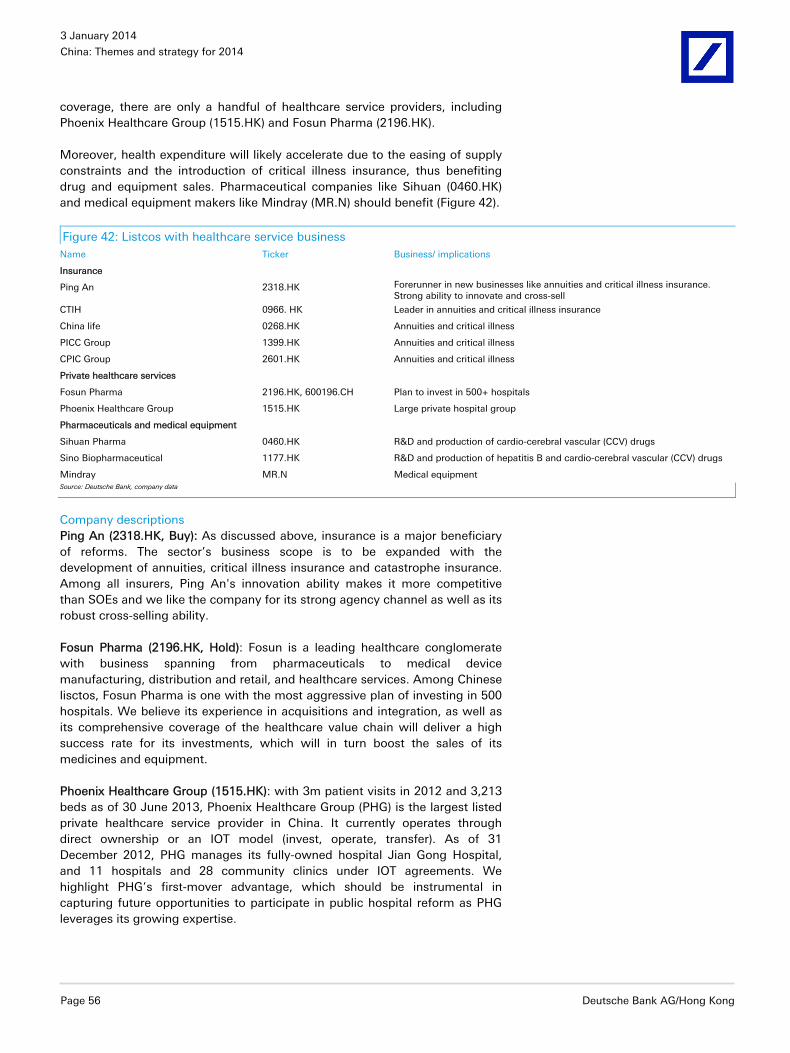
3 January 2014
China: Themes and strategy for 2014
Page 56 Deutsche Bank AG/Hong Kong
coverage, there are only a handful of healthcare service providers, including Phoenix Healthcare Group (1515.HK) and Fosun Pharma (2196.HK).
Moreover, health expenditure will likely accelerate due to the easing of supply constraints and the introduction of critical illness insurance, thus benefiting drug and equipment sales. Pharmaceutical companies like Sihuan (0460.HK) and medical equipment makers like Mindray (MR.N) should benefit (Figure 42).
Figure 42: Listcos with healthcare service business Name Ticker Business/ implications
Insurance
Ping An 2318.HK Forerunner in new businesses like annuities and critical illness insurance. Strong ability to innovate and cross-sell
CTIH 0966. HK Leader in annuities and critical illness insurance
China life 0268.HK Annuities and critical illness
PICC Group 1399.HK Annuities and critical illness
CPIC Group 2601.HK Annuities and critical illness
Private healthcare services
Fosun Pharma 2196.HK, 600196.CH Plan to invest in 500+ hospitals
Phoenix Healthcare Group 1515.HK Large private hospital group
Pharmaceuticals and medical equipment
Sihuan Pharma 0460.HK R&D and production of cardio-cerebral vascular (CCV) drugs
Sino Biopharmaceutical 1177.HK R&D and production of hepatitis B and cardio-cerebral vascular (CCV) drugs
Mindray MR.N Medical equipment Source: Deutsche Bank, company data
Company descriptions Ping An (2318.HK, Buy): As discussed above, insurance is a major beneficiary of reforms. The sector’s business scope is to be expanded with the development of annuities, critical illness insurance and catastrophe insurance. Among all insurers, Ping An's innovation ability makes it more competitive than SOEs and we like the company for its strong agency channel as well as its robust cross-selling ability.
Fosun Pharma (2196.HK, Hold): Fosun is a leading healthcare conglomerate with business spanning from pharmaceuticals to medical device manufacturing, distribution and retail, and healthcare services. Among Chinese lisctos, Fosun Pharma is one with the most aggressive plan of investing in 500 hospitals. We believe its experience in acquisitions and integration, as well as its comprehensive coverage of the healthcare value chain will deliver a high success rate for its investments, which will in turn boost the sales of its medicines and equipment.
Phoenix Healthcare Group (1515.HK): with 3m patient visits in 2012 and 3,213 beds as of 30 June 2013, Phoenix Healthcare Group (PHG) is the largest listed private healthcare service provider in China. It currently operates through direct ownership or an IOT model (invest, operate, transfer). As of 31 December 2012, PHG manages its fully-owned hospital Jian Gong Hospital, and 11 hospitals and 28 community clinics under IOT agreements. We highlight PHG’s first-mover advantage, which should be instrumental in capturing future opportunities to participate in public hospital reform as PHG leverages its growing expertise.
3 January 2014
China: Themes and strategy for 2014
Deutsche Bank AG/Hong Kong Page 57
Impact of reforms on property sector In this section, we discuss the impact of reforms and other real estate policies that will likely influence the performance of the property market: 1) the home purchase restrictions (HPRs); 2) urban land reform; 3) rural land reform; 4) urbanization policies; and 5) the property tax.
We conclude that the changes on the HPRs will likely be minimal in 2014. However, the following reforms will likely have profound and complex implications for China’s property sector in the short, medium and longer term:
1. Urban land reform. Land supply for urban residential and commercial uses will increase, while industrial land supply will fall. This will increase the volume growth of real estate development, especially in Tier 1 and 2 cities. Implementation of this reform will likely be immediate.
2. Rural land reform. Rural land reform will increase land supply for urban residential and commercial use – and thus real estate market volume growth – in the medium and longer term. It will also increase the income and wealth of farmers, which will in turn help accelerate the pace of urbanization and thus demand for urban properties.
3. Property tax. The property tax, which will likely to be rolled out in all major cities in next five to ten years, should more effectively curb speculative demand for property and thus reduce volume growth.
4. Social service reform. The urbanization plan emphasizes the provision of social services for migrant workers and will help speed up urbanization. This will also help boost demand for and thus volume growth of real estate development.
The aggregate impact of these reforms on the real estate market will likely include a slowdown in property inflation but higher volume growth for real estate developers compared with the base case of no reform. For 2014, we expect the average residential property inflation to moderate to around 5% (down from 8% in 2013) but volume growth to accelerate further.
At the company level, we like developers with exposure to Tier 1 and 2 cities where volume growth is high due to reforms but property tax introduction is less likely. Based on these criteria and valuations, we highlight four companies with Buy ratings from our sector analysts: COLI (0688.hk), China Resources Land (1109.hk), Shimao Property (0813.hk) and Guangzhou R&F (2777.hk).
Home purchase restrictions
Home purchase restrictions (HPRs) and credit policies are the two most important policy tools used in the past by the government to stabilize the property market. In 2014, we expect HPRs to remain largely unchanged in most cities.
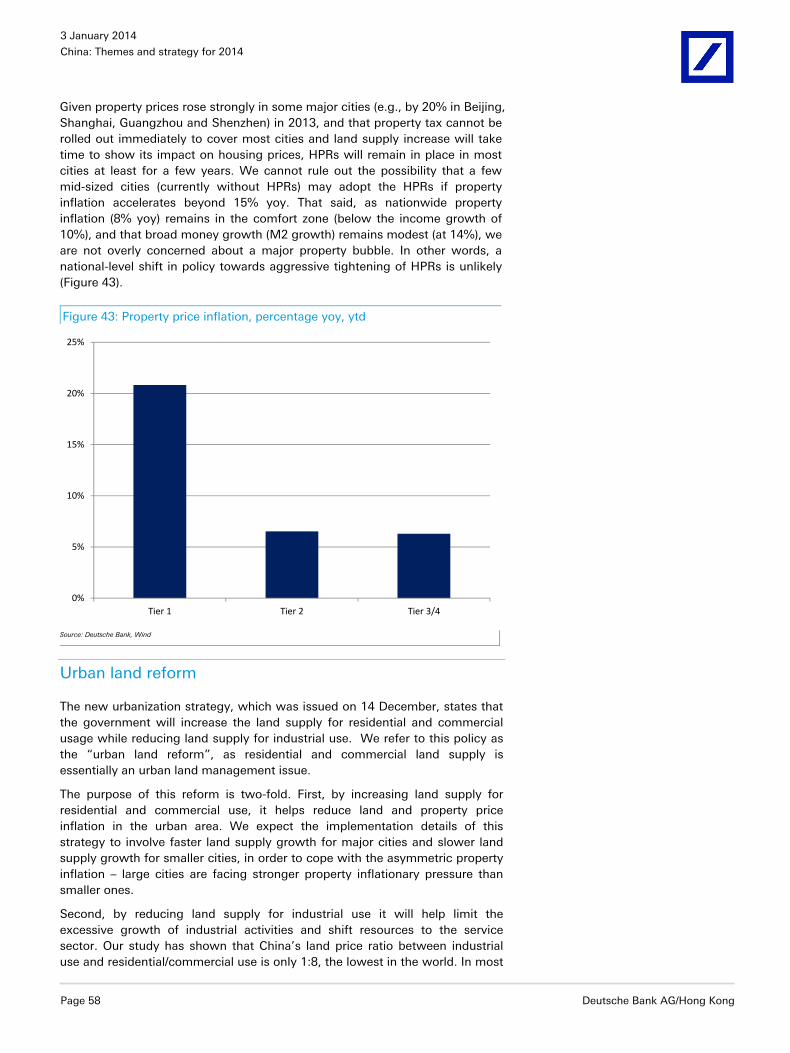
3 January 2014
China: Themes and strategy for 2014
Page 58 Deutsche Bank AG/Hong Kong
Given property prices rose strongly in some major cities (e.g., by 20% in Beijing, Shanghai, Guangzhou and Shenzhen) in 2013, and that property tax cannot be rolled out immediately to cover most cities and land supply increase will take time to show its impact on housing prices, HPRs will remain in place in most cities at least for a few years. We cannot rule out the possibility that a few mid-sized cities (currently without HPRs) may adopt the HPRs if property inflation accelerates beyond 15% yoy. That said, as nationwide property inflation (8% yoy) remains in the comfort zone (below the income growth of 10%), and that broad money growth (M2 growth) remains modest (at 14%), we are not overly concerned about a major property bubble. In other words, a national-level shift in policy towards aggressive tightening of HPRs is unlikely (Figure 43).
Figure 43: Property price inflation, percentage yoy, ytd
0%
5%
10%
15%
20%
25%
Tier 1 Tier 2 Tier 3/4
Source: Deutsche Bank, Wind
Urban land reform
The new urbanization strategy, which was issued on 14 December, states that the government will increase the land supply for residential and commercial usage while reducing land supply for industrial use. We refer to this policy as the “urban land reform”, as residential and commercial land supply is essentially an urban land management issue.
The purpose of this reform is two-fold. First, by increasing land supply for residential and commercial use, it helps reduce land and property price inflation in the urban area. We expect the implementation details of this strategy to involve faster land supply growth for major cities and slower land supply growth for smaller cities, in order to cope with the asymmetric property inflation – large cities are facing stronger property inflationary pressure than smaller ones.
Second, by reducing land supply for industrial use it will help limit the excessive growth of industrial activities and shift resources to the service sector. Our study has shown that China’s land price ratio between industrial use and residential/commercial use is only 1:8, the lowest in the world. In most
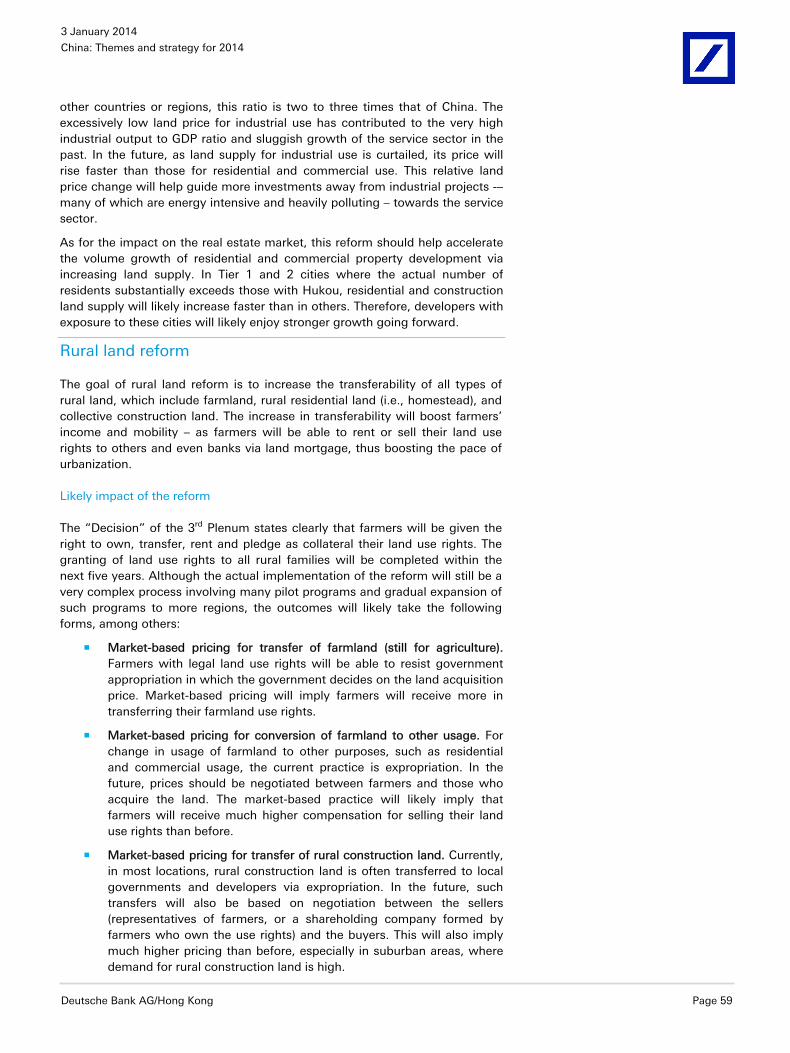
3 January 2014
China: Themes and strategy for 2014
Deutsche Bank AG/Hong Kong Page 59
other countries or regions, this ratio is two to three times that of China. The excessively low land price for industrial use has contributed to the very high industrial output to GDP ratio and sluggish growth of the service sector in the past. In the future, as land supply for industrial use is curtailed, its price will rise faster than those for residential and commercial use. This relative land price change will help guide more investments away from industrial projects -– many of which are energy intensive and heavily polluting – towards the service sector.
As for the impact on the real estate market, this reform should help accelerate the volume growth of residential and commercial property development via increasing land supply. In Tier 1 and 2 cities where the actual number of residents substantially exceeds those with Hukou, residential and construction land supply will likely increase faster than in others. Therefore, developers with exposure to these cities will likely enjoy stronger growth going forward.
Rural land reform
The goal of rural land reform is to increase the transferability of all types of rural land, which include farmland, rural residential land (i.e., homestead), and collective construction land. The increase in transferability will boost farmers’ income and mobility – as farmers will be able to rent or sell their land use rights to others and even banks via land mortgage, thus boosting the pace of urbanization.
Likely impact of the reform
The “Decision” of the 3rd Plenum states clearly that farmers will be given the right to own, transfer, rent and pledge as collateral their land use rights. The granting of land use rights to all rural families will be completed within the next five years. Although the actual implementation of the reform will still be a very complex process involving many pilot programs and gradual expansion of such programs to more regions, the outcomes will likely take the following forms, among others:
Market-based pricing for transfer of farmland (still for agriculture). Farmers with legal land use rights will be able to resist government appropriation in which the government decides on the land acquisition price. Market-based pricing will imply farmers will receive more in transferring their farmland use rights.
Market-based pricing for conversion of farmland to other usage. For change in usage of farmland to other purposes, such as residential and commercial usage, the current practice is expropriation. In the future, prices should be negotiated between farmers and those who acquire the land. The market-based practice will likely imply that farmers will receive much higher compensation for selling their land use rights than before.
Market-based pricing for transfer of rural construction land. Currently, in most locations, rural construction land is often transferred to local governments and developers via expropriation. In the future, such transfers will also be based on negotiation between the sellers (representatives of farmers, or a shareholding company formed by farmers who own the use rights) and the buyers. This will also imply much higher pricing than before, especially in suburban areas, where demand for rural construction land is high.
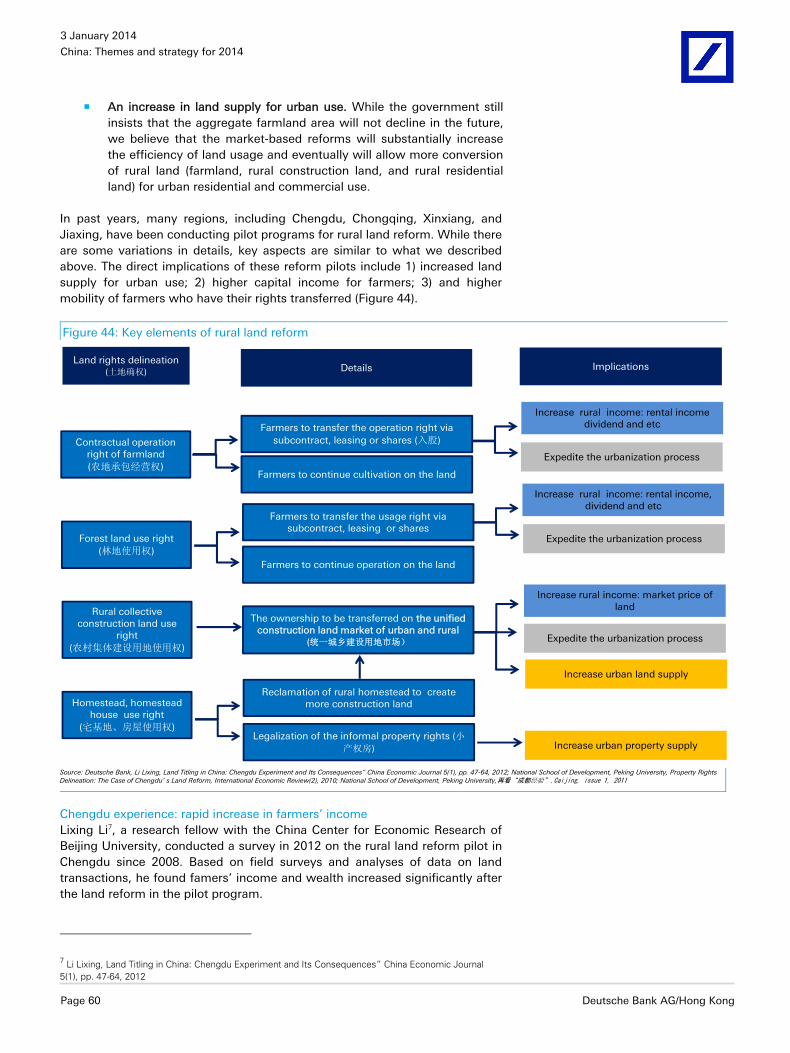
3 January 2014
China: Themes and strategy for 2014
Page 60 Deutsche Bank AG/Hong Kong
An increase in land supply for urban use. While the government still insists that the aggregate farmland area will not decline in the future, we believe that the market-based reforms will substantially increase the efficiency of land usage and eventually will allow more conversion of rural land (farmland, rural construction land, and rural residential land) for urban residential and commercial use.
In past years, many regions, including Chengdu, Chongqing, Xinxiang, and Jiaxing, have been conducting pilot programs for rural land reform. While there are some variations in details, key aspects are similar to what we described above. The direct implications of these reform pilots include 1) increased land supply for urban use; 2) higher capital income for farmers; 3) and higher mobility of farmers who have their rights transferred (Figure 44).
Figure 44: Key elements of rural land reform
Farmers to transfer the operation right via subcontract, leasing or shares (入股)
Increase rural income: rental income dividend and etc
Land rights delineation (土地确权)
Homestead, homestead house use right
(宅基地、房屋使用权)
Contractual operation right of farmland (农地承包经营权)
Rural collective construction land use
right(农村集体建设用地使用权)
Forest land use right (林地使用权)
Details Implications
Farmers to continue cultivation on the land
Expedite the urbanization process
Farmers to transfer the usage right via subcontract, leasing or shares
Farmers to continue operation on the land
Increase urban land supply
The ownership to be transferred on the unified construction land market of urban and rural
(统一城乡建设用地市场)
Reclamation of rural homestead to create more construction land
Legalization of the informal property rights (小产权房)
Increase rural income: rental income, dividend and etc
Expedite the urbanization process
Increase rural income: market price of land
Expedite the urbanization process
Increase urban property supply
Source: Deutsche Bank, Li Lixing, Land Titling in China: Chengdu Experiment and Its Consequences” China Economic Journal 5(1), pp. 47-64, 2012; National School of Development, Peking University, Property Rights Delineation: The Case of Chengdu’ s Land Reform, International Economic Review(2), 2010; National School of Development, Peking University,再看“成都经验”,Caijing, issue 1, 2011
Chengdu experience: rapid increase in farmers’ income Lixing Li7, a research fellow with the China Center for Economic Research of Beijing University, conducted a survey in 2012 on the rural land reform pilot in Chengdu since 2008. Based on field surveys and analyses of data on land transactions, he found famers’ income and wealth increased significantly after the land reform in the pilot program.
7 Li Lixing, Land Titling in China: Chengdu Experiment and Its Consequences” China Economic Journal 5(1), pp. 47-64, 2012
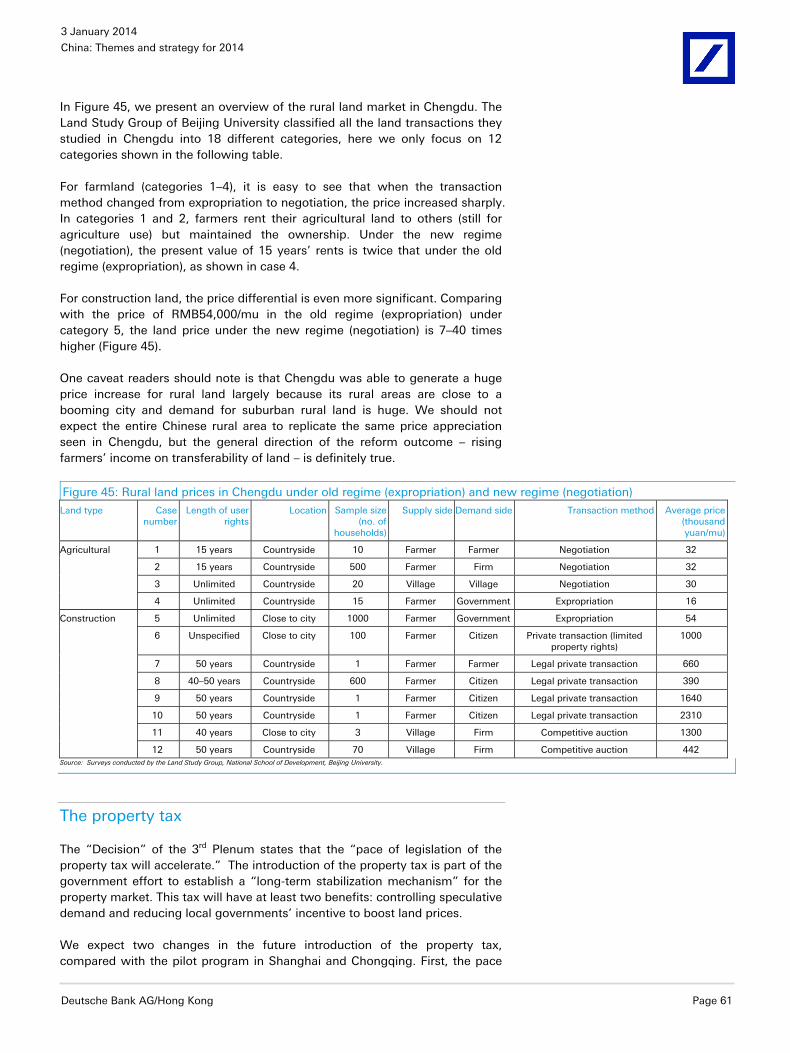
3 January 2014
China: Themes and strategy for 2014
Deutsche Bank AG/Hong Kong Page 61
In Figure 45, we present an overview of the rural land market in Chengdu. The Land Study Group of Beijing University classified all the land transactions they studied in Chengdu into 18 different categories, here we only focus on 12 categories shown in the following table.
For farmland (categories 1–4), it is easy to see that when the transaction method changed from expropriation to negotiation, the price increased sharply. In categories 1 and 2, farmers rent their agricultural land to others (still for agriculture use) but maintained the ownership. Under the new regime (negotiation), the present value of 15 years’ rents is twice that under the old regime (expropriation), as shown in case 4.
For construction land, the price differential is even more significant. Comparing with the price of RMB54,000/mu in the old regime (expropriation) under category 5, the land price under the new regime (negotiation) is 7–40 times higher (Figure 45).
One caveat readers should note is that Chengdu was able to generate a huge price increase for rural land largely because its rural areas are close to a booming city and demand for suburban rural land is huge. We should not expect the entire Chinese rural area to replicate the same price appreciation seen in Chengdu, but the general direction of the reform outcome – rising farmers’ income on transferability of land – is definitely true.
Figure 45: Rural land prices in Chengdu under old regime (expropriation) and new regime (negotiation)
Land type Case number
Length of user rights
Location Sample size (no. of
households)
Supply side Demand side Transaction method Average price (thousand yuan/mu)
Agricultural 1 15 years Countryside 10 Farmer Farmer Negotiation 32
2 15 years Countryside 500 Farmer Firm Negotiation 32
3 Unlimited Countryside 20 Village Village Negotiation 30
4 Unlimited Countryside 15 Farmer Government Expropriation 16
Construction 5 Unlimited Close to city 1000 Farmer Government Expropriation 54
6 Unspecified Close to city 100 Farmer Citizen Private transaction (limited property rights)
1000
7 50 years Countryside 1 Farmer Farmer Legal private transaction 660
8 40–50 years Countryside 600 Farmer Citizen Legal private transaction 390
9 50 years Countryside 1 Farmer Citizen Legal private transaction 1640
10 50 years Countryside 1 Farmer Citizen Legal private transaction 2310
11 40 years Close to city 3 Village Firm Competitive auction 1300
12 50 years Countryside 70 Village Firm Competitive auction 442 Source: Surveys conducted by the Land Study Group, National School of Development, Beijing University.
The property tax
The “Decision” of the 3rd Plenum states that the “pace of legislation of the property tax will accelerate.” The introduction of the property tax is part of the government effort to establish a “long-term stabilization mechanism” for the property market. This tax will have at least two benefits: controlling speculative demand and reducing local governments’ incentive to boost land prices.
We expect two changes in the future introduction of the property tax, compared with the pilot program in Shanghai and Chongqing. First, the pace
3 January 2014
China: Themes and strategy for 2014
Page 62 Deutsche Bank AG/Hong Kong
of its introduction will likely accelerate. In the past three years, only Shanghai and Chongqing adopted this tax. In the coming five years, we expect five to ten cities to introduce this tax. In the next ten years, most Tier 1 and some Tier 2 cities should have launched their property taxes.
Second, the coverage of the property tax in future will likely be wider than those in Shanghai and Chongqing. This means that not only the very large second homes (such as villas) will be taxed, but in most cities all residential properties will likely be taxed for areas that exceed a certain exemption threshold. Only by doing so will the property tax be able to replace land revenue as a major source of local revenue in the medium term.
In the short term, cities where the property tax is introduced will likely see an immediate reduction in demand for properties as expectation for future price appreciation will weaken. Therefore, a correction in share prices of developers with exposure to these cities at the time of the property tax announcement is inevitable, at least in the short term. However, the long-term implication of this tax is positive, as it would help avoid property bubbles.
Social service reform
A major part of the urbanization strategy released on 14 December is that the fiscal transfer system will be reformed so that public series – such as health, education, and pension – will support the migration of rural population to the cities.
Currently, many intergovernmental fiscal transfers from the central to local governments for particular social series – e.g., education, health insurance subsidy, pension subsidy – are based on population with Hukou (those with formal residence permits). In past decades, many farmers and their family members (children and parents) had migrated to cities but their Hukou remained in the provinces/counties of their origins. Under the current regime, fiscal transfers for many social services are allocated to the provinces/counties of the farmers’ origins, rather than to the cities where they currently reside. This results in a fiscal shortage for cities that need to provide the services. The inability of cities to provide reasonable levels of public services to migrants without Hokou – which forces these farmers to use private, and more expansive services – has become a major hurdle to urbanization.
We expect that from 2014, the formulae for both the equalization transfers and specific grants from the central government to provincial governments, as well as those transfers from provincial to lower level governments, be revised to reflect the demands for social services from migrants who live in cities but do not have Hukou. This reform will improve the level and quality of service provisions, and should help attract more rural residents to migrate to cities. Its demand implication for urban real estate is certainly positive.
Implications for listed developers
The aggregate impact of these reforms on the real estate market will likely include a slowdown in property inflation but a higher volume growth for real estate developers compared with the base case of no reform. For 2014, we expect the average residential property inflation to moderate to around 5% (down from 8% in 2013) but volume growth to accelerate.
3 January 2014
China: Themes and strategy for 2014
Deutsche Bank AG/Hong Kong Page 63
We believe that Tier 1 and 2 cities will remain the favorable places for developers, as they are likely to enjoy stronger land supply growth (as a result of the urban and rural land reforms) as well as a more rapid improvement of social services for migrant families which will attract a stronger population inflow. While theoretically small cities may also benefit from urbanization, developers in these cities will likely to suffer from continued oversupply of land (and therefore low pricing and low margin) and migration to small cities will likely remain limited due to the lack of job opportunities.
We select our preferred developers according to the following three main criteria: 1) Large exposure to the Tier 2 and Tier 1 cities (i.e., with >70% of land bank in Tier 1& 2 cities); 2) Limited exposure to cities that may introduce a property tax as early as in 2014 (we selected these cities largely based on their property inflation and readiness); 3) Buy ratings by our sector analysts largely based on valuations. This screening results in the following companies: COLI (0688.hk), China Resources Land (1109.hk), Shimao Property (0813.hk) and Guangzhou R&F (2777.hk).
3 January 2014
China: Themes and strategy for 2014
Page 64 Deutsche Bank AG/Hong Kong
New anti-pollution initiatives8 In our 28 February 2013 report, Big bang measures to fight air pollution, we predicted that the government would soon introduce very aggressive measures to reduce conventional coal consumption, promote clean energies, expand the use of clean-coal technologies, enforce tougher standards on fuel and car emissions, and promote public transportation such as subways.
In June 2013, the State Council issued China’s “Clean Air Action Plan,” and it was followed by even more aggressive local action plans in major areas such as Beijing, Shanghai, Hebei and Tianjin during October and November. All of our predictions were confirmed, and in some areas the announced measures were even more aggressive than we suggested in our “Big Bang list”. For example, the State Council decided that the PM2.5 (air pollution index) will need to fall by 25% within the next five years in all cities; the Beijing municipal government announced a plan to reduce conventional coal consumption by 35% by 2017 and reduce the annual growth rate of car ownership to 3% p.a. in the coming years from 9% in the past five years.
In this chapter, we present 1) our latest thinking on the desirable and likely new policies in the coming few years, beyond those already announced by the government; and 2) an outlook for new environmental areas of stronger growth potential which are not yet fully appreciated by investors. These include gas-fired power generation and transportation, IGCC, and environmental monitoring instrument.
Our conclusion is that the government should and will likely raise taxes on coal (e.g., by hiking the resource tax on coal), increase levies on SO2 and NOx, introduce a carbon tax, increase subsidies to new energies such as gas and IGCC, introduce limits to car ownership growth in major cities, and raise the industrial land prices (to increase costs of polluting industrial activities and shift resources to services). These reforms should benefit the gas-related sectors, other new energies, as well as the railway/subway sectors.
Ten new policies in sight
The government’s action plans to reduce air pollution contain many detailed policies (e.g., 88 measures in Beijing) but largely in the areas of enforcing standards for SO2 and NOx emission by power plants and industrial firms, tougher fuel quality and car emission standards, as well as mandatory requirement for scraping sub-standard cars and boilers. Although structural changes in the energy mix and transport mix are also discussed, there have not yet been concrete measures that would change the incentives of producers, investors and consumers.
8 The sections of IGCC and EMI are contributed by Deutsche Bank analyst Michael Tong, Eric Cheng and Kai-ting Wong. For more details, please refer to their reports Oil-to-gas switch in transportation (Nov 11 2013) and China Industrial Primer (Aug 27 2013).
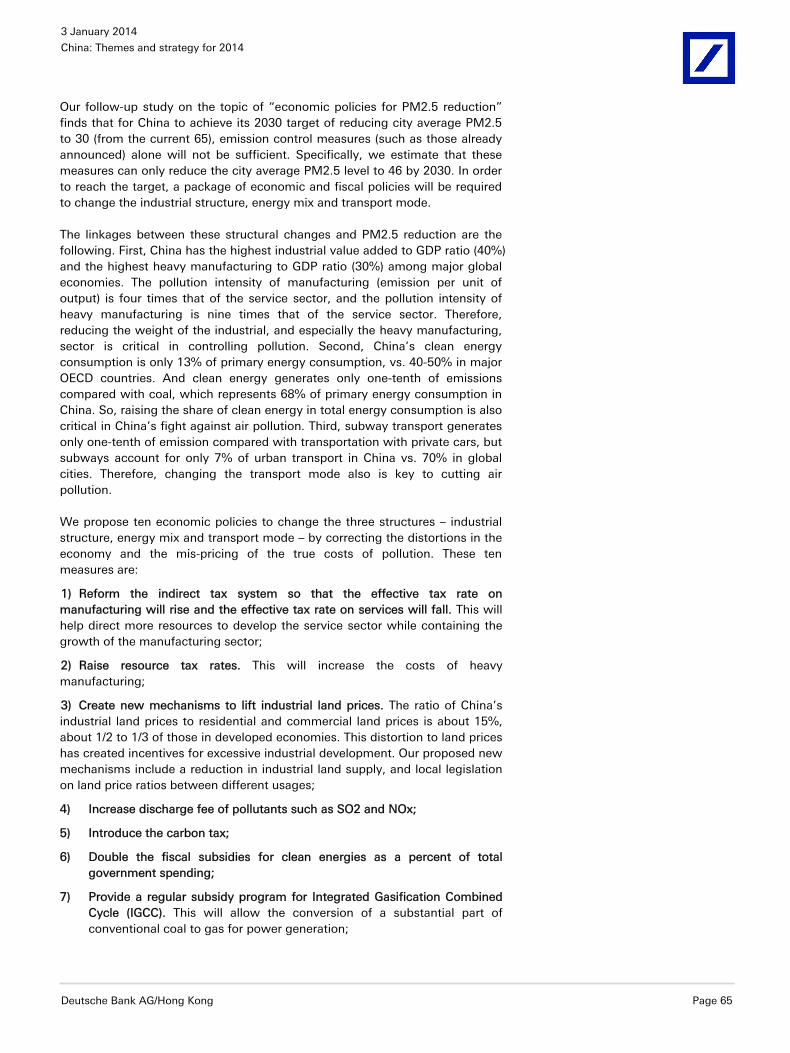
3 January 2014
China: Themes and strategy for 2014
Deutsche Bank AG/Hong Kong Page 65
Our follow-up study on the topic of “economic policies for PM2.5 reduction” finds that for China to achieve its 2030 target of reducing city average PM2.5 to 30 (from the current 65), emission control measures (such as those already announced) alone will not be sufficient. Specifically, we estimate that these measures can only reduce the city average PM2.5 level to 46 by 2030. In order to reach the target, a package of economic and fiscal policies will be required to change the industrial structure, energy mix and transport mode.
The linkages between these structural changes and PM2.5 reduction are the following. First, China has the highest industrial value added to GDP ratio (40%) and the highest heavy manufacturing to GDP ratio (30%) among major global economies. The pollution intensity of manufacturing (emission per unit of output) is four times that of the service sector, and the pollution intensity of heavy manufacturing is nine times that of the service sector. Therefore, reducing the weight of the industrial, and especially the heavy manufacturing, sector is critical in controlling pollution. Second, China’s clean energy consumption is only 13% of primary energy consumption, vs. 40-50% in major OECD countries. And clean energy generates only one-tenth of emissions compared with coal, which represents 68% of primary energy consumption in China. So, raising the share of clean energy in total energy consumption is also critical in China’s fight against air pollution. Third, subway transport generates only one-tenth of emission compared with transportation with private cars, but subways account for only 7% of urban transport in China vs. 70% in global cities. Therefore, changing the transport mode also is key to cutting air pollution.
We propose ten economic policies to change the three structures – industrial structure, energy mix and transport mode – by correcting the distortions in the economy and the mis-pricing of the true costs of pollution. These ten measures are:
1) Reform the indirect tax system so that the effective tax rate on manufacturing will rise and the effective tax rate on services will fall. This will help direct more resources to develop the service sector while containing the growth of the manufacturing sector;
2) Raise resource tax rates. This will increase the costs of heavy manufacturing;
3) Create new mechanisms to lift industrial land prices. The ratio of China’s industrial land prices to residential and commercial land prices is about 15%, about 1/2 to 1/3 of those in developed economies. This distortion to land prices has created incentives for excessive industrial development. Our proposed new mechanisms include a reduction in industrial land supply, and local legislation on land price ratios between different usages;
4) Increase discharge fee of pollutants such as SO2 and NOx;
5) Introduce the carbon tax;
6) Double the fiscal subsidies for clean energies as a percent of total government spending;
7) Provide a regular subsidy program for Integrated Gasification Combined Cycle (IGCC). This will allow the conversion of a substantial part of conventional coal to gas for power generation;
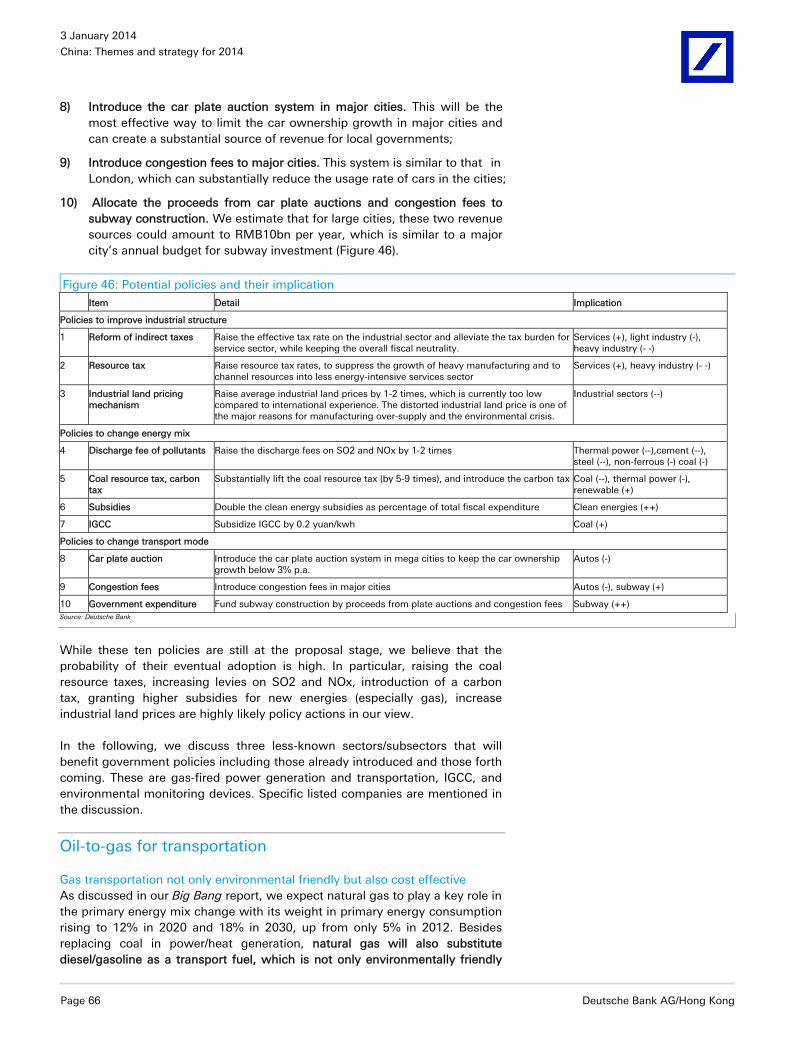
3 January 2014
China: Themes and strategy for 2014
Page 66 Deutsche Bank AG/Hong Kong
8) Introduce the car plate auction system in major cities. This will be the most effective way to limit the car ownership growth in major cities and can create a substantial source of revenue for local governments;
9) Introduce congestion fees to major cities. This system is similar to that in London, which can substantially reduce the usage rate of cars in the cities;
10) Allocate the proceeds from car plate auctions and congestion fees to subway construction. We estimate that for large cities, these two revenue sources could amount to RMB10bn per year, which is similar to a major city’s annual budget for subway investment (Figure 46).
Figure 46: Potential policies and their implication
Item Detail Implication
Policies to improve industrial structure
1 Reform of indirect taxes Raise the effective tax rate on the industrial sector and alleviate the tax burden for service sector, while keeping the overall fiscal neutrality.
Services (+), light industry (-), heavy industry (- -)
2 Resource tax Raise resource tax rates, to suppress the growth of heavy manufacturing and to channel resources into less energy-intensive services sector
Services (+), heavy industry (- -)
3 Industrial land pricing mechanism
Raise average industrial land prices by 1-2 times, which is currently too low compared to international experience. The distorted industrial land price is one of the major reasons for manufacturing over-supply and the environmental crisis.
Industrial sectors (--)
Policies to change energy mix
4 Discharge fee of pollutants Raise the discharge fees on SO2 and NOx by 1-2 times Thermal power (--),cement (--), steel (--), non-ferrous (-) coal (-)
5 Coal resource tax, carbon tax
Substantially lift the coal resource tax (by 5-9 times), and introduce the carbon tax Coal (--), thermal power (-), renewable (+)
6 Subsidies Double the clean energy subsidies as percentage of total fiscal expenditure Clean energies (++)
7 IGCC Subsidize IGCC by 0.2 yuan/kwh Coal (+)
Policies to change transport mode
8 Car plate auction Introduce the car plate auction system in mega cities to keep the car ownership growth below 3% p.a.
Autos (-)
9 Congestion fees Introduce congestion fees in major cities Autos (-), subway (+)
10 Government expenditure Fund subway construction by proceeds from plate auctions and congestion fees Subway (++) Source: Deutsche Bank
While these ten policies are still at the proposal stage, we believe that the probability of their eventual adoption is high. In particular, raising the coal resource taxes, increasing levies on SO2 and NOx, introduction of a carbon tax, granting higher subsidies for new energies (especially gas), increase industrial land prices are highly likely policy actions in our view.
In the following, we discuss three less-known sectors/subsectors that will benefit government policies including those already introduced and those forth coming. These are gas-fired power generation and transportation, IGCC, and environmental monitoring devices. Specific listed companies are mentioned in the discussion.
Oil-to-gas for transportation
Gas transportation not only environmental friendly but also cost effective As discussed in our Big Bang report, we expect natural gas to play a key role in the primary energy mix change with its weight in primary energy consumption rising to 12% in 2020 and 18% in 2030, up from only 5% in 2012. Besides replacing coal in power/heat generation, natural gas will also substitute diesel/gasoline as a transport fuel, which is not only environmentally friendly
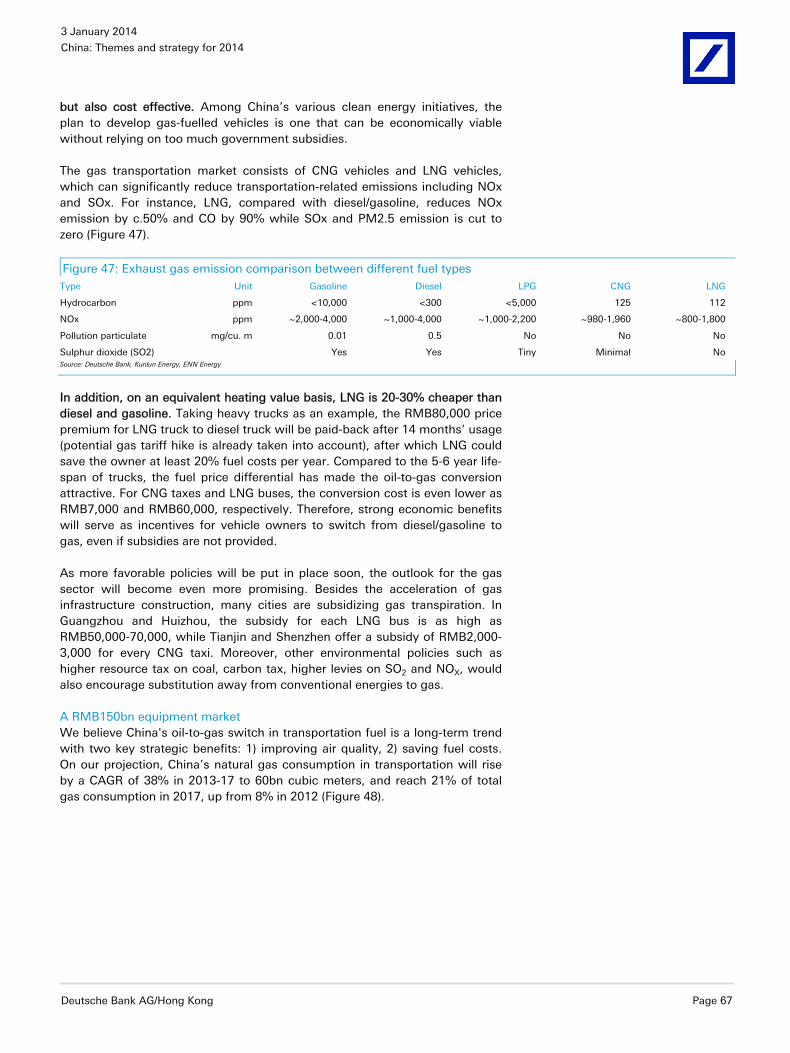
3 January 2014
China: Themes and strategy for 2014
Deutsche Bank AG/Hong Kong Page 67
but also cost effective. Among China’s various clean energy initiatives, the plan to develop gas-fuelled vehicles is one that can be economically viable without relying on too much government subsidies.
The gas transportation market consists of CNG vehicles and LNG vehicles, which can significantly reduce transportation-related emissions including NOx and SOx. For instance, LNG, compared with diesel/gasoline, reduces NOx emission by c.50% and CO by 90% while SOx and PM2.5 emission is cut to zero (Figure 47).
Figure 47: Exhaust gas emission comparison between different fuel types Type Unit Gasoline Diesel LPG CNG LNG
Hydrocarbon ppm <10,000 <300 <5,000 125 112
NOx ppm ~2,000-4,000 ~1,000-4,000 ~1,000-2,200 ~980-1,960 ~800-1,800
Pollution particulate mg/cu. m 0.01 0.5 No No No
Sulphur dioxide (SO2) Yes Yes Tiny Minimal NoSource: Deutsche Bank, Kunlun Energy, ENN Energy
In addition, on an equivalent heating value basis, LNG is 20-30% cheaper than diesel and gasoline. Taking heavy trucks as an example, the RMB80,000 price premium for LNG truck to diesel truck will be paid-back after 14 months’ usage (potential gas tariff hike is already taken into account), after which LNG could save the owner at least 20% fuel costs per year. Compared to the 5-6 year life-span of trucks, the fuel price differential has made the oil-to-gas conversion attractive. For CNG taxes and LNG buses, the conversion cost is even lower as RMB7,000 and RMB60,000, respectively. Therefore, strong economic benefits will serve as incentives for vehicle owners to switch from diesel/gasoline to gas, even if subsidies are not provided.
As more favorable policies will be put in place soon, the outlook for the gas sector will become even more promising. Besides the acceleration of gas infrastructure construction, many cities are subsidizing gas transpiration. In Guangzhou and Huizhou, the subsidy for each LNG bus is as high as RMB50,000-70,000, while Tianjin and Shenzhen offer a subsidy of RMB2,000-3,000 for every CNG taxi. Moreover, other environmental policies such as higher resource tax on coal, carbon tax, higher levies on SO2 and NOX, would also encourage substitution away from conventional energies to gas.
A RMB150bn equipment market We believe China's oil-to-gas switch in transportation fuel is a long-term trend with two key strategic benefits: 1) improving air quality, 2) saving fuel costs. On our projection, China’s natural gas consumption in transportation will rise by a CAGR of 38% in 2013-17 to 60bn cubic meters, and reach 21% of total gas consumption in 2017, up from 8% in 2012 (Figure 48).
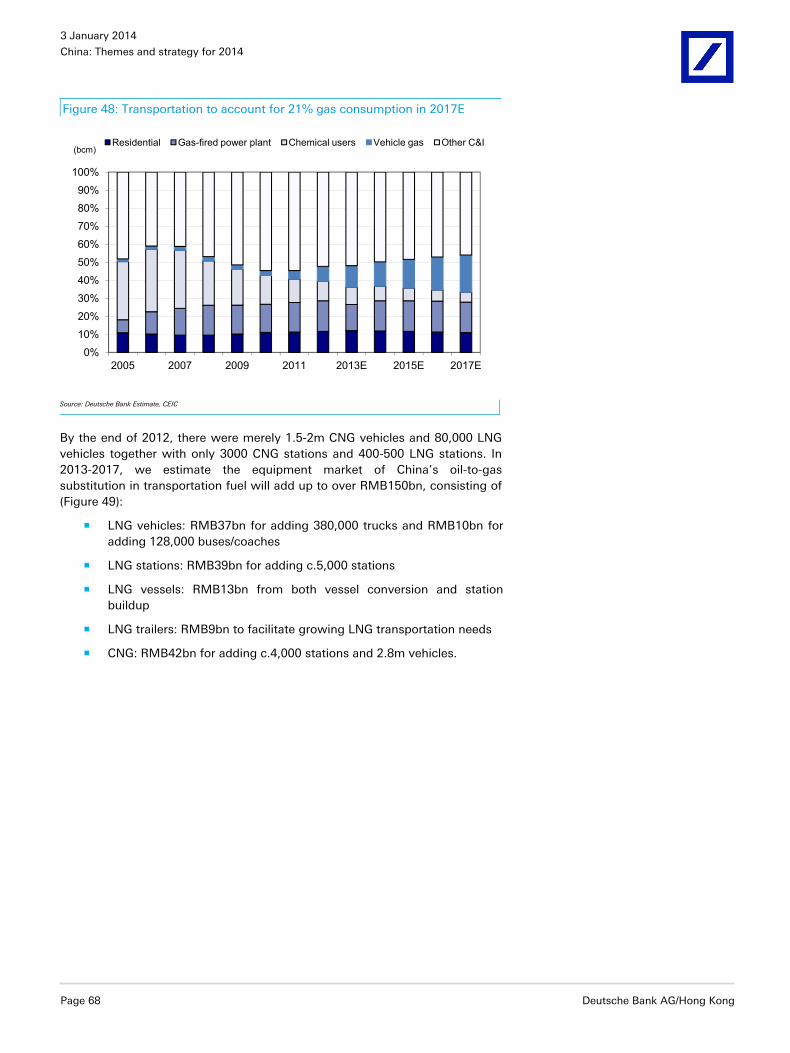
3 January 2014
China: Themes and strategy for 2014
Page 68 Deutsche Bank AG/Hong Kong
Figure 48: Transportation to account for 21% gas consumption in 2017E
0%
10%
20%
30%
40%
50%
60%
70%
80%
90%
100%
2005 2007 2009 2011 2013E 2015E 2017E
Residential Gas-fired power plant Chemical users Vehicle gas Other C&I(bcm)
Source: Deutsche Bank Estimate, CEIC
By the end of 2012, there were merely 1.5-2m CNG vehicles and 80,000 LNG vehicles together with only 3000 CNG stations and 400-500 LNG stations. In 2013-2017, we estimate the equipment market of China’s oil-to-gas substitution in transportation fuel will add up to over RMB150bn, consisting of (Figure 49):
LNG vehicles: RMB37bn for adding 380,000 trucks and RMB10bn for adding 128,000 buses/coaches
LNG stations: RMB39bn for adding c.5,000 stations
LNG vessels: RMB13bn from both vessel conversion and station buildup
LNG trailers: RMB9bn to facilitate growing LNG transportation needs
CNG: RMB42bn for adding c.4,000 stations and 2.8m vehicles.
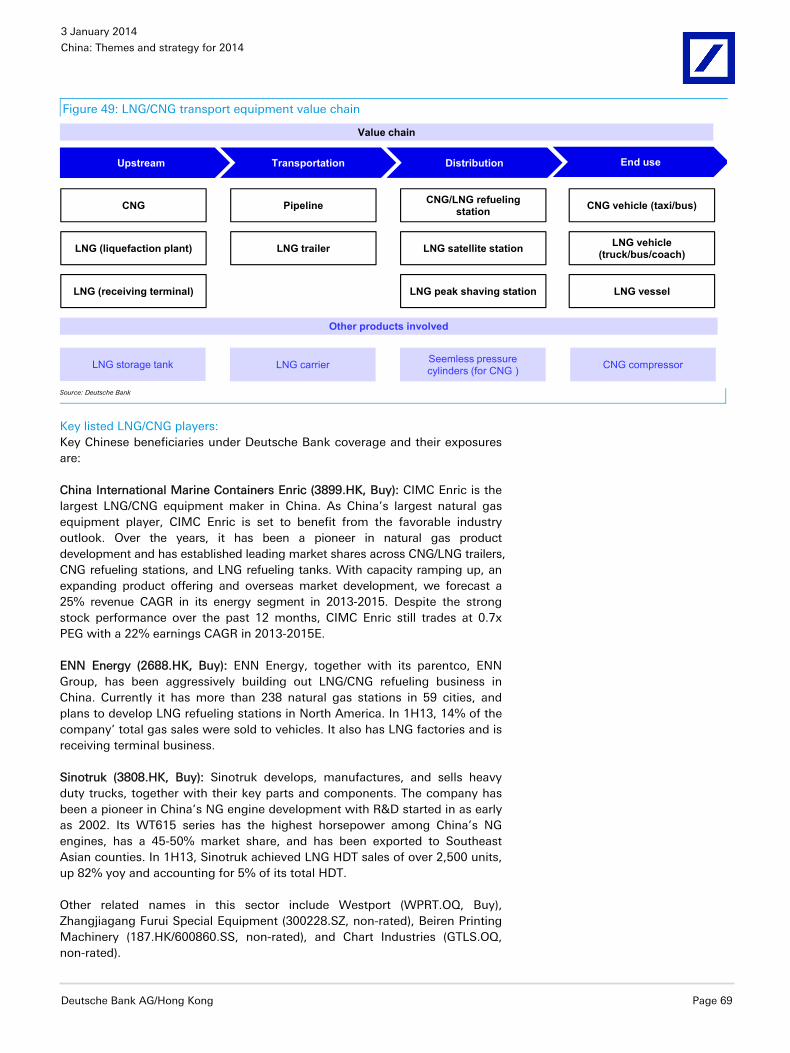
3 January 2014
China: Themes and strategy for 2014
Deutsche Bank AG/Hong Kong Page 69
Figure 49: LNG/CNG transport equipment value chain
CNG
LNG (liquefaction plant)
Pipeline
LNG (receiving terminal)
LNG trailer
CNG/LNG refueling station
LNG satellite station
LNG peak shaving station
CNG vehicle (taxi/bus)
LNG vehicle (truck/bus/coach)
LNG vessel
Upstream Transportation Distribution End use
Value chain
LNG storage tank
Other products involved
LNG carrier Seemless pressure cylinders (for CNG ) CNG compressor
Source: Deutsche Bank
Key listed LNG/CNG players: Key Chinese beneficiaries under Deutsche Bank coverage and their exposures are:
China International Marine Containers Enric (3899.HK, Buy): CIMC Enric is the largest LNG/CNG equipment maker in China. As China’s largest natural gas equipment player, CIMC Enric is set to benefit from the favorable industry outlook. Over the years, it has been a pioneer in natural gas product development and has established leading market shares across CNG/LNG trailers, CNG refueling stations, and LNG refueling tanks. With capacity ramping up, an expanding product offering and overseas market development, we forecast a 25% revenue CAGR in its energy segment in 2013-2015. Despite the strong stock performance over the past 12 months, CIMC Enric still trades at 0.7x PEG with a 22% earnings CAGR in 2013-2015E.
ENN Energy (2688.HK, Buy): ENN Energy, together with its parentco, ENN Group, has been aggressively building out LNG/CNG refueling business in China. Currently it has more than 238 natural gas stations in 59 cities, and plans to develop LNG refueling stations in North America. In 1H13, 14% of the company’ total gas sales were sold to vehicles. It also has LNG factories and is receiving terminal business.
Sinotruk (3808.HK, Buy): Sinotruk develops, manufactures, and sells heavy duty trucks, together with their key parts and components. The company has been a pioneer in China’s NG engine development with R&D started in as early as 2002. Its WT615 series has the highest horsepower among China’s NG engines, has a 45-50% market share, and has been exported to Southeast Asian counties. In 1H13, Sinotruk achieved LNG HDT sales of over 2,500 units, up 82% yoy and accounting for 5% of its total HDT.
Other related names in this sector include Westport (WPRT.OQ, Buy), Zhangjiagang Furui Special Equipment (300228.SZ, non-rated), Beiren Printing Machinery (187.HK/600860.SS, non-rated), and Chart Industries (GTLS.OQ, non-rated).
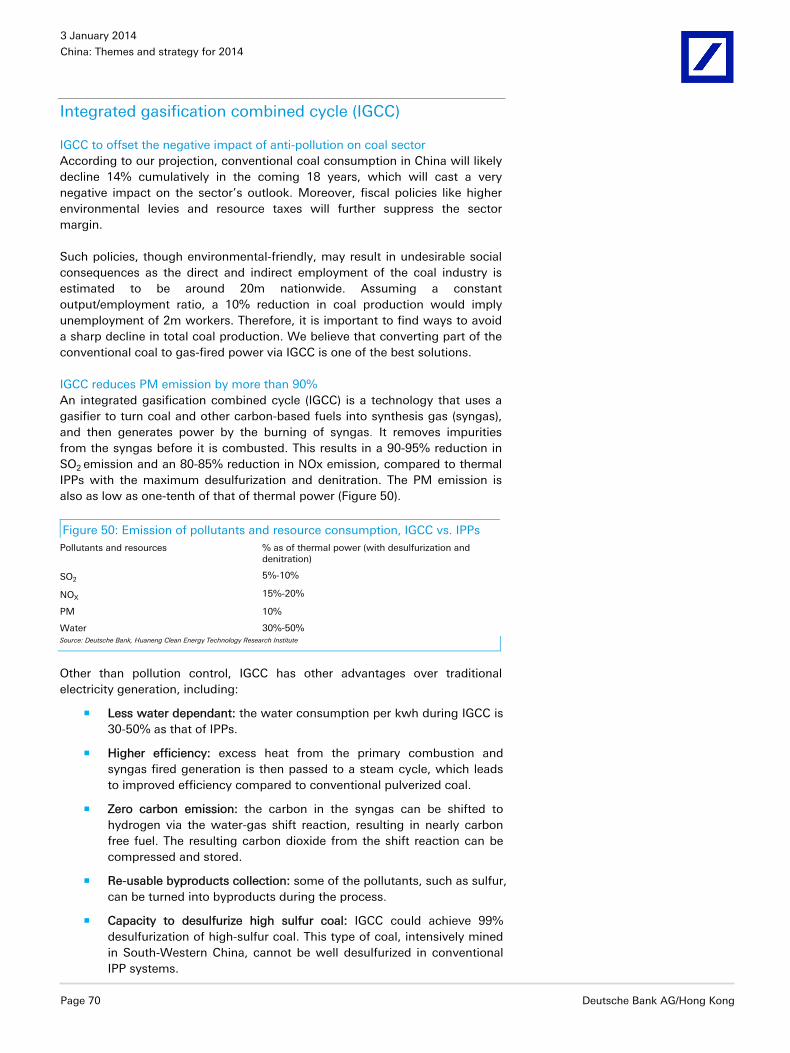
3 January 2014
China: Themes and strategy for 2014
Page 70 Deutsche Bank AG/Hong Kong
Integrated gasification combined cycle (IGCC)
IGCC to offset the negative impact of anti-pollution on coal sector According to our projection, conventional coal consumption in China will likely decline 14% cumulatively in the coming 18 years, which will cast a very negative impact on the sector’s outlook. Moreover, fiscal policies like higher environmental levies and resource taxes will further suppress the sector margin.
Such policies, though environmental-friendly, may result in undesirable social consequences as the direct and indirect employment of the coal industry is estimated to be around 20m nationwide. Assuming a constant output/employment ratio, a 10% reduction in coal production would imply unemployment of 2m workers. Therefore, it is important to find ways to avoid a sharp decline in total coal production. We believe that converting part of the conventional coal to gas-fired power via IGCC is one of the best solutions.
IGCC reduces PM emission by more than 90% An integrated gasification combined cycle (IGCC) is a technology that uses a gasifier to turn coal and other carbon-based fuels into synthesis gas (syngas), and then generates power by the burning of syngas. It removes impurities from the syngas before it is combusted. This results in a 90-95% reduction in SO2 emission and an 80-85% reduction in NOx emission, compared to thermal IPPs with the maximum desulfurization and denitration. The PM emission is also as low as one-tenth of that of thermal power (Figure 50).
Figure 50: Emission of pollutants and resource consumption, IGCC vs. IPPs Pollutants and resources % as of thermal power (with desulfurization and
denitration)
SO2 5%-10%
NOX 15%-20%
PM 10%
Water 30%-50% Source: Deutsche Bank, Huaneng Clean Energy Technology Research Institute
Other than pollution control, IGCC has other advantages over traditional electricity generation, including:
Less water dependant: the water consumption per kwh during IGCC is 30-50% as that of IPPs.
Higher efficiency: excess heat from the primary combustion and syngas fired generation is then passed to a steam cycle, which leads to improved efficiency compared to conventional pulverized coal.
Zero carbon emission: the carbon in the syngas can be shifted to hydrogen via the water-gas shift reaction, resulting in nearly carbon free fuel. The resulting carbon dioxide from the shift reaction can be compressed and stored.
Re-usable byproducts collection: some of the pollutants, such as sulfur, can be turned into byproducts during the process.
Capacity to desulfurize high sulfur coal: IGCC could achieve 99% desulfurization of high-sulfur coal. This type of coal, intensively mined in South-Western China, cannot be well desulfurized in conventional IPP systems.
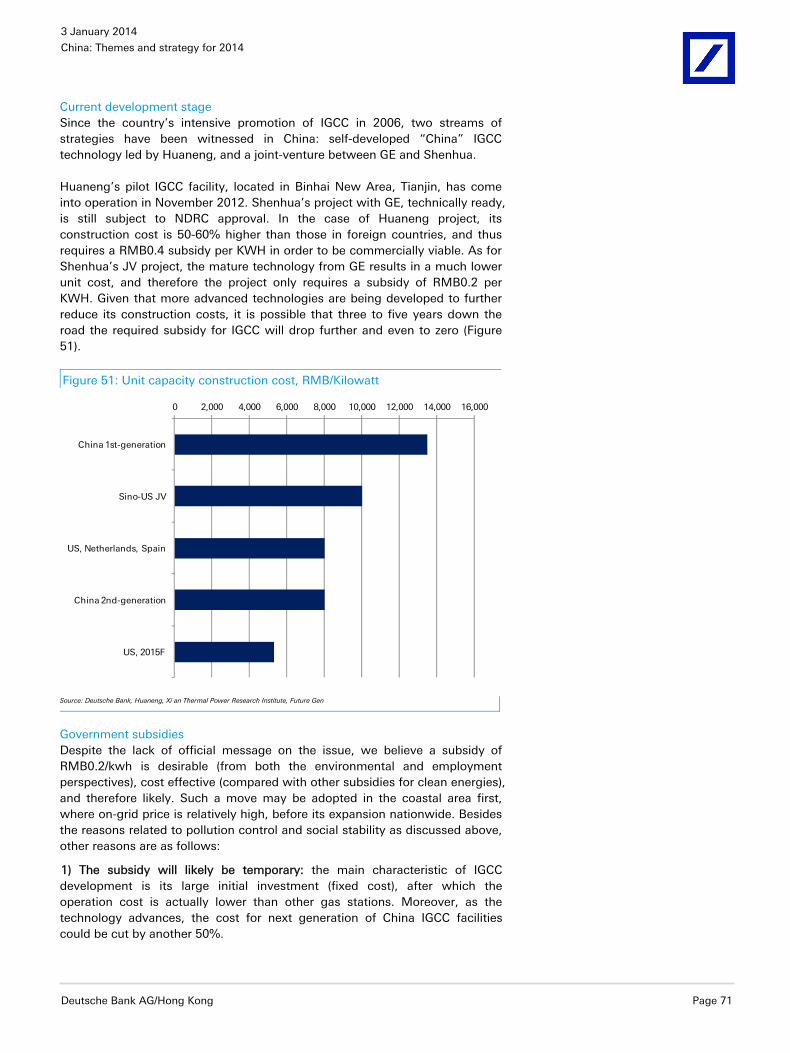
3 January 2014
China: Themes and strategy for 2014
Deutsche Bank AG/Hong Kong Page 71
Current development stage Since the country’s intensive promotion of IGCC in 2006, two streams of strategies have been witnessed in China: self-developed “China” IGCC technology led by Huaneng, and a joint-venture between GE and Shenhua.
Huaneng’s pilot IGCC facility, located in Binhai New Area, Tianjin, has come into operation in November 2012. Shenhua’s project with GE, technically ready, is still subject to NDRC approval. In the case of Huaneng project, its construction cost is 50-60% higher than those in foreign countries, and thus requires a RMB0.4 subsidy per KWH in order to be commercially viable. As for Shenhua’s JV project, the mature technology from GE results in a much lower unit cost, and therefore the project only requires a subsidy of RMB0.2 per KWH. Given that more advanced technologies are being developed to further reduce its construction costs, it is possible that three to five years down the road the required subsidy for IGCC will drop further and even to zero (Figure 51).
Figure 51: Unit capacity construction cost, RMB/Kilowatt
0 2,000 4,000 6,000 8,000 10,000 12,000 14,000 16,000
China 1st-generation
Sino-US JV
US, Netherlands, Spain
China 2nd-generation
US, 2015F
Source: Deutsche Bank, Huaneng, Xi an Thermal Power Research Institute, Future Gen
Government subsidies Despite the lack of official message on the issue, we believe a subsidy of RMB0.2/kwh is desirable (from both the environmental and employment perspectives), cost effective (compared with other subsidies for clean energies), and therefore likely. Such a move may be adopted in the coastal area first, where on-grid price is relatively high, before its expansion nationwide. Besides the reasons related to pollution control and social stability as discussed above, other reasons are as follows:
1) The subsidy will likely be temporary: the main characteristic of IGCC development is its large initial investment (fixed cost), after which the operation cost is actually lower than other gas stations. Moreover, as the technology advances, the cost for next generation of China IGCC facilities could be cut by another 50%.
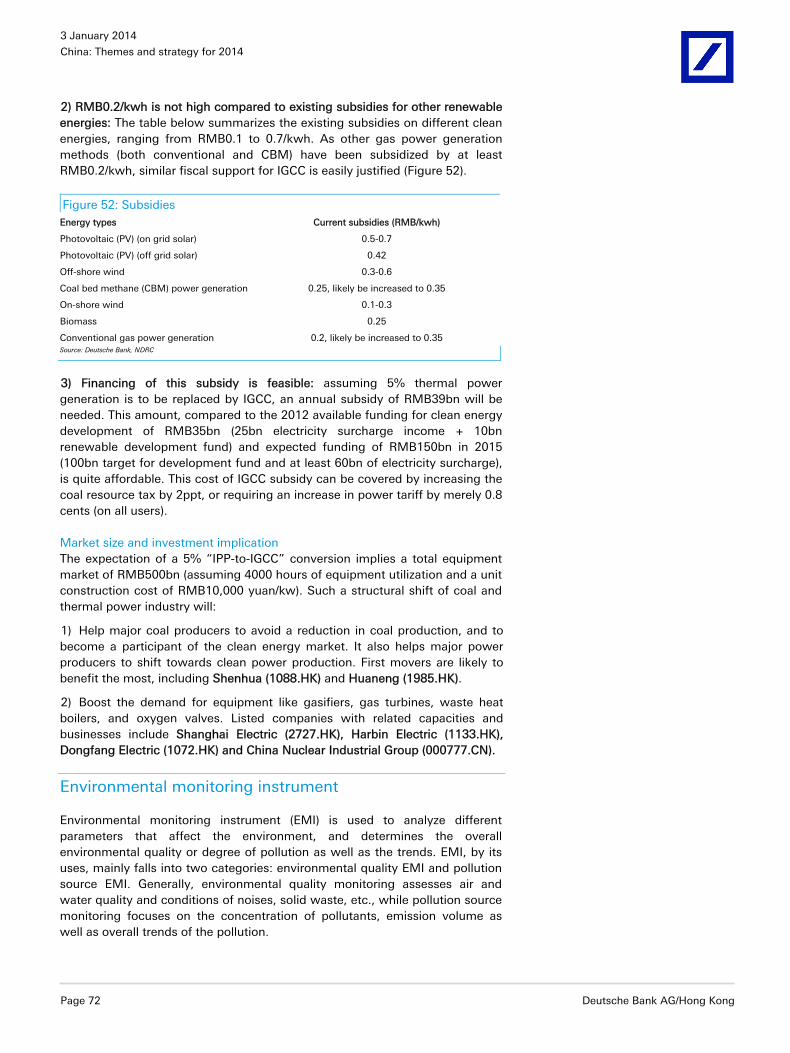
3 January 2014
China: Themes and strategy for 2014
Page 72 Deutsche Bank AG/Hong Kong
2) RMB0.2/kwh is not high compared to existing subsidies for other renewable energies: The table below summarizes the existing subsidies on different clean energies, ranging from RMB0.1 to 0.7/kwh. As other gas power generation methods (both conventional and CBM) have been subsidized by at least RMB0.2/kwh, similar fiscal support for IGCC is easily justified (Figure 52).
Figure 52: Subsidies Energy types Current subsidies (RMB/kwh)
Photovoltaic (PV) (on grid solar) 0.5-0.7
Photovoltaic (PV) (off grid solar) 0.42
Off-shore wind 0.3-0.6
Coal bed methane (CBM) power generation 0.25, likely be increased to 0.35
On-shore wind 0.1-0.3
Biomass 0.25
Conventional gas power generation 0.2, likely be increased to 0.35 Source: Deutsche Bank, NDRC
3) Financing of this subsidy is feasible: assuming 5% thermal power generation is to be replaced by IGCC, an annual subsidy of RMB39bn will be needed. This amount, compared to the 2012 available funding for clean energy development of RMB35bn (25bn electricity surcharge income + 10bn renewable development fund) and expected funding of RMB150bn in 2015 (100bn target for development fund and at least 60bn of electricity surcharge), is quite affordable. This cost of IGCC subsidy can be covered by increasing the coal resource tax by 2ppt, or requiring an increase in power tariff by merely 0.8 cents (on all users).
Market size and investment implication The expectation of a 5% “IPP-to-IGCC” conversion implies a total equipment market of RMB500bn (assuming 4000 hours of equipment utilization and a unit construction cost of RMB10,000 yuan/kw). Such a structural shift of coal and thermal power industry will:
1) Help major coal producers to avoid a reduction in coal production, and to become a participant of the clean energy market. It also helps major power producers to shift towards clean power production. First movers are likely to benefit the most, including Shenhua (1088.HK) and Huaneng (1985.HK).
2) Boost the demand for equipment like gasifiers, gas turbines, waste heat boilers, and oxygen valves. Listed companies with related capacities and businesses include Shanghai Electric (2727.HK), Harbin Electric (1133.HK), Dongfang Electric (1072.HK) and China Nuclear Industrial Group (000777.CN).
Environmental monitoring instrument
Environmental monitoring instrument (EMI) is used to analyze different parameters that affect the environment, and determines the overall environmental quality or degree of pollution as well as the trends. EMI, by its uses, mainly falls into two categories: environmental quality EMI and pollution source EMI. Generally, environmental quality monitoring assesses air and water quality and conditions of noises, solid waste, etc., while pollution source monitoring focuses on the concentration of pollutants, emission volume as well as overall trends of the pollution.
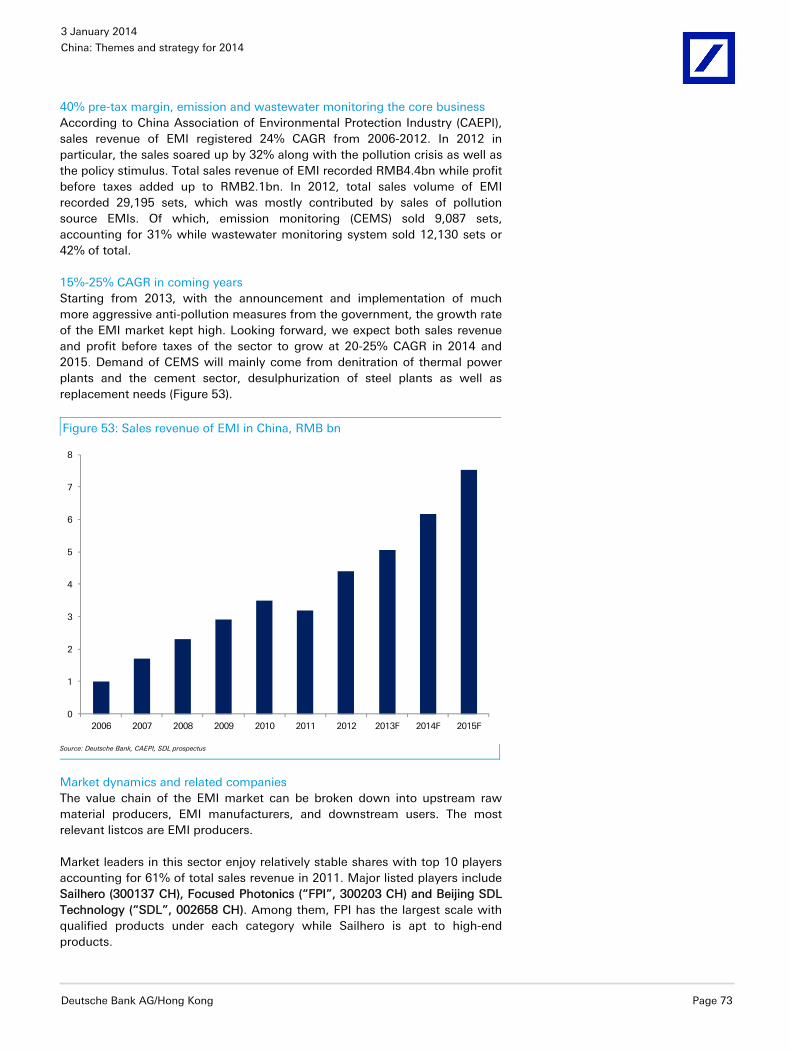
3 January 2014
China: Themes and strategy for 2014
Deutsche Bank AG/Hong Kong Page 73
40% pre-tax margin, emission and wastewater monitoring the core business According to China Association of Environmental Protection Industry (CAEPI), sales revenue of EMI registered 24% CAGR from 2006-2012. In 2012 in particular, the sales soared up by 32% along with the pollution crisis as well as the policy stimulus. Total sales revenue of EMI recorded RMB4.4bn while profit before taxes added up to RMB2.1bn. In 2012, total sales volume of EMI recorded 29,195 sets, which was mostly contributed by sales of pollution source EMIs. Of which, emission monitoring (CEMS) sold 9,087 sets, accounting for 31% while wastewater monitoring system sold 12,130 sets or 42% of total.
15%-25% CAGR in coming years Starting from 2013, with the announcement and implementation of much more aggressive anti-pollution measures from the government, the growth rate of the EMI market kept high. Looking forward, we expect both sales revenue and profit before taxes of the sector to grow at 20-25% CAGR in 2014 and 2015. Demand of CEMS will mainly come from denitration of thermal power plants and the cement sector, desulphurization of steel plants as well as replacement needs (Figure 53).
Figure 53: Sales revenue of EMI in China, RMB bn
0
1
2
3
4
5
6
7
8
2006 2007 2008 2009 2010 2011 2012 2013F 2014F 2015F
Source: Deutsche Bank, CAEPI, SDL prospectus
Market dynamics and related companies The value chain of the EMI market can be broken down into upstream raw material producers, EMI manufacturers, and downstream users. The most relevant listcos are EMI producers.
Market leaders in this sector enjoy relatively stable shares with top 10 players accounting for 61% of total sales revenue in 2011. Major listed players include Sailhero (300137 CH), Focused Photonics (“FPI”, 300203 CH) and Beijing SDL Technology (“SDL”, 002658 CH). Among them, FPI has the largest scale with qualified products under each category while Sailhero is apt to high-end products.
3 January 2014
China: Themes and strategy for 2014
Page 74 Deutsche Bank AG/Hong Kong
The two-child policy9 The “Decision on Major Issues Concerning Comprehensively Deepening Reforms” issued by the 3rd Plenum stated that the government would relax its decades-long one-child policy by allowing each couple to have two children if either the husband or the wife has no siblings. In Chinese, this is referred to as the “Dandu” policy. Soon after the release of the “Decision”, officials indicated that provinces will be allowed to decide on the timing of its implementation. We believe that most provinces will start the implementation of the “Dandu” policy from 2014. It is also likely in our view that a genuine two-child policy – permitting each family to have two children regardless of the status of the parents – will be implemented nationwide in two to three years.
This note is a condensed version of a study we conducted on the “impact of two-child policy” (see our report on Quantifying the Impact of Two-Child Policy published on 3 August 2013). It quantifies the impact of the relaxation of the one-child policy on population, growth potential, pension deficits, and demand for baby-products. The key conclusions are: the number of newborn babies will likely rise by 1.6m per year during 2014-18 compared with the base case of no-reform. In the longer run, such demographic changes should boost GDP growth by 0.2ppt during 2030-2050 and reduce the primary pension deficit by about 4% during 2040-50. In the shorter run, the reform will benefit sectors such as infant formula, diaper, baby care products, strollers, clothing, and education. Related stocks under Deutsche Bank coverage are: Mengniu, Modern Diary, Huishan, Hengan Int’l, New Oriental, TAL Education and Anta.
Current policy: “shuangdu” for most locations, “dandu” for selected rural areas
Since its introduction in 1979, China’s “family planning policy” (often called the “one-child policy”) has limited most families to having only one child and imposed financial or administrative penalties on those who violated the rule. Nonetheless, the policy is not all-encompassing, as it gives exemptions for ethics minorities, disabled people and other special social groups10. Over time, it has also been modestly relaxed in selected locations. In the following paragraphs, we describe the current family planning policies that apply to different regions.
As for ethnic Han, policies differ between urban and rural areas. In urban areas, all families are subject to the one-child policy except for couples who are both only children themselves (“shuangdu” policy). For rural areas, however, not only could the couples whose first child is female have a second chance, other options are introduced at the provincial level:
Six provinces (Xinjiang, Tibet, Qinghai, Yunnan, Hainan and Ningxia) with low population density allow households to have a second child
9 The author would like to thank Deutsche Bank Sector Analyst Anne Ling, Winnie Mak, Lydia Ling and Vivian Hao for their input in this chapter. 10 Other special groups include families with situations involving: 1) the only child of the household is disabled; 2) one of the parents is the only child of martyrs; 3) second marriage in which either the husband or the wife hasn’t had children; and 4) other minor exemptions at provincial levels.
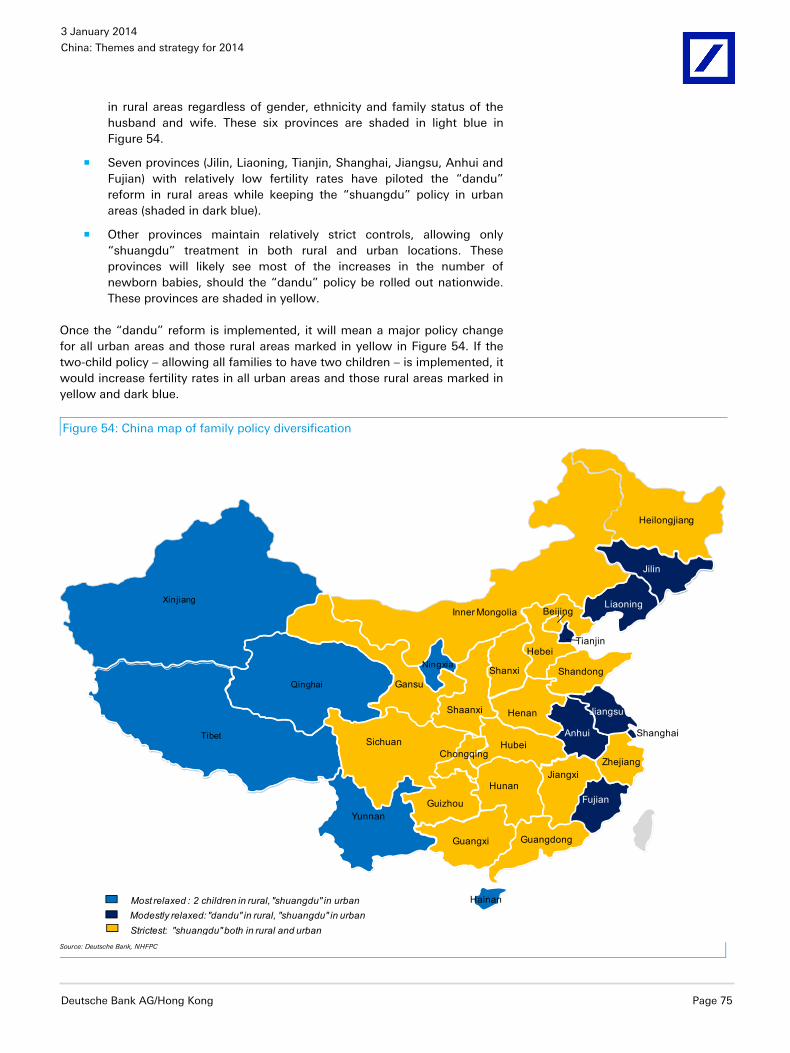
3 January 2014
China: Themes and strategy for 2014
Deutsche Bank AG/Hong Kong Page 75
in rural areas regardless of gender, ethnicity and family status of the husband and wife. These six provinces are shaded in light blue in Figure 54.
Seven provinces (Jilin, Liaoning, Tianjin, Shanghai, Jiangsu, Anhui and Fujian) with relatively low fertility rates have piloted the “dandu” reform in rural areas while keeping the “shuangdu” policy in urban areas (shaded in dark blue).
Other provinces maintain relatively strict controls, allowing only “shuangdu” treatment in both rural and urban locations. These provinces will likely see most of the increases in the number of newborn babies, should the “dandu” policy be rolled out nationwide. These provinces are shaded in yellow.
Once the “dandu” reform is implemented, it will mean a major policy change for all urban areas and those rural areas marked in yellow in Figure 54. If the two-child policy – allowing all families to have two children – is implemented, it would increase fertility rates in all urban areas and those rural areas marked in yellow and dark blue.
Figure 54: China map of family policy diversification
Yunnan
Sichuan
Gansu
Ningxia
Guangdong
Jiangsu
Zhejiang
Inner Mongolia
Shanxi
Hebei
Shaanxi Henan
Shandong
AnhuiHubei
HunanJiangxi
Fujian
Guangxi
Hainan
Guizhou
Tibet
Qinghai
Xinjiang Liaoning
Jilin
Heilongjiang
Tianjin
Beijing
Most relaxed : 2 children in rural, "shuangdu" in urbanModestly relaxed: "dandu" in rural, "shuangdu" in urbanStrictest: "shuangdu" both in rural and urban
Shanghai
Chongqing
Source: Deutsche Bank, NHFPC
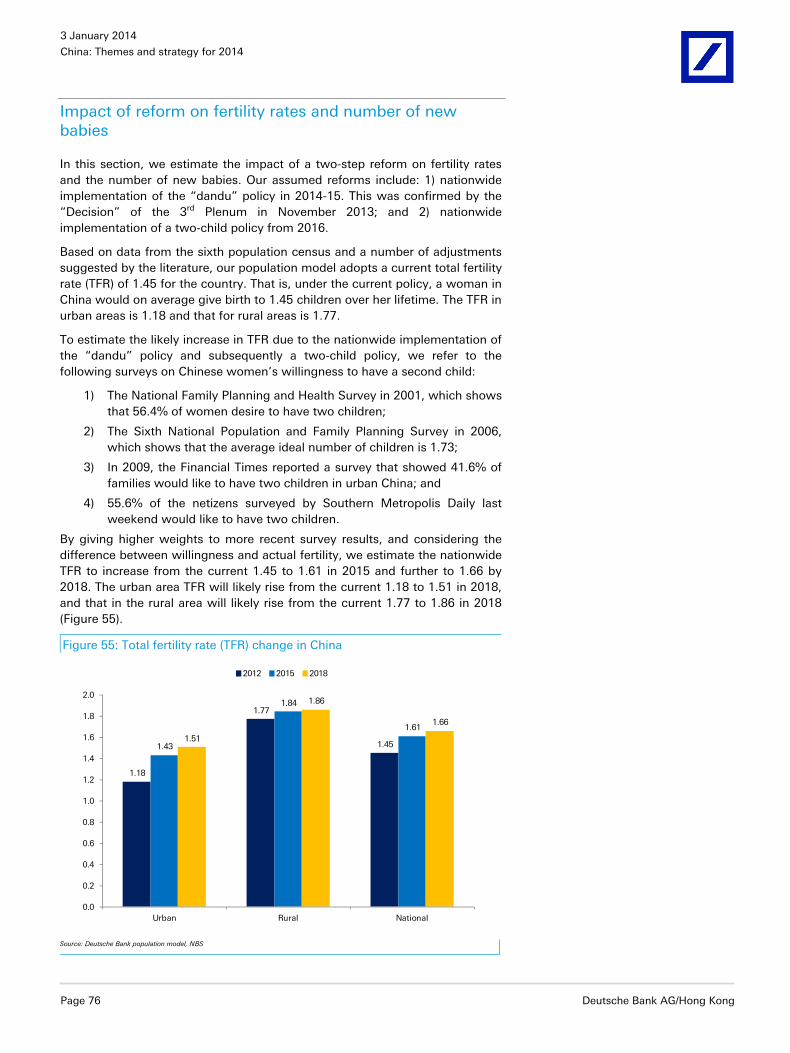
3 January 2014
China: Themes and strategy for 2014
Page 76 Deutsche Bank AG/Hong Kong
Impact of reform on fertility rates and number of new babies
In this section, we estimate the impact of a two-step reform on fertility rates and the number of new babies. Our assumed reforms include: 1) nationwide implementation of the “dandu” policy in 2014-15. This was confirmed by the “Decision” of the 3rd Plenum in November 2013; and 2) nationwide implementation of a two-child policy from 2016.
Based on data from the sixth population census and a number of adjustments suggested by the literature, our population model adopts a current total fertility rate (TFR) of 1.45 for the country. That is, under the current policy, a woman in China would on average give birth to 1.45 children over her lifetime. The TFR in urban areas is 1.18 and that for rural areas is 1.77.
To estimate the likely increase in TFR due to the nationwide implementation of the “dandu” policy and subsequently a two-child policy, we refer to the following surveys on Chinese women’s willingness to have a second child:
1) The National Family Planning and Health Survey in 2001, which shows that 56.4% of women desire to have two children;
2) The Sixth National Population and Family Planning Survey in 2006, which shows that the average ideal number of children is 1.73;
3) In 2009, the Financial Times reported a survey that showed 41.6% of families would like to have two children in urban China; and
4) 55.6% of the netizens surveyed by Southern Metropolis Daily last weekend would like to have two children.
By giving higher weights to more recent survey results, and considering the difference between willingness and actual fertility, we estimate the nationwide TFR to increase from the current 1.45 to 1.61 in 2015 and further to 1.66 by 2018. The urban area TFR will likely rise from the current 1.18 to 1.51 in 2018, and that in the rural area will likely rise from the current 1.77 to 1.86 in 2018 (Figure 55).
Figure 55: Total fertility rate (TFR) change in China
1.18
1.77
1.451.43
1.84
1.611.51
1.86
1.66
0.0
0.2
0.4
0.6
0.8
1.0
1.2
1.4
1.6
1.8
2.0
Urban Rural National
2012 2015 2018
Source: Deutsche Bank population model, NBS
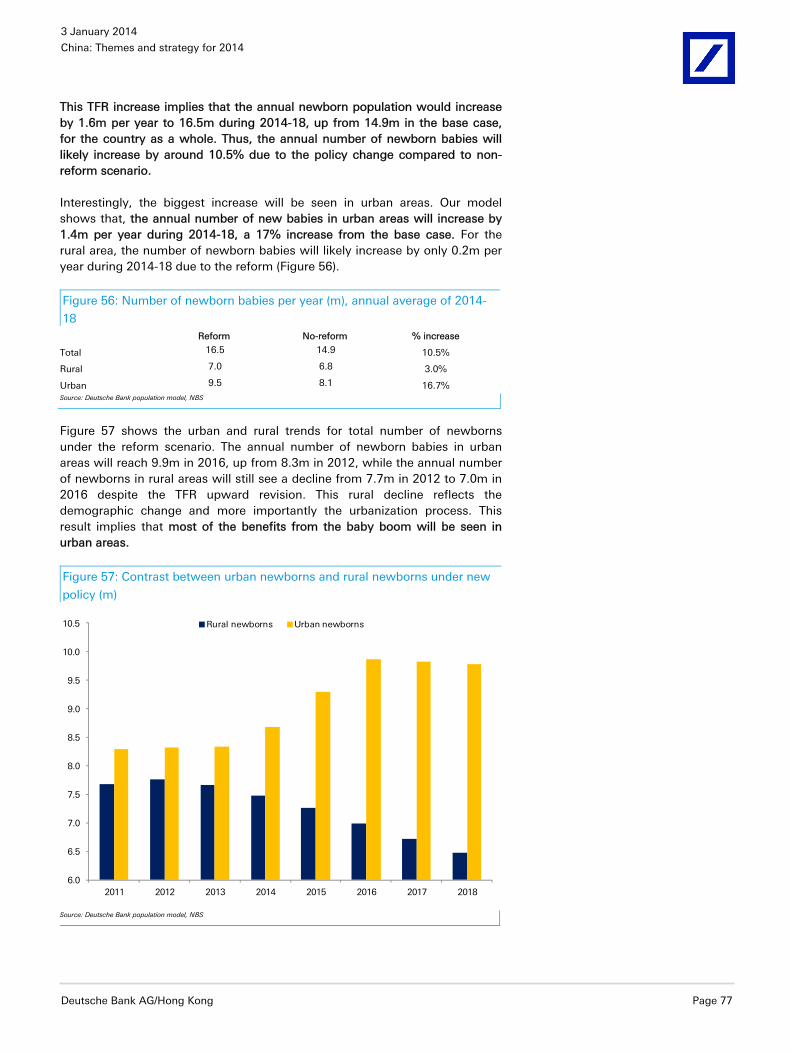
3 January 2014
China: Themes and strategy for 2014
Deutsche Bank AG/Hong Kong Page 77
This TFR increase implies that the annual newborn population would increase by 1.6m per year to 16.5m during 2014-18, up from 14.9m in the base case, for the country as a whole. Thus, the annual number of newborn babies will likely increase by around 10.5% due to the policy change compared to non-reform scenario.
Interestingly, the biggest increase will be seen in urban areas. Our model shows that, the annual number of new babies in urban areas will increase by 1.4m per year during 2014-18, a 17% increase from the base case. For the rural area, the number of newborn babies will likely increase by only 0.2m per year during 2014-18 due to the reform (Figure 56).
Figure 56: Number of newborn babies per year (m), annual average of 2014-
18 Reform No-reform % increase
Total 16.5 14.9 10.5%
Rural 7.0 6.8 3.0%
Urban 9.5 8.1 16.7% Source: Deutsche Bank population model, NBS
Figure 57 shows the urban and rural trends for total number of newborns under the reform scenario. The annual number of newborn babies in urban areas will reach 9.9m in 2016, up from 8.3m in 2012, while the annual number of newborns in rural areas will still see a decline from 7.7m in 2012 to 7.0m in 2016 despite the TFR upward revision. This rural decline reflects the demographic change and more importantly the urbanization process. This result implies that most of the benefits from the baby boom will be seen in urban areas.
Figure 57: Contrast between urban newborns and rural newborns under new
policy (m)
6.0
6.5
7.0
7.5
8.0
8.5
9.0
9.5
10.0
10.5
2011 2012 2013 2014 2015 2016 2017 2018
Rural newborns Urban newborns
Source: Deutsche Bank population model, NBS
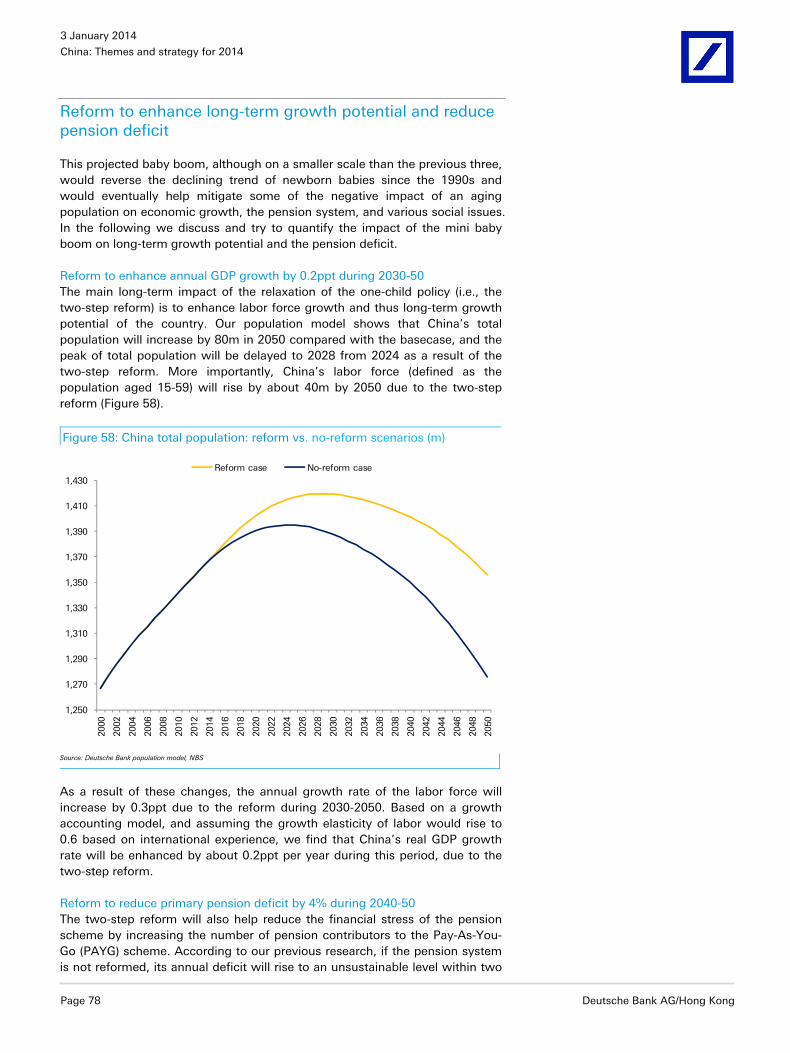
3 January 2014
China: Themes and strategy for 2014
Page 78 Deutsche Bank AG/Hong Kong
Reform to enhance long-term growth potential and reduce pension deficit
This projected baby boom, although on a smaller scale than the previous three, would reverse the declining trend of newborn babies since the 1990s and would eventually help mitigate some of the negative impact of an aging population on economic growth, the pension system, and various social issues. In the following we discuss and try to quantify the impact of the mini baby boom on long-term growth potential and the pension deficit.
Reform to enhance annual GDP growth by 0.2ppt during 2030-50 The main long-term impact of the relaxation of the one-child policy (i.e., the two-step reform) is to enhance labor force growth and thus long-term growth potential of the country. Our population model shows that China’s total population will increase by 80m in 2050 compared with the basecase, and the peak of total population will be delayed to 2028 from 2024 as a result of the two-step reform. More importantly, China’s labor force (defined as the population aged 15-59) will rise by about 40m by 2050 due to the two-step reform (Figure 58).
Figure 58: China total population: reform vs. no-reform scenarios (m)
1,250
1,270
1,290
1,310
1,330
1,350
1,370
1,390
1,410
1,430
2000
2002
2004
2006
2008
2010
2012
2014
2016
2018
2020
2022
2024
2026
2028
2030
2032
2034
2036
2038
2040
2042
2044
2046
2048
2050
Reform case No-reform case
Source: Deutsche Bank population model, NBS
As a result of these changes, the annual growth rate of the labor force will increase by 0.3ppt due to the reform during 2030-2050. Based on a growth accounting model, and assuming the growth elasticity of labor would rise to 0.6 based on international experience, we find that China’s real GDP growth rate will be enhanced by about 0.2ppt per year during this period, due to the two-step reform.
Reform to reduce primary pension deficit by 4% during 2040-50 The two-step reform will also help reduce the financial stress of the pension scheme by increasing the number of pension contributors to the Pay-As-You-Go (PAYG) scheme. According to our previous research, if the pension system is not reformed, its annual deficit will rise to an unsustainable level within two
3 January 2014
China: Themes and strategy for 2014
Deutsche Bank AG/Hong Kong Page 79
to three decades. The reform of the one-child policy will begin to modestly mitigate the pension deficit from the 2030s, and the benefits will become gradually more visible after 2040. Our model shows that, during 2040-50, the annual primary pension deficit (excluding interest payment) of the PAYG pension scheme could be reduced by about 4% due to the 2-step reform. Obviously, this is not a main solution to the pension sustainability issue, but it helps. The more fundamental solutions to China’s pension problem, as pointed out in our research on China National Balance Sheet (马骏、张晓蓉、李治国等著
《中国国家资产负债表研究 》,社会科学文献出版社,2012) include the increase in the retirement age and transfer of SOE shares to the pension system.
Social benefits of the reform In addition to the economic and financial benefits mentioned, a relaxation of the one-child policy could also have many social benefits. Here are a few examples.
1. Employers and educators have found that single children raised after the 1980s are often spoiled by their parents, unable to cope with difficulties and have trouble cooperating. Lessons learned from these “little emperors and empresses” are that more than one child per family may help enhance the social skills of the country’s future generation.
2. The unbalanced gender ratio is another side effect of the one-child policy, as many parents tried to have a boy by any means. This resulted in a newborn male to female ratio of 117:100 in 2012. Men unable to find a match have become a source of social instability. This social pressure could be eased by reforming the one-child policy.
3. Having more children can make it more feasible for families to undertake long-term care of disabled elderly people. This reduces the burden on the single child, and allows elderly people to spend more time with their kids.
Sectoral and company level implications
Given our estimate of an annual average increase of 1.6m in the number of newborn babies (i.e. 11% increase from the base case) during 2014-18, the immediate positive impact of this reform would be on sectors including infant formula and nutrition, diaper, baby clothing and trolleys and education.
Consumable baby products like infant formula, diaper and other personal care products will be the key beneficiaries. Roughly, an 11% increase in the number of newborn babies would translate into a similar increase in demand. Taking into account that most of the additional babies will be born in urban areas with parents of relatively higher purchasing power, its positive impact on the value of baby products could be greater than 11%. Major players like Mengniu (2319.HK), Modern Diary (1117.HK), Huishan (6863.HK), Biostime (1112.HK), Yashili (1230.HK), Hengan Int’l (1044.HK) and Prince Frog (1259.HK) fall into this category.
For durable goods like baby strollers, clothing and footwear, the impact might be slightly smaller, as the additional infants are all second children of the family, and could use the stroller and wear the
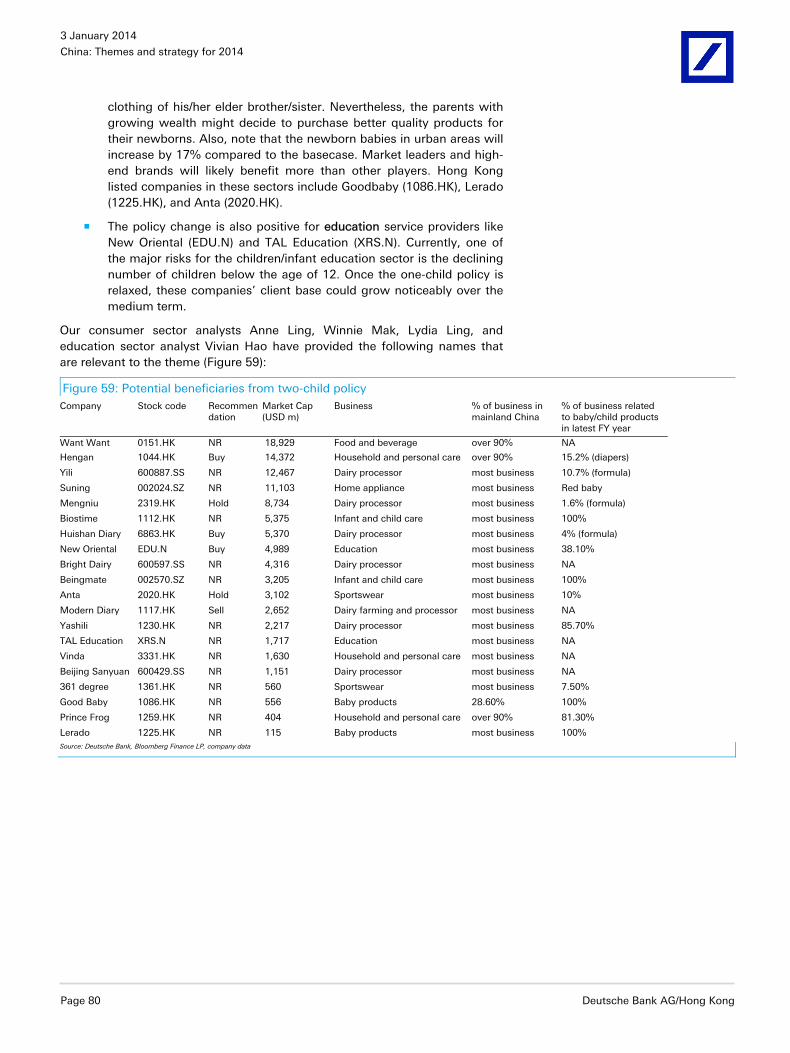
3 January 2014
China: Themes and strategy for 2014
Page 80 Deutsche Bank AG/Hong Kong
clothing of his/her elder brother/sister. Nevertheless, the parents with growing wealth might decide to purchase better quality products for their newborns. Also, note that the newborn babies in urban areas will increase by 17% compared to the basecase. Market leaders and high-end brands will likely benefit more than other players. Hong Kong listed companies in these sectors include Goodbaby (1086.HK), Lerado (1225.HK), and Anta (2020.HK).
The policy change is also positive for education service providers like New Oriental (EDU.N) and TAL Education (XRS.N). Currently, one of the major risks for the children/infant education sector is the declining number of children below the age of 12. Once the one-child policy is relaxed, these companies’ client base could grow noticeably over the medium term.
Our consumer sector analysts Anne Ling, Winnie Mak, Lydia Ling, and education sector analyst Vivian Hao have provided the following names that are relevant to the theme (Figure 59):
Figure 59: Potential beneficiaries from two-child policy Company Stock code Recommen
dation Market Cap (USD m)
Business % of business in mainland China
% of business related to baby/child products in latest FY year
Want Want 0151.HK NR 18,929 Food and beverage over 90% NA
Hengan 1044.HK Buy 14,372 Household and personal care over 90% 15.2% (diapers)
Yili 600887.SS NR 12,467 Dairy processor most business 10.7% (formula)
Suning 002024.SZ NR 11,103 Home appliance most business Red baby
Mengniu 2319.HK Hold 8,734 Dairy processor most business 1.6% (formula)
Biostime 1112.HK NR 5,375 Infant and child care most business 100%
Huishan Diary 6863.HK Buy 5,370 Dairy processor most business 4% (formula)
New Oriental EDU.N Buy 4,989 Education most business 38.10%
Bright Dairy 600597.SS NR 4,316 Dairy processor most business NA
Beingmate 002570.SZ NR 3,205 Infant and child care most business 100%
Anta 2020.HK Hold 3,102 Sportswear most business 10%
Modern Diary 1117.HK Sell 2,652 Dairy farming and processor most business NA
Yashili 1230.HK NR 2,217 Dairy processor most business 85.70%
TAL Education XRS.N NR 1,717 Education most business NA
Vinda 3331.HK NR 1,630 Household and personal care most business NA
Beijing Sanyuan 600429.SS NR 1,151 Dairy processor most business NA
361 degree 1361.HK NR 560 Sportswear most business 7.50%
Good Baby 1086.HK NR 556 Baby products 28.60% 100%
Prince Frog 1259.HK NR 404 Household and personal care over 90% 81.30%
Lerado 1225.HK NR 115 Baby products most business 100% Source: Deutsche Bank, Bloomberg Finance LP, company data
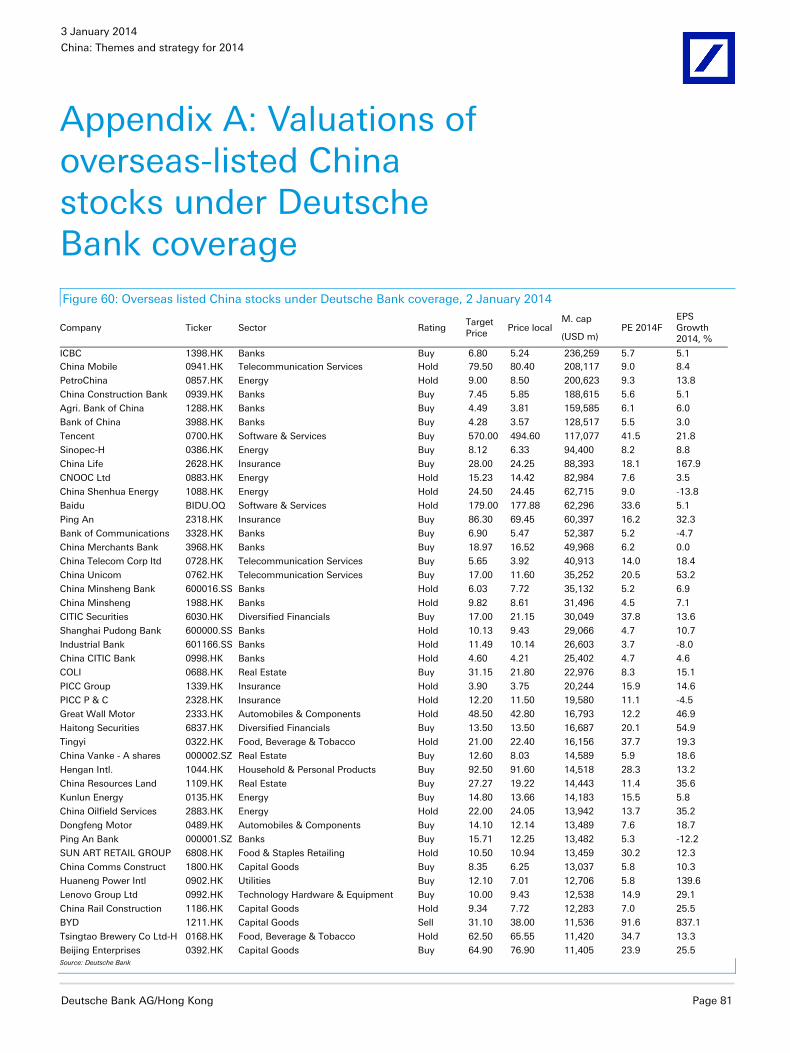
3 January 2014
China: Themes and strategy for 2014
Deutsche Bank AG/Hong Kong Page 81
Appendix A: Valuations of overseas-listed China stocks under Deutsche Bank coverage Figure 60: Overseas listed China stocks under Deutsche Bank coverage, 2 January 2014
Company Ticker Sector Rating Target Price
Price local M. cap
(USD m) PE 2014F
EPS Growth 2014, %
ICBC 1398.HK Banks Buy 6.80 5.24 236,259 5.7 5.1 China Mobile 0941.HK Telecommunication Services Hold 79.50 80.40 208,117 9.0 8.4
PetroChina 0857.HK Energy Hold 9.00 8.50 200,623 9.3 13.8
China Construction Bank 0939.HK Banks Buy 7.45 5.85 188,615 5.6 5.1
Agri. Bank of China 1288.HK Banks Buy 4.49 3.81 159,585 6.1 6.0
Bank of China 3988.HK Banks Buy 4.28 3.57 128,517 5.5 3.0
Tencent 0700.HK Software & Services Buy 570.00 494.60 117,077 41.5 21.8
Sinopec-H 0386.HK Energy Buy 8.12 6.33 94,400 8.2 8.8
China Life 2628.HK Insurance Buy 28.00 24.25 88,393 18.1 167.9
CNOOC Ltd 0883.HK Energy Hold 15.23 14.42 82,984 7.6 3.5
China Shenhua Energy 1088.HK Energy Hold 24.50 24.45 62,715 9.0 -13.8
Baidu BIDU.OQ Software & Services Hold 179.00 177.88 62,296 33.6 5.1
Ping An 2318.HK Insurance Buy 86.30 69.45 60,397 16.2 32.3
Bank of Communications 3328.HK Banks Buy 6.90 5.47 52,387 5.2 -4.7
China Merchants Bank 3968.HK Banks Buy 18.97 16.52 49,968 6.2 0.0
China Telecom Corp ltd 0728.HK Telecommunication Services Buy 5.65 3.92 40,913 14.0 18.4
China Unicom 0762.HK Telecommunication Services Buy 17.00 11.60 35,252 20.5 53.2
China Minsheng Bank 600016.SS Banks Hold 6.03 7.72 35,132 5.2 6.9
China Minsheng 1988.HK Banks Hold 9.82 8.61 31,496 4.5 7.1
CITIC Securities 6030.HK Diversified Financials Buy 17.00 21.15 30,049 37.8 13.6
Shanghai Pudong Bank 600000.SS Banks Hold 10.13 9.43 29,066 4.7 10.7
Industrial Bank 601166.SS Banks Hold 11.49 10.14 26,603 3.7 -8.0
China CITIC Bank 0998.HK Banks Hold 4.60 4.21 25,402 4.7 4.6
COLI 0688.HK Real Estate Buy 31.15 21.80 22,976 8.3 15.1
PICC Group 1339.HK Insurance Hold 3.90 3.75 20,244 15.9 14.6
PICC P & C 2328.HK Insurance Hold 12.20 11.50 19,580 11.1 -4.5
Great Wall Motor 2333.HK Automobiles & Components Hold 48.50 42.80 16,793 12.2 46.9
Haitong Securities 6837.HK Diversified Financials Buy 13.50 13.50 16,687 20.1 54.9
Tingyi 0322.HK Food, Beverage & Tobacco Hold 21.00 22.40 16,156 37.7 19.3
China Vanke - A shares 000002.SZ Real Estate Buy 12.60 8.03 14,589 5.9 18.6
Hengan Intl. 1044.HK Household & Personal Products Buy 92.50 91.60 14,518 28.3 13.2
China Resources Land 1109.HK Real Estate Buy 27.27 19.22 14,443 11.4 35.6
Kunlun Energy 0135.HK Energy Buy 14.80 13.66 14,183 15.5 5.8
China Oilfield Services 2883.HK Energy Hold 22.00 24.05 13,942 13.7 35.2
Dongfeng Motor 0489.HK Automobiles & Components Buy 14.10 12.14 13,489 7.6 18.7
Ping An Bank 000001.SZ Banks Buy 15.71 12.25 13,482 5.3 -12.2
SUN ART RETAIL GROUP 6808.HK Food & Staples Retailing Hold 10.50 10.94 13,459 30.2 12.3
China Comms Construct 1800.HK Capital Goods Buy 8.35 6.25 13,037 5.8 10.3
Huaneng Power Intl 0902.HK Utilities Buy 12.10 7.01 12,706 5.8 139.6
Lenovo Group Ltd 0992.HK Technology Hardware & Equipment Buy 10.00 9.43 12,538 14.9 29.1
China Rail Construction 1186.HK Capital Goods Hold 9.34 7.72 12,283 7.0 25.5
BYD 1211.HK Capital Goods Sell 31.10 38.00 11,536 91.6 837.1
Tsingtao Brewery Co Ltd-H 0168.HK Food, Beverage & Tobacco Hold 62.50 65.55 11,420 34.7 13.3
Beijing Enterprises 0392.HK Capital Goods Buy 64.90 76.90 11,405 23.9 25.5 Source: Deutsche Bank
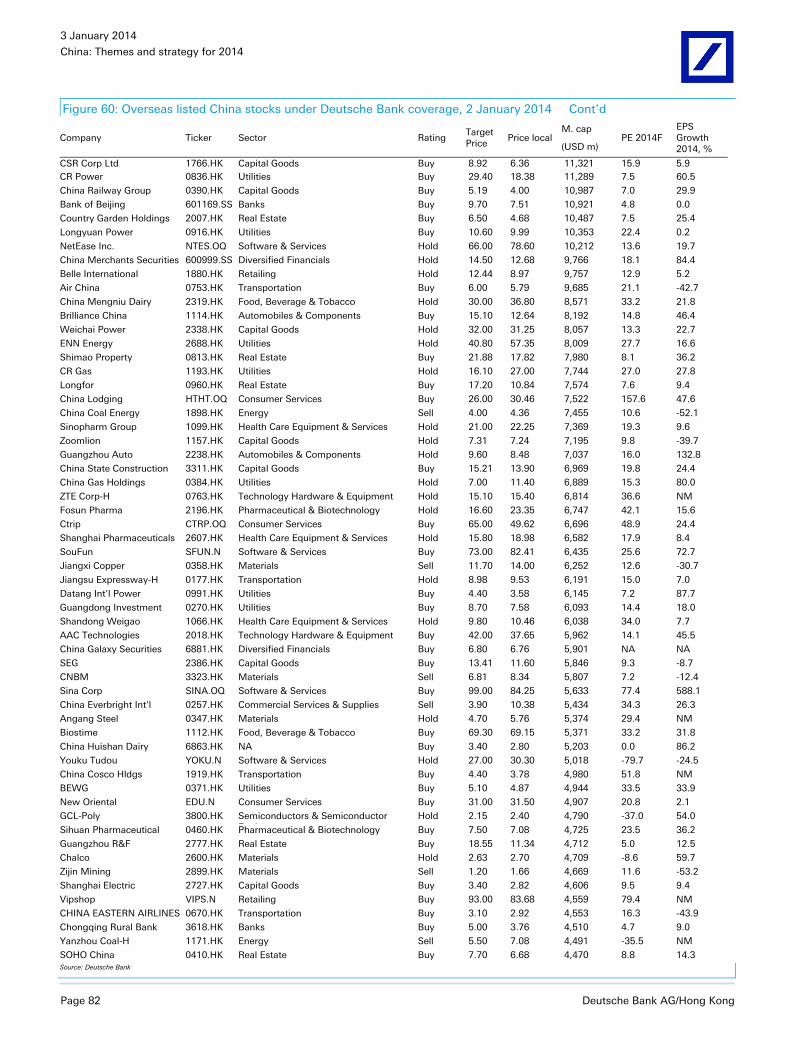
3 January 2014
China: Themes and strategy for 2014
Page 82 Deutsche Bank AG/Hong Kong
Figure 60: Overseas listed China stocks under Deutsche Bank coverage, 2 January 2014 Cont’d
Company Ticker Sector Rating Target Price
Price local M. cap
(USD m) PE 2014F
EPS Growth 2014, %
CSR Corp Ltd 1766.HK Capital Goods Buy 8.92 6.36 11,321 15.9 5.9 CR Power 0836.HK Utilities Buy 29.40 18.38 11,289 7.5 60.5
China Railway Group 0390.HK Capital Goods Buy 5.19 4.00 10,987 7.0 29.9
Bank of Beijing 601169.SS Banks Buy 9.70 7.51 10,921 4.8 0.0
Country Garden Holdings 2007.HK Real Estate Buy 6.50 4.68 10,487 7.5 25.4
Longyuan Power 0916.HK Utilities Buy 10.60 9.99 10,353 22.4 0.2
NetEase Inc. NTES.OQ Software & Services Hold 66.00 78.60 10,212 13.6 19.7
China Merchants Securities 600999.SS Diversified Financials Hold 14.50 12.68 9,766 18.1 84.4
Belle International 1880.HK Retailing Hold 12.44 8.97 9,757 12.9 5.2
Air China 0753.HK Transportation Buy 6.00 5.79 9,685 21.1 -42.7
China Mengniu Dairy 2319.HK Food, Beverage & Tobacco Hold 30.00 36.80 8,571 33.2 21.8
Brilliance China 1114.HK Automobiles & Components Buy 15.10 12.64 8,192 14.8 46.4
Weichai Power 2338.HK Capital Goods Hold 32.00 31.25 8,057 13.3 22.7
ENN Energy 2688.HK Utilities Hold 40.80 57.35 8,009 27.7 16.6
Shimao Property 0813.HK Real Estate Buy 21.88 17.82 7,980 8.1 36.2
CR Gas 1193.HK Utilities Hold 16.10 27.00 7,744 27.0 27.8
Longfor 0960.HK Real Estate Buy 17.20 10.84 7,574 7.6 9.4
China Lodging HTHT.OQ Consumer Services Buy 26.00 30.46 7,522 157.6 47.6
China Coal Energy 1898.HK Energy Sell 4.00 4.36 7,455 10.6 -52.1
Sinopharm Group 1099.HK Health Care Equipment & Services Hold 21.00 22.25 7,369 19.3 9.6
Zoomlion 1157.HK Capital Goods Hold 7.31 7.24 7,195 9.8 -39.7
Guangzhou Auto 2238.HK Automobiles & Components Hold 9.60 8.48 7,037 16.0 132.8
China State Construction 3311.HK Capital Goods Buy 15.21 13.90 6,969 19.8 24.4
China Gas Holdings 0384.HK Utilities Hold 7.00 11.40 6,889 15.3 80.0
ZTE Corp-H 0763.HK Technology Hardware & Equipment Hold 15.10 15.40 6,814 36.6 NM
Fosun Pharma 2196.HK Pharmaceutical & Biotechnology Hold 16.60 23.35 6,747 42.1 15.6
Ctrip CTRP.OQ Consumer Services Buy 65.00 49.62 6,696 48.9 24.4
Shanghai Pharmaceuticals 2607.HK Health Care Equipment & Services Hold 15.80 18.98 6,582 17.9 8.4
SouFun SFUN.N Software & Services Buy 73.00 82.41 6,435 25.6 72.7
Jiangxi Copper 0358.HK Materials Sell 11.70 14.00 6,252 12.6 -30.7
Jiangsu Expressway-H 0177.HK Transportation Hold 8.98 9.53 6,191 15.0 7.0
Datang Int'l Power 0991.HK Utilities Buy 4.40 3.58 6,145 7.2 87.7
Guangdong Investment 0270.HK Utilities Buy 8.70 7.58 6,093 14.4 18.0
Shandong Weigao 1066.HK Health Care Equipment & Services Hold 9.80 10.46 6,038 34.0 7.7
AAC Technologies 2018.HK Technology Hardware & Equipment Buy 42.00 37.65 5,962 14.1 45.5
China Galaxy Securities 6881.HK Diversified Financials Buy 6.80 6.76 5,901 NA NA
SEG 2386.HK Capital Goods Buy 13.41 11.60 5,846 9.3 -8.7
CNBM 3323.HK Materials Sell 6.81 8.34 5,807 7.2 -12.4
Sina Corp SINA.OQ Software & Services Buy 99.00 84.25 5,633 77.4 588.1
China Everbright Int'l 0257.HK Commercial Services & Supplies Sell 3.90 10.38 5,434 34.3 26.3
Angang Steel 0347.HK Materials Hold 4.70 5.76 5,374 29.4 NM
Biostime 1112.HK Food, Beverage & Tobacco Buy 69.30 69.15 5,371 33.2 31.8
China Huishan Dairy 6863.HK NA Buy 3.40 2.80 5,203 0.0 86.2
Youku Tudou YOKU.N Software & Services Hold 27.00 30.30 5,018 -79.7 -24.5
China Cosco Hldgs 1919.HK Transportation Buy 4.40 3.78 4,980 51.8 NM
BEWG 0371.HK Utilities Buy 5.10 4.87 4,944 33.5 33.9
New Oriental EDU.N Consumer Services Buy 31.00 31.50 4,907 20.8 2.1
GCL-Poly 3800.HK Semiconductors & Semiconductor E i
Hold 2.15 2.40 4,790 -37.0 54.0
Sihuan Pharmaceutical 0460.HK Pharmaceutical & Biotechnology Buy 7.50 7.08 4,725 23.5 36.2
Guangzhou R&F 2777.HK Real Estate Buy 18.55 11.34 4,712 5.0 12.5
Chalco 2600.HK Materials Hold 2.63 2.70 4,709 -8.6 59.7
Zijin Mining 2899.HK Materials Sell 1.20 1.66 4,669 11.6 -53.2
Shanghai Electric 2727.HK Capital Goods Buy 3.40 2.82 4,606 9.5 9.4
Vipshop VIPS.N Retailing Buy 93.00 83.68 4,559 79.4 NM
CHINA EASTERN AIRLINES 0670.HK Transportation Buy 3.10 2.92 4,553 16.3 -43.9
Chongqing Rural Bank 3618.HK Banks Buy 5.00 3.76 4,510 4.7 9.0
Yanzhou Coal-H 1171.HK Energy Sell 5.50 7.08 4,491 -35.5 NM
SOHO China 0410.HK Real Estate Buy 7.70 6.68 4,470 8.8 14.3 Source: Deutsche Bank
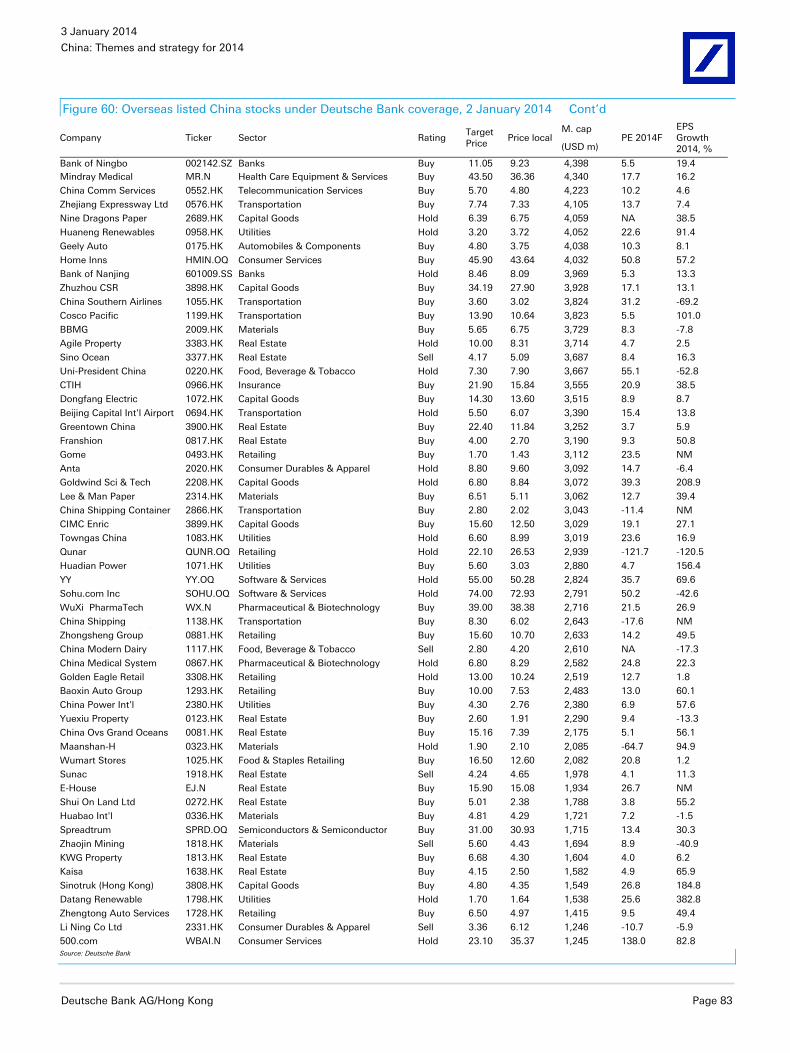
3 January 2014
China: Themes and strategy for 2014
Deutsche Bank AG/Hong Kong Page 83
Figure 60: Overseas listed China stocks under Deutsche Bank coverage, 2 January 2014 Cont’d
Company Ticker Sector Rating Target Price
Price local M. cap
(USD m) PE 2014F
EPS Growth 2014, %
Bank of Ningbo 002142.SZ Banks Buy 11.05 9.23 4,398 5.5 19.4 Mindray Medical MR.N Health Care Equipment & Services Buy 43.50 36.36 4,340 17.7 16.2
China Comm Services 0552.HK Telecommunication Services Buy 5.70 4.80 4,223 10.2 4.6
Zhejiang Expressway Ltd 0576.HK Transportation Buy 7.74 7.33 4,105 13.7 7.4
Nine Dragons Paper 2689.HK Capital Goods Hold 6.39 6.75 4,059 NA 38.5
Huaneng Renewables 0958.HK Utilities Hold 3.20 3.72 4,052 22.6 91.4
Geely Auto 0175.HK Automobiles & Components Buy 4.80 3.75 4,038 10.3 8.1
Home Inns HMIN.OQ Consumer Services Buy 45.90 43.64 4,032 50.8 57.2
Bank of Nanjing 601009.SS Banks Hold 8.46 8.09 3,969 5.3 13.3
Zhuzhou CSR 3898.HK Capital Goods Buy 34.19 27.90 3,928 17.1 13.1
China Southern Airlines 1055.HK Transportation Buy 3.60 3.02 3,824 31.2 -69.2
Cosco Pacific 1199.HK Transportation Buy 13.90 10.64 3,823 5.5 101.0
BBMG 2009.HK Materials Buy 5.65 6.75 3,729 8.3 -7.8
Agile Property 3383.HK Real Estate Hold 10.00 8.31 3,714 4.7 2.5
Sino Ocean 3377.HK Real Estate Sell 4.17 5.09 3,687 8.4 16.3
Uni-President China 0220.HK Food, Beverage & Tobacco Hold 7.30 7.90 3,667 55.1 -52.8
CTIH 0966.HK Insurance Buy 21.90 15.84 3,555 20.9 38.5
Dongfang Electric 1072.HK Capital Goods Buy 14.30 13.60 3,515 8.9 8.7
Beijing Capital Int'l Airport 0694.HK Transportation Hold 5.50 6.07 3,390 15.4 13.8
Greentown China 3900.HK Real Estate Buy 22.40 11.84 3,252 3.7 5.9
Franshion 0817.HK Real Estate Buy 4.00 2.70 3,190 9.3 50.8
Gome 0493.HK Retailing Buy 1.70 1.43 3,112 23.5 NM
Anta 2020.HK Consumer Durables & Apparel Hold 8.80 9.60 3,092 14.7 -6.4
Goldwind Sci & Tech 2208.HK Capital Goods Hold 6.80 8.84 3,072 39.3 208.9
Lee & Man Paper 2314.HK Materials Buy 6.51 5.11 3,062 12.7 39.4
China Shipping Container 2866.HK Transportation Buy 2.80 2.02 3,043 -11.4 NM
CIMC Enric 3899.HK Capital Goods Buy 15.60 12.50 3,029 19.1 27.1
Towngas China 1083.HK Utilities Hold 6.60 8.99 3,019 23.6 16.9
Qunar QUNR.OQ Retailing Hold 22.10 26.53 2,939 -121.7 -120.5
Huadian Power 1071.HK Utilities Buy 5.60 3.03 2,880 4.7 156.4
YY YY.OQ Software & Services Hold 55.00 50.28 2,824 35.7 69.6
Sohu.com Inc SOHU.OQ Software & Services Hold 74.00 72.93 2,791 50.2 -42.6
WuXi PharmaTech WX.N Pharmaceutical & Biotechnology Buy 39.00 38.38 2,716 21.5 26.9
China Shipping D l C L d
1138.HK Transportation Buy 8.30 6.02 2,643 -17.6 NM
Zhongsheng Group 0881.HK Retailing Buy 15.60 10.70 2,633 14.2 49.5
China Modern Dairy 1117.HK Food, Beverage & Tobacco Sell 2.80 4.20 2,610 NA -17.3
China Medical System 0867.HK Pharmaceutical & Biotechnology Hold 6.80 8.29 2,582 24.8 22.3
Golden Eagle Retail 3308.HK Retailing Hold 13.00 10.24 2,519 12.7 1.8
Baoxin Auto Group 1293.HK Retailing Buy 10.00 7.53 2,483 13.0 60.1
China Power Int'l 2380.HK Utilities Buy 4.30 2.76 2,380 6.9 57.6
Yuexiu Property 0123.HK Real Estate Buy 2.60 1.91 2,290 9.4 -13.3
China Ovs Grand Oceans 0081.HK Real Estate Buy 15.16 7.39 2,175 5.1 56.1
Maanshan-H 0323.HK Materials Hold 1.90 2.10 2,085 -64.7 94.9
Wumart Stores 1025.HK Food & Staples Retailing Buy 16.50 12.60 2,082 20.8 1.2
Sunac 1918.HK Real Estate Sell 4.24 4.65 1,978 4.1 11.3
E-House EJ.N Real Estate Buy 15.90 15.08 1,934 26.7 NM
Shui On Land Ltd 0272.HK Real Estate Buy 5.01 2.38 1,788 3.8 55.2
Huabao Int'l 0336.HK Materials Buy 4.81 4.29 1,721 7.2 -1.5
Spreadtrum SPRD.OQ Semiconductors & Semiconductor E i
Buy 31.00 30.93 1,715 13.4 30.3
Zhaojin Mining 1818.HK Materials Sell 5.60 4.43 1,694 8.9 -40.9
KWG Property 1813.HK Real Estate Buy 6.68 4.30 1,604 4.0 6.2
Kaisa 1638.HK Real Estate Buy 4.15 2.50 1,582 4.9 65.9
Sinotruk (Hong Kong) 3808.HK Capital Goods Buy 4.80 4.35 1,549 26.8 184.8
Datang Renewable 1798.HK Utilities Hold 1.70 1.64 1,538 25.6 382.8
Zhengtong Auto Services 1728.HK Retailing Buy 6.50 4.97 1,415 9.5 49.4
Li Ning Co Ltd 2331.HK Consumer Durables & Apparel Sell 3.36 6.12 1,246 -10.7 -5.9
500.com WBAI.N Consumer Services Hold 23.10 35.37 1,245 138.0 82.8 Source: Deutsche Bank
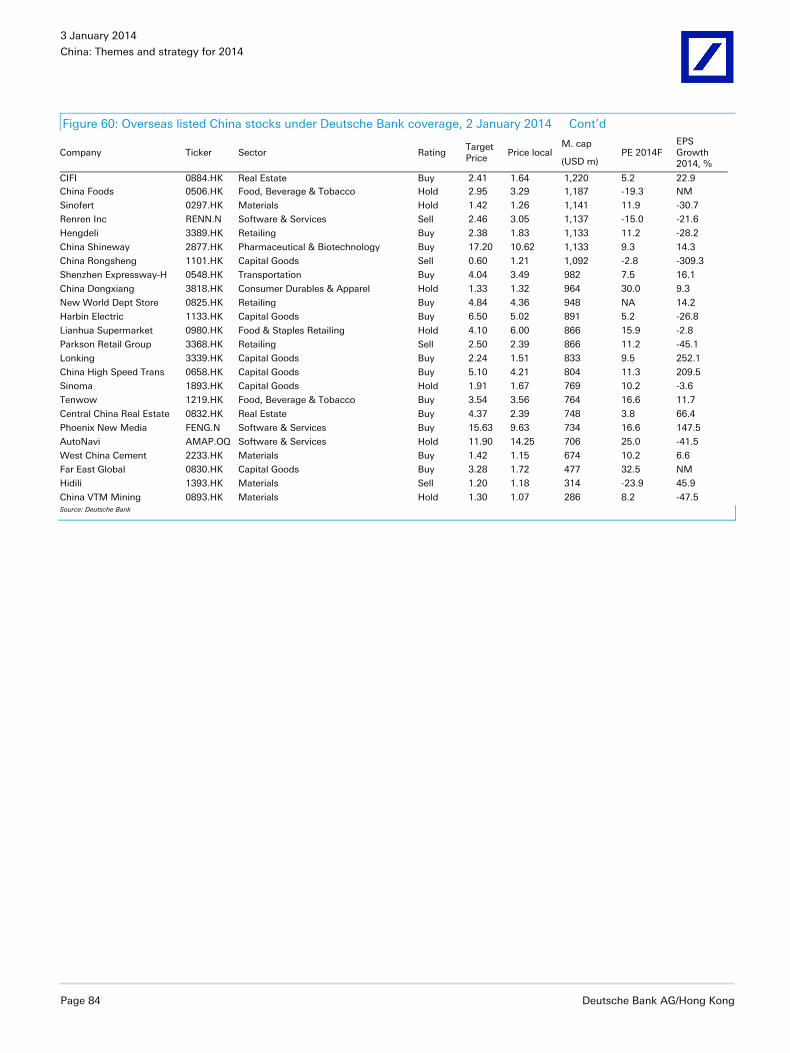
3 January 2014
China: Themes and strategy for 2014
Page 84 Deutsche Bank AG/Hong Kong
Figure 60: Overseas listed China stocks under Deutsche Bank coverage, 2 January 2014 Cont’d
Company Ticker Sector Rating Target Price
Price local M. cap
(USD m) PE 2014F
EPS Growth 2014, %
CIFI 0884.HK Real Estate Buy 2.41 1.64 1,220 5.2 22.9 China Foods 0506.HK Food, Beverage & Tobacco Hold 2.95 3.29 1,187 -19.3 NM
Sinofert 0297.HK Materials Hold 1.42 1.26 1,141 11.9 -30.7
Renren Inc RENN.N Software & Services Sell 2.46 3.05 1,137 -15.0 -21.6
Hengdeli 3389.HK Retailing Buy 2.38 1.83 1,133 11.2 -28.2
China Shineway 2877.HK Pharmaceutical & Biotechnology Buy 17.20 10.62 1,133 9.3 14.3
China Rongsheng 1101.HK Capital Goods Sell 0.60 1.21 1,092 -2.8 -309.3
Shenzhen Expressway-H 0548.HK Transportation Buy 4.04 3.49 982 7.5 16.1
China Dongxiang 3818.HK Consumer Durables & Apparel Hold 1.33 1.32 964 30.0 9.3
New World Dept Store Chi
0825.HK Retailing Buy 4.84 4.36 948 NA 14.2
Harbin Electric 1133.HK Capital Goods Buy 6.50 5.02 891 5.2 -26.8
Lianhua Supermarket 0980.HK Food & Staples Retailing Hold 4.10 6.00 866 15.9 -2.8
Parkson Retail Group 3368.HK Retailing Sell 2.50 2.39 866 11.2 -45.1
Lonking 3339.HK Capital Goods Buy 2.24 1.51 833 9.5 252.1
China High Speed Trans 0658.HK Capital Goods Buy 5.10 4.21 804 11.3 209.5
Sinoma 1893.HK Capital Goods Hold 1.91 1.67 769 10.2 -3.6
Tenwow 1219.HK Food, Beverage & Tobacco Buy 3.54 3.56 764 16.6 11.7
Central China Real Estate 0832.HK Real Estate Buy 4.37 2.39 748 3.8 66.4
Phoenix New Media FENG.N Software & Services Buy 15.63 9.63 734 16.6 147.5
AutoNavi AMAP.OQ Software & Services Hold 11.90 14.25 706 25.0 -41.5
West China Cement 2233.HK Materials Buy 1.42 1.15 674 10.2 6.6
Far East Global 0830.HK Capital Goods Buy 3.28 1.72 477 32.5 NM
Hidili 1393.HK Materials Sell 1.20 1.18 314 -23.9 45.9
China VTM Mining 0893.HK Materials Hold 1.30 1.07 286 8.2 -47.5 Source: Deutsche Bank
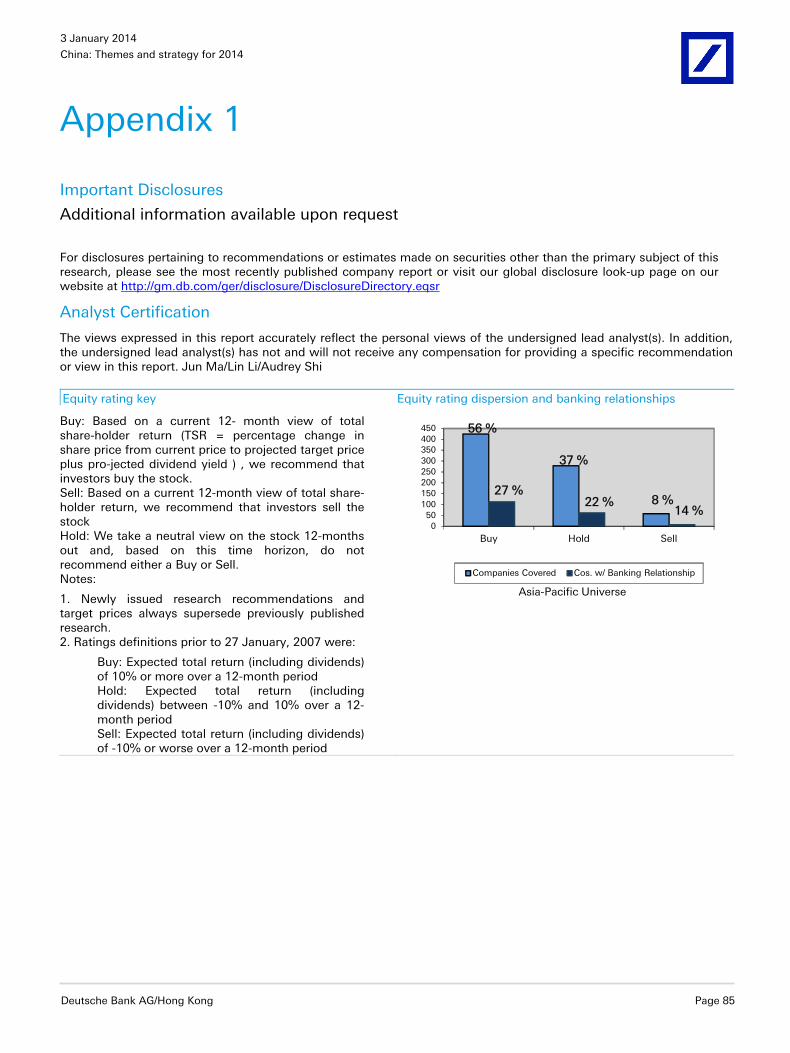
3 January 2014
China: Themes and strategy for 2014
Deutsche Bank AG/Hong Kong Page 85
Appendix 1
Important Disclosures Additional information available upon request For disclosures pertaining to recommendations or estimates made on securities other than the primary subject of this research, please see the most recently published company report or visit our global disclosure look-up page on our website at http://gm.db.com/ger/disclosure/DisclosureDirectory.eqsr Analyst Certification
The views expressed in this report accurately reflect the personal views of the undersigned lead analyst(s). In addition, the undersigned lead analyst(s) has not and will not receive any compensation for providing a specific recommendation or view in this report. Jun Ma/Lin Li/Audrey Shi Equity rating key Equity rating dispersion and banking relationships
Buy: Based on a current 12- month view of total share-holder return (TSR = percentage change in share price from current price to projected target price plus pro-jected dividend yield ) , we recommend that investors buy the stock. Sell: Based on a current 12-month view of total share-holder return, we recommend that investors sell the stock Hold: We take a neutral view on the stock 12-months out and, based on this time horizon, do not recommend either a Buy or Sell. Notes:
1. Newly issued research recommendations and target prices always supersede previously published research. 2. Ratings definitions prior to 27 January, 2007 were:
Buy: Expected total return (including dividends) of 10% or more over a 12-month period Hold: Expected total return (including dividends) between -10% and 10% over a 12-month period Sell: Expected total return (including dividends) of -10% or worse over a 12-month period
56 %
37 %
8 %27 %
22 %14 %
050
100150200250300350400450
Buy Hold Sell
Asia-Pacific Universe
Companies Covered Cos. w/ Banking Relationship
3 January 2014
China: Themes and strategy for 2014
Page 86 Deutsche Bank AG/Hong Kong
Regulatory Disclosures
1. Important Additional Conflict Disclosures
Aside from within this report, important conflict disclosures can also be found at https://gm.db.com/equities under the "Disclosures Lookup" and "Legal" tabs. Investors are strongly encouraged to review this information before investing.
2. Short-Term Trade Ideas
Deutsche Bank equity research analysts sometimes have shorter-term trade ideas (known as SOLAR ideas) that are consistent or inconsistent with Deutsche Bank's existing longer term ratings. These trade ideas can be found at the SOLAR link at http://gm.db.com.
3. Country-Specific Disclosures
Australia and New Zealand: This research, and any access to it, is intended only for "wholesale clients" within the meaning of the Australian Corporations Act and New Zealand Financial Advisors Act respectively. Brazil: The views expressed above accurately reflect personal views of the authors about the subject company(ies) and its(their) securities, including in relation to Deutsche Bank. The compensation of the equity research analyst(s) is indirectly affected by revenues deriving from the business and financial transactions of Deutsche Bank. In cases where at least one Brazil based analyst (identified by a phone number starting with +55 country code) has taken part in the preparation of this research report, the Brazil based analyst whose name appears first assumes primary responsibility for its content from a Brazilian regulatory perspective and for its compliance with CVM Instruction # 483. EU countries: Disclosures relating to our obligations under MiFiD can be found at http://www.globalmarkets.db.com/riskdisclosures. Japan: Disclosures under the Financial Instruments and Exchange Law: Company name - Deutsche Securities Inc. Registration number - Registered as a financial instruments dealer by the Head of the Kanto Local Finance Bureau (Kinsho) No. 117. Member of associations: JSDA, Type II Financial Instruments Firms Association, The Financial Futures Association of Japan, Japan Investment Advisers Association. Commissions and risks involved in stock transactions - for stock transactions, we charge stock commissions and consumption tax by multiplying the transaction amount by the commission rate agreed with each customer. Stock transactions can lead to losses as a result of share price fluctuations and other factors. Transactions in foreign stocks can lead to additional losses stemming from foreign exchange fluctuations. "Moody's", "Standard & Poor's", and "Fitch" mentioned in this report are not registered credit rating agencies in Japan unless “Japan” or "Nippon" is specifically designated in the name of the entity. Reports on Japanese listed companies not written by analysts of Deutsche Securities Inc. (DSI) are written by Deutsche Bank Group's analysts with the coverage companies specified by DSI. Russia: This information, interpretation and opinions submitted herein are not in the context of, and do not constitute, any appraisal or evaluation activity requiring a license in the Russian Federation.
GRCM2013PROD031046
David Folkerts-Landau
Group Chief Economist Member of the Group Executive Committee
Guy Ashton
Global Chief Operating Officer Research
Marcel Cassard Global Head
FICC Research & Global Macro Economics
Richard Smith and Steve Pollard Co-Global Heads Equity Research
Michael Spencer Regional Head
Asia Pacific Research
Ralf Hoffmann Regional Head
Deutsche Bank Research, Germany
Andreas Neubauer Regional Head
Equity Research, Germany
Steve Pollard Regional Head
Americas Research
International locations
Deutsche Bank AG Deutsche Bank Place Level 16 Corner of Hunter & Phillip Streets Sydney, NSW 2000 Australia Tel: (61) 2 8258 1234
Deutsche Bank AG Große Gallusstraße 10-14 60272 Frankfurt am Main Germany Tel: (49) 69 910 00
Deutsche Bank AG Filiale Hongkong International Commerce Centre, 1 Austin Road West,Kowloon, Hong Kong Tel: (852) 2203 8888
Deutsche Securities Inc. 2-11-1 Nagatacho Sanno Park Tower Chiyoda-ku, Tokyo 100-6171 Japan Tel: (81) 3 5156 6770
Deutsche Bank AG London 1 Great Winchester Street London EC2N 2EQ United Kingdom Tel: (44) 20 7545 8000
Deutsche Bank Securities Inc. 60 Wall Street New York, NY 10005 United States of America Tel: (1) 212 250 2500
Global Disclaimer The information and opinions in this report were prepared by Deutsche Bank AG or one of its affiliates (collectively "Deutsche Bank"). The information herein is believed to be reliable and has been obtained from public sources believed to be reliable. Deutsche Bank makes no representation as to the accuracy or completeness of such information.
Deutsche Bank may engage in securities transactions, on a proprietary basis or otherwise, in a manner inconsistent with the view taken in this research report. In addition, others within Deutsche Bank, including strategists and sales staff, may take a view that is inconsistent with that taken in this research report.
Opinions, estimates and projections in this report constitute the current judgement of the author as of the date of this report. They do not necessarily reflect the opinions of Deutsche Bank and are subject to change without notice. Deutsche Bank has no obligation to update, modify or amend this report or to otherwise notify a recipient thereof in the event that any opinion, forecast or estimate set forth herein, changes or subsequently becomes inaccurate. Prices and availability of financial instruments are subject to change without notice. This report is provided for informational purposes only. It is not an offer or a solicitation of an offer to buy or sell any financial instruments or to participate in any particular trading strategy. Target prices are inherently imprecise and a product of the analyst judgement.
As a result of Deutsche Bank’s March 2010 acquisition of BHF-Bank AG, a security may be covered by more than one analyst within the Deutsche Bank group. Each of these analysts may use differing methodologies to value the security; as a result, the recommendations may differ and the price targets and estimates of each may vary widely.
In August 2009, Deutsche Bank instituted a new policy whereby analysts may choose not to set or maintain a target price of certain issuers under coverage with a Hold rating. In particular, this will typically occur for "Hold" rated stocks having a market cap smaller than most other companies in its sector or region. We believe that such policy will allow us to make best use of our resources. Please visit our website at http://gm.db.com to determine the target price of any stock.
The financial instruments discussed in this report may not be suitable for all investors and investors must make their own informed investment decisions. Stock transactions can lead to losses as a result of price fluctuations and other factors. If a financial instrument is denominated in a currency other than an investor's currency, a change in exchange rates may adversely affect the investment. Past performance is not necessarily indicative of future results. Deutsche Bank may with respect to securities covered by this report, sell to or buy from customers on a principal basis, and consider this report in deciding to trade on a proprietary basis.
Unless governing law provides otherwise, all transactions should be executed through the Deutsche Bank entity in the investor's home jurisdiction. In the U.S. this report is approved and/or distributed by Deutsche Bank Securities Inc., a member of the NYSE, the NASD, NFA and SIPC. In Germany this report is approved and/or communicated by Deutsche Bank AG Frankfurt authorized by the BaFin. In the United Kingdom this report is approved and/or communicated by Deutsche Bank AG London, a member of the London Stock Exchange and regulated by the Financial Conduct Authority for the conduct of investment business in the UK and authorized by the BaFin. This report is distributed in Hong Kong by Deutsche Bank AG, Hong Kong Branch, in Korea by Deutsche Securities Korea Co. This report is distributed in Singapore by Deutsche Bank AG, Singapore Branch or Deutsche Securities Asia Limited, Singapore Branch (One Raffles Quay #18-00 South Tower Singapore 048583, +65 6423 8001), and recipients in Singapore of this report are to contact Deutsche Bank AG, Singapore Branch or Deutsche Securities Asia Limited, Singapore Branch in respect of any matters arising from, or in connection with, this report. Where this report is issued or promulgated in Singapore to a person who is not an accredited investor, expert investor or institutional investor (as defined in the applicable Singapore laws and regulations), Deutsche Bank AG, Singapore Branch or Deutsche Securities Asia Limited, Singapore Branch accepts legal responsibility to such person for the contents of this report. In Japan this report is approved and/or distributed by Deutsche Securities Inc. The information contained in this report does not constitute the provision of investment advice. In Australia, retail clients should obtain a copy of a Product Disclosure Statement (PDS) relating to any financial product referred to in this report and consider the PDS before making any decision about whether to acquire the product. Deutsche Bank AG Johannesburg is incorporated in the Federal Republic of Germany (Branch Register Number in South Africa: 1998/003298/10). Additional information relative to securities, other financial products or issuers discussed in this report is available upon request. This report may not be reproduced, distributed or published by any person for any purpose without Deutsche Bank's prior written consent. Please cite source when quoting.
Copyright © 2014 Deutsche Bank AG