Embed Size (px)
Citation preview
China’s international trade and air pollution in theUnited StatesJintai Lina,1,2, Da Pana,1, Steven J. Davisb, Qiang Zhangc,2, Kebin Hed,e,2, Can Wangc,d, David G. Streetsf,Donald J. Wuebblesg, and Dabo Guanc,h
aLaboratory for Climate and Ocean-Atmosphere Studies, Department of Atmospheric and Oceanic Sciences, School of Physics, Peking University, Beijing100871, China; bDepartment of Earth System Science, University of California, Irvine, CA 92697; cMinistry of Education Key Laboratory for Earth SystemModeling, Center for Earth System Science, Tsinghua University, Beijing 100084, China; dState Key Joint Laboratory of Environmental Simulation and PollutionControl, School of Environment, Tsinghua University, Beijing 100084, China; eCollaborative Innovation Center for Regional Environmental Quality, Beijing100084, China; fArgonne National Laboratory, Lemont, IL 60439; gDepartment of Atmospheric Sciences, School of Earth, Society, and Environment, Universityof Illinois at Urbana–Champaign, Urbana, IL 61801; and hwater@leeds, School of Earth and Environment, University of Leeds, Leeds, LS2 9JT, United Kingdom
Edited by Dan Jaffe, University of Washington, Seattle, WA, and accepted by the Editorial Board December 18, 2013 (received for review July 10, 2013)
China is the world’s largest emitter of anthropogenic air pollu-tants, and measurable amounts of Chinese pollution are trans-ported via the atmosphere to other countries, including the UnitedStates. However, a large fraction of Chinese emissions is due tomanufacture of goods for foreign consumption. Here, we analyzethe impacts of trade-related Chinese air pollutant emissions on theglobal atmospheric environment, linking an economic-emissionanalysis and atmospheric chemical transport modeling. We findthat in 2006, 36% of anthropogenic sulfur dioxide, 27% of nitro-gen oxides, 22% of carbon monoxide, and 17% of black carbonemitted in China were associated with production of goods forexport. For each of these pollutants, about 21% of export-relatedChinese emissions were attributed to China-to-US export. Atmo-spheric modeling shows that transport of the export-related Chi-nese pollution contributed 3–10% of annual mean surface sulfateconcentrations and 0.5–1.5% of ozone over the western UnitedStates in 2006. This Chinese pollution also resulted in one extraday or more of noncompliance with the US ozone standard in 2006over the Los Angeles area and many regions in the eastern UnitedStates. On a daily basis, the export-related Chinese pollution con-tributed, at a maximum, 12–24% of sulfate concentrations overthe western United States. As the United States outsourcedmanufacturing to China, sulfate pollution in 2006 increased inthe western United States but decreased in the eastern UnitedStates, reflecting the competing effect between enhanced trans-port of Chinese pollution and reduced US emissions. Our findingsare relevant to international efforts to reduce transboundaryair pollution.
input–output analysis | emission control | international collaboration
Akey driver of the rapid economic growth in China over thepast decade is the great expansion in the production of
goods for export (1). Although growth has slowed since theglobal financial crisis, between 2000 and 2007 the volume ofChinese exports grew by 390% (2). As the Chinese economy hasgrown, the economic structure has also changed, transitioningfrom a net importer to a large net exporter of energy-intensiveindustrial products (2). The energy needed to support this eco-nomic growth and transformation has come from combustion offossil fuels, primarily coal, which has contributed to a globalincrease in emissions of carbon dioxide (CO2) (3, 4). At the sametime, increased combustion of fossil fuels, relatively low com-bustion efficiency, and weak emission control measures have alsoled to drastic increases in air pollutants such as sulfur dioxide(SO2), nitrogen oxides (NOx), carbon monoxide (CO), blackcarbon (BC), and primary organic carbon (OC) (5–8). Indeed,fossil-fuel–intensive manufacturing, large manufacturing volume,and relatively weak emission controls have meant that Chinaemits far more pollutants per unit of gross domestic product(GDP) than countries with more advanced industrial andemission control technologies (SI Appendix, Table S1). Per unit
of GDP in 2006, China emitted 6–33 times as much air pollu-tants as the United States (Fig. 1 E–H). For these reasons, airquality has recently become a major focus of environmentalpolicy in China (8).In this study, the terms “export,” “import,” and “trade” all
refer to transaction of goods between countries. The pollutantsemitted in China due to its production of goods for foreignconsumption are regarded as emissions embodied in export(EEE) of China (9, 10). The EEE is unique in that the associatedgoods are consumed outside of China, raising a question aboutthe extent to which China and its export partners should be ac-countable for the emissions (10–12). The attribution depends onwhether the emission accounting is based on production or onconsumption. Production-based accounting considers all emis-sions physically produced in China to be Chinese emissions, in-cluding the EEE. Such accounting is used as default in currentemission inventories such as the Emission Database for GlobalAtmospheric Research (13). By comparison, consumption-basedaccounting views all emissions associated with production ofgoods consumed by China to be China’s responsibility, no matterwhether the production occurs in China or in other countries (9,10). Thus, the consumption-based Chinese emissions exclude theEEE but include the emissions embodied in import of China
Significance
International trade affects global air pollution and transport byredistributing emissions related to production of goods andservices and by potentially altering the total amount of globalemissions. Here we analyze the trade influences by combin-ing an economic-emission analysis on China’s bilateral tradeand atmospheric chemical transport modeling. Our focusedanalysis on US air quality shows that Chinese air pollution re-lated to production for exports contributes, at a maximum ona daily basis, 12–24% of sulfate pollution over the westernUnited States. The US outsourcing of manufacturing to Chinamight have reduced air quality in the western United Stateswith an improvement in the east, due to the combined effectsof changes in emissions and atmospheric transport.
Author contributions: J.L., Q.Z., K.H., and D.G. designed research; J.L. and D.P. performedresearch; J.L., D.P., S.J.D., Q.Z., K.H., C.W., D.G.S., D.J.W., and D.G. analyzed data; and J.L.,D.P., S.J.D., Q.Z., K.H., C.W., D.G.S., D.J.W., and D.G. wrote the paper.
The authors declare no conflict of interest.
This article is a PNAS Direct Submission. D.J. is a guest editor invited by the EditorialBoard.
Freely available online through the PNAS open access option.1J.L. and D.P. contributed equally to this work.2To whom correspondence may be addressed. E-mail: [email protected], [email protected], or [email protected].
This article contains supporting information online at www.pnas.org/lookup/suppl/doi:10.1073/pnas.1312860111/-/DCSupplemental.
1736–1741 | PNAS | February 4, 2014 | vol. 111 | no. 5 www.pnas.org/cgi/doi/10.1073/pnas.1312860111
A
B
C
D
E
F
G
H
I
J
K
L
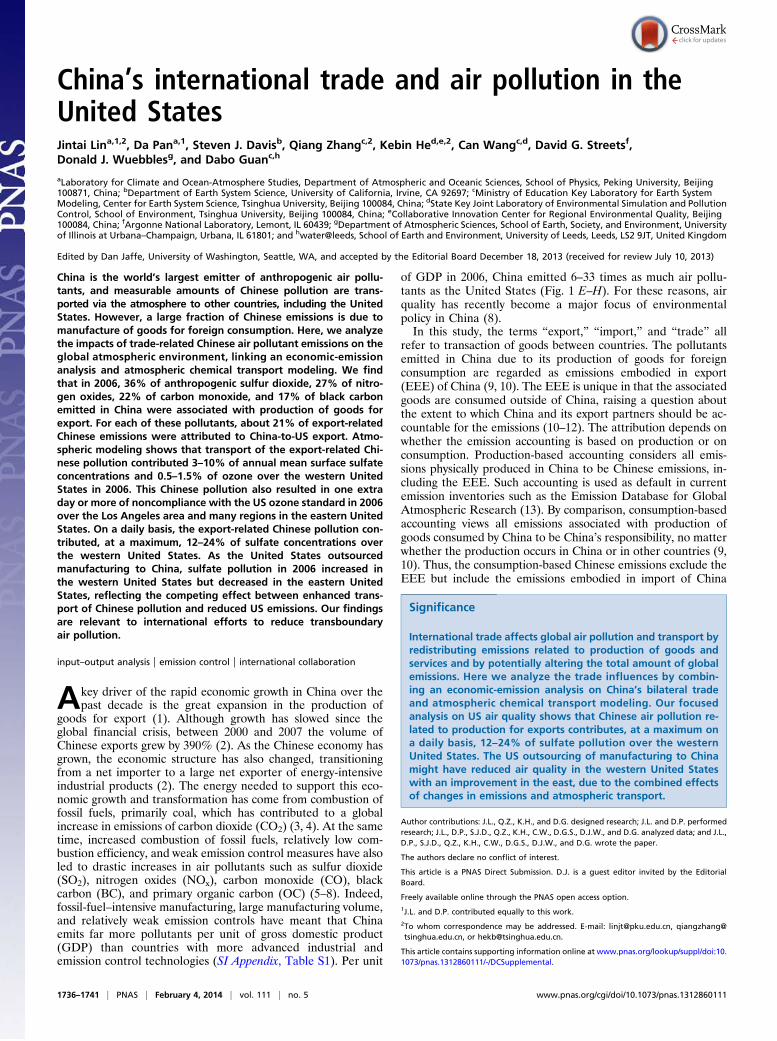
Fig. 1. Air pollutants embodied in Chinese trade between 2000 and 2009. (A–D) Production-based emissions (thin lines), consumption-based emissions (thicklines), and their differences (i.e., Chinese EET associated with its trade with the rest of the world in purple shading, and EET associated with Sino-US tradealone in green shading). All Chinese emissions are calculated here, the US production-based emissions are taken from the National Emissions Inventory, andthe US consumption-based emissions are derived based on production-based emissions and Sino-US trade-related emissions. Although China’s production-based emissions are growing rapidly, its EET are equivalent to substantial fractions of the production-based emissions. Similarly, the EET due to Sino-US tradeare equivalent to large proportions of the production-based US emissions since 2006. (E–H) Emissions per GDP. Although China’s production-based emissionsper unit GDP have been decreasing, its consumption-based emissions per unit GDP have decreased less significantly or have increased since 2008. (I–L)Emissions per capita. Per capita emissions are very different between the United States and China, and this disparity is increased when the consumption-basedemissions are considered. For data sources, see SI Appendix, Table S1, footnote.
Lin et al. PNAS | February 4, 2014 | vol. 111 | no. 5 | 1737
ENVIRONMEN
TAL
SCIENCE
SSU
STAINABILITY
SCIENCE
(EEI, i.e., emissions in other countries due to production ofgoods for Chinese consumption). The numerical difference be-tween production- and consumption-based emissions of China isthe EEE less the EEI, the result of which is regarded as theemissions embodied in net trade (EET) of China (10). Similaremission analyses are applicable to other countries.Previous studies have quantified the substantial CO2 emissions
embodied in Chinese trade (10, 11). Thus, far, however, rela-tively little attention has been paid to trade-related emissions ofshort-lived air pollutants and especially the resulting impacts onthe global atmospheric environment, except for an analysis donefor local air quality of the Pearl River Delta (14). This is truedespite the direct harm these pollutants do to human health (15–18), agriculture (19), ecosystems (20), and global climate (21,22). And as scientific evidence of transport of Chinese air pol-lution across the Pacific Ocean has grown since the late 1990s(23–29), the United States and Canada have a special interest inreducing Chinese air pollution. In the case of CO2, consumption-based accounting of emissions has been motivated by the argu-ment—often made by developing countries—that consumerswho benefit from a process should bear some responsibility forassociated environmental damage (30). A similar accounting foremissions of air pollutants and consequent impacts on the globalatmospheric environment may therefore be necessary to facili-tate discussion of international collaborations on transboundaryair pollution control (31).We quantify the emissions of SO2, NOx, CO, BC, and OC
embodied in Chinese exports and imports between 2000 and2009 using an economic input–output model constructed fromeconomic and emission data. The model resolves trade betweenChina and four countries/regions [the United States, the EuropeanUnion (EU), Japan, and an aggregated region of all othercountries] and 42 industry sectors, and allocates pollutantemissions to countries and industry sectors according to wheregoods are consumed. As part of our analysis, we also quantify the
uncertainties in emission derivation using a Monte Carlo ap-proach. We then simulate the effects of export-related Chineseemissions on air pollution in China and downwind regions, usingthe GEOS-Chem global chemical transport model. See SI Ap-pendix for details of our analytic approach, data sources, andmodel simulations.
ResultsFig. 1 A–D shows the trends over 2000–2009 in the EET of Chinarelated to its trade with the rest of the world (purple shading)and in the EET with respect to Sino-US trade alone (green shad-ing), together with the production- and consumption-based emis-sion accounting for China and the United States. For China,although the production-based emissions of SO2 and BC havedeclined since 2007 due to the global financial crisis and sulfuremission control, the consumption-based emissions of all pol-lutants have continued to rise, reflecting a net decrease in the EET.Nonetheless, the EET were equivalent to a large fraction of pro-duction-based Chinese emissions, and this fraction expanded be-tween 2000 and 2006. For example, the EET of SO2 grew from 4.0teragrams (Tg) (equivalent to 18% of production-based Chineseemissions) in 2000 to 10.3 Tg (30%) in 2006 (Fig. 1A). The fractionof the EET grew similarly for NOx, CO, and BC (Fig. 1 B–D).Meanwhile, although the EET for Sino-US trade were equivalentonly to 2–8% of production-based US emissions in 2000, the pro-portion grewby a factor of 2–3 to reach 6–19% in 2006 (Fig. 1A–D).This trend reflects the decline of production-based emissions of theUnited States and its continuous outsourcing (32).Although the EET represent the difference between the EEE
and the EEI, the EET of China were numerically close to itsEEE over 2000–2009. This is because the EEE of China arelarger than the EEI by a factor of 4–6 during these years,reflecting China’s trade imbalance with the rest of the world, thetypes of goods being traded, and the differences in emission in-tensity between China and its trading partners (SI Appendix,
A B
C D
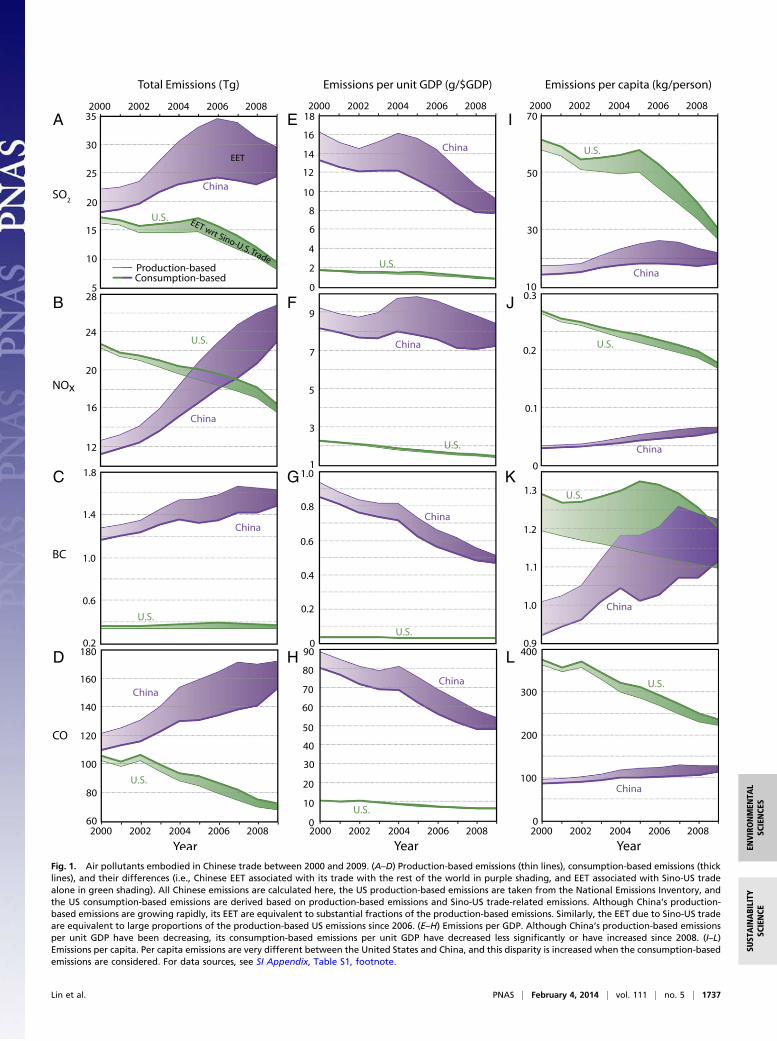
Fig. 2. Simulated percentage contribution of surface air pollution in 2006 from Chinese EEE for (A) sulfate, (B) ozone, (C ) BC, and (D) CO. Results are shownfor annual mean concentrations in the lowest model layer (0–130 m), presented as (simulation 1 − simulation 2)/simulation 1 in the SI Appendix, section 6. Thecolor scale is nonlinear to better present the wide range of impacts over different regions. The Chinese EEE affect pollutant concentrations most significantlyover China, but they also affect the rest of East Asia, the Arctic, western North America, and other regions downwind of China. The negative impacts onozone concentrations over parts of the northern Chinese provinces are primarily because the EEE-related NOx emissions increase the ozone sink in thenighttime overcompensating for the effect of enhanced ozone production in the daytime.
1738 | www.pnas.org/cgi/doi/10.1073/pnas.1312860111 Lin et al.
section 5.2). In 2006, the Chinese EEE contributed 36% of itsproduction-based emissions for SO2, 27% for NOx, 22% for CO,and 17% for BC. And for all these pollutants, about 21% of theChinese EEE in 2006 were attributed to China-to-US exportof goods.Fig. 1 E–H shows that Chinese emissions per unit of GDP have
mostly decreased between 2000 and 2009. However, the pro-duction-based emissions per unit GDP have recently decreasedat a faster rate than have the consumption-based emissions perunit GDP. In the case of NOx, the consumption-based Chineseemissions per unit GDP have actually increased since 2008 (Fig.1F). Meanwhile, emissions per unit GDP have also declined inthe United States, regardless of whether or not the emissionsembodied in Sino-US trade are included (Fig. 1 E–H). Theemissions per unit GDP for China are much greater than thosefor the United States, based on both production- and con-sumption-based accounting. In 2009, the production-basedemissions per unit GDP for China were about 6–17 times greaterthan the United States. The difference in consumption-basedemissions per unit GDP was somewhat less: 5–14 times greater inChina than the United States.Finally, Fig. 1 I–L illustrates the large gap in emissions per
capita between the United States and China. Over 2000–2009,the EET per capita for China related to its trade with the rest ofthe world (purple shading) were close to the EET per capitafor the United States related to Sino-US trade alone (greenshading). For China, although the production-based emissionsper capita have fallen or flattened since 2007, the consumption-based emissions per capita have increased (Fig. 1 I–L). Thisagain suggests that the global financial crisis affected Chineseexports but did not stem domestic growth. The trends contrast tothe reductions in both production- and consumption-basedemissions per capita for the United States.Using the GEOS-Chem chemical transport model, we simu-
lated the impacts of the EEE-related Chinese pollution on theglobal atmospheric environment in 2006 (SI Appendix, section 6for descriptions of various model simulations). Fig. 2 shows themodeled percentage of annual mean surface pollutant concen-trations in the Northern Hemisphere in 2006 attributable to theatmospheric transport and transformation of the EEE-relatedChinese air pollution. The EEE-related Chinese pollution accoun-ted for 23–34% of sulfate concentrations, 10–23% of BC, and12–23% of CO over East China (east of 100°E). This pollutionresulted in ozone reductions over the North China Plain andNortheast China with ozone enhancements over the southernprovinces. The mixed impacts reflect the nonlinear chemicalprocesses that govern the ozone level: The additional NOx due toChinese EEE enhanced the nighttime ozone loss, compensatingfor the effect of enhanced daytime ozone production (33).Fig. 2 shows that, through the atmospheric transport and
transformation, parts of the EEE-related Chinese pollution in2006 affected the surface air pollutant levels over the rest of EastAsia, the North Pacific, western North America, Arctic, andother regions downwind of China. In particular, the EEE-relatedChinese pollution contributed about 3–10% of the annual meansurface sulfate concentrations, 1–3% of BC, 2–3% of CO, and0.5–1.5% of ozone over the western contiguous United States(west of 100°W). On a monthly basis, the trans-Pacific transportof Chinese air pollution was enhanced in spring (SI Appendix,Fig. S7) due to active cyclonic activities and strong westerly winds(24, 34).The trans-Pacific transport is largely episodic (28, 35), such
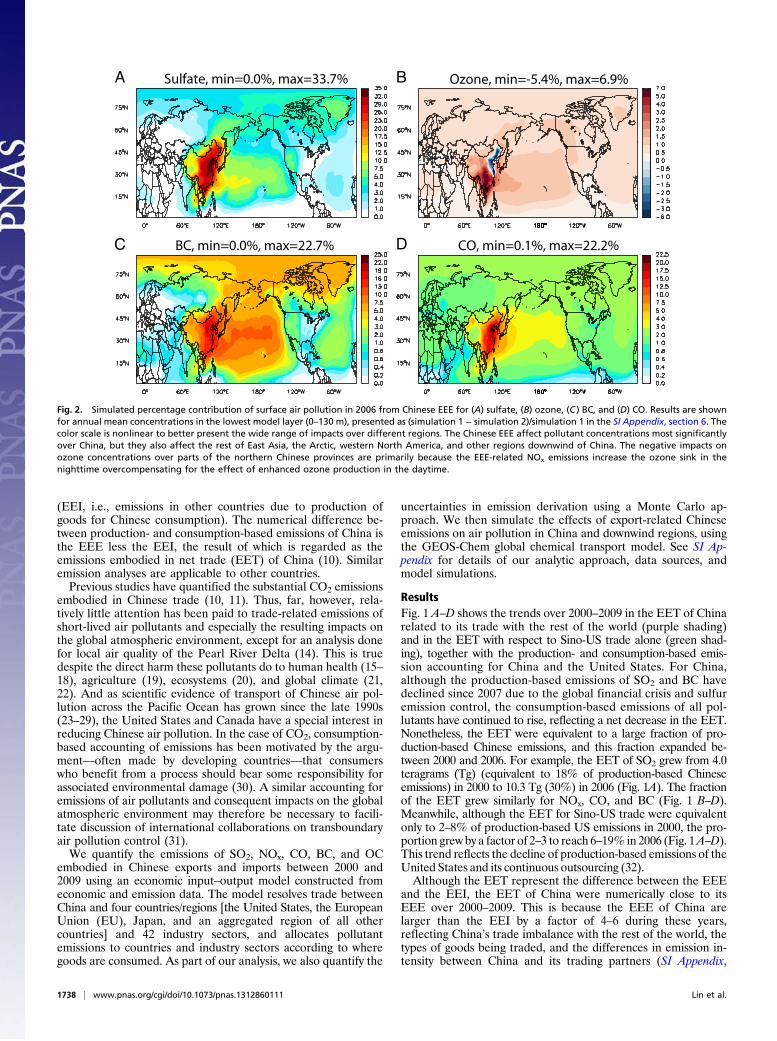
that the influence of Chinese pollution on US air quality variessignificantly from one day to another. Fig. 3 shows the maximumcontribution of EEE-related Chinese air pollution to daily meansurface air pollutant concentrations over the United States in2006. On a day-to-day basis, the transport of EEE-related Chi-nese pollution contributed, at a maximum, 12–24% of sulfate
concentrations, 2–5% of ozone, 4–6% of CO, and up to 11% ofBC over the western United States, and it also contributed up to8% of daily mean ozone over parts of the Great Lakes region.Furthermore, the trans-Pacific transport increased the numberof days in 2006 when the daily maximum 8-h average ozoneconcentration exceeded the current US standard (75 ppb). Forthe 217 model gridcells constituting the contiguous UnitedStates, there are 38 gridcells that had one extra day or more ofozone exceedance in 2006 because of the transport of the EEE-related Chinese air pollution, including the gridcells covering theLos Angeles area and many regions in the eastern United States(SI Appendix, Fig. S8).In 2006, China-to-US export of goods resulted in about 7.4%
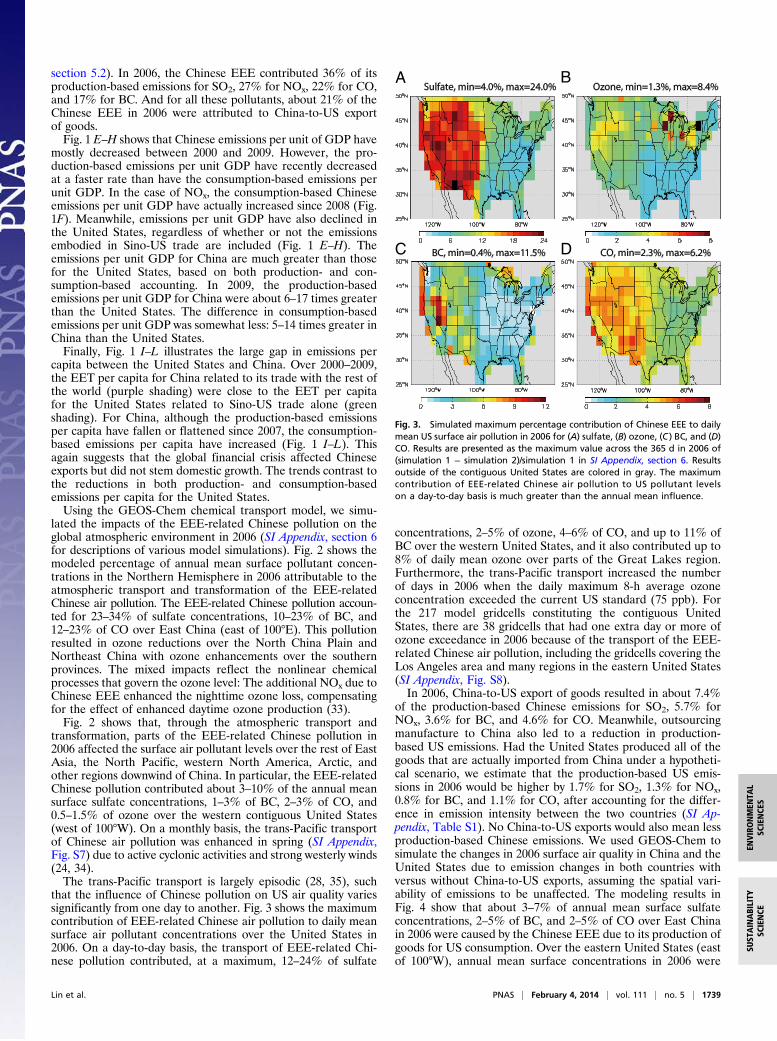
of the production-based Chinese emissions for SO2, 5.7% forNOx, 3.6% for BC, and 4.6% for CO. Meanwhile, outsourcingmanufacture to China also led to a reduction in production-based US emissions. Had the United States produced all of thegoods that are actually imported from China under a hypotheti-cal scenario, we estimate that the production-based US emis-sions in 2006 would be higher by 1.7% for SO2, 1.3% for NOx,0.8% for BC, and 1.1% for CO, after accounting for the differ-ence in emission intensity between the two countries (SI Ap-pendix, Table S1). No China-to-US exports would also mean lessproduction-based Chinese emissions. We used GEOS-Chem tosimulate the changes in 2006 surface air quality in China and theUnited States due to emission changes in both countries withversus without China-to-US exports, assuming the spatial vari-ability of emissions to be unaffected. The modeling results inFig. 4 show that about 3–7% of annual mean surface sulfateconcentrations, 2–5% of BC, and 2–5% of CO over East Chinain 2006 were caused by the Chinese EEE due to its production ofgoods for US consumption. Over the eastern United States (eastof 100°W), annual mean surface concentrations in 2006 were
A B
C D
Fig. 3. Simulated maximum percentage contribution of Chinese EEE to dailymean US surface air pollution in 2006 for (A) sulfate, (B) ozone, (C ) BC, and (D)CO. Results are presented as the maximum value across the 365 d in 2006 of(simulation 1 − simulation 2)/simulation 1 in SI Appendix, section 6. Resultsoutside of the contiguous United States are colored in gray. The maximumcontribution of EEE-related Chinese air pollution to US pollutant levelson a day-to-day basis is much greater than the annual mean influence.
Lin et al. PNAS | February 4, 2014 | vol. 111 | no. 5 | 1739
ENVIRONMEN
TAL
SCIENCE
SSU
STAINABILITY
SCIENCE
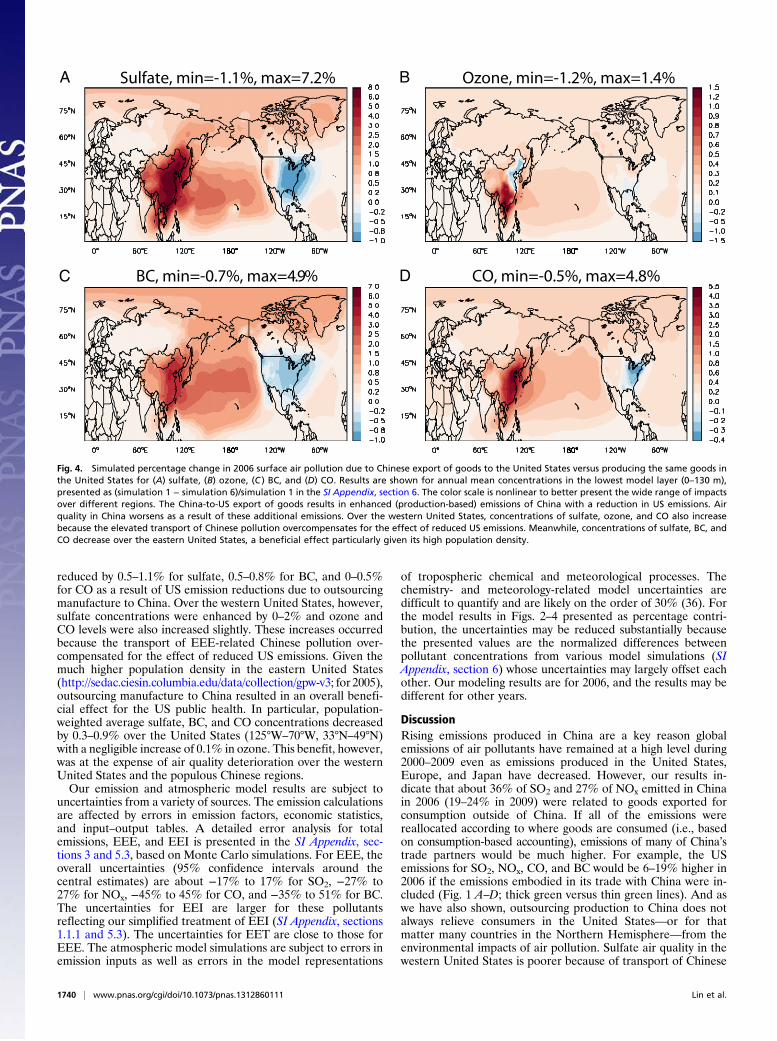
reduced by 0.5–1.1% for sulfate, 0.5–0.8% for BC, and 0–0.5%for CO as a result of US emission reductions due to outsourcingmanufacture to China. Over the western United States, however,sulfate concentrations were enhanced by 0–2% and ozone andCO levels were also increased slightly. These increases occurredbecause the transport of EEE-related Chinese pollution over-compensated for the effect of reduced US emissions. Given themuch higher population density in the eastern United States(http://sedac.ciesin.columbia.edu/data/collection/gpw-v3; for 2005),outsourcing manufacture to China resulted in an overall benefi-cial effect for the US public health. In particular, population-weighted average sulfate, BC, and CO concentrations decreasedby 0.3–0.9% over the United States (125°W–70°W, 33°N–49°N)with a negligible increase of 0.1% in ozone. This benefit, however,was at the expense of air quality deterioration over the westernUnited States and the populous Chinese regions.Our emission and atmospheric model results are subject to
uncertainties from a variety of sources. The emission calculationsare affected by errors in emission factors, economic statistics,and input–output tables. A detailed error analysis for totalemissions, EEE, and EEI is presented in the SI Appendix, sec-tions 3 and 5.3, based on Monte Carlo simulations. For EEE, theoverall uncertainties (95% confidence intervals around thecentral estimates) are about −17% to 17% for SO2, −27% to27% for NOx, −45% to 45% for CO, and −35% to 51% for BC.The uncertainties for EEI are larger for these pollutantsreflecting our simplified treatment of EEI (SI Appendix, sections1.1.1 and 5.3). The uncertainties for EET are close to those forEEE. The atmospheric model simulations are subject to errors inemission inputs as well as errors in the model representations
of tropospheric chemical and meteorological processes. Thechemistry- and meteorology-related model uncertainties aredifficult to quantify and are likely on the order of 30% (36). Forthe model results in Figs. 2–4 presented as percentage contri-bution, the uncertainties may be reduced substantially becausethe presented values are the normalized differences betweenpollutant concentrations from various model simulations (SIAppendix, section 6) whose uncertainties may largely offset eachother. Our modeling results are for 2006, and the results may bedifferent for other years.
DiscussionRising emissions produced in China are a key reason globalemissions of air pollutants have remained at a high level during2000–2009 even as emissions produced in the United States,Europe, and Japan have decreased. However, our results in-dicate that about 36% of SO2 and 27% of NOx emitted in Chinain 2006 (19–24% in 2009) were related to goods exported forconsumption outside of China. If all of the emissions werereallocated according to where goods are consumed (i.e., basedon consumption-based accounting), emissions of many of China’strade partners would be much higher. For example, the USemissions for SO2, NOx, CO, and BC would be 6–19% higher in2006 if the emissions embodied in its trade with China were in-cluded (Fig. 1 A–D; thick green versus thin green lines). And aswe have also shown, outsourcing production to China does notalways relieve consumers in the United States—or for thatmatter many countries in the Northern Hemisphere—from theenvironmental impacts of air pollution. Sulfate air quality in thewestern United States is poorer because of transport of Chinese
BA
C D
Fig. 4. Simulated percentage change in 2006 surface air pollution due to Chinese export of goods to the United States versus producing the same goods inthe United States for (A) sulfate, (B) ozone, (C ) BC, and (D) CO. Results are shown for annual mean concentrations in the lowest model layer (0–130 m),presented as (simulation 1 − simulation 6)/simulation 1 in the SI Appendix, section 6. The color scale is nonlinear to better present the wide range of impactsover different regions. The China-to-US export of goods results in enhanced (production-based) emissions of China with a reduction in US emissions. Airquality in China worsens as a result of these additional emissions. Over the western United States, concentrations of sulfate, ozone, and CO also increasebecause the elevated transport of Chinese pollution overcompensates for the effect of reduced US emissions. Meanwhile, concentrations of sulfate, BC, andCO decrease over the eastern United States, a beneficial effect particularly given its high population density.
1740 | www.pnas.org/cgi/doi/10.1073/pnas.1312860111 Lin et al.
pollution associated with production of goods for US con-sumption, although air quality in the eastern United Statesis improved.The thin purple lines in Fig. 1 E–H show the significant
progress China has made since 2000 in reducing the (production-based) emissions per unit GDP through technological improve-ments and changes in economic structure (7, 37). In particular,SO2 emissions per unit GDP are decreasing rapidly since 2004(38) (Fig. 1E). However, the emissions per unit GDP for allpollutants remain much higher than those of the United States(Fig. 1 E–H), and further improvements in technology andeconomic structure could reduce emissions of pollutants muchmore. Differences in the ratio of pollutant to CO2 emissionsbetween the United States and China (SI Appendix, section 7 andTable S11) indicate that production-based Chinese emissionscould be reduced by 58–62% for SO2, 47–54% for CO, and up to22% for NOx over 2000–2009 if China were to enhance energyefficiency and deploy emission control technologies as effectiveas those used in the United States. Even if such improvementswere made to only those facilities involved in producing goodsfor export, the reduction in emissions would significantly im-prove the air quality in China and in downwind regions. Forinstance, the annual mean surface sulfate concentrations in2006 would have been about 10–19% lower in China and 1–5%lower in the western United States based on the simulationof GEOS-Chem.Consideration of international cooperation to reduce trans-
boundary transport of air pollution (31) must confront thequestion of who is responsible for emissions in one countryduring production of goods to support consumption in another.Polluting industries in China and other emerging economies supplya large proportion of global consumption through international
trade. Sustaining the current trading system while minimizingtransboundary air pollution—and other environmental impacts—will likely require international agreements informed by con-sumption-based accounting of emissions of air pollutants as wellas atmospheric transport modeling of air pollution.
Materials and MethodsCalculation of EEE and EEI is based on an input–output analysis of theeconomic processes required to produce a particular good or service, mul-tiplied by sector-specific emission intensities. See SI Appendix, Fig. S1 for theflowchart. Emissions from ocean shipping vessels are not accounted for.Sectoral emission intensities are calculated as total production-based Chi-nese emissions (which are estimated with a technology-based, bottom-upapproach) divided by total monetary outputs from the respective sectors.The estimated production-based total emissions are consistent with the lit-erature (SI Appendix, Fig. S3). A Monte Carlo method is used to quantifyuncertainty associated with errors in emission factors, economic statistics,and the input–output analysis itself. Emissions of CO2 are calculated witha similar approach, and the resulting emissions embodied in trade are con-sistent with previous studies (SI Appendix, Fig. S4). The global GEOS-Chemchemical transport model (version 8–03-02; on the 2.5° long × 2° lat grid) isused to simulate the impacts of EEE-related Chinese air pollution on theglobal atmospheric environment. We do not distinguish the EEE of volatileorganic compounds that would otherwise enhance the modeled ozoneproduction efficiency of NOx; a sensitivity simulation shows that the effect ismostly confined in the North China Plain (SI Appendix, section 6 and Fig. S6).Detailed descriptions of our analytic approach, data sources, and modelsimulations are presented in SI Appendix.
ACKNOWLEDGMENTS. We thank Michael Prather for comments. This re-search is supported by the National Natural Science Foundation of China,Grants 41175127, 41005078, 41222036, 21221004, 41328008, and J1103404.The work at Tsinghua University is also supported by the Tsinghua UniversityInitiative Research Program (2011Z01026).
1. Guan D, Peters GP, Weber CL, Hubacek K (2009) Journey to world top emitter: Ananalysis of the driving forces of China’s recent CO2 emissions surge. Geophys Res Lett36(4):L04709.
2. National Bureau of Statistics (2001–2010) China Trade and External Economic Statis-tical Yearbook (China Statistics Press, Beijing).
3. Minx JC, et al. (2011) A “carbonizing dragon”: China’s fast growing CO2 emissionsrevisited. Environ Sci Technol 45(21):9144–9153.
4. Fan Y, Xia Y (2012) Exploring energy consumption and demand in China. Energy40(1):23–30.
5. Ohara T, et al. (2007) An Asian emission inventory of anthropogenic emission sourcesfor the period 1980-2020. Atmos Chem Phys 7(16):4419–4444.
6. Lu Z, Zhang Q, Streets DG (2011) Sulfur dioxide and primary carbonaceous aerosolemissions in China and India, 1996–2010. Atmos Chem Phys 11(18):9839–9864.
7. Lin J, et al. (2010) Recent changes in particulate air pollution over China observedfrom space and the ground: Effectiveness of emission control. Environ Sci Technol44(20):7771–7776.
8. Zhang Q, He KB, Huo H (2012) Policy: Cleaning China’s air. Nature 484(7393):161–162.9. Peters GP, Minx JC, Weber CL, Edenhofer O (2011) Growth in emission transfers via
international trade from 1990 to 2008. Proc Natl Acad Sci USA 108(21):8903–8908.10. Davis SJ, Caldeira K (2010) Consumption-based accounting of CO2 emissions. Proc Natl
Acad Sci USA 107(12):5687–5692.11. Hertwich EG, Peters GP (2009) Carbon footprint of nations: A global, trade-linked
analysis. Environ Sci Technol 43(16):6414–6420.12. Peters GP, Hertwich EG (2008) CO2 embodied in international trade with implications
for global climate policy. Environ Sci Technol 42(5):1401–1407.13. Janssens-Maenhout G, Petrescu AMR, Muntean M, Blujdea V (2010) Verifying
Greenhouse Gas Emissions: Methods to Support International Climate Agreements(The National Academies Press, Atlanta).
14. Streets DG, Yu C, Bergin MH, Wang XM, Carmichael GR (2006) Modeling study of airpollution due to the manufacture of export goods in China’s Pearl River Delta. En-viron Sci Technol 40(7):2099–2107.
15. Smith KR, et al. (2009) Public health benefits of strategies to reduce greenhouse-gasemissions: Health implications of short-lived greenhouse pollutants. Lancet 374(9707):2091–2103.
16. Dockery DW, et al. (1993) An association between air pollution and mortality in sixU.S. cities. N Engl J Med 329(24):1753–1759.
17. Pope CA, 3rd, et al. (2002) Lung cancer, cardiopulmonary mortality, and long-termexposure to fine particulate air pollution. JAMA 287(9):1132–1141.
18. Bell ML, Dominici F, Samet JM (2005) A meta-analysis of time-series studies of ozoneand mortality with comparison to the national morbidity, mortality, and air pollutionstudy. Epidemiology 16(4):436–445.
19. Van Dingenen R, et al. (2009) The global impact of ozone on agricultural crop yieldsunder current and future air quality legislation. Atmos Environ 43:604–618.
20. Wittig VE, Ainsworth EA, Naidu SL, Karnosky DF, Long SP (2009) Quantifying theimpact of current and future tropospheric ozone on tree biomass, growth, physiologyand biochemistry: A quantitative meta-analysis. Glob Change Biol 15(2):396–424.
21. Ramanathan V, Carmichael G (2008) Global and regional climate changes due to blackcarbon. Nat Geosci 1(4):221–227.
22. Penner JE, et al. (2010) Short-lived uncertainty? Nat Geosci 3(9):587–588.23. Jaffe D, et al. (1999) Transport of Asian air pollution to North America. Geophys Res
Lett 26(6):711–714.24. Zhang L, et al. (2008) Transpacific transport of ozone pollution and the effect of
recent Asian emission increases on air quality in North America: An integratedanalysis using satellite, aircraft, ozonesonde, and surface observations. Atmos ChemPhys 8(20):6117–6136.
25. Fiore AM, et al. (2002) Background ozone over the United States in summer: Origin,trend, and contribution to pollution episodes. J Geophys Res, D, Atmospheres107(D15):4275.
26. Cooper OR, et al. (2010) Increasing springtime ozone mixing ratios in the free tro-posphere over western North America. Nature 463(7279):344–348.
27. Yu H, et al. (2012) Aerosols from overseas rival domestic emissions over NorthAmerica. Science 337(6094):566–569.
28. Wuebbles DJ, Lei H, Lin JT (2007) Intercontinental transport of aerosols and photo-chemical oxidants from Asia and its consequences. Environ Pollut 150(1):65–84.
29. Lin JT, Wuebbles DJ, Liang XZ (2008) Effects of intercontinental transport on surfaceozone over the United States: Present and future assessment with a global model.Geophys Res Lett 35(2):L02805.
30. Shue H (1999) Global Environment and International Inequality. Int Aff 75(3):531–545.
31. HTAP Task Force (2010) Hemispheric Transport of Air Pollution 2010 Executive Summary(Convention on Long-Range Transboundary Air Pollution, Geneva).
32. Weber CL, Matthews HS (2007) Embodied environmental emissions in U.S. in-ternational trade, 1997-2004. Environ Sci Technol 41(14):4875–4881.
33. Seinfeld JH, Pandis SN (2006) Atmospheric Chemistry and Physics: From Air Pollutionto Climate Change (Wiley, Hoboken, NJ), 2nd Ed.
34. Jacob DJ, et al. (2003) Transport and chemical evolution over the Pacific (TRACE-P)aircraft mission: Design, execution, and first results. J. Geophys. Res. 108(D20)(9000).
35. Yienger JJ, et al. (2000) The episodic nature of air pollution transport from Asia toNorth America. J Geophys Res, D, Atmospheres 105(D22):26931–26945.
36. Lin JT, et al. (2012) Modeling uncertainties for tropospheric nitrogen dioxide columnsaffecting satellite-based inverse modeling of nitrogen oxides emissions. Atmos ChemPhys 12(24):12255–12275.
37. National Bureau of Statistics (2001–2010) China Statistical Yearbook (China StatisticsPress, Beijing).
38. Xu Y (2011) Improvements in the operation of SO2 scrubbers in China’s coal powerplants. Environ Sci Technol 45(2):380–385.
Lin et al. PNAS | February 4, 2014 | vol. 111 | no. 5 | 1741
ENVIRONMEN
TAL
SCIENCE
SSU
STAINABILITY
SCIENCE