Embed Size (px)
Citation preview
Ch
ina
Re
sou
rces Q
ua
rterly So
uth
ern
win
ter~
No
rthe
rn su
mm
er 2
01
6
China Resources QuarterlySouthern winter ~ Northern summer 2016
China Resources Quarterly
Southern winter ~ Northern summer 2016
ii China Resources Quarterly • Southern winter ~ Northern summer
© Commonwealth of Australia 2016
Creative Commons licence With the exception of the Coat of Arms, this publication is licensed under a Creative Commons Attribution 3.0 Australia Licence. Creative Commons Attribution 3.0 Australia Licence is a standard form license agreement that allows you to copy, distribute, transmit and adapt this publication provided that you attribute the work.
A summary of the licence terms is available from: http://creativecommons.org/licenses/by/3.0/au/deed.en
The full licence terms are available from: http://creativecommons.org/licenses/by/3.0/au/legalcode
The Commonwealth’s preference is that you attribute this publication (and any material sourced from it) using the following wording: Source: Licensed from the Commonwealth of Australia under a Creative Commons Attribution 3.0 Australia Licence.
ISSN 978–1–921516–05–4 [Print]
ISSN 978–1–921516–07–8 [PDF]
This work is copyright. Apart from any use as permitted under the Copyright Act 1968, no part may be reproduced or altered by any process without prior written permission from the Australian Government. Requests and inquiries concerning reproduction and rights should be addressed to:
Department of Industry, Innovation and ScienceGPO Box 9839Canberra ACT 2601
or by emailing [email protected]
China Resources Quarterly • Southern winter ~ Northern summer iii
AcknowledgementsThis publication was jointly undertaken by the Westpac Institutional Bank, a division of the Westpac Group, and the Australian Government Department of Industry, Innovation and Science. The relationship is non–commercial. The report was previously published under the title of the Westpac–BREE China Resources Quarterly.
Editors
Westpac: Elliot Clarke and Justin Smirk. Department of Industry, Innovation and Science: Gayathiri Bragatheswaran, Nicole Thomas, Nikolai Drahos, Thuong Nguyen, Monica Philalay, Joseph Moloney, Jay Hammond, Mark Gibbons and Ross Lambie.
Design and production
Julie Doel
Cover image
Shutterstock
This report was fi nalised on 8 August 2016.
iv China Resources Quarterly • Southern winter ~ Northern summer
Acknowledgements iii
Contents iv
Acronyms and abbreviations v
Foreword vi
Executive summary 1
Recent developments in the Chinese
economy2
General macroeconomic indicators 6
Resource related macroeconomic
indicators8
Steel 10
Iron ore 13
Metallurgical coal 17
Energy overview 18
Thermal coal 21
Oil 23
Gas 27
Uranium 29
Gold 31
Silver 33
Copper 34
Aluminium 37
Alumina 39
Bauxite 41
Nickel 42
Zinc 45
Lead 49
Tin 50
Molybdenum 54
Tungsten 52
Cobalt 53
Antimony 55
Platinum and Palladium 56
Mineral sands 57
Rare earth oxides 58
Manganese and Cadmium 59
Diamonds and Magnesium 60
Mineral and energy import summary 61
Provincial distribution of energy
and resource related activity
Electricity output & consumption 62
Coal and gas 63
Ferrous metals 64
Alumina and aluminium 65
Copper and gold 66
Nickel and zinc 67
Contents
China Resources Quarterly • Southern winter ~ Northern summer v
Acronyms and abbreviations
ABS Australian Bureau of Statistics
ASEAN Association of Southeast Asian Nations
AUD, $A Australian dollar
bcm billion cubic metres
CEIC Chinese Economic Information Company
CFR Cost including freight
CNY, CNH Chinese yuan (onshore & off shore)
cm cubic metres
dltu dry long tonne unit
FDI foreign direct investment
FOB free on board
FX Foreign exchange
G3 United States, Europe and Japan
GDP gross domestic product
GFC global fi nancial crisis
GFCF gross fi xed capital formation
GCF gross capital formation
IEA International Energy Agency
IMF International Monetary Fund
koe, mtoe kilogram of oil equivalent, million tonnes of oil equivalent
kgpp kilograms per person
kWh kilowatt hour
LNG liquefi ed natural gas
Mt million tonnes
na not available
NAR net as received
NIEs Newly Industrialised Economies (Singapore, Taiwan, Hong Kong, South Korea)
ODI outward direct investment
OECD Organisation for Economic Cooperation and Development
OPEC Organisation of Petroleum Exporting Countries
PMI Purchasing Managers Index
PPP purchasing–power parity
ppt percentage point
RMB Chinese Renminbi
SHIBOR Shanghai Interbank Off ered Rate
sqkm square kilometres
USD, US$ United States dollar
Growth rate conventions and abbreviations.
“Year–ended growth”, abbreviated %yr, is the level of an indicator in a single period (a month or quarter) versus the corresponding period in the prior year, expressed as a percentage.
The term “smoothed growth” should be understood to represent a 3 month moving average (3mma) of the year– ended growth rate.
“Year–to–date growth”, abbreviated %ytd, is the accumulated level of an indicator at a point in the calendar year (for example year–to–June, year–to–Sep) versus the corresponding point in the prior year, expressed as a percentage.
“Annual average growth”, abbreviated %ann, is the level of an indicator over four quarters, versus the previous four quarter period, expressed as a percentage.
“Month–on–month and quarter–on–quarter growth”, abbreviated %mth or %qtr, is the level of an indicator in one period, versus the immediately prior period, expressed as a percentage.
“Annualised growth or annualised rate”, is the change in an indicator in a single period grossed up to a year, expressed as a percentage. If seasonally adjusted, this may be rendered as %saar.
vi China Resources Quarterly • Southern winter ~ Northern summer
ForewordWelcome to the Southern winter ~ Northern summer edition of the China Resources Quarterly – hereafter the CRQ. The CRQ is a collaborative research venture between the Westpac Institutional Bank (hereafter Westpac) and the Australian Government Department of Industry, Innovation and Science.
The CRQ is the primary reference point for public and private sector decision makers seeking to understand developments in the Chinese economy, with special reference to its demand for resources.
This edition has been compiled against an underwhelming economic backdrop, albeit with an improved risk appetite across global markets. China’s domestic demand impulse remains narrow and external demand is limited. As a result, nominal activity growth is subdued vis–a–vis the double–digit percentage growth rates that were common place for much of the last decade.
In the resources sphere, despite the weak tone of end demand, the rally in key commodities which commenced in Q1 has continued through to August. Speculation and the sustained depreciation of the Renminbi are likely playing a signifi cant role behind the scenes. A reversal of these gains seems likely later in 2016 as supply continues to weigh on diminishing underlying demand.
With China’s development model in the midst of a major structural infl ection point, and Australia’s own commodity cycle having shifted decisively into the supply phase, it is more vital than ever to have access to key data. The CRQ aims to do its part in this regard by making available rigorous and empirically grounded analysis of macroeconomic and resource industry trends.
China is now the world’s largest national economy in purchasing power parity (internationally comparable volume) terms and the largest producer of industrial value added, however measured. And it is now a free–trade agreement partner of Australia. These observations underscore the value of continuing to deepen our collective understanding of the ever–evolving Chinese economy.
Bill Evans Mark CullyChief Economist Chief EconomistWestpac Department of Industry, Innovation & Science
China Resources Quarterly • Southern winter ~ Northern summer 1
Executive summary
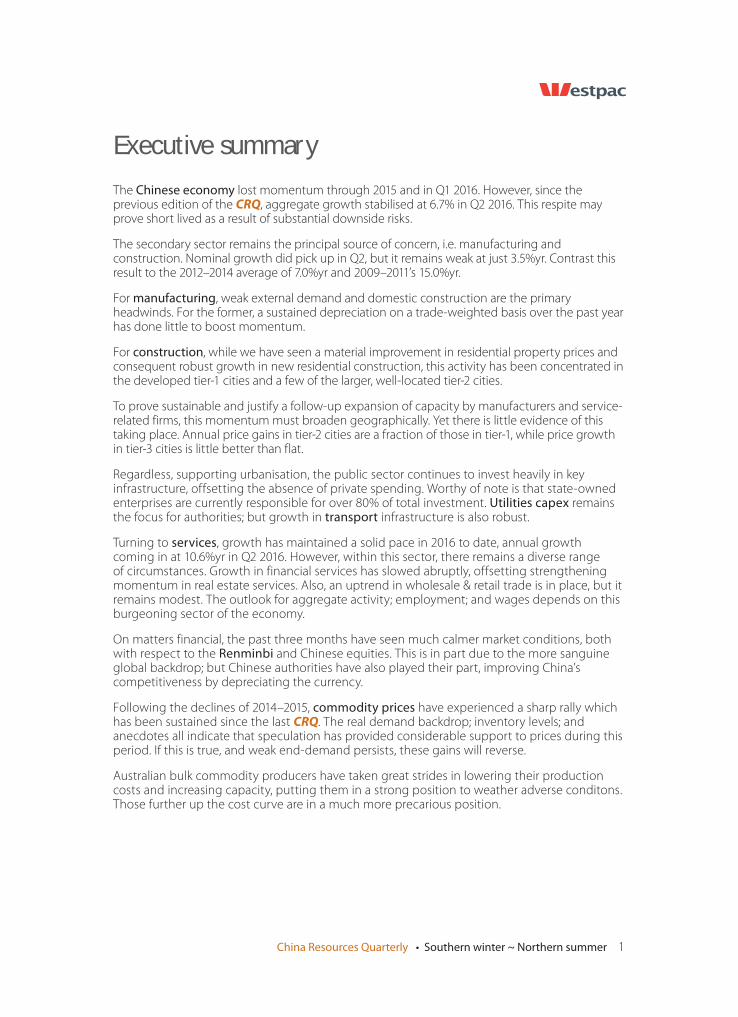
The Chinese economy lost momentum through 2015 and in Q1 2016. However, since the previous edition of the CRQ, aggregate growth stabilised at 6.7% in Q2 2016. This respite may prove short lived as a result of substantial downside risks.
The secondary sector remains the principal source of concern, i.e. manufacturing and construction. Nominal growth did pick up in Q2, but it remains weak at just 3.5%yr. Contrast this result to the 2012–2014 average of 7.0%yr and 2009–2011’s 15.0%yr.
For manufacturing, weak external demand and domestic construction are the primary headwinds. For the former, a sustained depreciation on a trade-weighted basis over the past year has done little to boost momentum.
For construction, while we have seen a material improvement in residential property prices and consequent robust growth in new residential construction, this activity has been concentrated in the developed tier-1 cities and a few of the larger, well-located tier-2 cities.
To prove sustainable and justify a follow-up expansion of capacity by manufacturers and service-related firms, this momentum must broaden geographically. Yet there is little evidence of this taking place. Annual price gains in tier-2 cities are a fraction of those in tier-1, while price growth in tier-3 cities is little better than flat.
Regardless, supporting urbanisation, the public sector continues to invest heavily in key infrastructure, offsetting the absence of private spending. Worthy of note is that state-owned enterprises are currently responsible for over 80% of total investment. Utilities capex remains the focus for authorities; but growth in transport infrastructure is also robust.
Turning to services, growth has maintained a solid pace in 2016 to date, annual growth coming in at 10.6%yr in Q2 2016. However, within this sector, there remains a diverse range of circumstances. Growth in financial services has slowed abruptly, offsetting strengthening momentum in real estate services. Also, an uptrend in wholesale & retail trade is in place, but it remains modest. The outlook for aggregate activity; employment; and wages depends on this burgeoning sector of the economy.
On matters financial, the past three months have seen much calmer market conditions, both with respect to the Renminbi and Chinese equities. This is in part due to the more sanguine global backdrop; but Chinese authorities have also played their part, improving China’s competitiveness by depreciating the currency.
Following the declines of 2014–2015, commodity prices have experienced a sharp rally which has been sustained since the last CRQ. The real demand backdrop; inventory levels; and anecdotes all indicate that speculation has provided considerable support to prices during this period. If this is true, and weak end-demand persists, these gains will reverse.
Australian bulk commodity producers have taken great strides in lowering their production costs and increasing capacity, putting them in a strong position to weather adverse conditons. Those further up the cost curve are in a much more precarious position.
2 China Resources Quarterly • Southern winter ~ Northern summer
-10
0
10
20
30
40
50
-10
0
10
20
30
40
50
Jun-93 Jun-97 Jun-01 Jun-05 Jun-09 Jun-13 Jun-17
%yr%yr
Total
Secondary
Tertiary
Sources: Westpac Economics, CEIC
-2
-1
0
1
2
3
4
5
6
Investment
ppt cont
Consumption
ppt cont
Net exports
ppt cont
GDP deflator
%ytd
%ytd or ppt
Q1 '14 Q2 '14
Q3'14 Q4'14
Q1'15 Q2'15
Q3 '15 Q4'15
Q1'16 Q2'16
Sources: CEIC, Westpac Economics.
0
5
10
15
20
25
30
0
5
10
15
20
25
30
Real estate Manuf Transport Utilities Total
%ytd%ytd
Dec-12 Dec-13 Dec-14
Dec-15 Jun-16
Sources: CEIC,
Westpac
Economics
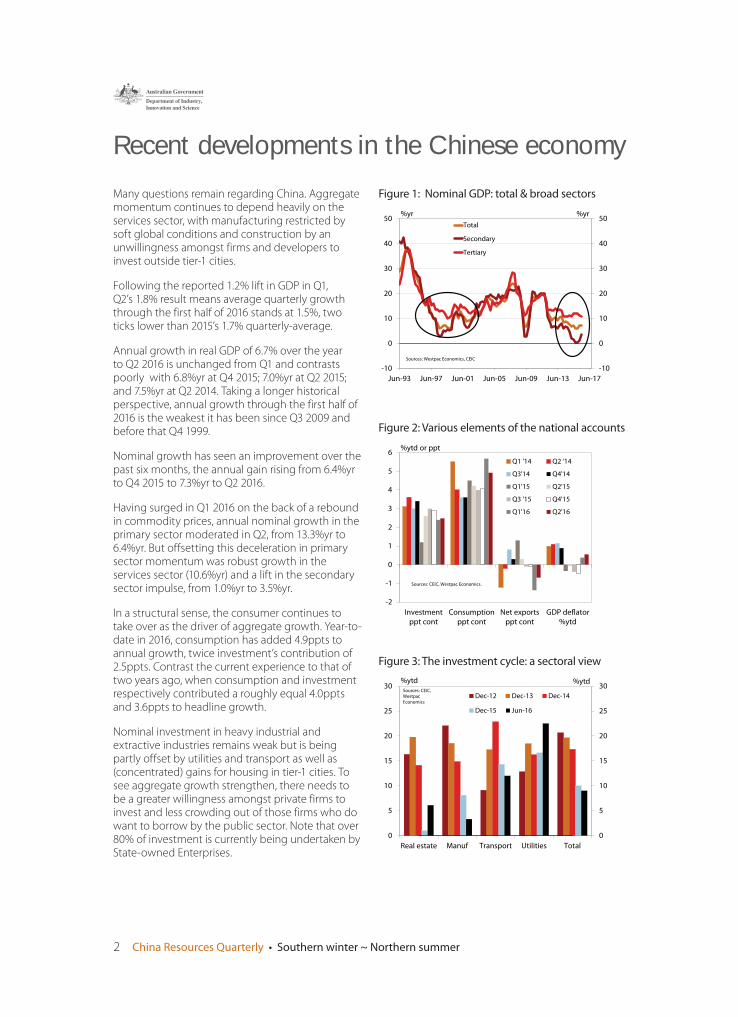
Figure 1: Nominal GDP: total & broad sectors
Figure 2: Various elements of the national accounts
Figure 3: The investment cycle: a sectoral view
Recent developments in the Chinese economy
Many questions remain regarding China. Aggregate momentum continues to depend heavily on the services sector, with manufacturing restricted by soft global conditions and construction by an unwillingness amongst firms and developers to invest outside tier-1 cities.
Following the reported 1.2% lift in GDP in Q1, Q2’s 1.8% result means average quarterly growth through the first half of 2016 stands at 1.5%, two ticks lower than 2015’s 1.7% quarterly-average.
Annual growth in real GDP of 6.7% over the year to Q2 2016 is unchanged from Q1 and contrasts poorly with 6.8%yr at Q4 2015; 7.0%yr at Q2 2015; and 7.5%yr at Q2 2014. Taking a longer historical perspective, annual growth through the first half of 2016 is the weakest it has been since Q3 2009 and before that Q4 1999.
Nominal growth has seen an improvement over the past six months, the annual gain rising from 6.4%yr to Q4 2015 to 7.3%yr to Q2 2016.
Having surged in Q1 2016 on the back of a rebound in commodity prices, annual nominal growth in the primary sector moderated in Q2, from 13.3%yr to 6.4%yr. But offsetting this deceleration in primary sector momentum was robust growth in the services sector (10.6%yr) and a lift in the secondary sector impulse, from 1.0%yr to 3.5%yr.
In a structural sense, the consumer continues to take over as the driver of aggregate growth. Year-to-date in 2016, consumption has added 4.9ppts to annual growth, twice investment’s contribution of 2.5ppts. Contrast the current experience to that of two years ago, when consumption and investment respectively contributed a roughly equal 4.0ppts and 3.6ppts to headline growth.
Nominal investment in heavy industrial and extractive industries remains weak but is being partly offset by utilities and transport as well as (concentrated) gains for housing in tier-1 cities. To see aggregate growth strengthen, there needs to be a greater willingness amongst private firms to invest and less crowding out of those firms who do want to borrow by the public sector. Note that over 80% of investment is currently being undertaken by State-owned Enterprises.
China Resources Quarterly • Southern winter ~ Northern summer 3
70
75
80
85
90
95
100
105
110
115
120
125
130
Jun-01 Jun-04 Jun-07 Jun-10 Jun-13 Jun-16
0
5
10
15
20
25
Nominal GDP growth (lhs)
Business situation* (rhs)
Domestic orders* (rhs)Sources: CEIC, Westpac Economics.
* 5000 enterprise survey. Dec-13 nominal GDP growth interpolated.
% long run average%yr
-30
-15
0
15
30
45
60
-15
0
15
30
45
Jun-01 Jun-04 Jun-07 Jun-10 Jun-13 Jun-16
Cement (lhs) Steel (lhs)
Electricity (lhs) Exports (rhs)
%yr %yr
Sources: CEIC, Westpac.
3mma of year-ended
rates.
-10
0
10
20
30
40
50
-10
0
10
20
30
40
50
Jun-94 Jun-98 Jun-02 Jun-06 Jun-10 Jun-14
%yr%yr
Financial services
Real estate services
Tertiary total
Wholesale and Retail
Sources: Westpac Economics, CEIC
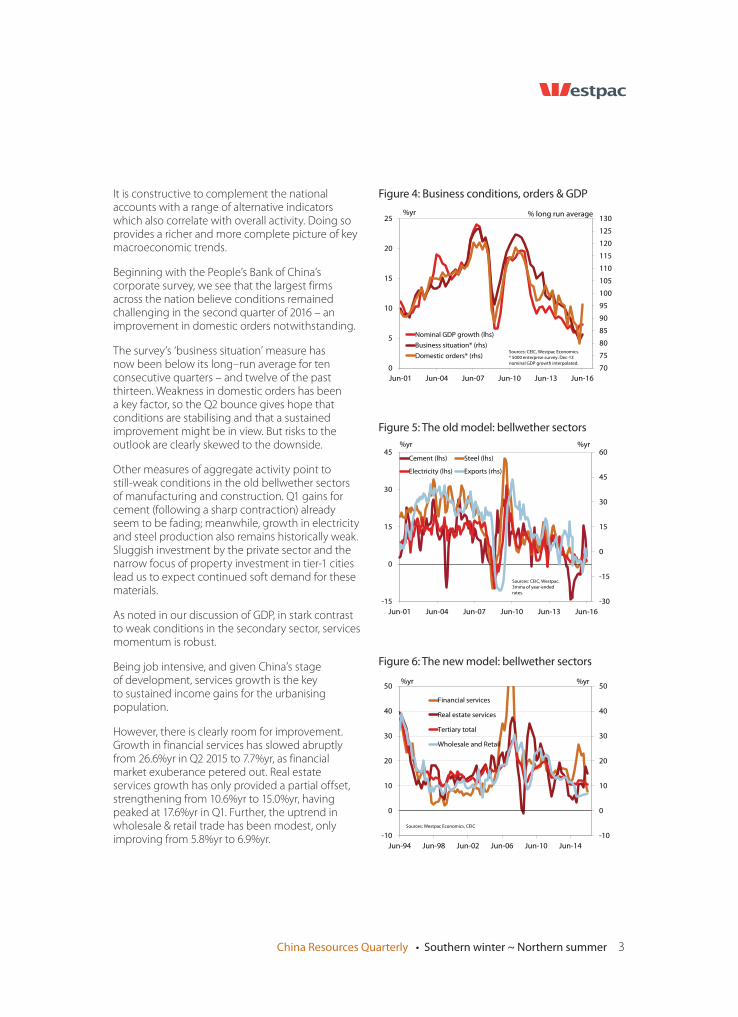
Figure 4: Business conditions, orders & GDP
Figure 5: The old model: bellwether sectors
Figure 6: The new model: bellwether sectors
It is constructive to complement the national accounts with a range of alternative indicators which also correlate with overall activity. Doing so provides a richer and more complete picture of key macroeconomic trends.
Beginning with the People’s Bank of China’s corporate survey, we see that the largest firms across the nation believe conditions remained challenging in the second quarter of 2016 – an improvement in domestic orders notwithstanding.
The survey’s ‘business situation’ measure has now been below its long–run average for ten consecutive quarters – and twelve of the past thirteen. Weakness in domestic orders has been a key factor, so the Q2 bounce gives hope that conditions are stabilising and that a sustained improvement might be in view. But risks to the outlook are clearly skewed to the downside.
Other measures of aggregate activity point to still-weak conditions in the old bellwether sectors of manufacturing and construction. Q1 gains for cement (following a sharp contraction) already seem to be fading; meanwhile, growth in electricity and steel production also remains historically weak. Sluggish investment by the private sector and the narrow focus of property investment in tier-1 cities lead us to expect continued soft demand for these materials.
As noted in our discussion of GDP, in stark contrast to weak conditions in the secondary sector, services momentum is robust.
Being job intensive, and given China’s stage of development, services growth is the key to sustained income gains for the urbanising population.
However, there is clearly room for improvement. Growth in financial services has slowed abruptly from 26.6%yr in Q2 2015 to 7.7%yr, as financial market exuberance petered out. Real estate services growth has only provided a partial offset, strengthening from 10.6%yr to 15.0%yr, having peaked at 17.6%yr in Q1. Further, the uptrend in wholesale & retail trade has been modest, only improving from 5.8%yr to 6.9%yr.
4 China Resources Quarterly • Southern winter ~ Northern summer
-100
-80
-60
-40
-20
0
20
40
60
80
100
-100
-80
-60
-40
-20
0
20
40
60
80
100
Jun-11 Jun-12 Jun-13 Jun-14 Jun-15 Jun-16
Net % of cities Net % of cities
New
Secondary market
Sources: CEIC,
Westpac Economics
90
100
110
120
130
140
150
160
170
180
190
75
100
125
150
175
200
225
250
275
300
Aug-06 Aug-08 Aug-10 Aug-12 Aug-14 Aug-16
indexindex
Completions (lhs)
Sales (lhs)
Residential land price (rhs)
Sources: CEIC, Westpac. Aug-2006 = 100.
Underlying activity data in sqm.
Land price is a spliced series of 100 and 70 city series.
-45
-30
-15
0
15
30
45
60
75
90
105
-45
-30
-15
0
15
30
45
60
75
90
105
Jun-01 Jun-04 Jun-07 Jun-10 Jun-13 Jun-16
%yr%yr
Sales
Starts
Sources: CEIC, Westpac.
Underlying data in sqm.
3mma of the year-ended growth rate.
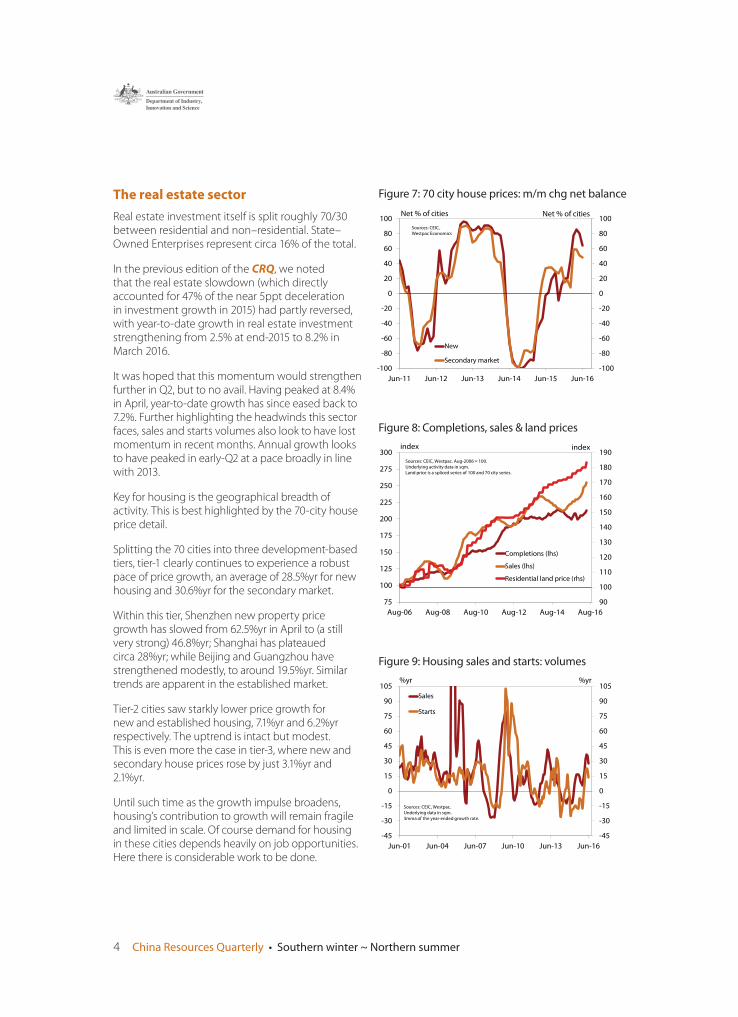
Figure 8: Completions, sales & land prices
Figure 9: Housing sales and starts: volumes
Figure 7: 70 city house prices: m/m chg net balanceThe real estate sector
Real estate investment itself is split roughly 70/30 between residential and non–residential. State–Owned Enterprises represent circa 16% of the total.
In the previous edition of the CRQ, we noted that the real estate slowdown (which directly accounted for 47% of the near 5ppt deceleration in investment growth in 2015) had partly reversed, with year-to-date growth in real estate investment strengthening from 2.5% at end-2015 to 8.2% in March 2016.
It was hoped that this momentum would strengthen further in Q2, but to no avail. Having peaked at 8.4% in April, year-to-date growth has since eased back to 7.2%. Further highlighting the headwinds this sector faces, sales and starts volumes also look to have lost momentum in recent months. Annual growth looks to have peaked in early-Q2 at a pace broadly in line with 2013.
Key for housing is the geographical breadth of activity. This is best highlighted by the 70-city house price detail.
Splitting the 70 cities into three development-based tiers, tier-1 clearly continues to experience a robust pace of price growth, an average of 28.5%yr for new housing and 30.6%yr for the secondary market.
Within this tier, Shenzhen new property price growth has slowed from 62.5%yr in April to (a still very strong) 46.8%yr; Shanghai has plateaued circa 28%yr; while Beijing and Guangzhou have strengthened modestly, to around 19.5%yr. Similar trends are apparent in the established market.
Tier-2 cities saw starkly lower price growth for new and established housing, 7.1%yr and 6.2%yr respectively. The uptrend is intact but modest. This is even more the case in tier-3, where new and secondary house prices rose by just 3.1%yr and 2.1%yr.
Until such time as the growth impulse broadens, housing’s contribution to growth will remain fragile and limited in scale. Of course demand for housing in these cities depends heavily on job opportunities. Here there is considerable work to be done.
China Resources Quarterly • Southern winter ~ Northern summer 5
-6
-4
-2
0
2
4
6
8
-15
-10
-5
0
5
10
15
20
Jun-01 Jun-04 Jun-07 Jun-10 Jun-13 Jun-16
%yr
Real effective RMB (%yr, lhs)
Real lending rate (ppt deviation from average, rhs)
Sources: CEIC,
Westpac Economics.
ppt
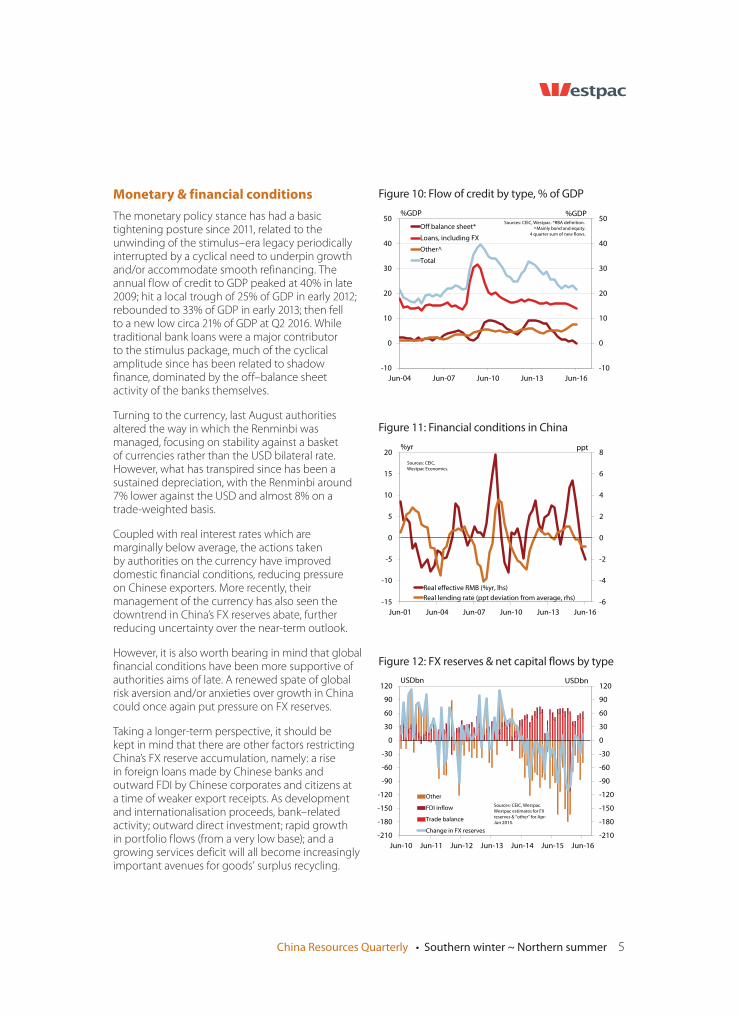
Figure 10: Flow of credit by type, % of GDP
Figure 11: Financial conditions in China
Figure 12: FX reserves & net capital fl ows by type
-10
0
10
20
30
40
50
Jun-04 Jun-07 Jun-10 Jun-13 Jun-16
-10
0
10
20
30
40
50%GDP%GDP
Off balance sheet*
Loans, including FX
Other^
Total
Sources: CEIC, Westpac. *RBA definition. ^Mainly bond and equity.
4 quarter sum of new flows.
-210
-180
-150
-120
-90
-60
-30
0
30
60
90
120
-210
-180
-150
-120
-90
-60
-30
0
30
60
90
120
Jun-10 Jun-11 Jun-12 Jun-13 Jun-14 Jun-15 Jun-16
USDbnUSDbn
Other
FDI inflow
Trade balance
Change in FX reserves
Sources: CEIC, Westpac.
Westpac estimates for FX
reserves & “other” for Apr-
Jun 2015.
Monetary & financial conditions
The monetary policy stance has had a basic tightening posture since 2011, related to the unwinding of the stimulus–era legacy periodically interrupted by a cyclical need to underpin growth and/or accommodate smooth refinancing. The annual flow of credit to GDP peaked at 40% in late 2009; hit a local trough of 25% of GDP in early 2012; rebounded to 33% of GDP in early 2013; then fell to a new low circa 21% of GDP at Q2 2016. While traditional bank loans were a major contributor to the stimulus package, much of the cyclical amplitude since has been related to shadow finance, dominated by the off–balance sheet activity of the banks themselves.
Turning to the currency, last August authorities altered the way in which the Renminbi was managed, focusing on stability against a basket of currencies rather than the USD bilateral rate. However, what has transpired since has been a sustained depreciation, with the Renminbi around 7% lower against the USD and almost 8% on a trade-weighted basis.
Coupled with real interest rates which are marginally below average, the actions taken by authorities on the currency have improved domestic financial conditions, reducing pressure on Chinese exporters. More recently, their management of the currency has also seen the downtrend in China’s FX reserves abate, further reducing uncertainty over the near-term outlook.
However, it is also worth bearing in mind that global financial conditions have been more supportive of authorities aims of late. A renewed spate of global risk aversion and/or anxieties over growth in China could once again put pressure on FX reserves.
Taking a longer-term perspective, it should be kept in mind that there are other factors restricting China’s FX reserve accumulation, namely: a rise in foreign loans made by Chinese banks and outward FDI by Chinese corporates and citizens at a time of weaker export receipts. As development and internationalisation proceeds, bank–related activity; outward direct investment; rapid growth in portfolio flows (from a very low base); and a growing services deficit will all become increasingly important avenues for goods’ surplus recycling.
6 China Resources Quarterly • Southern winter ~ Northern summer
Qu
art
erl
y
Jun
–1
3Se
p–
13
De
c–1
3M
ar–
14
Jun
–1
4Se
p–
14
De
c–1
4M
ar–
15
Jun
–1
5Se
p–
15
De
c–1
5M
ar–
16
Jun
–1
6
Re
al G
DP
%yr
7.6
7.9
7.7
7.4
7.5
7.1
7.2
7.0
7.0
6.9
6.8
6.7
6.7
No
min
al G
DP
%yr
9.3
10
.31
0.6
8.4
8.7
8.4
7.4
6.7
7.2
6.0
6.1
7.1
7.3
Co
ntr
ibu
tio
ns
to r
eal
GD
P p
erc
en
tag
e p
oin
ts y
td
Fin
al c
on
sum
pti
on
exp
en
dit
ure
3.4
3.5
3.6
5.5
4.0
3.6
3.6
4.5
4.2
4.0
4.1
5.7
4.9
Gro
ss c
apit
al fo
rmat
ion
4.1
4.3
4.3
3.1
3.6
3.0
3.4
1.2
2.6
3.0
2.9
2.4
2.5
Ne
t e
xpo
rts
0.1
–0
.1–
0.1
–1
.2–
0.2
0.8
0.3
1.3
0.3
–0
.1–
0.1
–1
.4–
0.7
Seco
nd
ary
ind
ust
ry %
ytd
7.7
7.9
8.0
7.6
7.7
7.6
7.4
6.3
6.2
6.1
6.1
5.9
6.1
Tert
iary
ind
ust
ry %
ytd
8.3
8.4
8.3
7.6
7.6
7.6
7.8
8.0
8.3
8.4
8.3
7.6
7.5
Cu
rre
nt
Acc
ou
nt
%G
DP
4q
ma
2.3
1.8
1.5
1.3
1.7
2.1
2.7
3.3
3.2
3.1
3.1
2.6
1.8
GD
P d
efl
ato
r %
yr1
.72
.42
.91
.01
.21
.30
.2–
0.3
0.2
–0
.9–
0.7
0.4
0.6
Fixe
d in
vest
me
nt
de
fl at
or
%yr
–0
.10
.00
.91
.10
.60
.4–
0.1
–0
.9–
1.2
–2
.3–
2.9
–2
.7–
0.8
Lan
d p
rice
ind
ex
%yr
5.1
6.2
7.0
7.5
7.2
6.1
5.2
3.8
3.4
3.5
3.2
3.6
3.9
Co
nsu
me
r p
rice
ind
ex
%yr
2.4
2.8
2.9
2.3
2.2
2.0
1.5
1.2
1.4
1.7
1.5
2.1
2.1
Pro
du
cer
pri
ce in
de
x %
yr–
2.7
–1
.7–
1.4
–2
.0–
1.5
–1
.3–
2.8
–4
.6–
4.7
–5
.7–
5.9
–4
.8–
2.9
Ce
ntr
al r
eve
nu
e 4
qm
a %
yr1
0.1
10
.81
0.2
10
.81
0.8
9.7
8.7
7.3
7.5
8.2
8.5
9.2
7.8
Ce
ntr
al e
xpe
nd
itu
res
4q
ma
%yr
10
.87
.51
1.2
11
.31
3.4
14
.18
.57
.67
.11
1.1
15
.91
7.4
12
.8
Ce
ntr
al o
pe
rati
ng
po
siti
on
4q
ma
%G
DP
–1
.7–
1.4
–1
.8–
1.8
–2
.3–
2.4
–1
.8–
1.9
–2
.2–
3.0
–3
.5–
3.8
–3
.4
Mo
ne
y su
pp
ly M
2 %
yr1
4.0
14
.21
3.6
12
.11
4.7
12
.91
2.2
11
.61
1.8
13
.11
3.3
13
.41
1.8
Ban
k lo
ans
(sto
ck)
%yr
14
.21
4.3
14
.11
3.9
14
.01
3.2
13
.61
4.7
14
.41
5.8
15
.01
4.7
14
.3
Tota
l cre
dit
su
pp
ly (
ne
w, r
olli
ng
an
nu
al)
%G
DP
3
2.1
31
.12
9.1
27
.72
8.6
25
.72
5.6
23
.72
2.2
23
.12
2.5
25
.02
3.1
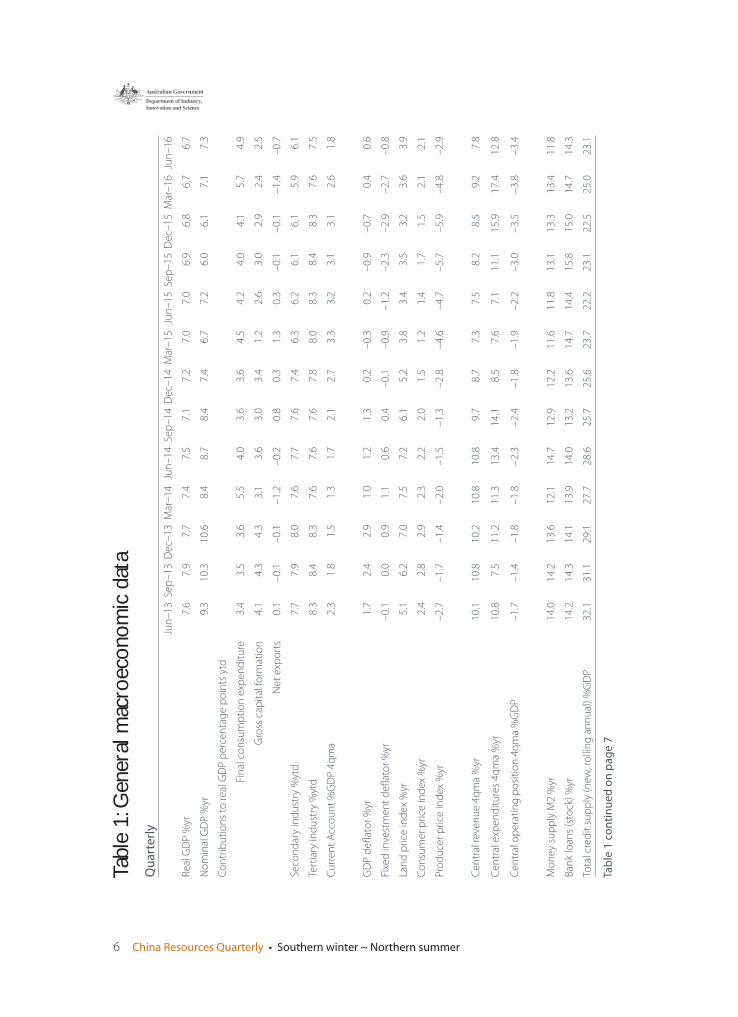
Tabl
e 1:
Gen
eral
mac
roec
onom
ic d
ata
Tab
le 1
co
nti
nu
ed
on
pa
ge
7
China Resources Quarterly • Southern winter ~ Northern summer 7
Qu
art
erl
y
Jun
–1
3Se
p–
13
De
c–1
3M
ar–
14
Jun
–1
4Se
p–
14
De
c–1
4M
ar–
15
Jun
–1
5Se
p–
15
De
c–1
5M
ar–
16
Jun
–1
6
Exp
ort
s %
yr4
.13
.97
.5–
4.7
5.0
13
.08
.61
0.0
–2
.2–
5.9
–5
.3–
8.6
–4
.3
to G
3–
4.9
2.6
9.4
2.8
9.3
10
.53
.87
.6–
1.0
–3
.3–
4.2
–6
.4–
6.3
to A
sia
ex
Jap
an1
5.2
7.5
6.9
–1
0.3
2.8
16
.21
3.3
9.9
–2
.6–
7.4
–4
.1–
9.0
–2
.0
to A
ust
ralia
–5
.33
.0–
1.5
1.1
4.8
4.1
5.3
14
.44
.21
.02
.0–
1.0
–9
.4
to n
on
–A
sian
em
erg
ing
mar
kets
0.4
–1
.45
.9–
3.3
3.9
14
.61
0.0
16
.6–
5.0
–1
0.0
–1
4.7
–1
6.1
–6
.6
Imp
ort
s %
yr5
.28
.47
.23
.31
.51
.2–
1.4
–1
7.9
–1
3.5
–1
4.2
–1
2.0
–1
3.4
–6
.6
fro
m G
3–
0.1
4.3
8.1
11
.57
.44
.32
.4–
11
.8–
10
.2–
13
.0–
11
.0–
9.8
–3
.3
fro
m A
sia
ex
Jap
an8
.17
.31
.5–
4.7
1.7
3.5
–0
.4–
14
.1–
11
.4–
14
.5–
9.2
–1
2.9
–7
.2
fro
m A
ust
ralia
9.1
19
.03
3.5
24
.82
.4–
1.9
–2
0.5
–2
6.5
–3
0.9
–2
0.5
–1
8.5
–3
0.8
–0
.3
fro
m n
on
–A
sian
em
erg
ing
mar
kets
–6
.84
.96
.32
.44
.50
.8–
4.4
–3
6.7
–2
7.6
–2
0.5
–2
3.0
–1
1.3
–6
.4
Trad
e b
alan
ce U
SDb
n6
5.7
61
.59
0.5
16
.68
5.9
12
8.1
14
9.5
12
3.7
13
9.5
16
3.6
17
4.8
12
5.7
14
3.4
Ch
ang
e in
FX
re
serv
es
USD
bn
54
16
61
59
12
74
5–
10
6–
45
–1
13
–3
6–
18
0–
18
4–
11
8–
7
Ente
rpri
se s
urv
ey
– n
et
bal
ance
, 50
bas
e
Bu
sin
ess
co
nd
itio
ns
57
.15
6.3
58
.15
5.3
55
.45
4.9
54
.55
2.8
51
.84
9.4
48
.44
6.7
48
.3
Pro
fi ta
bili
ty5
5.6
55
.15
7.6
50
.95
4.1
55
.05
5.0
51
.05
2.8
51
.15
0.5
47
.25
2.7
Do
me
stic
ord
ers
50
.34
8.2
49
.44
4.4
48
.54
6.9
46
.54
2.5
46
.34
3.3
42
.53
9.1
46
.6
Fore
ign
ord
ers
49
.95
0.1
48
.74
5.4
49
.74
9.9
47
.94
4.2
48
.74
6.3
43
.74
1.0
46
.5
Ban
kin
g c
limat
e –
% o
f av
era
ge
De
man
d fo
r lo
ans
92
.69
5.4
95
.09
9.9
91
.38
5.1
82
.98
7.9
77
.27
2.4
72
.68
0.1
72
.4
Ease
of
po
licy
stan
ce9
1.5
72
.67
3.6
68
.77
4.1
84
.39
0.3
96
.91
18
.71
10
.11
21
.01
15
.21
09
.7
Ban
kers
’ co
nfi
de
nce
leve
l1
16
.01
10
.41
29
.11
22
.49
7.2
10
7.0
95
.08
6.0
78
.67
3.5
68
.66
9.0
79
.1
We
stp
ac M
NI C
on
sum
er
Sen
tim
en
t* –
% o
f av
era
ge
He
adlin
e c
om
po
site
10
1.9
96
.51
03
.39
9.1
97
.79
5.0
93
.19
4.3
93
.19
7.2
93
.79
5.8
96
.8
Exp
ect
ed
fam
ily fi
nan
ces
10
3.9
97
.11
04
.39
8.3
99
.99
5.4
92
.79
4.6
93
.69
9.6
93
.99
7.1
95
.5
Ho
use
pri
ce e
xpe
ctat
ion
s9
9.6
10
3.6
10
2.1
10
5.6
10
4.4
10
5.6
10
4.4
10
6.3
10
5.2
10
7.3
10
3.7
10
5.4
10
3.7
Emp
loym
en
t o
utl
oo
k1
07
.99
7.3
11
0.2
99
.69
9.7
94
.79
3.3
93
.89
3.1
90
.79
0.0
88
.19
3.2
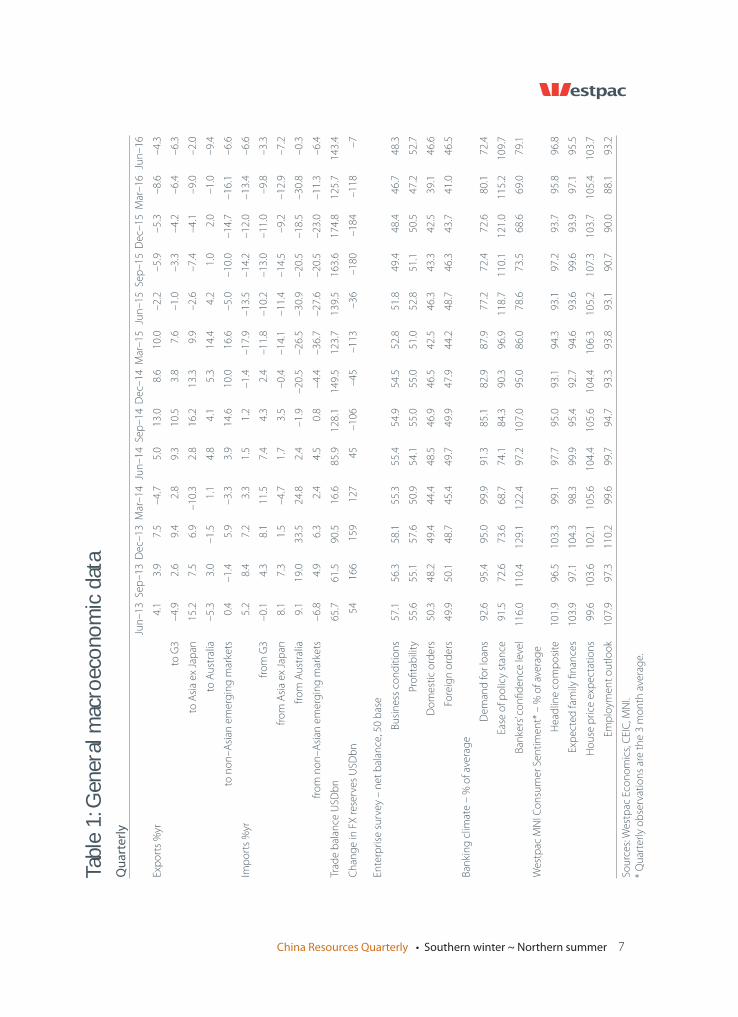
Sou
rce
s: W
est
pac
Eco
no
mic
s, C
EIC
, MN
I.
Tabl
e 1:
Gen
eral
mac
roec
onom
ic d
ata
* Q
uar
terl
y o
bse
rvat
ion
s ar
e t
he
3 m
on
th a
vera
ge.
8 China Resources Quarterly • Southern winter ~ Northern summer
Mo
nth
ly
Jul–
15
Au
g–
15
Sep
–1
5O
ct–
15
No
v–1
5D
ec–
15
Jan
–1
6Fe
b–
16
Mar
–1
6A
pr–
16
May
–1
6Ju
n–
16
Ind
ust
rial
pro
du
ctio
n %
yr 3
mm
a6
.36
.35
.95
.85
.85
.95
.85
.65
.96
.16
.36
.1
Ele
ctri
city
*2
.62
.81
.61
.41
.41
.4n
.a.
n.a
.5
.92
.92
.51
.6
Pro
cess
ed
cru
de
oil*
6.2
5.6
4.7
3.3
2.2
2.8
n.a
.n
.a.
0.5
2.1
1.6
2.8
Ce
me
nt*
–5
.7–
5.1
–4
.1–
3.6
–4
.3–
4.3
n.a
.n
.a.
24
.81
4.2
10
.42
.9
Ste
el p
rod
uct
s*–
0.2
–0
.9–
1.4
–0
.90
.0–
0.7
n.a
.n
.a.
1.7
1.0
1.0
1.2
No
n–
ferr
ou
s m
eta
ls*
22
.62
1.2
18
.41
6.1
13
.69
.9n
.a.
n.a
.3
.82
.82
.10
.0
Au
tom
ob
iles*
–8
.9–
10
.6–
12
.3–
7.0
0.1
8.8
n.a
.n
.a.
4.2
4.6
4.8
6.2
Civ
ilian
sh
ips*
–1
.9–
0.7
–2
.30
.3–
9.8
–9
.1n
.a.
n.a
.–
14
.7–
20
.9–
20
.2–
17
.9
Me
tal c
utt
ing
to
ols
*2
.5–
1.7
–1
4.9
–1
6.4
n.a
.n
.a.
n.a
.n
.a.
n.a
.n
.a.
n.a
.n
.a.
Fixe
d a
sse
t in
vest
me
nt
%yr
3m
ma
10
.51
0.2
8.6
8.4
9.0
9.0
9.3
9.1
10
.51
0.5
9.6
8.3
Man
ufa
ctu
rin
g, o
f w
hic
h8
.77
.76
.46
.87
.47
.47
.16
.56
.96
.24
.12
.1
He
avy
ind
ust
ry6
.25
.43
.44
.94
.95
.74
.44
.14
.44
.02
.6–
0.6
Har
d in
fras
tru
ctu
re, o
f w
hic
h1
7.3
18
.81
6.6
15
.51
6.7
15
.41
6.3
13
.91
7.8
19
.42
0.8
20
.7
Hig
hw
ays
18
.41
4.9
12
.21
3.8
15
.71
3.4
10
.87
.68
.91
0.3
11
.61
4.6
Rai
lway
s2
6.7
12
.33
.4–
10
.2–
10
.7–
13
.6–
13
.4–
17
.4–
8.7
3.1
18
.73
0.4
Uti
litie
s1
5.8
15
.81
4.2
12
.81
4.5
17
.51
8.8
18
.11
9.0
23
.42
2.9
24
.5
Re
al e
stat
e, o
f w
hic
h2
.91
.7–
0.4
–2
.2–
3.5
–3
.1–
1.3
1.4
5.2
7.5
8.6
6.6
Dw
elli
ng
s2
.31
.7–
0.1
–1
.8–
2.9
–3
.0–
1.9
0.3
3.8
6.8
8.8
6.9
No
n–
resi
de
nti
al4
.31
.9–
1.1
–3
.0–
4.8
–3
.4–
0.2
3.6
8.2
8.9
8.3
5.9
Off
–m
arke
t u
rban
co
nst
ruct
ion
–2
9.8
–2
7.2
–3
7.5
–6
.51
7.0
–6
.8–
24
.0–
46
.5–
32
.9–
30
.2–
32
.1–
37
.0
Val
ue
of
ne
w p
roje
ct s
tart
s–
4.5
–3
.81
.2–
0.2
3.9
5.7
19
.22
7.6
40
.33
8.4
31
.12
1.1
Nu
mb
er
of
ne
w p
roje
ct s
tart
s1
8.0
17
.52
3.6
23
.32
7.9
24
.03
2.1
41
.84
6.8
38
.62
8.4
25
.8
Loca
l go
vern
me
nt
pro
ject
s1
0.8
10
.78
.99
.19
.89
.29
.59
.21
1.0
10
.69
.37
.9
Ce
ntr
al g
ove
rnm
en
t p
roje
cts
2.8
0.3
3.2
–3
.0–
4.0
5.3
4.4
5.1
0.1
9.9
15
.11
7.7
Stat
e o
wn
ed
en
terp
rise
inve
stm
en
t1
1.9
12
.51
0.2
10
.61
1.7
9.7
12
.61
4.5
22
.12
3.5
24
.22
3.6
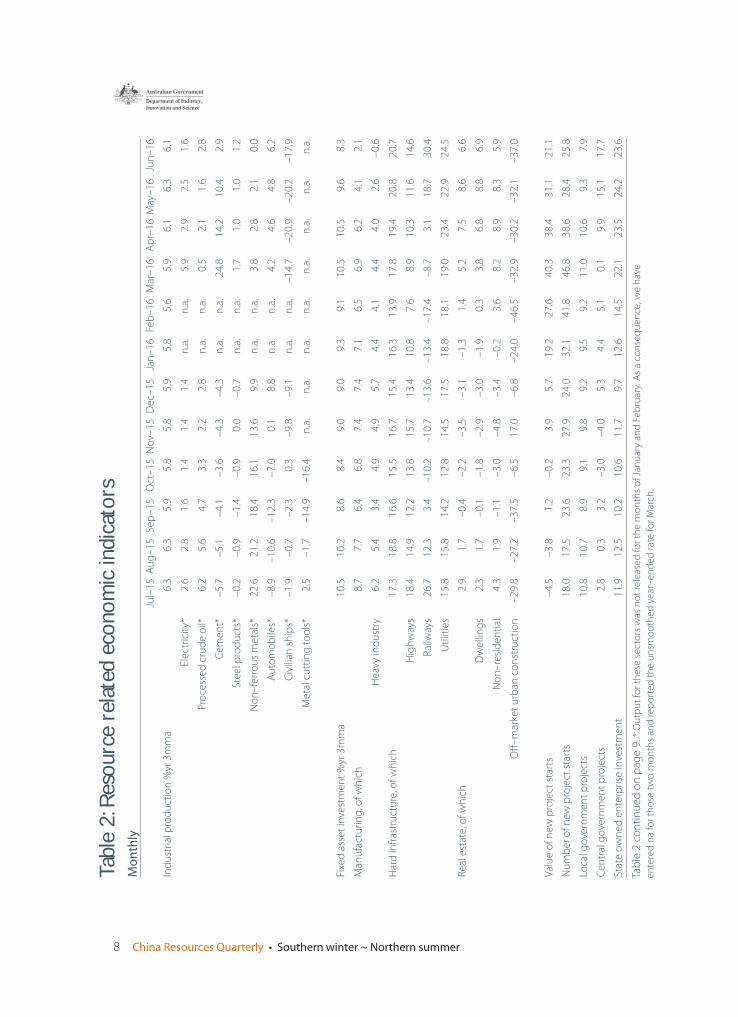
Tabl
e 2:
Res
ourc
e re
late
d ec
onom
ic in
dica
tors
Tab
le 2
co
nti
nu
ed
on
pag
e 9
. * O
utp
ut
for
the
se s
ect
ors
was
no
t re
leas
ed
for
the
mo
nth
s o
f Ja
nu
ary
and
Fe
bru
ary.
As
a co
nse
qu
en
ce, w
e h
ave
en
tere
d n
a fo
r th
ose
tw
o m
on
ths
and
re
po
rte
d t
he
un
smo
oth
ed
ye
ar–
en
de
d r
ate
for
Mar
ch.
China Resources Quarterly • Southern winter ~ Northern summer 9
Mo
nth
ly
%yr
3m
ma
un
less
oth
erw
ise
sp
eci
fi e
dJu
l–1
5A
ug
–1
5Se
p–
15
Oct
–1
5N
ov–
15
De
c–1
5Ja
n–
16
Feb
–1
6M
ar–
16
Ap
r–1
6M
ay–
16
Jun
–1
6
Vo
lum
e o
f h
ou
sin
g s
tart
s–
16
.4–
17
.7–
7.6
–8
.6–
10
.0–
17
.4–
4.7
6.9
18
.12
2.1
21
.11
3.8
Vo
lum
e o
f h
ou
sin
g s
ale
s1
6.6
16
.61
4.2
9.7
7.7
5.2
12
.81
9.3
31
.33
6.6
35
.32
7.6
Val
ue
of
ho
usi
ng
sal
es
– N
atio
nw
ide
11
.61
6.1
17
.91
8.3
18
.01
7.5
27
.93
8.3
52
.95
7.0
58
.45
3.1
East
ern
pro
vin
ces
17
.02
2.9
25
.12
5.4
24
.72
3.7
36
.24
8.9
67
.87
2.7
73
.76
5.0
Ce
ntr
al p
rovi
nce
s5
.99
.01
0.8
12
.01
3.2
13
.62
1.2
28
.33
7.1
41
.04
4.4
45
.1
We
ste
rn p
rovi
nce
s1
.73
.94
.54
.44
.13
.99
.41
4.7
21
.62
3.2
24
.22
2.5
Vo
lum
e o
f la
nd
sal
es
–3
0.6
–3
2.6
–3
3.6
–3
7.1
–3
4.9
–2
6.6
–2
1.8
–1
9.6
–1
1.3
–2
.02
.93
.7
70
cit
y ne
w d
we
llin
g p
rice
s n
et
% r
isin
g m
–o
–m
1.4
18
.62
8.6
–8
.61
1.4
20
.02
0.0
45
.77
7.1
85
.78
0.0
64
.3
70
cit
y se
cond
ary
dw
elli
ng
pri
ces
ne
t %
ris
ing
m–
o–
m3
4.3
34
.33
0.0
27
.13
4.3
14
.31
7.1
8.6
58
.65
8.6
51
.44
8.6
Au
to s
ale
s, o
f w
hic
h–
3.3
–4
.1–
2.7
3.6
11
.31
5.8
14
.57
.55
.34
.88
.41
0.4
pas
sen
ge
r ca
rs–
2.9
–4
.4–
2.2
4.4
13
.41
8.5
17
.28
.85
.95
.09
.31
2.0
Exca
vato
r sa
les
–3
2.2
–3
2.3
–3
1.0
–3
1.6
–2
9.2
–2
8.4
–1
7.8
4.0
19
.71
4.5
1.9
–2
.2
Terr
est
rial
fre
igh
t4
.74
.04
.03
.94
.45
.31
.0–
4.6
–8
.6–
7.7
–5
.8–
5.6
Aq
uat
ic f
reig
ht
4.1
4.1
4.6
5.3
5.9
4.7
2.0
0.5
0.9
2.2
2.3
2.2
Inte
rnat
ion
al a
ir f
reig
ht
5.1
3.9
2.6
2.3
3.6
4.8
8.5
2.1
2.8
–0
.55
.55
.5
Jul–
15
Au
g–
15
Sep
–1
5O
ct–
15
No
v–1
5D
ec–
15
Jan
–1
6Fe
b–
16
Mar
–1
6A
pr–
16
May
–1
6Ju
n–
16
Man
ufa
ctu
rin
g P
MI –
ind
ex
– o
f w
hic
h5
0.0
49
.74
9.8
49
.84
9.6
49
.74
9.4
49
.05
0.2
50
.15
0.1
50
.0
Ou
tpu
t5
2.4
51
.75
2.3
52
.25
1.9
52
.25
1.4
50
.25
2.3
52
.25
2.3
52
.5
Ne
w o
rde
rs4
9.9
49
.75
0.2
50
.34
9.8
50
.24
9.5
48
.65
1.4
51
.05
0.7
50
.5
Ne
w e
xpo
rt o
rde
rs4
7.9
47
.74
7.9
47
.44
6.4
47
.54
6.9
47
.45
0.2
50
.15
0.0
49
.6
Raw
mat
eri
al in
ven
tori
es
48
.44
8.3
47
.54
7.2
47
.14
7.6
46
.84
8.0
48
.24
7.4
47
.64
7.0
Fin
ish
ed
go
od
s in
ven
tori
es
47
.44
7.2
46
.84
7.2
46
.74
6.1
44
.64
6.4
46
.04
5.5
46
.84
6.5
Pu
rch
ase
s o
f in
pu
ts5
0.3
49
.44
8.6
48
.84
8.3
50
.34
9.0
47
.95
2.6
51
.05
1.2
50
.5
Imp
ort
s4
7.8
47
.24
8.1
47
.54
6.7
47
.64
6.4
45
.85
0.1
49
.54
9.6
49
.1
Ne
w o
rde
rs t
o fi
nis
he
d g
oo
ds
inve
nto
rie
s ra
tio
1.0
51
.05
1.0
71
.07
1.0
71
.09
1.1
11
.05
1.1
21
.12
1.0
81
.09
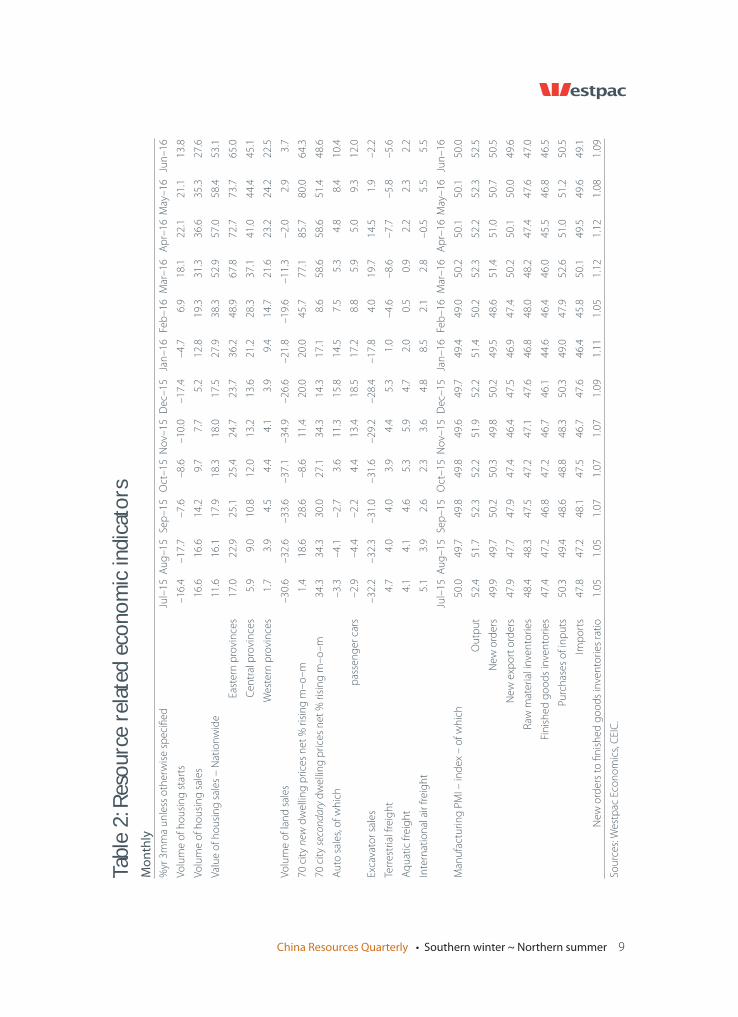
Sou
rce
s: W
est
pac
Eco
no
mic
s, C
EIC
.
Tabl
e 2:
Res
ourc
e re
late
d ec
onom
ic in
dica
tors
10 China Resources Quarterly • Southern winter ~ Northern summer
Steel
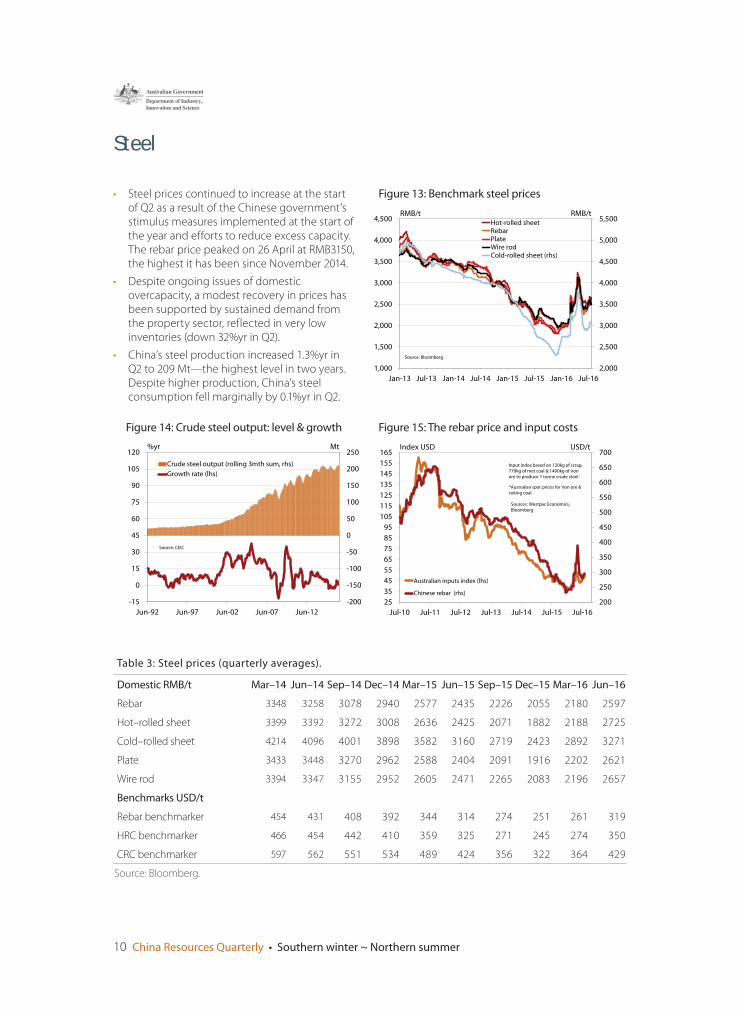
• Steel prices continued to increase at the start of Q2 as a result of the Chinese government’s stimulus measures implemented at the start of the year and efforts to reduce excess capacity. The rebar price peaked on 26 April at RMB3150, the highest it has been since November 2014.
• Despite ongoing issues of domestic overcapacity, a modest recovery in prices has been supported by sustained demand from the property sector, reflected in very low inventories (down 32%yr in Q2).
• China’s steel production increased 1.3%yr in Q2 to 209 Mt—the highest level in two years. Despite higher production, China’s steel consumption fell marginally by 0.1%yr in Q2.
2,000
2,500
3,000
3,500
4,000
4,500
5,000
5,500
1,000
1,500
2,000
2,500
3,000
3,500
4,000
4,500
Jan-13 Jul-13 Jan-14 Jul-14 Jan-15 Jul-15 Jan-16 Jul-16
RMB/tRMB/tHot-rolled sheetRebarPlateWire rodCold-rolled sheet (rhs)
Source: Bloomberg
200
250
300
350
400
450
500
550
600
650
700
25
35
45
55
65
75
85
95
105
115
125
135
145
155
165
Jul-10 Jul-11 Jul-12 Jul-13 Jul-14 Jul-15 Jul-16
USD/tIndex USD
Australian inputs index (lhs)
Chinese rebar (rhs)
Sources: Westpac Economics,
Bloomberg
Input index based on 120kg of scrap, 770kg of met coal & 1400kg of iron
ore to produce 1 tonne crude steel
*Australian spot prices for iron ore & coking coal.
-200
-150
-100
-50
0
50
100
150
200
250
-15
0
15
30
45
60
75
90
105
120
Jun-92 Jun-97 Jun-02 Jun-07 Jun-12
%yr Mt
Crude steel output (rolling 3mth sum, rhs)
Growth rate (lhs)
Source: CEIC
Figure 13: Benchmark steel prices
Figure 14: Crude steel output: level & growth Figure 15: The rebar price and input costs
Table 3: Steel prices (quarterly averages).
Domestic RMB/t Mar–14 Jun–14 Sep–14 Dec–14 Mar–15 Jun–15 Sep–15 Dec–15 Mar–16 Jun–16
Rebar 3348 3258 3078 2940 2577 2435 2226 2055 2180 2597
Hot–rolled sheet 3399 3392 3272 3008 2636 2425 2071 1882 2188 2725
Cold–rolled sheet 4214 4096 4001 3898 3582 3160 2719 2423 2892 3271
Plate 3433 3448 3270 2962 2588 2404 2091 1916 2202 2621
Wire rod 3394 3347 3155 2952 2605 2471 2265 2083 2196 2657
Benchmarks USD/t
Rebar benchmarker 454 431 408 392 344 314 274 251 261 319
HRC benchmarker 466 454 442 410 359 325 271 245 274 350
CRC benchmarker 597 562 551 534 489 424 356 322 364 429
Source: Bloomberg.
China Resources Quarterly • Southern winter ~ Northern summer 11
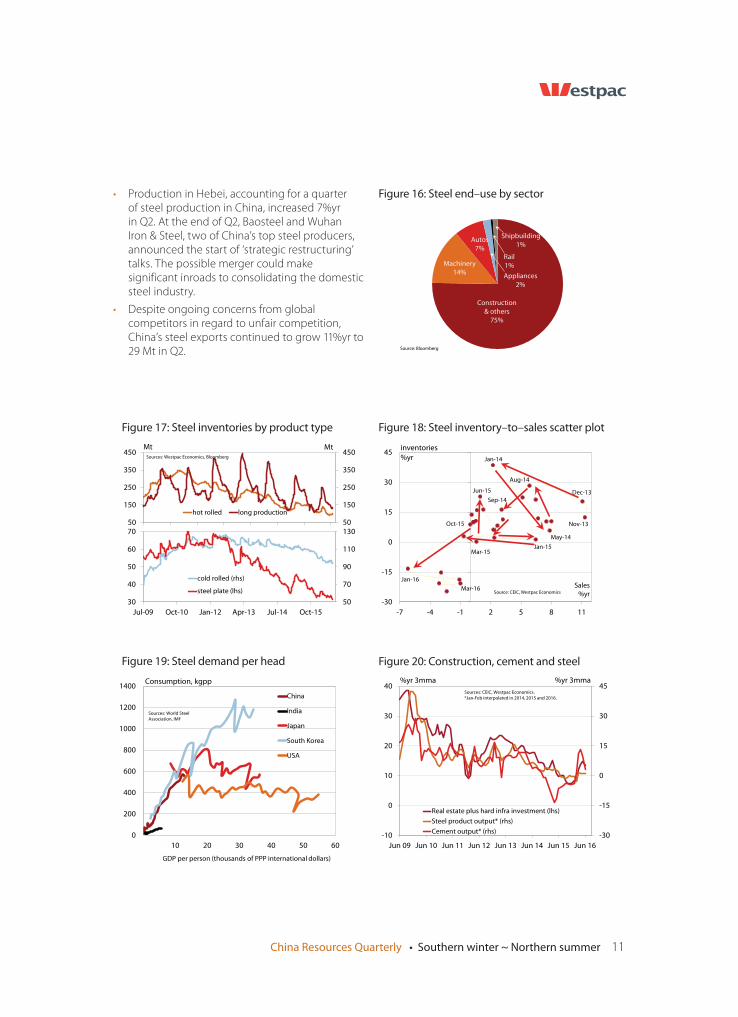
• Production in Hebei, accounting for a quarter of steel production in China, increased 7%yr in Q2. At the end of Q2, Baosteel and Wuhan Iron & Steel, two of China’s top steel producers, announced the start of ‘strategic restructuring’ talks. The possible merger could make significant inroads to consolidating the domestic steel industry.
• Despite ongoing concerns from global competitors in regard to unfair competition, China’s steel exports continued to grow 11%yr to 29 Mt in Q2.
0
200
400
600
800
1000
1200
1400
10 20 30 40 50 60
GDP per person (thousands of PPP international dollars)
China
India
Japan
South Korea
USA
Sources: World Steel
Association, IMF
Consumption, kgpp
Figure 19: Steel demand per head
Construction
& others
75%
Machinery
14%
Autos
7%
Appliances
2%
Rail
1%
Shipbuilding
1%
Source: Bloomberg
-30
-15
0
15
30
45
-7 -4 -1 2 5 8 11
inventories
%yr
Sales%yr
Nov-13
Jan-14
May-14
Jan-15
Dec-13Sep-14
Aug-14
Jan-16
Mar-15
Oct-15
Jun-15
Mar-16Source: CEIC, Westpac Economics
-30
-15
0
15
30
45
-10
0
10
20
30
40
Jun 09 Jun 10 Jun 11 Jun 12 Jun 13 Jun 14 Jun 15 Jun 16
%yr 3mma%yr 3mma
Real estate plus hard infra investment (lhs)
Steel product output* (rhs)
Cement output* (rhs)
Sources: CEIC, Westpac Economics.
*Jan-Feb interpolated in 2014, 2015 and 2016.
Figure 16: Steel end–use by sector
Figure 18: Steel inventory–to–sales scatter plot
Figure 20: Construction, cement and steel
Figure 17: Steel inventories by product type
50
150
250
350
450
50
150
250
350
450Mt Mt
hot rolled long production
Sources: Westpac Economics, Bloomberg
30
40
50
60
70
50
70
90
110
130
Jul-09 Oct-10 Jan-12 Apr-13 Jul-14 Oct-15
cold rolled (rhs)
steel plate (lhs)
12 China Resources Quarterly • Southern winter ~ Northern summer
Table 4: Iron ore prices (USD/t, 62% ferrous metal content unless otherwise indicated).
Qingdao spot price, CFR Mar–14 Jun–14 Sep–14 Dec–14 Mar–15 Jun–15 Sep–15 Dec–15 Mar–16 Jun–16
Quarter average 121 103 90 74 62 58 55 47 49 55
Quarter end 117 94 78 71 51 59 56 44 54 56
Quarter high 135 120 98 84 71 66 59 57 64 70
Quarter low 104 89 78 67 51 47 45 38 40 48
Qingdao price in CNY terms, CFR 736 642 558 457 390 363 346 299 318 363
IODEX Aust FOB 110.8 93.9 81.4 66.1 57.6 53.2 48.8 41.8 45.0 52.5
Sources: Bloomberg. CFR is cost including freight. FOB is free on board.
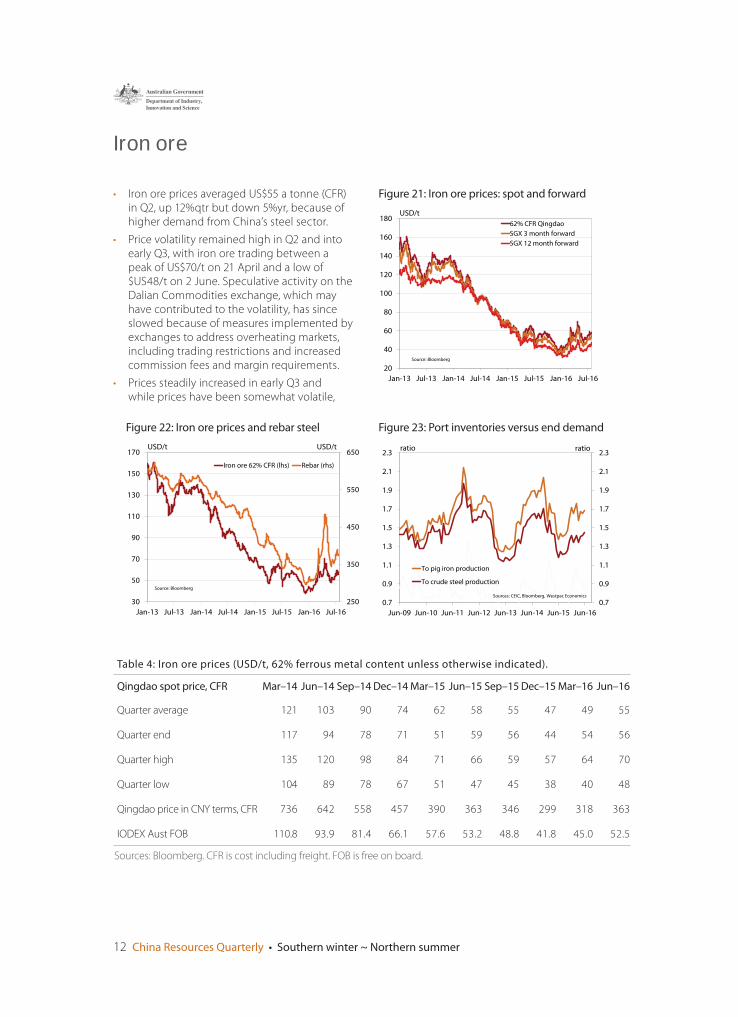
• Iron ore prices averaged US$55 a tonne (CFR) in Q2, up 12%qtr but down 5%yr, because of higher demand from China’s steel sector.
• Price volatility remained high in Q2 and into early Q3, with iron ore trading between a peak of US$70/t on 21 April and a low of $US48/t on 2 June. Speculative activity on the Dalian Commodities exchange, which may have contributed to the volatility, has since slowed because of measures implemented by exchanges to address overheating markets, including trading restrictions and increased commission fees and margin requirements.
• Prices steadily increased in early Q3 and while prices have been somewhat volatile,
20
40
60
80
100
120
140
160
180
Jan-13 Jul-13 Jan-14 Jul-14 Jan-15 Jul-15 Jan-16 Jul-16
USD/t
62% CFR Qingdao
SGX 3 month forward
SGX 12 month forward
Source: Bloomberg
250
350
450
550
650
30
50
70
90
110
130
150
170
Jan-13 Jul-13 Jan-14 Jul-14 Jan-15 Jul-15 Jan-16 Jul-16
USD/tUSD/t
Iron ore 62% CFR (lhs) Rebar (rhs)
Source: Bloomberg
Figure 21: Iron ore prices: spot and forward
Figure 22: Iron ore prices and rebar steel Figure 23: Port inventories versus end demand
Iron ore
0.7
0.9
1.1
1.3
1.5
1.7
1.9
2.1
2.3
0.7
0.9
1.1
1.3
1.5
1.7
1.9
2.1
2.3
Jun-09 Jun-10 Jun-11 Jun-12 Jun-13 Jun-14 Jun-15 Jun-16
ratioratio
To pig iron production
To crude steel production
Sources: CEIC, Bloomberg, Westpac Economics
China Resources Quarterly • Southern winter ~ Northern summer 13
in responce to weakening sentiment towards China’s property market due to an absence of any further government stimulus, they were around US60/t on August 5.
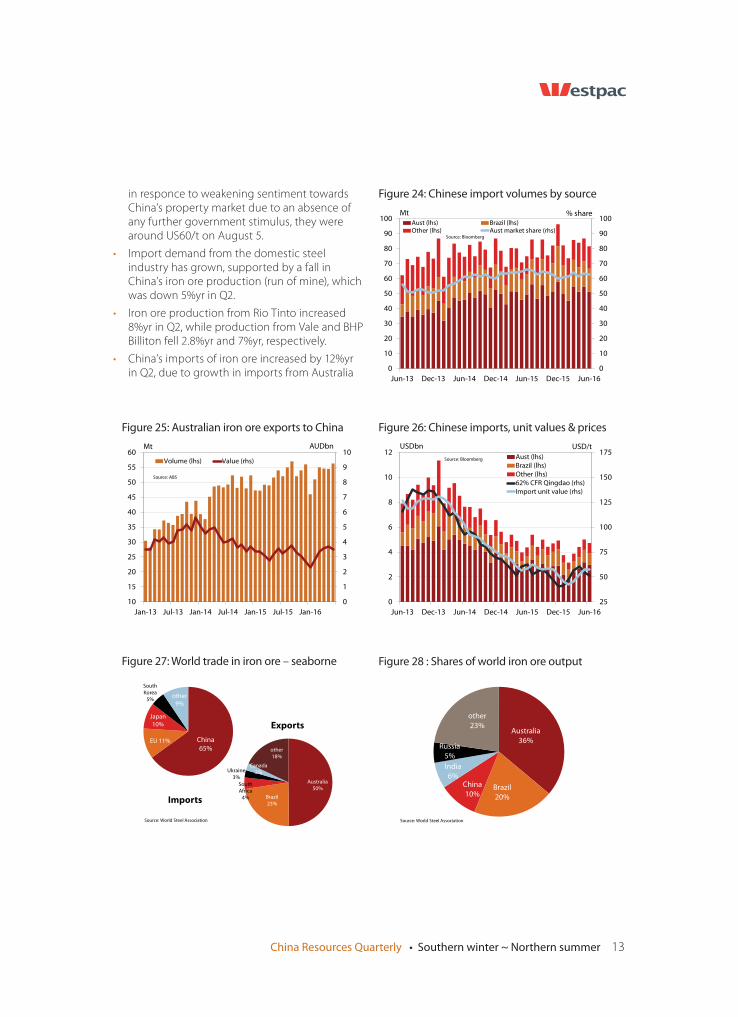
• Import demand from the domestic steel industry has grown, supported by a fall in China’s iron ore production (run of mine), which was down 5%yr in Q2.
• Iron ore production from Rio Tinto increased 8%yr in Q2, while production from Vale and BHP Billiton fell 2.8%yr and 7%yr, respectively.
• China’s imports of iron ore increased by 12%yr in Q2, due to growth in imports from Australia
China
65%EU 11%
Japan
10%
South
Korea
5%other
9%
Imports
Source: World Steel Association
Australia
50%
Brazil
23%
South
Africa
4%
Ukraine
3%
Canada
2%
other
18%
Exports
Figure 27: World trade in iron ore – seaborne
0
10
20
30
40
50
60
70
80
90
100
0
10
20
30
40
50
60
70
80
90
100
Jun-13 Dec-13 Jun-14 Dec-14 Jun-15 Dec-15 Jun-16
% shareMt
Aust (lhs) Brazil (lhs)Other (lhs) Aust market share (rhs)
Source: Bloomberg
25
50
75
100
125
150
175
0
2
4
6
8
10
12
Jun-13 Dec-13 Jun-14 Dec-14 Jun-15 Dec-15 Jun-16
USD/tUSDbn
Aust (lhs)
Brazil (lhs)
Other (lhs)
62% CFR Qingdao (rhs)
Import unit value (rhs)
Source: Bloomberg
Australia
36%
Brazil
20%
China
10%
India
6%
Russia
5%
other
23%
Source: World Steel Association
Figure 24: Chinese import volumes by source
Figure 26: Chinese imports, unit values & prices
Figure 28 : Shares of world iron ore output
Figure 25: Australian iron ore exports to China
0
1
2
3
4
5
6
7
8
9
10
10
15
20
25
30
35
40
45
50
55
60
Jan-13 Jul-13 Jan-14 Jul-14 Jan-15 Jul-15 Jan-16
AUDbnMt
Volume (lhs) Value (rhs)
Source: ABS
14 China Resources Quarterly • Southern winter ~ Northern summer
0 225 450 675 900 1125 1350 1575
USD/t
Others
South Africa
Russian Federation
Canada
China
India
Australia
Brazil
current TSI $62/t cfr
Sources: WoodMcKenzie, Westpac Economics. Includes
mining, royalties, freight from mine to port,
administration and processing.
Cumulative export supply, mt
0
5
10
15
20
25
30
35
0
5
10
15
20
25
30
35
Jun-07 Dec-08 Jun-10 Dec-11 Jun-13 Dec-14 Jun-16
% share% share
Number of Chinese ferrous mining firms
making a loss, % of total
Sources: CEIC, Bloomberg,
Westpac Economics
Figure 32: Chinese iron ore miners: loss–makers Figure 33: Seaborne iron ore cost curve
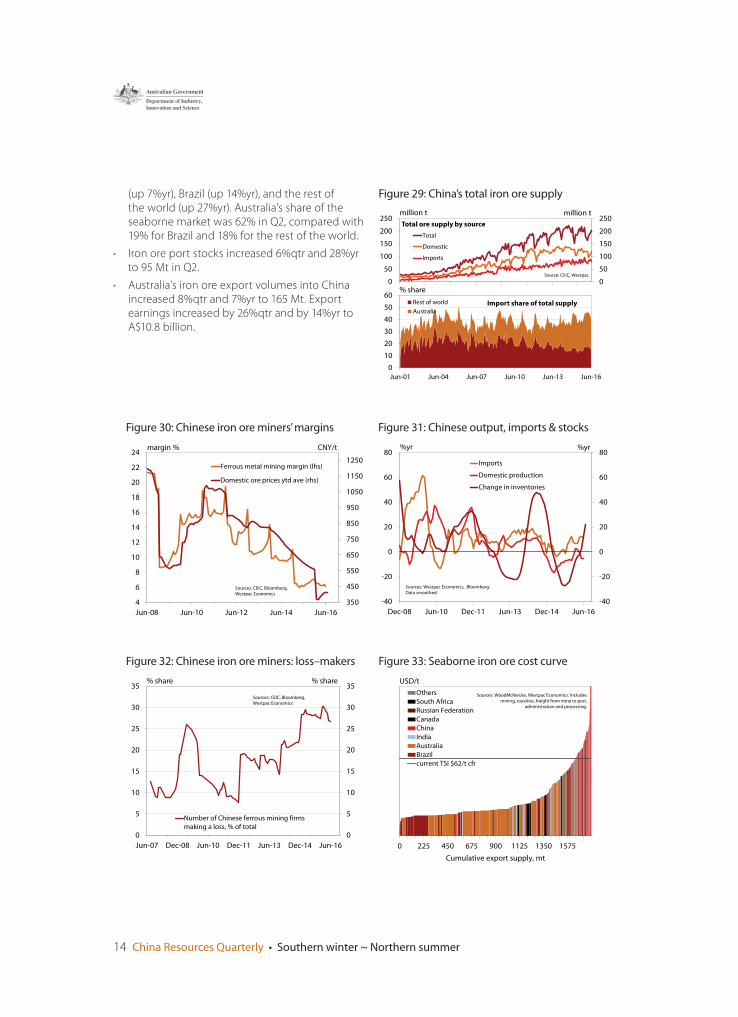
(up 7%yr), Brazil (up 14%yr), and the rest of the world (up 27%yr). Australia’s share of the seaborne market was 62% in Q2, compared with 19% for Brazil and 18% for the rest of the world.
• Iron ore port stocks increased 6%qtr and 28%yr to 95 Mt in Q2.
• Australia’s iron ore export volumes into China increased 8%qtr and 7%yr to 165 Mt. Export earnings increased by 26%qtr and by 14%yr to A$10.8 billion.
0
50
100
150
200
250
0
50
100
150
200
250million tmillion t
Total
Domestic
Imports
Source: CEIC, Westpac.
0
10
20
30
40
50
60
Jun-01 Jun-04 Jun-07 Jun-10 Jun-13 Jun-16
% share
Rest of world
Australia
Import share of total supply
Total ore supply by source
-40
-20
0
20
40
60
80
-40
-20
0
20
40
60
80
Dec-08 Jun-10 Dec-11 Jun-13 Dec-14 Jun-16
%yr%yr
Imports
Domestic production
Change in inventories
Sources: Westpac Economics, Bloomberg.
Data smoothed.
350
450
550
650
750
850
950
1050
1150
1250
4
6
8
10
12
14
16
18
20
22
24
Jun-08 Jun-10 Jun-12 Jun-14 Jun-16
CNY/tmargin %
Ferrous metal mining margin (lhs)
Domestic ore prices ytd ave (rhs)
Sources: CEIC, Bloomberg,
Westpac Economics
Figure 30: Chinese iron ore miners’ margins Figure 31: Chinese output, imports & stocks
Figure 29: China’s total iron ore supply
China Resources Quarterly • Southern winter ~ Northern summer 15
Iro
n o
reu
nit
Mar
–1
4Ju
n–
14
Se
p–
14
De
c–1
4M
ar–
15
Jun
–1
5S
ep
–1
5D
ec–
15
Mar
–1
6Ju
n–
16
Ch
ina
imp
ort
sM
t2
22
.02
35
.32
42
.12
33
.62
27
.12
26
.02
46
.32
53
.92
41
.62
52
.3
Au
stra
liaM
t1
18
.21
38
.21
49
.41
42
.71
44
.41
46
.81
58
.51
57
.91
50
.11
57
.4
Bra
zil
Mt
41
.63
8.9
44
.74
5.8
41
.84
2.3
50
.15
7.5
53
.64
8.3
valu
eU
SDb
n2
8.4
25
.72
1.9
18
.51
5.8
13
.21
4.8
14
.11
0.8
14
.2
Raw
pro
du
ctio
n *
Mt
30
4.2
39
3.6
41
0.6
38
9.3
28
0.6
35
0.2
38
1.6
36
2.6
26
0.0
33
1.2
Iro
n o
re s
tock
s at
po
rts,
en
d o
f q
trM
t1
03
.81
05
.71
03
.29
5.2
93
.37
4.1
80
.98
9.3
89
.49
4.9
we
eks
of
imp
ort
sw
ee
ks6
.16
.26
.15
.65
.54
.44
.85
.35
.35
.6
Au
stra
lian
exp
ort
s to
Ch
ina
Mt
12
2.2
14
5.8
14
9.7
15
2.2
14
3.7
15
4.6
16
3.9
16
1.9
15
2.4
16
5.4
valu
eA
UD
bn
14
.41
3.4
11
.91
0.9
9.8
9.5
10
.59
.08
.61
0.8
Me
tallu
rgic
al c
oa
l
Ch
ina
imp
ort
sM
t1
3.0
18
.11
3.4
18
.01
0.9
10
.71
4.8
11
.61
1.4
15
.6
valu
eU
SDm
n1
63
41
81
21
27
01
73
69
80
88
31
16
37
91
74
29
82
Au
stra
lian
exp
ort
s to
Ch
ina
Mt
10
.11
1.6
11
.21
3.4
7.7
11
.08
.69
.19
.31
0.4
valu
eA
UD
mn
12
48
12
38
11
43
15
14
95
71
16
09
26
89
29
53
10
50
Sou
rce
s: B
loo
mb
erg
, AB
S, C
EIC
. * R
aw m
ine
ou
tpu
t w
ith
a lo
w ir
on
co
nte
nt.
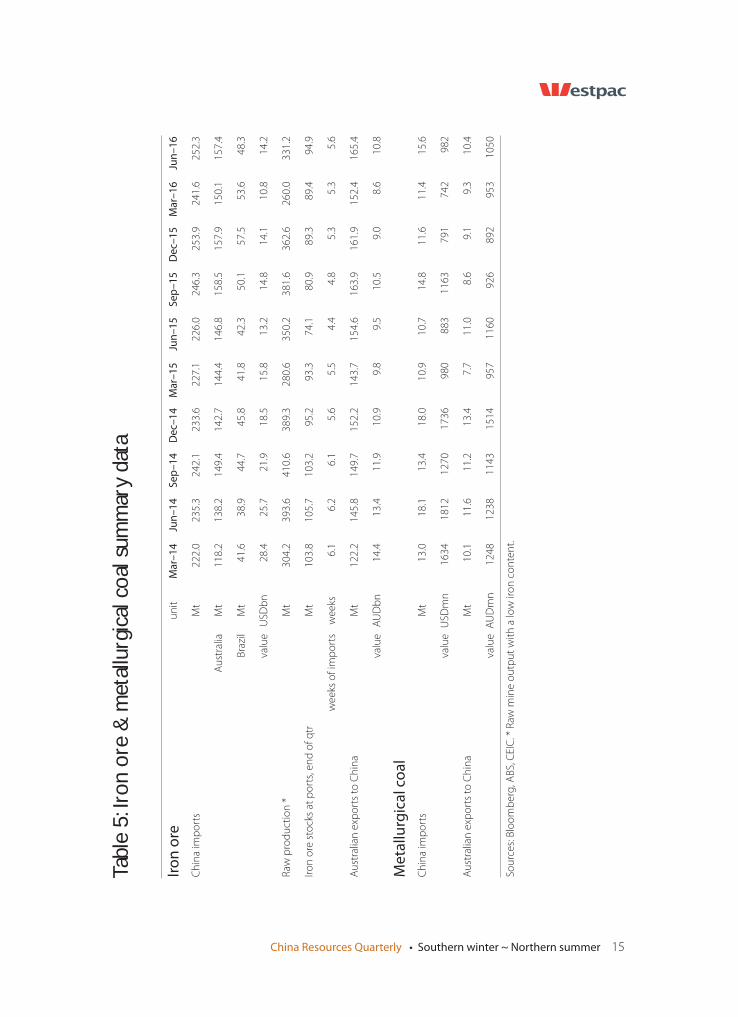
Tabl
e 5:
Iron
ore
& m
etal
lurg
ical
coa
l sum
mar
y da
ta
16 China Resources Quarterly • Southern winter ~ Northern summer
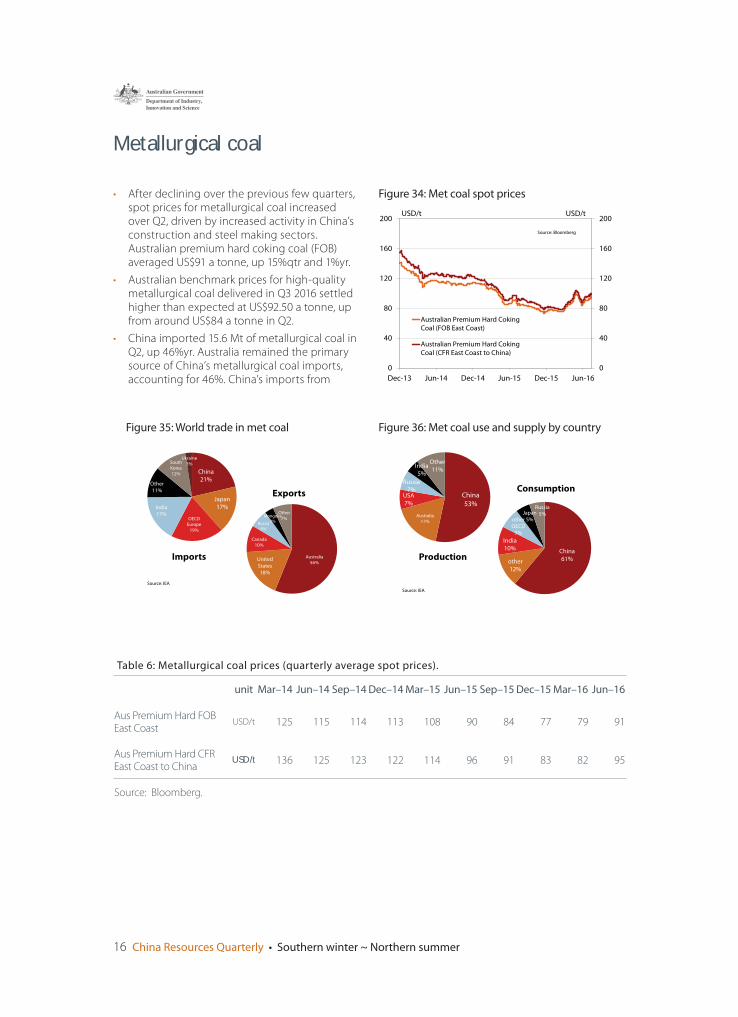
Metallurgical coal
• After declining over the previous few quarters, spot prices for metallurgical coal increased over Q2, driven by increased activity in China’s construction and steel making sectors. Australian premium hard coking coal (FOB) averaged US$91 a tonne, up 15%qtr and 1%yr.
• Australian benchmark prices for high-quality metallurgical coal delivered in Q3 2016 settled higher than expected at US$92.50 a tonne, up from around US$84 a tonne in Q2.
• China imported 15.6 Mt of metallurgical coal in Q2, up 46%yr. Australia remained the primary source of China’s metallurgical coal imports, accounting for 46%. China’s imports from
0
40
80
120
160
200
0
40
80
120
160
200
Dec-13 Jun-14 Dec-14 Jun-15 Dec-15 Jun-16
USD/tUSD/t
Australian Premium Hard CokingCoal (FOB East Coast)
Australian Premium Hard Coking
Coal (CFR East Coast to China)
Source: Bloomberg
China
53%
Australia
17%
USA
7%
Russia
7%
India
5%
Other
11%
Production
Source: IEA
China
61%other
12%
India
10%
other
OECD
7%
Japan
5%
Russia
5%
Consumption
China
21%
Japan
17%
OECD
Europe
19%
India
17%
Other
11%
South
Korea
12%
Ukraine
3%
Imports
Source: IEA
Australia
56%United
States
18%
Canada
10%
Russia6%
Mongolia3%
Other
7%
Exports
Figure 34: Met coal spot prices
Figure 35: World trade in met coal Figure 36: Met coal use and supply by country
Table 6: Metallurgical coal prices (quarterly average spot prices).
unit Mar–14 Jun–14 Sep–14 Dec–14 Mar–15 Jun–15 Sep–15 Dec–15 Mar–16 Jun–16
Aus Premium Hard FOB East Coast
USD/t 125 115 114 113 108 90 84 77 79 91
Aus Premium Hard CFR East Coast to China
USD/t 136 125 123 122 114 96 91 83 82 95
Source: Bloomberg.
China Resources Quarterly • Southern winter ~ Northern summer 17
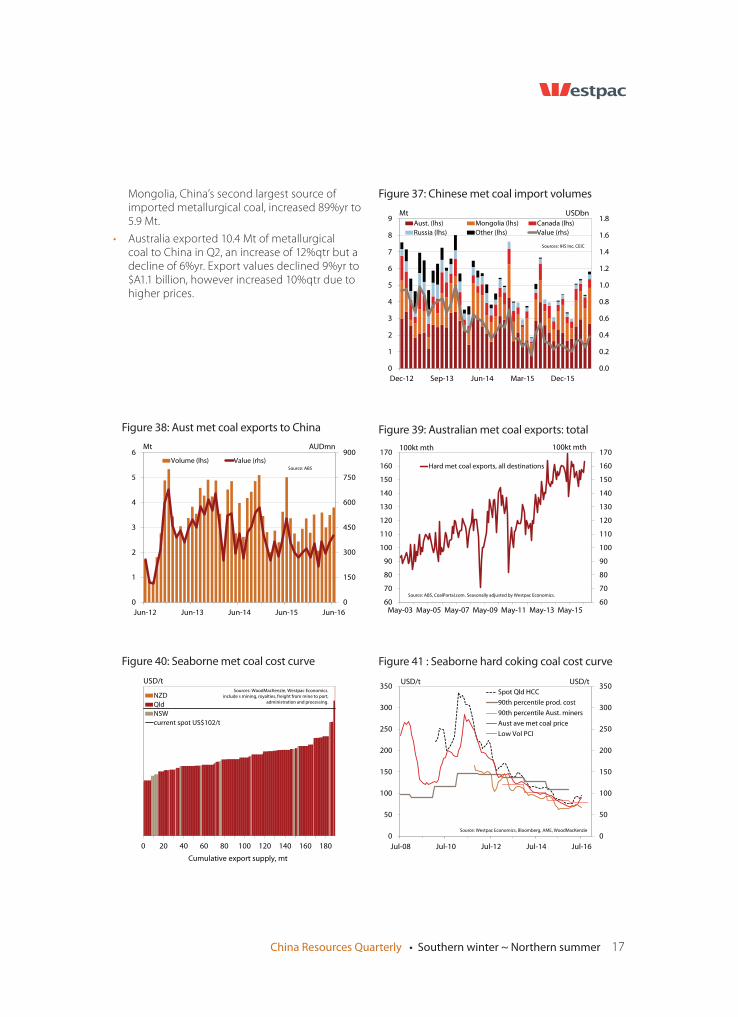
Mongolia, China’s second largest source of imported metallurgical coal, increased 89%yr to 5.9 Mt.
• Australia exported 10.4 Mt of metallurgical coal to China in Q2, an increase of 12%qtr but a decline of 6%yr. Export values declined 9%yr to $A1.1 billion, however increased 10%qtr due to higher prices.
0 20 40 60 80 100 120 140 160 180
USD/t
NZD
Qld
NSW
current spot US$102/t
Sources: WoodMacKenzie, Westpac Economics. include s mining, royalties, freight from mine to port,
administration and processing.
Cumulative export supply, mt
Figure 40: Seaborne met coal cost curve
0.0
0.2
0.4
0.6
0.8
1.0
1.2
1.4
1.6
1.8
0
1
2
3
4
5
6
7
8
9
Dec-12 Sep-13 Jun-14 Mar-15 Dec-15
USDbnMt
Aust. (lhs) Mongolia (lhs) Canada (lhs)
Russia (lhs) Other (lhs) Value (rhs)
Sources: IHS Inc, CEIC
60
70
80
90
100
110
120
130
140
150
160
170
May-03 May-05 May-07 May-09 May-11 May-13 May-1560
70
80
90
100
110
120
130
140
150
160
170100kt mth100kt mth
Hard met coal exports, all destinations
Source: ABS, CoalPortal.com. Seasonally adjusted by Westpac Economics.
0
150
300
450
600
750
900
0
1
2
3
4
5
6
Jun-12 Jun-13 Jun-14 Jun-15 Jun-16
AUDmnMt
Volume (lhs) Value (rhs)Source: ABS
0
50
100
150
200
250
300
350
Jul-08 Jul-10 Jul-12 Jul-14 Jul-16
0
50
100
150
200
250
300
350USD/tUSD/t
Spot Qld HCC
90th percentile prod. cost
90th percentile Aust. miners
Aust ave met coal price
Low Vol PCI
Source: Westpac Economics, Bloomberg, AME, WoodMacKenzie
Figure 37: Chinese met coal import volumes
Figure 39: Australian met coal exports: total Figure 38: Aust met coal exports to China
Figure 41 : Seaborne hard coking coal cost curve
18 China Resources Quarterly • Southern winter ~ Northern summer
Developments in China’s energy policy
• The National Energy Administration (NEA) has urged China’s northeast region to cancel or postpone coal-fired power generation projects with a joint capacity of over 7.5 million kilowatts due to excess power generation. An 800 kilovolt direct current power transmission project in the northeast region will be completed in 2017 to send the region’s power to other parts of the country.
• During Angela Merkel’s visit to Beijing in June for the fourth-round of China-Germany intergovernmental consultation, Premier Li Keqiang called for both countries to use innovation to expand common interests and energy cooperation.
• To improve Beijing’s air quality, the Beijing Municipal Environmental Protection Bureau announced in June that subsidies will be provided to gas boilers that are able to reduce emission of nitrogen by at least 50 percent from their renovations. The subsidies will cover one fourth to one third of renovation costs. To reach an emission standard of no more than 80 milligrams per cubic meter by April 2017, 10,000 gas-fired boilers in the city proper, mainly in the six urban districts, will be renovated.
• In June, through the 7th Clean Energy Ministerial global forum, President Xi Jinping outlined China’s policy intention to continue boosting and coordinating innovative green and low-carbon developments. While President Jinping was unable to attend the forum, he sent a letter which highlighted China’s plans to optimise its industrial structure, set up a low-carbon energy system, promote green buildings and low-carbon transport, and establish a national carbon emission trading market.
• In late May, the State owned, China Southern Power Grid announced that it will install 25,000 charging posts for electric vehicles by 2020. This follows a similar decision in December 2015 by northern China’s distributor State Grid Corp to install 120,000 charging posts over the next few years. The 3 billion yuan plan for 25,000 posts would require building
674, multiple-post charging stations in the provinces of Guangdong, Yunnan, Guizhou and Hainan and the Guangxi Zhuang Autonomous Region.
• During the 13th meeting of the China-Russia Energy Cooperation Committee in May, Chinese Vice-Premier Zhang Gaoli and his Russian counterpart, Arkady Dvorkovich, agreed to increase and build energy cooperation between the countries. This agreement comes on the back of development of energy trade between the countries and substantial progress on major strategic energy projects since the last meeting in November 2015.
• The National Government Offices Administration announced in May that over half the new vehicles in China’s Central State Departments will be new energy vehicles (partially or fully powered by electricity) within five years to encourage environmentally friendly means of travel.
Electricity trends
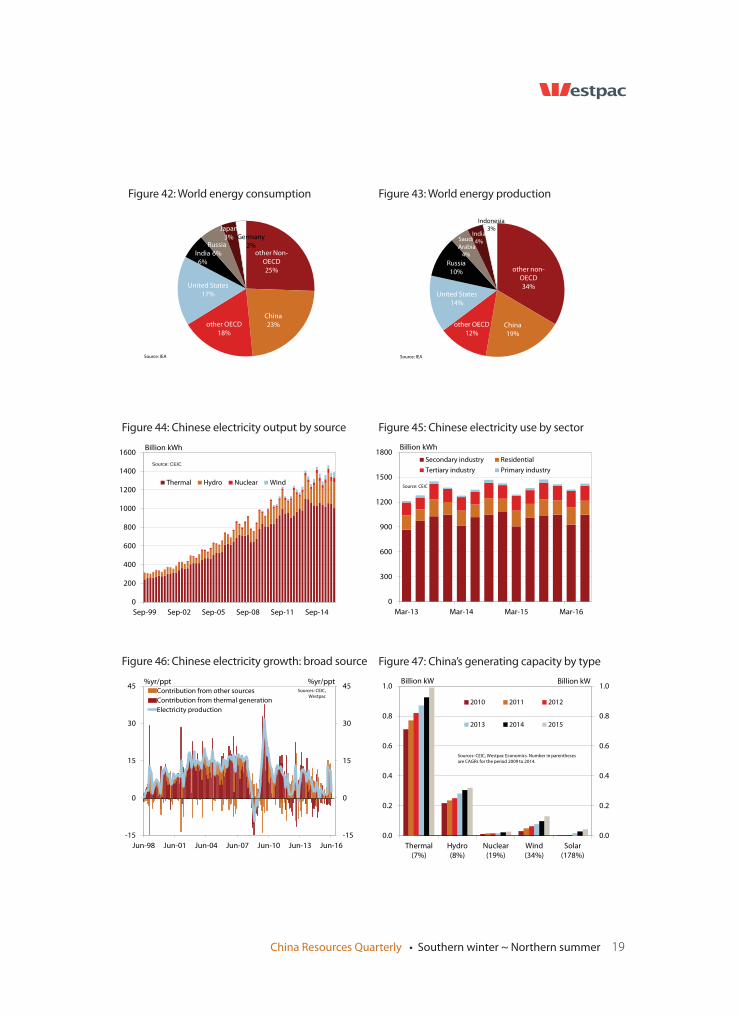
• China generated 1.4 trillion kWh of electricity in Q2, a 1.7%yr increase relative to the same period in 2015. Over the same period, generation increased across all energy sources except for thermal, which declined by 1.7%yr. Hydro, nuclear and wind electricity generation increased by 11%yr, 18%yr and 26.4%yr respectively.
• Investment in new generation capacity decreased 9.5%yr in Q2 relative to the same period in 2015, to RMB 277.6 billion. Investment declined in hydro, thermal and wind electricity generation by 19%yr, 9%yr, and 34%yr respectively. Conversely, investment in nuclear generation capacity was up by 5.8%yr.
• Overall electricity consumption in China increased 3.8%yr to 1422 billion kWh in Q2 relative to the same period in 2015. Consumption across all sectors increased with primary, secondary, tertiary and residential electricity use up by 8%yr, 3%yr, 7%yr and 4%yr respectively.
China Resources Quarterly • Southern winter ~ Northern summer 19
-15
0
15
30
45
-15
0
15
30
45
Jun-98 Jun-01 Jun-04 Jun-07 Jun-10 Jun-13 Jun-16
Contribution from other sources
Contribution from thermal generation
Electricity production
%yr/ppt %yr/pptSources: CEIC,
Westpac
Figure 46: Chinese electricity growth: broad source
other non-
OECD34%
China
19%
other OECD
12%
United States
14%
Russia
10%
Saudi
Arabia4%
India
4%
Indonesia
3%
Source: IEA
other Non-
OECD25%
China
23%other OECD
18%
United States
17%
India
6%
Russia
6%
Japan
3% Germany
2%
Source: IEA
0
300
600
900
1200
1500
1800
Mar-13 Mar-14 Mar-15 Mar-16
Billion kWh
Secondary industry Residential
Tertiary industry Primary industry
Source: CEIC
0
200
400
600
800
1000
1200
1400
1600
Sep-99 Sep-02 Sep-05 Sep-08 Sep-11 Sep-14
Billion kWh
Thermal Hydro Nuclear Wind
Source: CEIC
0.0
0.2
0.4
0.6
0.8
1.0
0.0
0.2
0.4
0.6
0.8
1.0
Thermal
(7%)
Hydro
(8%)
Nuclear
(19%)
Wind
(34%)
Solar
(178%)
Billion kWBillion kW
2010 2011 2012
2013 2014 2015
Sources: CEIC, Westpac Economics. Number in parentheses
are CAGRs for the period 2009 to 2014.
Figure 43: World energy productionFigure 42: World energy consumption
Figure 45: Chinese electricity use by sectorFigure 44: Chinese electricity output by source
Figure 47: China’s generating capacity by type
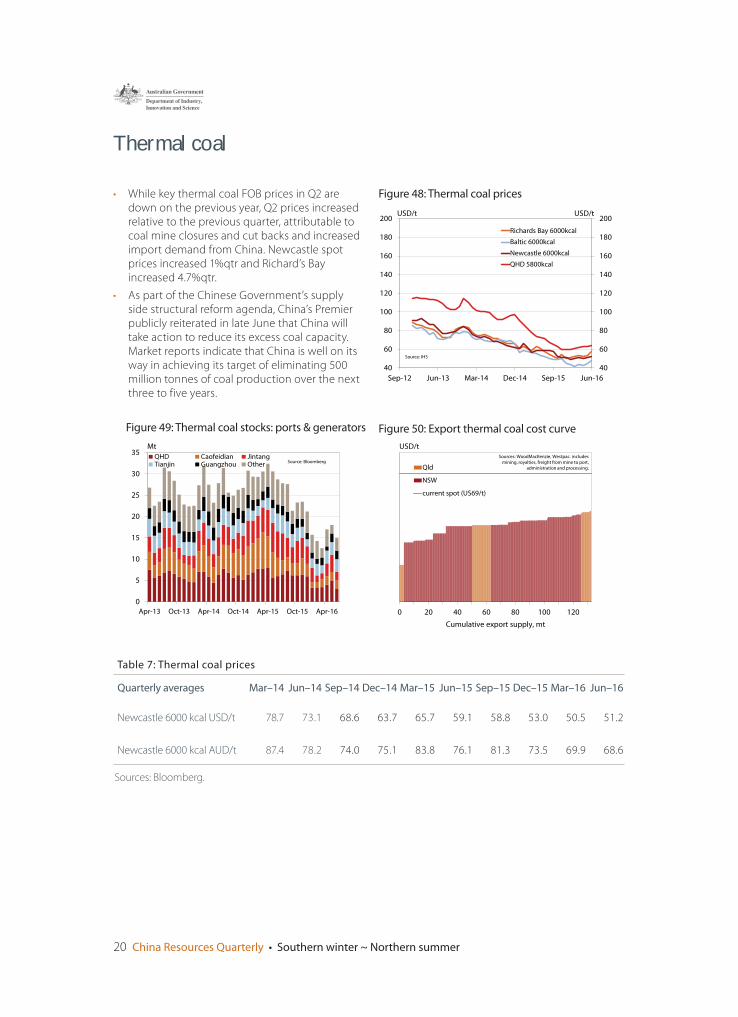
20 China Resources Quarterly • Southern winter ~ Northern summer
Thermal coal
• While key thermal coal FOB prices in Q2 are down on the previous year, Q2 prices increased relative to the previous quarter, attributable to coal mine closures and cut backs and increased import demand from China. Newcastle spot prices increased 1%qtr and Richard’s Bay increased 4.7%qtr.
• As part of the Chinese Government’s supply side structural reform agenda, China’s Premier publicly reiterated in late June that China will take action to reduce its excess coal capacity. Market reports indicate that China is well on its way in achieving its target of eliminating 500 million tonnes of coal production over the next three to five years.
40
60
80
100
120
140
160
180
200
40
60
80
100
120
140
160
180
200
Sep-12 Jun-13 Mar-14 Dec-14 Sep-15 Jun-16
USD/tUSD/t
Richards Bay 6000kcal
Baltic 6000kcal
Newcastle 6000kcal
QHD 5800kcal
Source: IHS
0 20 40 60 80 100 120
USD/t
Qld
NSW
current spot (US69/t)
Sources: WoodMacKenzie, Westpac. includes
mining, royalties, freight from mine to port, administration and processing.
Cumulative export supply, mt
0
5
10
15
20
25
30
35
Apr-13 Oct-13 Apr-14 Oct-14 Apr-15 Oct-15 Apr-16
Mt
QHD Caofeidian JintangTianjin Guangzhou Other Source: Bloomberg
Figure 48: Thermal coal prices
Figure 49: Thermal coal stocks: ports & generators Figure 50: Export thermal coal cost curve
Table 7: Thermal coal prices
Quarterly averages Mar–14 Jun–14 Sep–14 Dec–14 Mar–15 Jun–15 Sep–15 Dec–15 Mar–16 Jun–16
Newcastle 6000 kcal USD/t 78.7 73.1 68.6 63.7 65.7 59.1 58.8 53.0 50.5 51.2
Newcastle 6000 kcal AUD/t 87.4 78.2 74.0 75.1 83.8 76.1 81.3 73.5 69.9 68.6
Sources: Bloomberg.
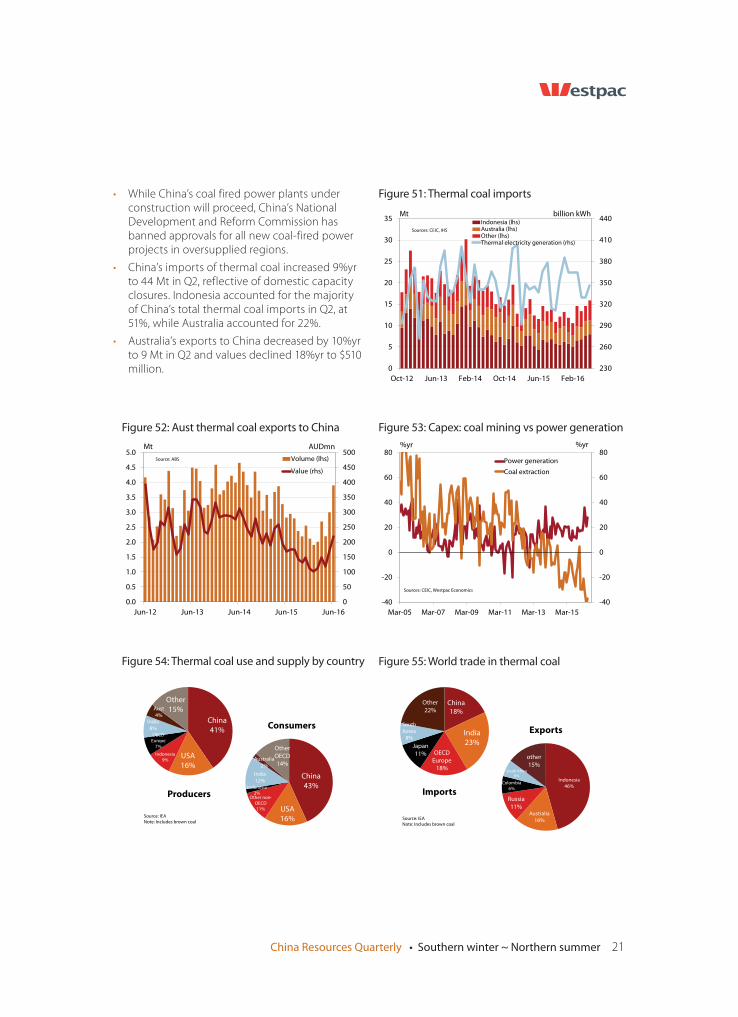
China Resources Quarterly • Southern winter ~ Northern summer 21
• While China’s coal fired power plants under construction will proceed, China’s National Development and Reform Commission has banned approvals for all new coal-fired power projects in oversupplied regions.
• China’s imports of thermal coal increased 9%yr to 44 Mt in Q2, reflective of domestic capacity closures. Indonesia accounted for the majority of China’s total thermal coal imports in Q2, at 51%, while Australia accounted for 22%.
• Australia’s exports to China decreased by 10%yr to 9 Mt in Q2 and values declined 18%yr to $510 million.
China
41%
USA
16%
Indonesia
9%
OECD
Europe
7%
India
8%
Aust
4%
Other
15%
Producers
Source: IEA
Note: Includes brown coal
China
43%
USA
16%
Other non-
OECD
11%
Indonesia
2%
India
12%
Australia
2%
Other
OECD14%
Consumers
Figure 54: Thermal coal use and supply by country
230
260
290
320
350
380
410
440
0
5
10
15
20
25
30
35
Oct-12 Jun-13 Feb-14 Oct-14 Jun-15 Feb-16
billion kWhMtIndonesia (lhs)Australia (lhs)Other (lhs)Thermal electricity generation (rhs)
Sources: CEIC, IHS
-40
-20
0
20
40
60
80
-40
-20
0
20
40
60
80
Mar-05 Mar-07 Mar-09 Mar-11 Mar-13 Mar-15
%yr%yr
Power generation
Coal extraction
Sources: CEIC, Westpac Economics
0
50
100
150
200
250
300
350
400
450
500
0.0
0.5
1.0
1.5
2.0
2.5
3.0
3.5
4.0
4.5
5.0
Jun-12 Jun-13 Jun-14 Jun-15 Jun-16
AUDmnMt
Volume (lhs)
Value (rhs)
Source: ABS
China
18%
India
23%
OECD
Europe18%
Japan
11%
South
Korea
8%
Other
22%
Imports
Source: IEANote: Includes brown coal
Indonesia
46%
Australia
16%
Russia
11%
Colombia6%
South Africa6%
other
15%
Exports
Figure 51: Thermal coal imports
Figure 53: Capex: coal mining vs power generationFigure 52: Aust thermal coal exports to China
Figure 55: World trade in thermal coal
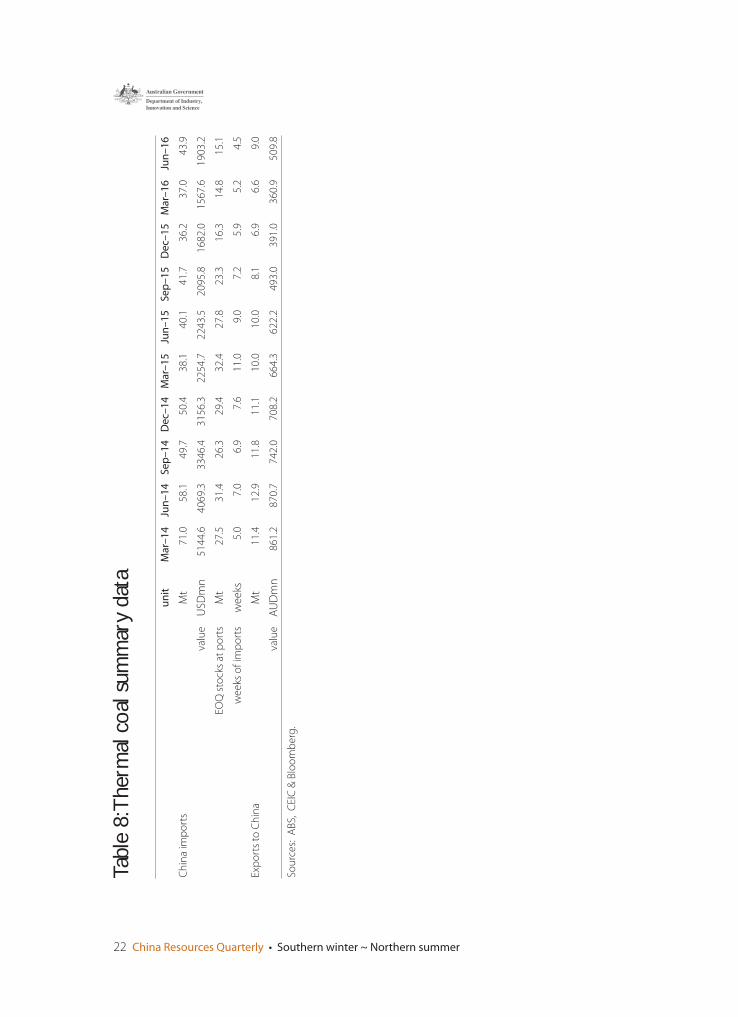
22 China Resources Quarterly • Southern winter ~ Northern summer
Tabl
e 8:
The
rmal
coa
l sum
mar
y da
ta
un
itM
ar–
14
Jun
–1
4S
ep
–1
4D
ec–
14
Mar
–1
5Ju
n–
15
Se
p–
15
De
c–1
5M
ar–
16
Jun
–1
6
Ch
ina
imp
ort
sM
t7
1.0
58
.14
9.7
50
.43
8.1
40
.14
1.7
36
.23
7.0
43
.9
valu
eU
SDm
n5
14
4.6
40
69
.33
34
6.4
31
56
.32
25
4.7
22
43
.52
09
5.8
16
82
.01
56
7.6
19
03
.2
EOQ
sto
cks
at p
ort
sM
t2
7.5
31
.42
6.3
29
.43
2.4
27
.82
3.3
16
.31
4.8
15
.1
we
eks
of
imp
ort
sw
ee
ks5
.07
.06
.97
.61
1.0
9.0
7.2
5.9
5.2
4.5
Exp
ort
s to
Ch
ina
Mt
11
.41
2.9
11
.81
1.1
10
.01
0.0
8.1
6.9
6.6
9.0
valu
eA
UD
mn
86
1.2
87
0.7
74
2.0
70
8.2
66
4.3
62
2.2
49
3.0
39
1.0
36
0.9
50
9.8
Sou
rce
s: A
BS,
CEI
C &
Blo
om
be
rg.
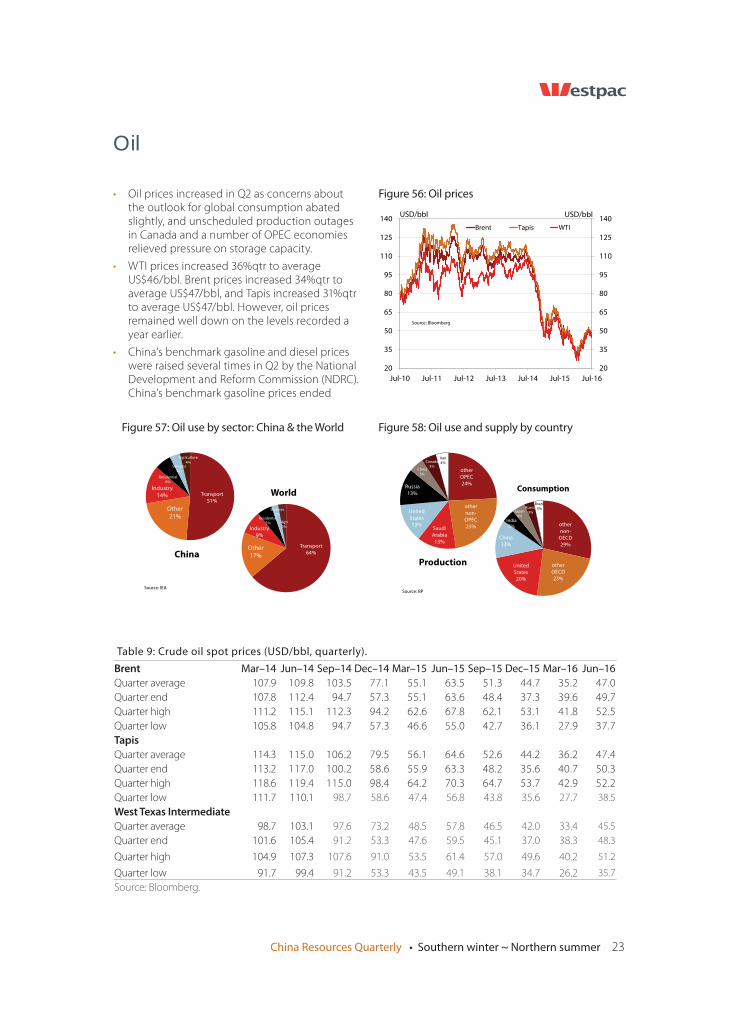
China Resources Quarterly • Southern winter ~ Northern summer 23
Oil
• Oil prices increased in Q2 as concerns about the outlook for global consumption abated slightly, and unscheduled production outages in Canada and a number of OPEC economies relieved pressure on storage capacity.
• WTI prices increased 36%qtr to average US$46/bbl. Brent prices increased 34%qtr to average US$47/bbl, and Tapis increased 31%qtr to average US$47/bbl. However, oil prices remained well down on the levels recorded a year earlier.
• China’s benchmark gasoline and diesel prices were raised several times in Q2 by the National Development and Reform Commission (NDRC). China’s benchmark gasoline prices ended
20
35
50
65
80
95
110
125
140
20
35
50
65
80
95
110
125
140
Jul-10 Jul-11 Jul-12 Jul-13 Jul-14 Jul-15 Jul-16
USD/bblUSD/bbl
Brent Tapis WTI
Source: Bloomberg
other
OPEC
24%
other
non-
OPEC
23%Saudi
Arabia
13%
United
States
13%
Russia
13%
China5%
Canada5%
Iran4%
Production
Source: BP
other
non-
OECD
29%
other
OECD
23%
United
States
20%
China
13%
India
5%
Japan4%
Russia3%
Brazil3%
ConsumptionTransport
51%
Other
21%
Industry14%
Residential6%
Services4%
Agriculture4%
China
Source: IEA
Transport
64%Other
17%
Industry
9%
Residential5%
Services2%
Agri3%
World
Figure 56: Oil prices
Figure 57: Oil use by sector: China & the World Figure 58: Oil use and supply by country
Table 9: Crude oil spot prices (USD/bbl, quarterly).
Brent Mar–14 Jun–14 Sep–14 Dec–14 Mar–15 Jun–15 Sep–15 Dec–15 Mar–16 Jun–16
Quarter average 107.9 109.8 103.5 77.1 55.1 63.5 51.3 44.7 35.2 47.0
Quarter end 107.8 112.4 94.7 57.3 55.1 63.6 48.4 37.3 39.6 49.7
Quarter high 111.2 115.1 112.3 94.2 62.6 67.8 62.1 53.1 41.8 52.5
Quarter low 105.8 104.8 94.7 57.3 46.6 55.0 42.7 36.1 27.9 37.7
TapisQuarter average 114.3 115.0 106.2 79.5 56.1 64.6 52.6 44.2 36.2 47.4
Quarter end 113.2 117.0 100.2 58.6 55.9 63.3 48.2 35.6 40.7 50.3
Quarter high 118.6 119.4 115.0 98.4 64.2 70.3 64.7 53.7 42.9 52.2
Quarter low 111.7 110.1 98.7 58.6 47.4 56.8 43.8 35.6 27.7 38.5
West Texas IntermediateQuarter average 98.7 103.1 97.6 73.2 48.5 57.8 46.5 42.0 33.4 45.5
Quarter end 101.6 105.4 91.2 53.3 47.6 59.5 45.1 37.0 38.3 48.3
Quarter high 104.9 107.3 107.6 91.0 53.5 61.4 57.0 49.6 40.2 51.2
Quarter low 91.7 99.4 91.2 53.3 43.5 49.1 38.1 34.7 26.2 35.7
Source: Bloomberg.
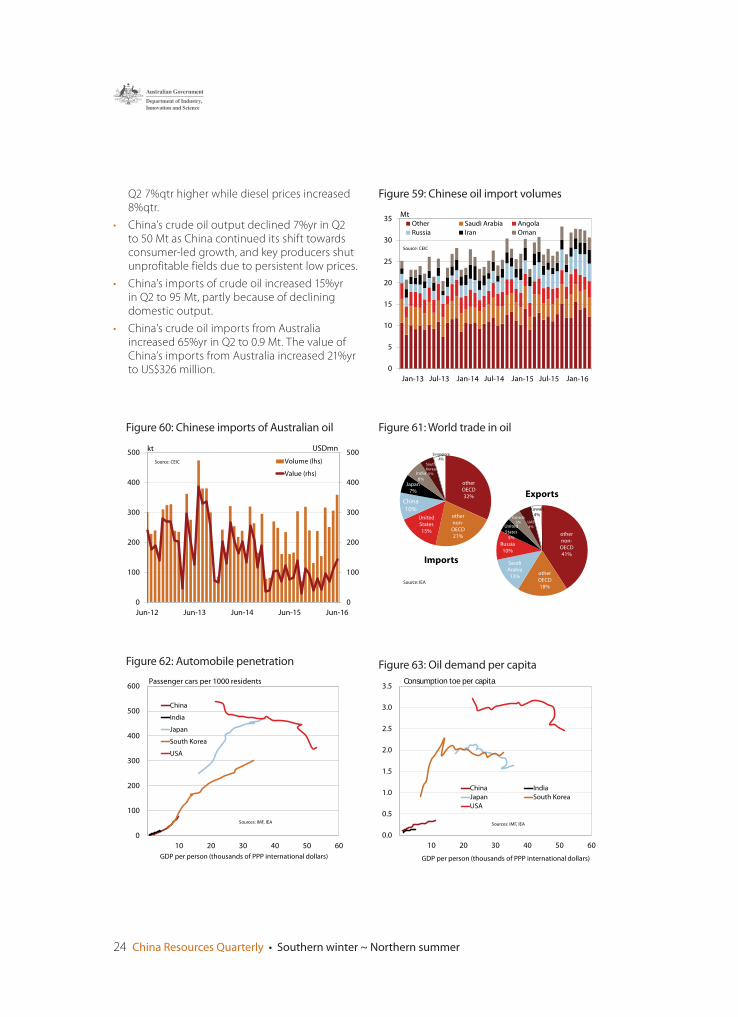
24 China Resources Quarterly • Southern winter ~ Northern summer
0
100
200
300
400
500
600
10 20 30 40 50 60
GDP per person (thousands of PPP international dollars)
China
India
Japan
South Korea
USA
Passenger cars per 1000 residents
Sources: IMF, IEA
Figure 62: Automobile penetration
0
5
10
15
20
25
30
35Mt
Other Saudi Arabia Angola
Russia Iran Oman
Source: CEIC
other
OECD
32%
other
non-
OECD
21%
United
States
15%
China
10%
Japan
7%
India6%
South Korea
5%
Singapore4%
Imports
Source: IEA
other
non-
OECD
41%
other
OECD
18%
Saudi
Arabia
13%
Russia
10%
United States
5%
Canada5% UAE
4%
Kuwait
4%
Exports
0
100
200
300
400
500
0
100
200
300
400
500
Jun-12 Jun-13 Jun-14 Jun-15 Jun-16
USDmnkt
Volume (lhs)
Value (rhs)
Source: CEIC
0.0
0.5
1.0
1.5
2.0
2.5
3.0
3.5
10 20 30 40 50 60
GDP per person (thousands of PPP international dollars)
China India
Japan South Korea
USA
Consumption toe per capita
Sources: IMF, IEA
Figure 59: Chinese oil import volumes
Figure 61: World trade in oilFigure 60: Chinese imports of Australian oil
Figure 63: Oil demand per capita
Q2 7%qtr higher while diesel prices increased 8%qtr.
• China’s crude oil output declined 7%yr in Q2 to 50 Mt as China continued its shift towards consumer-led growth, and key producers shut unprofitable fields due to persistent low prices.
• China’s imports of crude oil increased 15%yr in Q2 to 95 Mt, partly because of declining domestic output.
• China’s crude oil imports from Australia increased 65%yr in Q2 to 0.9 Mt. The value of China’s imports from Australia increased 21%yr to US$326 million.
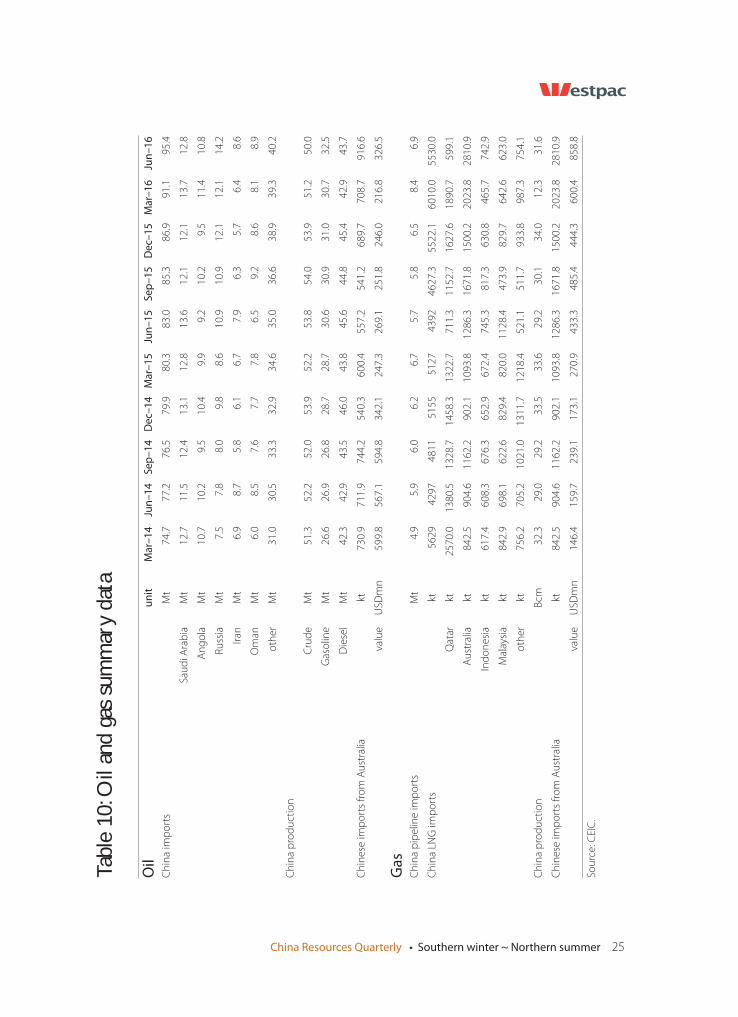
China Resources Quarterly • Southern winter ~ Northern summer 25
Oil
un
itM
ar–
14
Jun
–1
4S
ep
–1
4D
ec–
14
Mar
–1
5Ju
n–
15
Se
p–
15
De
c–1
5M
ar–
16
Jun
–1
6
Ch
ina
imp
ort
sM
t7
4.7
77
.27
6.5
79
.98
0.3
83
.08
5.3
86
.99
1.1
95
.4
Sau
di A
rab
iaM
t1
2.7
11
.51
2.4
13
.11
2.8
13
.61
2.1
12
.11
3.7
12
.8
An
go
laM
t1
0.7
10
.29
.51
0.4
9.9
9.2
10
.29
.51
1.4
10
.8
Ru
ssia
Mt
7.5
7.8
8.0
9.8
8.6
10
.91
0.9
12
.11
2.1
14
.2
Iran
Mt
6.9
8.7
5.8
6.1
6.7
7.9
6.3
5.7
6.4
8.6
Om
anM
t6
.08
.57
.67
.77
.86
.59
.28
.68
.18
.9
oth
er
Mt
31
.03
0.5
33
.33
2.9
34
.63
5.0
36
.63
8.9
39
.34
0.2
Ch
ina
pro
du
ctio
n
Cru
de
Mt
51
.35
2.2
52
.05
3.9
52
.25
3.8
54
.05
3.9
51
.25
0.0
Gas
olin
eM
t2
6.6
26
.92
6.8
28
.72
8.7
30
.63
0.9
31
.03
0.7
32
.5
Die
sel
Mt
42
.34
2.9
43
.54
6.0
43
.84
5.6
44
.84
5.4
42
.94
3.7
Ch
ine
se im
po
rts
fro
m A
ust
ralia
kt7
30
.97
11
.97
44
.25
40
.36
00
.45
57
.25
41
.26
89
.77
08
.79
16
.6
valu
eU
SDm
n5
99
.85
67
.15
94
.83
42
.12
47
.32
69
.12
51
.82
46
.02
16
.83
26
.5
Ga
sC
hin
a p
ipe
line
imp
ort
sM
t4
.95
.96
.06
.26
.75
.75
.86
.58
.46
.9
Ch
ina
LNG
imp
ort
skt
56
29
42
97
48
11
51
55
51
27
43
92
46
27
.35
52
2.1
60
10
.05
53
0.0
Qat
arkt
25
70
.01
38
0.5
13
28
.71
45
8.3
13
22
.77
11
.31
15
2.7
16
27
.61
89
0.7
59
9.1
Au
stra
liakt
84
2.5
90
4.6
11
62
.29
02
.11
09
3.8
12
86
.31
67
1.8
15
00
.22
02
3.8
28
10
.9
Ind
on
esi
akt
61
7.4
60
8.3
67
6.3
65
2.9
67
2.4
74
5.3
81
7.3
63
0.8
46
5.7
74
2.9
Mal
aysi
akt
84
2.9
69
8.1
62
2.6
82
9.4
82
0.0
11
28
.44
73
.98
29
.76
42
.66
23
.0
oth
er
kt7
56
.27
05
.21
02
1.0
13
11
.71
21
8.4
52
1.1
51
1.7
93
3.8
98
7.3
75
4.1
Ch
ina
pro
du
ctio
nB
cm3
2.3
29
.02
9.2
33
.53
3.6
29
.23
0.1
34
.01
2.3
31
.6
Ch
ine
se im
po
rts
fro
m A
ust
ralia
kt8
42
.59
04
.61
16
2.2
90
2.1
10
93
.81
28
6.3
16
71
.81
50
0.2
20
23
.82
81
0.9
valu
eU
SDm
n1
46
.41
59
.72
39
.11
73
.12
70
.94
33
.34
85
.44
44
.36
00
.48
58
.8
Sou
rce
: CEI
C.
Tabl
e 10
: Oil
and
gas
sum
mar
y da
ta
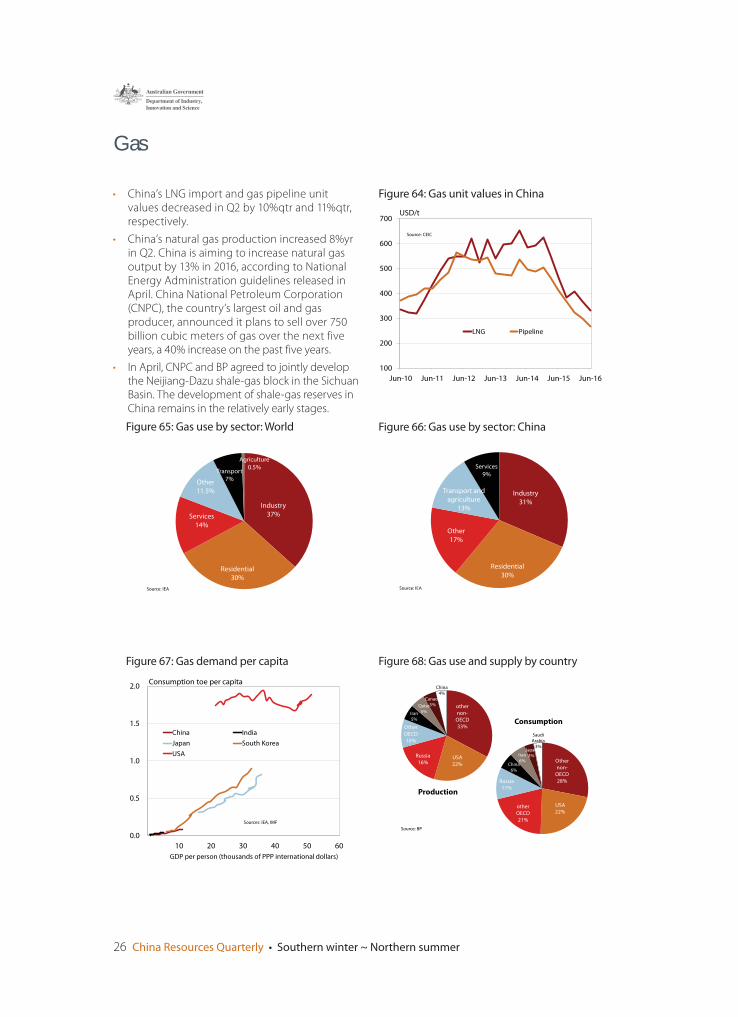
26 China Resources Quarterly • Southern winter ~ Northern summer
Gas
• China’s LNG import and gas pipeline unit values decreased in Q2 by 10%qtr and 11%qtr, respectively.
• China’s natural gas production increased 8%yr in Q2. China is aiming to increase natural gas output by 13% in 2016, according to National Energy Administration guidelines released in April. China National Petroleum Corporation (CNPC), the country’s largest oil and gas producer, announced it plans to sell over 750 billion cubic meters of gas over the next five years, a 40% increase on the past five years.
• In April, CNPC and BP agreed to jointly develop the Neijiang-Dazu shale-gas block in the Sichuan Basin. The development of shale-gas reserves in China remains in the relatively early stages.
100
200
300
400
500
600
700
Jun-10 Jun-11 Jun-12 Jun-13 Jun-14 Jun-15 Jun-16
USD/t
LNG Pipeline
Source: CEIC
Industry
31%
Residential
30%
Other
17%
Transport and
agriculture13%
Services
9%
Source: IEA
Industry
37%
Residential
30%
Services
14%
Other
11.5%
Transport
7%
Agriculture
0.5%
Source: IEA
Figure 64: Gas unit values in China
Figure 65: Gas use by sector: World Figure 66: Gas use by sector: China
other
non-
OECD
33%
USA
22%
Russia
16%
Other
OECD
10%
Iran5%
Qatar5%
Canada5%
China4%
Production
Other
non-
OECD
28%
USA
22%other
OECD
21%
Russia
11%
China6%
Iran6%
Japan3%
Saudi Arabia
3%
Consumption
Source: BP
0.0
0.5
1.0
1.5
2.0
10 20 30 40 50 60
GDP per person (thousands of PPP international dollars)
China India
Japan South Korea
USA
Consumption toe per capita
Sources: IEA, IMF
Figure 68: Gas use and supply by countryFigure 67: Gas demand per capita
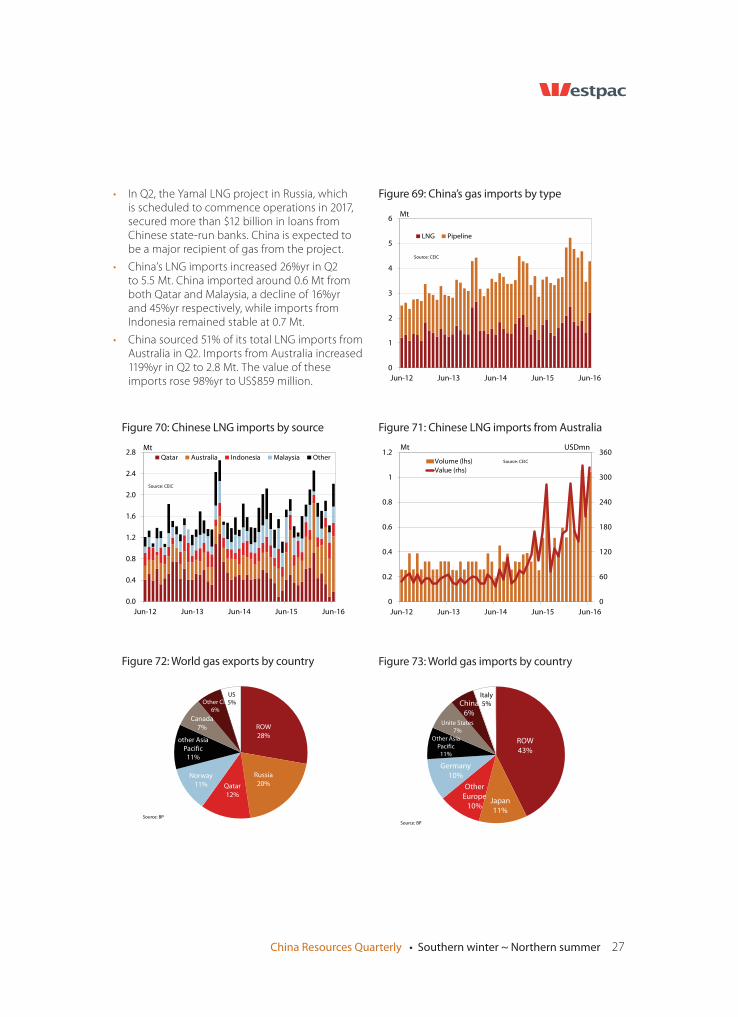
China Resources Quarterly • Southern winter ~ Northern summer 27
• In Q2, the Yamal LNG project in Russia, which is scheduled to commence operations in 2017, secured more than $12 billion in loans from Chinese state-run banks. China is expected to be a major recipient of gas from the project.
• China’s LNG imports increased 26%yr in Q2 to 5.5 Mt. China imported around 0.6 Mt from both Qatar and Malaysia, a decline of 16%yr and 45%yr respectively, while imports from Indonesia remained stable at 0.7 Mt.
• China sourced 51% of its total LNG imports from Australia in Q2. Imports from Australia increased 119%yr in Q2 to 2.8 Mt. The value of these imports rose 98%yr to US$859 million.
ROW
28%
Russia
20%Qatar
12%
Norway
11%
other Asia
Pacific
11%
Canada
7%
Other CIS
6%
US
5%
Source: BP
Figure 72: World gas exports by country
0
1
2
3
4
5
6
Jun-12 Jun-13 Jun-14 Jun-15 Jun-16
Mt
LNG Pipeline
Source: CEIC
0
60
120
180
240
300
360
0
0.2
0.4
0.6
0.8
1
1.2
Jun-12 Jun-13 Jun-14 Jun-15 Jun-16
Mt USDmn
Volume (lhs)
Value (rhs)
Source: CEIC
ROW
43%
Japan
11%
Other
Europe
10%
Germany
10%
Other Asia
Pacific11%
Unite States
7%
China
6%
Italy
5%
Source: BP
Figure 69: China’s gas imports by type
Figure 71: Chinese LNG imports from Australia
Figure 73: World gas imports by country
Figure 70: Chinese LNG imports by source
0.0
0.4
0.8
1.2
1.6
2.0
2.4
2.8
Jun-12 Jun-13 Jun-14 Jun-15 Jun-16
MtQatar Australia Indonesia Malaysia Other
Source: CEIC
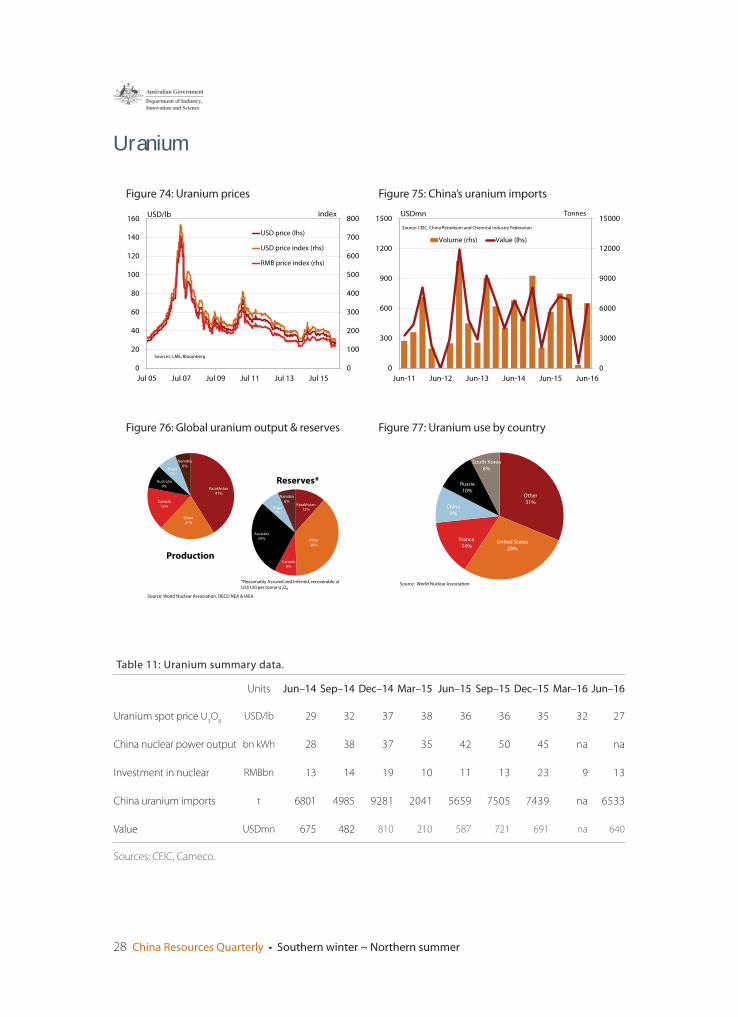
28 China Resources Quarterly • Southern winter ~ Northern summer
Uranium
0
100
200
300
400
500
600
700
800
0
20
40
60
80
100
120
140
160
Jul 05 Jul 07 Jul 09 Jul 11 Jul 13 Jul 15
index USD/lb
USD price (lhs)
USD price index (rhs)
RMB price index (rhs)
Sources: LME, Bloomberg
0
3000
6000
9000
12000
15000
0
300
600
900
1200
1500
Jun-11 Jun-12 Jun-13 Jun-14 Jun-15 Jun-16
USDmn
Volume (rhs) Value (lhs)
Source: CEIC, China Petroleum and Chemical Industry Federation
Tonnes
Other
31%
United States
28%
France
14%
China
9%
Russia
10%
South Korea
8%
Source: World Nuclear Association
Kazakhstan41%
Other21%
Canada16%
Australia9%
Niger7%
Namibia6%
Production
Kazakhstan12%
Other38%
Canada8%
Australia29%
Niger7%
Namibia6%
Reserves*
*Reasonably Assured and Inferred, recoverable at US$130 per tonne U3O8
Source: World Nuclear Association, OECD NEA & IAEA
Figure 74: Uranium prices
Figure 76: Global uranium output & reserves
Figure 75: China’s uranium imports
Figure 77: Uranium use by country
Table 11: Uranium summary data.
Units Jun–14 Sep–14 Dec–14 Mar–15 Jun–15 Sep–15 Dec–15 Mar–16 Jun–16
Uranium spot price U3O
8USD/lb 29 32 37 38 36 36 35 32 27
China nuclear power output bn kWh 28 38 37 35 42 50 45 na na
Investment in nuclear RMBbn 13 14 19 10 11 13 23 9 13
China uranium imports t 6801 4985 9281 2041 5659 7505 7439 na 6533
Value USDmn 675 482 810 210 587 721 691 na 640
Sources: CEIC, Cameco.
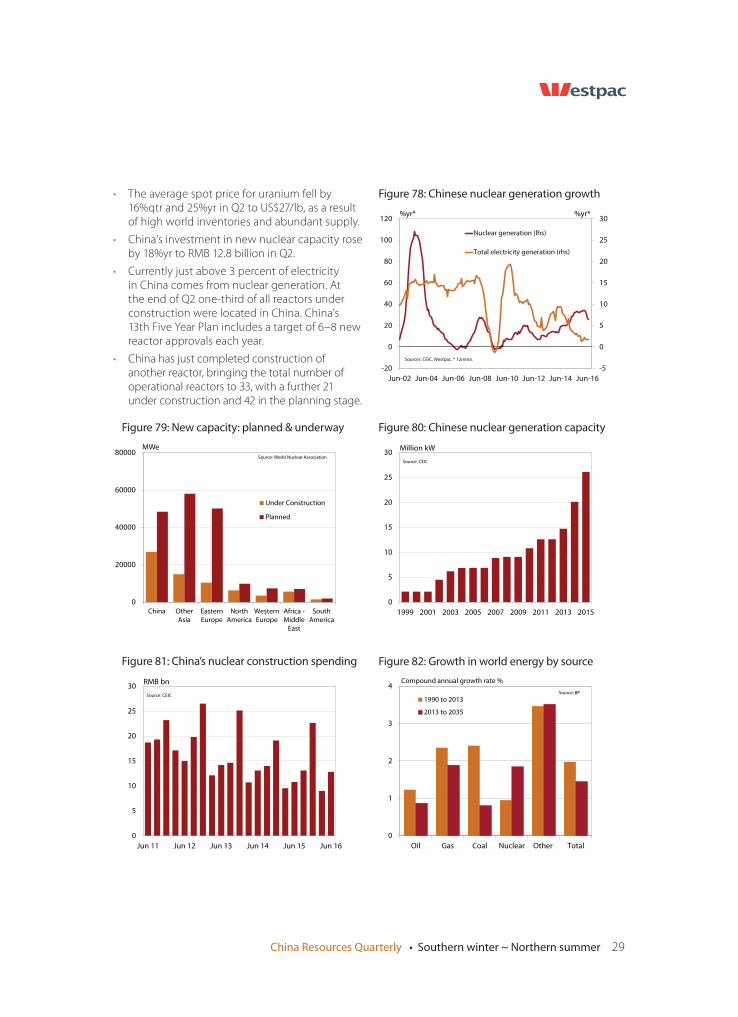
China Resources Quarterly • Southern winter ~ Northern summer 29
• The average spot price for uranium fell by 16%qtr and 25%yr in Q2 to US$27/lb, as a result of high world inventories and abundant supply.
• China’s investment in new nuclear capacity rose by 18%yr to RMB 12.8 billion in Q2.
• Currently just above 3 percent of electricity in China comes from nuclear generation. At the end of Q2 one-third of all reactors under construction were located in China. China’s 13th Five Year Plan includes a target of 6–8 new reactor approvals each year.
• China has just completed construction of another reactor, bringing the total number of operational reactors to 33, with a further 21 under construction and 42 in the planning stage.
0
5
10
15
20
25
30
Jun 11 Jun 12 Jun 13 Jun 14 Jun 15 Jun 16
RMB bn
Source: CEIC
Figure 81: China’s nuclear construction spending
0
20000
40000
60000
80000
China Other
Asia
Eastern
Europe
North
America
Western
Europe
Africa -
Middle
East
South
America
MWe
Under Construction
Planned
Source: World Nuclear Association
0
1
2
3
4
Oil Gas Coal Nuclear Other Total
1990 to 2013
2013 to 2035
Source: BP
Compound annual growth rate %
Figure 78: Chinese nuclear generation growth
Figure 80: Chinese nuclear generation capacity
Figure 82: Growth in world energy by source
Figure 79: New capacity: planned & underway
0
5
10
15
20
25
30
1999 2001 2003 2005 2007 2009 2011 2013 2015
Million kW
Source: CEIC
-5
0
5
10
15
20
25
30
-20
0
20
40
60
80
100
120
Jun-02 Jun-04 Jun-06 Jun-08 Jun-10 Jun-12 Jun-14 Jun-16
Nuclear generation (lhs)
Total electricity generation (rhs)
%yr* %yr*
Sources: CEIC, Westpac. * 12mma.
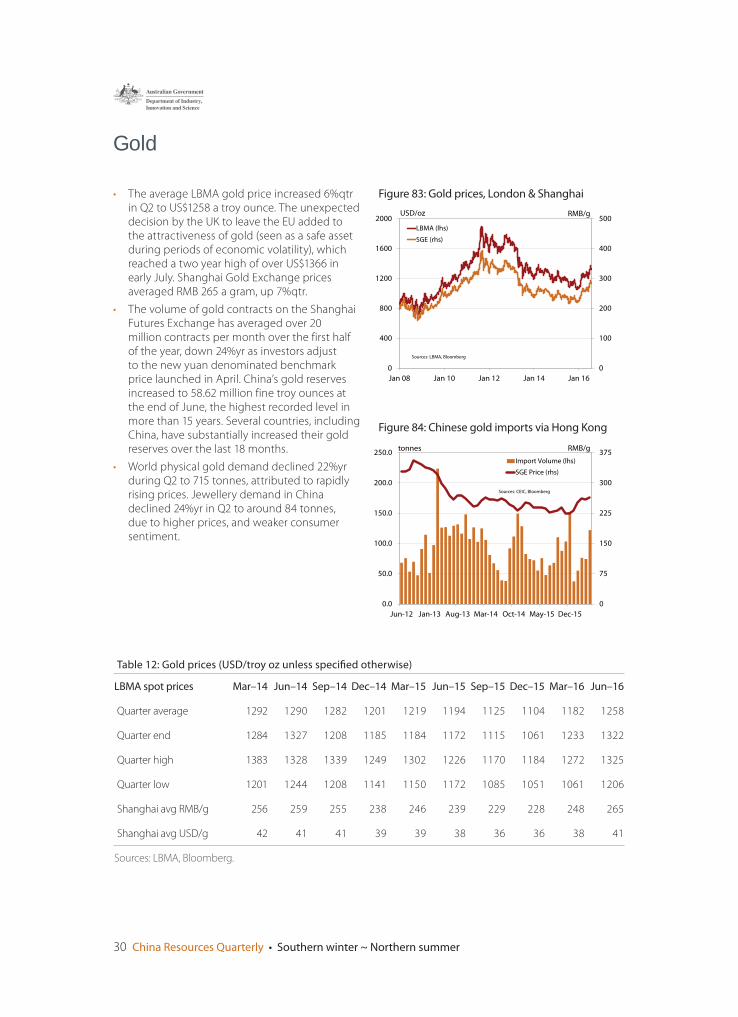
30 China Resources Quarterly • Southern winter ~ Northern summer
Gold
• The average LBMA gold price increased 6%qtr in Q2 to US$1258 a troy ounce. The unexpected decision by the UK to leave the EU added to the attractiveness of gold (seen as a safe asset during periods of economic volatility), which reached a two year high of over US$1366 in early July. Shanghai Gold Exchange prices averaged RMB 265 a gram, up 7%qtr.
• The volume of gold contracts on the Shanghai Futures Exchange has averaged over 20 million contracts per month over the first half of the year, down 24%yr as investors adjust to the new yuan denominated benchmark price launched in April. China’s gold reserves increased to 58.62 million fine troy ounces at the end of June, the highest recorded level in more than 15 years. Several countries, including China, have substantially increased their gold reserves over the last 18 months.
• World physical gold demand declined 22%yr during Q2 to 715 tonnes, attributed to rapidly rising prices. Jewellery demand in China declined 24%yr in Q2 to around 84 tonnes, due to higher prices, and weaker consumer sentiment.
0
100
200
300
400
500
0
400
800
1200
1600
2000
Jan 08 Jan 10 Jan 12 Jan 14 Jan 16
RMB/gUSD/oz
LBMA (lhs)
SGE (rhs)
Sources: LBMA, Bloomberg
0
75
150
225
300
375
0.0
50.0
100.0
150.0
200.0
250.0
Jun-12 Jan-13 Aug-13 Mar-14 Oct-14 May-15 Dec-15
RMB/gtonnes
Import Volume (lhs)
SGE Price (rhs)
Sources: CEIC, Bloomberg
Figure 83: Gold prices, London & Shanghai
Figure 84: Chinese gold imports via Hong Kong
Table 12: Gold prices (USD/troy oz unless specifi ed otherwise)
LBMA spot prices Mar–14 Jun–14 Sep–14 Dec–14 Mar–15 Jun–15 Sep–15 Dec–15 Mar–16 Jun–16
Quarter average 1292 1290 1282 1201 1219 1194 1125 1104 1182 1258
Quarter end 1284 1327 1208 1185 1184 1172 1115 1061 1233 1322
Quarter high 1383 1328 1339 1249 1302 1226 1170 1184 1272 1325
Quarter low 1201 1244 1208 1141 1150 1172 1085 1051 1061 1206
Shanghai avg RMB/g 256 259 255 238 246 239 229 228 248 265
Shanghai avg USD/g 42 41 41 39 39 38 36 36 38 41
Sources: LBMA, Bloomberg.
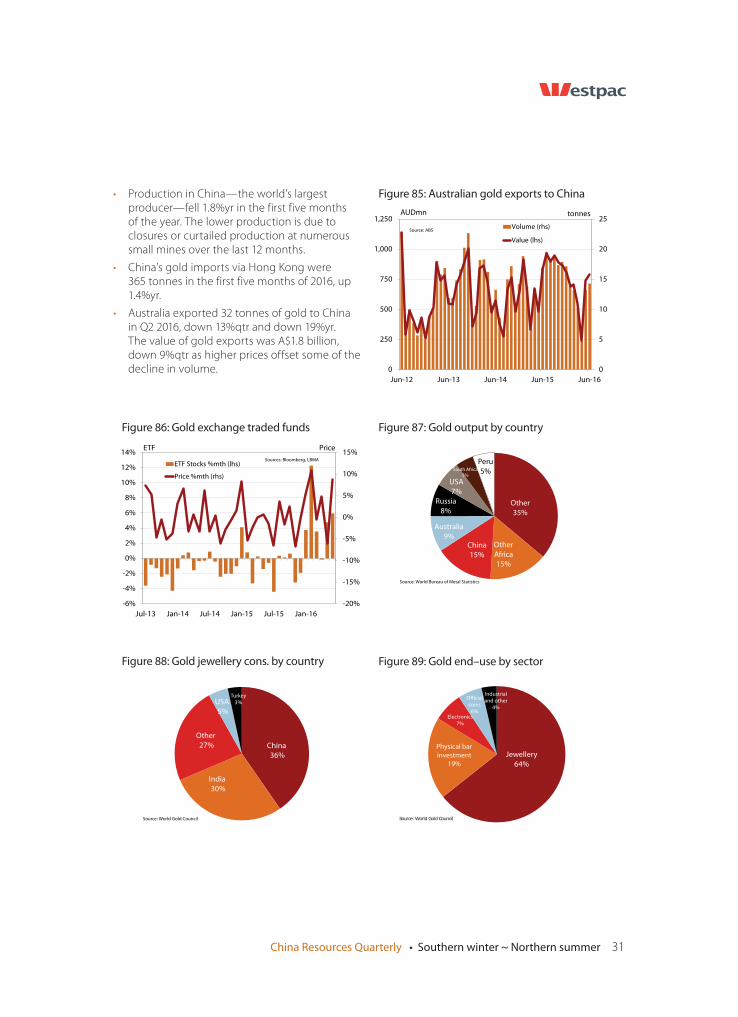
China Resources Quarterly • Southern winter ~ Northern summer 31
• Production in China—the world’s largest producer—fell 1.8%yr in the first five months of the year. The lower production is due to closures or curtailed production at numerous small mines over the last 12 months.
• China’s gold imports via Hong Kong were 365 tonnes in the first five months of 2016, up 1.4%yr.
• Australia exported 32 tonnes of gold to China in Q2 2016, down 13%qtr and down 19%yr. The value of gold exports was A$1.8 billion, down 9%qtr as higher prices offset some of the decline in volume.
China
36%
India
30%
Other
27%
USA
5%
Turkey
3%
Source: World Gold Council
Figure 88: Gold jewellery cons. by country
0
5
10
15
20
25
0
250
500
750
1,000
1,250
Jun-12 Jun-13 Jun-14 Jun-15 Jun-16
tonnesAUDmn
Volume (rhs)
Value (lhs)
Source: ABS
Other
35%
Other
Africa
15%
China
15%
Australia
9%
Russia
8%
USA
7%
South Africa
5%
Peru
5%
Source: World Bureau of Metal Statistics
-20%
-15%
-10%
-5%
0%
5%
10%
15%
-6%
-4%
-2%
0%
2%
4%
6%
8%
10%
12%
14%
Jul-13 Jan-14 Jul-14 Jan-15 Jul-15 Jan-16
PriceETF
ETF Stocks %mth (lhs)
Price %mth (rhs)
Sources: Bloomberg, LBMA
Jewellery
64%
Physical bar
investment19%
Electronics
7%
Official
coins
6%
Industrial
and other
4%
Source: World Gold Council
Figure 85: Australian gold exports to China
Figure 87: Gold output by countryFigure 86: Gold exchange traded funds
Figure 89: Gold end–use by sector
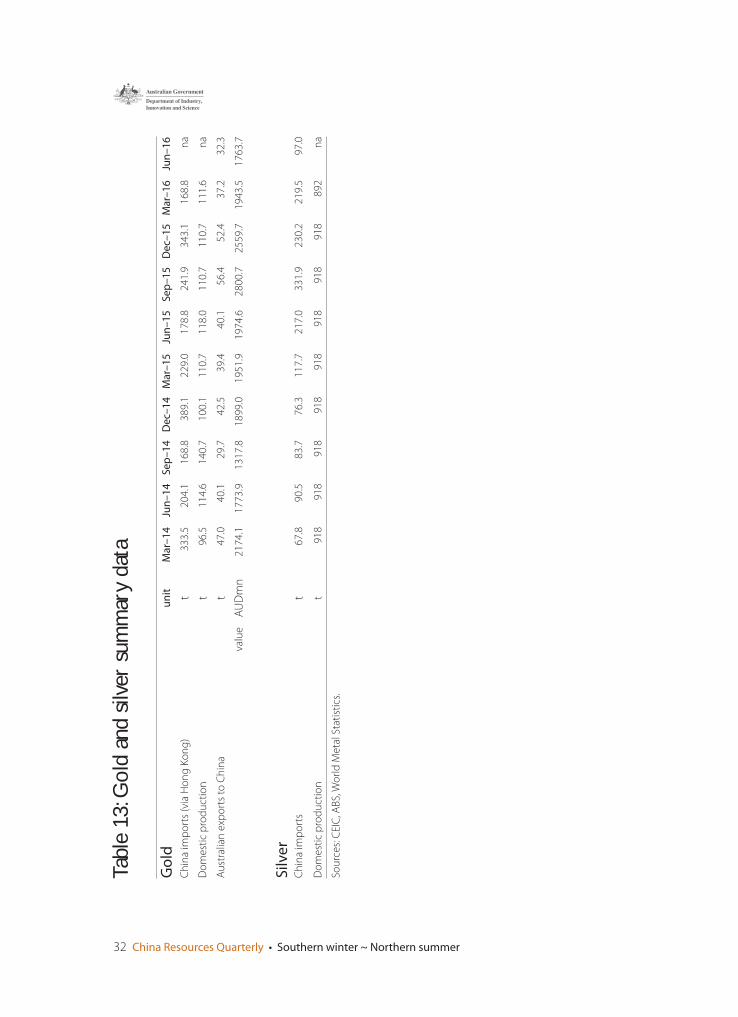
32 China Resources Quarterly • Southern winter ~ Northern summer
Go
ldu
nit
Mar
–1
4Ju
n–
14
Se
p–
14
De
c–1
4M
ar–
15
Jun
–1
5S
ep
–1
5D
ec–
15
Mar
–1
6Ju
n–
16
Ch
ina
imp
ort
s (v
ia H
on
g K
on
g)
t3
33
.52
04
.11
68
.83
89
.12
29
.01
78
.82
41
.93
43
.11
68
.8n
a
Do
me
stic
pro
du
ctio
nt
96
.51
14
.61
40
.71
00
.11
10
.71
18
.01
10
.71
10
.71
11
.6n
a
Au
stra
lian
exp
ort
s to
Ch
ina
t4
7.0
40
.12
9.7
42
.53
9.4
40
.15
6.4
52
.43
7.2
32
.3
valu
eA
UD
mn
21
74
.11
77
3.9
13
17
.81
89
9.0
19
51
.91
97
4.6
28
00
.72
55
9.7
19
43
.51
76
3.7
Silv
er
Ch
ina
imp
ort
st
67
.89
0.5
83
.77
6.3
11
7.7
21
7.0
33
1.9
23
0.2
21
9.5
97
.0
Do
me
stic
pro
du
ctio
nt
91
89
18
91
89
18
91
89
18
91
89
18
89
2n
a
Sou
rce
s: C
EIC
, AB
S, W
orl
d M
eta
l Sta
tist
ics.
Tabl
e 13
: Gol
d an
d si
lver
sum
mar
y da
ta
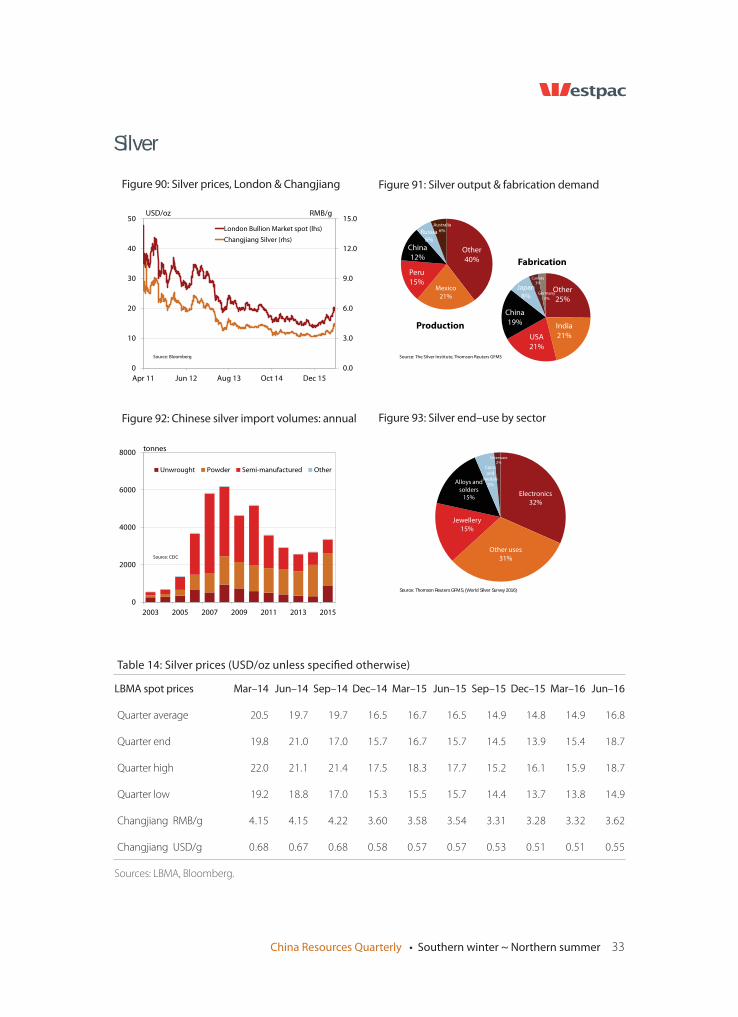
China Resources Quarterly • Southern winter ~ Northern summer 33
Other
40%
Mexico
21%
Peru
15%
China
12%
Russia
6%
Australia
6%
Production
Other
25%
India
21%USA
21%
China
19%
Japan
8%
Canada3%
Germany3%
Fabrication
Source: The Silver Institute, Thomson Reuters GFMS
0.0
3.0
6.0
9.0
12.0
15.0
0
10
20
30
40
50
Apr 11 Jun 12 Aug 13 Oct 14 Dec 15
RMB/gUSD/oz
London Bullion Market spot (lhs)
Changjiang Silver (rhs)
Source: Bloomberg
Electronics
32%
Other uses
31%
Jewellery
15%
Alloys and
solders15%
Coins
and
medals
2%
Silverware2%
Source: Thomson Reuters GFMS, (World Silver Survey 2016)
0
2000
4000
6000
8000
2003 2005 2007 2009 2011 2013 2015
tonnes
Unwrought Powder Semi-manufactured Other
Source: CEIC
Figure 91: Silver output & fabrication demandFigure 90: Silver prices, London & Changjiang
Figure 92: Chinese silver import volumes: annual Figure 93: Silver end–use by sector
Silver
Table 14: Silver prices (USD/oz unless specifi ed otherwise)
LBMA spot prices Mar–14 Jun–14 Sep–14 Dec–14 Mar–15 Jun–15 Sep–15 Dec–15 Mar–16 Jun–16
Quarter average 20.5 19.7 19.7 16.5 16.7 16.5 14.9 14.8 14.9 16.8
Quarter end 19.8 21.0 17.0 15.7 16.7 15.7 14.5 13.9 15.4 18.7
Quarter high 22.0 21.1 21.4 17.5 18.3 17.7 15.2 16.1 15.9 18.7
Quarter low 19.2 18.8 17.0 15.3 15.5 15.7 14.4 13.7 13.8 14.9
Changjiang RMB/g 4.15 4.15 4.22 3.60 3.58 3.54 3.31 3.28 3.32 3.62
Changjiang USD/g 0.68 0.67 0.68 0.58 0.57 0.57 0.53 0.51 0.51 0.55
Sources: LBMA, Bloomberg.
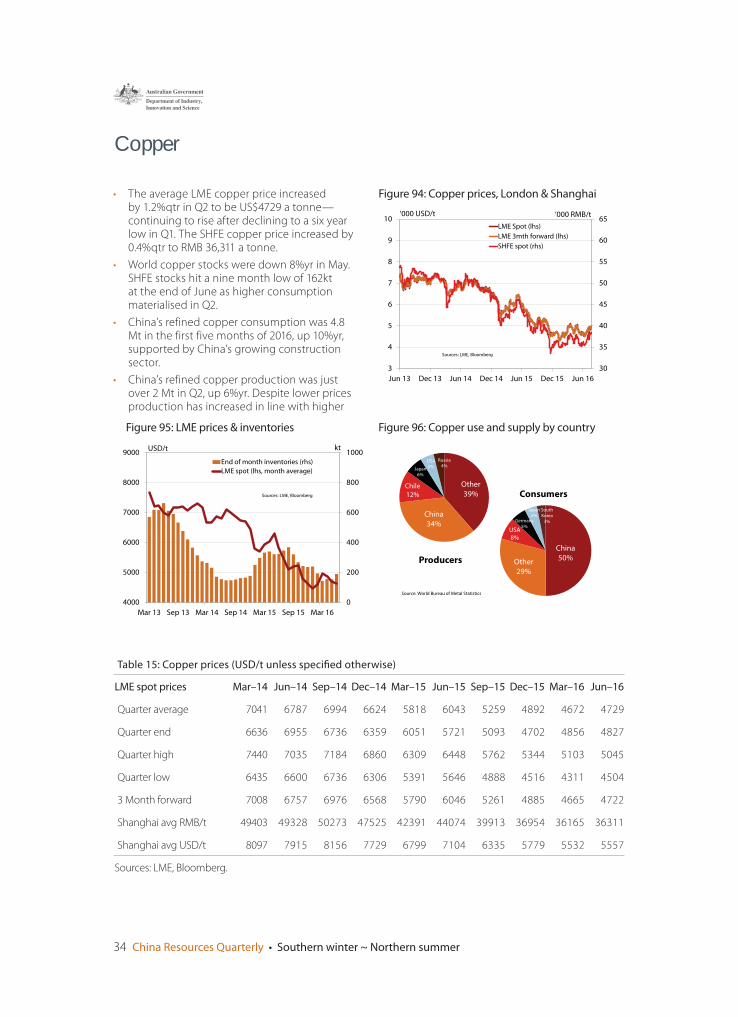
34 China Resources Quarterly • Southern winter ~ Northern summer
Copper
• The average LME copper price increased by 1.2%qtr in Q2 to be US$4729 a tonne—continuing to rise after declining to a six year low in Q1. The SHFE copper price increased by 0.4%qtr to RMB 36,311 a tonne.
• World copper stocks were down 8%yr in May. SHFE stocks hit a nine month low of 162kt at the end of June as higher consumption materialised in Q2.
• China’s refined copper consumption was 4.8 Mt in the first five months of 2016, up 10%yr, supported by China’s growing construction sector.
• China’s refined copper production was just over 2 Mt in Q2, up 6%yr. Despite lower prices production has increased in line with higher
30
35
40
45
50
55
60
65
3
4
5
6
7
8
9
10
Jun 13 Dec 13 Jun 14 Dec 14 Jun 15 Dec 15 Jun 16
‘000 RMB/t‘000 USD/t
LME Spot (lhs)
LME 3mth forward (lhs)
SHFE spot (rhs)
Sources: LME, Bloomberg
Other
39%
China
34%
Chile
12%
Japan
6%
USA
5%
Russia
4%
Producers
Source: World Bureau of Metal Statistics
China
50%Other
29%
USA
8%
Germany
5%
Japan
5%South
Korea
3%
Consumers
0
200
400
600
800
1000
4000
5000
6000
7000
8000
9000
Mar 13 Sep 13 Mar 14 Sep 14 Mar 15 Sep 15 Mar 16
ktUSD/t
End of month inventories (rhs)
LME spot (lhs, month average)
Sources: LME, Bloomberg
Figure 94: Copper prices, London & Shanghai
Figure 95: LME prices & inventories Figure 96: Copper use and supply by country
Table 15: Copper prices (USD/t unless specifi ed otherwise)
LME spot prices Mar–14 Jun–14 Sep–14 Dec–14 Mar–15 Jun–15 Sep–15 Dec–15 Mar–16 Jun–16
Quarter average 7041 6787 6994 6624 5818 6043 5259 4892 4672 4729
Quarter end 6636 6955 6736 6359 6051 5721 5093 4702 4856 4827
Quarter high 7440 7035 7184 6860 6309 6448 5762 5344 5103 5045
Quarter low 6435 6600 6736 6306 5391 5646 4888 4516 4311 4504
3 Month forward 7008 6757 6976 6568 5790 6046 5261 4885 4665 4722
Shanghai avg RMB/t 49403 49328 50273 47525 42391 44074 39913 36954 36165 36311
Shanghai avg USD/t 8097 7915 8156 7729 6799 7104 6335 5779 5532 5557
Sources: LME, Bloomberg.
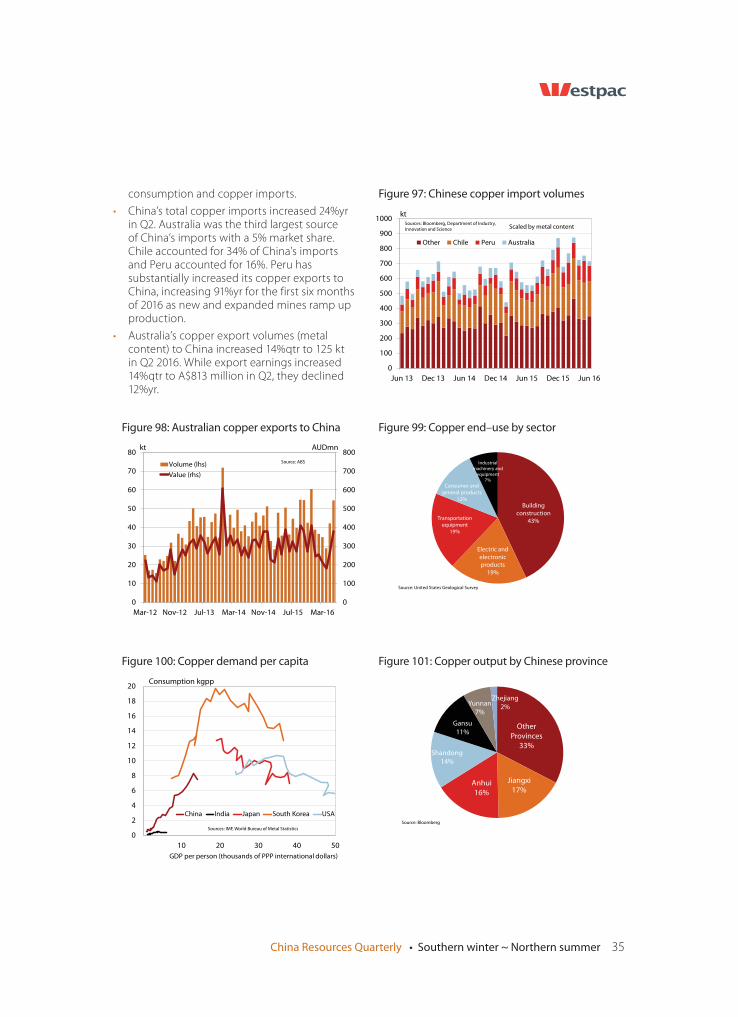
China Resources Quarterly • Southern winter ~ Northern summer 35
consumption and copper imports.
• China’s total copper imports increased 24%yr in Q2. Australia was the third largest source of China’s imports with a 5% market share. Chile accounted for 34% of China’s imports and Peru accounted for 16%. Peru has substantially increased its copper exports to China, increasing 91%yr for the first six months of 2016 as new and expanded mines ramp up production.
• Australia’s copper export volumes (metal content) to China increased 14%qtr to 125 kt in Q2 2016. While export earnings increased 14%qtr to A$813 million in Q2, they declined 12%yr.
Other
Provinces
33%
Jiangxi
17%Anhui
16%
Shandong
14%
Gansu
11%
Yunnan
7%
Zhejiang
2%
Source: Bloomberg
Figure 100: Copper demand per capita
0
100
200
300
400
500
600
700
800
900
1000
Jun 13 Dec 13 Jun 14 Dec 14 Jun 15 Dec 15 Jun 16
kt
Other Chile Peru Australia
Scaled by metal contentSources: Bloomberg, Department of Industry,
Innovation and Science
0
2
4
6
8
10
12
14
16
18
20
10 20 30 40 50
GDP per person (thousands of PPP international dollars)
China India Japan South Korea USA
Consumption kgpp
Sources: IMF, World Bureau of Metal Statistics
0
100
200
300
400
500
600
700
800
Mar-12 Nov-12 Jul-13 Mar-14 Nov-14 Jul-15 Mar-16
0
10
20
30
40
50
60
70
80AUDmnkt
Volume (lhs)
Value (rhs)
Source: ABS
Figure 97: Chinese copper import volumes
Figure 99: Copper end–use by sectorFigure 98: Australian copper exports to China
Figure 101: Copper output by Chinese province
Building
construction43%
Electric and
electronic products
19%
Transportation
equipment
19%
Consumer and
general products
12%
Industrial
machinery and
equipment
7%
Source: United States Geological Survey
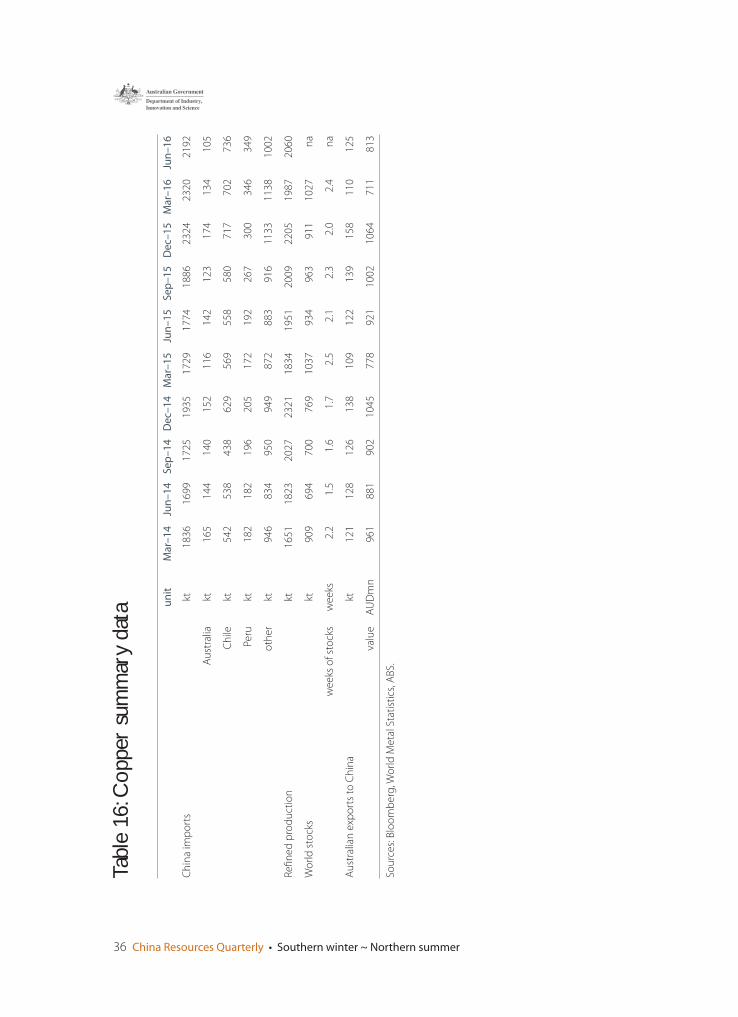
36 China Resources Quarterly • Southern winter ~ Northern summer
un
itM
ar–
14
Jun
–1
4S
ep
–1
4D
ec–
14
Mar
–1
5Ju
n–
15
Se
p–
15
De
c–1
5M
ar–
16
Jun
–1
6
Ch
ina
imp
ort
skt
18
36
16
99
17
25
19
35
17
29
17
74
18
86
23
24
23
20
21
92
Au
stra
liakt
16
51
44
14
01
52
11
61
42
12
31
74
13
41
05
Ch
ilekt
54
25
38
43
86
29
56
95
58
58
07
17
70
27
36
Peru
kt1
82
18
21
96
20
51
72
19
22
67
30
03
46
34
9
oth
er
kt9
46
83
49
50
94
98
72
88
39
16
11
33
11
38
10
02
Re
fi n
ed
pro
du
ctio
nkt
16
51
18
23
20
27
23
21
18
34
19
51
20
09
22
05
19
87
20
60
Wo
rld
sto
cks
kt9
09
69
47
00
76
91
03
79
34
96
39
11
10
27
na
we
eks
of
sto
cks
we
eks
2.2
1.5
1.6
1.7
2.5
2.1
2.3
2.0
2.4
na
Au
stra
lian
exp
ort
s to
Ch
ina
kt1
21
12
81
26
13
81
09
12
21
39
15
81
10
12
5
valu
eA
UD
mn
96
18
81
90
21
04
57
78
92
11
00
21
06
47
11
81
3
Sou
rce
s: B
loo
mb
erg
, Wo
rld
Me
tal S
tati
stic
s, A
BS.
Tabl
e 16
: Cop
per
sum
mar
y da
ta
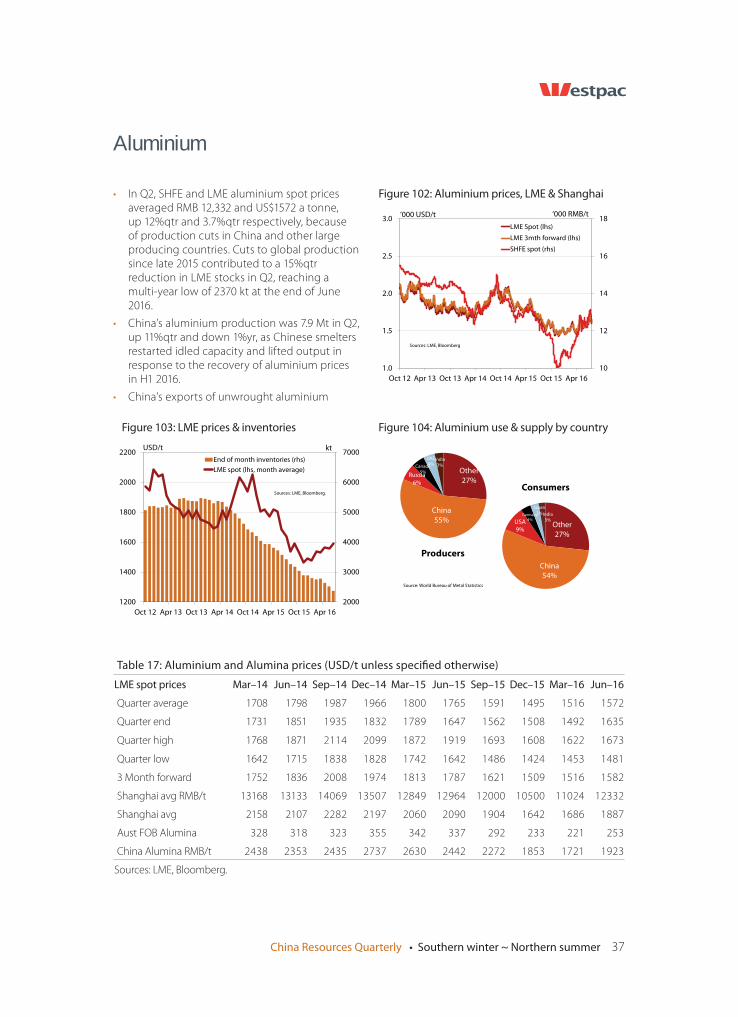
China Resources Quarterly • Southern winter ~ Northern summer 37
Aluminium
• In Q2, SHFE and LME aluminium spot prices averaged RMB 12,332 and US$1572 a tonne, up 12%qtr and 3.7%qtr respectively, because of production cuts in China and other large producing countries. Cuts to global production since late 2015 contributed to a 15%qtr reduction in LME stocks in Q2, reaching a multi-year low of 2370 kt at the end of June 2016.
• China’s aluminium production was 7.9 Mt in Q2, up 11%qtr and down 1%yr, as Chinese smelters restarted idled capacity and lifted output in response to the recovery of aluminium prices in H1 2016.
• China’s exports of unwrought aluminium
10
12
14
16
18
1.0
1.5
2.0
2.5
3.0
Oct 12 Apr 13 Oct 13 Apr 14 Oct 14 Apr 15 Oct 15 Apr 16
‘000 RMB/t ‘000 USD/t
LME Spot (lhs)
LME 3mth forward (lhs)
SHFE spot (rhs)
Sources: LME, Bloomberg
Other
27%
China
55%
Russia
6%
Canada
5%
UAE
4%India
3%
Producers
Source: World Bureau of Metal Statistics
Other
27%
China
54%
USA
9%
Germany4%
Japan
3%India
3%
Consumers
2000
3000
4000
5000
6000
7000
1200
1400
1600
1800
2000
2200
Oct 12 Apr 13 Oct 13 Apr 14 Oct 14 Apr 15 Oct 15 Apr 16
ktUSD/t
End of month inventories (rhs)
LME spot (lhs, month average)
Sources: LME, Bloomberg.
Figure 102: Aluminium prices, LME & Shanghai
Figure 103: LME prices & inventories Figure 104: Aluminium use & supply by country
Table 17: Aluminium and Alumina prices (USD/t unless specifi ed otherwise)
LME spot prices Mar–14 Jun–14 Sep–14 Dec–14 Mar–15 Jun–15 Sep–15 Dec–15 Mar–16 Jun–16
Quarter average 1708 1798 1987 1966 1800 1765 1591 1495 1516 1572
Quarter end 1731 1851 1935 1832 1789 1647 1562 1508 1492 1635
Quarter high 1768 1871 2114 2099 1872 1919 1693 1608 1622 1673
Quarter low 1642 1715 1838 1828 1742 1642 1486 1424 1453 1481
3 Month forward 1752 1836 2008 1974 1813 1787 1621 1509 1516 1582
Shanghai avg RMB/t 13168 13133 14069 13507 12849 12964 12000 10500 11024 12332
Shanghai avg 2158 2107 2282 2197 2060 2090 1904 1642 1686 1887
Aust FOB Alumina 328 318 323 355 342 337 292 233 221 253
China Alumina RMB/t 2438 2353 2435 2737 2630 2442 2272 1853 1721 1923
Sources: LME, Bloomberg.
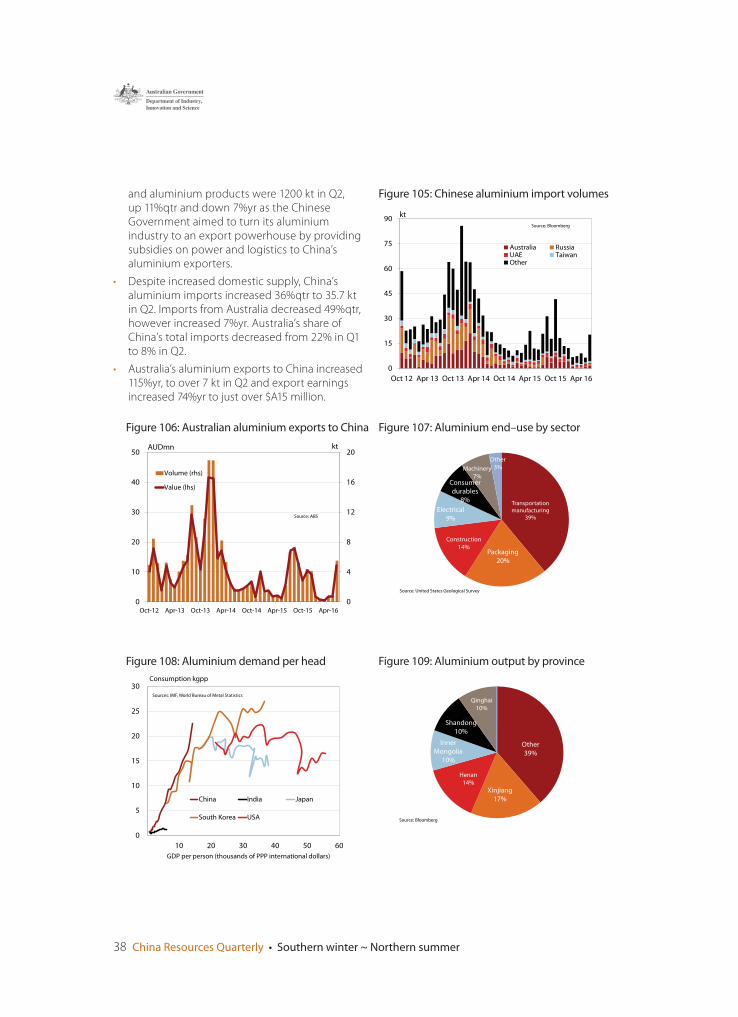
38 China Resources Quarterly • Southern winter ~ Northern summer
and aluminium products were 1200 kt in Q2, up 11%qtr and down 7%yr as the Chinese Government aimed to turn its aluminium industry to an export powerhouse by providing subsidies on power and logistics to China’s aluminium exporters.
• Despite increased domestic supply, China’s aluminium imports increased 36%qtr to 35.7 kt in Q2. Imports from Australia decreased 49%qtr, however increased 7%yr. Australia’s share of China’s total imports decreased from 22% in Q1 to 8% in Q2.
• Australia’s aluminium exports to China increased 115%yr, to over 7 kt in Q2 and export earnings increased 74%yr to just over $A15 million.
Other
39%
Xinjiang
17%
Henan
14%
Inner
Mongolia10%
Shandong
10%
Qinghai
10%
Source: Bloomberg
Figure 109: Aluminium output by province
0
15
30
45
60
75
90
Oct 12 Apr 13 Oct 13 Apr 14 Oct 14 Apr 15 Oct 15 Apr 16
kt
Australia RussiaUAE TaiwanOther
Source: Bloomberg
0
5
10
15
20
25
30
10 20 30 40 50 60
GDP per person (thousands of PPP international dollars)
China India Japan
South Korea USA
Consumption kgpp
Sources: IMF, World Bureau of Metal Statistics
0
4
8
12
16
20
0
10
20
30
40
50
Oct-12 Apr-13 Oct-13 Apr-14 Oct-14 Apr-15 Oct-15 Apr-16
ktAUDmn
Volume (rhs)
Value (lhs)
Source: ABS
Figure 105: Chinese aluminium import volumes
Figure 108: Aluminium demand per head
Figure 106: Australian aluminium exports to China Figure 107: Aluminium end–use by sector
Transportation manufacturing
39%
Packaging
20%
Construction
14%
Electrical
9%
Consumer
durables
8%
Machinery
7%
Other
3%
Source: United States Geological Survey
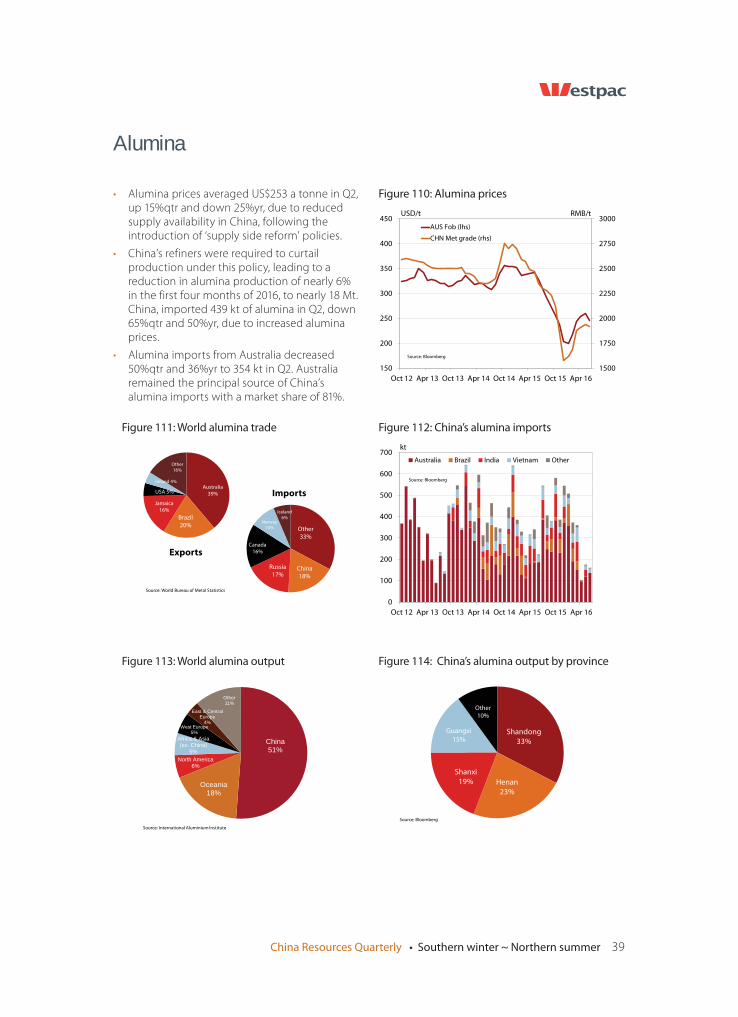
China Resources Quarterly • Southern winter ~ Northern summer 39
• Alumina prices averaged US$253 a tonne in Q2, up 15%qtr and down 25%yr, due to reduced supply availability in China, following the introduction of ‘supply side reform’ policies.
• China’s refiners were required to curtail production under this policy, leading to a reduction in alumina production of nearly 6% in the first four months of 2016, to nearly 18 Mt. China, imported 439 kt of alumina in Q2, down 65%qtr and 50%yr, due to increased alumina prices.
• Alumina imports from Australia decreased 50%qtr and 36%yr to 354 kt in Q2. Australia remained the principal source of China’s alumina imports with a market share of 81%.
Shandong
33%
Henan
23%
Shanxi
19%
Guangxi
15%
Other
10%
Source: Bloomberg
Figure 114: China’s alumina output by province
1500
1750
2000
2250
2500
2750
3000
150
200
250
300
350
400
450
Oct 12 Apr 13 Oct 13 Apr 14 Oct 14 Apr 15 Oct 15 Apr 16
RMB/tUSD/t
AUS Fob (lhs)
CHN Met grade (rhs)
Source: Bloomberg
China51%
Oceania18%
North America6%
Africa & Asia (ex. China)
5%
West Europe5%
East & Central Europe
4%
Other11%
Source: International Aluminium Institute
Other
33%
China
18%
Russia
17%
Canada
16%
Norway
10%
Iceland
6%
ImportsAustralia
39%
Brazil
20%
Jamaica
16%
USA 5%
Ireland 4%
Other
16%
Exports
Source: World Bureau of Metal Statistics
Figure 110: Alumina prices
Figure 113: World alumina output
Figure 111: World alumina trade Figure 112: China’s alumina imports
0
100
200
300
400
500
600
700
Oct 12 Apr 13 Oct 13 Apr 14 Oct 14 Apr 15 Oct 15 Apr 16
kt
Australia Brazil India Vietnam Other
Source: Bloomberg
Alumina
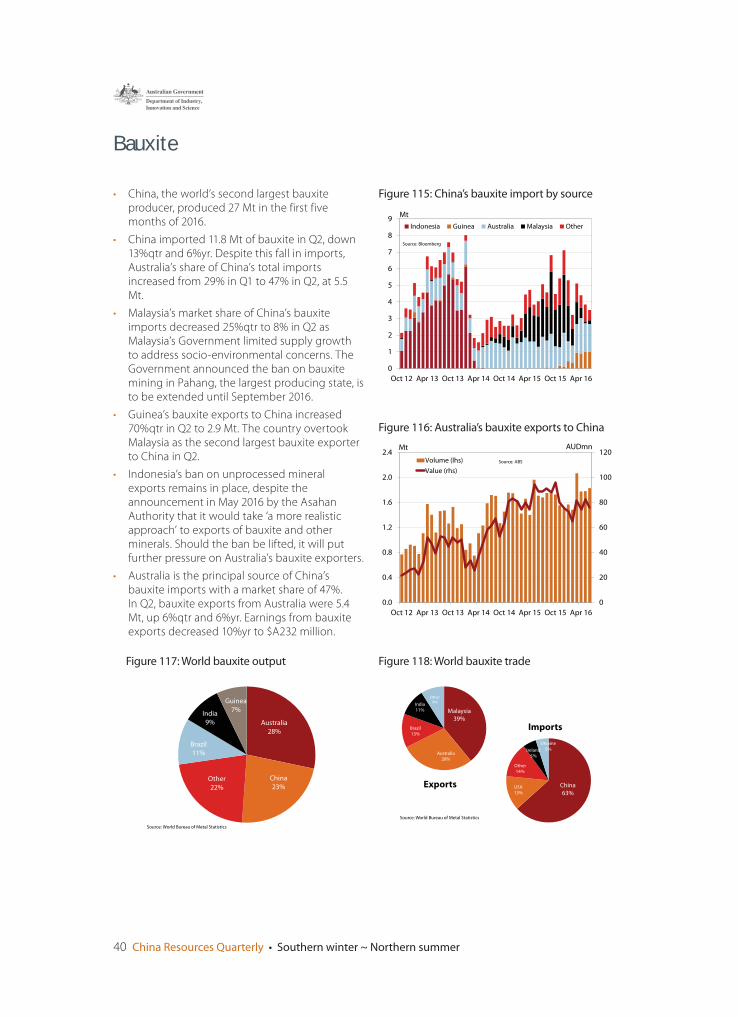
40 China Resources Quarterly • Southern winter ~ Northern summer
• China, the world’s second largest bauxite producer, produced 27 Mt in the first five months of 2016.
• China imported 11.8 Mt of bauxite in Q2, down 13%qtr and 6%yr. Despite this fall in imports, Australia’s share of China’s total imports increased from 29% in Q1 to 47% in Q2, at 5.5 Mt.
• Malaysia’s market share of China’s bauxite imports decreased 25%qtr to 8% in Q2 as Malaysia’s Government limited supply growth to address socio-environmental concerns. The Government announced the ban on bauxite mining in Pahang, the largest producing state, is to be extended until September 2016.
• Guinea’s bauxite exports to China increased 70%qtr in Q2 to 2.9 Mt. The country overtook Malaysia as the second largest bauxite exporter to China in Q2.
• Indonesia’s ban on unprocessed mineral exports remains in place, despite the announcement in May 2016 by the Asahan Authority that it would take ‘a more realistic approach’ to exports of bauxite and other minerals. Should the ban be lifted, it will put further pressure on Australia’s bauxite exporters.
• Australia is the principal source of China’s bauxite imports with a market share of 47%. In Q2, bauxite exports from Australia were 5.4 Mt, up 6%qtr and 6%yr. Earnings from bauxite exports decreased 10%yr to $A232 million.
Figure 118: World bauxite trade
0
1
2
3
4
5
6
7
8
9
Oct 12 Apr 13 Oct 13 Apr 14 Oct 14 Apr 15 Oct 15 Apr 16
Mt
Indonesia Guinea Australia Malaysia Other
Source: Bloomberg
Australia
28%
China
23%Other
22%
Brazil
11%
India
9%
Guinea
7%
Source: World Bureau of Metal Statistics
0.0
0.4
0.8
1.2
1.6
2.0
2.4
Oct 12 Apr 13 Oct 13 Apr 14 Oct 14 Apr 15 Oct 15 Apr 16
0
20
40
60
80
100
120Mt AUDmn
Volume (lhs)
Value (rhs)
Source: ABS
Figure 117: World bauxite output
Figure 116: Australia’s bauxite exports to China
Malaysia
39%
Australia
28%
Brazil
13%
India11%
Other9%
Exports China
63%USA
13%
Other
14%
Ireland
5%
Ukraine
5%
Imports
Source: World Bureau of Metal Statistics
Bauxite
Figure 115: China’s bauxite import by source
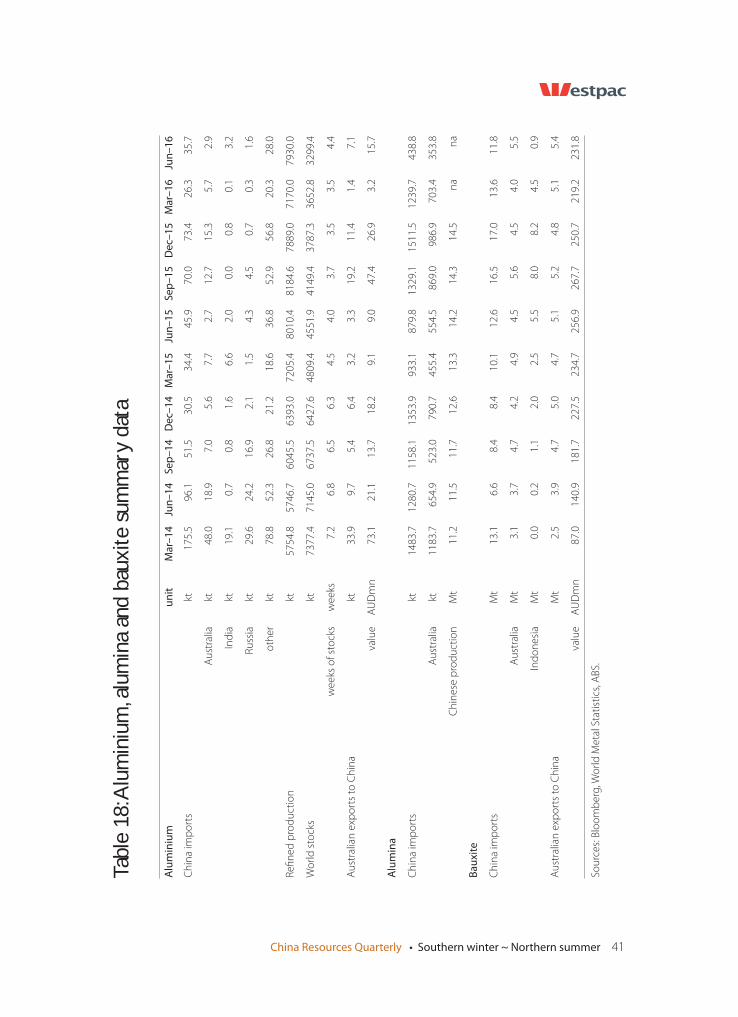
China Resources Quarterly • Southern winter ~ Northern summer 41
Alu
min
ium
un
itM
ar–
14
Jun
–1
4S
ep
–1
4D
ec–
14
Mar
–1
5Ju
n–
15
Se
p–
15
De
c–1
5M
ar–
16
Jun
–1
6
Ch
ina
imp
ort
skt
17
5.5
96
.15
1.5
30
.53
4.4
45
.97
0.0
73
.42
6.3
35
.7
Au
stra
liakt
48
.01
8.9
7.0
5.6
7.7
2.7
12
.71
5.3
5.7
2.9
Ind
iakt
19
.10
.70
.81
.66
.62
.00
.00
.80
.13
.2
Ru
ssia
kt2
9.6
24
.21
6.9
2.1
1.5
4.3
4.5
0.7
0.3
1.6
oth
er
kt7
8.8
52
.32
6.8
21
.21
8.6
36
.85
2.9
56
.82
0.3
28
.0
Re
fi n
ed
pro
du
ctio
nkt
57
54
.85
74
6.7
60
45
.56
39
3.0
72
05
.48
01
0.4
81
84
.67
88
9.0
71
70
.07
93
0.0
Wo
rld
sto
cks
kt7
37
7.4
71
45
.06
73
7.5
64
27
.64
80
9.4
45
51
.94
14
9.4
37
87
.33
65
2.8
32
99
.4
we
eks
of
sto
cks
we
eks
7.2
6.8
6.5
6.3
4.5
4.0
3.7
3.5
3.5
4.4
Au
stra
lian
exp
ort
s to
Ch
ina
kt3
3.9
9.7
5.4
6.4
3.2
3.3
19
.21
1.4
1.4
7.1
valu
eA
UD
mn
73
.12
1.1
13
.71
8.2
9.1
9.0
47
.42
6.9
3.2
15
.7
Alu
min
a
Ch
ina
imp
ort
skt
14
83
.71
28
0.7
11
58
.11
35
3.9
93
3.1
87
9.8
13
29
.11
51
1.5
12
39
.74
38
.8
Au
stra
liakt
11
83
.76
54
.95
23
.07
90
.74
55
.45
54
.58
69
.09
86
.97
03
.43
53
.8
Ch
ine
se p
rod
uct
ion
Mt
11
.21
1.5
11
.71
2.6
13
.31
4.2
14
.31
4.5
na
na
Ba
uxi
te
Ch
ina
imp
ort
sM
t1
3.1
6.6
8.4
8.4
10
.11
2.6
16
.51
7.0
13
.61
1.8
Au
stra
liaM
t3
.13
.74
.74
.24
.94
.55
.64
.54
.05
.5
Ind
on
esi
aM
t0
.00
.21
.12
.02
.55
.58
.08
.24
.50
.9
Au
stra
lian
exp
ort
s to
Ch
ina
Mt
2.5
3.9
4.7
5.0
4.7
5.1
5.2
4.8
5.1
5.4
valu
eA
UD
mn
87
.01
40
.91
81
.72
27
.52
34
.72
56
.92
67
.72
50
.72
19
.22
31
.8
Sou
rce
s: B
loo
mb
erg
, Wo
rld
Me
tal S
tati
stic
s, A
BS.
Tabl
e 18
: Alu
min
ium
, alu
min
a an
d ba
uxite
sum
mar
y da
ta
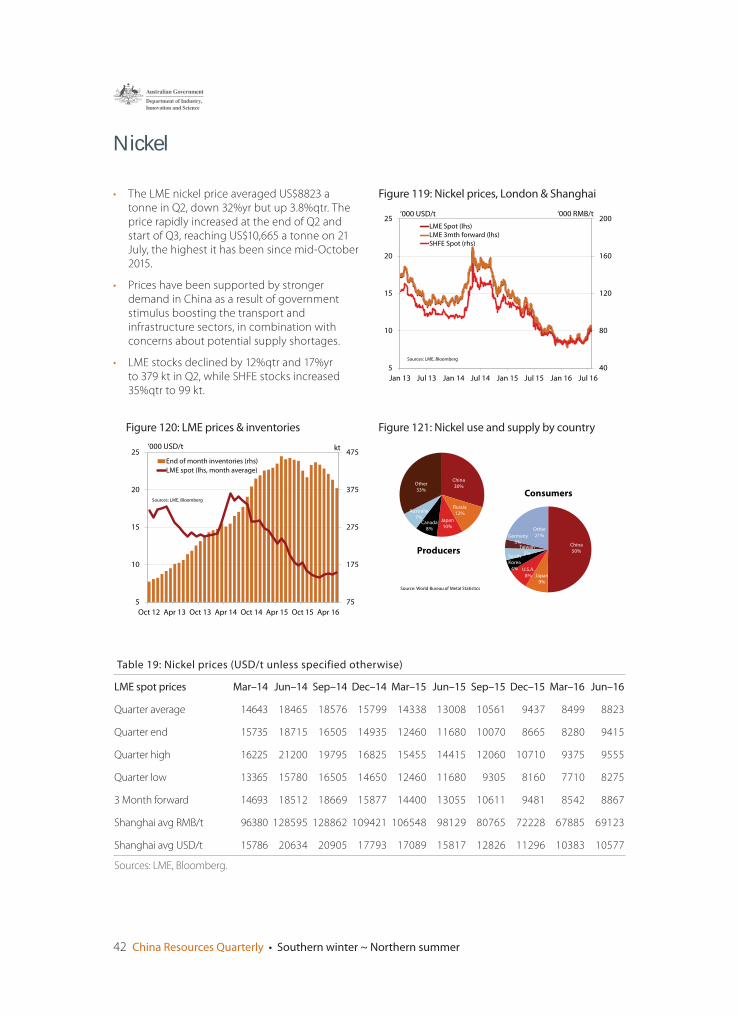
42 China Resources Quarterly • Southern winter ~ Northern summer
Nickel
• The LME nickel price averaged US$8823 a tonne in Q2, down 32%yr but up 3.8%qtr. The price rapidly increased at the end of Q2 and start of Q3, reaching US$10,665 a tonne on 21 July, the highest it has been since mid-October 2015.
• Prices have been supported by stronger demand in China as a result of government stimulus boosting the transport and infrastructure sectors, in combination with concerns about potential supply shortages.
• LME stocks declined by 12%qtr and 17%yr to 379 kt in Q2, while SHFE stocks increased 35%qtr to 99 kt.
40
80
120
160
200
5
10
15
20
25
Jan 13 Jul 13 Jan 14 Jul 14 Jan 15 Jul 15 Jan 16 Jul 16
‘000 RMB/t‘000 USD/t
LME Spot (lhs)
LME 3mth forward (lhs)
SHFE Spot (rhs)
Sources: LME, Bloomberg
China
30%
Russia
12%
Japan
10%Canada
8%
Australia
7%
Other
33%
Producers
Source: World Bureau of Metal Statistics
China
50%
Japan
9%
U.S.A.
8%
South
Korea
4%
Taiwan
5%
Germany
3%
Other
21%
Consumers
75
175
275
375
475
5
10
15
20
25
Oct 12 Apr 13 Oct 13 Apr 14 Oct 14 Apr 15 Oct 15 Apr 16
kt‘000 USD/t
End of month inventories (rhs)
LME spot (lhs, month average)
Sources: LME, Bloomberg
Figure 119: Nickel prices, London & Shanghai
Figure 120: LME prices & inventories Figure 121: Nickel use and supply by country
Table 19: Nickel prices (USD/t unless specified otherwise)
LME spot prices Mar–14 Jun–14 Sep–14 Dec–14 Mar–15 Jun–15 Sep–15 Dec–15 Mar–16 Jun–16
Quarter average 14643 18465 18576 15799 14338 13008 10561 9437 8499 8823
Quarter end 15735 18715 16505 14935 12460 11680 10070 8665 8280 9415
Quarter high 16225 21200 19795 16825 15455 14415 12060 10710 9375 9555
Quarter low 13365 15780 16505 14650 12460 11680 9305 8160 7710 8275
3 Month forward 14693 18512 18669 15877 14400 13055 10611 9481 8542 8867
Shanghai avg RMB/t 96380 128595 128862 109421 106548 98129 80765 72228 67885 69123
Shanghai avg USD/t 15786 20634 20905 17793 17089 15817 12826 11296 10383 10577
Sources: LME, Bloomberg.
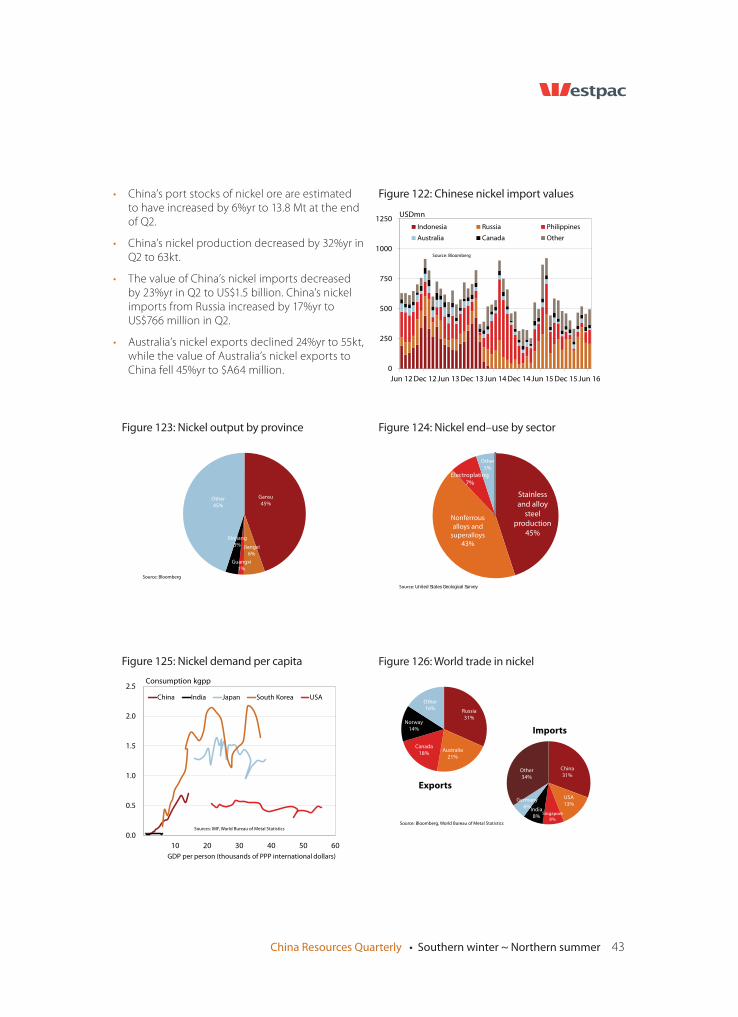
China Resources Quarterly • Southern winter ~ Northern summer 43
• China’s port stocks of nickel ore are estimated to have increased by 6%yr to 13.8 Mt at the end of Q2.
• China’s nickel production decreased by 32%yr in Q2 to 63kt.
• The value of China’s nickel imports decreased by 23%yr in Q2 to US$1.5 billion. China’s nickel imports from Russia increased by 17%yr to US$766 million in Q2.
• Australia’s nickel exports declined 24%yr to 55kt, while the value of Australia’s nickel exports to China fell 45%yr to $A64 million.
Gansu
45%
Jiangxi
6%
Guangxi
1%
Xinjiang
3%
Other
45%
Source: Bloomberg
Figure 125: Nickel demand per capita
0
250
500
750
1000
1250
Jun 12 Dec 12 Jun 13 Dec 13 Jun 14 Dec 14 Jun 15 Dec 15 Jun 16
USDmn
Indonesia Russia Philippines
Australia Canada Other
Source: Bloomberg
Stainless
and alloy
steel
production
45%
Nonferrous
alloys and superalloys
43%
Electroplating
7%
Other
5%
Source: United States Geological Survey
0.0
0.5
1.0
1.5
2.0
2.5
10 20 30 40 50 60
GDP per person (thousands of PPP international dollars)
China India Japan South Korea USA
Consumption kgpp
Sources: IMF, World Bureau of Metal Statistics
Figure 122: Chinese nickel import values
Figure 124: Nickel end–use by sectorFigure 123: Nickel output by province
Figure 126: World trade in nickel
Russia
31%
Australia
21%
Canada
18%
Norway
14%
Other
16%
Exports
China
31%
USA
13%
Singapore8%
India
8%
Germany
6%
Other
34%
Imports
Source: Bloomberg, World Bureau of Metal Statistics
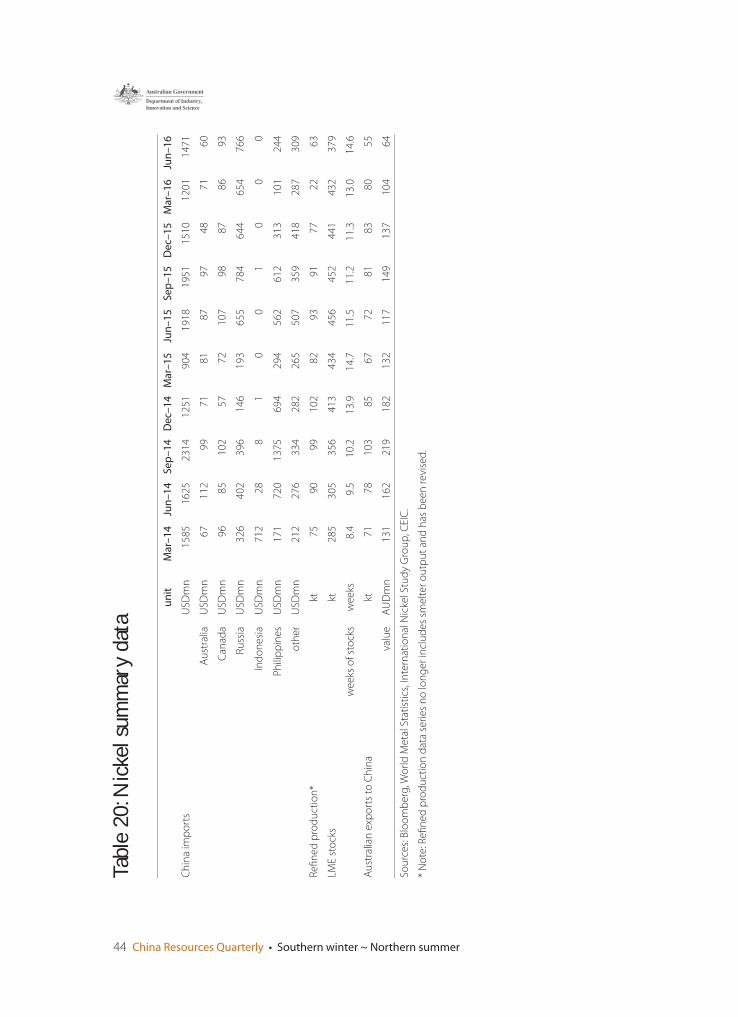
44 China Resources Quarterly • Southern winter ~ Northern summer
un
itM
ar–
14
Jun
–1
4S
ep
–1
4D
ec–
14
Mar
–1
5Ju
n–
15
Se
p–
15
De
c–1
5M
ar–
16
Jun
–1
6
Ch
ina
imp
ort
sU
SDm
n1
58
51
62
52
31
41
25
19
04
19
18
19
51
15
10
12
01
14
71
Au
stra
liaU
SDm
n6
71
12
99
71
81
87
97
48
71
60
Can
ada
USD
mn
96
85
10
25
77
21
07
98
87
86
93
Ru
ssia
USD
mn
32
64
02
39
61
46
19
36
55
78
46
44
65
47
66
Ind
on
esi
aU
SDm
n7
12
28
81
00
10
00
Ph
ilip
pin
es
USD
mn
17
17
20
13
75
69
42
94
56
26
12
31
31
01
24
4
oth
er
USD
mn
21
22
76
33
42
82
26
55
07
35
94
18
28
73
09
Re
fi n
ed
pro
du
ctio
n*
kt7
59
09
91
02
82
93
91
77
22
63
LME
sto
cks
kt2
85
30
53
56
41
34
34
45
64
52
44
14
32
37
9
we
eks
of
sto
cks
we
eks
8.4
9.5
10
.21
3.9
14
.71
1.5
11
.21
1.3
13
.01
4.6
Au
stra
lian
exp
ort
s to
Ch
ina
kt7
17
81
03
85
67
72
81
83
80
55
valu
eA
UD
mn
13
11
62
21
91
82
13
21
17
14
91
37
10
46
4
Sou
rce
s: B
loo
mb
erg
, Wo
rld
Me
tal S
tati
stic
s, In
tern
atio
nal
Nic
kel S
tud
y G
rou
p, C
EIC
.
* N
ote
: Re
fi n
ed
pro
du
ctio
n d
ata
seri
es
no
lon
ge
r in
clu
de
s sm
elt
er
ou
tpu
t an
d h
as b
ee
n r
evi
sed
.
Tabl
e 20
: Nic
kel s
umm
ary
data
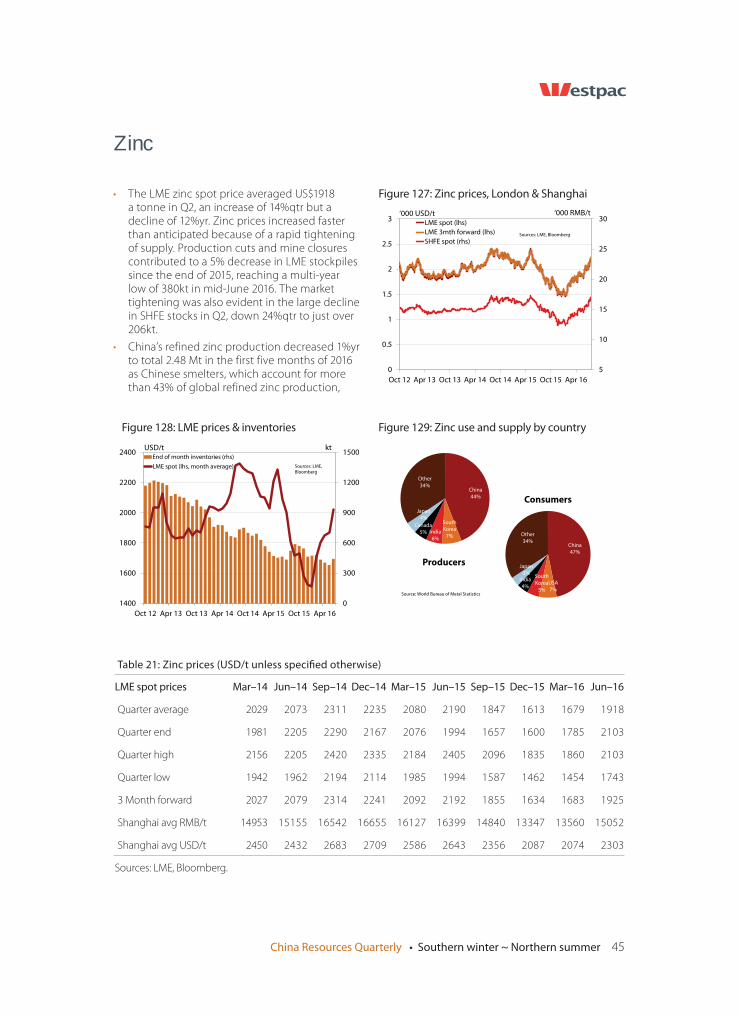
China Resources Quarterly • Southern winter ~ Northern summer 45
Zinc
• The LME zinc spot price averaged US$1918 a tonne in Q2, an increase of 14%qtr but a decline of 12%yr. Zinc prices increased faster than anticipated because of a rapid tightening of supply. Production cuts and mine closures contributed to a 5% decrease in LME stockpiles since the end of 2015, reaching a multi-year low of 380kt in mid-June 2016. The market tightening was also evident in the large decline in SHFE stocks in Q2, down 24%qtr to just over 206kt.
• China’s refined zinc production decreased 1%yr to total 2.48 Mt in the first five months of 2016 as Chinese smelters, which account for more than 43% of global refined zinc production,
5
10
15
20
25
30
0
0.5
1
1.5
2
2.5
3
Oct 12 Apr 13 Oct 13 Apr 14 Oct 14 Apr 15 Oct 15 Apr 16
‘000 RMB/t‘000 USD/tLME spot (lhs)
LME 3mth forward (lhs)
SHFE spot (rhs)Sources: LME, Bloomberg
China
44%
South
Korea
7%India
6%
Canada
5%
Japan
4%
Other
34%
Producers
Source: World Bureau of Metal Statistics
China
47%
USA
7%
South
Korea
5%
India
4%
Japan
3%
Other
34%
Consumers
0
300
600
900
1200
1500
1400
1600
1800
2000
2200
2400
Oct 12 Apr 13 Oct 13 Apr 14 Oct 14 Apr 15 Oct 15 Apr 16
ktUSD/tEnd of month inventories (rhs)
LME spot (lhs, month average) Sources: LME,
Bloomberg
Figure 127: Zinc prices, London & Shanghai
Figure 128: LME prices & inventories Figure 129: Zinc use and supply by country
Table 21: Zinc prices (USD/t unless specifi ed otherwise)
LME spot prices Mar–14 Jun–14 Sep–14 Dec–14 Mar–15 Jun–15 Sep–15 Dec–15 Mar–16 Jun–16
Quarter average 2029 2073 2311 2235 2080 2190 1847 1613 1679 1918
Quarter end 1981 2205 2290 2167 2076 1994 1657 1600 1785 2103
Quarter high 2156 2205 2420 2335 2184 2405 2096 1835 1860 2103
Quarter low 1942 1962 2194 2114 1985 1994 1587 1462 1454 1743
3 Month forward 2027 2079 2314 2241 2092 2192 1855 1634 1683 1925
Shanghai avg RMB/t 14953 15155 16542 16655 16127 16399 14840 13347 13560 15052
Shanghai avg USD/t 2450 2432 2683 2709 2586 2643 2356 2087 2074 2303
Sources: LME, Bloomberg.
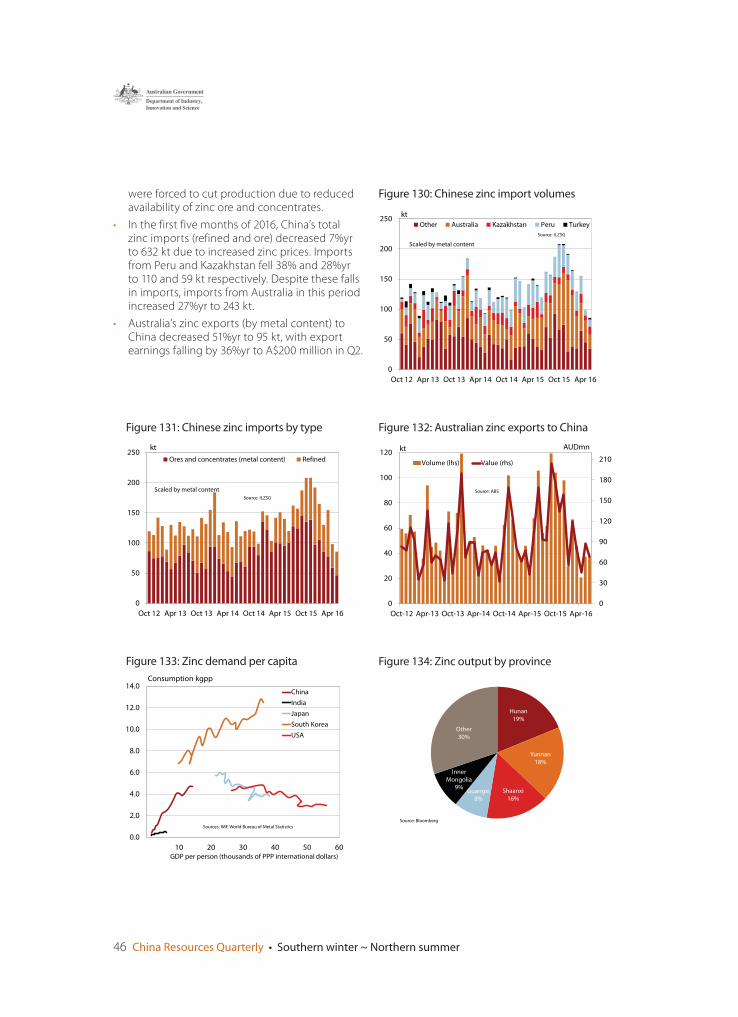
46 China Resources Quarterly • Southern winter ~ Northern summer
were forced to cut production due to reduced availability of zinc ore and concentrates.
• In the first five months of 2016, China’s total zinc imports (refined and ore) decreased 7%yr to 632 kt due to increased zinc prices. Imports from Peru and Kazakhstan fell 38% and 28%yr to 110 and 59 kt respectively. Despite these falls in imports, imports from Australia in this period increased 27%yr to 243 kt.
• Australia’s zinc exports (by metal content) to China decreased 51%yr to 95 kt, with export earnings falling by 36%yr to A$200 million in Q2.
Hunan
19%
Yunnan
18%
Shaanxi
16%Guangxi
8%
Inner
Mongolia9%
Other
30%
Source: Bloomberg
Figure 133: Zinc demand per capita
0
50
100
150
200
250
Oct 12 Apr 13 Oct 13 Apr 14 Oct 14 Apr 15 Oct 15 Apr 16
kt
Other Australia Kazakhstan Peru Turkey
Source: ILZSG
Scaled by metal content
0
30
60
90
120
150
180
210
0
20
40
60
80
100
120
Oct-12 Apr-13 Oct-13 Apr-14 Oct-14 Apr-15 Oct-15 Apr-16
AUDmnkt
Volume (lhs) Value (rhs)
Source: ABS
0.0
2.0
4.0
6.0
8.0
10.0
12.0
14.0
10 20 30 40 50 60GDP per person (thousands of PPP international dollars)
China
India
Japan
South Korea
USA
Consumption kgpp
Sources: IMF, World Bureau of Metal Statistics
Figure 130: Chinese zinc import volumes
Figure 132: Australian zinc exports to China
Figure 134: Zinc output by province
0
50
100
150
200
250
Oct 12 Apr 13 Oct 13 Apr 14 Oct 14 Apr 15 Oct 15 Apr 16
kt
Ores and concentrates (metal content) Refined
Source: ILZSG
Scaled by metal content
Figure 131: Chinese zinc imports by type
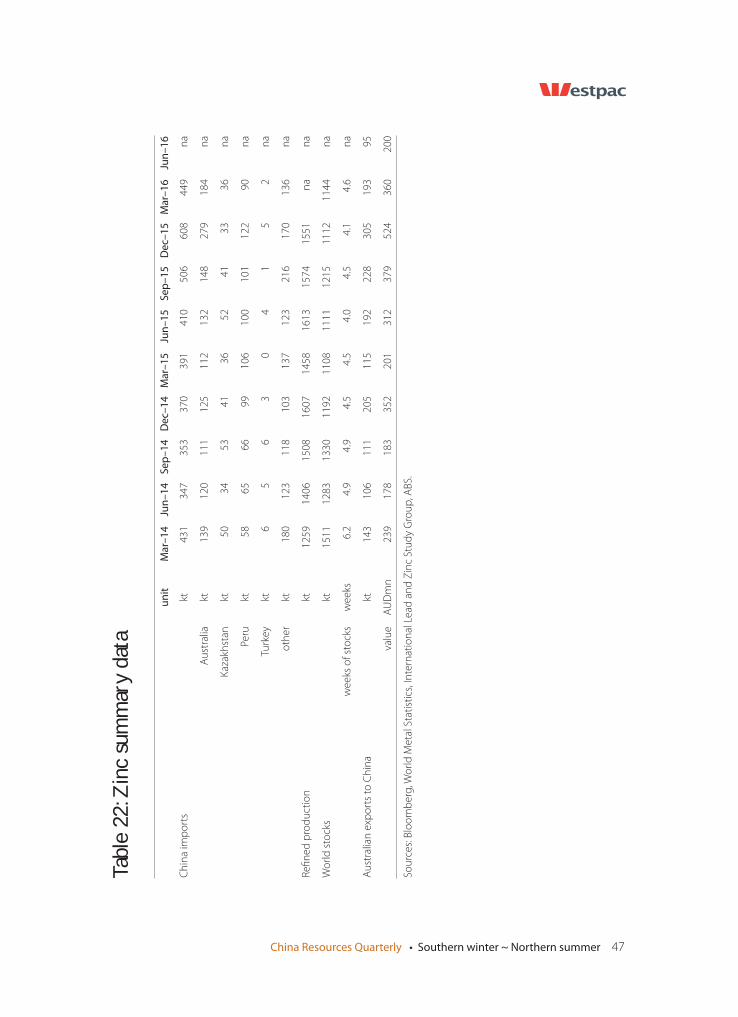
China Resources Quarterly • Southern winter ~ Northern summer 47
un
itM
ar–
14
Jun
–1
4S
ep
–1
4D
ec–
14
Mar
–1
5Ju
n–
15
Se
p–
15
De
c–1
5M
ar–
16
Jun
–1
6
Ch
ina
imp
ort
skt
43
13
47
35
33
70
39
14
10
50
66
08
44
9n
a
Au
stra
liakt
13
91
20
11
11
25
11
21
32
14
82
79
18
4n
a
Kaz
akh
stan
kt5
03
45
34
13
65
24
13
33
6n
a
Peru
kt5
86
56
69
91
06
10
01
01
12
29
0n
a
Turk
ey
kt6
56
30
41
52
na
oth
er
kt1
80
12
31
18
10
31
37
12
32
16
17
01
36
na
Re
fi n
ed
pro
du
ctio
nkt
12
59
14
06
15
08
16
07
14
58
16
13
15
74
15
51
na
na
Wo
rld
sto
cks
kt1
51
11
28
31
33
01
19
21
10
81
11
11
21
51
11
21
14
4n
a
we
eks
of
sto
cks
we
eks
6.2
4.9
4.9
4.5
4.5
4.0
4.5
4.1
4.6
na
Au
stra
lian
exp
ort
s to
Ch
ina
kt1
43
10
61
11
20
51
15
19
22
28
30
51
93
95
valu
eA
UD
mn
23
91
78
18
33
52
20
13
12
37
95
24
36
02
00
Sou
rce
s: B
loo
mb
erg
, Wo
rld
Me
tal S
tati
stic
s, In
tern
atio
nal
Le
ad a
nd
Zin
c St
ud
y G
rou
p, A
BS.
Tabl
e 22
: Zin
c su
mm
ary
data
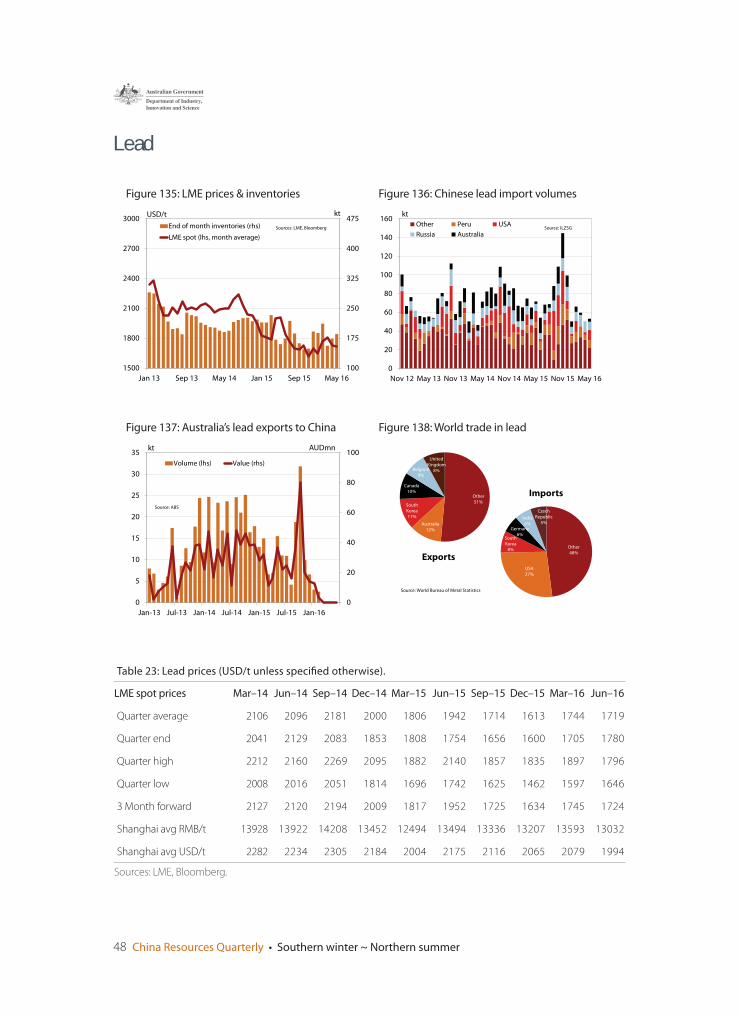
48 China Resources Quarterly • Southern winter ~ Northern summer
Lead
0
20
40
60
80
100
120
140
160
Nov 12 May 13 Nov 13 May 14 Nov 14 May 15 Nov 15 May 16
kt
Other Peru USA
Russia AustraliaSource: ILZSG
100
175
250
325
400
475
1500
1800
2100
2400
2700
3000
Jan 13 Sep 13 May 14 Jan 15 Sep 15 May 16
ktUSD/t
End of month inventories (rhs)
LME spot (lhs, month average)
Sources: LME, Bloomberg
Other
51%
Australia
12%
South
Korea
11%
Canada
10%
Belgium
8%
United
Kingdom
8%
Exports
Source: World Bureau of Metal Statistics
Other
48%
USA
27%
South
Korea
8%
Germany
6%
India
6%
Czech
Republic
5%
Imports
0
20
40
60
80
100
0
5
10
15
20
25
30
35
Jan-13 Jul-13 Jan-14 Jul-14 Jan-15 Jul-15 Jan-16
kt AUDmn
Volume (lhs) Value (rhs)
Source: ABS
Figure 136: Chinese lead import volumesFigure 135: LME prices & inventories
Figure 137: Australia’s lead exports to China Figure 138: World trade in lead
Table 23: Lead prices (USD/t unless specifi ed otherwise).
LME spot prices Mar–14 Jun–14 Sep–14 Dec–14 Mar–15 Jun–15 Sep–15 Dec–15 Mar–16 Jun–16
Quarter average 2106 2096 2181 2000 1806 1942 1714 1613 1744 1719
Quarter end 2041 2129 2083 1853 1808 1754 1656 1600 1705 1780
Quarter high 2212 2160 2269 2095 1882 2140 1857 1835 1897 1796
Quarter low 2008 2016 2051 1814 1696 1742 1625 1462 1597 1646
3 Month forward 2127 2120 2194 2009 1817 1952 1725 1634 1745 1724
Shanghai avg RMB/t 13928 13922 14208 13452 12494 13494 13336 13207 13593 13032
Shanghai avg USD/t 2282 2234 2305 2184 2004 2175 2116 2065 2079 1994
Sources: LME, Bloomberg.
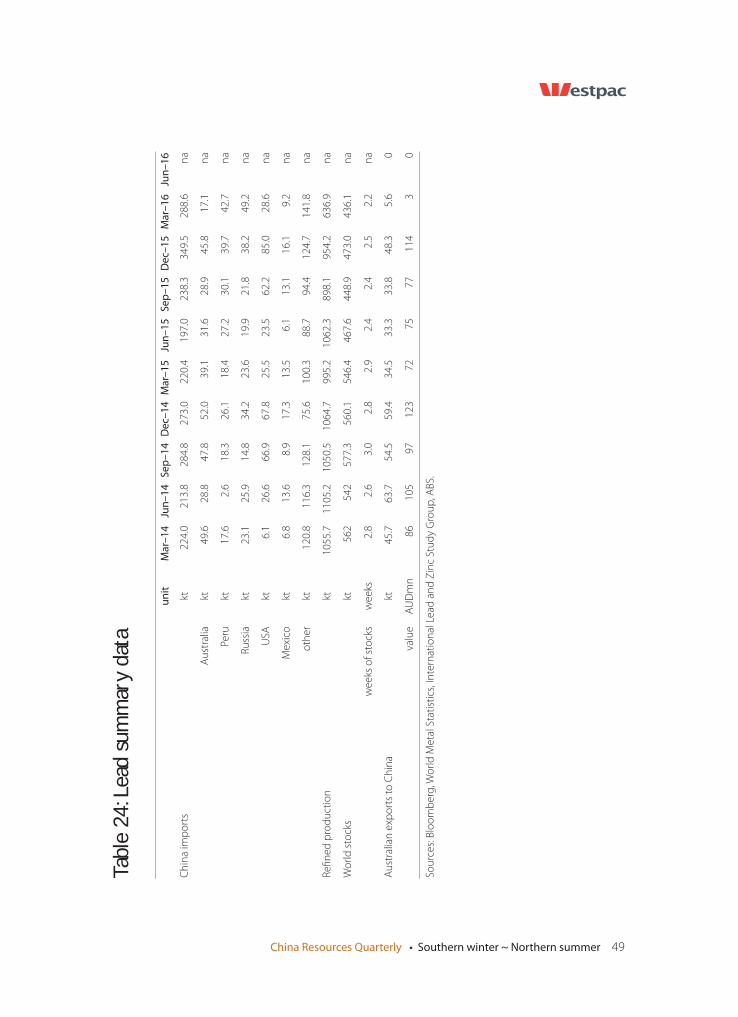
China Resources Quarterly • Southern winter ~ Northern summer 49
un
itM
ar–
14
Jun
–1
4S
ep
–1
4D
ec–
14
Mar
–1
5Ju
n–
15
Se
p–
15
De
c–1
5M
ar–
16
Jun
–1
6
Ch
ina
imp
ort
skt
22
4.0
21
3.8
28
4.8
27
3.0
22
0.4
19
7.0
23
8.3
34
9.5
28
8.6
na
Au
stra
liakt
49
.62
8.8
47
.85
2.0
39
.13
1.6
28
.94
5.8
17
.1n
a
Peru
kt1
7.6
2.6
18
.32
6.1
18
.42
7.2
30
.13
9.7
42
.7n
a
Ru
ssia
kt2
3.1
25
.91
4.8
34
.22
3.6
19
.92
1.8
38
.24
9.2
na
USA
kt6
.12
6.6
66
.96
7.8
25
.52
3.5
62
.28
5.0
28
.6n
a
Me
xico
kt6
.81
3.6
8.9
17
.31
3.5
6.1
13
.11
6.1
9.2
na
oth
er
kt1
20
.81
16
.31
28
.17
5.6
10
0.3
88
.79
4.4
12
4.7
14
1.8
na
Re
fi n
ed
pro
du
ctio
nkt
10
55
.71
10
5.2
10
50
.51
06
4.7
99
5.2
10
62
.38
98
.19
54
.26
36
.9n
a
Wo
rld
sto
cks
kt5
62
54
25
77
.35
60
.15
46
.44
67
.64
48
.94
73
.04
36
.1n
a
we
eks
of
sto
cks
we
eks
2.8
2.6
3.0
2.8
2.9
2.4
2.4
2.5
2.2
na
Au
stra
lian
exp
ort
s to
Ch
ina
kt4
5.7
63
.75
4.5
59
.43
4.5
33
.33
3.8
48
.35
.60
valu
eA
UD
mn
86
10
59
71
23
72
75
77
11
43
0
Sou
rce
s: B
loo
mb
erg
, Wo
rld
Me
tal S
tati
stic
s, In
tern
atio
nal
Le
ad a
nd
Zin
c St
ud
y G
rou
p, A
BS.
Tabl
e 24
: Lea
d su
mm
ary
data
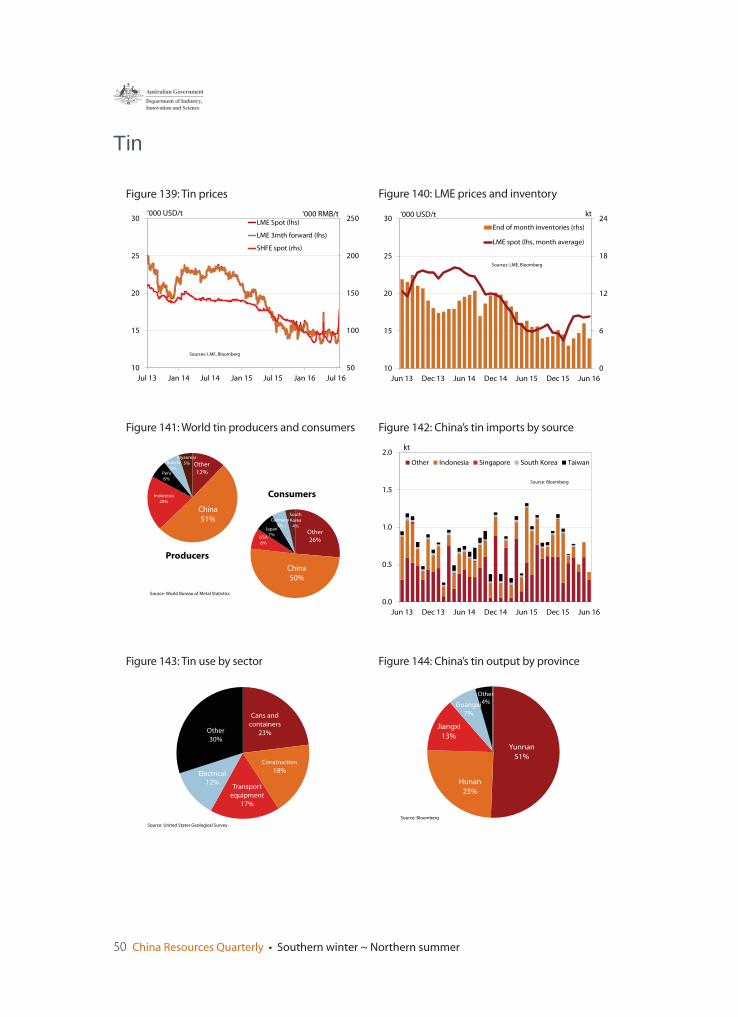
50 China Resources Quarterly • Southern winter ~ Northern summer
Yunnan
51%
Hunan
25%
Jiangxi
13%
Guangxi
7%
Other
4%
Source: Bloomberg
Figure 144: China’s tin output by province
0
6
12
18
24
10
15
20
25
30
Jun 13 Dec 13 Jun 14 Dec 14 Jun 15 Dec 15 Jun 16
kt‘000 USD/t
End of month inventories (rhs)
LME spot (lhs, month average)
Sources: LME, Bloomberg
Cans and
containers
23%
Construction
18%
Transport
equipment
17%
Electrical
12%
Other
30%
Source: United States Geological Survey
Other
12%
China
51%
Indonesia20%
Peru6%
Bolivia6%
Myanmar
5%
Producers
Source: World Bureau of Metal Statistics
Other
26%
China
50%
USA8%
Japan7%
Germany
5%
South Korea
4%
Consumers
50
100
150
200
250
10
15
20
25
30
Jul 13 Jan 14 Jul 14 Jan 15 Jul 15 Jan 16 Jul 16
‘000 RMB/t‘000 USD/tLME Spot (lhs)
LME 3mth forward (lhs)
SHFE spot (rhs)
Sources: LME, Bloomberg
Figure 140: LME prices and inventory
Figure 143: Tin use by sector
Figure 141: World tin producers and consumers
Figure 139: Tin prices
Figure 142: China’s tin imports by source
0.0
0.5
1.0
1.5
2.0
Jun 13 Dec 13 Jun 14 Dec 14 Jun 15 Dec 15 Jun 16
kt
Other Indonesia Singapore South Korea Taiwan
Source: Bloomberg
Tin
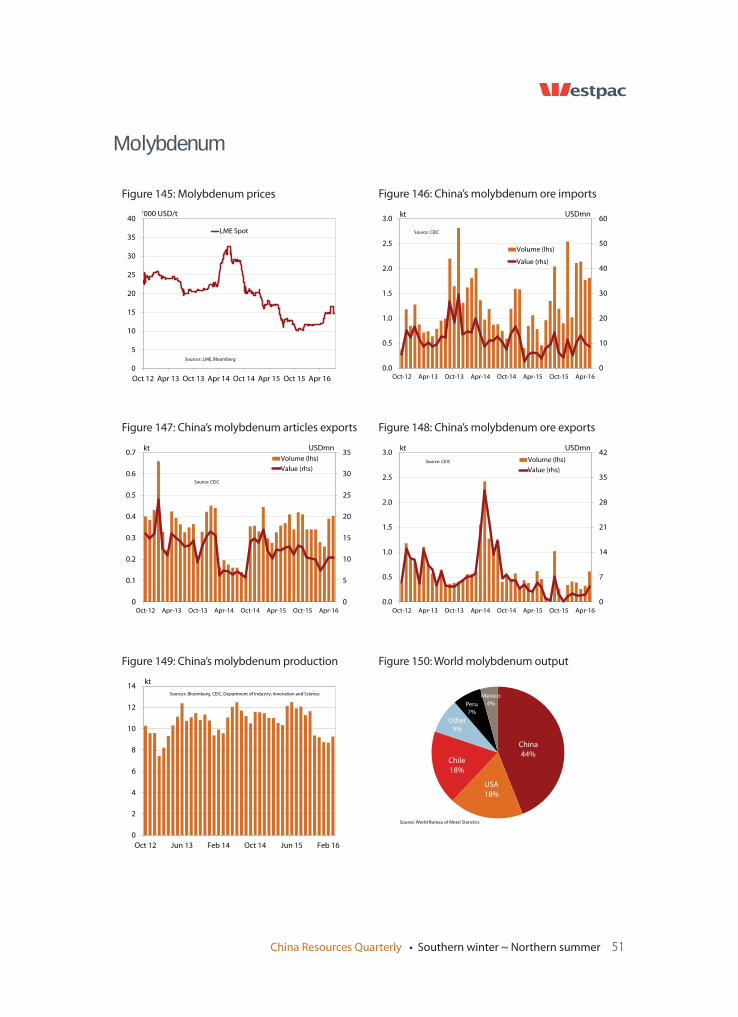
China Resources Quarterly • Southern winter ~ Northern summer 51
China
44%
USA
18%
Chile
18%
Other
9%
Peru
7%
Mexico
4%
Source: World Bureau of Metal Statistics
Figure 150: World molybdenum output
0
10
20
30
40
50
60
0.0
0.5
1.0
1.5
2.0
2.5
3.0
Oct-12 Apr-13 Oct-13 Apr-14 Oct-14 Apr-15 Oct-15 Apr-16
USDmnkt
Volume (lhs)
Value (rhs)
Source: CEIC
0
2
4
6
8
10
12
14
Oct 12 Jun 13 Feb 14 Oct 14 Jun 15 Feb 16
kt
Sources: Bloomberg, CEIC, Department of Industry, Innovation and Science
0
5
10
15
20
25
30
35
0
0.1
0.2
0.3
0.4
0.5
0.6
0.7
Oct-12 Apr-13 Oct-13 Apr-14 Oct-14 Apr-15 Oct-15 Apr-16
USDmnkt
Volume (lhs)
Value (rhs)
Source: CEIC
Figure 146: China’s molybdenum ore imports
Figure 149: China’s molybdenum production
Figure 147: China’s molybdenum articles exports Figure 148: China’s molybdenum ore exports
0
7
14
21
28
35
42
0.0
0.5
1.0
1.5
2.0
2.5
3.0
Oct-12 Apr-13 Oct-13 Apr-14 Oct-14 Apr-15 Oct-15 Apr-16
USDmnkt
Volume (lhs)
Value (rhs)
Source: CEIC
Molybdenum
0
5
10
15
20
25
30
35
40
Oct 12 Apr 13 Oct 13 Apr 14 Oct 14 Apr 15 Oct 15 Apr 16
‘000 USD/t
LME Spot
Sources: LME, Bloomberg
Figure 145: Molybdenum prices
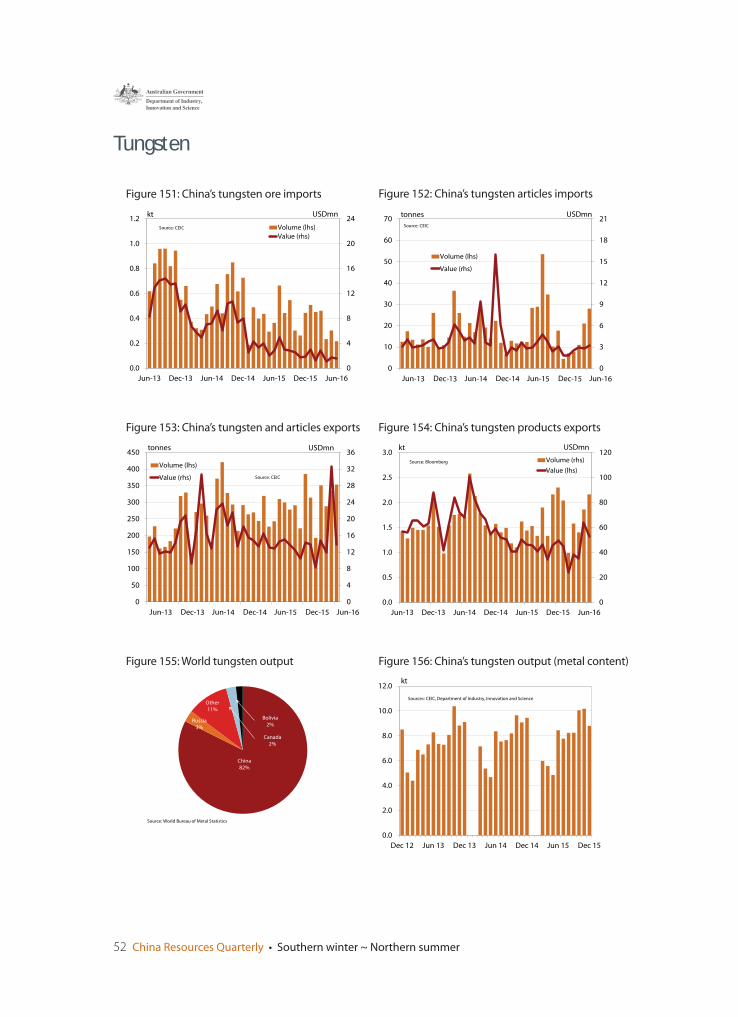
52 China Resources Quarterly • Southern winter ~ Northern summer
0.0
0.5
1.0
1.5
2.0
2.5
3.0
Jun-13 Dec-13 Jun-14 Dec-14 Jun-15 Dec-15 Jun-16
0
20
40
60
80
100
120kt USDmn
Volume (rhs)
Value (lhs)
Source: Bloomberg
Figure 156: China’s tungsten output (metal content)
0
3
6
9
12
15
18
21
0
10
20
30
40
50
60
70USDmntonnes
Volume (lhs)
Value (rhs)
Source: CEIC
China
82%
Russia
3%
Other
11%
Canada
2%
Bolivia
2%
Source: World Bureau of Metal Statistics
0
4
8
12
16
20
24
28
32
36
0
50
100
150
200
250
300
350
400
450USDmntonnes
Volume (lhs)
Value (rhs) Source: CEIC
0
4
8
12
16
20
24
0.0
0.2
0.4
0.6
0.8
1.0
1.2
Jun-13 Dec-13 Jun-14 Dec-14 Jun-15 Dec-15 Jun-16
USDmnkt
Volume (lhs)
Value (rhs)
Source: CEIC
Figure 152: China’s tungsten articles imports
Figure 155: World tungsten output
Figure 153: China’s tungsten and articles exports
Figure 151: China’s tungsten ore imports
Figure 154: China’s tungsten products exports
0.0
2.0
4.0
6.0
8.0
10.0
12.0
Dec 12 Jun 13 Dec 13 Jun 14 Dec 14 Jun 15 Dec 15
kt
Sources: CEIC, Department of Industry, Innovation and Science
Tungsten
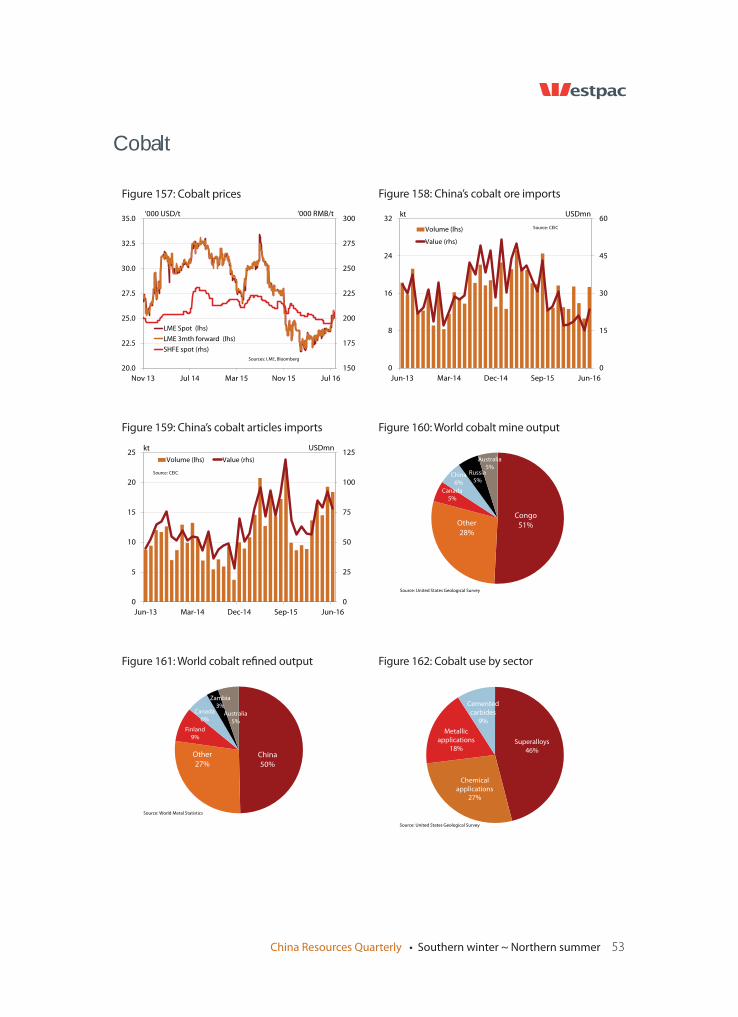
China Resources Quarterly • Southern winter ~ Northern summer 53
Superalloys
46%
Chemical
applications27%
Metallic
applications18%
Cemented
carbides9%
Source: United States Geological Survey
Figure 162: Cobalt use by sector
0
15
30
45
60
0
8
16
24
32
Jun-13 Mar-14 Dec-14 Sep-15 Jun-16
USDmnkt
Volume (lhs)
Value (rhs)
Source: CEIC
China
50%
Other
27%
Finland
9%
Canada
6%
Zambia
3%
Australia
5%
Source: World Metal Statistics
0
25
50
75
100
125
0
5
10
15
20
25
Jun-13 Mar-14 Dec-14 Sep-15 Jun-16
USDmnkt
Volume (lhs) Value (rhs)
Source: CEIC
Figure 158: China’s cobalt ore imports
Figure 161: World cobalt refi ned output
Figure 159: China’s cobalt articles imports Figure 160: World cobalt mine output
Congo
51%Other
28%
Canada
5%
China
6%
Russia
5%
Australia
5%
Source: United States Geological Survey
Cobalt
150
175
200
225
250
275
300
20.0
22.5
25.0
27.5
30.0
32.5
35.0
Nov 13 Jul 14 Mar 15 Nov 15 Jul 16
‘000 RMB/t‘000 USD/t
LME Spot (lhs)
LME 3mth forward (lhs)
SHFE spot (rhs)
Sources: LME, Bloomberg
Figure 157: Cobalt prices
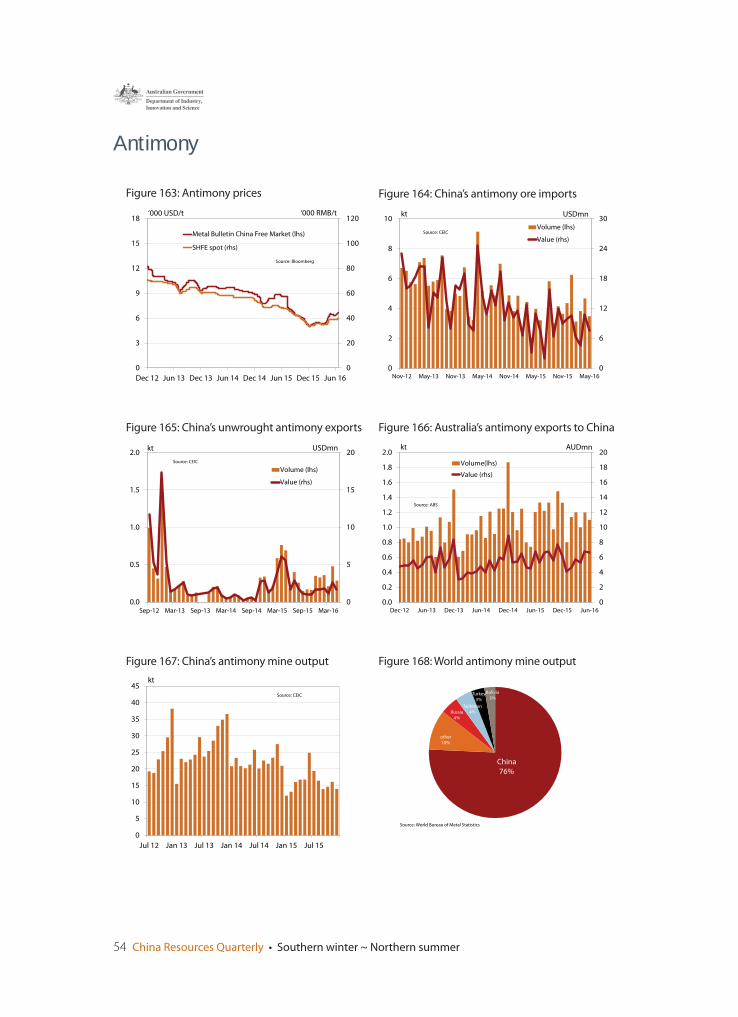
54 China Resources Quarterly • Southern winter ~ Northern summer
China
76%
other
10%
Russia
4%
Tajikistan
4%
Turkey
3%
Bolivia
3%
Source: World Bureau of Metal Statistics
Figure 168: World antimony mine output
0
6
12
18
24
30
0
2
4
6
8
10
Nov-12 May-13 Nov-13 May-14 Nov-14 May-15 Nov-15 May-16
USDmnkt
Volume (lhs)
Value (rhs)Source: CEIC
0
5
10
15
20
25
30
35
40
45
Jul 12 Jan 13 Jul 13 Jan 14 Jul 14 Jan 15 Jul 15
kt
Source: CEIC
0
5
10
15
20
0.0
0.5
1.0
1.5
2.0
Sep-12 Mar-13 Sep-13 Mar-14 Sep-14 Mar-15 Sep-15 Mar-16
USDmnkt
Volume (lhs)
Value (rhs)
Source: CEIC
0
20
40
60
80
100
120
0
3
6
9
12
15
18
Dec 12 Jun 13 Dec 13 Jun 14 Dec 14 Jun 15 Dec 15 Jun 16
‘000 RMB/t‘000 USD/t
Metal Bulletin China Free Market (lhs)
SHFE spot (rhs)
Source: Bloomberg
Figure 164: China’s antimony ore imports
Figure 167: China’s antimony mine output
Figure 165: China’s unwrought antimony exports
Figure 163: Antimony prices
Figure 166: Australia’s antimony exports to China
0.0
0.2
0.4
0.6
0.8
1.0
1.2
1.4
1.6
1.8
2.0
Dec-12 Jun-13 Dec-13 Jun-14 Dec-14 Jun-15 Dec-15 Jun-16
0
2
4
6
8
10
12
14
16
18
20kt AUDmn
Volume(lhs)
Value (rhs)
Source: ABS
Antimony
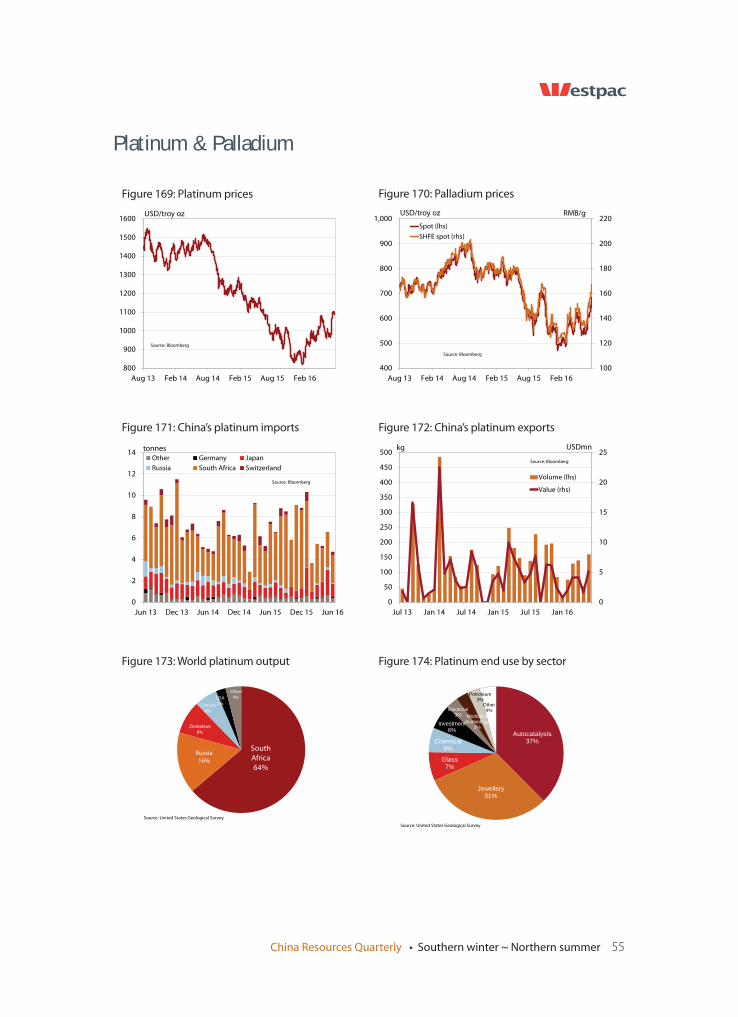
China Resources Quarterly • Southern winter ~ Northern summer 55
Autocatalysts37%
Jewellery31%
Glass7%
Chemical6%
Investment6%
Electrical3% Medical &
biomedical3%
Petroleum3%
Other4%
Source: United States Geological Survey
Figure 174: Platinum end use by sector
100
120
140
160
180
200
220
400
500
600
700
800
900
1,000
Aug 13 Feb 14 Aug 14 Feb 15 Aug 15 Feb 16
RMB/gUSD/troy oz
Spot (lhs)
SHFE spot (rhs)
Source: Bloomberg
South
Africa
64%
Russia
16%
Zimbabwe
8%
Canada
6%
USA
2%
Other
4%
Source: United States Geological Survey
0
2
4
6
8
10
12
14
Jun 13 Dec 13 Jun 14 Dec 14 Jun 15 Dec 15 Jun 16
tonnesOther Germany Japan
Russia South Africa Switzerland
Source: Bloomberg
Figure 170: Palladium prices
Figure 173: World platinum output
Figure 171: China’s platinum imports Figure 172: China’s platinum exports
0
5
10
15
20
25
0
50
100
150
200
250
300
350
400
450
500
Jul 13 Jan 14 Jul 14 Jan 15 Jul 15 Jan 16
USDmnkg
Volume (lhs)
Value (rhs)
Source: Bloomberg
Platinum & Palladium
800
900
1000
1100
1200
1300
1400
1500
1600
Aug 13 Feb 14 Aug 14 Feb 15 Aug 15 Feb 16
USD/troy oz
Source: Bloomberg
Figure 169: Platinum prices
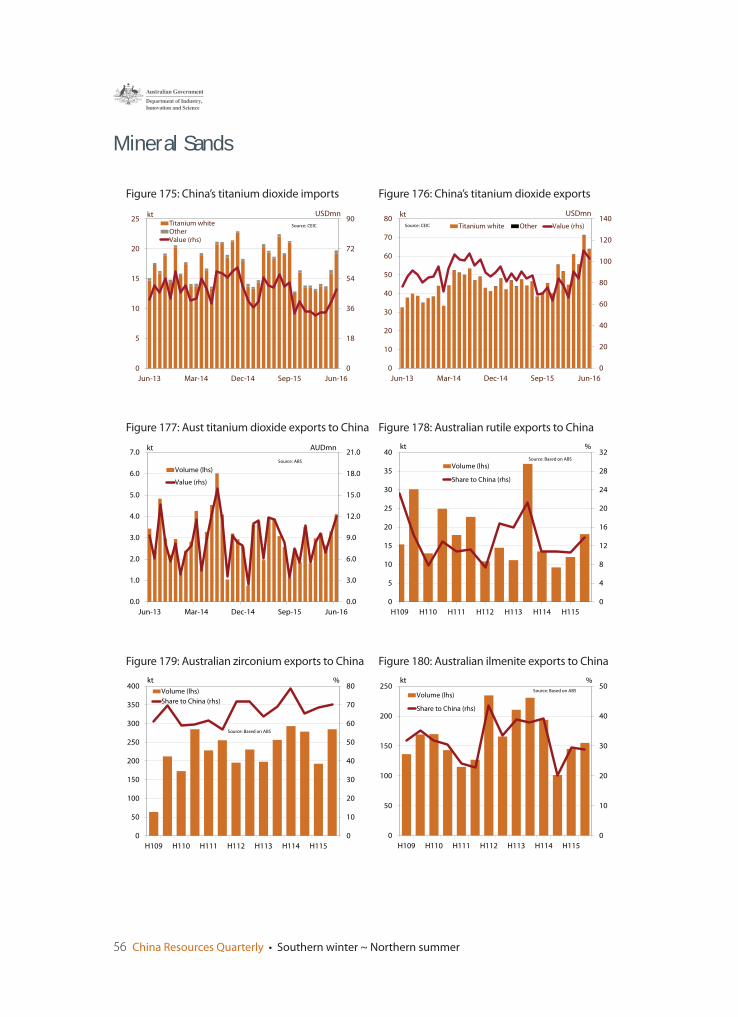
56 China Resources Quarterly • Southern winter ~ Northern summer
0
10
20
30
40
50
0
50
100
150
200
250
H109 H110 H111 H112 H113 H114 H115
%kt
Volume (lhs)
Share to China (rhs)
Source: Based on ABS
Figure 180: Australian ilmenite exports to China
0
20
40
60
80
100
120
140
0
10
20
30
40
50
60
70
80
Jun-13 Mar-14 Dec-14 Sep-15 Jun-16
USDmnkt
Titanium white Other Value (rhs)Source: CEIC
0
10
20
30
40
50
60
70
80
0
50
100
150
200
250
300
350
400
H109 H110 H111 H112 H113 H114 H115
%kt
Volume (lhs)
Share to China (rhs)
Source: Based on ABS
0.0
3.0
6.0
9.0
12.0
15.0
18.0
21.0
0.0
1.0
2.0
3.0
4.0
5.0
6.0
7.0
Jun-13 Mar-14 Dec-14 Sep-15 Jun-16
AUDmnkt
Volume (lhs)
Value (rhs)
Source: ABS
0
18
36
54
72
90
0
5
10
15
20
25
Jun-13 Mar-14 Dec-14 Sep-15 Jun-16
USDmnktTitanium whiteOtherValue (rhs)
Source: CEIC
Figure 176: China’s titanium dioxide exports
Figure 179: Australian zirconium exports to China
Figure 177: Aust titanium dioxide exports to China
Figure 175: China’s titanium dioxide imports
Figure 178: Australian rutile exports to China
0
4
8
12
16
20
24
28
32
0
5
10
15
20
25
30
35
40
H109 H110 H111 H112 H113 H114 H115
%kt
Volume (lhs)
Share to China (rhs)
Source: Based on ABS
Mineral Sands
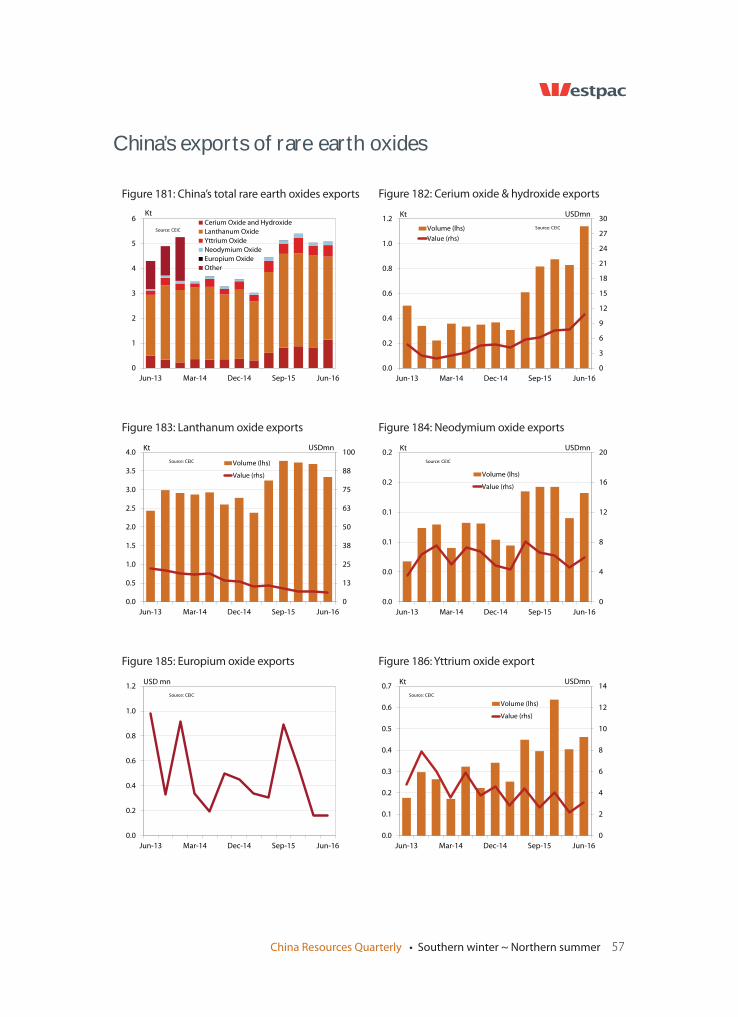
China Resources Quarterly • Southern winter ~ Northern summer 57
0
2
4
6
8
10
12
14
0.0
0.1
0.2
0.3
0.4
0.5
0.6
0.7
Jun-13 Mar-14 Dec-14 Sep-15 Jun-16
USDmnKt
Volume (lhs)
Value (rhs)
Source: CEIC
Figure 186: Yttrium oxide export
0
3
6
9
12
15
18
21
24
27
30
0.0
0.2
0.4
0.6
0.8
1.0
1.2
Jun-13 Mar-14 Dec-14 Sep-15 Jun-16
USDmnKt
Volume (lhs)
Value (rhs)
Source: CEIC
0.0
0.2
0.4
0.6
0.8
1.0
1.2
Jun-13 Mar-14 Dec-14 Sep-15 Jun-16
USD mn
Source: CEIC
0
13
25
38
50
63
75
88
100
0.0
0.5
1.0
1.5
2.0
2.5
3.0
3.5
4.0
Jun-13 Mar-14 Dec-14 Sep-15 Jun-16
USDmnKt
Volume (lhs)
Value (rhs)
Source: CEIC
Figure 182: Cerium oxide & hydroxide exports
Figure 185: Europium oxide exports
Figure 183: Lanthanum oxide exports Figure 184: Neodymium oxide exports
0
4
8
12
16
20
0.0
0.0
0.1
0.1
0.2
0.2
Jun-13 Mar-14 Dec-14 Sep-15 Jun-16
USDmnKt
Volume (lhs)
Value (rhs)
Source: CEIC
China’s exports of rare earth oxides
0
1
2
3
4
5
6
Jun-13 Mar-14 Dec-14 Sep-15 Jun-16
KtCerium Oxide and Hydroxide
Lanthanum Oxide
Yttrium Oxide
Neodymium Oxide
Europium Oxide
Other
Source: CEIC
Figure 181: China’s total rare earth oxides exports
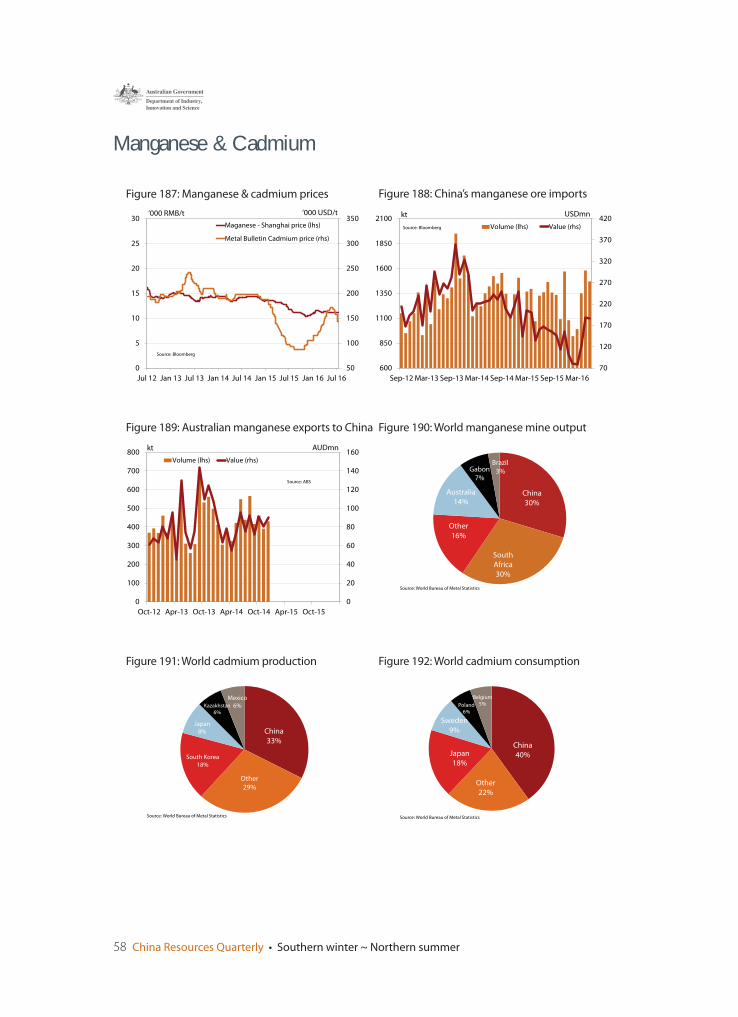
58 China Resources Quarterly • Southern winter ~ Northern summer
China
40%
Other
22%
Japan
18%
Sweden
9%
Poland
6%
Belgium
5%
Source: World Bureau of Metal Statistics
Figure 192: World cadmium consumption
70
120
170
220
270
320
370
420
600
850
1100
1350
1600
1850
2100
Sep-12 Mar-13 Sep-13 Mar-14 Sep-14 Mar-15 Sep-15 Mar-16
USDmnkt
Volume (lhs) Value (rhs)Source: Bloomberg
China
33%
Other
29%
South Korea
18%
Japan
8%
Kazakhstan
6%
Mexico
6%
Source: World Bureau of Metal Statistics
0
20
40
60
80
100
120
140
160
0
100
200
300
400
500
600
700
800
Oct-12 Apr-13 Oct-13 Apr-14 Oct-14 Apr-15 Oct-15
AUDmnkt
Volume (lhs) Value (rhs)
Source: ABS
50
100
150
200
250
300
350
0
5
10
15
20
25
30
Jul 12 Jan 13 Jul 13 Jan 14 Jul 14 Jan 15 Jul 15 Jan 16 Jul 16
‘000 USD/t‘000 RMB/t
Maganese - Shanghai price (lhs)
Metal Bulletin Cadmium price (rhs)
Source: Bloomberg
Figure 188: China’s manganese ore imports
Figure 191: World cadmium production
Figure 189: Australian manganese exports to China
Figure 187: Manganese & cadmium prices
Figure 190: World manganese mine output
China
30%
South
Africa
30%
Other
16%
Australia
14%
Gabon
7%
Brazil
3%
Source: World Bureau of Metal Statistics
Manganese & Cadmium
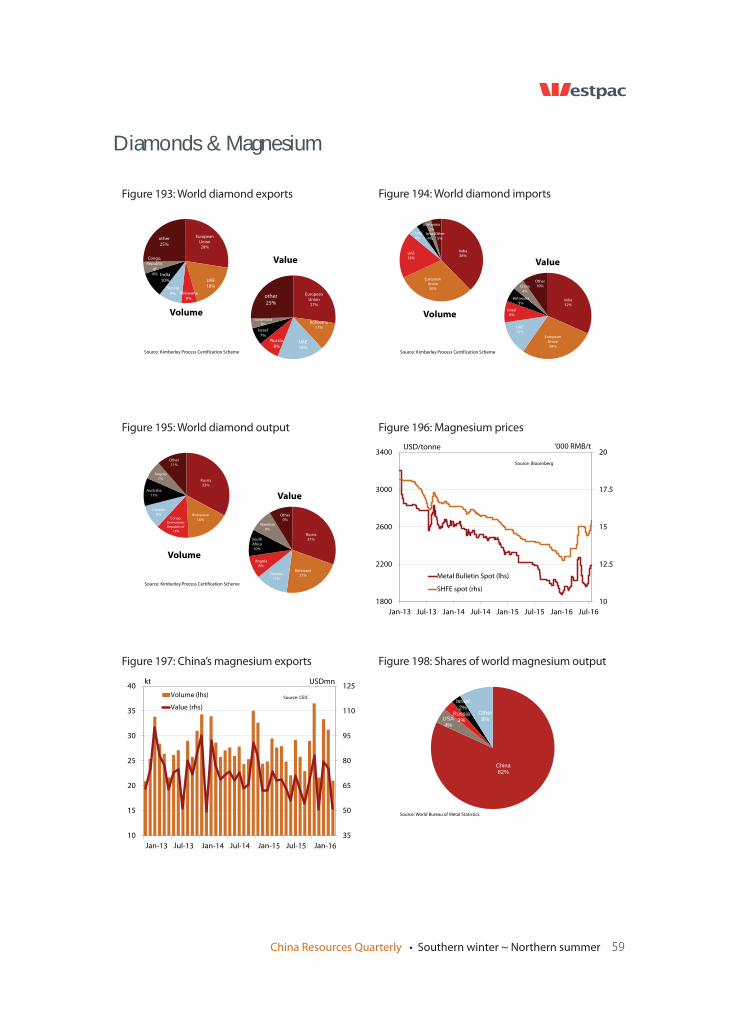
China Resources Quarterly • Southern winter ~ Northern summer 59
China82%
USA4%
Russia3%
Israel2%
Other9%
Source: World Bureau of Metal Statistics.
Figure 198: Shares of world magnesium output
India38%
European Union30%
UAE18%
China4%
Israel4%
Botswana2%
Other5%
Volume
India32%
European Union28%
UAE13%
Israel8%
Botswana5%
China4%
Other10%
Value
Source: Kimberley Process Certification Scheme
35
50
65
80
95
110
125
10
15
20
25
30
35
40USDmnkt
Volume (lhs)
Value (rhs)
Source: CEIC
Russia33%
Botswana16%Congo,
Democratic Republic of
13%
Canada9%
Australia11%
Angola7%
Other11%
Volume
Russia31%
Botswana21%Canada
12%
Angola8%
South Africa10%
Namibia9%
Other 9%
Value
Source: Kimberley Process Certification Scheme
Figure 194: World diamond imports
Figure 197: China’s magnesium exports
Figure 195: World diamond output Figure 196: Magnesium prices
10
12.5
15
17.5
20
1800
2200
2600
3000
3400
Jan-13 Jul-13 Jan-14 Jul-14 Jan-15 Jul-15 Jan-16 Jul-16
‘000 RMB/tUSD/tonne
Metal Bulletin Spot (lhs)
SHFE spot (rhs)
Source: Bloomberg
Diamonds & Magnesium
European Union28%
UAE
18%
Botswana6%
Russia
9%
India10%
Congo, Republic
of4%
other
25%
Volume
European Union27%
Botswana11%
UAE
18%
Russia
8%
Israel7%
Switzerland4%
other
25%
Value
Source: Kimberley Process Certification Scheme
Figure 193: World diamond exports
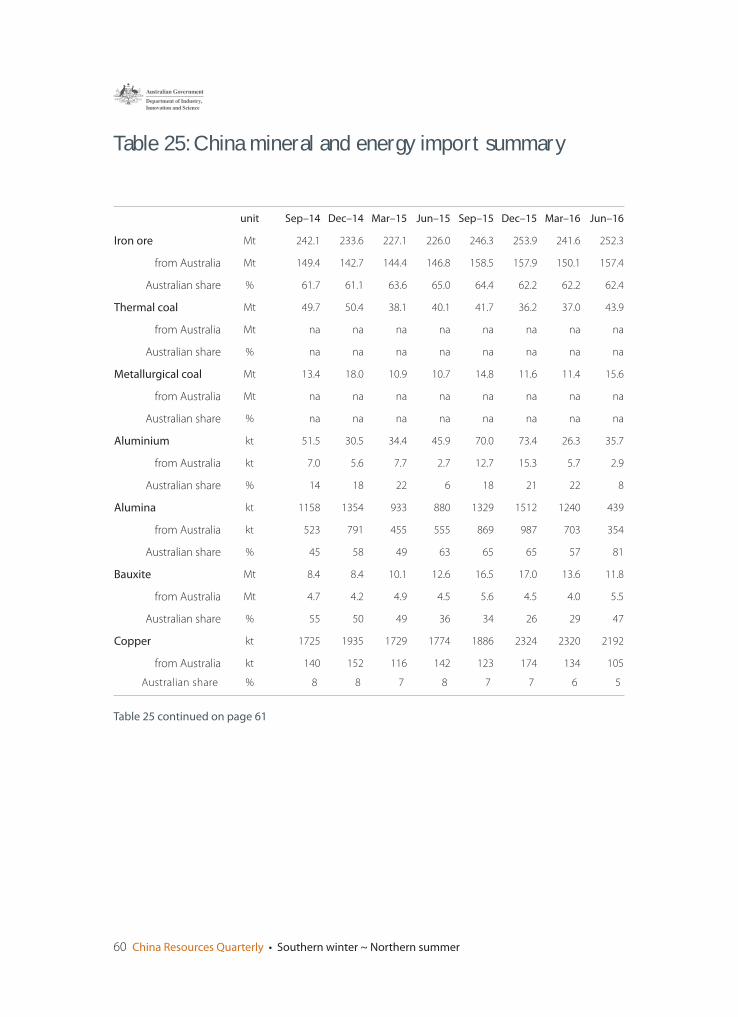
60 China Resources Quarterly • Southern winter ~ Northern summer
Table 25: China mineral and energy import summary
unit Sep–14 Dec–14 Mar–15 Jun–15 Sep–15 Dec–15 Mar–16 Jun–16
Iron ore Mt 242.1 233.6 227.1 226.0 246.3 253.9 241.6 252.3
from Australia Mt 149.4 142.7 144.4 146.8 158.5 157.9 150.1 157.4
Australian share % 61.7 61.1 63.6 65.0 64.4 62.2 62.2 62.4
Thermal coal Mt 49.7 50.4 38.1 40.1 41.7 36.2 37.0 43.9
from Australia Mt na na na na na na na na
Australian share % na na na na na na na na
Metallurgical coal Mt 13.4 18.0 10.9 10.7 14.8 11.6 11.4 15.6
from Australia Mt na na na na na na na na
Australian share % na na na na na na na na
Aluminium kt 51.5 30.5 34.4 45.9 70.0 73.4 26.3 35.7
from Australia kt 7.0 5.6 7.7 2.7 12.7 15.3 5.7 2.9
Australian share % 14 18 22 6 18 21 22 8
Alumina kt 1158 1354 933 880 1329 1512 1240 439
from Australia kt 523 791 455 555 869 987 703 354
Australian share % 45 58 49 63 65 65 57 81
Bauxite Mt 8.4 8.4 10.1 12.6 16.5 17.0 13.6 11.8
from Australia Mt 4.7 4.2 4.9 4.5 5.6 4.5 4.0 5.5
Australian share % 55 50 49 36 34 26 29 47
Copper kt 1725 1935 1729 1774 1886 2324 2320 2192
from Australia kt 140 152 116 142 123 174 134 105
Australian share % 8 8 7 8 7 7 6 5
Table 25 continued on page 61
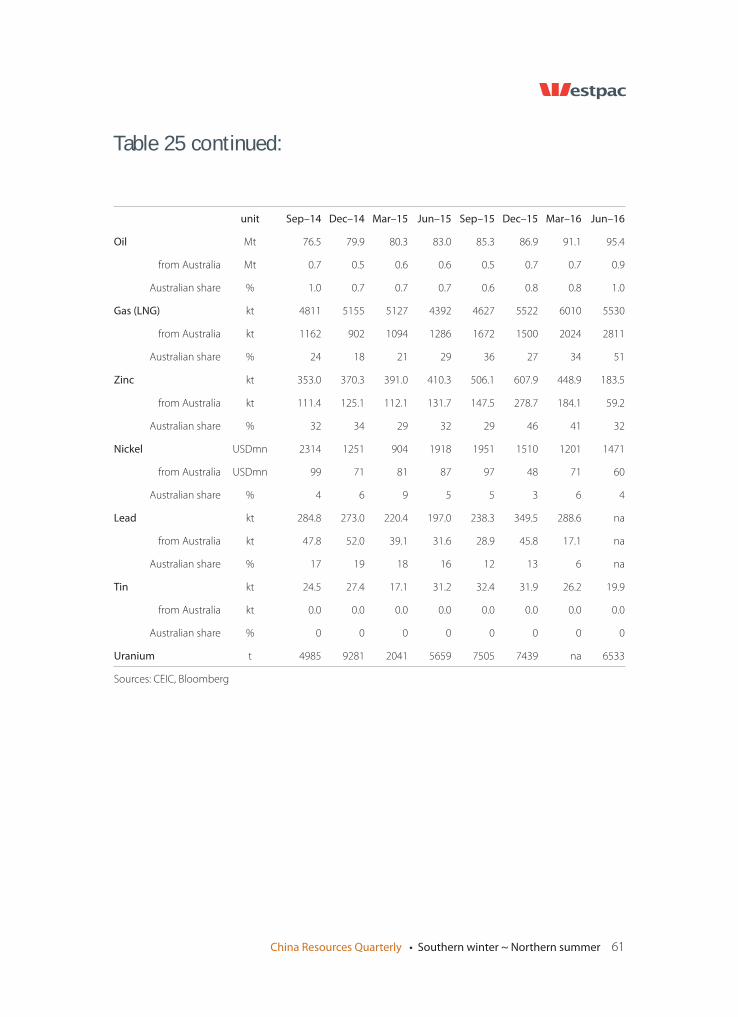
China Resources Quarterly • Southern winter ~ Northern summer 61
Table 25 continued:
unit Sep–14 Dec–14 Mar–15 Jun–15 Sep–15 Dec–15 Mar–16 Jun–16
Oil Mt 76.5 79.9 80.3 83.0 85.3 86.9 91.1 95.4
from Australia Mt 0.7 0.5 0.6 0.6 0.5 0.7 0.7 0.9
Australian share % 1.0 0.7 0.7 0.7 0.6 0.8 0.8 1.0
Gas (LNG) kt 4811 5155 5127 4392 4627 5522 6010 5530
from Australia kt 1162 902 1094 1286 1672 1500 2024 2811
Australian share % 24 18 21 29 36 27 34 51
Zinc kt 353.0 370.3 391.0 410.3 506.1 607.9 448.9 183.5
from Australia kt 111.4 125.1 112.1 131.7 147.5 278.7 184.1 59.2
Australian share % 32 34 29 32 29 46 41 32
Nickel USDmn 2314 1251 904 1918 1951 1510 1201 1471
from Australia USDmn 99 71 81 87 97 48 71 60
Australian share % 4 6 9 5 5 3 6 4
Lead kt 284.8 273.0 220.4 197.0 238.3 349.5 288.6 na
from Australia kt 47.8 52.0 39.1 31.6 28.9 45.8 17.1 na
Australian share % 17 19 18 16 12 13 6 na
Tin kt 24.5 27.4 17.1 31.2 32.4 31.9 26.2 19.9
from Australia kt 0.0 0.0 0.0 0.0 0.0 0.0 0.0 0.0
Australian share % 0 0 0 0 0 0 0 0
Uranium t 4985 9281 2041 5659 7505 7439 na 6533
Sources: CEIC, Bloomberg
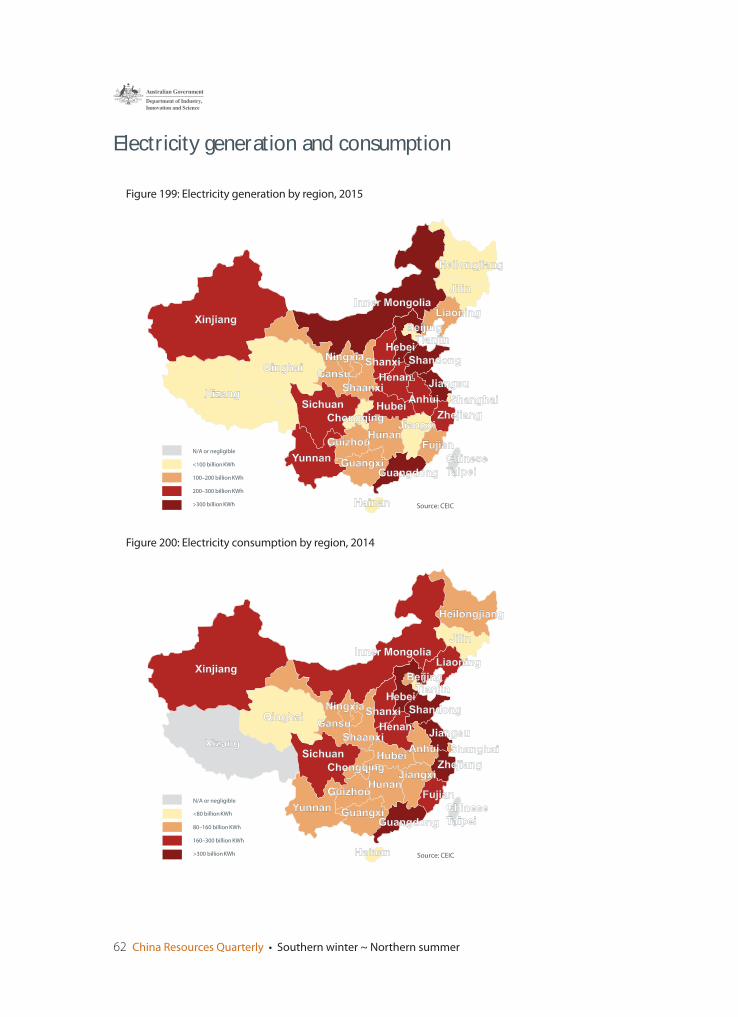
62 China Resources Quarterly • Southern winter ~ Northern summer
Electricity generation and consumption
Figure 200: Electricity consumption by region, 2014
Figure 199: Electricity generation by region, 2015
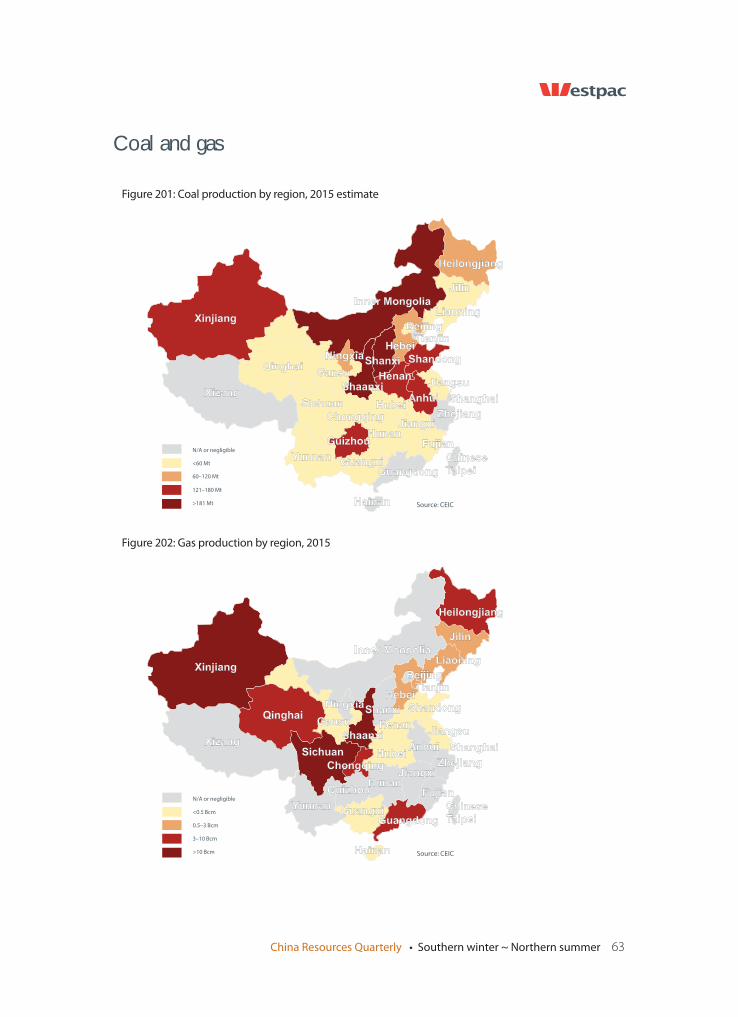
China Resources Quarterly • Southern winter ~ Northern summer 63
Coal and gas
Figure 202: Gas production by region, 2015
Figure 201: Coal production by region, 2015 estimate
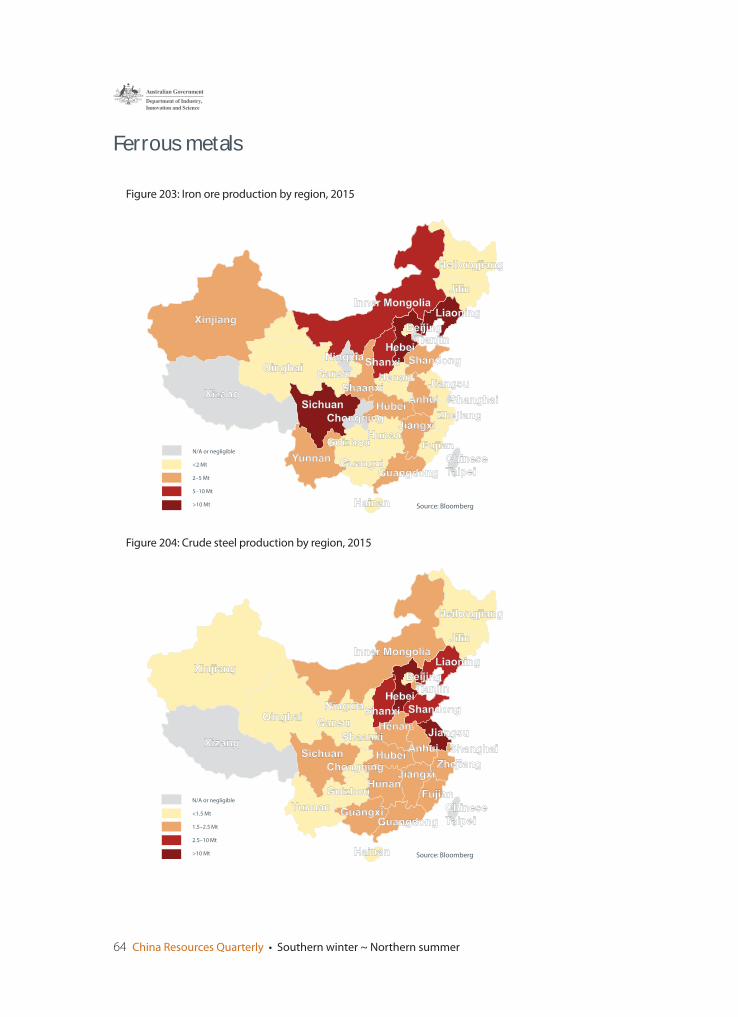
64 China Resources Quarterly • Southern winter ~ Northern summer
Ferrous metals
Figure 204: Crude steel production by region, 2015
Figure 203: Iron ore production by region, 2015
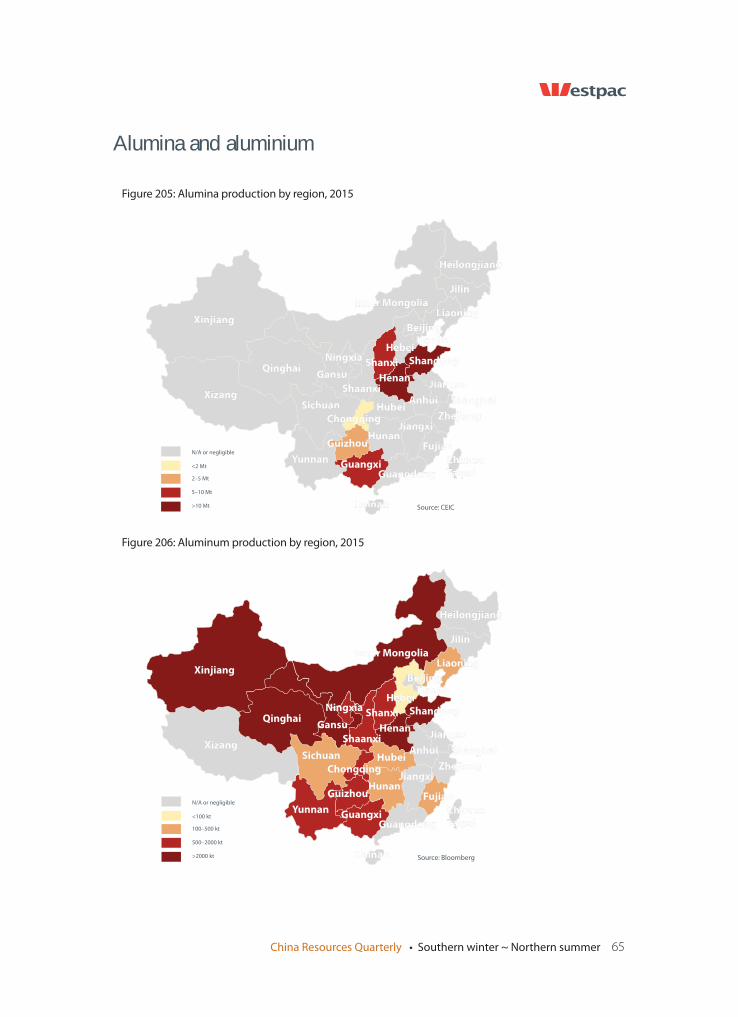
China Resources Quarterly • Southern winter ~ Northern summer 65
Alumina and aluminium
<100 kt
100–500 kt
500–2000 kt
>2000 kt Hainan
N/A or negligible
Source: Bloomberg
<2 Mt
2–5 Mt
5–10 Mt
>10 Mt Hainan
N/A or negligible
Source: CEIC
Figure 206: Aluminum production by region, 2015
Figure 205: Alumina production by region, 2015
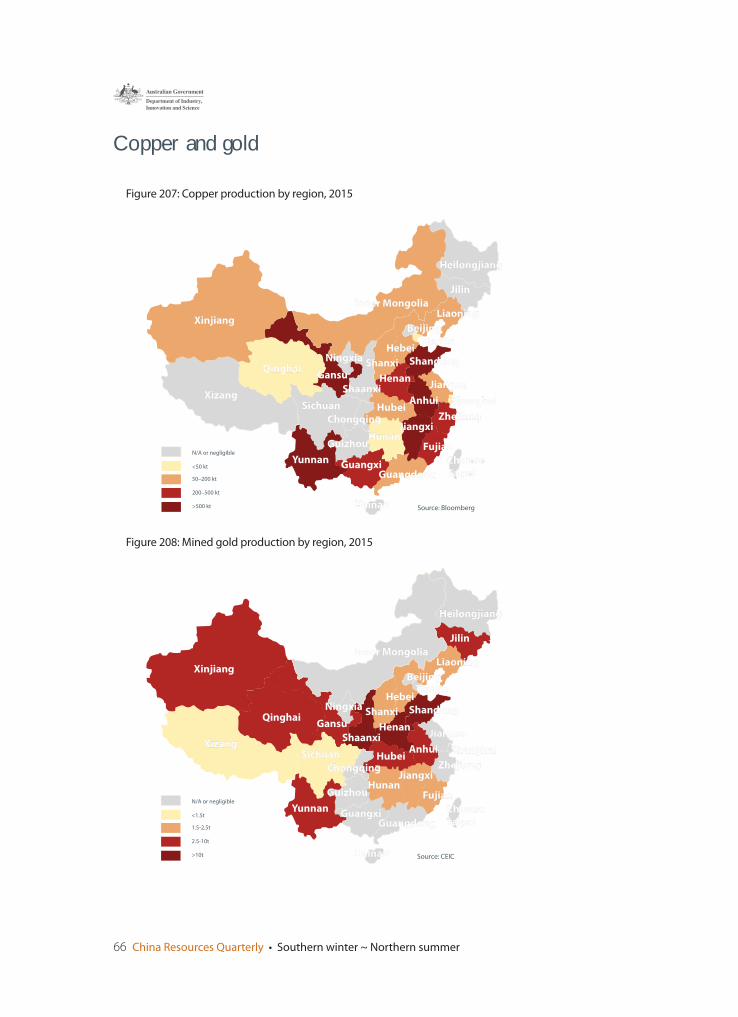
66 China Resources Quarterly • Southern winter ~ Northern summer
Copper and gold
<1.5t
1.5-2.5t
2.5-10t
>10t Hainan
N/A or negligible
Source: CEIC
Figure 208: Mined gold production by region, 2015
<50 kt
50–200 kt
200–500 kt
>500 kt Hainan
N/A or negligible
Source: Bloomberg
Figure 207: Copper production by region, 2015
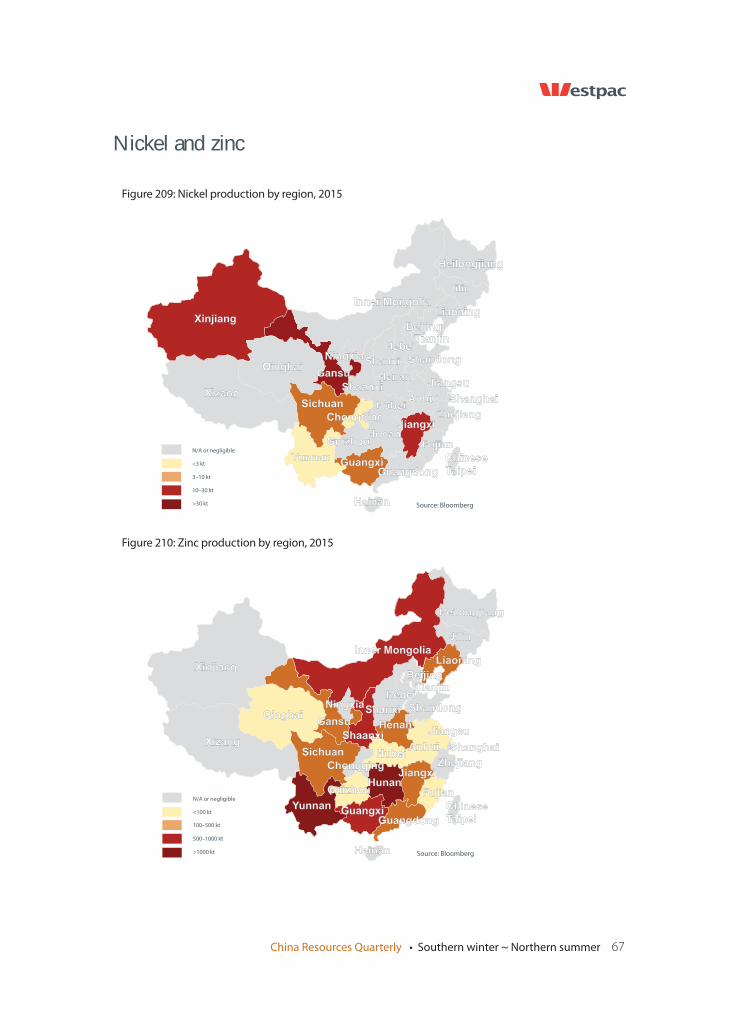
China Resources Quarterly • Southern winter ~ Northern summer 67
Nickel and zinc
Figure 210: Zinc production by region, 2015
Figure 209: Nickel production by region, 2015
68 China Resources Quarterly • Southern winter ~ Northern summer
© Copyright 2016 Westpac Banking Corporation
Things you should know.
Westpac Institutional Bank is a division of Westpac Banking Corporation ABN 33 007 457 141 (‘Westpac’). This information is correct at 1 July 2016.
Disclaimer
This material contains general commentary, research, and market colour. The material does not constitute investment advice. The material may contain investment recommendations, including information recommending an investment strategy. Reasonable steps have been taken to ensure that the material is presented in a clear, accurate and objective manner. Certain types of transactions, including those involving futures, options and high yield securities give rise to substantial risk and are not suitable for all investors. We recommend that you seek your own independent legal or financial advice before proceeding with any investment decision. This information has been prepared without taking account of your objectives, financial situation or needs. This material may contain material provided by third parties. While such material is published with the necessary permission none of Westpac or its related entities accepts any responsibility for the accuracy or completeness of any such material. Although we have made every effort to ensure the information is free from error, none of Westpac or its related entities warrants the accuracy, adequacy or completeness of the information, or otherwise endorses it in any way. Except where contrary to law, Westpac and its related entities intend by this notice to exclude liability for the information. The information is subject to change without notice and none of Westpac or its related entities is under any obligation to update the information or correct any inaccuracy which may become apparent at a later date. The information contained in this material does not constitute an offer, a solicitation of an offer, or an inducement to subscribe for, purchase or sell any financial instrument or to enter a legally binding contract. Past performance is not a reliable indicator of future performance. Whilst every effort has been taken to ensure that the assumptions on which the forecasts are based are reasonable, the forecasts may be affected by incorrect assumptions or by known or unknown risks and uncertainties. The ultimate outcomes may differ substantially from these forecasts.
Country disclosures
Australia: Westpac holds an Australian Financial Services Licence (No. 233714). This material is provided to you solely for your own use and in your capacity as a wholesale client of Westpac.
New Zealand: In New Zealand, Westpac Institutional Bank refers to the brand under which products and services are provided by either Westpac or Westpac New Zealand Limited (“WNZL”). Any product or service made available by WNZL does not represent an offer from Westpac or any of its subsidiaries (other than WNZL). Neither Westpac nor its other subsidiaries guarantee or otherwise support the performance of WNZL in respect of any such product. The current disclosure statements for the New Zealand branch of Westpac and WNZL can be obtained at the internet address www.westpac.co.nz. For further information please refer to the Product Disclosure Statement (available from your Relationship Manager) for any product for which a Product Disclosure Statement is required, or applicable customer agreement. Download the Westpac NZ QFE Group Financial Advisers Act 2008 Disclosure Statement at www.westpac.co.nz.
China, Hong Kong, Singapore and India: This material has been prepared and issued for distribution in Singapore to institutional investors, accredited investors and expert investors (as defined in the applicable Singapore laws and regulations) only. Recipients in Singapore of this material should contact Westpac Singapore Branch in respect of any matters arising from, or in connection with, this material. Westpac Singapore Branch holds a wholesale banking licence and is subject to supervision by the Monetary Authority of Singapore. Westpac Hong Kong Branch holds a banking license and is subject to supervision by the Hong Kong Monetary Authority. Westpac Hong Kong branch also holds a license issued by the Hong Kong Securities and Futures Commission (SFC) for Type 1 and Type 4 regulated activities. This material is intended only to “professional investors” as defined in the Securities and Futures Ordinance and any rules made under that Ordinance. Westpac Shanghai and Beijing Branches hold banking licenses and are subject to supervision by the China Banking Regulatory Commission (CBRC). Westpac Mumbai Branch holds a banking license from Reserve Bank of India (RBI) and subject to regulation and supervision by the RBI.
UK: The contents of this communication, which have been prepared by and are the sole responsibility of Westpac Banking Corporation London and Westpac Europe Limited. Westpac (a) has its principal place of business in the United Kingdom at Camomile Court, 23 Camomile Street, London EC3A 7LL, and is registered at Cardiff in the UK (as Branch No. BR00106), and (b) authorised and regulated by the Australian Prudential Regulation Authority in Australia. Westpac is authorised in the United Kingdom by the Prudential Regulation Authority. Westpac is subject to regulation by the Financial Conduct Authority and limited regulation by the Prudential Regulation Authority. Details about the extent of our regulation by the Prudential Regulation Authority are available from us on request. Westpac Europe Limited is a company registered in England (number 05660023) and is authorised by the Prudential Regulation Authority and regulated by the Financial Conduct Authority and the Prudential Regulation Authority.
This communication is being made only to and is directed at (a) persons who have professional experience in matters relating to investments who fall within Article 19(5) of the Financial Services and Markets Act 2000 (Financial Promotion) Order 2005 (the “Order”) or (b) high net worth entities, and other persons to whom it may otherwise lawfully be communicated, falling within Article 49(2)(a) to (d) of the Order (all such persons together being referred to as “relevant persons”). Any person who is not a relevant person should not act or rely on this communication or any of its contents. The investments to which this communication relates are only available to and any invitation, offer or agreement to subscribe, purchase or otherwise acquire such investments will be engaged in only with, relevant persons. Any person who is not a relevant person should not act or rely
China Resources Quarterly • Southern winter ~ Northern summer 69
upon this communication or any of its contents. In the same way, the information contained in this communication is intended for “eligible counterparties” and “professional clients” as defined by the rules of the Financial Conduct Authority and is not intended for “retail clients”. With this in mind, Westpac expressly prohibits you from passing on the information in this communication to any third party. In particular this communication and, in each case, any copies thereof may not be taken, transmitted or distributed, directly or indirectly into any restricted jurisdiction. This communication is made in compliance with the Market Abuse Regulation (Regulation (EU) 596/2014).
U.S.: Westpac operates in the United States of America as a federally licensed branch, regulated by the Office of the Comptroller of the Currency. Westpac is also registered with the US Commodity Futures Trading Commission (“CFTC”) as a Swap Dealer, but is neither registered as, or affiliated with, a Futures Commission Merchant registered with the US CFTC. Westpac Capital Markets, LLC (‘WCM’), a wholly-owned subsidiary of Westpac, is a broker-dealer registered under the U.S. Securities Exchange Act of 1934 (‘the Exchange Act’) and member of the Financial Industry Regulatory Authority (‘FINRA’). This communication is provided for distribution to U.S. institutional investors in reliance on the exemption from registration provided by Rule 15a-6 under the Exchange Act and is not subject to all of the independence and disclosure standards applicable to debt research reports prepared for retail investors in the United States. WCM is the U.S. distributor of this communication and accepts responsibility for the contents of this communication. All disclaimers set out with respect to Westpac apply equally to WCM. If you would like to speak to someone regarding any security mentioned herein, please contact WCM on +1 212 389 1269. All disclaimers set out with respect to Westpac apply equally to WCM.
Investing in any non-U.S. securities or related financial instruments mentioned in this communication may present certain risks. The securities of non-U.S. issuers may not be registered with, or be subject to the regulations of, the SEC in the United States. Information on such non-U.S. securities or related financial instruments may be limited. Non-U.S. companies may not subject to audit and reporting standards and regulatory requirements comparable to those in effect in the United States. The value of any investment or income from any securities or related derivative instruments denominated in a currency other than U.S. dollars is subject to exchange rate fluctuations that may have a positive or adverse effect on the value of or income from such securities or related derivative instruments.
The author of this communication is employed by Westpac and is not registered or qualified as a research analyst, representative, or associated person under the rules of FINRA, any other U.S. self-regulatory organisation, or the laws, rules or regulations of any State. Unless otherwise specifically stated, the views expressed herein are solely those of the author and may differ from the information, views or analysis expressed by Westpac and/or its affiliates.
Investment Recommendations Disclosure
Investment Recommendations for Financial Instruments covered by MAR are made in compliance with Article 20 MAR. Westpac does not apply MAR Investment Recommendation requirements to Spot Foreign Exchange which is out of scope for MAR.
Unless otherwise indicated, there are no planned updates to this Investment Recommendation at the time of publication. Westpac has no obligation to update, modify or amend this Investment Recommendation or to notify the recipients of this Investment Recommendation should any information, including opinion, forecast or estimate set out in this Investment Recommendation change or subsequently become inaccurate.
Westpac will from time to time dispose of and acquire financial instruments of companies covered in this Investment Recommendation as principal and act as a market maker or liquidity provider in such financial instruments.
Westpac does not have any proprietary positions in equity shares of issuers that are the subject of an investment recommendation.
Westpac may have provided investment banking services to the issuer in the course of the past 12 months.
Westpac does not permit any issuer to see or comment on any investment recommendation prior to its completion and distribution.
Individuals who produce investment recommendations are not permitted to undertake any transactions in any financial instruments or derivatives in relation to the issuers covered by the investment recommendations they produce.
Westpac has implemented policies and procedures, which are designed to ensure conflicts of interests are managed consistently and appropriately, and to treat clients fairly.
The following arrangements have been adopted for the avoidance and prevention of conflicts in interests associated with the provision of investment recommendations.
i. Chinese Wall/Cell arrangements;ii. physical separation of various Business/Support Units; iii. Strict and well defined wall/cell crossing procedures;iv. a “need to know” policy; v. documented and well defined procedures for dealing with conflicts of interest; vi. reasonable steps by Compliance to ensure that the Chinese Wall/Cell arrangements remain effective and that such
arrangements are adequately monitored.

70 China Resources Quarterly • Southern winter~ Northern summer

Ch
ina
Re
sou
rces Q
ua
rterly So
uth
ern
win
ter~
No
rthe
rn su
mm
er 2
01
6